1.4 Stem-and-Leaf Plots, 1.4 Stem-and-Leaf Plots, Histograms, and Circle Histograms, and Circle
GraphsGraphs
Objectives: Make and interpret a stem-and-leaf plot, a Objectives: Make and interpret a stem-and-leaf plot, a histogramhistogram
Standards: 2.6.5A Organize and display data using Standards: 2.6.5A Organize and display data using pictures, tallies, tables, charts, bar pictures, tallies, tables, charts, bar
and circle graphs. 2.6.8E Analyze and display and circle graphs. 2.6.8E Analyze and display data in a stem-and-leaf plot.data in a stem-and-leaf plot.

Do NowDo Now
Order the data from least to Order the data from least to greatest.greatest.
78, 95, 92, 84, 86, 82, 74, 73, 70, 78, 95, 92, 84, 86, 82, 74, 73, 70, 86, 90, 91,81, 85, 8986, 90, 91,81, 85, 89

Definition:A stem-and-leaf plot is a
graph that splits data into 2 parts: a stem and leaf.
Stem Leaf
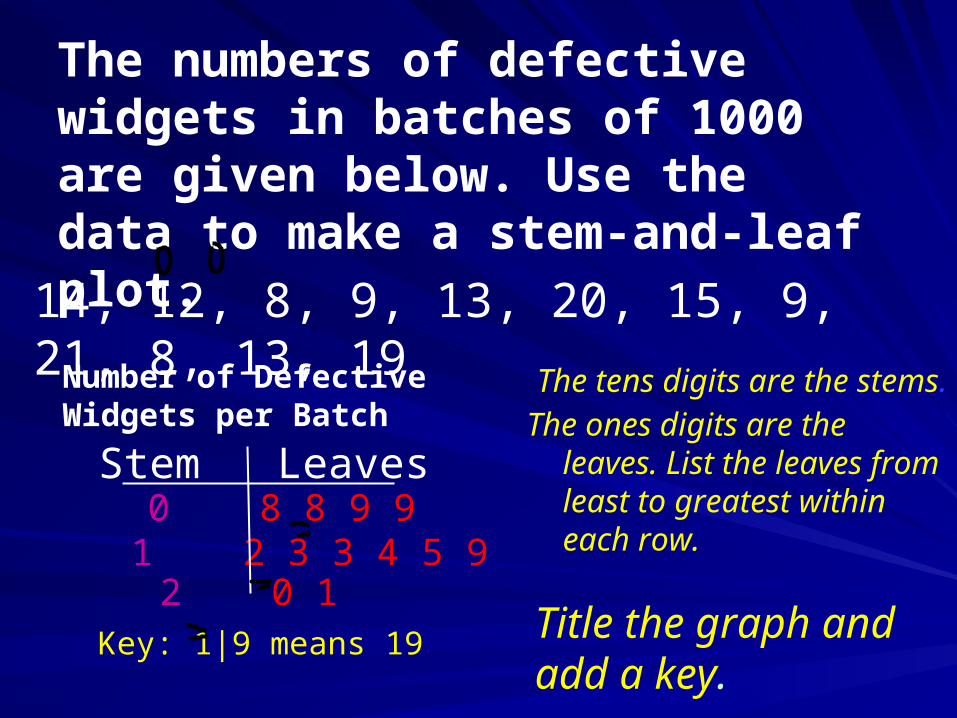
The numbers of defective widgets in batches of 1000 are given below. Use the data to make a stem-and-leaf plot.
14, 12, 8, 9, 13, 20, 15, 9, 21, 8, 13, 19
Number of DefectiveWidgets per Batch
Stem Leaves0 8 8 9 91 2 3 3 4 5 92 0 1
The tens digits are the stems.The ones digits are the
leaves. List the leaves from least to greatest within each row.
Title the graph and add a key.
Key: 1|9 means 19

Example 1Example 1
Organize data from the Do Now using a stem-and-leaf plot.
Include a key


Ex2. A bakery collected the following data about the
# of loaves of bread sold each of the 24 business days:
53, 49, 27, 48, 60, 52, 44, 38, 47, 52, 82,46, 55,
31, 39, 54, 51, 47, 50, 45, 50, 61, 43, and 64.
Make a stem-and-leaf plot of the data. Find the median and mode(s) of the data. How can the owner use the stem-and-leaf
plot to make plans for baking bread?

II.Histogram – a bar graph that shows the frequency of each
value.
See Textbook Pg. 59

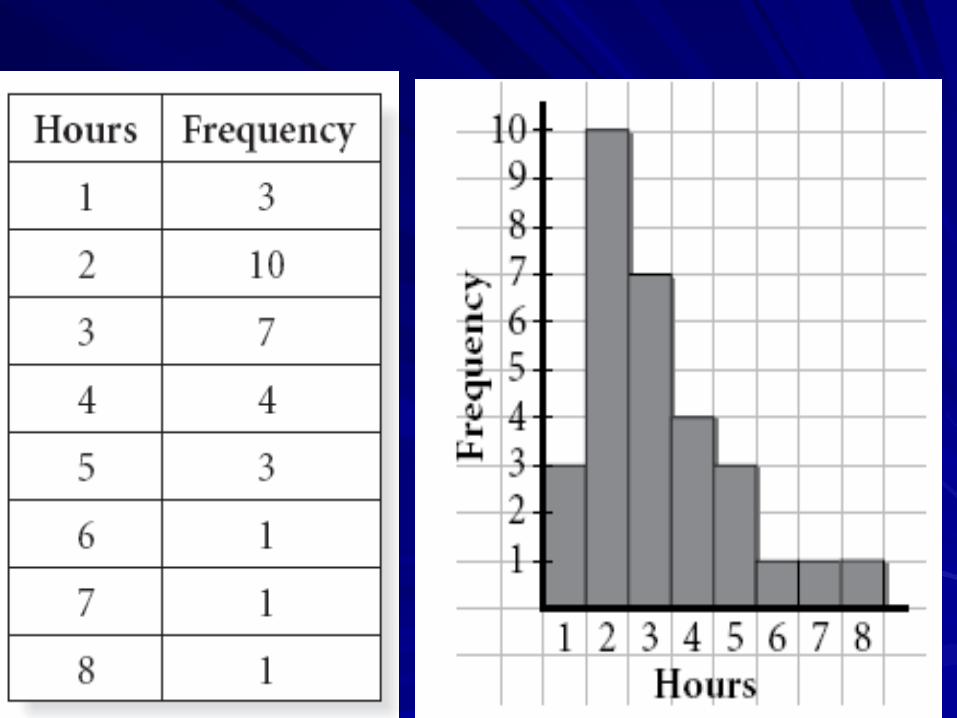
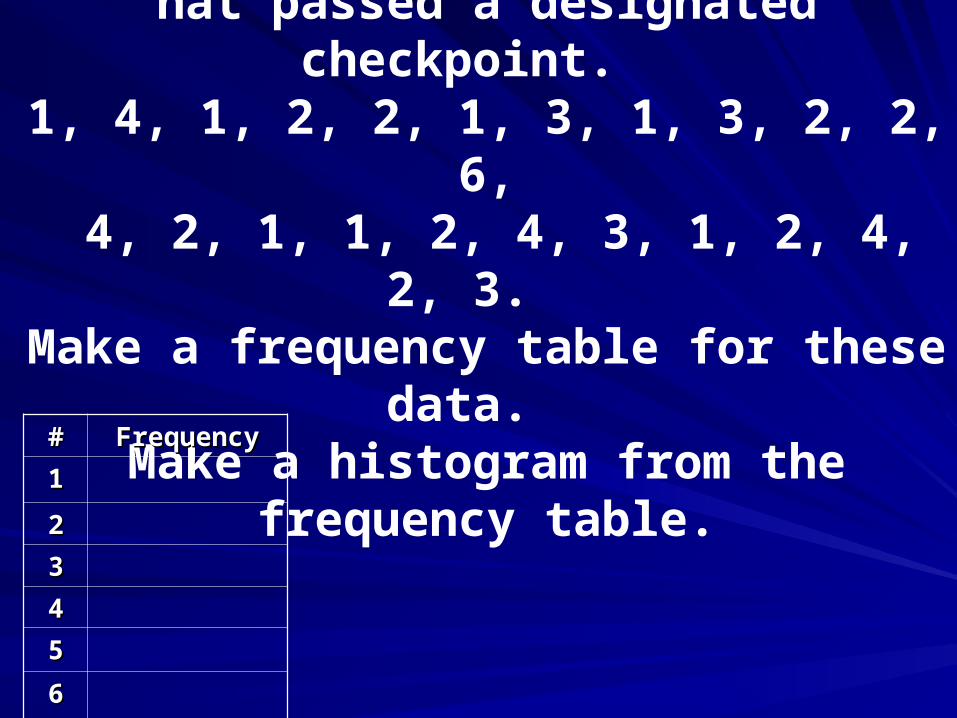
*Ex 2. The given data shows the # of people in 24 vehicles
hat passed a designated checkpoint. 1, 4, 1, 2, 2, 1, 3, 1, 3, 2, 2, 6,
4, 2, 1, 1, 2, 4, 3, 1, 2, 4, 2, 3. Make a frequency table for these data. Make a histogram from the frequency
table.## FrequencyFrequency
11
22
33
44
55
66


PracticePractice
Textbook: p.62/1,3,5
P.65/10

Exit QuestionExit Question
A. When would you use a A. When would you use a stem and leaf plot to display stem and leaf plot to display data?data?
B. When would you use a B. When would you use a histogram to display data?histogram to display data?


Review of Stem-and-Leaf Plots, Review of Stem-and-Leaf Plots, Histograms, and Circle GraphsHistograms, and Circle Graphs
Recommended