2010 Talent Search 7th Grade Females - SAT
Critical ReadingMath
Mean
Std. Deviation
25th
50th
75th
Number of Students
Percentiles
520530
460460
400410
9598
461469
49704970
Statistics
Percentile RankFrequency
200
220
230
240
250
260
280
290
300
310
320
330
340
350
360
370
380
390
400
410
420
430
440
450
460 51192
48303
41164
38254
33214
29257
24144
21127
18154
15113
13111
1098
872
734
671
553
447
316
336
223
11
123
12
116
128
Math Scores and Percentiles
Page 1

Percentile RankFrequency
470
480
490
500
510
520
530
540
550
560
570
580
590
600
610
620
630
640
650
660
670
680
690
700
710
720
730
740
750
760
770
780
790
800
Total 4970
10015
1002
1002
10014
996
991
9911
993
9910
9921
9814
9827
9717
9732
9637
9639
9535
9448
9351
9280
9155
9058
8881
87118
84103
8284
81172
77143
74160
71164
68184
64237
59170
56223
Math Scores and Percentiles
Page 2

Percentile RankFrequency
200
210
220
230
240
250
260
270
280
290
300
310
320
330
340
350
360
370
380
390
400
410
420
430
440
450
460
470
480
490
500
510
520
530
540
550
84107
82148
79163
75132
73187
69203
65174
61201
57243
52144
49233
45167
41312
35204
31225
26122
24196
20126
18127
15158
1284
1085
873
763
653
537
443
323
333
21
227
13
116
11
112
133
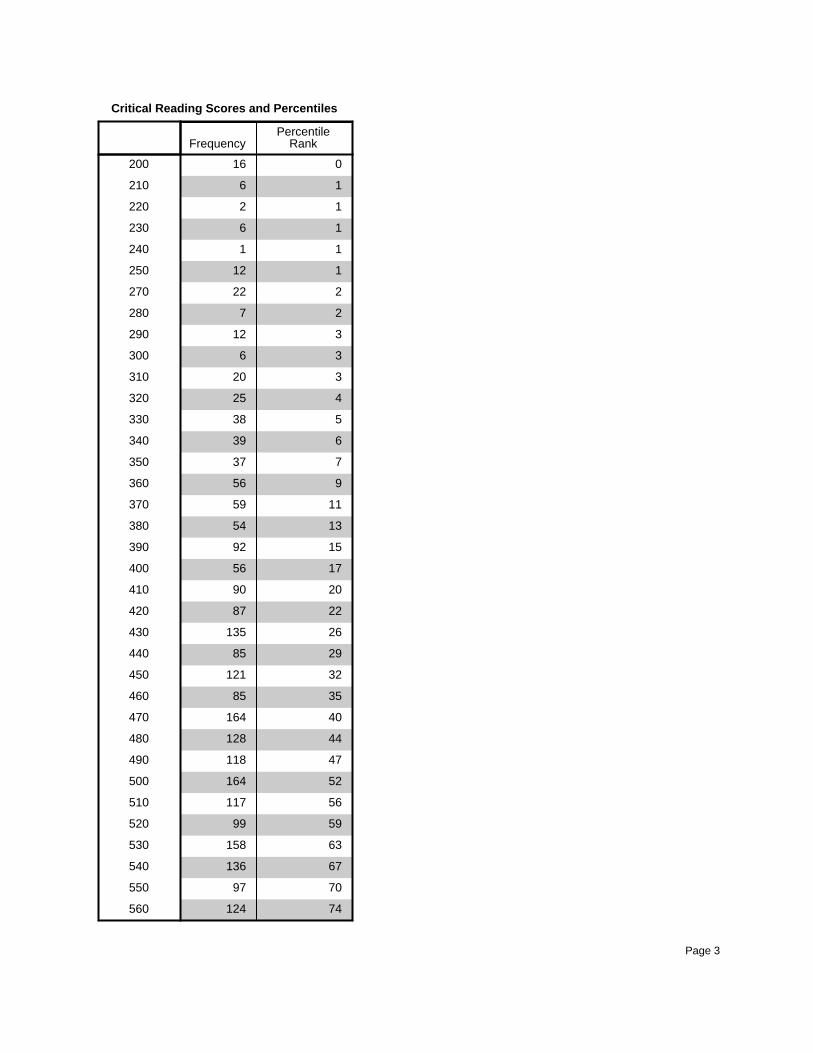
Critical Reading Scores and Percentiles
Page 3

Percentile RankFrequency
560
570
580
590
600
610
620
630
640
650
660
670
680
690
700
710
720
730
740
750
760
780
790
800
Total
4970
1001
1001
1001
1001
1004
1005
1007
1005
994
9916
9913
9916
9924
9823
9828
9738
9662
9542
9435
9381
9287
9065
89108
87144
Critical Reading Scores and Percentiles
Page 4

Math Scores
800
780
760
740
720
700
680
660
640
620
600
580
560
540
520
500
480
460
440
420
400
380
360
340
320
300
280
260
240
220
200
Fre
qu
ency
400
300
200
100
0
2010 Talent Search 7th Grade Females - SATMean = 469.08Std. Dev. = 98.478N = 4,970
Page 5

Critical Reading Scores
800
780
760
740
720
700
680
660
640
620
600
580
560
540
520
500
480
460
440
420
400
380
360
340
320
300
280
260
240
220
200
Fre
qu
ency
400
300
200
100
0
2010 Talent Search 7th Grade Females - SATMean = 461.05Std. Dev. = 94.89N = 4,970
Page 6

2010 Talent Search 7th Grade Males - SAT
Critical ReadingMath
Mean
Std. Deviation
25th
50th
75th
Number of Students
Percentiles
520570
460490
390430
97108
457503
52185218
Statistics
Percentile RankFrequency
200
210
220
240
250
260
280
290
300
310
320
330
340
350
360
370
380
390
400
410
420
430
440
450
460
38184
35268
30159
27173
23154
20178
17116
15123
12109
1082
996
759
660
520
447
326
335
212
225
114
11
116
116
02
024
Math Scores and Percentiles
Page 1

Percentile RankFrequency
470
480
490
500
510
520
530
540
550
560
570
580
590
600
610
620
630
640
650
660
670
680
690
700
710
720
730
740
750
760
770
780
790
800
Total
5218
10031
998
9911
9927
9911
988
9835
9710
9732
9738
9629
9554
9461
9360
9256
9189
8976
8882
8693
84125
8292
80100
78118
76186
73135
70122
68191
64201
60132
58168
54210
50253
45185
42190
Math Scores and Percentiles
Page 2

Percentile RankFrequency
200
210
220
230
240
250
260
270
280
290
300
310
320
330
340
350
360
370
380
390
400
410
420
430
440
450
460
470
480
490
500
510
520
530
540
550
84107
82144
79181
75127
73165
70211
66194
62181
59277
53175
50205
46197
42318
36192
33204
29154
26182
22133
20122
17186
14101
1288
1092
878
763
631
556
424
348
310
242
23
224
13
115
137
Critical Reading Scores and Percentiles
Page 3

Percentile RankFrequency
560
570
580
590
600
610
620
630
640
650
660
670
680
690
700
710
720
730
740
750
780
790
Total
5218
1001
1001
1002
1003
1004
1005
1003
1006
1005
9924
9919
9929
9836
9730
9763
9643
9555
9491
92103
9081
88111
86133
Critical Reading Scores and Percentiles
Page 4

Math Scores
800
780
760
740
720
700
680
660
640
620
600
580
560
540
520
500
480
460
440
420
400
380
360
340
320
300
280
260
240
220
200
Fre
qu
ency
300
200
100
0
2010 Talent Search 7th Grade Males - SAT
Mean = 503.05Std. Dev. = 108.245N = 5,218
Page 5

Verbal Scores
800
780
760
740
720
700
680
660
640
620
600
580
560
540
520
500
480
460
440
420
400
380
360
340
320
300
280
260
240
220
200
Fre
qu
ency
400
300
200
100
0
2010 Talent Search 7th Grade Males - SAT
Mean = 456.94Std. Dev. = 96.561N = 5,218
Page 6
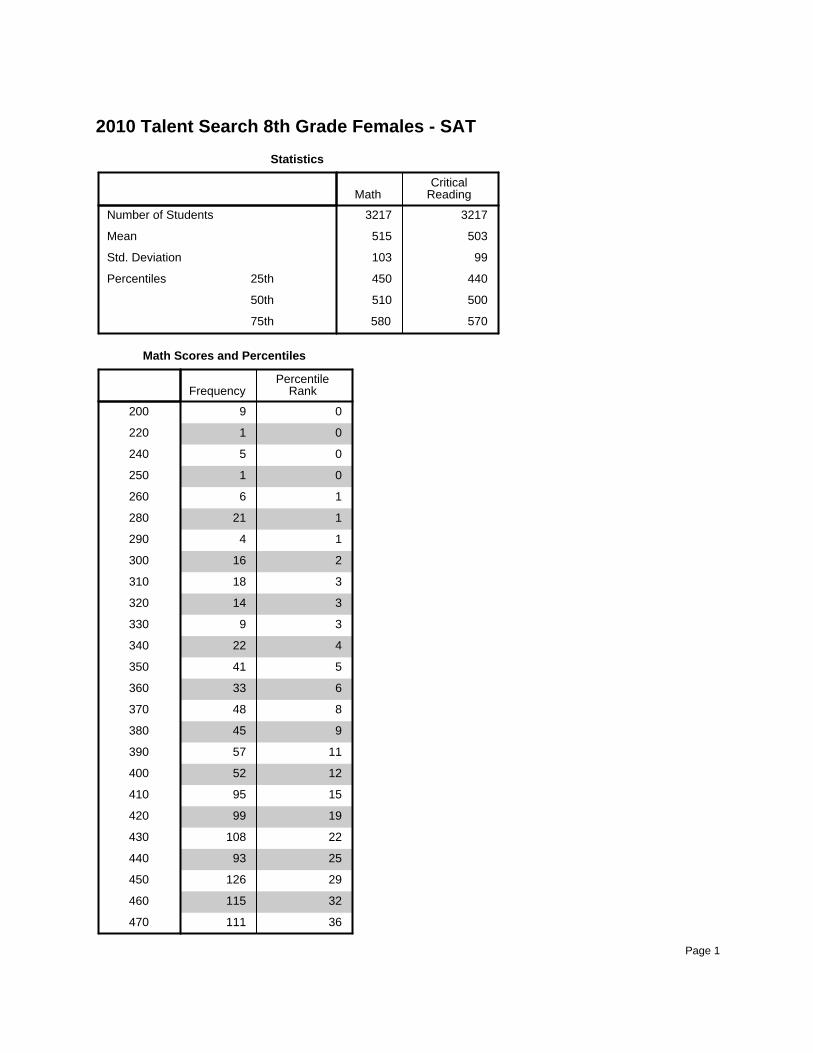
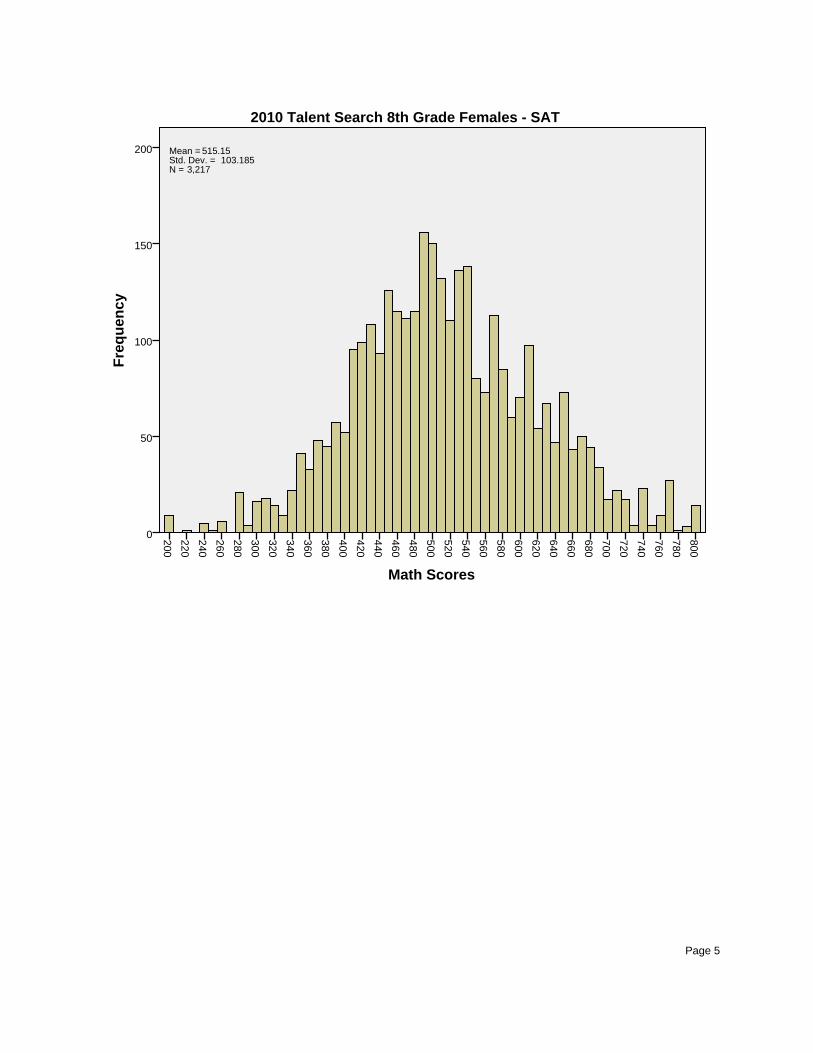
2010 Talent Search 8th Grade Females - SAT
Critical ReadingMath
Mean
Std. Deviation
25th
50th
75th
Number of Students
Percentiles
570580
500510
440450
99103
503515
32173217
Statistics
Percentile RankFrequency
200
220
240
250
260
280
290
300
310
320
330
340
350
360
370
380
390
400
410
420
430
440
450
460
470
36111
32115
29126
2593
22108
1999
1595
1252
1157
945
848
633
541
422
39
314
318
216
14
121
16
01
05
01
09
Math Scores and Percentiles
Page 1

Percentile RankFrequency
480
490
500
510
520
530
540
550
560
570
580
590
600
610
620
630
640
650
660
670
680
690
700
710
720
730
740
750
760
770
780
790
800
Total
3217
10014
1003
991
9927
999
984
9823
974
9717
9722
9617
9634
9544
9350
9243
9073
8847
8767
8454
8397
8070
7860
7685
73113
7073
6780
65138
61136
56110
53132
49150
44156
39115
Math Scores and Percentiles
Page 2

Percentile RankFrequency
200
210
230
250
260
270
280
290
300
310
320
330
340
350
360
370
380
390
400
410
420
430
440
450
460
470
480
490
500
510
520
530
540
550
560
570
7691
74145
6988
66118
63152
58104
55123
51147
46130
42137
38135
3480
31124
2790
25148
2069
1883
1556
1476
1147
1055
848
735
622
525
427
323
211
216
28
18
13
113
11
11
119
Critical Reading Scores and Percentiles
Page 3

Percentile RankFrequency
580
590
600
610
620
630
640
650
660
670
680
690
700
710
720
730
740
750
760
770
780
790
800
Total
3217
1003
1005
1001
1001
1003
1004
994
998
9921
9810
9817
9814
9726
9634
9534
9458
9231
9185
8966
8752
8596
82105
7981
Critical Reading Scores and Percentiles
Page 4
Math Scores
800
780
760
740
720
700
680
660
640
620
600
580
560
540
520
500
480
460
440
420
400
380
360
340
320
300
280
260
240
220
200
Fre
qu
ency
200
150
100
50
0
2010 Talent Search 8th Grade Females - SAT
Mean = 515.15Std. Dev. = 103.185N = 3,217
Page 5

Verbal Scores
800
780
760
740
720
700
680
660
640
620
600
580
560
540
520
500
480
460
440
420
400
380
360
340
320
300
280
260
240
220
200
Fre
qu
ency
200
150
100
50
0
2010 Talent Search 8th Grade Females - SAT
Mean = 503.15Std. Dev. = 98.942N = 3,217
Page 6

2010 Talent Search 8th Grade Males - SAT
Critical ReadingMath
Mean
Std. Deviation
25th
50th
75th
Number of Students
Percentiles
570630
500550
430480
100108
499550
33433343
Statistics
Percentile RankFrequency
200
220
230
240
260
270
280
290
300
310
320
330
340
350
360
370
380
390
400
410
420
430
440
450
460
2272
20114
1667
1478
1252
1072
835
735
632
531
425
319
324
23
213
210
112
15
17
11
17
04
02
04
04
Math Scores and Percentiles
Page 1

Percentile RankFrequency
470
480
490
500
510
520
530
540
550
560
570
580
590
600
610
620
630
640
650
660
670
680
690
700
710
720
730
740
750
760
770
780
790
800
Total
3343
10057
983
982
9841
9718
965
9641
9512
9530
9450
9226
9171
8962
8784
8572
8397
8082
7792
75100
72133
6878
6599
62104
59137
5590
5386
50128
46144
42100
39105
36135
32146
27101
2484
Math Scores and Percentiles
Page 2
Percentile RankFrequency
200
210
220
230
240
250
270
280
290
300
310
320
330
340
350
360
370
380
390
400
410
420
430
440
450
460
470
480
490
500
510
520
530
540
550
560
74124
7097
67136
63158
5999
56117
52164
47118
44128
40164
3585
32121
2985
26135
2287
2090
1756
1592
1354
1159
956
737
639
538
425
320
36
312
27
222
112
11
16
12
16
016
Critical Reading Scores and Percentiles
Page 3

Percentile RankFrequency
570
580
590
600
610
620
630
640
650
660
670
680
690
700
710
720
730
740
750
770
780
790
800
Total
3343
1002
1002
1001
1001
1004
1007
998
9913
999
9919
9818
9733
9747
9545
9429
9333
9276
9059
8866
86100
83110
8094
7793
Critical Reading Scores and Percentiles
Page 4

Math Scores
800
780
760
740
720
700
680
660
640
620
600
580
560
540
520
500
480
460
440
420
400
380
360
340
320
300
280
260
240
220
200
Fre
qu
ency
150
100
50
0
2010 Talent Search 8th Grade Males - SAT
Mean = 549.85Std. Dev. = 108.492N = 3,343
Page 5
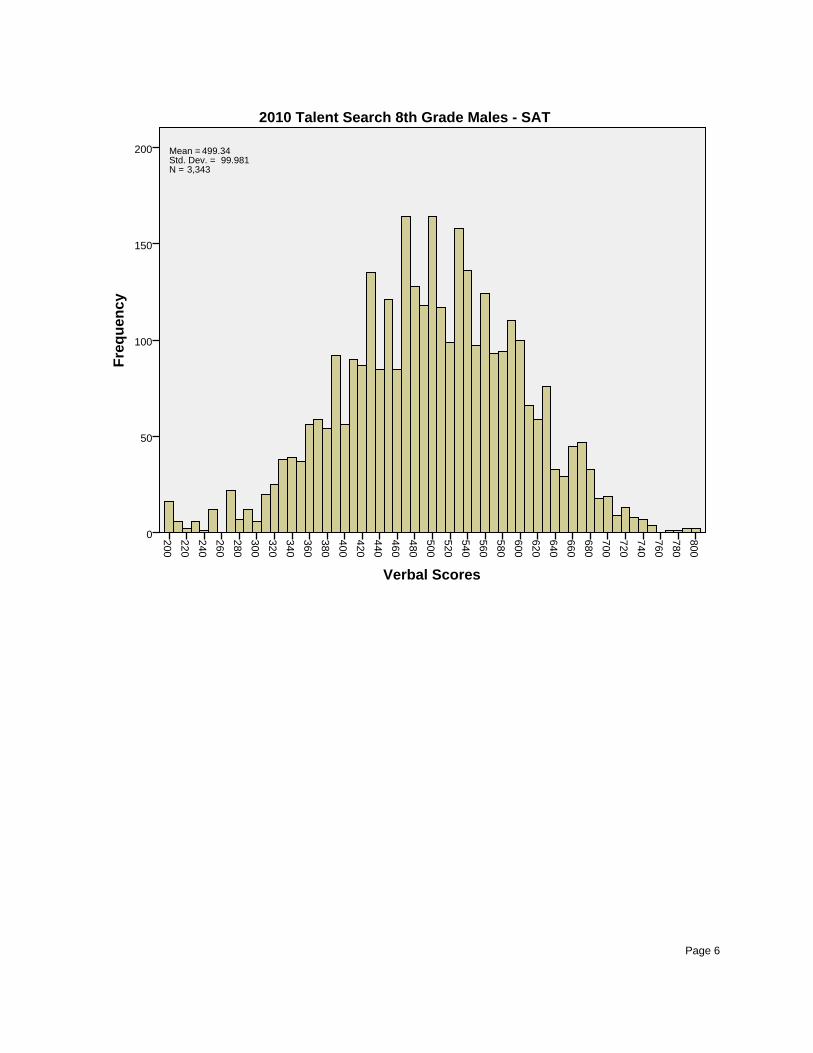
Verbal Scores
800
780
760
740
720
700
680
660
640
620
600
580
560
540
520
500
480
460
440
420
400
380
360
340
320
300
280
260
240
220
200
Fre
qu
ency
200
150
100
50
0
2010 Talent Search 8th Grade Males - SAT
Mean = 499.34Std. Dev. = 99.981N = 3,343
Page 6
Recommended


![Welcome! [schools.friscoisd.org]schools.friscoisd.org/docs/default-source/middle... · Welcome! ¡Bienvenidos! Duke Talent Identification Program 7th Grade Talent Search . ... able](https://img.pdfslide.net/doc/110x75/5f0c1ac27e708231d433c31f/welcome-welcome-bienvenidos-duke-talent-identification-program-7th-grade.jpg)