©2011 Cengage Learning

Chapter 16
©2011 Cengage Learning
SUMMARY OF REAL ESTATE INVESTMENT PRINCIPLES

©2011 Cengage Learning
Basic Investment Principles
Key Investment FactorsReturnManagementTaxabilityLiquidityRisk
©2011 Cengage Learning
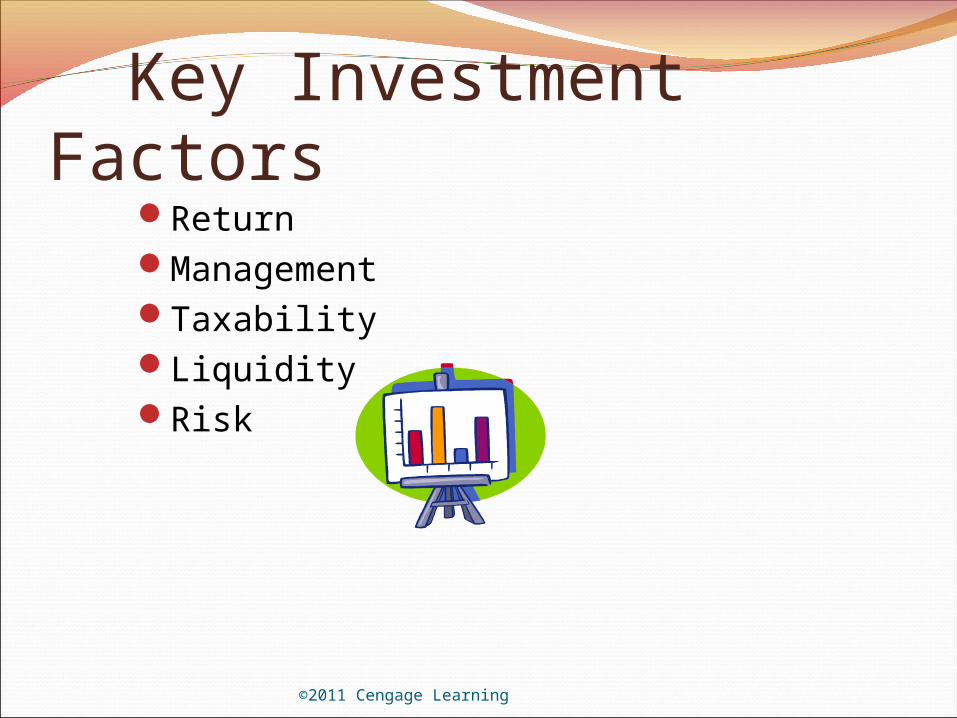
Major Economic Characteristics of an Investment• Return can be in the form of money or
amenities.• It may also vary over time & include reversion
at transfer• A series of payments over a period of time.• A series of payments plus a large single
payment.• A large single payment.
• Management of the investment over the holding period.
• Investors are interested in the after tax return.• Liquidity - real estate is considered illiquid. • Property may be sold or borrowed against.
©2011 Cengage Learning

Investment Risksa) Financialb) Interest Ratec) Purchasing Powerd) Social Changee) Legal Change
©2011 Cengage Learning

Real Estate as an Investment
Normally produces slow recovery of profit & initial investment over a period of years.
The process of forecasting money received annually, including resale, is called cash flow analysis.
©2011 Cengage Learning
Cash FlowThe income received from an investment over
a period of time.
©2011 Cengage Learning
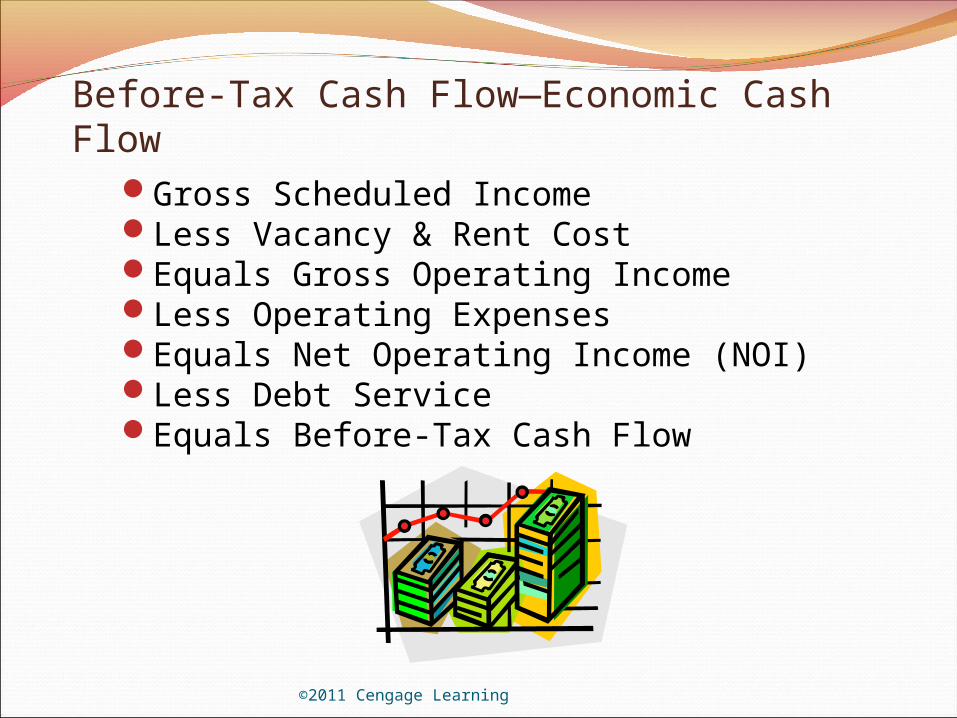
Before-Tax Cash Flow—Economic Cash FlowGross Scheduled IncomeLess Vacancy & Rent CostEquals Gross Operating IncomeLess Operating ExpensesEquals Net Operating Income (NOI)Less Debt ServiceEquals Before-Tax Cash Flow
©2011 Cengage Learning

Net Spendable Income =
Before Tax Cash Flow - Taxes
©2011 Cengage Learning

©2011 Cengage Learning
Annual Cash Flow Analysis
1. Gross Scheduled Income ($800 X 20 units X 12 mos.)
$192,000
2. Plus: Other Income ($300 X 12 mos.) + 3,600
3. Equals: Total Gross Income $195,600
4. Less: Vacancy/Credit Loss (5%) - 9,780
5. Equals: Gross Operating Income $185,820
6. Less: Annual Operating Expenses - 43,100
7. Equals: Net Operating Expenses $142,720
8. Less: Annual Debt Service -126,370
9. Equals: Before-Tax Cash Flow $16,350
©2011 Cengage Learning
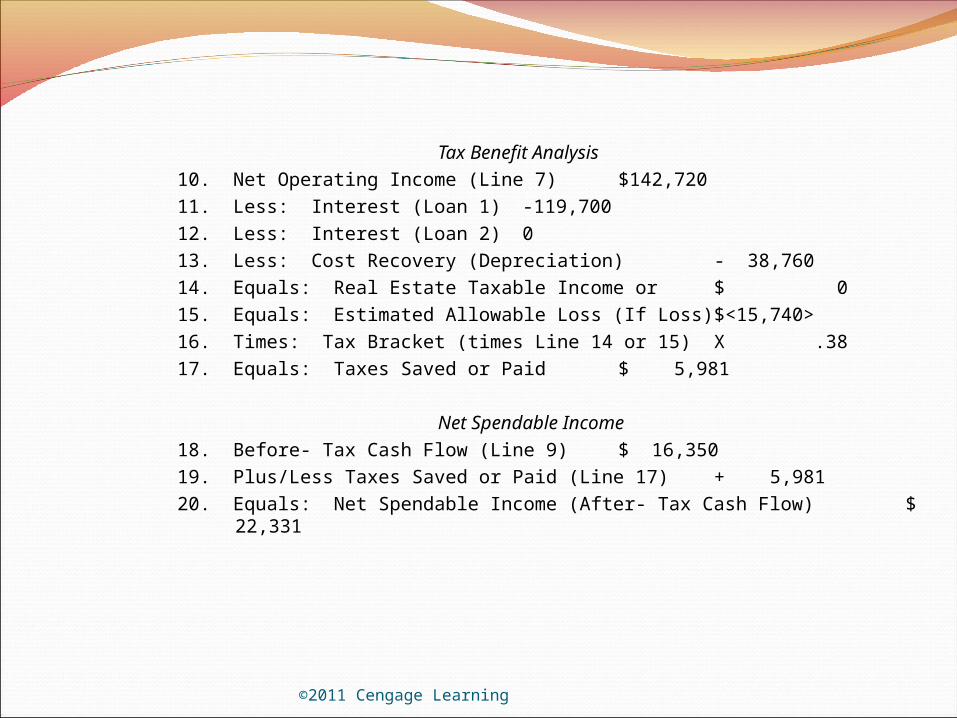
Tax Benefit Analysis10. Net Operating Income (Line 7) $142,72011. Less: Interest (Loan 1) -119,70012. Less: Interest (Loan 2) 013. Less: Cost Recovery (Depreciation) - 38,76014. Equals: Real Estate Taxable Income or $ 015. Equals: Estimated Allowable Loss (If Loss) $<15,740>16. Times: Tax Bracket (times Line 14 or 15) X .3817. Equals: Taxes Saved or Paid $ 5,981
Net Spendable Income18. Before- Tax Cash Flow (Line 9) $ 16,35019. Plus/Less Taxes Saved or Paid (Line 17) + 5,98120. Equals: Net Spendable Income (After- Tax Cash Flow) $ 22,331
Rental Real EstateTaxable income can represent an
income or loss Passive income and loss rules
©2011 Cengage Learning
After Tax Cash FlowNet spendable incomePlus or minus the taxes saved or paid
©2011 Cengage Learning
Ownership Period AnalysisInvestment in large properties means a
higher degree of analysis.Multiyear analysis is used with the cash flow
projected for each year of the estimated holding period.
©2011 Cengage Learning
Net Spendable IncomeIncludes the Net Sale Proceeds Called reversion by appraisers
©2011 Cengage Learning

Estimated Net Sales ProceedsResale price Minus seller closing costsMinus loan balancesMinus capital gain taxes Equals Net Sale Proceeds
©2011 Cengage Learning

Cash Flow AnalysisEstimate the first year’s Net Spendable
Income (After-Tax Cash Flow).Estimate each subsequent year’s Net
Spendable Income for the holding periodEstimate the net sale proceeds.
©2011 Cengage Learning
Key Economic IssuesOffering price
Amount of the cash investment
Rate of return on the cash investment
©2011 Cengage Learning

Techniques of Investors to Determine Purchase Price
Gross Rent Multiplier Asking Price / Gross Scheduled Income =Gross Rent
Multiplier Capitalization Rate
Net Operating Income (NOI) / Asking Price = Capitalization Rate
Price Per Square Foot
©2011 Cengage Learning
Rate of Return on cash invested
Rate of Return for the first year cash flow
Rate of Return for the holding period– Internal Rate of Return (IRR)– Financial Management Rate of Return
(FMMR)
©2011 Cengage Learning
©2011 Cengage Learning
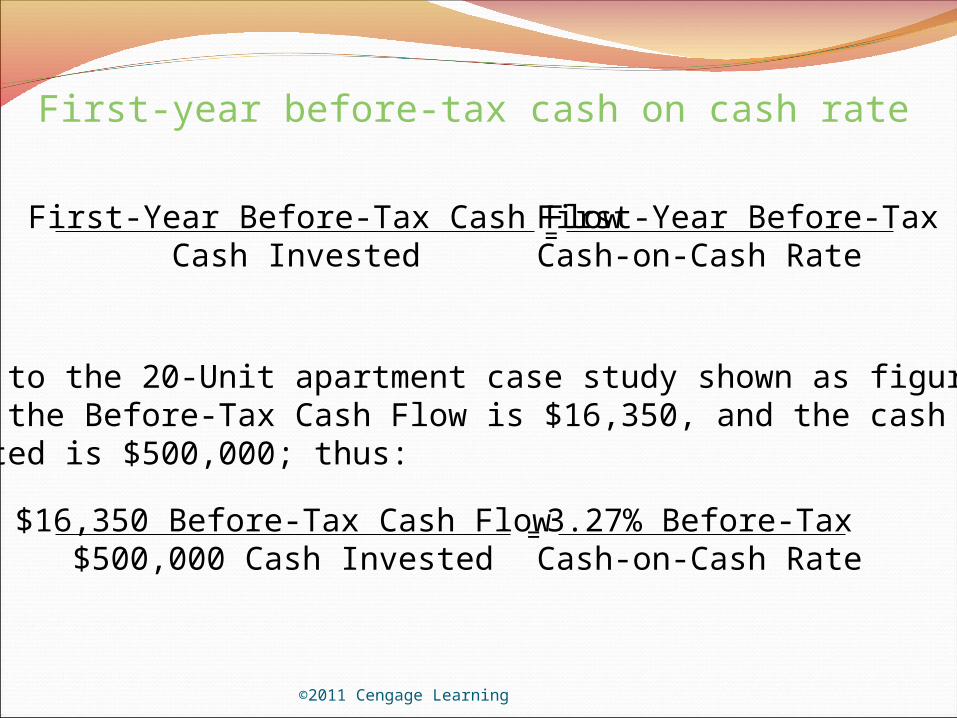
First-year before-tax cash on cash rate
First-Year Before-Tax Cash FlowCash Invested
First-Year Before-TaxCash-on-Cash Rate
=
Refer to the 20-Unit apartment case study shown as figure16.1; the Before-Tax Cash Flow is $16,350, and the cash invested is $500,000; thus:
$16,350 Before-Tax Cash Flow$500,000 Cash Invested
3.27% Before-TaxCash-on-Cash Rate
=

©2011 Cengage Learning
After-tax cash rate
First-Year Net Spendable IncomeCash Invested
First-Year After-TaxCash-on-Cash Rate
=
Refer to the 20-Unit apartment case study; the Net Spendable Income is $22,331, and the cash invested is still$500,000; therefore, the After-Tax Cash-on-Cash Rate is:
Net Spendable Income $22,331Cash Invested $500,000
4.47% After- TaxCash on Cash Rate
=
©2011 Cengage Learning
Investing is defined as giving up present consumption in exchange for future benefits.
Give it a try. You might like it or better explain it to others!
Recommended