1 | P a g e
CHAPTER 1: GENERAL INTRODUCTION
1.1 Introduction of the Subject Matter
This Dissertation aims to make a thorough review and assessment of the level of
organizational project management maturity of the South African sports clubs. The
main attention of the research is focused on the soccer clubs that are participating in
the South African Amalgamated Banks of South Africa (ABSA) Premier Soccer
League (PSL).
In approaching the research study, examination was made of the available literature
on theory and practice of Sports Management, Project Management, and Project
Management Maturity Models. The focus areas were on; the Management of soccer
clubs projects (events and activities), and secondly; the evaluation of Project
Management Maturity levels of Project Oriented Organizations such as soccer clubs
The words Football and Soccer are used interchangeably, as are the words Project
Oriented Organization (POO), Project Oriented Company (POC), and Project Based
Organization (PBO), as they refer to the same concepts, respectively, in this
document.
1.2 Sports Management
According to Zeigler (1987), the actual field of sport management as we understand
it today is at least 35 years older. He states that there have been courses on the
organization and administration of physical education and athletics in colleges and
universities since 1890. Zeigler (1996) further emphasize that the titles of the first
textbooks in sport management suggests that the focus of these texts are on the
management of physical education and athletic programs. Quite rightly they contain
chapters on such issues as how to organize athletic contests, how to manage
intramural programs, and how to maintain inventories of athletic equipment. He
further point out that these topics reflects the domain of sport management as it was
in the field's formative years; Nike and Entertainment and Sports Programming
2 | P a g e
Network (ESPN) were not yet created, the National Hockey League (NHL) only had
six teams, merchandising and licensing agreements were virtually unheard of, and
the only connection between McDonalds and the Olympics was if you stopped for a
hamburger on the way to or from one of the events. Today things are different, Sport,
as many commentators have noted, is big business (Aris 1990; Wilson 1988) and big
business is heavily involved in sport.
Sport has an ambiguous history when viewed from a management perspective. As
Stewart & Smith (1999) noted, the management of sport has traditionally been
divided between two contrasting philosophical approaches. At one extreme, sport is
viewed as a unique cultural institution with a host of special features wherein the
reflexive application of standard business practices not only produces poor
management decision making, but also erodes its rich history, emotional
connections, tribal links, and social relevance. At the other extreme, sport is seen to
be nothing more than just another generic business enterprise subject to the usual
government regulations, market pressures and customer demands, and is best
managed by the application of standard business tools that assist the planning,
finance, human resource management and marketing functions. Stewart & Smith
(1999) emphasize that over time these divisions have been blurred because of
sport’s corporatisation, and through the emergence of sport management as an
academic discipline. Stewart & Smith (1999) further states that sport is additionally
complicated by the fact that it exists in both commercial and not-for-profit forms like
other cultural services such as theatre, art, music, health care and education. On the
other hand, it is also distinctive in the sense that despite its growing
commercialisation and corporatisation, it ostensibly possesses many special
features.
Slack (1998) states that the management of sport was differentiated from general
management due to a belief in the social value of sport, rather than on the exclusive
basis of its economic value. According to Smith & Steward (2010), Slack (1996)
highlights the importance of connecting contemporary management issues and
theories to the management of sport by not only bolstering the credibility of sport
management, but by also using sport as a testing ground for broader management
theory development.
3 | P a g e
Foster, Greyser, & Walsh (2006) tackled the sport-as-a-unique institution issue by
compiling a list of features professional sport and business have in common, and
areas where they differ. They concluded that whereas sport and business share a
common concern for value creation, branding, funding new sources of revenue,
product innovation and market expansion, sport is significantly more concerned with
beating rivals, winning trophies, sharing revenue, and channelling the passions of
both players (the employees), and fans (the customers).
Smith & Steward (2010) further highlight an important point made by Foster, Greyser
& Walsh (2006) that athletes are now business assets, who are instrumental in
attracting fans, sponsors and media exposure. It therefore comes as no surprise that
unlike business, a sport’s service deliverers the players, who earn far more than their
immediate supervisors, the club managers.
There are also a number of distinctive features of sport which according to Hoye,
Nicholson, & Smith (2008) are most clearly played out in different ways across
sports’ three sectoral landscapes, the corporate, the not-for-profit, and the public.
They contend that the unique attributes of sport organizations influence how
theories, principles, and strategies are applied by sport managers. The unique
attributes included ‘‘consumer behaviour, the relationship between sport and
government, regulatory regimes, strategy, organizational structure, human resource
management, organizational culture, governance, and performance management. In
other words, the management of sport invokes the same basic considerations as any
other form of business management, but the specific application is subject to a range
of contextual quirks that demand customised adjustments (Smith & Steward 2010).
According to Smith & Steward (2010),
“The special features, or specificity, of sport have also been mired in a high
degree of structural ambiguity, and a cursory review of different governance
systems in sport around the world reveals that the push toward
corporatisation has delivered a range of substantially different business
models”.
4 | P a g e
As Foreman (2003) observed, there are numerous facets of sport’s organizational
structures to consider that go well beyond its legal status. These structures include
systems of governance, patterns of ownership, the mix of stakeholders, corporate
partnerships, and sport’s regulatory context. Hoye & Cuskelly (2007) argue that even
where the imperative of commercial success is at its most powerful in professional
team sport, there is considerable diversity, ranging from the membership based
clubs of Australia, New Zealand, South Africa and sub-continental Asia, to the listed
public shares of European football clubs, and the privately owned franchises of the
US ‘big four’ leagues (NFL, NBA, MLB, NHL). Foreman’s (2003) suggestion that this
suite of elements also affects the management practices undertaken is supported by
Noll (2003), who argue that different governance and business models have a
significant influence on management practice.
Smith & Steward (2010) argue that, of all the contextual forces observed to affect
sporting structures and practices over the last decade, it has been the impact of
commercialisation that has received the greatest attention. Syzmanski & Kuypers
(1999) refer to sport as an entertainment business capable of generating prodigious
sums of money and imposing into the lives of billions of people across the globe.
Accordingly, the problems of running a sporting business are much like those found
in any other business.
Although the special features of sport appear in a variety of works associated with
sport and its management, with Foster, Greyser, & Walsh (2006) being a good
recent example, there have been only a few attempts to systematically address their
importance and implications for good management practice. Hoye, Nicholson, &
Smith (2008) recently reviewed what they described as the unique features of sport
management, but their discussion was narrowly grounded in conventional aspects of
management, like strategy and human resources.
Manologlou (2004) further emphasize the need to manage sports clubs as a
business through his assertion that:
5 | P a g e
“Since the financial standing of a team is mainly what determines its overall
“health”, clubs now operate more like single business entities rather than
simply like athletic associations. Just as companies in the business world try
to function under certain standards and on an equal basis, European football
clubs should be competing under similar principles in order to make the
product more attractive to the general public, the sponsors, the players and
members”.
Manologlou’s (2004) analysis also apply for professional soccer clubs globally,
including the SA Premier Soccer League (PSL) clubs. PSL clubs now operates more
as businesses with player transfer transactions being conducted between local and
overseas clubs, engaging in community responsibility projects, managing game-day
events such as Ticketing, Catering, Security, Public Administration at the stadium,
daily management of youth development structures, managing relations with
supporters, sponsors, government, and the public, etc.
Syzmanski & Kuypers (1999) refer to sport as an entertainment business capable of
generating prodigious sums of money and imposing into the lives of billions of people
across the globe. Accordingly, the problems of running a sporting business are much
like those found in any other business. Hoye, Nicholson, & Smith (2008) argue that
the best way to tackle sport management is to inject sport’s idiosyncrasies with a
healthy dose of business management practices.
From Syzmanski & Kuypers (1999) and Hoye, Nicholson, & Smith (2008)’s
assertions above, it becomes necessary that sports clubs management practices
needs to be transformed from traditional and conventional ways, to standard
business management practices. This requires the clubs to become fully fledged
Project Oriented Organizations (POOs), and to manage their activities as projects.
As noted by Stewart and Smith (1999), the clubs should change from functioning as
unique cultural institutions with a host of special features wherein the reflexive
application of standard business practices not only produces poor management
decision making, but also erodes its rich history, emotional connections, tribal links,
and social relevance.
6 | P a g e
1.3 Project Oriented Organizations
Gareis (1989) has long ago coined the concept of the Project-Oriented Organization
(POO). Anderson & Jessen (2003) emphasize the specific feature of such an
organization is that the management of single projects, the management of network
of internal and external projects, and the relationships between the company and the
single projects are considered. According to (Gareis 2004) today projects are seen
as far more than solving of technical problems; they are also venues for mastering
business and change. The term project maturity might be used as an indication of or
a measurement of the organization’s ability to use projects for different purposes.
The terms project-oriented or project-based organization and the more generic term
of managing by projects can be applied to organizations whose strategic business
objectives rely on results from projects or programs (Gareis 2004).
Gareis (2005) states that, in the Dissertation the construct project-oriented company
is taken as the basic concept, which emphasises that the company explicitly chooses
to be project-oriented and manages a project portfolio of different internal and
external project types. The project-oriented company is a social construct and has
specific organizational strategy, structures and culture.
According to Gareis (2005) the project-oriented company is characterized by an
explicit project management culture. The project-oriented company advocates a
culture based on management concepts, such as Lean Management, Total Quality
Management, the Learning Organization, and Business Process Re-Engineering.
Lang & Rattay (2005) states that the management culture of the project-oriented
company is characterized by customer-orientation, process-orientation, and
interdisciplinary cross functional team work. Gareis (2005) further supports this by
making reference to networking with clients and suppliers and Beirne (2006) also
refer to empowerment.
A Contrario, Aubry, Hobbs, & Thuillier (2007) explain, the concept of project-oriented
organization relates to a global structural approach for more effective project
delivery. This question goes beyond the examination of the strict project structure
7 | P a g e
and the position of a given project in the organization to address the structural
problem from the point of view of the organizational level. This leads to research
agendas that reflect different schools of thought. Among others, Turner & Keegan
(1999) propose looking at the versatile project-oriented firm as a dual set of
functions, one of governance and one of operational control. DeFillippi & Arthur
(1998) have also identified project-based enterprises as organizations that manage
production functions within a temporary project organization setting, e.g. cultural
industries (film production and theatre) and professional services (public relations
and events management).
Dinsmore (1996) propose a corporate view of project management where the
organization is seen as a portfolio of projects and introduced the idea of managing
organization by projects. In a more recent research, Lampel & Jha (2004) explore
the relationship between projects and the corporate environment using the construct
of project orientation. Their initial findings conclude that this interface is a locus of
tension. The lack of understanding of the causes and dynamics of tension between
projects and organizations leads to friction and failure. This insight confirms the
necessity to shed light on the global organization where projects are realised in a
dynamic environment alongside operations (Lampel & Jha 2004).
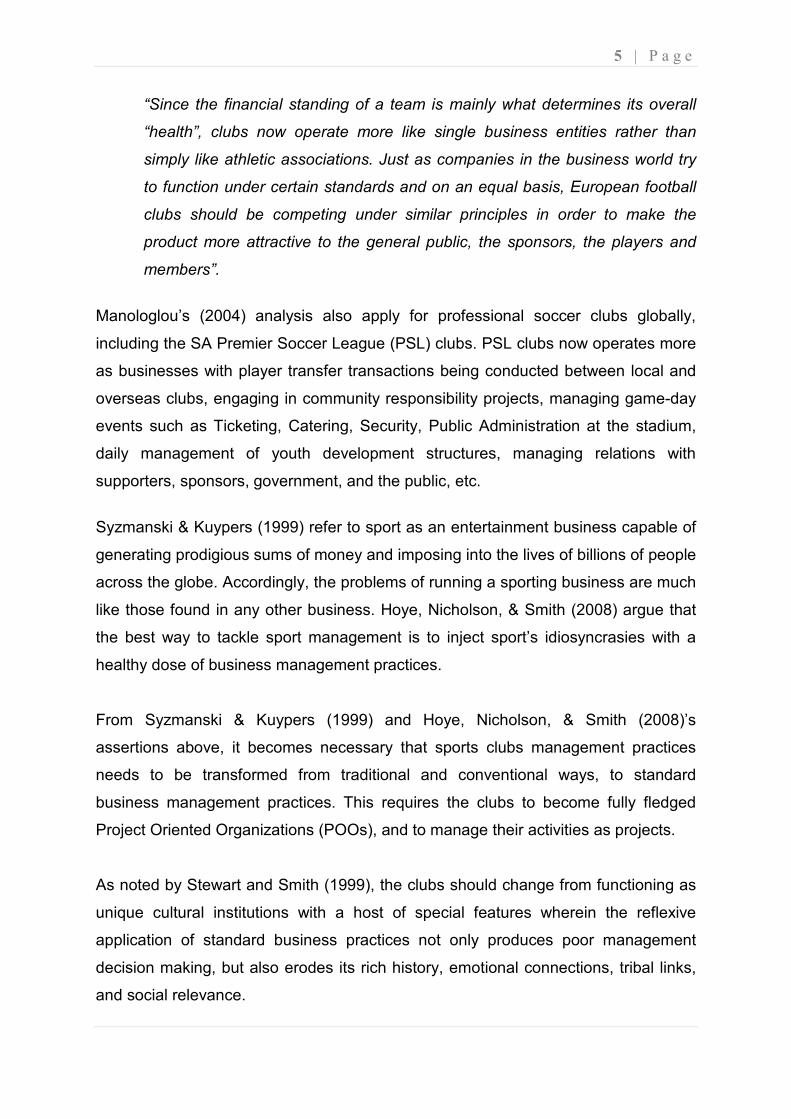
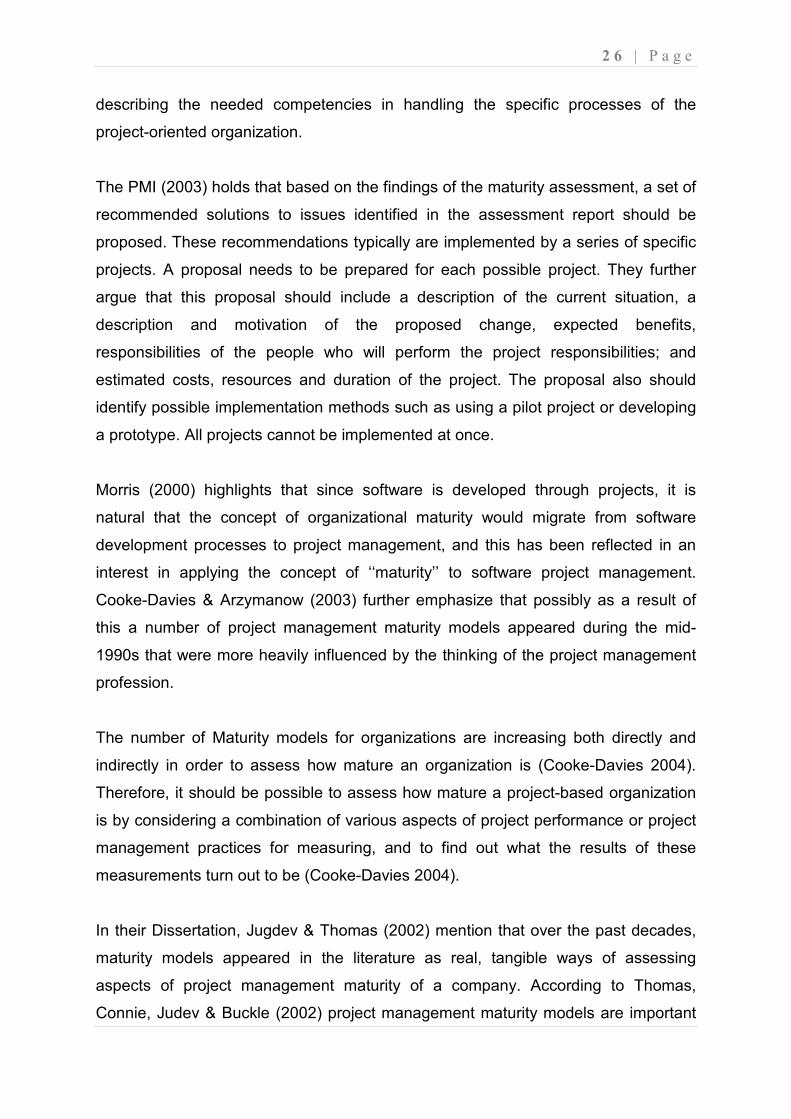
Thiry & Deguire (2007) argue that, most organizations have implemented Project
Management Offices (PMOs) and portfolio management structures that have
evolved from the traditional pyramidal organizational structure (see Fig. 1-1). In this
perspective, project-based structures simply mimic traditional organizational
structures, replacing management rhetoric with project rhetoric and may therefore be
losing some of the dynamism and flexibility attributes that characterise project and
programme management.
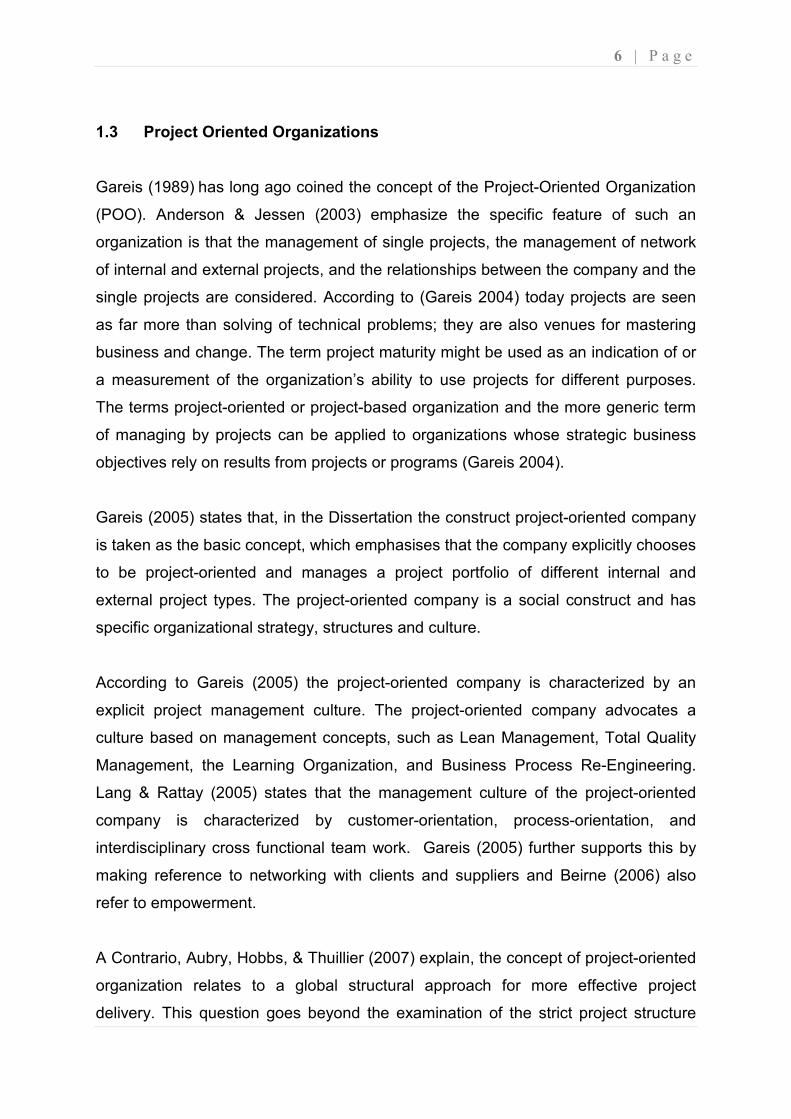
As shown in Fig. 1-2, a well integrated PBO is expected to display strong
interrelationships between its projects and both its business and corporate
strategies; in such an organization project managers are expected to be appointed in
senior management roles, or senior managers are expected to view project
management as an integrative process.
Fig. 1-1: Typical mechanistic PBO model as de
Source: (Thiry & Deguire 2007, p. 652)
Fig. 1-2: Vertical and horizontal integration in PBOs
Source: (Thiry & Deguire 2007, p. 652)
Typical mechanistic PBO model as described in recent PM literature
Deguire 2007, p. 652)
horizontal integration in PBOs
Deguire 2007, p. 652)
8 | P a g e
scribed in recent PM literature
9 | P a g e
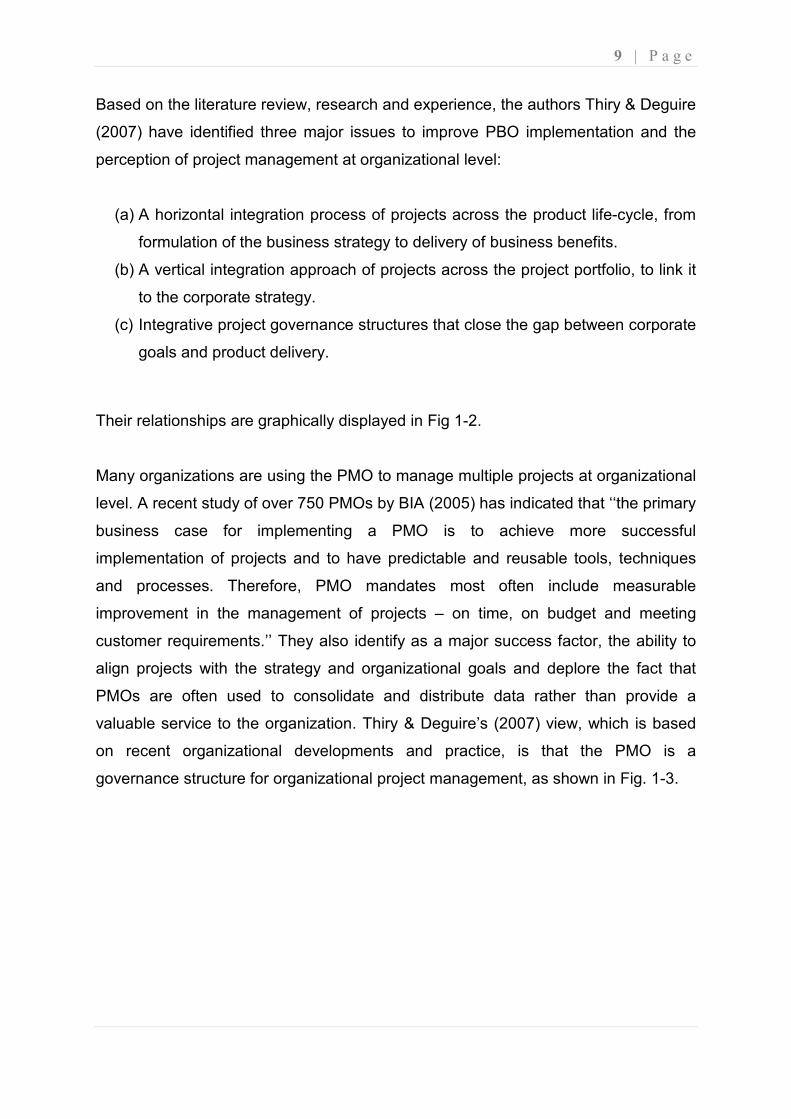
Based on the literature review, research and experience, the authors Thiry & Deguire
(2007) have identified three major issues to improve PBO implementation and the
perception of project management at organizational level:
(a) A horizontal integration process of projects across the product life-cycle, from
formulation of the business strategy to delivery of business benefits.
(b) A vertical integration approach of projects across the project portfolio, to link it
to the corporate strategy.
(c) Integrative project governance structures that close the gap between corporate
goals and product delivery.
Their relationships are graphically displayed in Fig 1-2.
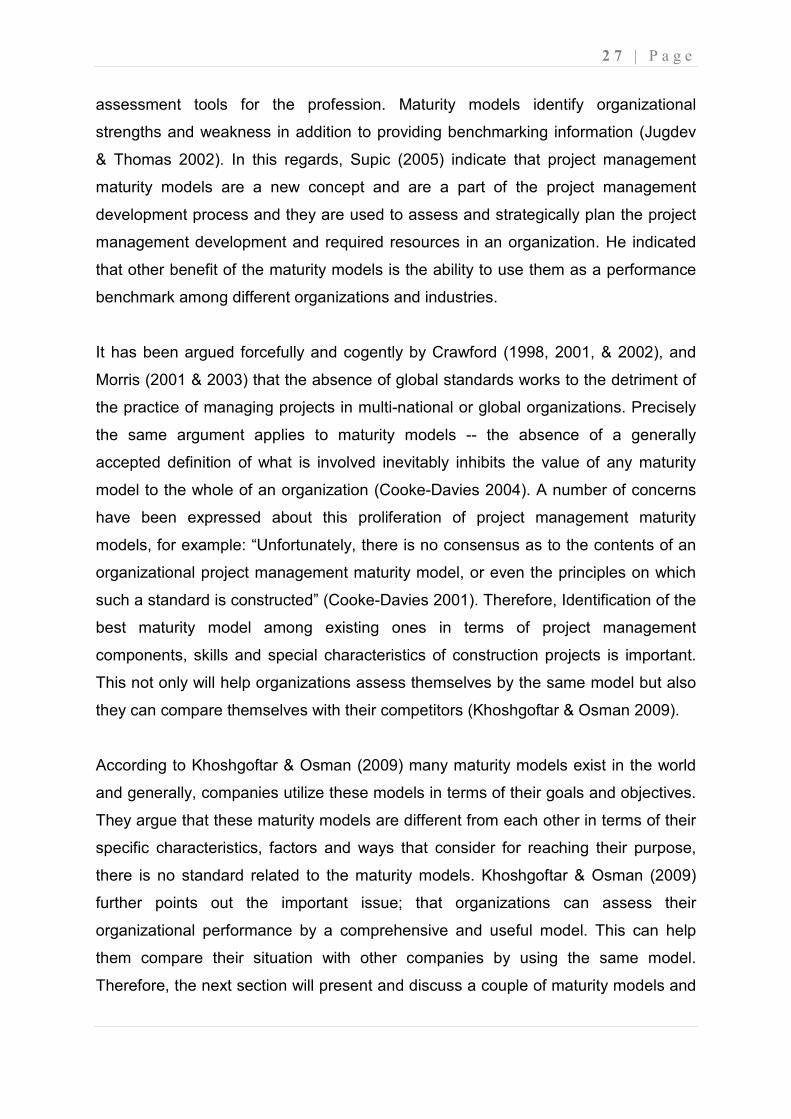
Many organizations are using the PMO to manage multiple projects at organizational
level. A recent study of over 750 PMOs by BIA (2005) has indicated that ‘‘the primary
business case for implementing a PMO is to achieve more successful
implementation of projects and to have predictable and reusable tools, techniques
and processes. Therefore, PMO mandates most often include measurable
improvement in the management of projects – on time, on budget and meeting
customer requirements.’’ They also identify as a major success factor, the ability to
align projects with the strategy and organizational goals and deplore the fact that
PMOs are often used to consolidate and distribute data rather than provide a
valuable service to the organization. Thiry & Deguire’s (2007) view, which is based
on recent organizational developments and practice, is that the PMO is a
governance structure for organizational project management, as shown in Fig. 1-3.
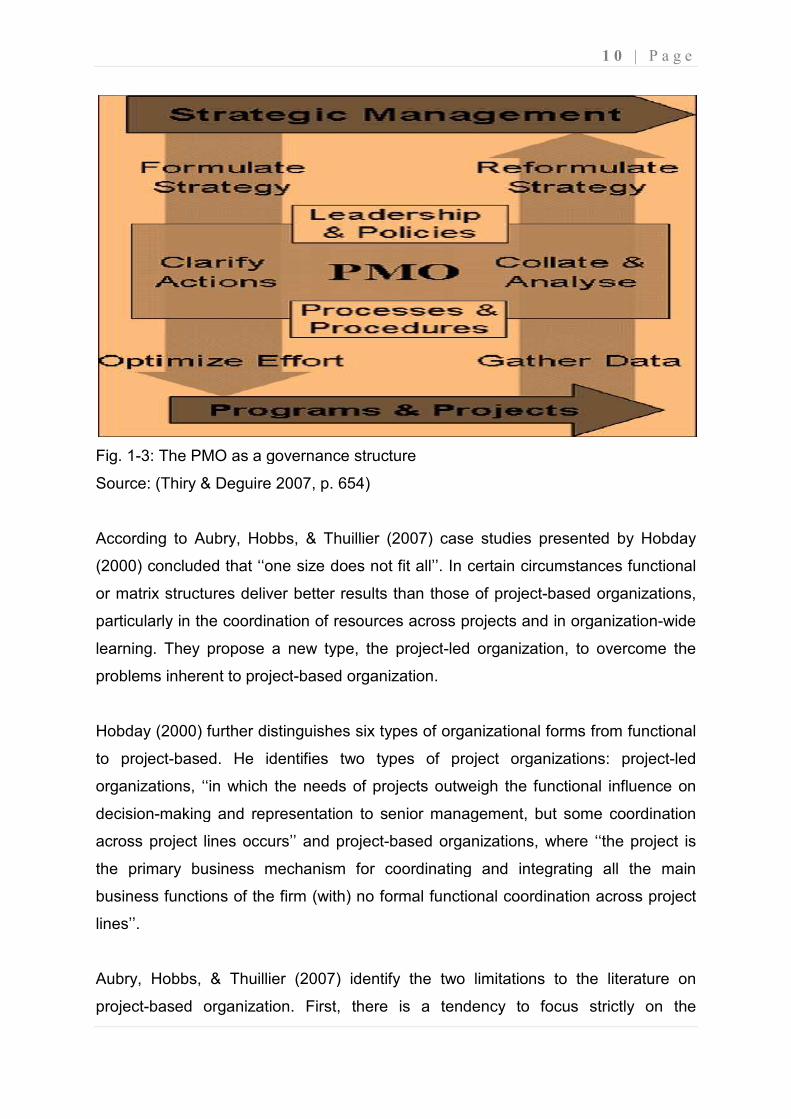
Fig. 1-3: The PMO as a governance structure
Source: (Thiry & Deguire 2007, p. 654)
According to Aubry, Hobbs,
(2000) concluded that ‘‘one size does
or matrix structures deliver better results than those of project
particularly in the coordination of resources
learning. They propose a new type, the project
problems inherent to project
Hobday (2000) further distinguishes
to project-based. He identifies two types of project
organizations, ‘‘in which the needs of projects outweigh
decision-making and representation
across project lines occurs’’ and project
the primary business mechanism for coordinating and integrating all the main
business functions of the firm
lines’’.
Aubry, Hobbs, & Thuillier (2007)
project-based organization.
e PMO as a governance structure
Deguire 2007, p. 654)
According to Aubry, Hobbs, & Thuillier (2007) case studies presented by Hobday
concluded that ‘‘one size does not fit all’’. In certain circumstances functional
structures deliver better results than those of project-based
articularly in the coordination of resources across projects and in organization
propose a new type, the project-led organization, to overcome
problems inherent to project-based organization.
distinguishes six types of organizational forms from functional
He identifies two types of project organization
s, ‘‘in which the needs of projects outweigh the functional influence on
making and representation to senior management, but some coordination
across project lines occurs’’ and project-based organizations, where ‘‘the project is
mechanism for coordinating and integrating all the main
business functions of the firm (with) no formal functional coordination across project
Thuillier (2007) identify the two limitations to the
organization. First, there is a tendency to focus strictly on
1 0 | P a g e
ase studies presented by Hobday
not fit all’’. In certain circumstances functional
based organizations,
organization-wide
, to overcome the
al forms from functional
organizations: project-led
the functional influence on
ior management, but some coordination
s, where ‘‘the project is
mechanism for coordinating and integrating all the main
coordination across project
to the literature on
First, there is a tendency to focus strictly on the
1 1 | P a g e
structural problem instead of seeing structure as part of a global organizational
process. Second, apart from those adopting an economic perspective, many of the
Dissertations on the subject propose models that lack theoretical foundations.
Thiry & Deguire (2007) argue that an important aspect of PBOs is yet unexplored
and lies in the development of a collaborative relationship between the fields of
project and general management and the importance of developing a common
language that fosters dialogue. Thiry & Deguire (2007) also emphasizes a two way
relationship which recognises that project management practice can and will
influence organizational practices as well as the obvious reverse.
According to Gareis (2003) companies are becoming more project-oriented. Projects
and programs are applied in all industries and in the non-profit sector. To perceive a
company as a POC is a social construction. Any company (or parts of a company,
such as a division or a profit center), which frequently applies projects and programs
to perform relatively unique business processes of large scope, can be perceived as
being project-oriented.
A POC can be defined as an organization, which:
• defines “Management by Projects” as an organizational strategy,
• applies temporary organizations for the performance of business processes of
medium and large scope,
• manages a project portfolio of different project types,
• has specific permanent organization units, such as a [Project Management]
PM Office and a Project Portfolio Group,
• applies a “New Management Paradigm”, and
• perceives itself, as being project-oriented.
Gareis (2003) further states that to observe the project-orientation of a company
requires “putting on a special pair of glasses of project-orientation,” which allows us
to observe the practices of project-, programme-, and project portfolio management
and to observe the organizational design and the personnel management, which
1 2 | P a g e
support these managerial practices. These observations are the basis for
management interventions needed in order to optimize the maturity as a POC.
1.4 Problem Statement
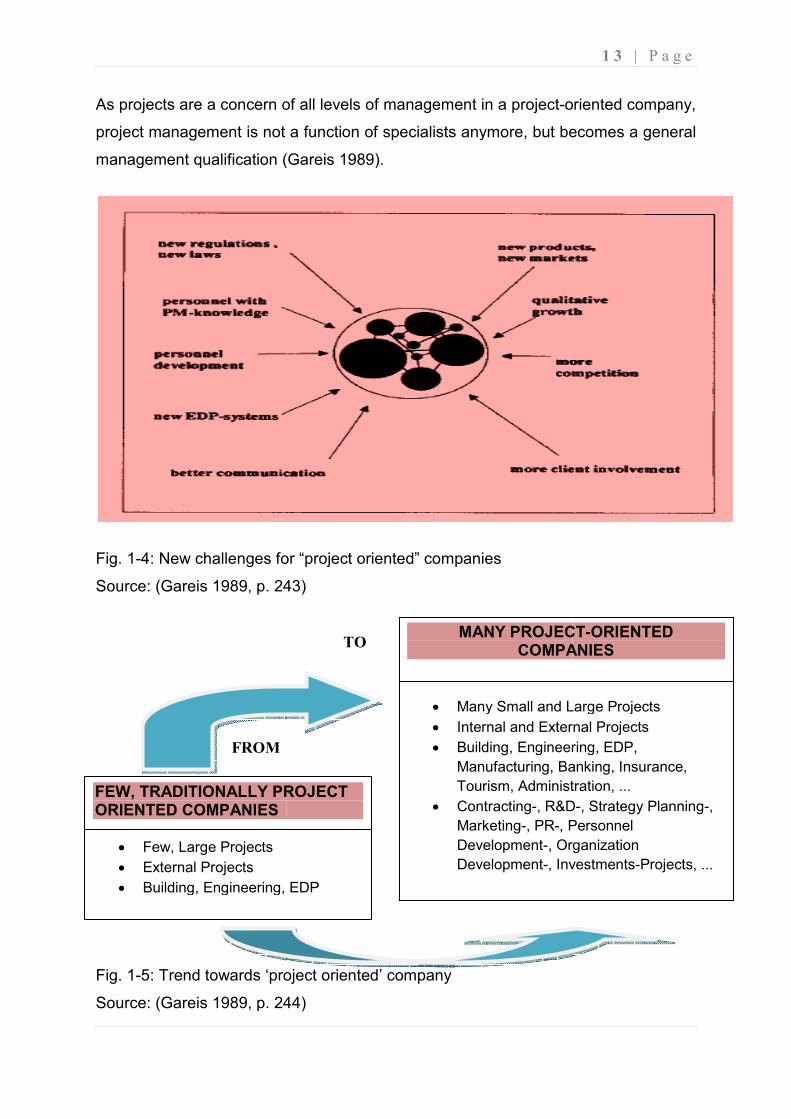
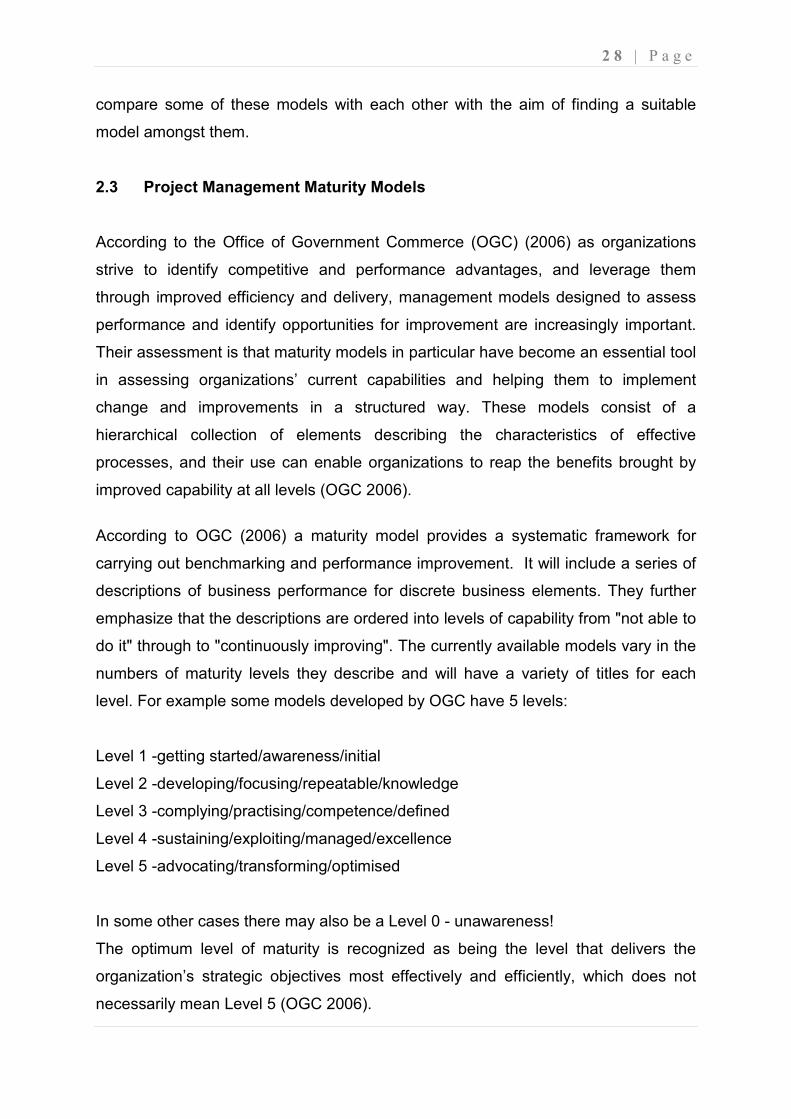
Gareis (1989) describes a project as “an organization, which is established for a
limited time period to solve a complex (relatively), unique problem”. Due to new
demands from a more complex and dynamic business environment (see Fig. 1-4),
recently not just building and engineering companies but companies from other
industries such as manufacturing, banking, insurance, tourism, and from
administration, also manage (part of their businesses) ‘by projects’. These
companies establish project organization for complex strategy planning, R & D,
marketing personnel development, organizational development, and PR tasks in
order to achieve satisfactory problem solutions in a short time and within budget
(Gareis 1989).
Hobday (2000) describes a project-based organization in two forms as an
organization ‘‘in which the needs of projects outweigh the functional influence on
decision-making and representation to senior management, but some coordination
across project lines occurs’’ and project-based organizations, where ‘‘the project is
the primary business mechanism for coordinating and integrating all the main
business functions of the firm (with) no formal functional coordination across project
lines’’.
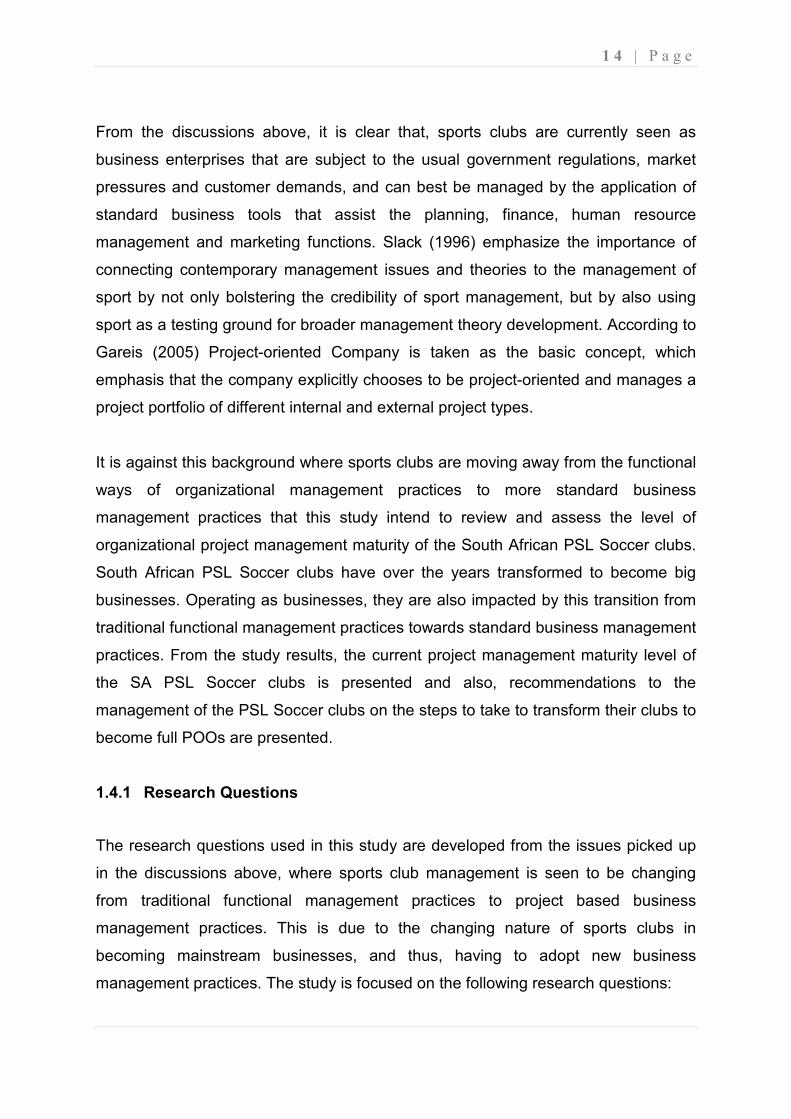
Gareis (1989) also states that, the trend toward the project-oriented company
creates new management demands (see Fig. 1-5). He says that there is a demand:
• for the professional management of single projects (‘project management’),
• for the professional management of the network of projects, performed
simultaneously by the project oriented company,
• for the management of the relationships between the single projects and the
base organization of the company.
As projects are a concern of all levels of management in
project management is not a function of specialists anymore, but beco
management qualification (Gareis 1989).
Fig. 1-4: New challenges for “project oriented” companies
Source: (Gareis 1989, p. 243)
Fig. 1-5: Trend towards ‘project oriented’ company
Source: (Gareis 1989, p. 244
FEW, TRADITIONALLY PROJECT ORIENTED COMPANIES
• Few, Large Projects
• External Projects
• Building, Engineering, EDP
FROM
As projects are a concern of all levels of management in a project-oriented company,
not a function of specialists anymore, but beco
(Gareis 1989).
New challenges for “project oriented” companies
Gareis 1989, p. 243)
5: Trend towards ‘project oriented’ company
Gareis 1989, p. 244)
TRADITIONALLY PROJECT
Building, Engineering, EDP
MANY PROJECTCOMPANIES
• Many Small and Large Projects
• Internal and External Projects
• Building, Engineering, EDP,
Manufacturing, Banking, Insurance,
Tourism, Administration, ...
• Contracting-, R&D
Marketing-, PR-, Personnel
Development-, Organization
Development-, Investments
TO
1 3 | P a g e
oriented company,
not a function of specialists anymore, but becomes a general
MANY PROJECT-ORIENTED COMPANIES
Many Small and Large Projects
Internal and External Projects
Engineering, EDP,
Manufacturing, Banking, Insurance,
Tourism, Administration, ...
, R&D-, Strategy Planning-,
, Personnel
, Organization
, Investments-Projects, ...
1 4 | P a g e
From the discussions above, it is clear that, sports clubs are currently seen as
business enterprises that are subject to the usual government regulations, market
pressures and customer demands, and can best be managed by the application of
standard business tools that assist the planning, finance, human resource
management and marketing functions. Slack (1996) emphasize the importance of
connecting contemporary management issues and theories to the management of
sport by not only bolstering the credibility of sport management, but by also using
sport as a testing ground for broader management theory development. According to
Gareis (2005) Project-oriented Company is taken as the basic concept, which
emphasis that the company explicitly chooses to be project-oriented and manages a
project portfolio of different internal and external project types.
It is against this background where sports clubs are moving away from the functional
ways of organizational management practices to more standard business
management practices that this study intend to review and assess the level of
organizational project management maturity of the South African PSL Soccer clubs.
South African PSL Soccer clubs have over the years transformed to become big
businesses. Operating as businesses, they are also impacted by this transition from
traditional functional management practices towards standard business management
practices. From the study results, the current project management maturity level of
the SA PSL Soccer clubs is presented and also, recommendations to the
management of the PSL Soccer clubs on the steps to take to transform their clubs to
become full POOs are presented.
1.4.1 Research Questions
The research questions used in this study are developed from the issues picked up
in the discussions above, where sports club management is seen to be changing
from traditional functional management practices to project based business
management practices. This is due to the changing nature of sports clubs in
becoming mainstream businesses, and thus, having to adopt new business
management practices. The study is focused on the following research questions:
1 5 | P a g e
1.4.1.1 Primary Research Question
What is the level of organizational project management maturity of the South
African PSL Soccer clubs?
The study is conducted on one representative club from the PSL, and an inference is
drawn about the level of organizational project management maturity of this club, to
the entire South African PSL Soccer Clubs.
1.4.1.2 Research Sub-Questions
The following questions form a set of sub-questions supporting the primary question:
i. Do PSL clubs perceive themselves as POOs?
ii. Do PSL clubs define “Management by Projects” as an organizational
strategy?
iii. Do PSL clubs have specific permanent organization units, such as a PM
Office and a Project Portfolio Group to help facilitate project management
efforts?
iv. Can something be done to improve the utilization of project management
practices by the PSL Clubs?
v. What is the next step in the path to attaining a higher degree of
organizational project management maturity by PSL Soccer clubs?
1.5 Study Objectives
The main objective of the study is to make a thorough review and assessment of the
level of organizational project management maturity of the South African PSL Soccer
clubs using Organizational Project Management Maturity Model (OPM3) Self-
assessment survey and open-ended structured interviews.
1 6 | P a g e
Based on the level of organizational project management maturity of the PSL Soccer
clubs, obtained from the results of the assessments, recommendations for the clubs
to make improvements or adjustments to enhance the successful implementation of
their projects and improve on their project management maturity level are presented.
Further objectives of the study are to:
• Establish whether the PSL Soccer clubs perceives themselves as businesses,
and as such, are entities that are supposed to be Project-Oriented in
managing their operations.
• Determine if the PSL Soccer clubs regards project management as a major
organizational strategic drive to help deliver their business targets.
• Determine if the organizational structure of the PSL Soccer clubs are
structured in a way that will assist in facilitating project management efforts.
• Identify if there is any organizational project management maturity measure
currently in place, and what the overall level is for the PSL Soccer clubs.
• Establish if something needs to be done to enhance the utilization of project
management practices by the PSL Clubs.
• Determine the way forward to assist the PSL Soccer clubs to attain a higher
degree of organizational project management maturity.
The benefits of the study can be realised in two folds. In establishing the level of
organizational project management maturity of the South African PSL Soccer club
through analysing the results of the sampled club, an inference is made from the
results obtained from this representative club to the entire South African PSL Soccer
clubs. The next steps to progress to a higher level of maturity are also proposed.
On the other hand, the study highlight the importance of implementing project
management practices in the way the PSL clubs manage their projects to ensure
that their projects are executed successfully.
1 7 | P a g e
1.6 Study Methodology
The first area of the study focus on measuring the organizational project
management maturity of PSL Soccer clubs, and the second area of focus is on
validating the organizational project management maturity of PSL Soccer clubs
based on how they manage their projects. The procedure and methodology that is
followed in this research is described below:
Firstly, engage the sampled PSL Soccer club’s management to get a buy-in to
conduct the study on their club, through convincing them about the benefits of the
study for their club. Make official requests to The Club’s management via telephone,
email, meetings, and using established internal personal contacts.
Secondly, provide a description of the sampled PSL club and its projects, pending
approval from The Club’s management. The Club is selected from the current
sixteen PSL clubs using a Simple Random Sampling method, from which one club is
selected for developing the research study. From the chosen club’s list of projects, a
finite set is chosen for investigation using the OPM3 Self assessment survey and
open ended interview questionnaire. Interviews are conducted with the relevant
project leaders and their team members per individual projects to collect available
information and literature about these projects. Further additional information is
gathered from the club’s projects documentation and reports, and from the literature
survey collected from the general industry-related literature.
Thirdly, conduct an extensive literature survey on organizational project
management, project management maturity models, Project Oriented Organizations
(POO), and sports and events management. Using OPM3 Self assessment survey
and open ended interview questionnaire, collect the data, analyze, review,
summarize and compare it to the literature, in assessment of the study findings.

1 8 | P a g e
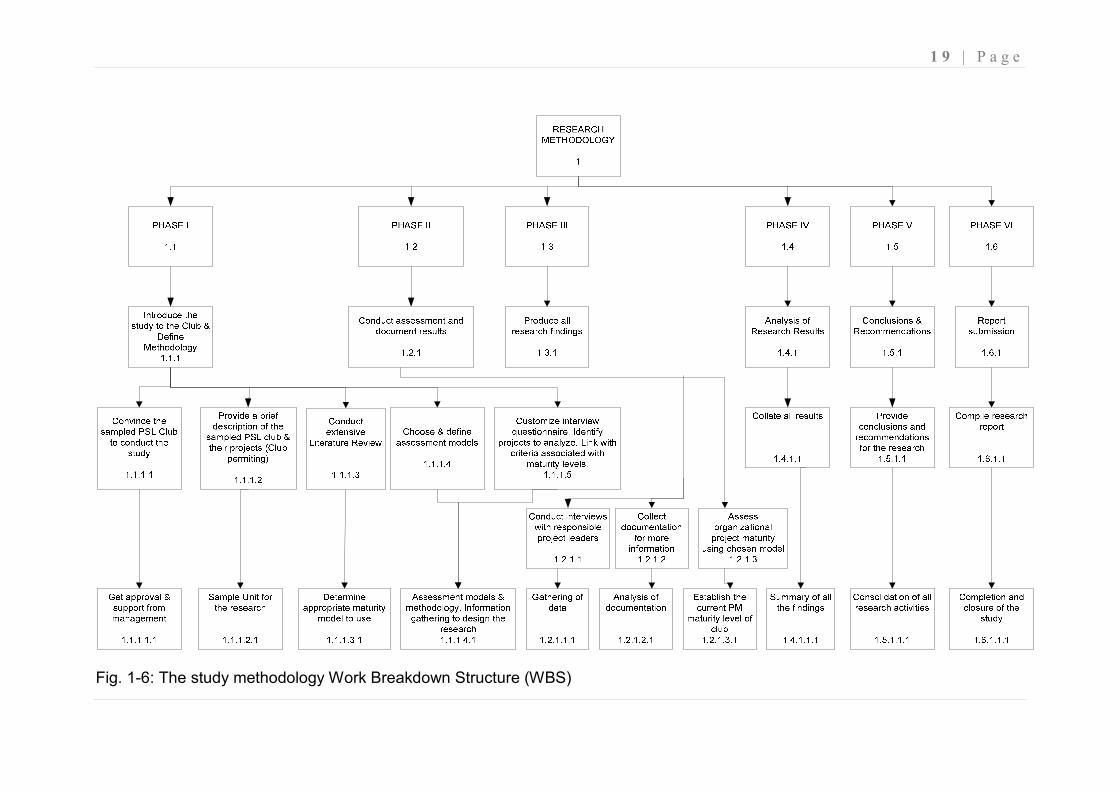
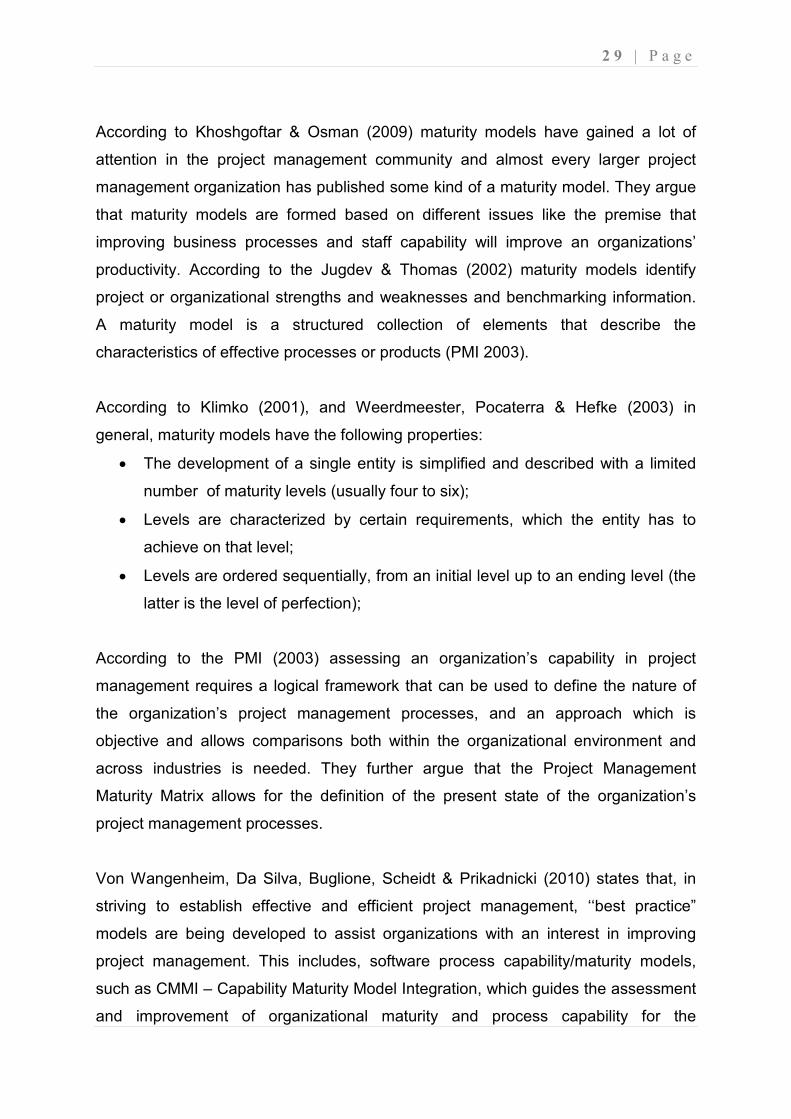
Lastly, include a section on conclusions and recommendations to complete a full
research report. The study methodology Work Breakdown Structure (WBS) is
summarized in Fig. 3-1 below. The methodology is divided into six Phases.
1 9 | P a g e
Fig. 1-6: The study methodology Work Breakdown Structure (WBS)
2 0 | P a g e
1.7 Study Limitations
The study has the following limitations:
• The reluctance of The Club management to allow the study to be conducted
on their club because of the level of skepticism concerning the kind of benefits
the study aims to provide to The Club.
• Availability of the club’s management to conduct interviews and complete
survey questionnaires is limited due to the PSL league season being in full
swing and all personnel at the club focusing on the league. This compromises
the quality of data collection.
• Accessibility of information that is regarded as confidential by the club.
Certain information cannot be made available because of the levels of
confidentiality involved.
• Timelines provided by SBL to complete the study constrain and compromise
the thoroughness and quality of the study.
• A Non Disclosure Agreement restriction between the researcher and the club,
not to mention the club’s name and that of its employees, including
management, in the research report; not to report on the club’s profile and
other “sensitive” projects as that will easily expose their identity, because the
club prefers to remain anonymous due to fear of their operations being
exposed to their competitors.
• Inaccurate or incomplete information that is provided by club’s respondents
because of lack of thorough understanding of the research aims and
objectives, and being skeptical about the research.
1.8 Chapters Outline
The research report consists of 6 chapters, References, and a list of Appendices as
described below.
2 1 | P a g e
Chapter 2: Theory and Practice of Project Management Maturity
This chapter review the theory and practice of sports and event management,
Project Management Maturity, and the benefits of using maturity models. The
common project management maturity models are discussed, highlighting the
advantages and limitations of using these models in analyzing organizational
Project Management Maturity.
Chapter 3: Research Methodology
This chapter discusses the philosophy behind the different research methodologies
available, their strengths and weaknesses, and presents the methodology that is
selected by the researcher for this study. The research design and data collection
instruments used are also discussed in this chapter.
Chapter 4: Research Results
This chapter presents the research results and findings.
Chapter 5: Synthesis & Analysis of Results
This chapter presents the analysis of the results and findings. Thorough analysis of
the results is conducted in this chapter and all identified gaps are highlighted and
their root-cause identified. This is the chapter were research questions are
answered.
Chapter 6: Conclusions and Recommendations.
This chapter provides all the conclusions from the study, as informed by the analysis
of the results in the preceding chapter. Relevant recommendations as informed by
the study results and their analysis thereof are also proposed in this chapter.
2 2 | P a g e
CHAPTER 2: THEORY AND PRACTICE OF PROJECT MANAGEMENT
MATURITY
2.1 Introduction
According to Combe (1998), Hartman (1997), and Ibbs & Kwak (2000) project
management maturity models, as a subset of strategic planning for project
management provide a means of identifying key steps, the tasks that need to be
accomplished, and the sequence of events needed to realize meaningful and
measurable results. They basically describe the purpose of the maturity model as the
one that provide a framework for improving an organization’s business result by
assessing the organization’s project management strengths and weaknesses,
enabling comparisons with similar organizations, and a measure of the correlation
between an organization’s project management level and actual project
performance.
Cooke-Davies (2002) points out that there is an increased interest in project
management maturity in the marketplace today. Several trends point to this:
• A growing number of organizations are adopting Software Engineering
Institute’s (SEI’s) latest addition to the Capability-Maturity Model family of
models – the CMM-I (for Integration);
• Extensive support is being shown for the development of PMI’s OPM3
(Organizational Project Management Maturity Model);
• An editorial comment in Project Manager Today’s February issue [of 2002]
suggested that project management maturity models are being hailed as the
latest new ‘silver bullet’ that some project managers have sought for so long.
In support of this trend, there are at least 30 models on the market that are currently
being used by organizations to assess the maturity of their project management
processes. Unfortunately, adopting such a ‘maturity model’ throughout an enterprise
involves an enormous pan-organizational effort, with no guarantee that the results
will live up to expectations (Cooke-Davis 2002).
2 3 | P a g e
Kerzner (2004) further emphasize this fact by saying that, “all organizations go
through a maturity process”... even though these systems and processes do not
necessarily guarantee success, they just increase the probability of success. It is
against this background that the following sections in this chapter will cover in detail
the theory and practice of organizational project management maturity, and also
provide a discussion on some of these project management maturity models.
2.2 Organizational Project Management Maturity
The concept of process maturity was born in the Total Quality Management
movement, where the application of statistical process control (SPC) techniques
showed that improving the maturity of any technical process leads to two things: a
reduction in the variability inherent in the process, and an improvement in the mean
performance of the process (Cooke-Davies, Schlichter & Bredillet 2001).
According to the Project Management Institute (PMI) (2003), as organizations
continue to grow in size and scope, they are taking on increasingly complicated
projects. However, they have not necessarily made the same advancements in their
project management practices. Their research shows that project failure rates have
actually increased, and that those rates correspond directly to the size of the project.
Anderson & Jessen (2003) view projects today as far more than solving of technical
problems; they are also venues for mastering business and change. They view
project maturity as a term that might be used as an indication of or a measurement
of the organization’s ability to use projects for different purposes.
Webster (1988) defines ‘‘mature’’ as being ripe or having reached the state of full
natural or maximum development. Anderson & Jessen (2003) defines Maturity as the
quality or state of being mature. According to Anderson & Jessen (2003) if the
concept of maturity is applied to an organization it might refer to a state where the
organization is in a perfect condition to achieve its objectives. In this case, project
maturity would then mean that the organization is perfectly conditioned to deal with
its projects. But in the real world though, we will not find the fully matured
organization; no one has reached the stage of maximum development and no one
2 4 | P a g e
will. Therefore it makes sense to talk about a certain degree of maturity and make an
effort to measure or characterise the maturity of the organization. Anderson &
Jessen (2003) have adopted a broad definition of maturity, including both behaviour
and competence. Their view is that maturity within the business community is best
explained as the sum of action (ability to act and decide), attitude (willingness to be
involved), and knowledge (an understanding of the impact of willingness and action).
Anderson & Jessen (2003) further elaborate on their view that, transformed to testing
project maturity, the idea is to ask questions about project management knowledge,
project management attitude, and actual project practice. The purpose of the
questions is to investigate whether there are differences among central project
stakeholders on the willingness, the knowledge, and the actual use of projects at
their level in the organization. In this way a more complete picture of the way project
management is adopted in organizations could come forth.
The researcher view Anderson & Jessen’s (2003) definition of project maturity as a
more broad and inclusive definition in that it looks to investigate an organization’s
project management knowledge, attitude, and project practice. It is this definition that
informs this current research project.
According to Cooke-Davies & Arzymanow (2003) through the widely adopted
‘‘Capability Maturity Model’’ for software organizations, developed by the Software
Engineering Institute of Carnegie-Mellon University between 1986 and 1993, this
concept of process maturity migrated to a measure of ‘‘organizational’’ process
maturity. Integral to the model is the concept that organizations advance through a
series of five stages to maturity: initial level, repeatable level, defined level, managed
level and optimising level. They further argue that:
‘‘These five maturity levels define an ordinal scale for measuring the maturity
of an organization’s software process and for evaluating its software process
capability. The levels also help an organization prioritize its improvement
efforts.’’
2 5 | P a g e
Paulk, Curtis, Chrissis & Weber (1993) emphasize that the ‘‘prize’’ for advancing
through these stages is an increasing ‘‘software process capability’’, which results in
improved software productivity.
According to Anderson & Jessen (2003) the ladder of maturity consists of three
steps. The basic ‘‘layer’’, or level, is Project Management, or the management of
individual projects. At this level project managers can concentrate on individual team
efforts in order to achieve predefined project goals with predetermined constraints to
time and resources. The next level is Program Management, which is defined by
Association of Project Managers (APM) (2000) as a collection of projects related to
some extent to a common objective. According to APM (2000) a program could be a
new product development, an organizational restructuring of the company or the
implementation of an advanced software package in different departments of the
company. Program management is the effective management of all the projects
under the umbrella of the program. Anderson & Jessen (2003) further defines at the
third level, Portfolio Management, as the management of a number of projects and
programs that do not necessarily share a common objective. Buttrick (2000) further
emphasize that the issue is to undertake these simultaneously. Only by relating the
total effort to an overall strategy can this level be mastered professionally. At this
level the managerial approach must be wider, and include a balanced view on how
to distribute scarce resources between competing desires (Anderson & Jessen
2003).
Anderson & Jessen (2003) further states that the ladder proposition does not mean
that all companies have a distinct opinion about step differences. They argue that in
most companies projects may be used for operational, tactical and strategic
purposes at the same time. This does not prevent a ladder concept in the sense that
some companies may be more developed (action-, knowledge-and attitude-wise)
than other companies on advanced use of projects.
However, not all authors agree with the ladder theory. Gareis & Hueman (2000)
reject the notion of a ladder: the argument being that a ladder model might be too
rigid. Instead they go for a spider web presentation to allow for more differentiation in
2 6 | P a g e
describing the needed competencies in handling the specific processes of the
project-oriented organization.
The PMI (2003) holds that based on the findings of the maturity assessment, a set of
recommended solutions to issues identified in the assessment report should be
proposed. These recommendations typically are implemented by a series of specific
projects. A proposal needs to be prepared for each possible project. They further
argue that this proposal should include a description of the current situation, a
description and motivation of the proposed change, expected benefits,
responsibilities of the people who will perform the project responsibilities; and
estimated costs, resources and duration of the project. The proposal also should
identify possible implementation methods such as using a pilot project or developing
a prototype. All projects cannot be implemented at once.
Morris (2000) highlights that since software is developed through projects, it is
natural that the concept of organizational maturity would migrate from software
development processes to project management, and this has been reflected in an
interest in applying the concept of ‘‘maturity’’ to software project management.
Cooke-Davies & Arzymanow (2003) further emphasize that possibly as a result of
this a number of project management maturity models appeared during the mid-
1990s that were more heavily influenced by the thinking of the project management
profession.
The number of Maturity models for organizations are increasing both directly and
indirectly in order to assess how mature an organization is (Cooke-Davies 2004).
Therefore, it should be possible to assess how mature a project-based organization
is by considering a combination of various aspects of project performance or project
management practices for measuring, and to find out what the results of these
measurements turn out to be (Cooke-Davies 2004).
In their Dissertation, Jugdev & Thomas (2002) mention that over the past decades,
maturity models appeared in the literature as real, tangible ways of assessing
aspects of project management maturity of a company. According to Thomas,
Connie, Judev & Buckle (2002) project management maturity models are important
2 7 | P a g e
assessment tools for the profession. Maturity models identify organizational
strengths and weakness in addition to providing benchmarking information (Jugdev
& Thomas 2002). In this regards, Supic (2005) indicate that project management
maturity models are a new concept and are a part of the project management
development process and they are used to assess and strategically plan the project
management development and required resources in an organization. He indicated
that other benefit of the maturity models is the ability to use them as a performance
benchmark among different organizations and industries.
It has been argued forcefully and cogently by Crawford (1998, 2001, & 2002), and
Morris (2001 & 2003) that the absence of global standards works to the detriment of
the practice of managing projects in multi-national or global organizations. Precisely
the same argument applies to maturity models -- the absence of a generally
accepted definition of what is involved inevitably inhibits the value of any maturity
model to the whole of an organization (Cooke-Davies 2004). A number of concerns
have been expressed about this proliferation of project management maturity
models, for example: “Unfortunately, there is no consensus as to the contents of an
organizational project management maturity model, or even the principles on which
such a standard is constructed” (Cooke-Davies 2001). Therefore, Identification of the
best maturity model among existing ones in terms of project management
components, skills and special characteristics of construction projects is important.
This not only will help organizations assess themselves by the same model but also
they can compare themselves with their competitors (Khoshgoftar & Osman 2009).
According to Khoshgoftar & Osman (2009) many maturity models exist in the world
and generally, companies utilize these models in terms of their goals and objectives.
They argue that these maturity models are different from each other in terms of their
specific characteristics, factors and ways that consider for reaching their purpose,
there is no standard related to the maturity models. Khoshgoftar & Osman (2009)
further points out the important issue; that organizations can assess their
organizational performance by a comprehensive and useful model. This can help
them compare their situation with other companies by using the same model.
Therefore, the next section will present and discuss a couple of maturity models and
2 8 | P a g e
compare some of these models with each other with the aim of finding a suitable
model amongst them.
2.3 Project Management Maturity Models
According to the Office of Government Commerce (OGC) (2006) as organizations
strive to identify competitive and performance advantages, and leverage them
through improved efficiency and delivery, management models designed to assess
performance and identify opportunities for improvement are increasingly important.
Their assessment is that maturity models in particular have become an essential tool
in assessing organizations’ current capabilities and helping them to implement
change and improvements in a structured way. These models consist of a
hierarchical collection of elements describing the characteristics of effective
processes, and their use can enable organizations to reap the benefits brought by
improved capability at all levels (OGC 2006).
According to OGC (2006) a maturity model provides a systematic framework for
carrying out benchmarking and performance improvement. It will include a series of
descriptions of business performance for discrete business elements. They further
emphasize that the descriptions are ordered into levels of capability from "not able to
do it" through to "continuously improving". The currently available models vary in the
numbers of maturity levels they describe and will have a variety of titles for each
level. For example some models developed by OGC have 5 levels:
Level 1 -getting started/awareness/initial
Level 2 -developing/focusing/repeatable/knowledge
Level 3 -complying/practising/competence/defined
Level 4 -sustaining/exploiting/managed/excellence
Level 5 -advocating/transforming/optimised
In some other cases there may also be a Level 0 - unawareness!
The optimum level of maturity is recognized as being the level that delivers the
organization’s strategic objectives most effectively and efficiently, which does not
necessarily mean Level 5 (OGC 2006).
2 9 | P a g e
According to Khoshgoftar & Osman (2009) maturity models have gained a lot of
attention in the project management community and almost every larger project
management organization has published some kind of a maturity model. They argue
that maturity models are formed based on different issues like the premise that
improving business processes and staff capability will improve an organizations’
productivity. According to the Jugdev & Thomas (2002) maturity models identify
project or organizational strengths and weaknesses and benchmarking information.
A maturity model is a structured collection of elements that describe the
characteristics of effective processes or products (PMI 2003).
According to Klimko (2001), and Weerdmeester, Pocaterra & Hefke (2003) in
general, maturity models have the following properties:
• The development of a single entity is simplified and described with a limited
number of maturity levels (usually four to six);
• Levels are characterized by certain requirements, which the entity has to
achieve on that level;
• Levels are ordered sequentially, from an initial level up to an ending level (the
latter is the level of perfection);
According to the PMI (2003) assessing an organization’s capability in project
management requires a logical framework that can be used to define the nature of
the organization’s project management processes, and an approach which is
objective and allows comparisons both within the organizational environment and
across industries is needed. They further argue that the Project Management
Maturity Matrix allows for the definition of the present state of the organization’s
project management processes.
Von Wangenheim, Da Silva, Buglione, Scheidt & Prikadnicki (2010) states that, in
striving to establish effective and efficient project management, ‘‘best practice”
models are being developed to assist organizations with an interest in improving
project management. This includes, software process capability/maturity models,
such as CMMI – Capability Maturity Model Integration, which guides the assessment
and improvement of organizational maturity and process capability for the
3 0 | P a g e
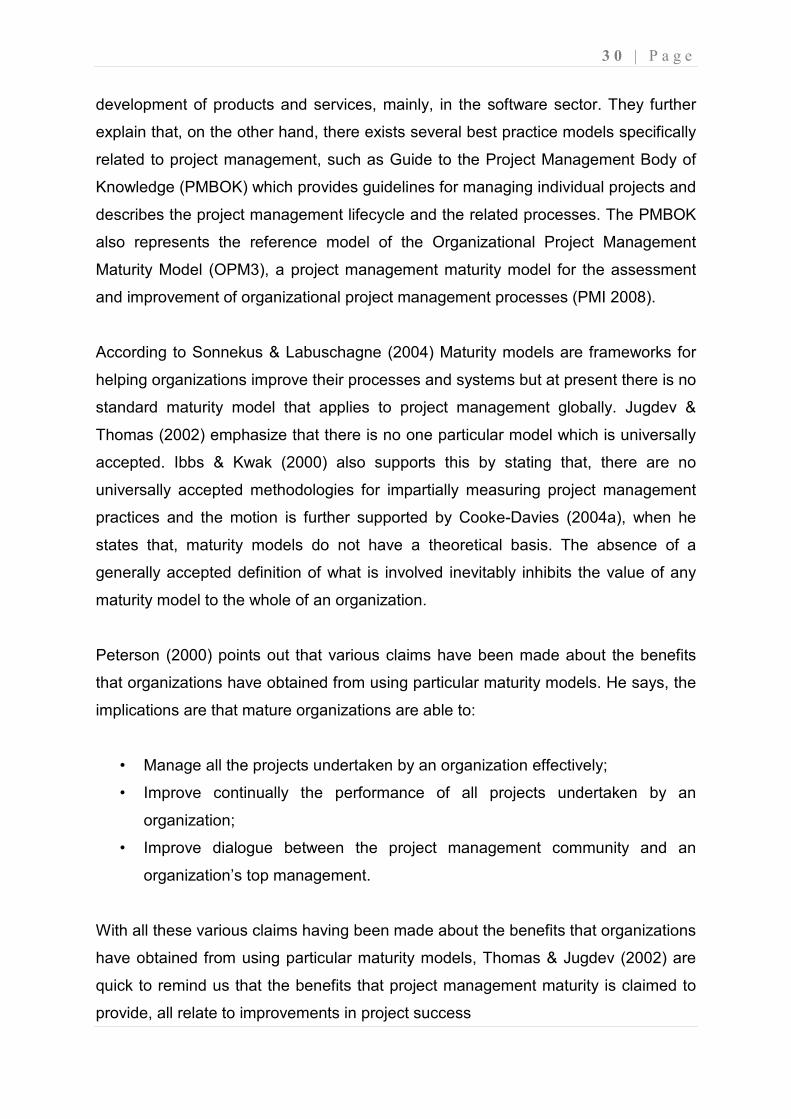
development of products and services, mainly, in the software sector. They further
explain that, on the other hand, there exists several best practice models specifically
related to project management, such as Guide to the Project Management Body of
Knowledge (PMBOK) which provides guidelines for managing individual projects and
describes the project management lifecycle and the related processes. The PMBOK
also represents the reference model of the Organizational Project Management
Maturity Model (OPM3), a project management maturity model for the assessment
and improvement of organizational project management processes (PMI 2008).
According to Sonnekus & Labuschagne (2004) Maturity models are frameworks for
helping organizations improve their processes and systems but at present there is no
standard maturity model that applies to project management globally. Jugdev &
Thomas (2002) emphasize that there is no one particular model which is universally
accepted. Ibbs & Kwak (2000) also supports this by stating that, there are no
universally accepted methodologies for impartially measuring project management
practices and the motion is further supported by Cooke-Davies (2004a), when he
states that, maturity models do not have a theoretical basis. The absence of a
generally accepted definition of what is involved inevitably inhibits the value of any
maturity model to the whole of an organization.
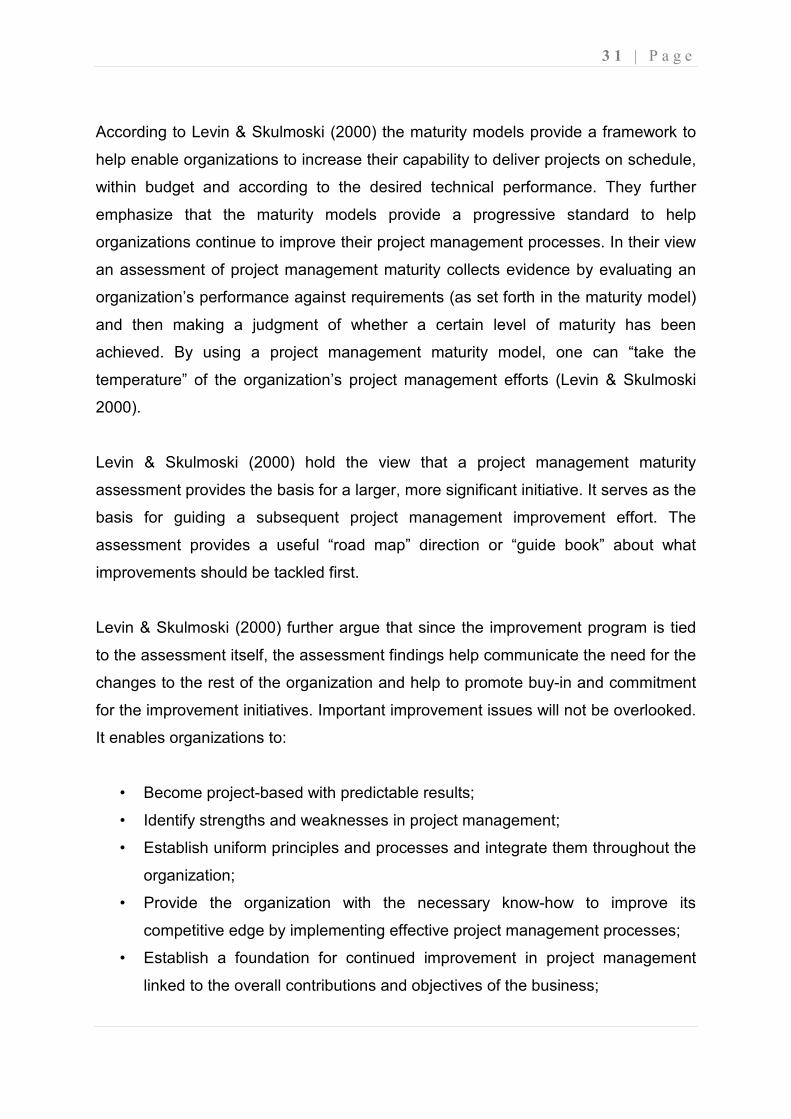
Peterson (2000) points out that various claims have been made about the benefits
that organizations have obtained from using particular maturity models. He says, the
implications are that mature organizations are able to:
• Manage all the projects undertaken by an organization effectively;
• Improve continually the performance of all projects undertaken by an
organization;
• Improve dialogue between the project management community and an
organization’s top management.
With all these various claims having been made about the benefits that organizations
have obtained from using particular maturity models, Thomas & Jugdev (2002) are
quick to remind us that the benefits that project management maturity is claimed to
provide, all relate to improvements in project success
3 1 | P a g e
According to Levin & Skulmoski (2000) the maturity models provide a framework to
help enable organizations to increase their capability to deliver projects on schedule,
within budget and according to the desired technical performance. They further
emphasize that the maturity models provide a progressive standard to help
organizations continue to improve their project management processes. In their view
an assessment of project management maturity collects evidence by evaluating an
organization’s performance against requirements (as set forth in the maturity model)
and then making a judgment of whether a certain level of maturity has been
achieved. By using a project management maturity model, one can “take the
temperature” of the organization’s project management efforts (Levin & Skulmoski
2000).
Levin & Skulmoski (2000) hold the view that a project management maturity
assessment provides the basis for a larger, more significant initiative. It serves as the
basis for guiding a subsequent project management improvement effort. The
assessment provides a useful “road map” direction or “guide book” about what
improvements should be tackled first.
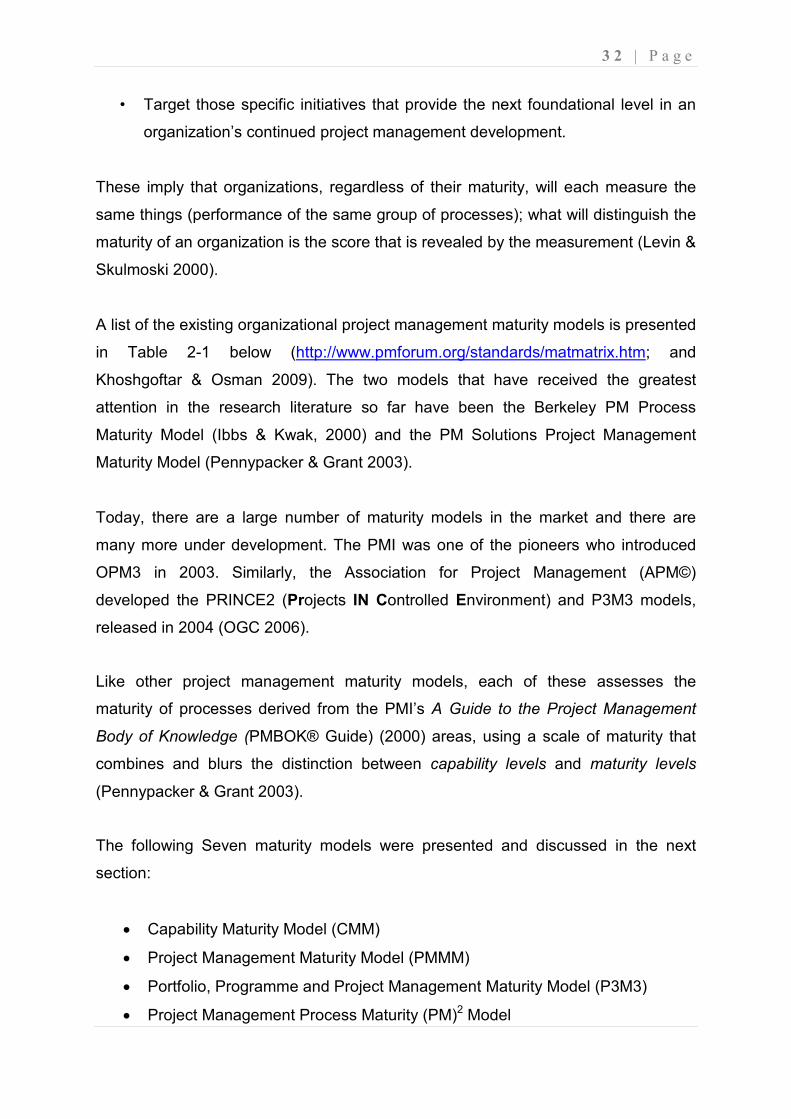
Levin & Skulmoski (2000) further argue that since the improvement program is tied
to the assessment itself, the assessment findings help communicate the need for the
changes to the rest of the organization and help to promote buy-in and commitment
for the improvement initiatives. Important improvement issues will not be overlooked.
It enables organizations to:
• Become project-based with predictable results;
• Identify strengths and weaknesses in project management;
• Establish uniform principles and processes and integrate them throughout the
organization;
• Provide the organization with the necessary know-how to improve its
competitive edge by implementing effective project management processes;
• Establish a foundation for continued improvement in project management
linked to the overall contributions and objectives of the business;
3 2 | P a g e
• Target those specific initiatives that provide the next foundational level in an
organization’s continued project management development.
These imply that organizations, regardless of their maturity, will each measure the
same things (performance of the same group of processes); what will distinguish the
maturity of an organization is the score that is revealed by the measurement (Levin &
Skulmoski 2000).
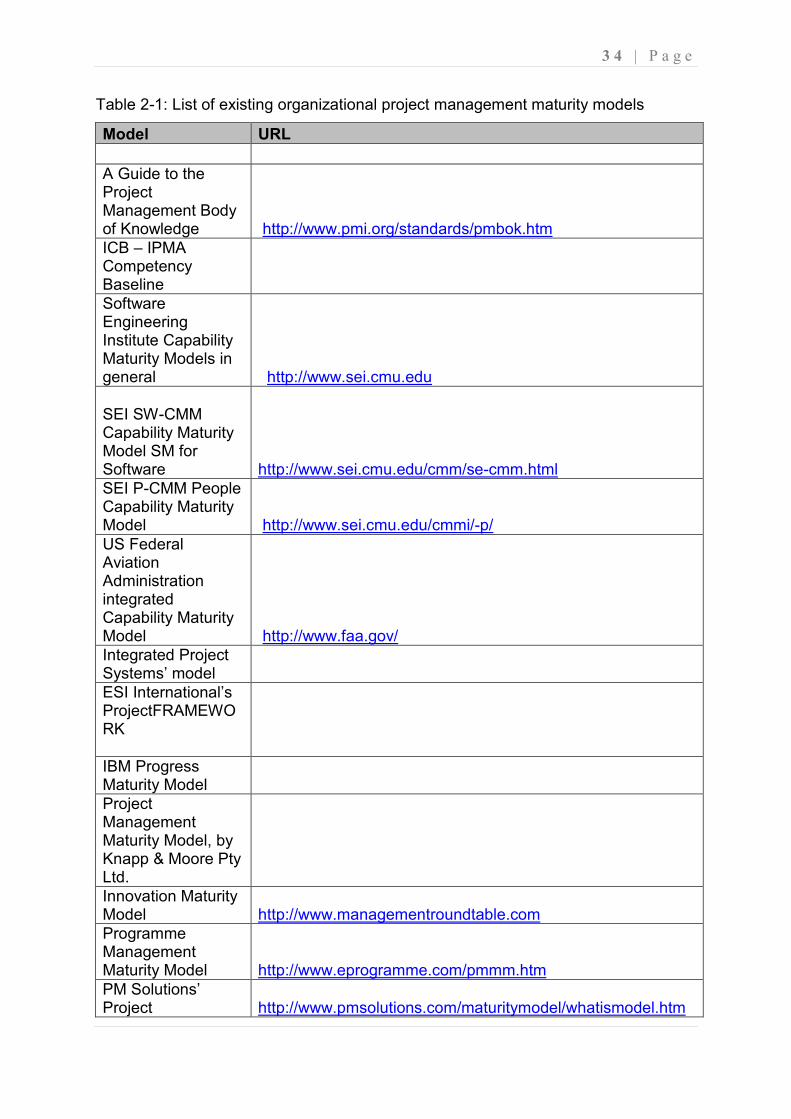
A list of the existing organizational project management maturity models is presented
in Table 2-1 below (http://www.pmforum.org/standards/matmatrix.htm; and
Khoshgoftar & Osman 2009). The two models that have received the greatest
attention in the research literature so far have been the Berkeley PM Process
Maturity Model (Ibbs & Kwak, 2000) and the PM Solutions Project Management
Maturity Model (Pennypacker & Grant 2003).
Today, there are a large number of maturity models in the market and there are
many more under development. The PMI was one of the pioneers who introduced
OPM3 in 2003. Similarly, the Association for Project Management (APM©)
developed the PRINCE2 (Projects IN Controlled Environment) and P3M3 models,
released in 2004 (OGC 2006).
Like other project management maturity models, each of these assesses the
maturity of processes derived from the PMI’s A Guide to the Project Management
Body of Knowledge (PMBOK® Guide) (2000) areas, using a scale of maturity that
combines and blurs the distinction between capability levels and maturity levels
(Pennypacker & Grant 2003).
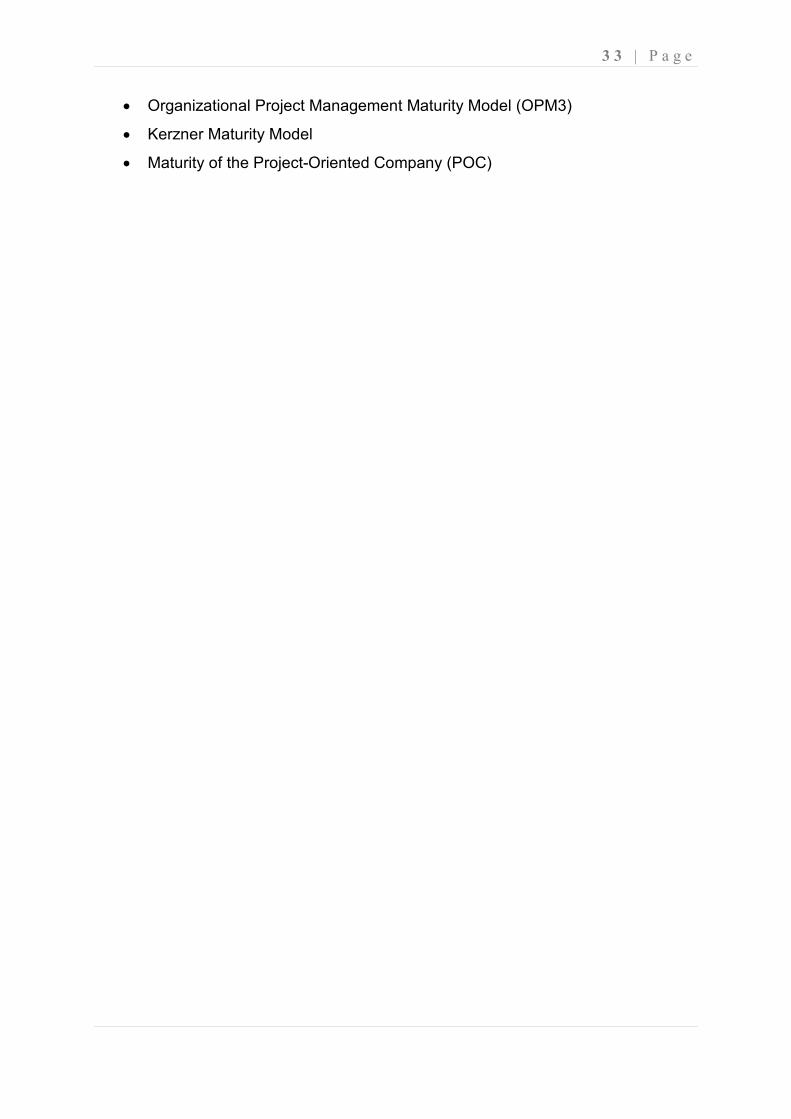
The following Seven maturity models were presented and discussed in the next
section:
• Capability Maturity Model (CMM)
• Project Management Maturity Model (PMMM)
• Portfolio, Programme and Project Management Maturity Model (P3M3)
• Project Management Process Maturity (PM)2 Model
3 3 | P a g e
• Organizational Project Management Maturity Model (OPM3)
• Kerzner Maturity Model
• Maturity of the Project-Oriented Company (POC)
3 4 | P a g e
Table 2-1: List of existing organizational project management maturity models
Model URL
A Guide to the Project Management Body of Knowledge http://www.pmi.org/standards/pmbok.htm
ICB – IPMA Competency Baseline
Software Engineering Institute Capability Maturity Models in general http://www.sei.cmu.edu
SEI SW-CMM Capability Maturity Model SM for Software http://www.sei.cmu.edu/cmm/se-cmm.html
SEI P-CMM People Capability Maturity Model http://www.sei.cmu.edu/cmmi/-p/
US Federal Aviation Administration integrated Capability Maturity Model http://www.faa.gov/
Integrated Project Systems’ model
ESI International’s ProjectFRAMEWORK
IBM Progress Maturity Model
Project Management Maturity Model, by Knapp & Moore Pty Ltd.
Innovation Maturity Model http://www.managementroundtable.com
Programme Management Maturity Model http://www.eprogramme.com/pmmm.htm
PM Solutions’ Project http://www.pmsolutions.com/maturitymodel/whatismodel.htm
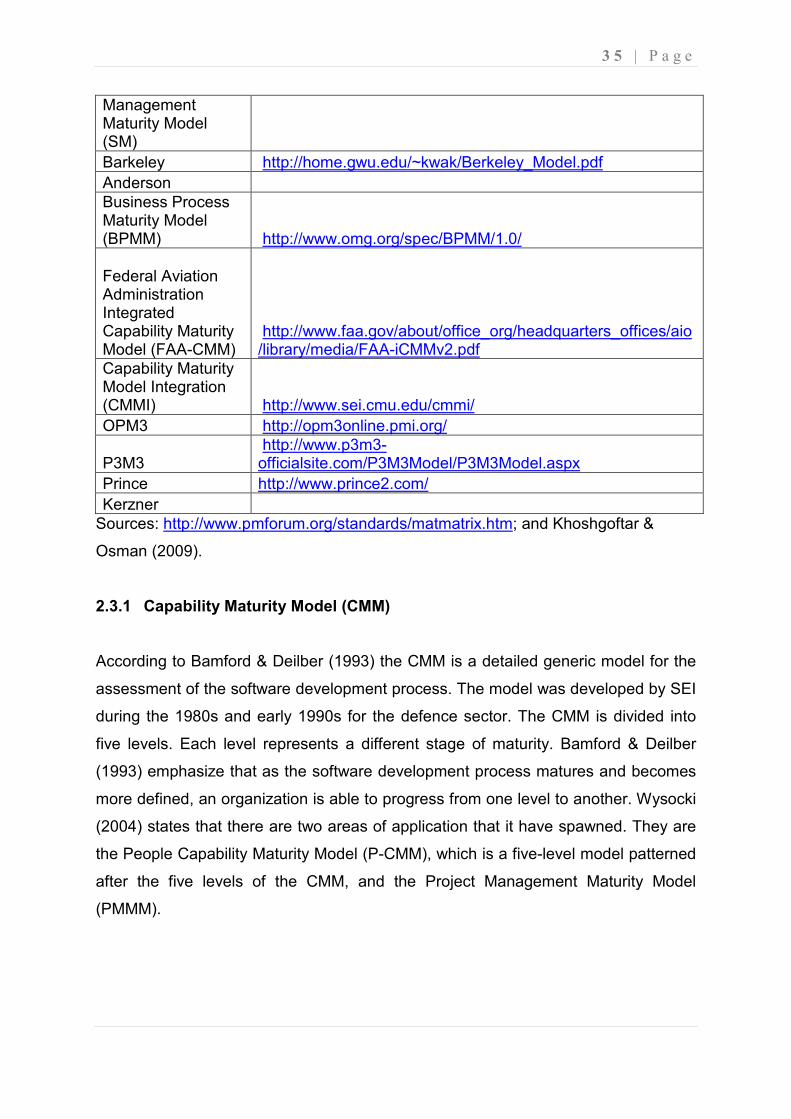
3 5 | P a g e
Management Maturity Model (SM)
Barkeley http://home.gwu.edu/~kwak/Berkeley_Model.pdf
Anderson
Business Process Maturity Model (BPMM) http://www.omg.org/spec/BPMM/1.0/
Federal Aviation Administration Integrated Capability Maturity Model (FAA-CMM)
http://www.faa.gov/about/office_org/headquarters_offices/aio/library/media/FAA-iCMMv2.pdf
Capability Maturity Model Integration (CMMI) http://www.sei.cmu.edu/cmmi/
OPM3 http://opm3online.pmi.org/
P3M3 http://www.p3m3-officialsite.com/P3M3Model/P3M3Model.aspx
Prince http://www.prince2.com/
Kerzner
Sources: http://www.pmforum.org/standards/matmatrix.htm; and Khoshgoftar &
Osman (2009).
2.3.1 Capability Maturity Model (CMM)
According to Bamford & Deilber (1993) the CMM is a detailed generic model for the
assessment of the software development process. The model was developed by SEI
during the 1980s and early 1990s for the defence sector. The CMM is divided into
five levels. Each level represents a different stage of maturity. Bamford & Deilber
(1993) emphasize that as the software development process matures and becomes
more defined, an organization is able to progress from one level to another. Wysocki
(2004) states that there are two areas of application that it have spawned. They are
the People Capability Maturity Model (P-CMM), which is a five-level model patterned
after the five levels of the CMM, and the Project Management Maturity Model
(PMMM).
3 6 | P a g e
CMM Overview
According to Paulk, Curtis, Chrissis, & Weber, (1993) the Capability Maturity Model
for Software provides software organizations with guidance on how to gain control of
their processes for developing and maintaining software and how to evolve toward a
culture of software engineering and management excellence. They describe the
CMM as a model that is designed to guide software organizations in selecting
process improvement strategies by determining current process maturity and
identifying the few issues most critical to software quality and process improvement.
By focusing on a limited set of activities and working aggressively to achieve them,
an organization can steadily improve its organization-wide software process to
enable continuous and lasting gains in software process capability (Paulk et al.
1993).
Paulk et al. (1993) defines a maturity level as a well-defined evolutionary plateau
toward achieving a mature software process. They further argue that:
“Each maturity level provides a layer in the foundation for continuous process
improvement. Each level comprises a set of process goals that, when
satisfied, stabilize an important component of the software process. Achieving
each level of the maturity framework establishes a different component in the
software process, resulting in an increase in the process capability of the
organization.”
According to Paulk et al. (1993) the CMM provides a framework for organizing these
evolutionary steps into five maturity levels that lay successive foundations for
continuous process improvement. These five maturity levels define an ordinal scale
for measuring the maturity of an organization's software process and for evaluating
its software process capability. The levels also help an organization prioritize its
improvement efforts.
Organizing the CMM into the five levels shown in Fig. 2-1 prioritizes improvement
actions for increasing software process maturity. The labelled arrows in Fig. 2-1
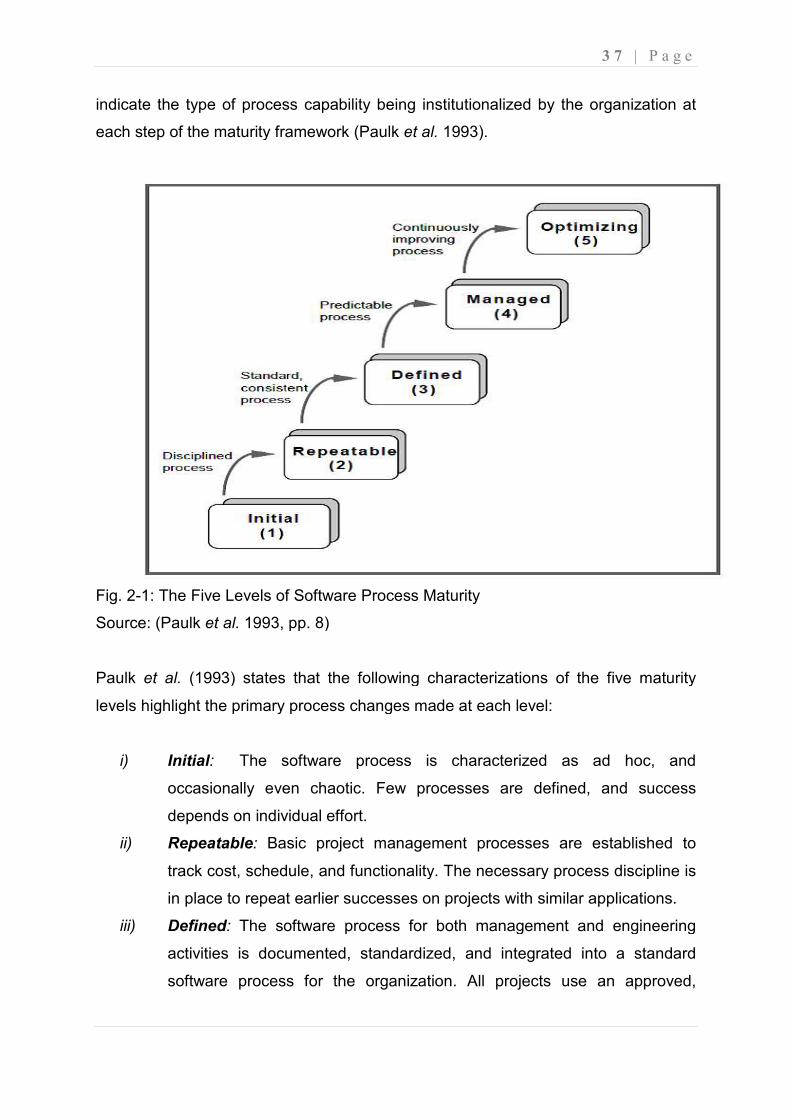
indicate the type of process capability being institutionalized by th
each step of the maturity framework (Paulk
Fig. 2-1: The Five Levels of Software Process Maturity
Source: (Paulk et al. 1993, pp. 8)
Paulk et al. (1993) states that the
levels highlight the primary process changes made at each level:
i) Initial: The software process is characterized as ad hoc, and
occasionally even chaotic. Few processes are defined, and success
depends on individual effort.
ii) Repeatable: Basic project management processes are established to
track cost, schedule, and functionality. The necessary process discipline is
in place to repeat earlier successes on projects with similar applications.
iii) Defined: The softw
activities is documented, standardized, and integrated into a standard
software process for the organization. All projects use an approved,
indicate the type of process capability being institutionalized by th
each step of the maturity framework (Paulk et al. 1993).
The Five Levels of Software Process Maturity
1993, pp. 8)
(1993) states that the following characterizations of the five maturity
levels highlight the primary process changes made at each level:
The software process is characterized as ad hoc, and
occasionally even chaotic. Few processes are defined, and success
individual effort.
Basic project management processes are established to
track cost, schedule, and functionality. The necessary process discipline is
in place to repeat earlier successes on projects with similar applications.
The software process for both management and engineering
activities is documented, standardized, and integrated into a standard
software process for the organization. All projects use an approved,
3 7 | P a g e
indicate the type of process capability being institutionalized by the organization at
following characterizations of the five maturity
The software process is characterized as ad hoc, and
occasionally even chaotic. Few processes are defined, and success
Basic project management processes are established to
track cost, schedule, and functionality. The necessary process discipline is
in place to repeat earlier successes on projects with similar applications.
are process for both management and engineering
activities is documented, standardized, and integrated into a standard
software process for the organization. All projects use an approved,
3 8 | P a g e
tailored version of the organization's standard software process for
developing and maintaining software.
iv) Managed: Detailed measures of the software process and product quality
are collected. Both the software process and products are quantitatively
understood and controlled.
v) Optimizing: Continuous process improvement is enabled by quantitative
feedback from the process and from piloting innovative ideas and
technologies.
Maturity Levels 2 through 5 can be characterized through the activities performed by
the organization to establish or improve the software process, by activities performed
on each project, and by the resulting process capability across projects, and a
behavioural characterization of Level 1 is included to establish a base of comparison
for process improvements at higher maturity levels (Paulk et al. 1993).
According to Hathera, Burd & Boldyref (1996) the CMM provides a detailed method
for assessing the maturity of the development software process. It defines a number
of process areas, their goals, the necessary commitment required, the ability to
perform, the activities to be performed, monitoring of the implementation and
verification that need to be achieved. They state that if an organization is able to fully
satisfy all these criteria, then it can be seen to be at a given maturity level.
2.3.2 Project Management Maturity Model (PMMM)
According to OGC (2006) PMMM helps organizations address fundamental aspects
of managing projects, improve the likelihood of a quality result and successful
outcome and reduce the likelihood of risks impacting projects adversely. They state
that reaching an excellence in project management can be achieved by PMMM
which is comprised of five levels, as shown in Fig. 2-2.
Demir & Kocabas (2010) argue that PMMM is getting popular because of its
versatility and its ability to control time and cost most efficiently. They further state
that more and more organizations have embraced Project management as a key
strategy for remaining competitive in today’s highly competitive business
3 9 | P a g e
environment. The PMMM allows the organization to identify what steps must be
taken, what deeds must be accomplished and in what sequence to realize
meaningful and measurable results (Demir & Kocabas 2010).
PMMM Overview
Each of the five levels of PMMM, as presented by Demir & Kocabas (2010)
represents a different degree of maturity in project management. The levels are:
i) Level 1: Common Language (Initial Process): In this level, the
organization recognizes the importance of project management and the need
for a good understanding of the basic knowledge on project management and
the accompanying language or terminology. In the first level, project definition
and awareness are important.
ii) Level 2: Common Processes (Repeatable Process): In this level, the
organization recognizes that common processes need to be defined and
developed such that successes on the project can be repeated on other
projects. Also the recognition of the application and support of the project
management principles to other methodologies employed by the company is
included. In this level, the key process areas are business case development,
project establishment, project planning, monitoring and control, stakeholder
management and communications, requirements management, risk
management, configuration management, management of suppliers and
external parties.
iii) Level 3: Singular Methodology (Defined Process): In this level, the
organization recognizes the synergistic effect of combining all corporate
methodologies into a singular methodology, the centre of which is project
management. The synergistic effects also make process control easier with a
single methodology than with multiple methodologies. This level provides
these key areas; benefits management, transition, information management,
organizational focus, process definition, training, skills and competency
development, integrated management and reporting, lifecycle control, inter-
group co-ordination and networking, quality assurance, Centre of Excellence
(COE) role deployment.
4 0 | P a g e
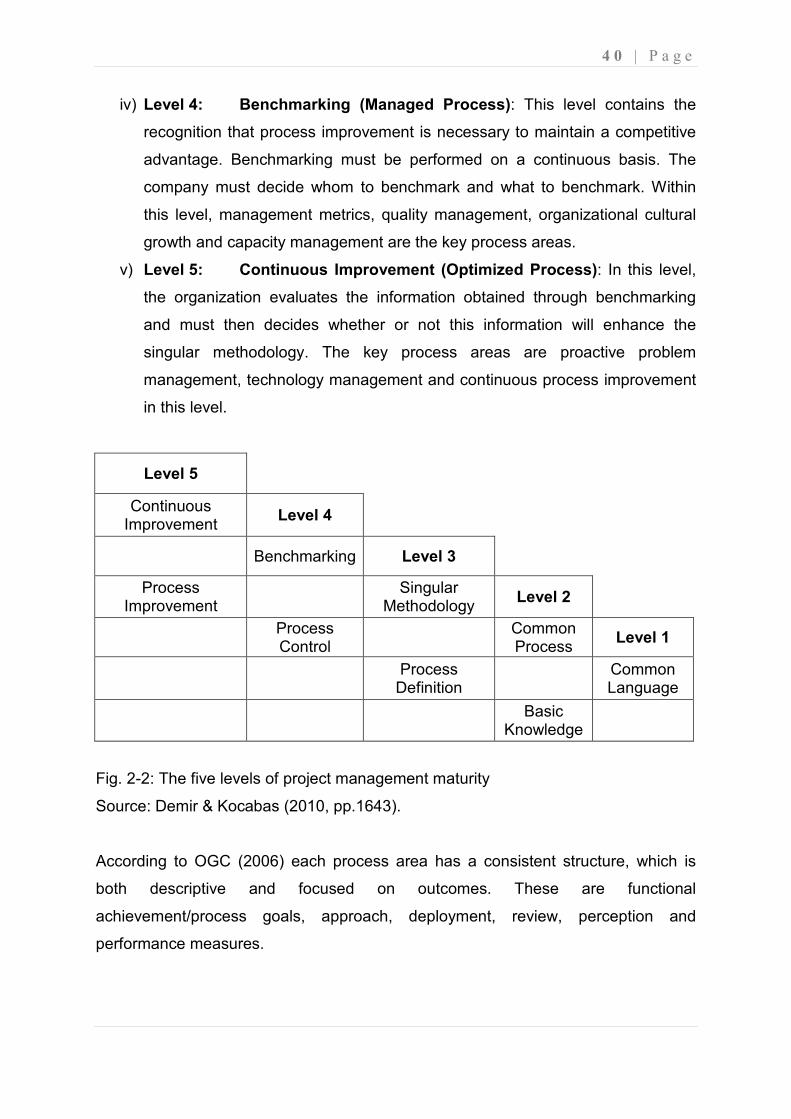
iv) Level 4: Benchmarking (Managed Process): This level contains the
recognition that process improvement is necessary to maintain a competitive
advantage. Benchmarking must be performed on a continuous basis. The
company must decide whom to benchmark and what to benchmark. Within
this level, management metrics, quality management, organizational cultural
growth and capacity management are the key process areas.
v) Level 5: Continuous Improvement (Optimized Process): In this level,
the organization evaluates the information obtained through benchmarking
and must then decides whether or not this information will enhance the
singular methodology. The key process areas are proactive problem
management, technology management and continuous process improvement
in this level.
Level 5
Continuous Improvement
Level 4
Benchmarking Level 3
Process Improvement
Singular
Methodology Level 2
Process Control
Common Process
Level 1
Process Definition
Common Language
Basic
Knowledge
Fig. 2-2: The five levels of project management maturity
Source: Demir & Kocabas (2010, pp.1643).
According to OGC (2006) each process area has a consistent structure, which is
both descriptive and focused on outcomes. These are functional
achievement/process goals, approach, deployment, review, perception and
performance measures.
4 1 | P a g e
According to Demir & Kocabas (2010) as organizations continue to grow and
develop, and as the body of knowledge of Programme and Project Management
continues to develop further, more and more organizations are going to want to know
where they are on their own learning curve and what it would take to improve their
performance on projects. They argue that it is the project management maturity
model that will assist the organizations to assess their probability of successfully
executing their projects. This model provides best practices to ensure management
organizations’ effectiveness at performing project management tasks (Demir &
Kocabas 2010).
2.3.3 Portfolio, Programme and Project Management Maturity Model (P3M3)
According to the OGC (2006) the P3M3, described in this document, is an enhanced
version of the Project Management Maturity Model developed by Office of
Government Commerce. They further highlight that the enhanced version of the
Project Management Maturity Model is based on the process maturity framework
that evolved into the Software Engineering Institute’s (SEI) Capability Maturity Model
(CMM). However, since P3M3 was designed by SEI it has overhauled radically their
set of Maturity Models to create CMMI.
The P3M3 has become a key standard amongst maturity models, providing a
framework with which organizations can assess their current performance and put in
place improvement plans with measurable outcomes based on industry best practice
(OGC 2006).
P3M3 is an overarching model (Fig. 2-3) containing three individual models:
• Portfolio Management Maturity Model (PfM3)
• Programme Management Maturity Model (PgM3)
• Project Management Maturity Model (PjM3)
Although connected, there are no interdependencies between these models, which
allows for independent assessment in any of the specific disciplines. For example,
an organization’s programme management capabilities may be more evolved than
its project management capabilities,
as a stand-alone tool when
Fig. 2-3: P3M3 Structure
Source: OGC (2006, pp. 7)
P3M3 Overview
P3M3 uses a five-level maturity framework and the
• Level 1 – awareness of process
• Level 2 – repeatable process
• Level 3 – defined process
• Level 4 – managed process
• Level 5 – optimized process
These levels comprise the structural components
shown in the Table 2-2. They
predecessor, the Project Management Maturity Model (OGC 2006).
management capabilities, so the project management model can be used
alone tool when looking to improve that area (OGC 2006).
Source: OGC (2006, pp. 7)
level maturity framework and the five Maturity Levels are
awareness of process
repeatable process
defined process
managed process
optimized process
These levels comprise the structural components of P3M3 and are characterized as
. They are consistent with the original P3M3 model and its
predecessor, the Project Management Maturity Model (OGC 2006).
4 2 | P a g e
model can be used
2006).
five Maturity Levels are:
of P3M3 and are characterized as
are consistent with the original P3M3 model and its
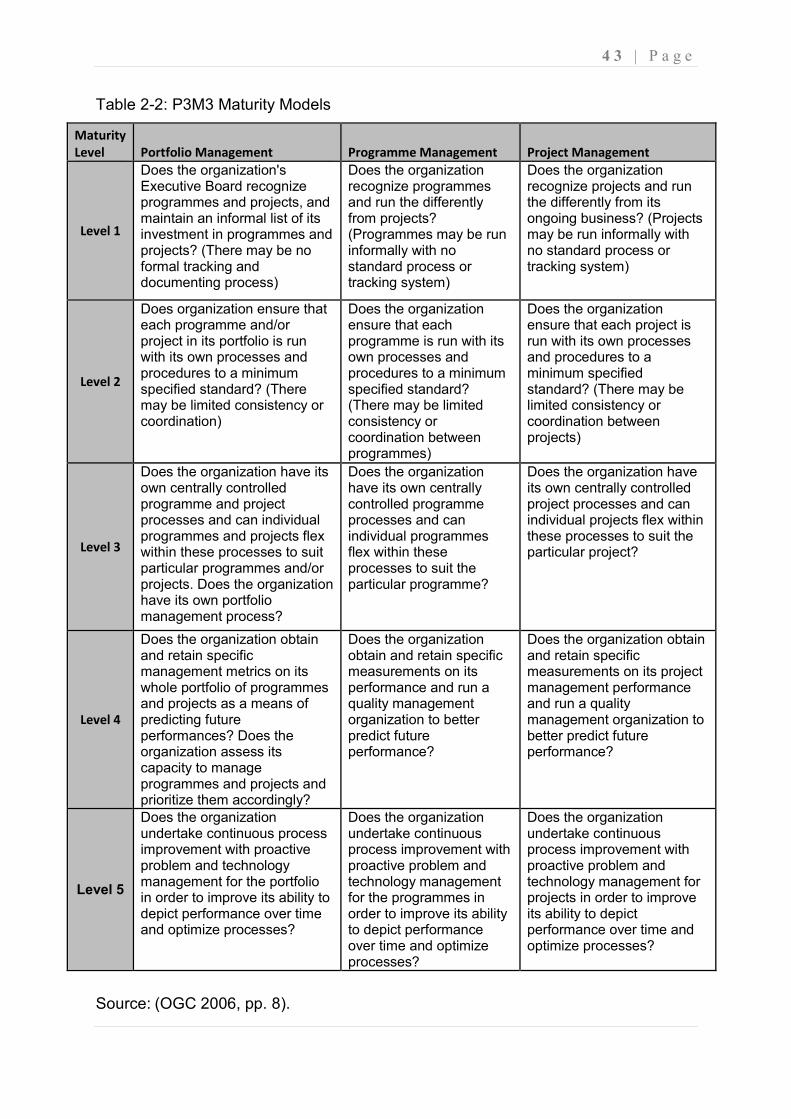
4 3 | P a g e
Table 2-2: P3M3 Maturity Models
Maturity
Level Portfolio Management Programme Management Project Management
Level 1
Does the organization's Executive Board recognize programmes and projects, and maintain an informal list of its investment in programmes and projects? (There may be no formal tracking and documenting process)
Does the organization recognize programmes and run the differently from projects? (Programmes may be run informally with no standard process or tracking system)
Does the organization recognize projects and run the differently from its ongoing business? (Projects may be run informally with no standard process or tracking system)
Level 2
Does organization ensure that each programme and/or project in its portfolio is run with its own processes and procedures to a minimum specified standard? (There may be limited consistency or coordination)
Does the organization ensure that each programme is run with its own processes and procedures to a minimum specified standard? (There may be limited consistency or coordination between programmes)
Does the organization ensure that each project is run with its own processes and procedures to a minimum specified standard? (There may be limited consistency or coordination between projects)
Level 3
Does the organization have its own centrally controlled programme and project processes and can individual programmes and projects flex within these processes to suit particular programmes and/or projects. Does the organization have its own portfolio management process?
Does the organization have its own centrally controlled programme processes and can individual programmes flex within these processes to suit the particular programme?
Does the organization have its own centrally controlled project processes and can individual projects flex within these processes to suit the particular project?
Level 4
Does the organization obtain and retain specific management metrics on its whole portfolio of programmes and projects as a means of predicting future performances? Does the organization assess its capacity to manage programmes and projects and prioritize them accordingly?
Does the organization obtain and retain specific measurements on its performance and run a quality management organization to better predict future performance?
Does the organization obtain and retain specific measurements on its project management performance and run a quality management organization to better predict future performance?
Level 5
Does the organization undertake continuous process improvement with proactive problem and technology management for the portfolio in order to improve its ability to depict performance over time and optimize processes?
Does the organization undertake continuous process improvement with proactive problem and technology management for the programmes in order to improve its ability to depict performance over time and optimize processes?
Does the organization undertake continuous process improvement with proactive problem and technology management for projects in order to improve its ability to depict performance over time and optimize processes?
Source: (OGC 2006, pp. 8).
4 4 | P a g e
According to OGC (2006) P3M3 focuses on the following seven Process
Perspectives, which exist in all three models and can be assessed at all five Maturity
Levels.
• Management Control
• Benefits Management
• Financial Management
• Stakeholder Engagement
• Risk Management
• Organizational Governance
• Resource Management
The flexibility of P3M3 allows organizations to review all seven Process Perspectives
across all three models – portfolio, programme and project management – but they
can also review just one (or several) of the Process Perspectives, whether across all
three models or across only one or two of them. This can be useful to gain a better
understanding of an organization’s overall effectiveness in, for example, risk
management or resource management (OGC 2006).
P3M3 can be used in many ways, for example:
• to understand the key practices in effective portfolio, programme and project
management processes;
• to identify the key practices that need to be embedded within an organization
for it to achieve the next Maturity Level;
• to understand and improve an organization’s capability to manage its portfolio,
programmes and projects more effectively;
• by client organizations, to assess the risks that might arise from process
capability issues within service providers managing their programmes and
projects;
• by OGC, user groups and the APM Group’s Accredited Consultancy
Organizations as the basis for developing maturity questionnaires.
4 5 | P a g e
P3M3 also has the flexibility to be refined and expanded as best practice evolves
within portfolio, programme and project management, and this can be
accommodated by new or amended key process areas at specific levels within the
model (OGC 2006).
2.3.4 Project Management Process Maturity (PM)2 Model
According to Kwak & Ibbs (2002) the (PM)2 model follows a systematic and
incremental approach that progress from an unsophisticated level to a sophisticated
PM maturity level. Each maturity level consists of major PM characteristics, factors,
and processes. The model demonstrates sequential steps that outline an
organization’s improvement of its PM processes.
Kwak & Ibbs (2002) argue that the (PM)2 model aims to integrate previous PM
practices, processes, and maturity models to improve PM effectiveness in the
organization. They further highlight that literature reviews and discussions with other
PM professionals were conducted to capture the different aspects of maturity
concept, and also the fact that quality management theories and practices influenced
the fundamental idea of the (PM)2 model (Kwak & Ibbs 2002).
(PM)2 Model Overview
According to Kwak & Ibbs (2002) the (PM)2 model is developed by integrating
previous maturity models that measure the PM levels of different companies and
industries. This model becomes the basis to evaluate and position an organization’s
current PM maturity level. Kwak & Ibbs (2002) states that (PM)2 illustrates a series
of steps to help an organization incrementally improve its overall PM effectiveness.
According to Kwak & Ibbs (2002) the (PM)2 model breaks PM processes and
practices into nine PM knowledge areas and five PM processes by adopting PMI’s
PMBOK (PMI 2000) (Fig. 2-4). This allows an organization to determine the
strengths and weaknesses of current PM practices and focus on the weak PM
practices to achieve higher PM maturity.
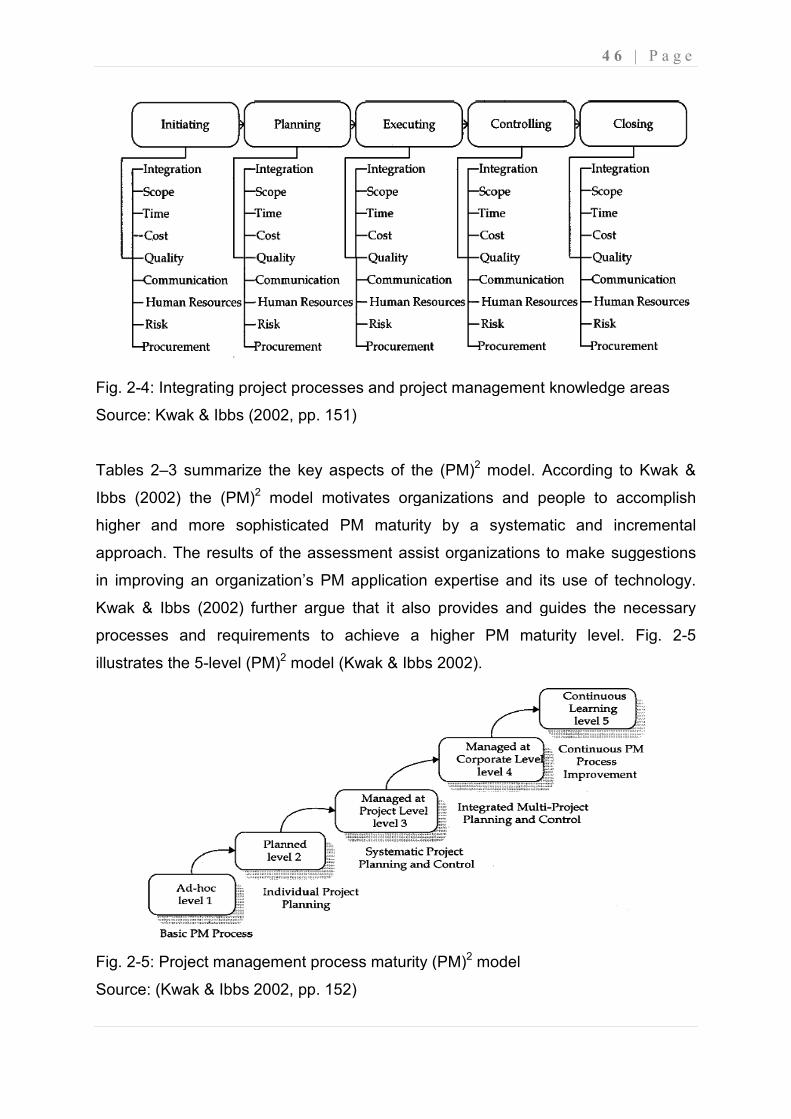
Fig. 2-4: Integrating project processes and project management knowledge areas
Source: Kwak & Ibbs (2002
Tables 2–3 summarize the key aspects of the (PM)
Ibbs (2002) the (PM)2 model motivates organizations and people to accomplish
higher and more sophisticated PM maturity by a systematic
approach. The results of the assessment
in improving an organization’s
Kwak & Ibbs (2002) further argue that i
processes and requirements to
illustrates the 5-level (PM)2
Fig. 2-5: Project management process maturity (PM)
Source: (Kwak & Ibbs 2002, pp
Integrating project processes and project management knowledge areas
Kwak & Ibbs (2002, pp. 151)
summarize the key aspects of the (PM)2 model. According to
model motivates organizations and people to accomplish
higher and more sophisticated PM maturity by a systematic
The results of the assessment assist organizations to make suggestions
in improving an organization’s PM application expertise and its use of technology.
further argue that it also provides and guides the necessary
processes and requirements to achieve a higher PM maturity level.
model (Kwak & Ibbs 2002).
: Project management process maturity (PM)2 model
Source: (Kwak & Ibbs 2002, pp. 152)
4 6 | P a g e
Integrating project processes and project management knowledge areas
According to Kwak &
model motivates organizations and people to accomplish
and incremental
assist organizations to make suggestions
expertise and its use of technology.
t also provides and guides the necessary
achieve a higher PM maturity level. Fig. 2-5
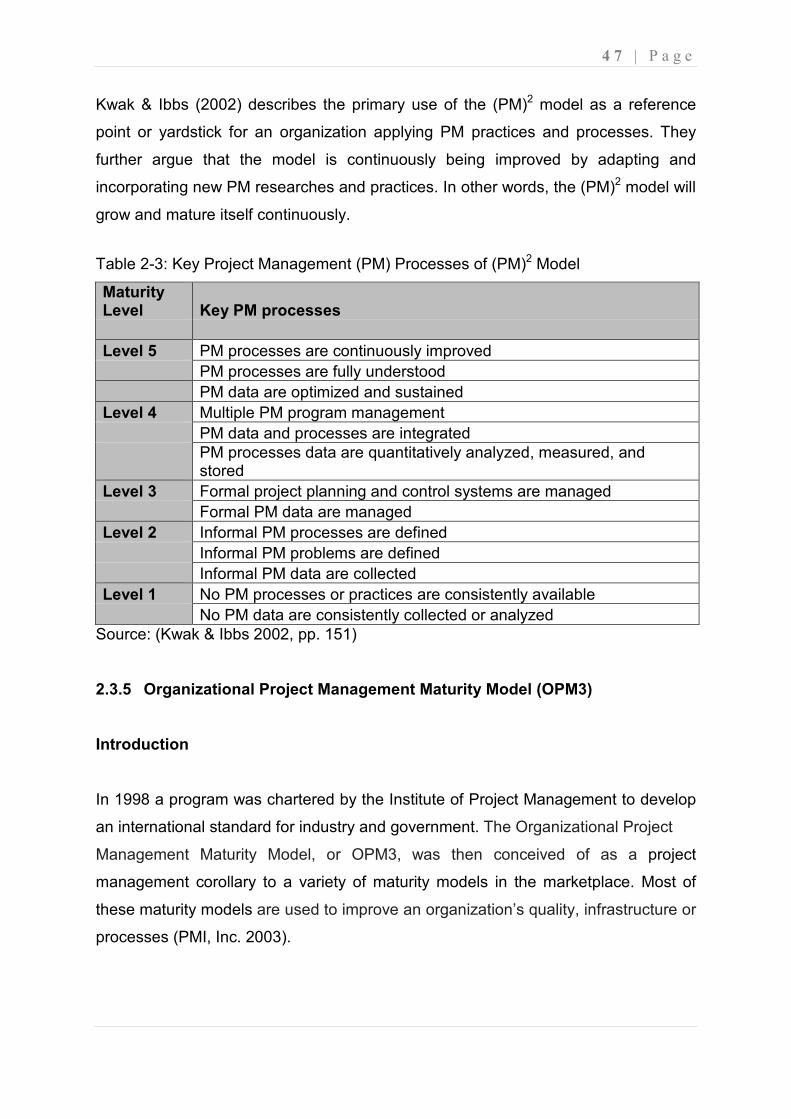
4 7 | P a g e
Kwak & Ibbs (2002) describes the primary use of the (PM)2 model as a reference
point or yardstick for an organization applying PM practices and processes. They
further argue that the model is continuously being improved by adapting and
incorporating new PM researches and practices. In other words, the (PM)2 model will
grow and mature itself continuously.
Table 2-3: Key Project Management (PM) Processes of (PM)2 Model
Maturity Level Key PM processes
Level 5 PM processes are continuously improved
PM processes are fully understood
PM data are optimized and sustained
Level 4 Multiple PM program management
PM data and processes are integrated
PM processes data are quantitatively analyzed, measured, and stored
Level 3 Formal project planning and control systems are managed
Formal PM data are managed
Level 2 Informal PM processes are defined
Informal PM problems are defined
Informal PM data are collected
Level 1 No PM processes or practices are consistently available
No PM data are consistently collected or analyzed
Source: (Kwak & Ibbs 2002, pp. 151)
2.3.5 Organizational Project Management Maturity Model (OPM3)
Introduction
In 1998 a program was chartered by the Institute of Project Management to develop
an international standard for industry and government. The Organizational Project
Management Maturity Model, or OPM3, was then conceived of as a project
management corollary to a variety of maturity models in the marketplace. Most of
these maturity models are used to improve an organization’s quality, infrastructure or
processes (PMI, Inc. 2003).
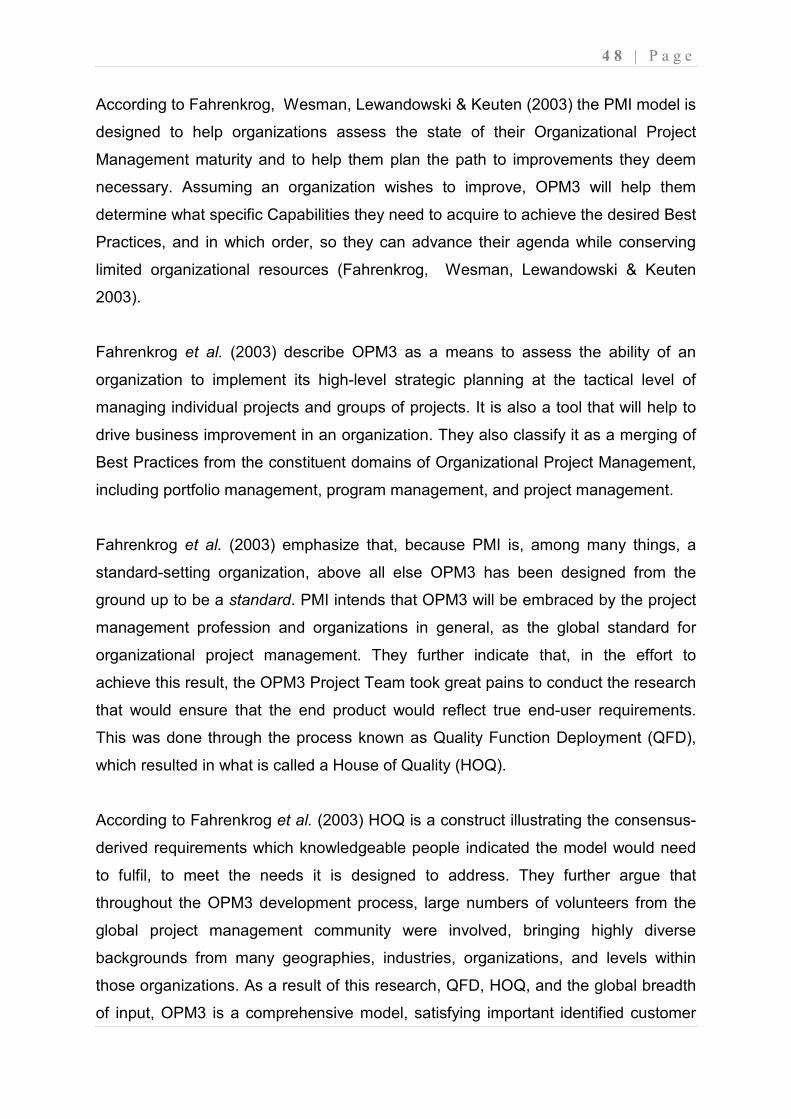
4 8 | P a g e
According to Fahrenkrog, Wesman, Lewandowski & Keuten (2003) the PMI model is
designed to help organizations assess the state of their Organizational Project
Management maturity and to help them plan the path to improvements they deem
necessary. Assuming an organization wishes to improve, OPM3 will help them
determine what specific Capabilities they need to acquire to achieve the desired Best
Practices, and in which order, so they can advance their agenda while conserving
limited organizational resources (Fahrenkrog, Wesman, Lewandowski & Keuten
2003).
Fahrenkrog et al. (2003) describe OPM3 as a means to assess the ability of an
organization to implement its high-level strategic planning at the tactical level of
managing individual projects and groups of projects. It is also a tool that will help to
drive business improvement in an organization. They also classify it as a merging of
Best Practices from the constituent domains of Organizational Project Management,
including portfolio management, program management, and project management.
Fahrenkrog et al. (2003) emphasize that, because PMI is, among many things, a
standard-setting organization, above all else OPM3 has been designed from the
ground up to be a standard. PMI intends that OPM3 will be embraced by the project
management profession and organizations in general, as the global standard for
organizational project management. They further indicate that, in the effort to
achieve this result, the OPM3 Project Team took great pains to conduct the research
that would ensure that the end product would reflect true end-user requirements.
This was done through the process known as Quality Function Deployment (QFD),
which resulted in what is called a House of Quality (HOQ).
According to Fahrenkrog et al. (2003) HOQ is a construct illustrating the consensus-
derived requirements which knowledgeable people indicated the model would need
to fulfil, to meet the needs it is designed to address. They further argue that
throughout the OPM3 development process, large numbers of volunteers from the
global project management community were involved, bringing highly diverse
backgrounds from many geographies, industries, organizations, and levels within
those organizations. As a result of this research, QFD, HOQ, and the global breadth
of input, OPM3 is a comprehensive model, satisfying important identified customer
4 9 | P a g e
requirements, such as practicality, scalability, and flexibility, as well as design
requirements, such as the use of specific Capabilities, Outcomes, and Key
Performance Indicators. They also view OPM3 as the incorporation of all three
project management domains and a process improvement model.
According to the Project Management Institute, Inc. (2003) the OPM3 model was
designed to achieve the following:
• to help organizations assess and improve their project management
capabilities as well as the capabilities necessary to achieve organizational
strategies through projects;
• to set the standard for excellence in project, program, and portfolio
management best practices; and
• to explain the capabilities necessary to achieve those best practices
Fahrenkrog et al. (2003) describes the basic components of the OPM3 model as:
• Best Practices in Organizational Project Management;
• The constituent Capabilities that lead to progressive maturity and indicate the
existence or attainment of Best Practices in the organization;
• The “navigation paths” needed to traverse these Capabilities on the way to
increased maturity in the targeted Best Practices;
• One or more observable Outcomes signifying the existence or attainment of
each Capability;
• One or more Key Performance Indicators, which are the means of measuring
each Outcome;
• Model context, including the Organizational Project Management Process and
the stages of process improvement.
OPM3 Overview
According to Fahrenkrog et al. (2003) an additional critical feature of the model is the
dependencies existing among Capabilities. They argue that the attainment of each
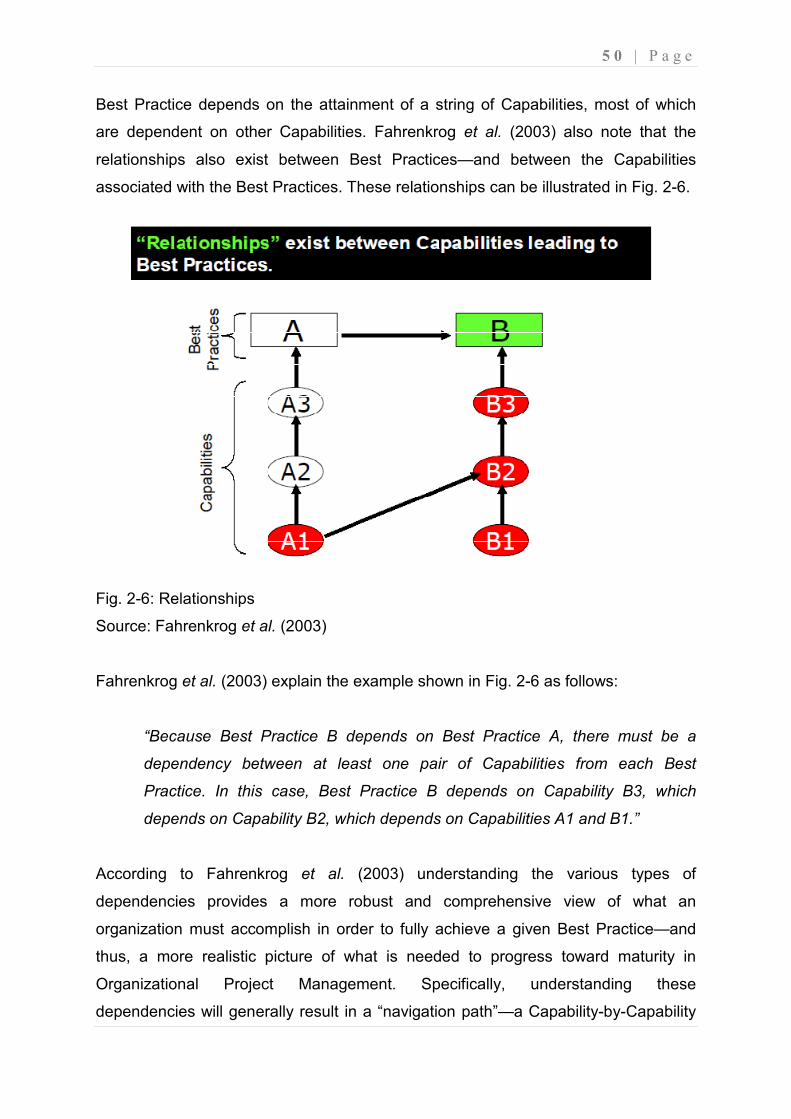
5 0 | P a g e
Best Practice depends on the attainment of a string of Capabilities, most of which
are dependent on other Capabilities. Fahrenkrog et al. (2003) also note that the
relationships also exist between Best Practices—and between the Capabilities
associated with the Best Practices. These relationships can be illustrated in Fig. 2-6.
Fig. 2-6: Relationships
Source: Fahrenkrog et al. (2003)
Fahrenkrog et al. (2003) explain the example shown in Fig. 2-6 as follows:
“Because Best Practice B depends on Best Practice A, there must be a
dependency between at least one pair of Capabilities from each Best
Practice. In this case, Best Practice B depends on Capability B3, which
depends on Capability B2, which depends on Capabilities A1 and B1.”
According to Fahrenkrog et al. (2003) understanding the various types of
dependencies provides a more robust and comprehensive view of what an
organization must accomplish in order to fully achieve a given Best Practice—and
thus, a more realistic picture of what is needed to progress toward maturity in
Organizational Project Management. Specifically, understanding these
dependencies will generally result in a “navigation path”—a Capability-by-Capability
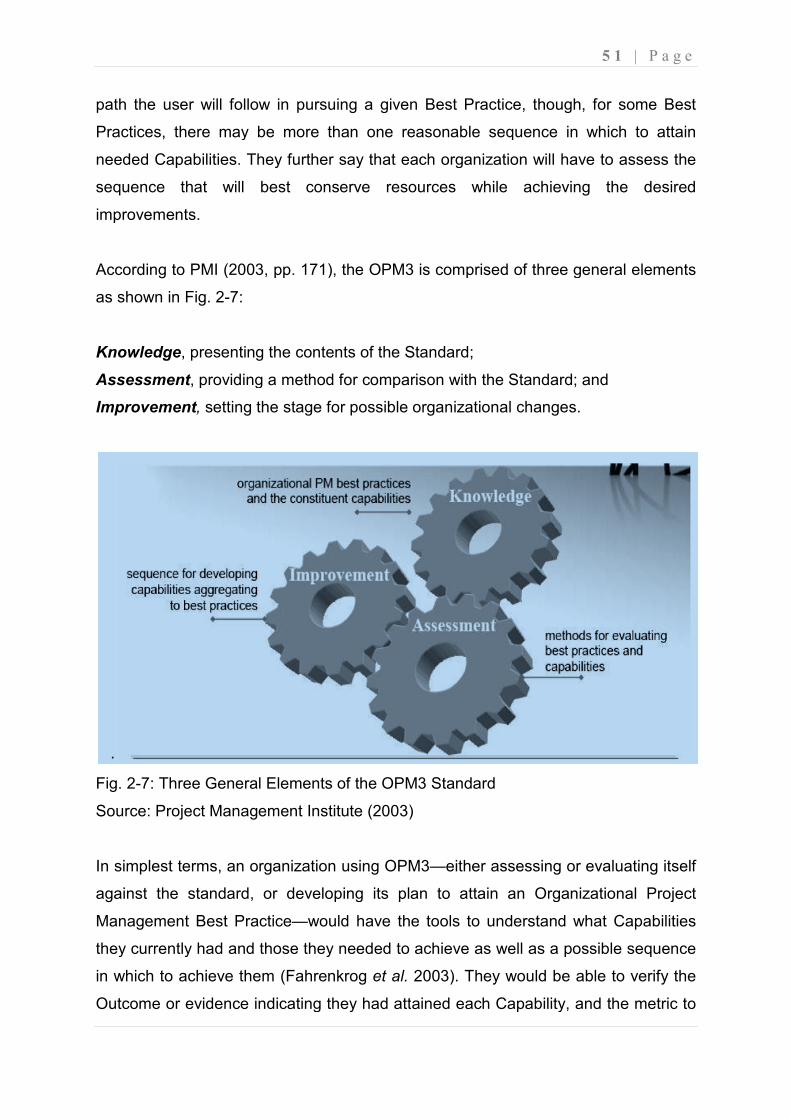
path the user will follow in pursuing a given Best Practice, though, for some Best
Practices, there may be more than
needed Capabilities. They further say that e
sequence that will best conserve resources while achieving the desired
improvements.
According to PMI (2003, pp. 171), the OPM3 is comprised of three general elements
as shown in Fig. 2-7:
Knowledge, presenting the contents of the Standard;
Assessment, providing a method for comparison with the Standard; and
Improvement, setting the stage for possible
Fig. 2-7: Three General Elements of the
Source: Project Management Institute (2003)
In simplest terms, an organization using OPM3
against the standard, or
Management Best Practice
they currently had and those they needed to achieve as well as a possible sequence
in which to achieve them (Fahrenkrog
Outcome or evidence indicating they had att
the user will follow in pursuing a given Best Practice, though, for some Best
Practices, there may be more than one reasonable sequence in which to att
They further say that each organization will have to assess the
sequence that will best conserve resources while achieving the desired
PMI (2003, pp. 171), the OPM3 is comprised of three general elements
, presenting the contents of the Standard;
, providing a method for comparison with the Standard; and
setting the stage for possible organizational changes.
Three General Elements of the OPM3 Standard
Source: Project Management Institute (2003)
In simplest terms, an organization using OPM3—either assessing or evaluating itself
developing its plan to attain an Organizational Project
Management Best Practice—would have the tools to understand what Capabilities
they currently had and those they needed to achieve as well as a possible sequence
Fahrenkrog et al. 2003). They would be able to verify the
Outcome or evidence indicating they had attained each Capability, and the metric to
5 1 | P a g e
the user will follow in pursuing a given Best Practice, though, for some Best
one reasonable sequence in which to attain
ach organization will have to assess the
sequence that will best conserve resources while achieving the desired
PMI (2003, pp. 171), the OPM3 is comprised of three general elements
, providing a method for comparison with the Standard; and
al changes.
either assessing or evaluating itself
developing its plan to attain an Organizational Project
understand what Capabilities
they currently had and those they needed to achieve as well as a possible sequence
They would be able to verify the
each Capability, and the metric to
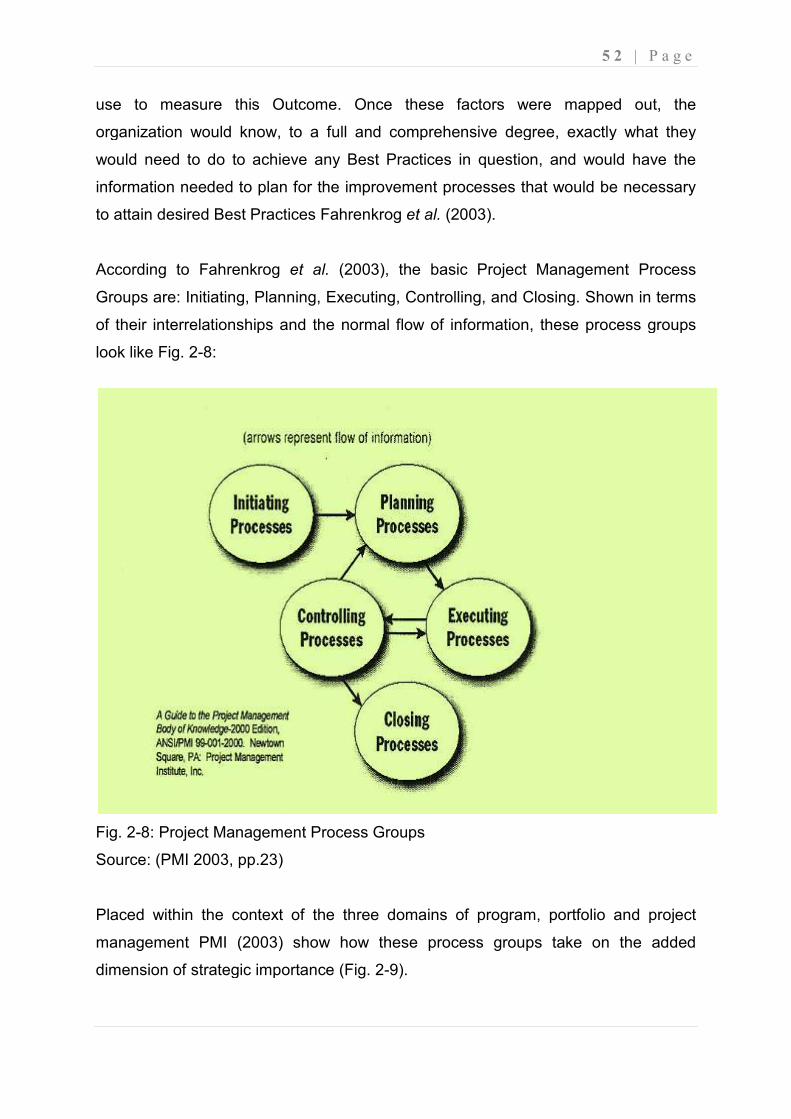
use to measure this Outcome. Once these factors were mapped out, the
organization would know, to a full and comprehensive degree, exactly what they
would need to do to achieve
information needed to plan for the improvement processes
to attain desired Best Practices
According to Fahrenkrog
Groups are: Initiating, Planning
of their interrelationships and the normal flow of information, these process groups
look like Fig. 2-8:
Fig. 2-8: Project Management Process Groups
Source: (PMI 2003, pp.23)
Placed within the context of the three domains of program, portfolio and project
management PMI (2003) show how these process groups take on the
dimension of strategic importance
use to measure this Outcome. Once these factors were mapped out, the
organization would know, to a full and comprehensive degree, exactly what they
would need to do to achieve any Best Practices in question, and wou
information needed to plan for the improvement processes that would be necessary
to attain desired Best Practices Fahrenkrog et al. (2003).
Fahrenkrog et al. (2003), the basic Project Management Process
Planning, Executing, Controlling, and Closing
of their interrelationships and the normal flow of information, these process groups
Project Management Process Groups
the context of the three domains of program, portfolio and project
(2003) show how these process groups take on the
dimension of strategic importance (Fig. 2-9).
5 2 | P a g e
use to measure this Outcome. Once these factors were mapped out, the
organization would know, to a full and comprehensive degree, exactly what they
any Best Practices in question, and would have the
that would be necessary
the basic Project Management Process
Closing. Shown in terms
of their interrelationships and the normal flow of information, these process groups
the context of the three domains of program, portfolio and project
(2003) show how these process groups take on the added
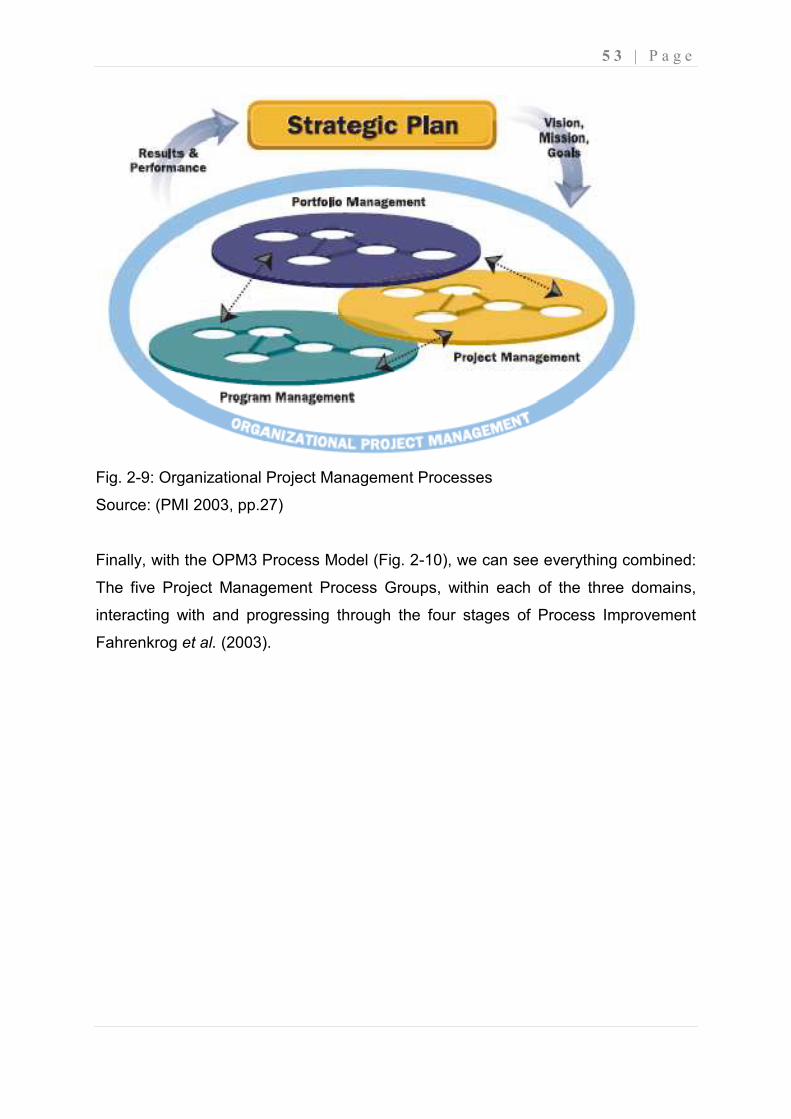
5 3 | P a g e
Fig. 2-9: Organizational Project Management Processes
Source: (PMI 2003, pp.27)
Finally, with the OPM3 Process Model (Fig. 2-10), we can see everything combined:
The five Project Management Process Groups, within each of the three domains,
interacting with and progressing through the four stages of Process Improvement
Fahrenkrog et al. (2003).
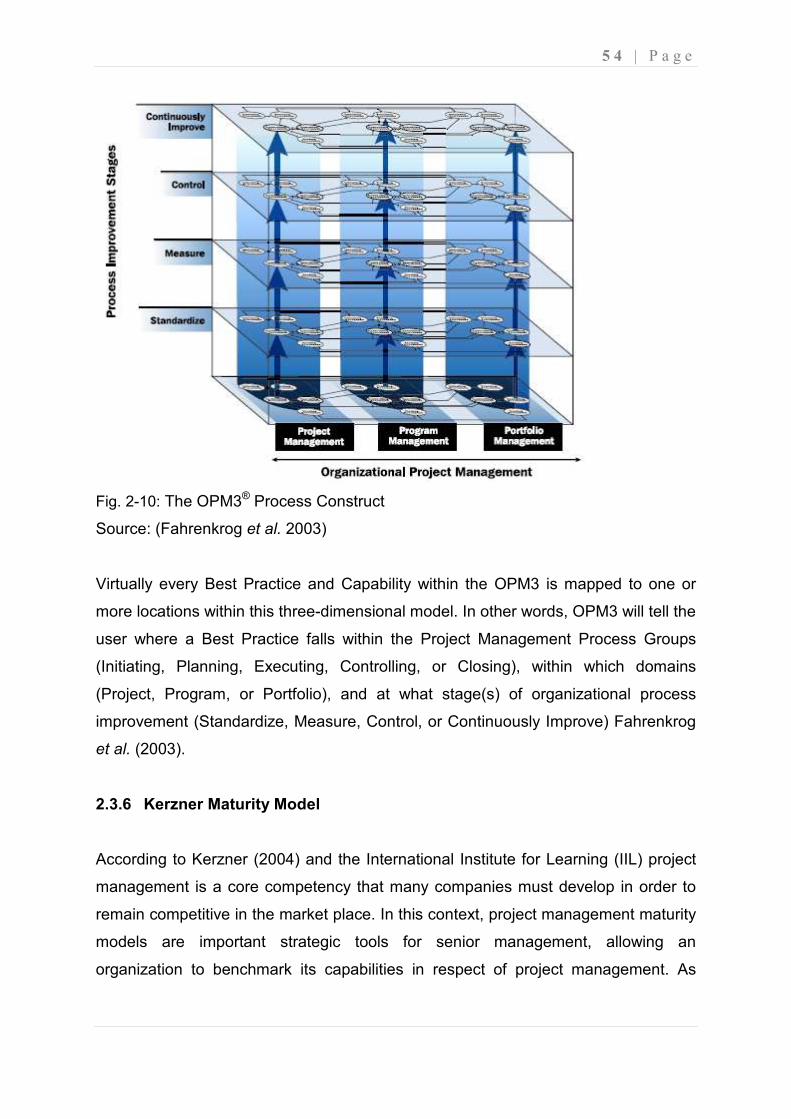
5 4 | P a g e
Fig. 2-10: The OPM3® Process Construct
Source: (Fahrenkrog et al. 2003)
Virtually every Best Practice and Capability within the OPM3 is mapped to one or
more locations within this three-dimensional model. In other words, OPM3 will tell the
user where a Best Practice falls within the Project Management Process Groups
(Initiating, Planning, Executing, Controlling, or Closing), within which domains
(Project, Program, or Portfolio), and at what stage(s) of organizational process
improvement (Standardize, Measure, Control, or Continuously Improve) Fahrenkrog
et al. (2003).
2.3.6 Kerzner Maturity Model
According to Kerzner (2004) and the International Institute for Learning (IIL) project
management is a core competency that many companies must develop in order to
remain competitive in the market place. In this context, project management maturity
models are important strategic tools for senior management, allowing an
organization to benchmark its capabilities in respect of project management. As
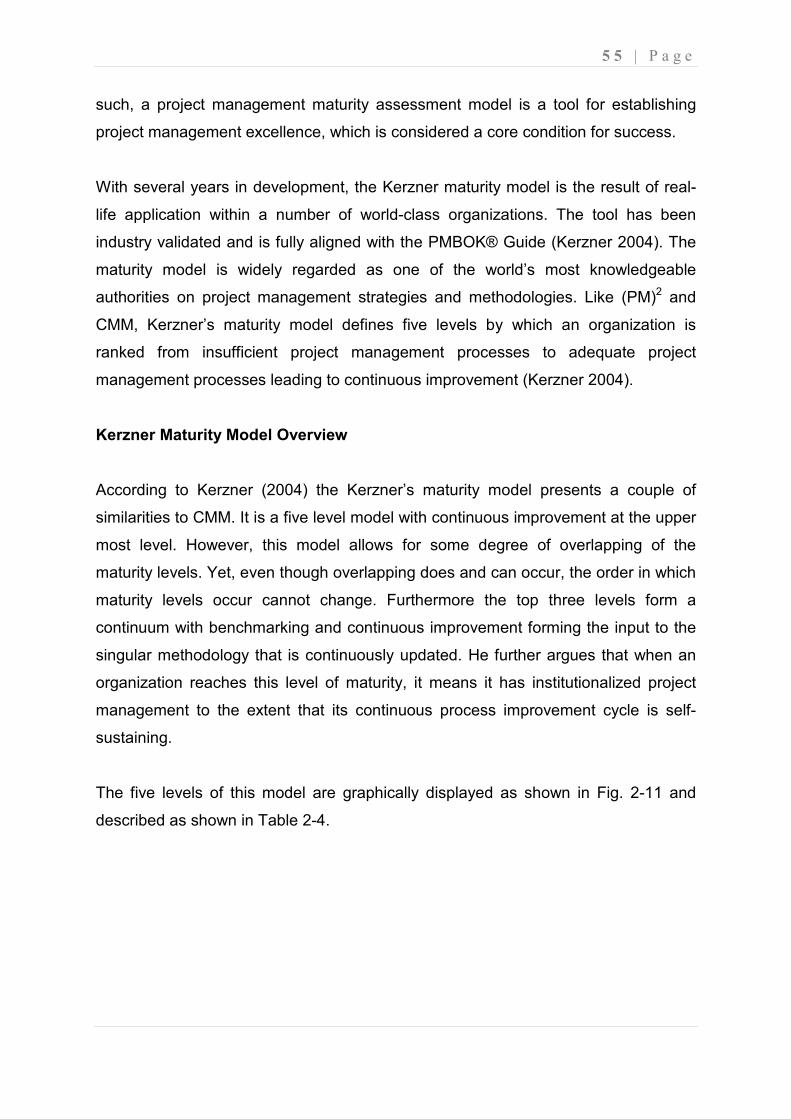
5 5 | P a g e
such, a project management maturity assessment model is a tool for establishing
project management excellence, which is considered a core condition for success.
With several years in development, the Kerzner maturity model is the result of real-
life application within a number of world-class organizations. The tool has been
industry validated and is fully aligned with the PMBOK® Guide (Kerzner 2004). The
maturity model is widely regarded as one of the world’s most knowledgeable
authorities on project management strategies and methodologies. Like (PM)2 and
CMM, Kerzner’s maturity model defines five levels by which an organization is
ranked from insufficient project management processes to adequate project
management processes leading to continuous improvement (Kerzner 2004).
Kerzner Maturity Model Overview
According to Kerzner (2004) the Kerzner’s maturity model presents a couple of
similarities to CMM. It is a five level model with continuous improvement at the upper
most level. However, this model allows for some degree of overlapping of the
maturity levels. Yet, even though overlapping does and can occur, the order in which
maturity levels occur cannot change. Furthermore the top three levels form a
continuum with benchmarking and continuous improvement forming the input to the
singular methodology that is continuously updated. He further argues that when an
organization reaches this level of maturity, it means it has institutionalized project
management to the extent that its continuous process improvement cycle is self-
sustaining.
The five levels of this model are graphically displayed as shown in Fig. 2-11 and
described as shown in Table 2-4.
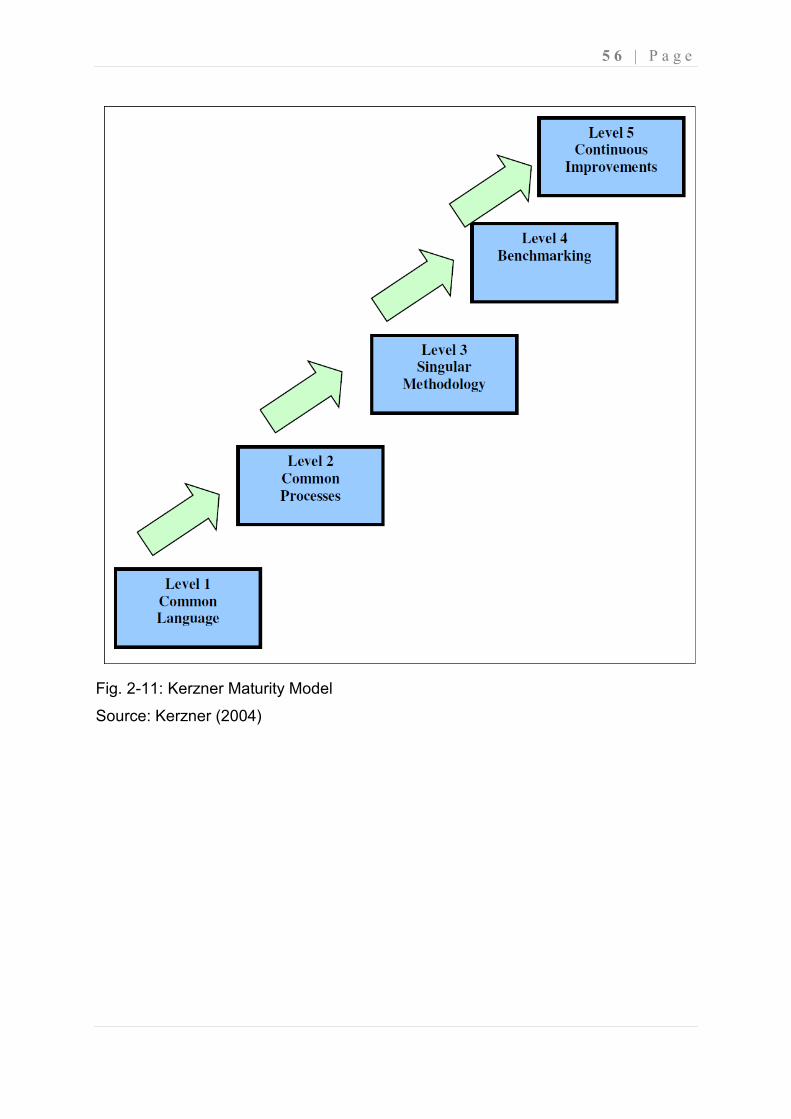
5 6 | P a g e
Fig. 2-11: Kerzner Maturity Model
Source: Kerzner (2004)
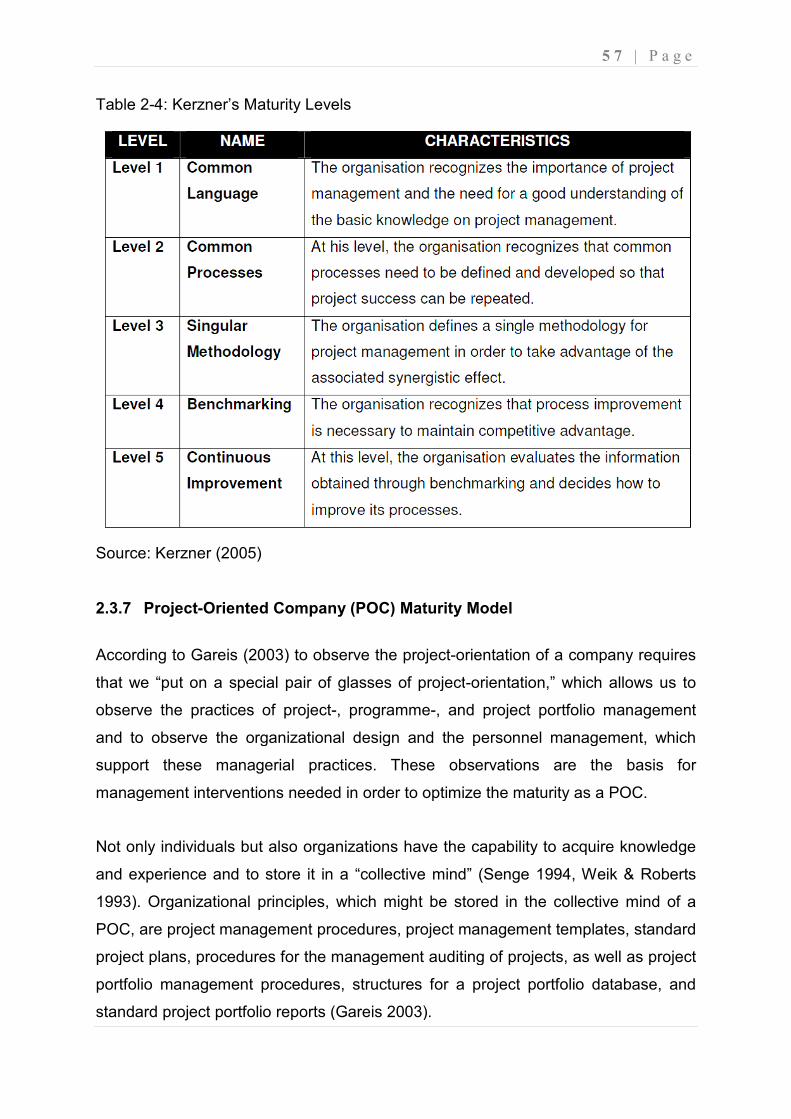
Table 2-4: Kerzner’s Maturity Levels
Source: Kerzner (2005)
2.3.7 Project-Oriented Company (POC)
According to Gareis (2003)
that we “put on a special pair of glasses of project
observe the practices of project
and to observe the organizational
support these managerial practices. These observations are the basis for
management interventions needed in order to optimize the maturity as a
Not only individuals but also organizations have the capabilit
and experience and to store it in a “collective min
1993). Organizational principles, which might be stored in the collective mind of a
POC, are project management procedures, project management template
project plans, procedures for the management auditing of projects, as well as project
portfolio management procedures, structures for a project portfolio database, and
standard project portfolio reports (Gareis 2003).
ner’s Maturity Levels
ompany (POC) Maturity Model
2003) to observe the project-orientation of a company requires
that we “put on a special pair of glasses of project-orientation,” which allows us to
observe the practices of project-, programme-, and project portfolio management
and to observe the organizational design and the personnel management, which
support these managerial practices. These observations are the basis for
management interventions needed in order to optimize the maturity as a
Not only individuals but also organizations have the capability to acquire knowledge
and experience and to store it in a “collective mind” (Senge 1994, Weik & Roberts
1993). Organizational principles, which might be stored in the collective mind of a
POC, are project management procedures, project management template
project plans, procedures for the management auditing of projects, as well as project
ortfolio management procedures, structures for a project portfolio database, and
reports (Gareis 2003).
5 7 | P a g e
orientation of a company requires
orientation,” which allows us to
, and project portfolio management
design and the personnel management, which
support these managerial practices. These observations are the basis for
management interventions needed in order to optimize the maturity as a POC.
y to acquire knowledge
d” (Senge 1994, Weik & Roberts
1993). Organizational principles, which might be stored in the collective mind of a
POC, are project management procedures, project management templates, standard
project plans, procedures for the management auditing of projects, as well as project
ortfolio management procedures, structures for a project portfolio database, and
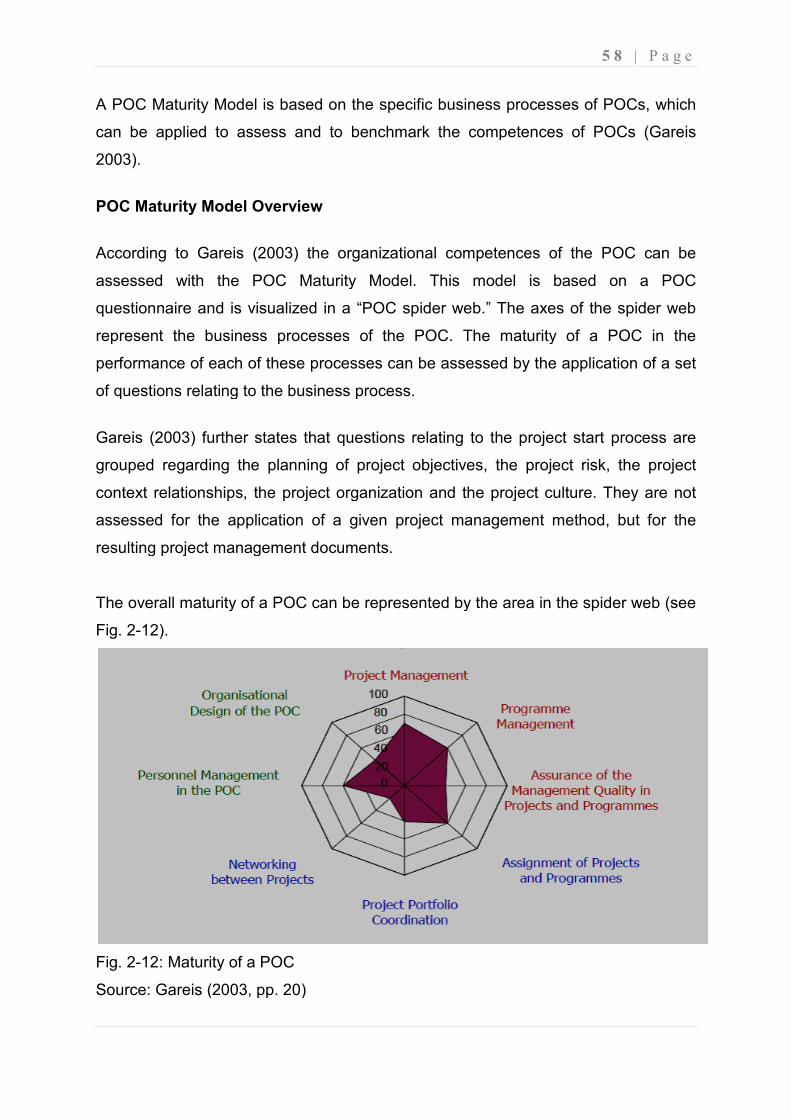
A POC Maturity Model is based on the specific business processes of POCs, which
can be applied to assess and to benchmark the competences of POCs
2003).
POC Maturity Model Overview
According to Gareis (2003)
assessed with the POC Maturity
questionnaire and is visualized in a “POC spider web.” The axes of the spider web
represent the business processes of the POC. The maturity of a POC in the
performance of each of these processes can be
of questions relating to the business process.
Gareis (2003) further states that
grouped regarding the planning of project objectives, the project risk, the project
context relationships, the project organization and the project culture. They are not
assessed for the application of a given project management method, but for the
resulting project management
The overall maturity of a POC can be represented by the area in the spider
Fig. 2-12).
Fig. 2-12: Maturity of a POC
Source: Gareis (2003, pp. 20)
based on the specific business processes of POCs, which
can be applied to assess and to benchmark the competences of POCs
Maturity Model Overview
2003) the organizational competences of the POC can be
h the POC Maturity Model. This model is based on a POC
questionnaire and is visualized in a “POC spider web.” The axes of the spider web
represent the business processes of the POC. The maturity of a POC in the
performance of each of these processes can be assessed by the application of a set
of questions relating to the business process.
further states that questions relating to the project start process are
grouped regarding the planning of project objectives, the project risk, the project
context relationships, the project organization and the project culture. They are not
assessed for the application of a given project management method, but for the
resulting project management documents.
The overall maturity of a POC can be represented by the area in the spider
12: Maturity of a POC
Source: Gareis (2003, pp. 20)
5 8 | P a g e
based on the specific business processes of POCs, which
can be applied to assess and to benchmark the competences of POCs (Gareis
he organizational competences of the POC can be
Model. This model is based on a POC
questionnaire and is visualized in a “POC spider web.” The axes of the spider web
represent the business processes of the POC. The maturity of a POC in the
assessed by the application of a set
uestions relating to the project start process are
grouped regarding the planning of project objectives, the project risk, the project
context relationships, the project organization and the project culture. They are not
assessed for the application of a given project management method, but for the
The overall maturity of a POC can be represented by the area in the spider web (see
5 9 | P a g e
According to Gareis (2003) the maturities of POCs can be benchmarked and further
developed. He further argues that instruments to develop the competences of
individuals performing roles in the POC are (self-) assessments, trainings
(classroom, on the job) and coachings. He also emphasize that instruments to
develop the organizational competences of the POC are assessments, bench
markings and organizational development projects, e.g. to implement project
portfolio management, to establish a PM Office.
According to Gareis (2003) it is important to differentiate between the project
management process and other specific processes of the POC. Even project
management is the most important business process of the POC, competences for
the performance of the other specific business processes of the POC have to be
further developed, too. The POC Maturity Model supports the assessment as well as
the further development of these competences (Gareis 2003).
2.4 Comparison of Maturity Models
According to Khoshgoftar & Osman (2009) Maturity models are one of the
widespread areas in the field of improving organizational performance. They identify
organizational strengths and weaknesses as well as providing benchmarking
information. Khoshgoftar & Osman (2009) further states that there are many maturity
models like OPM3, CMMI, P3M3, PRINCE, BPMM, and Kerzner’s Project
Management Maturity Model, etc. These models are different from each other in
terms of their factors and characteristics and also there is no standard related to
these models. Therefore, it is important for organizations to be able to assess their
situation by a comprehensive and useful model (Khoshgoftar & Osman 2009).
Accordingly, this section compared the different maturity models in terms of selected
variables and aimed to identify a more suitable maturity model than others.
There were two steps followed in the process of comparing the maturity models; the
first was to select some models for comparison. In this regards, four of the discussed
maturity models above were compared to some of the maturity models listed in
Table 2-1. The second step was to find the variables for comparing maturity models
with each other. The selected variables were adopted from Hakamian’s (2005)
6 0 | P a g e
unpublished Dissertation (Khoshgoftar & Osman 2009). Table 2-5 shows comparison
of models according to the selected variables. According to Khoshgoftar & Osman
(2009), the following variables were selected:
• Publisher: The reliable publisher
• Scope: The cover of the area of model
• Number of Maturity Level: The quantity of maturity level of model
• Discrete and Continues: Consisting of the maturity level
• Details: The amount of the considered factors
• Date of Issue: The publications from 2000 to 2007 will be taken into
consideration in this case
• Refer to Standard: Based on which standard the model is designed
• Definition of Maturity: Definition of maturity
• Organization Strategic: Considering the organization strategic
• Project Management Process: The covering project management process
• Program Management Process: The covering program management process
• Portfolio Management Process: The covering portfolio management process
• Coverage Assessment: Identifying the coverage of the model
• Assessment Difficulty: The extent of difficulties
• Assessment Cost: Expenditure of assessment
• Quantitative Results: Showing the quantitative results
• Tangible of Results: Identifying of the results clearly
• Identifying weakness and strong points: Indicating weaknesses and strongest
of organization
• Continuous Assessment: Considering continues assessment
• Training Difficulty: The extent of difficulties in training of the model for staff
and assessors
• Commitment for Continuous Improvement: Considering continues
improvement
• Suggestion of alternative for improvement: To find out the solutions
• Priority of Improvement: Determining priority of improvement in organization
• Support by Publisher: Support by publisher
• New Edition: compatibility with new conditions
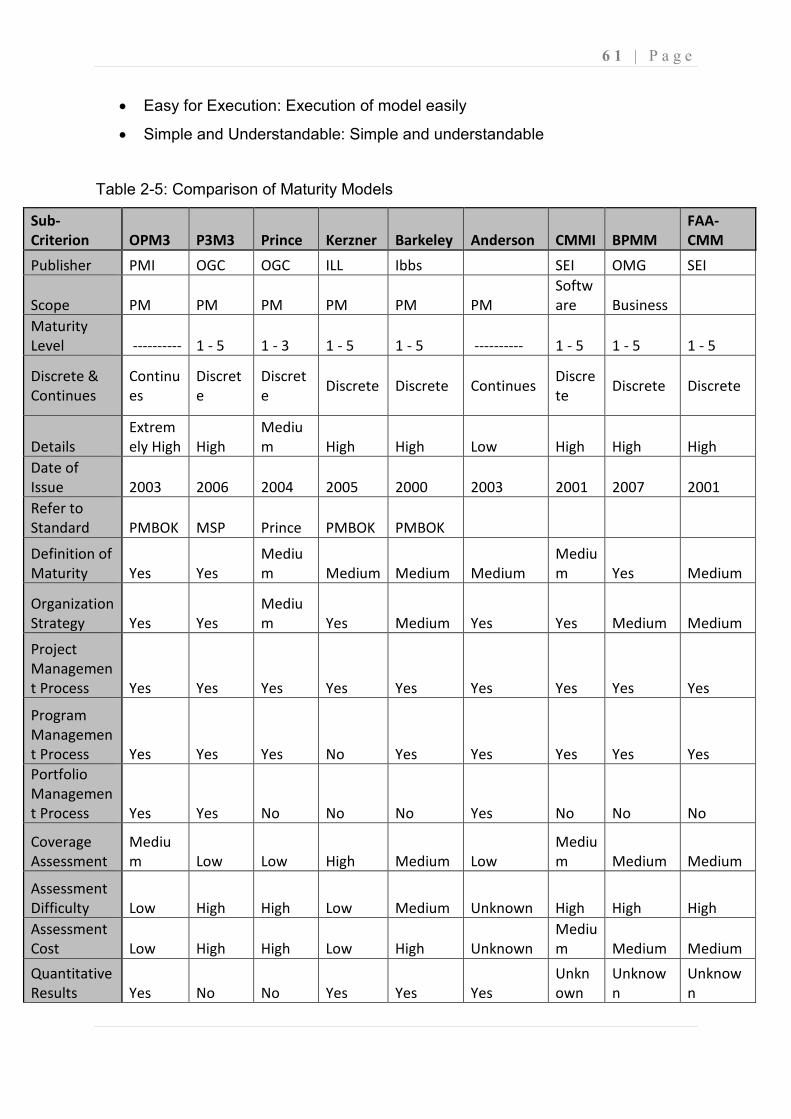
6 1 | P a g e
• Easy for Execution: Execution of model easily
• Simple and Understandable: Simple and understandable
Table 2-5: Comparison of Maturity Models
Sub-
Criterion OPM3 P3M3 Prince Kerzner Barkeley Anderson CMMI BPMM
FAA-
CMM
Publisher PMI OGC OGC ILL Ibbs SEI OMG SEI
Scope PM PM PM PM PM PM
Softw
are Business
Maturity
Level ---------- 1 - 5 1 - 3 1 - 5 1 - 5 ---------- 1 - 5 1 - 5 1 - 5
Discrete &
Continues
Continu
es
Discret
e
Discret
e Discrete Discrete Continues
Discre
te Discrete Discrete
Details
Extrem
ely High High
Mediu
m High High Low High High High
Date of
Issue 2003 2006 2004 2005 2000 2003 2001 2007 2001
Refer to
Standard PMBOK MSP Prince PMBOK PMBOK
Definition of
Maturity Yes Yes
Mediu
m Medium Medium Medium
Mediu
m Yes Medium
Organization
Strategy Yes Yes
Mediu
m Yes Medium Yes Yes Medium Medium
Project
Managemen
t Process Yes Yes Yes Yes Yes Yes Yes Yes Yes
Program
Managemen
t Process Yes Yes Yes No Yes Yes Yes Yes Yes
Portfolio
Managemen
t Process Yes Yes No No No Yes No No No
Coverage
Assessment
Mediu
m Low Low High Medium Low
Mediu
m Medium Medium
Assessment
Difficulty Low High High Low Medium Unknown High High High
Assessment
Cost Low High High Low High Unknown
Mediu
m Medium Medium
Quantitative
Results Yes No No Yes Yes Yes
Unkn
own
Unknow
n
Unknow
n
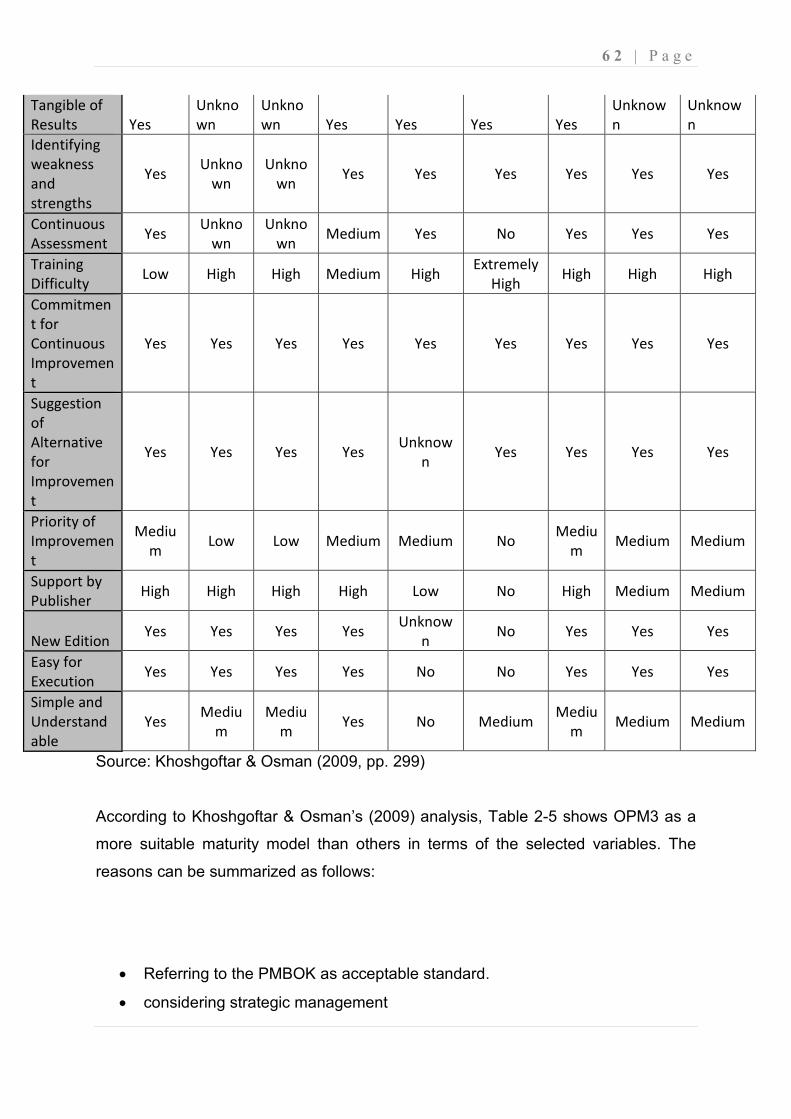
6 2 | P a g e
Tangible of
Results Yes
Unkno
wn
Unkno
wn Yes Yes Yes Yes
Unknow
n
Unknow
n
Identifying
weakness
and
strengths
Yes Unkno
wn
Unkno
wn Yes Yes Yes Yes Yes Yes
Continuous
Assessment Yes
Unkno
wn
Unkno
wn Medium Yes No Yes Yes Yes
Training
Difficulty Low High High Medium High
Extremely
High High High High
Commitmen
t for
Continuous
Improvemen
t
Yes Yes Yes Yes Yes Yes Yes Yes Yes
Suggestion
of
Alternative
for
Improvemen
t
Yes Yes Yes Yes Unknow
n Yes Yes Yes Yes
Priority of
Improvemen
t
Mediu
m Low Low Medium Medium No
Mediu
m Medium Medium
Support by
Publisher High High High High Low No High Medium Medium
New Edition Yes Yes Yes Yes
Unknow
n No Yes Yes Yes
Easy for
Execution Yes Yes Yes Yes No No Yes Yes Yes
Simple and
Understand
able
Yes Mediu
m
Mediu
m Yes No Medium
Mediu
m Medium Medium
Source: Khoshgoftar & Osman (2009, pp. 299)
According to Khoshgoftar & Osman’s (2009) analysis, Table 2-5 shows OPM3 as a
more suitable maturity model than others in terms of the selected variables. The
reasons can be summarized as follows:
• Referring to the PMBOK as acceptable standard.
• considering strategic management
6 3 | P a g e
• Considering portfolio management, program management and project
management.
• Having continues approach while most of the other models have five maturity
level and are discrete
• Having 586 best practice and 2400 capability that show more details for this
model
• Date of issue that indicate this model is not old
• Publisher that is PMI, the most popular institute in the project management
• Having the assessment tools, this model use special software for analyzing
collected data
• Attention to the improvement
• Suggesting alternative for improvement
• Identifying the weakness and strong points by model
• Supporting by PMI
• Emphasis to continuous improvement and priority of improvement
• Simple and understandable for user
• Using this model is not costly
• Executing of the model is easy
• This model is not related to the special industry
There are a couple of reasons why reference to PMI and its standard PMBOK are
highlighted as some of the reasons OPM3 is a more suitable maturity model than
others in the analysis above. Firstly, according to PMI’s (2011) ‘PMBOK® Guide and
Standards article’, PMI global standards provide guidelines, rules and characteristics
for project management. These standards are widely accepted and, when
consistently applied, they help the user; the global peers and the organization
achieve professional excellence. And because they’re created and updated by both
volunteer teams and the general public, the user can be confident that their
standards continually and accurately reflect the evolving profession.
Secondly, according to PMI’s (2011) ‘What is PMI? Article’, PMI's 12 standards for
project, program and portfolio management is the most widely recognized standards
in the profession - and increasingly the model for project management in business
6 4 | P a g e
and government. They are developed and updated by thousands of PMI volunteers
with experience in every type of project, and provide a common language for project
management around the world (PMI 2011).
Thirdly, according to Project Smart (2011) the PMBOK is a collection of processes
and knowledge areas generally accepted as best practice within the project
management discipline. As an internationally recognised standard (IEEE Std 1490-
2003) it provides the fundamentals of project management, irrespective of the type of
project be it construction, software, engineering, automotive etc.
Lastly, the PMBOK is considered one of the most essential tools in the project
management profession and is the de facto global standard for the industry Project
Smart (2011).
Maturity models are new concept in the field of project management. They are not
under a standard and they have different frameworks. Organizations utilize these
models for reaching their goals and objectives. Comparing the models can help the
organizations in selecting and utilizing suitable maturity model (Khoshgoftar &
Osman 2009).
Khoshgoftar & Osman’s (2009) analysis above concludes that OPM3 is a suitable
model among others in terms of selected variables. This does not however mean
that OPM3 is the best one in the world and in all situations because this needs
further research.
6 5 | P a g e
2.5 Chapter Summary
The chapter presents the theory and literature of project management with specific
focus on the concept of organizational project management maturity.
The chapter firstly highlights the maturity models that are currently availability on the
market and are in use by various organizations to assess the maturity of their project
management processes. The emphasis is further put on the fact that, maturity
processes that all organizations go through do not necessarily guarantee success of
the organization’s operations, but just increase the probability of success.
A brief history is presented describing the inception of the concept of process
maturity, giving reference to the early Total Quality Management movement’s impact
on the; reduction in the variability inherent in the process, and an improvement in the
mean performance of the process.
The chapter further elaborates on the uniqueness of the maturity models in terms of
their specific characteristics, factors and ways that they consider for reaching their
purpose and the lack of standard/s related to these models. Further emphasis is put
on the way organizations can assess their organizational performance by a
comprehensive and useful model, and how this can help them compare their
situation with other companies by using the same model.
The chapter also introduces the systematic framework for carrying out benchmarking
and performance improvement that the maturity models presents. The levels of
capability from "not able to do it" through to "continuously improving" are introduced.
The chapter further discusses the important improvement issues that are brought
about by these maturity models, and how the organizations can benefit from these
models.
The lists of both the existing and recent organizational project management maturity
models are presented. The models that have received the greatest attention in the
research literature are also identified. Recent maturity models available in the market
6 6 | P a g e
are also identified, with their developers. The description of what these maturity
models assess is provided.
The chapter then presents and discuss the seven maturity models identified:
• Capability Maturity Model (CMM)
• Project Management Maturity Model (PMMM)
• Portfolio, Programme and Project Management Maturity Model (P3M3)
• Project Management Process Maturity (PM)2 Model
• Organizational Project Management Maturity Model (OPM3)
• Kerzner Maturity Model
• Maturity of the Project-Oriented Company (POC)
Lastly, a comparison study between four of the discussed maturity models and the
other recent maturity models listed in the chapter is presented. The two steps
followed in the process of comparing the maturity models are also discussed. The
chapter concludes by identifying OPM3 as the suitable model among others in terms
of selected variables used in the analysis, however, it also emphasize the fact that
OPM3 is not necessarily the best model in the world in all situations, and identifies
the need for further research.
6 7 | P a g e
CHAPTER 3: RESEARCH METHODOLOGY
3.1 Introduction
This Chapter presents the research method that was used by the researcher in this
study to answer the posed research questions. These include the sampling design,
research design - including data collection strategies, study limitations and ethical
considerations. This chapter firstly discuss the theory and practice of research
methodologies to highlight the different options that are available to use for
conducting the study. The chapter further display the systematic process that was
followed to reach the conclusions, and that acceptable research methodologies are
observed and applied. The research methodology provides a view of how the study
was conducted and the considerations that were afforded to ethical standards.
The main objective of this study is to assess and evaluate the level of project
management maturity of the South African PSL Soccer clubs using OPM3
assessment model. To achieve this objective, the following research questions are
tested in this study:
Primary Research Question:
What is the level of organizational project management maturity of the South African
PSL Soccer clubs?
Research Sub-Questions:
i. Do PSL clubs perceive themselves as POOs?
ii. Do PSL clubs define “Management by Projects” as an organizational
strategy?
iii. Do PSL clubs have specific permanent organization units, such as a PM
Office and a Project Portfolio Group to help facilitate project management
efforts?
iv. Can something be done to improve the utilization of project management
practices by the PSL Clubs?
6 8 | P a g e
v. What is the next step in the path to attaining a higher degree of
organizational project management maturity by PSL Soccer clubs?
3.2 Research Methodologies: Theory and Practice
3.2.1 Qualitative Method
According to Abusabha & Woelfel (2003) Qualitative Research describes an event in
its natural setting. Walsh (2003) describes it as a subjective way to look at life as it is
lived and an attempt to explain the studied behaviour. Qualitative research uses
qualifying words and descriptions to record aspects about the world through
qualitative data, such as interviews, documents and participant observation, to
understand and explain social phenomena (Myers 1997).
Creswell (2003); de Vaus (2001) explain that rather than design an experiment and
artificially control the variables, qualitative researchers use anthropological and
ethnographic methods to study the participants. As little intrusion as possible should
occur in qualitative research and a researcher will frequently observe the participants
unnoticed. The methodology is sensitive to understanding and analysing the
perspectives of human experience through a process of description that is
expressive and persuasive in language (Bless & Higson-Smith 2000; Creswell 1998;
Gillham 2000).
Leedy and Ormrod (2005) further states that:
“To answer some research, we cannot skim across the surface. We must dig
to get a complete understanding of the phenomena we are studying. In
qualitative research, we do indeed dig deep: we collect numerous forma of
data and examine them from various angles to construct a rich and
meaningful picture of a complex situation”.
Kumar (2005) states that these methodologies involve a phenomenological
perspective whereby researchers aim to understand, report and evaluate the
meaning of events for people in particular situations, that is, how their social world is
6 9 | P a g e
structured by the participants in it. The focus of qualitative methodologies is the way
in which participants (rather than the researcher) interpret their experiences and
construct reality.
Kumar (2005) provides a summary of the qualitative methodologies as follows:
(a) Interview
An interview may be tightly structured, semi-structured, unstructured, in-depth or
conversational. This methodology involves the researcher and the interviewee in a
one-to-one situation and may be quite time consuming. The researcher may
interview several people at different times using the same interview question
schedule.
In the interview, the researcher is able to ask probing, follow-up questions and open
ended questions. Therefore the interview can be tailored to the situation and to the
respondent. In this instance, the interviewer also has the opportunity to clarify
questions and misunderstandings as the interview progresses. It is not possible to
achieve this in other methods such as surveys.
Holmes & Walsh (2005) makes the following presentation of the Advantages and
Disadvantages offered by face-to-face interview:
Advantages of face-to-face interview
A people-to-people tool within a people-oriented business - Project
management is ultimately a people-oriented business that requires personal
interactions by and between all of the project team members. Face-to-face
interviewing extends this principle to maturity assessments. Not only does the
interview provide an interpersonal connection between the interviewer and the
interview participant, it allows the interviewer to begin to assess the “people skills” of
the personnel assigned to manage projects at the subject company. Interview
participants who display grace and candor during the interview are more likely to
carry those traits into their project teams, and are more likely to be open to the
7 0 | P a g e
recommendations for change or improvement that will flow from the assessment
study. Conversely, interview subjects who are less cooperative or more belligerent
during the interviews are less likely to readily adopt new suggestions.
Reveals actual, as well as intended behaviours - Conducting face-to-face
interviews allows the interviewer/assessor to discover how the project team
members at the subject company conduct their project business on a day-to-day
basis. It is the only tool in the assessor's toolbox that provides a means to evaluate
the validity of several of the other tools, such as a review of policy manuals, or a
project document search. Policy statements and procedures manuals provide
guidance into how the subject company believes it should or wants to do work. By
engaging project team members in open conversations, the interviewer can elicit
comments that reveal, “what we really do” vs. “what we think we do” or “what are we
supposed to do?” Additionally, by discussing different types of project reports with
the people who write them, or use them, the assessor can gain insight into the value
placed on each report. A simple document review, while important, can only indicate
that a report exists, not that it is a valued tool, used by the project team to help
control their projects, or by management to monitor progress.
Provides opportunity to observe the corporate culture of the subject company
- Corporate culture creates different patterns of behaviour at different companies that
can have a significant impact on the outcomes of projects. The degree of openness
to hearing and dealing with project issues, demonstrating appreciation for project
successes, and the amount of information sharing between functional groups
working on a project all contribute to the ultimate success of a project. All companies
probably would respond affirmatively to possessing these traits; not all companies
truly demonstrate these traits positively. During one-on-one conversations with
working-level project team members, the assessor can learn how well the subject
company responds to project information, or how often it “shoots the messenger.”
Making improvements in project management (which is the natural follow-on to
assessing a company’s level of maturity) have a greater chance of success when the
recommendations from the assessors address behaviours that need repair.
Typically, the assessor is an outside consultant, hired for their reputed expertise and
7 1 | P a g e
experience, with no intimate connection to the subject company or its employees.
While this detached position contributes to the objectivity of the assessor's
observations, it poses challenges in acquiring and validating information. The use of
face-to-face interviews opens a doorway for the assessor to see into the subject
company. Even something as simple as acquiring a list of products manufactured by
the subject company, which can be initiated with a search of the company’s web site
or customer literature; can be enhanced by the personal contact inherent in the
interview. Letting the company’s personnel describe their products will reveal areas
of corporate and individual pride and satisfaction, as well as provide significant
indicators of which projects are viewed as successful (or not) at the subject
company.
Difficulties associated with face-to-face interview
Need to establish credibility of assessors - As an outsider, the assessment team
often encounter a “Who-are-you-and-why-should-I-give-you-any-of-mytime?”
reluctance to participate amongst the project management community at the subject
company. This attitude can stem from two general sources: a general distrust of
consultants and management’s motives for hiring them; or insufficient information
about the assessors’ credentials. Neither of these difficulties is insurmountable, but
neither can be ignored. And both can be addressed initially by a carefully worded
introduction from the assessment’s sponsor within the host company.
The sponsor for the assessment must possess sufficient status within his/her own
organization to approve, or be able to solicit approval for the funding needed to
conduct the assessment study. This status can be leveraged to convey the
credentials of the assessment team to the host organization. The assessors must be
introduced to the project management community in terms that readily establish the
expertise and experience of the assessment team with this type of work. This also
implies that the assessment team must be comprised of, or, at the least, be led by
experienced, senior project managers, whose personal credentials will inspire
confidence in the interview participants.
7 2 | P a g e
Need to secure cooperation of interview participants - The assessor also needs
to recognize that many people within the host company’s project management
organization(s) will not view the assessment in an entirely positive light. Although the
study is intended to be a continuous-improvement effort, it may still be perceived to
stem from something being wrong, or judged to be not good enough. The outside
assessor could be viewed as Management’s vigilante enforcer, coming in to identify
and punish the under-achievers in project management. The assessor must defuse
this impression, a task that can best be done if the assessor knows where the host
company’s “sore spots” exist and why the host company has elected to conduct the
assessment.
Here again, the status of the assessment sponsor can be of great help in
overcoming the reluctance of the interview participants. The sponsor’s introduction of
the assessment team can be used to share the rationale for the study and remove
much of the apprehension that could surround it.
Need to prepare thoroughly - During each interview, it is beneficial to allow
conversation to flow in a freewheeling manner, rather than following a rigid, checklist
Q&A. For this to work, the assessor/interviewer must be adequately prepared to
conduct the interview. The assessor must know the assessment model in great
detail, and be able to detect different levels of maturity for each knowledge area,
regardless of whether or not the interview respondent uses catch phrases and key
words from the model in his/her comments. It is the assessor’s responsibility to be
able to take appropriate notes during the interview without disrupting the flow of the
interview by having to shuffle Dissertations or stumble from one topic to the next.
The assessment team can help prepare for the interviews by constructing an easy-
to-use interview form that guides them through the different areas, and offers
reminders of key phrases to listen for. By creating the form, the team members
increase their familiarity with it, and find it more beneficial as a guide. Additionally, by
constructing their own form, the assessment team members can afford themselves
the opportunity to reacquaint themselves with the details of the assessment model.
7 3 | P a g e
Information provided by interview participant is subjective - Each interview
participant possesses their own biases, coloured by their most recent successes (or
failures) on projects to which they’ve been assigned. These biases create an
individual calibration of the spectrum from “Good Performance” to “Bad
Performance” for each interview participant. Even if the assessor uses questions
with a built-in grading scale (“… on a scale from one to five…”) the optimism or
pessimism of the interview participant can cause different participants to grade the
same experience differently. The assessor is the common factor across multiple
interviews, and must draw enough information from each participant to adequately
place each one on a common scale.
Information is not readily quantifiable - Unlike a written (or electronic) survey,
where the assessing team can count and graph the responses from the participants,
the information gathered during an interview is not readily quantifiable. Not every
interview is the same as all the others. The discussion, if it is free-flowing and
catered to the interests and background of the participants, ranges to different areas
and focuses on different topics. The assessor has the responsibility to ensure that
each discussion reaches enough, but not necessarily all of the project management
knowledge areas to yield a reasonable spectrum that can be linked to the answers
from other interviews.
Extracting and analyzing the data from a number of interviews is carried out largely
within the brain of the assessor, without the guidance of any fixed or fully defined
algorithm. The assessor relies, to a large degree, upon “feel,” which demands that
the assessor have a broad foundation upon which to build. Years of experience in
project management situations similar to those faced by the interview participants at
the host company, coupled with an in-depth familiarity of the individual elements of
the maturity model is essential to permit the assessor to make an honest
assessment.
Information gathered by multiple assessors is not easily shared and
synthesized - The difficulties of collecting and analyzing data that is presented
subjectively and anecdotally are compounded when a team of assessors is involved.
If each interviewer has his/her own scale of judgment, and his/her own sense of
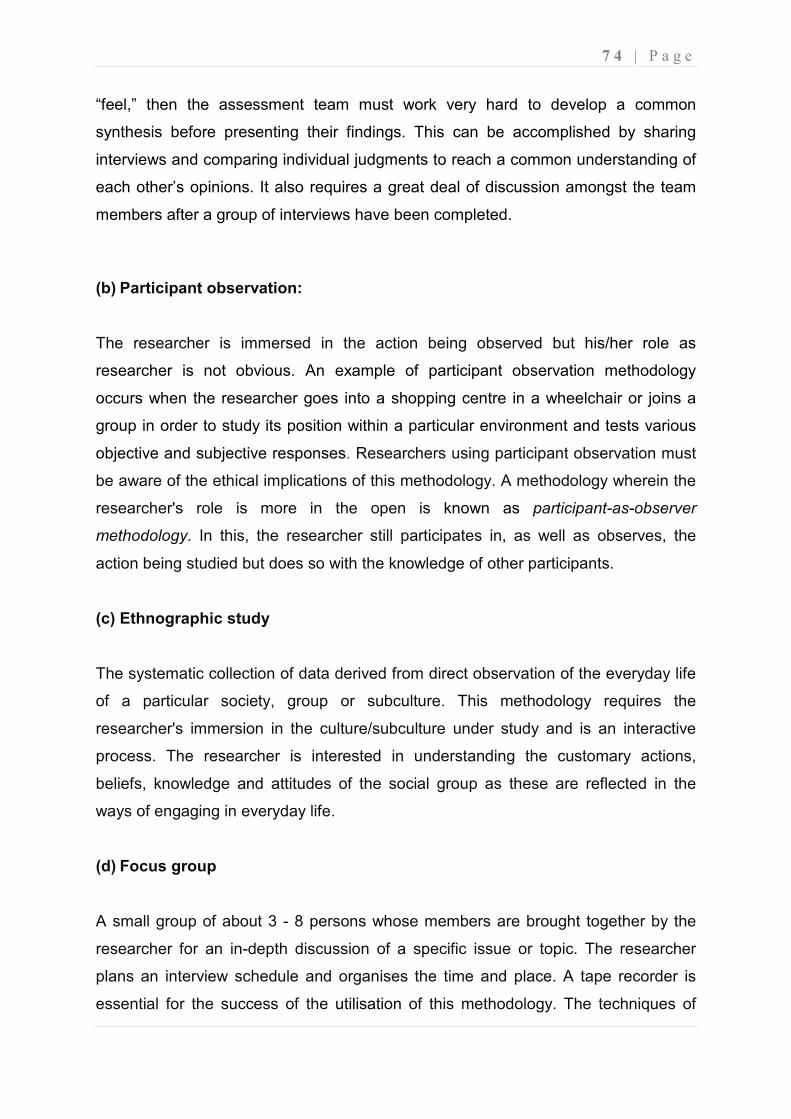
7 4 | P a g e
“feel,” then the assessment team must work very hard to develop a common
synthesis before presenting their findings. This can be accomplished by sharing
interviews and comparing individual judgments to reach a common understanding of
each other’s opinions. It also requires a great deal of discussion amongst the team
members after a group of interviews have been completed.
(b) Participant observation:
The researcher is immersed in the action being observed but his/her role as
researcher is not obvious. An example of participant observation methodology
occurs when the researcher goes into a shopping centre in a wheelchair or joins a
group in order to study its position within a particular environment and tests various
objective and subjective responses. Researchers using participant observation must
be aware of the ethical implications of this methodology. A methodology wherein the
researcher's role is more in the open is known as participant-as-observer
methodology. In this, the researcher still participates in, as well as observes, the
action being studied but does so with the knowledge of other participants.
(c) Ethnographic study
The systematic collection of data derived from direct observation of the everyday life
of a particular society, group or subculture. This methodology requires the
researcher's immersion in the culture/subculture under study and is an interactive
process. The researcher is interested in understanding the customary actions,
beliefs, knowledge and attitudes of the social group as these are reflected in the
ways of engaging in everyday life.
(d) Focus group
A small group of about 3 - 8 persons whose members are brought together by the
researcher for an in-depth discussion of a specific issue or topic. The researcher
plans an interview schedule and organises the time and place. A tape recorder is
essential for the success of the utilisation of this methodology. The techniques of
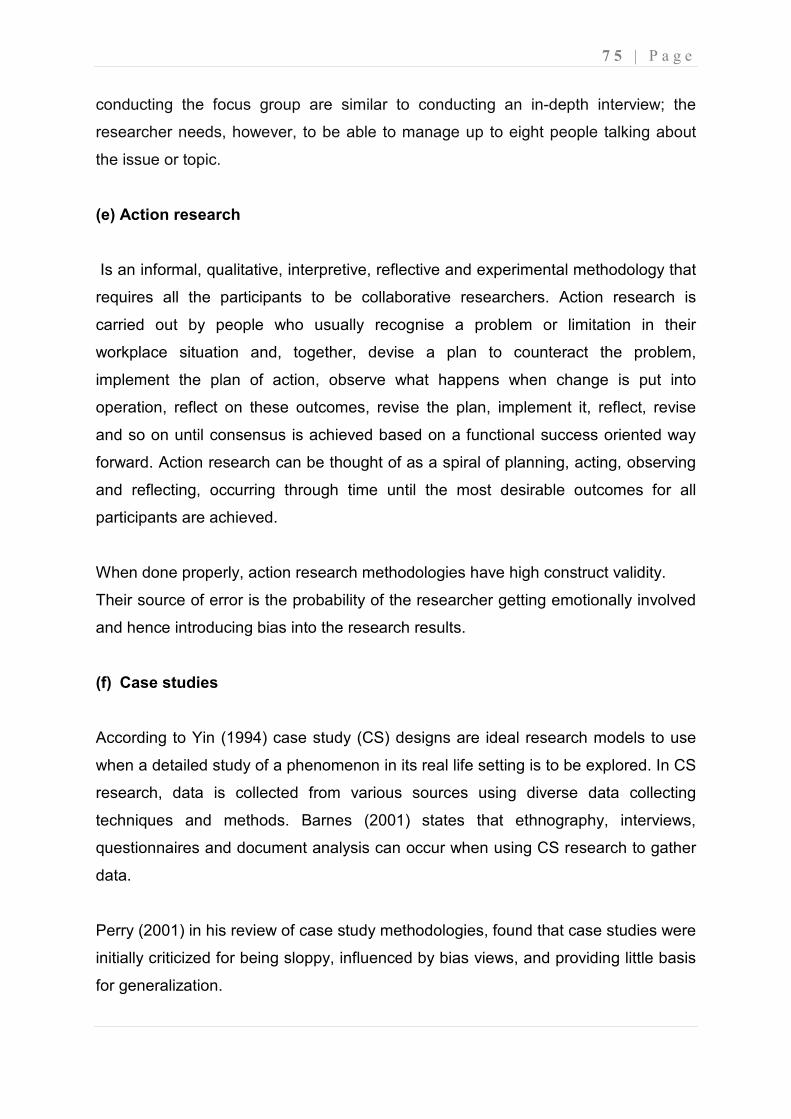
7 5 | P a g e
conducting the focus group are similar to conducting an in-depth interview; the
researcher needs, however, to be able to manage up to eight people talking about
the issue or topic.
(e) Action research
Is an informal, qualitative, interpretive, reflective and experimental methodology that
requires all the participants to be collaborative researchers. Action research is
carried out by people who usually recognise a problem or limitation in their
workplace situation and, together, devise a plan to counteract the problem,
implement the plan of action, observe what happens when change is put into
operation, reflect on these outcomes, revise the plan, implement it, reflect, revise
and so on until consensus is achieved based on a functional success oriented way
forward. Action research can be thought of as a spiral of planning, acting, observing
and reflecting, occurring through time until the most desirable outcomes for all
participants are achieved.
When done properly, action research methodologies have high construct validity.
Their source of error is the probability of the researcher getting emotionally involved
and hence introducing bias into the research results.
(f) Case studies
According to Yin (1994) case study (CS) designs are ideal research models to use
when a detailed study of a phenomenon in its real life setting is to be explored. In CS
research, data is collected from various sources using diverse data collecting
techniques and methods. Barnes (2001) states that ethnography, interviews,
questionnaires and document analysis can occur when using CS research to gather
data.
Perry (2001) in his review of case study methodologies, found that case studies were
initially criticized for being sloppy, influenced by bias views, and providing little basis
for generalization.
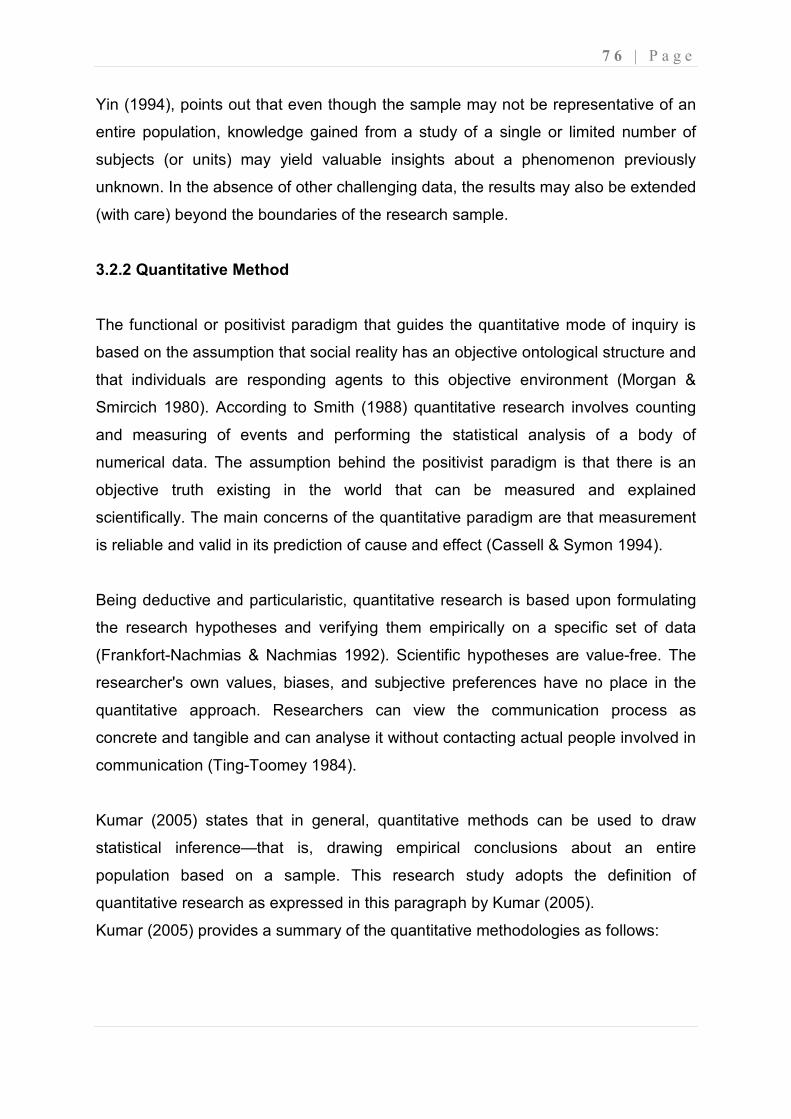
7 6 | P a g e
Yin (1994), points out that even though the sample may not be representative of an
entire population, knowledge gained from a study of a single or limited number of
subjects (or units) may yield valuable insights about a phenomenon previously
unknown. In the absence of other challenging data, the results may also be extended
(with care) beyond the boundaries of the research sample.
3.2.2 Quantitative Method
The functional or positivist paradigm that guides the quantitative mode of inquiry is
based on the assumption that social reality has an objective ontological structure and
that individuals are responding agents to this objective environment (Morgan &
Smircich 1980). According to Smith (1988) quantitative research involves counting
and measuring of events and performing the statistical analysis of a body of
numerical data. The assumption behind the positivist paradigm is that there is an
objective truth existing in the world that can be measured and explained
scientifically. The main concerns of the quantitative paradigm are that measurement
is reliable and valid in its prediction of cause and effect (Cassell & Symon 1994).
Being deductive and particularistic, quantitative research is based upon formulating
the research hypotheses and verifying them empirically on a specific set of data
(Frankfort-Nachmias & Nachmias 1992). Scientific hypotheses are value-free. The
researcher's own values, biases, and subjective preferences have no place in the
quantitative approach. Researchers can view the communication process as
concrete and tangible and can analyse it without contacting actual people involved in
communication (Ting-Toomey 1984).
Kumar (2005) states that in general, quantitative methods can be used to draw
statistical inference—that is, drawing empirical conclusions about an entire
population based on a sample. This research study adopts the definition of
quantitative research as expressed in this paragraph by Kumar (2005).
Kumar (2005) provides a summary of the quantitative methodologies as follows:
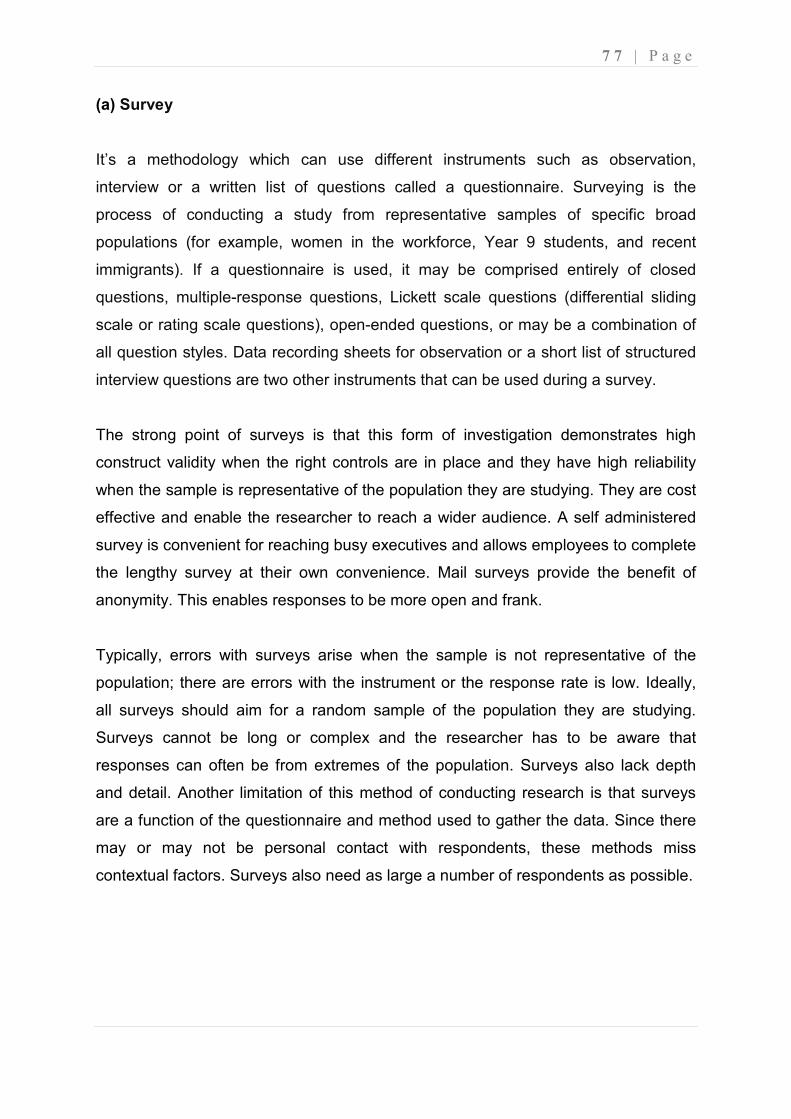
7 7 | P a g e
(a) Survey
It’s a methodology which can use different instruments such as observation,
interview or a written list of questions called a questionnaire. Surveying is the
process of conducting a study from representative samples of specific broad
populations (for example, women in the workforce, Year 9 students, and recent
immigrants). If a questionnaire is used, it may be comprised entirely of closed
questions, multiple-response questions, Lickett scale questions (differential sliding
scale or rating scale questions), open-ended questions, or may be a combination of
all question styles. Data recording sheets for observation or a short list of structured
interview questions are two other instruments that can be used during a survey.
The strong point of surveys is that this form of investigation demonstrates high
construct validity when the right controls are in place and they have high reliability
when the sample is representative of the population they are studying. They are cost
effective and enable the researcher to reach a wider audience. A self administered
survey is convenient for reaching busy executives and allows employees to complete
the lengthy survey at their own convenience. Mail surveys provide the benefit of
anonymity. This enables responses to be more open and frank.
Typically, errors with surveys arise when the sample is not representative of the
population; there are errors with the instrument or the response rate is low. Ideally,
all surveys should aim for a random sample of the population they are studying.
Surveys cannot be long or complex and the researcher has to be aware that
responses can often be from extremes of the population. Surveys also lack depth
and detail. Another limitation of this method of conducting research is that surveys
are a function of the questionnaire and method used to gather the data. Since there
may or may not be personal contact with respondents, these methods miss
contextual factors. Surveys also need as large a number of respondents as possible.
7 8 | P a g e
(b) Observation
This methodology involves watching and recording behaviours within a clearly
defined area. The researcher plays the role of passive observer and is, therefore,
outside the action/s being observed and recorded.
(c) Questionnaire
A questionnaire is a commonplace instrument for collecting data beyond the physical
reach of the researcher, that is, from a large or diverse sample of people. It is an
impersonal instrument for collecting information and must, therefore, contain clear
questions, worded as simply as possible to avoid any confusion or ambiguity since
the researcher probably will not be present to explain what was meant by any one
particular question. The questionnaire should be designed to fulfil a specific research
objective; it should be brief and the sequence of the questions logical.
(d) Statistical analysis
Statistical analysis involves examining data to interpret meaning, make
generalisations and extrapolate trends. Often the data is presented in graphical form
and because these data are expressed in the language of mathematics, they should
be evaluated and interpreted by means of appropriate mathematical or statistical
procedures.
Kumar (2005) states that from the point of view of the mode of enquiry, there are two
types of research: quantitative and qualitative. The main objective of qualitative
research is to describe the variation in a phenomenon, situation or attitude, whereas
quantitative research, in addition, helps the researcher to quantify or measure the
variation (Kumar, 2005).
Kumar (2005) summarizes the differences between these two research methods as
outlined in Table 3-1.
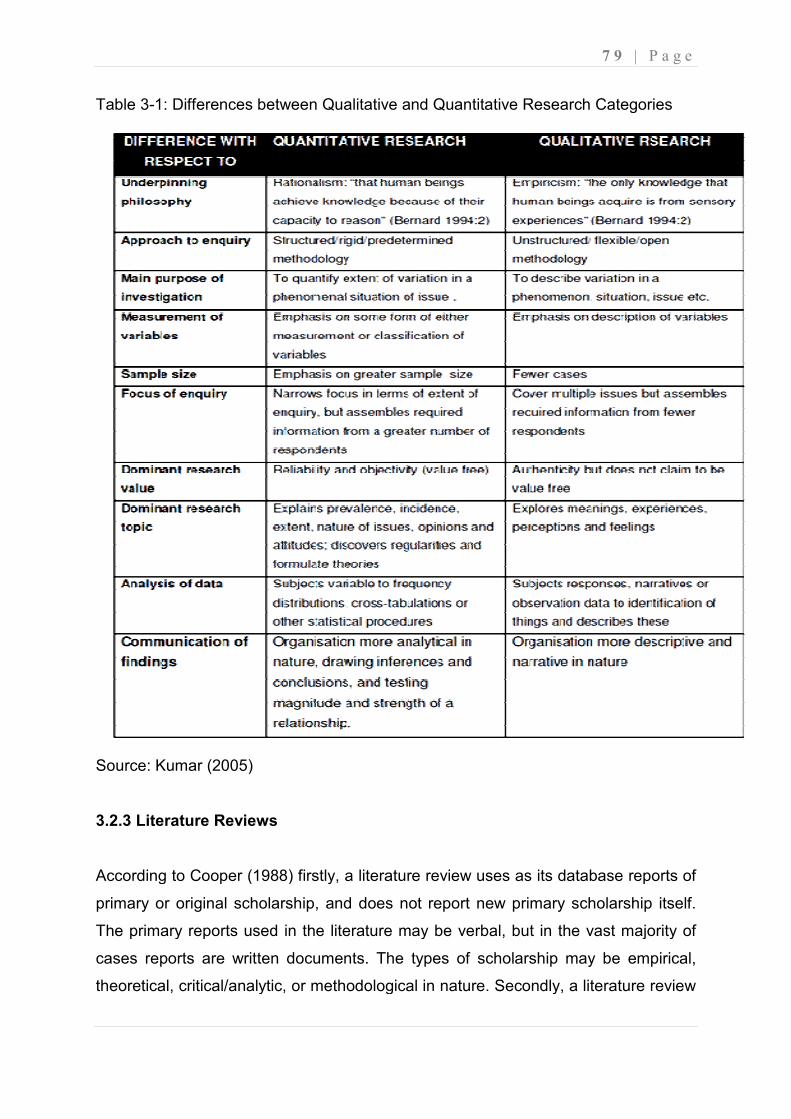
Table 3-1: Differences between Qualitative and Quantitative Research Categories
Source: Kumar (2005)
3.2.3 Literature Reviews
According to Cooper (1988) firstly, a literature review uses as its database reports of
primary or original scholarship, and does not report new primary scholarship itself.
The primary reports used in the literature may be verbal, but in the vast majority
cases reports are written documents. The types of scholarship may be empirical,
theoretical, critical/analytic, or methodological in nature. Secondly, a literature review
Differences between Qualitative and Quantitative Research Categories
According to Cooper (1988) firstly, a literature review uses as its database reports of
primary or original scholarship, and does not report new primary scholarship itself.
The primary reports used in the literature may be verbal, but in the vast majority
cases reports are written documents. The types of scholarship may be empirical,
theoretical, critical/analytic, or methodological in nature. Secondly, a literature review
7 9 | P a g e
Differences between Qualitative and Quantitative Research Categories
According to Cooper (1988) firstly, a literature review uses as its database reports of
primary or original scholarship, and does not report new primary scholarship itself.
The primary reports used in the literature may be verbal, but in the vast majority of
cases reports are written documents. The types of scholarship may be empirical,
theoretical, critical/analytic, or methodological in nature. Secondly, a literature review
8 0 | P a g e
seeks to describe, summarise, evaluate, clarify and/or integrate the content of
primary reports.
According to Bruce (1994) the review of relevant literature is nearly always a
standard chapter of a Dissertation or dissertation and is applied for both qualitative
and quantitative research methodologies. The review forms an important chapter in a
Dissertation where its purpose is to provide the background to and justification for
the research. Bruce (1994) further identifies a list; a search; a survey; a vehicle for
learning; a research facilitator; and a report as six elements of a literature review.
3.2.4 Secondary Data Analysis
The research designer has a wide variety of methods to consider, either singly or in
combination. They can be grouped first according to whether they use secondary or
primary sources of data. Secondary data are already available, because they were
collected for some purpose other than solving the present problem. Included here
are (1) the existing company information system; (2) databanks of other
organizations, including government sources such as the Census Bureau or trade
association studies and reports; and (3) syndicated data sources, such as consumer
purchase panels, where one organization collects reasonable standardized data for
use by client companies (Aaker, Kumar & Day 2001).
Aaker, Kumar & Day (2001) describes the many uses of secondary data by
researchers as follows:
• Secondary data may actually provide enough information to resolve the
problem being investigated.
• Secondary data can be a valuable source of new ideas that can be explored
later through primary research.
• Examining available secondary data is a prerequisite to collecting primary
data. It helps to define the problem and formulate hypotheses about its
solution.
8 1 | P a g e
• Secondary data is of use in the collection of primary data. Examining the
methodology and techniques employed by other investigators in similar
studies may be useful in planning the present one.
• Secondary data also helps to define the population, select the sample in
primary information collection, and define the parameters of primary research.
• Secondary data can also serve as a reference base against which to compare
the validity or accuracy of primary data. It may also be of value in establishing
classifications that are compatible with past studies so that trends may be
more readily analyzed.
According to Aaker, Kumar & Day (2001) the most significant benefits secondary
data offer a researcher are savings in cost and time. Secondary data research
involves just spending a few days in the library extracting the data and reporting
them. This should involve very little time, effort, and money compared to primary
research. Even if the data are bought from another source, it will turn out to be
cheaper than collecting primary data, because the cost of data collection is shared
by all those using the data (Aaker, Kumar & Day 2001).
3.2.5 Document Evaluation
Document analysis is the gathering of information used in a formal description of the
text; it also refers to studying and analyzing of the data, followed by processing and
understanding of the contents in the documents so that conclusions may be drawn
(Springer, 1998).
According to Bryman (1989) the materials employed in document analysis comprise
of a number of different types of information: written material such as letters, reports
to shareholders, memorandums, chief executive speeches, and company records
that provide data on absenteeism, profitability, size, budgets, newsDissertation
articles, company newsletters, closing plans and contracts. Moreover, the materials
can be relatively recent or historical
Martin (2000) further emphasize the relevancy of confidentiality during document
analysis by stating that due to the sensitive nature of some documents, the
8 2 | P a g e
consultant should reach an agreement with the client concerned as to which
documents should and should not be examined or used in the research report.
3.3 Integrating qualitative and quantitative research methods
Niglas (2000) states that in a long run there are three different widely advocated
positions towards the possibility and usefulness to use quantitative and qualitative
approaches in complimentary, combined or mixed ways:
The advocates of the first position, which Niglas (2000) call strong paradigmatic
view, declare that only one of those approaches is good/appropriate/scientific
enough for the inquiry about the social life. They say that quantitative and qualitative
research methodologies are tightly bound to different mutually exclusive
epistemological positions. From here follows that there is no point even to talk about
the possibility of combining or mixing of those approaches. The proponents of this
position are sometimes called purists.
The advocates of the second position, which Niglas (2000) call week paradigmatic
view, are somewhat more tolerant towards different methodologies saying that both
of them can be used and are useful, but as they carry with them different
philosophical underpinnings they are suitable in very different situations and contexts
and therefore one cannot and should not mix or combine quantitative and qualitative
approaches in the framework of one study. The proponents of this view are
sometimes called situationalists.
The advocates of the third position regard quantitative and qualitative approaches
both as useful and proper ways of going to study the social world. Although they see
some major differences between quantitative and qualitative research they also see
some important similarities between them and advocate the integrated use of
different methodologies if this can advance our understanding about the
phenomenon under the investigation. The proponents of this position are sometimes
called pragmatists.
According to Kinn & Curzio (2005) a growing number of authors argue that there is a
case for integrating qualitative and quantitative research methods (e.g. Goodwin and
8 3 | P a g e
Goodwin, 1984; Myers and Haase, 1989; McKinley, 1993; Barbour, 1999; Burnard
and Hannigan, 2000; Bourgeois, 2002). The two types of research are designed to
answer different sorts of questions, collect different types of data and produce
different types of answers (Barbour, 1999). Researchers have combined the two
approaches for a variety of reasons: for meeting different needs at different stages of
a project; compensating for shortcomings in any one method; and triangulation
(Mason, 1993; Ong, 1993; Barbour, 1999).
Denzin (1978) developed the concept of triangulation - the term that is probably most
widely used to denote any attempt to combine or mix different methods in a research
study. One could draw obvious parallels in how the terms 'paradigm' and
'triangulation' have lost their initial quite narrow and well-defined meaning and
became to denote something general and indefinite (Niglas 2000).
However, according to Niglas (2000), Denzin’s (1978) triangulation concept means
more than using multiple measurements of the same phenomenon - in addition to
the use of diverse data, it involves combining different methods and theories, as well
as perspectives of different investigators. Denzin (1978) has clearly identified four
different types of triangulation:
data triangulation - the use of variety of data sources and data sets in a study. Data
may be both qualitative and quantitative, gathered by different methods or by the
same method from different sources or at different times.
investigator triangulation - the use of several different researchers. Here the
importance of partnership and teamwork is underlined as the way of bringing in
different perspectives.
theory triangulation - the use of different theoretical viewpoints for determining
competing hypotheses as well as for interpreting the single set of data.
methodological triangulation - the use of multiple methods to study a single problem
or phenomenon. It may also include the use of the same method on different
occasions and situations.
8 4 | P a g e
It can be seen that the concept of triangulation is based on the assumption that by
using several data sources, methods and investigators one can neutralize bias
inherent in one particular data source, investigator or method (Jick 1979). It is often
stressed out that different methods have different weaknesses and strengths and
therefore the main effect triangulation can offer is to overcome the weaknesses of
any single method. Thus, if several different methods are used for investigation of
the phenomenon of our interest and the results provide mutual confirmation we can
be more sure that the results are valid (Niglas 2000). Within this context, quantitative
and qualitative approaches are usually seen as different ways of studying the same
phenomenon and able to answer the same research questions (Bryman 1988).
Niglas (2000) further states that although the perspective of triangulation seems to
be very promising several authors have warned about the hidden problems that the
combined use of qualitative and quantitative methods for the purposes of
triangulation can bring with it. Bryman (1992) has raised three alarming questions.
First, as quantitative and qualitative researches have different preoccupations it is
highly questionable whether they are tapping the same things even when they are
examining apparently similar issues. Second, if quantitative and qualitative findings
do not confirm each other how should the researcher respond. And third, if the
conflict in results is present what it actually means and comprises. Thus, in the
context of combining qualitative and quantitative approaches the concept of
triangulation is not as unproblematic as it may appear.
On the other hand in the wider framework of integrated use of qualitative and
quantitative approaches the triangulation is offering quite limited possibilities. As in
the case of triangulation the results of different methods are supposed to validate
each other, it means that different methods have to be highly independent
throughout the study. This approach excludes the possibility to mix quantitative and
qualitative aspects on different levels of investigation (Niglas 2000). However Brewer
& Hunter (1989, 81) classify studies into three categories: a) monomethod studies, b)
composite method studies, which combine some elements of the basic monomethod
styles and c) multimethod studies, which combine the basic styles of research. The
authors give their clear preference to the multimethod designs because according to
them composite methods 'comprise some of the basic methods' sources of strength'
8 5 | P a g e
and they 'fail to provide the opportunity for triangulated measurement and hypothesis
testing, and the protection against monomethod bias, that the multimethod strategy
provides' (Brewer and Hunter 1989, 81).
In Table 3-2, Niglas (2000) compares classifications of studies that different authors
have proposed. Studying their definitions of given categories it becomes clear that in
spite of different labels there are considerable similarities between classifications.
Although there are no one-to-one correspondents it seems feasible to organize
classifications into three columns so that categories in each column are conceptually
close to each other. Thus, the broad classification of studies into three categories is
useful and that definitions given by Tashakkori and Teddlie (1998) are conceptually
reasonable.
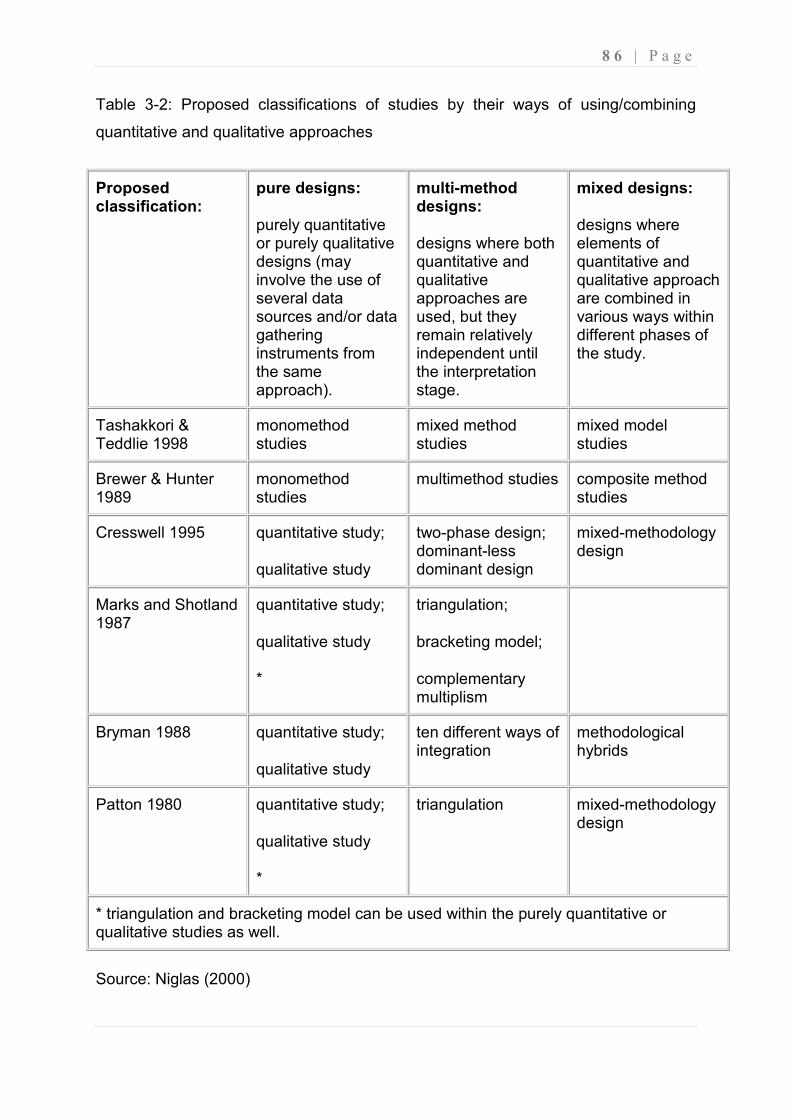
8 6 | P a g e
Table 3-2: Proposed classifications of studies by their ways of using/combining
quantitative and qualitative approaches
Proposed classification:
pure designs:
purely quantitative or purely qualitative designs (may involve the use of several data sources and/or data gathering instruments from the same approach).
multi-method designs:
designs where both quantitative and qualitative approaches are used, but they remain relatively independent until the interpretation stage.
mixed designs:
designs where elements of quantitative and qualitative approach are combined in various ways within different phases of the study.
Tashakkori & Teddlie 1998
monomethod studies
mixed method studies
mixed model studies
Brewer & Hunter 1989
monomethod studies
multimethod studies composite method studies
Cresswell 1995 quantitative study;
qualitative study
two-phase design; dominant-less dominant design
mixed-methodology design
Marks and Shotland 1987
quantitative study;
qualitative study
*
triangulation;
bracketing model;
complementary multiplism
Bryman 1988 quantitative study;
qualitative study
ten different ways of integration
methodological hybrids
Patton 1980 quantitative study;
qualitative study
*
triangulation mixed-methodology design
* triangulation and bracketing model can be used within the purely quantitative or qualitative studies as well.
Source: Niglas (2000)
8 7 | P a g e
3.4 Sampling Design
According to Cooper & Schindler (2003) the basic idea of sampling is that by
selecting some of the elements in a population – the total collection of elements
about which we wish to make some inferences – we may draw conclusions about the
entire population. There are several compelling reasons for sampling, including:
lower costs, greater accuracy of results, greater speed of data collection and
availability of population elements (Cooper & Schindler 2003).
3.4.1 Target Population
According to Zikmund (2003) the first question related to sampling concerns
identifying the target population, that is, the complete group of specific population
elements relevant to the research project. Vogel (2006) further emphasize this by
stating that, at the outset of the sampling process, it is vitally important to carefully
define the target population so that the proper source from which the data are to be
collected can be identified.
The target population for this research study is all the South African PSL Football
Clubs.
3.4.2 The sampling frame
According to Zikmund (2003) in actual practice the sample will be drawn from a list of
population elements that is often somewhat different from the target population that
has been defined. A sample frame is the list of elements from which the sample may
be drawn. It is generally not feasible to compile a list that does not exclude some
members of the population (Vogel 2006).
The sampling frame used in this research study is all the South African PSL Football
Clubs that are currently participating in the PSL and have never been relegated to
the lower league divisions in any of the previous seasons (between 2007/8 and
2010/11) under the sponsorship of ABSA.
8 8 | P a g e
3.4.3 Sampling units
Vogel (2006) states that, during the actual sampling process the elements of the
population must be selected according to a certain procedure. The sampling unit is a
single element or group subject to selection in the sample.
The sampling unit used in this research study is a single South African PSL Football
club that is currently participating in the PSL and have never been relegated to the
lower league divisions in any of the previous seasons (between 2007/8 and 2010/11)
under the sponsorship of ABSA.
3.4.4 Sampling method (Simple Random Sampling)
To ensure that the above unit is properly sampled, the researcher searched on the
PSL Website (www.psl.co.za) to obtain data on the final log standings between the
PSL seasons of 2007/8 to 2010/11. This information of the final log standings of
PSL clubs in the years 2007/8 to 2010/11 is found in Appendix B. The researcher
then analyzed the data and thereafter established all the clubs that qualify and those
that don’t qualify to be part of the intended population. The following criterion is used
to select a sample: Since the last two clubs on the log are relegated to the lower
league division, the researcher exclude these clubs that got relegated over the
selected league periods (between 2007/8 to 2010/11) from the population required
for this study.
The researcher then applied a simple random sampling method to choose the
appropriate sample for the purposes of this research. A Microsoft Excel Spreadsheet
tool was used to ensure the sample is obtained without any degree of error or bias
and that it complied with a probability sampling procedure.
All the PSL clubs that qualify as per the above criterion were then listed in one
column of the spreadsheet; a random sorting facility was utilized to ensure that any
club that becomes number one is chosen.
8 9 | P a g e
3.4.5 Sample size
As discussed in the section above, one South African PSL Football club is selected
as a sample that represents a broader group of all South African PSL Football clubs
for this research study. The selected club was approached using a combination of
phone calls, emails and personal visits to determine their willingness to participate in
the research study. As a precaution, if the selected club could have indicated their
unwillingness to participate in the study for one reasons or another, the next
available club, determined from the random sample generator would have been
approached, and so forth, until a suitable club was found that agreed to participate in
the study. The researcher assumed that not all of the eligible PSL clubs would have
refused to participate in the research study.
3.5 Research Design
3.5.1 Research Method
According to Kumar (2005) quantitative and qualitative research methodologies differ
in the philosophy that underpins their mode of inquiry as well as to some extent, in
methods, models and procedures used. Barnes (2001) further points out that every
research method has advantages and disadvantages and that there is no one right
approach to doing research. Some approaches are probably more applicable than
others and this may be determined by the specific objectives and purpose of the
research itself.
In Section 3.3 above, the various methods of triangulation were discussed. As
described by Denzin (1978) methodological triangulation involves the use of multiple
methods to study a single problem or phenomenon. It may also include the use of
the same method on different occasions and situations. With the advantage
presented by this methodology (of using multiple methods to study a single problem),
the researcher adopted this Triangulation approach as a research methodology to
use for this study.
9 0 | P a g e
In pursuance of the triangulation approach, the two-phased design model was
adopted for this study. A quantitative research using a Self-assessment survey
method and a qualitative research using an Interview method were used. However, a
qualitative assessment is considered a support tool for making an overall
assessment. Where the results of the qualitative assessment are marginal or where
the inputs are uncertain, then more weight is given to the quantitative assessment.
3.5.1.1 Measuring Instruments
A measurement instrument should be both valid and reliable. The validity of the
instrument is the extent to which the instrument measures what it is supposed to
measure. The reliability of the instrument is the consistency with which the
instrument yields a certain result if nothing has changed (Leedy & Ormrod 2005).
The following measuring instruments and tools were therefore used to conduct the
research and gather the necessary data from the respondents:
• Literature review (theory and practice) of Organizational Project Management
Maturity and its applicable models
• OPM3 Self-administered assessment survey questionnaire
• Interview
• Document evaluations.
3.5.1.1.1 Validity of the measurement instrument
According to Leedy & Ormrod (2005) the validity of the instrument can take four
different forms:
• Face validity: This is the extent to which the instrument looks like it is
measuring a particular characteristic.
• Content validity: This is the extent to which the instrument is representative of
the content area being measured.
9 1 | P a g e
• Criterion validity: This is the extent to which the instrument’s result correlates
with a similar, related instrument.
• Construct validity: This is the extent to which the instrument measures
characteristics that are not obtainable by observation.
The following steps wer taken to determine the validity of both the Self-assessment
and Interview questionnaires:
• Literature on project management was used to determine the questions
asked. This ensures content validity.
• The measurement instruments were tested on several project managers to
determine their efficiency. This ensures construct validity.
3.5.1.1.2 Reliability of the measurement instrument
According to Leedy & Ormrod (2005) the following forms of reliability can be defined:
• Inter-rater reliability: The extent to which two or more researchers evaluating
the same characteristic give the same results.
• Internal consistency reliability: The extent to which similar items in the
instrument yield the same results.
• Equivalent forms reliability: The extent to which different variants of the same
instrument yield similar results.
• Test-retest reliability: The extent to which the instrument will yield similar
results when used on different occasions
The following steps were taken to determine the reliability of the Self-assessment
and Interview questionnaires:
• Internal consistency reliability was increased by submitting the same
questionnaires to all the respondents throughout the sample drawn.
• Equivalent forms reliability was increased by obtaining the data in as little time
as possible.
9 2 | P a g e
3.5.2 Data Collection Strategies
With the research method defined as explained in the section above, the process of
gathering information from the respondents could begin. This is the process of Data
collection. Data collection is an important phase of any type of research study. When
collecting data, the researcher ensured that accurate and relevant information was
gathered as inaccurate information could impact negatively on the results of a study
and ultimately lead to invalid results.
The current study was based on the Triangulation multi-method research design
where both the quantitative and qualitative techniques were applied, and hence the
focus was only on the quantitative and qualitative data collection methods. In the
following sections, the researcher discusses in detail the quantitative and qualitative
data collection strategies that were used for this research study.
(i) Literature review
An extensive literature review based on past and current studies was conducted in
the areas of project management, project management maturity, and project
management maturity models by the researcher. The researcher established that
there are several different maturity models in practice even though there is no
universally accepted industry standard in place. This review of the literature has
enabled the researcher to accumulate much appropriate insight on the study and
based on that the researcher was able to select the project management maturity
model appropriate for the study.
The selection of the appropriate maturity model was critical to help achieve the
assessment objectives. The more recently published standard called OPM3
(Organizational Project Management Maturity Model) from the Project Management
Institute was selected as the model for this study. OPM3 is used as a Self-
assessment survey tool for collecting and capturing of information from respondents.
The purpose of assessment for the OPM3 model is to provide a description of the
current state of organizational project management maturity of the PSL Soccer club
9 3 | P a g e
case study. Detailed information about the OPM3 model is covered in Chapter 2 of
this research report.
(ii) OPM3 Self-assessment surveys The OPM3 was chosen as a model and used as a Self-assessment survey tool for
collecting data and capturing information from the respondents. According to
Khoshgoftar & Osman’s (2009) comparison of maturity models study, OPM3 is the
more suitable maturity model than others in terms of the selected variables used for
that study. The reasons are summarized as follows:
• Referring to the PMBOK (PMI 2004) as acceptable standard.
• considering strategic management
• Considering portfolio management, program management and project
management.
• Having continues approach while most of the other models have five maturity
level and are discrete
• Having 586 best practice and 2400 capability that show more details for this
model
• Date of issue that indicate this model is not old
• Publisher that is PMI, the most popular institute in the project management
• Having the assessment tools, this model use special software for analyzing
collected data
• Attention to the improvement
• Suggesting alternative for improvement
• Identifying the weakness and strong points by model
• Supported by PMI
• Emphasis to continuous improvement and priority of improvement
• Simple and understandable for user
• Using this model is not costly
• Executing of the model is easy
• This model is not related to the special industry
9 4 | P a g e
There are a couple of reasons why reference to PMI and its standard PMBOK are
highlighted as some of the reasons OPM3 is the more suitable maturity model than
other maturity models.
Firstly, according to PMI’s (2011) ‘PMBOK® Guide and Standards article’, PMI global
standards provide guidelines, rules and characteristics for project management.
These standards are widely accepted and, when consistently applied, they help the
user; the global peers and the organization achieve professional excellence. And
because they’re created and updated by both volunteer teams and the general
public, the user can be confident that their standards continually and accurately
reflect the evolving profession.
Secondly, according to PMI’s (2011) ‘What is PMI? Article’, PMI's 12 standards for
project, program and portfolio management is the most widely recognized standards
in the profession - and increasingly the model for project management in business
and government. They are developed and updated by thousands of PMI volunteers
with experience in every type of project, and provide a common language for project
management around the world (PMI 2011).
Thirdly, according to Project Smart (2011) the PMBOK is a collection of processes
and knowledge areas generally accepted as best practice within the project
management discipline. As an internationally recognised standard (IEEE Std 1490-
2003) it provides the fundamentals of project management, irrespective of the type of
project be it construction, software, engineering, automotive etc.
Lastly, the PMBOK is considered one of the most essential tools in the project
management profession and is the de facto global standard for the industry Project
Smart (2011).
According to PMI (2008) the OPM3 Self-assessment is a series of 151 Yes or No
questions falling into one of three categories: project, program and portfolio
management. Appendix C presents the Self-assessment survey template. The 151
questions are divided according to the following criteria:
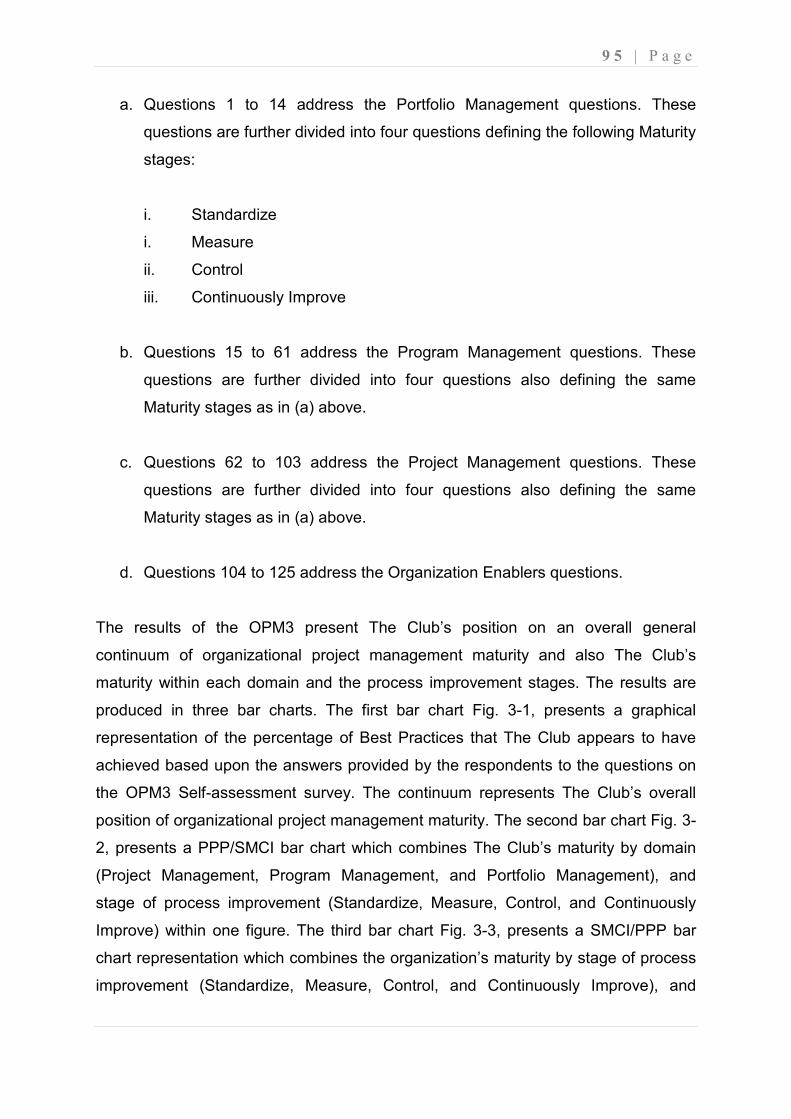
9 5 | P a g e
a. Questions 1 to 14 address the Portfolio Management questions. These
questions are further divided into four questions defining the following Maturity
stages:
i. Standardize
i. Measure
ii. Control
iii. Continuously Improve
b. Questions 15 to 61 address the Program Management questions. These
questions are further divided into four questions also defining the same
Maturity stages as in (a) above.
c. Questions 62 to 103 address the Project Management questions. These
questions are further divided into four questions also defining the same
Maturity stages as in (a) above.
d. Questions 104 to 125 address the Organization Enablers questions.
The results of the OPM3 present The Club’s position on an overall general
continuum of organizational project management maturity and also The Club’s
maturity within each domain and the process improvement stages. The results are
produced in three bar charts. The first bar chart Fig. 3-1, presents a graphical
representation of the percentage of Best Practices that The Club appears to have
achieved based upon the answers provided by the respondents to the questions on
the OPM3 Self-assessment survey. The continuum represents The Club’s overall
position of organizational project management maturity. The second bar chart Fig. 3-
2, presents a PPP/SMCI bar chart which combines The Club’s maturity by domain
(Project Management, Program Management, and Portfolio Management), and
stage of process improvement (Standardize, Measure, Control, and Continuously
Improve) within one figure. The third bar chart Fig. 3-3, presents a SMCI/PPP bar
chart representation which combines the organization’s maturity by stage of process
improvement (Standardize, Measure, Control, and Continuously Improve), and
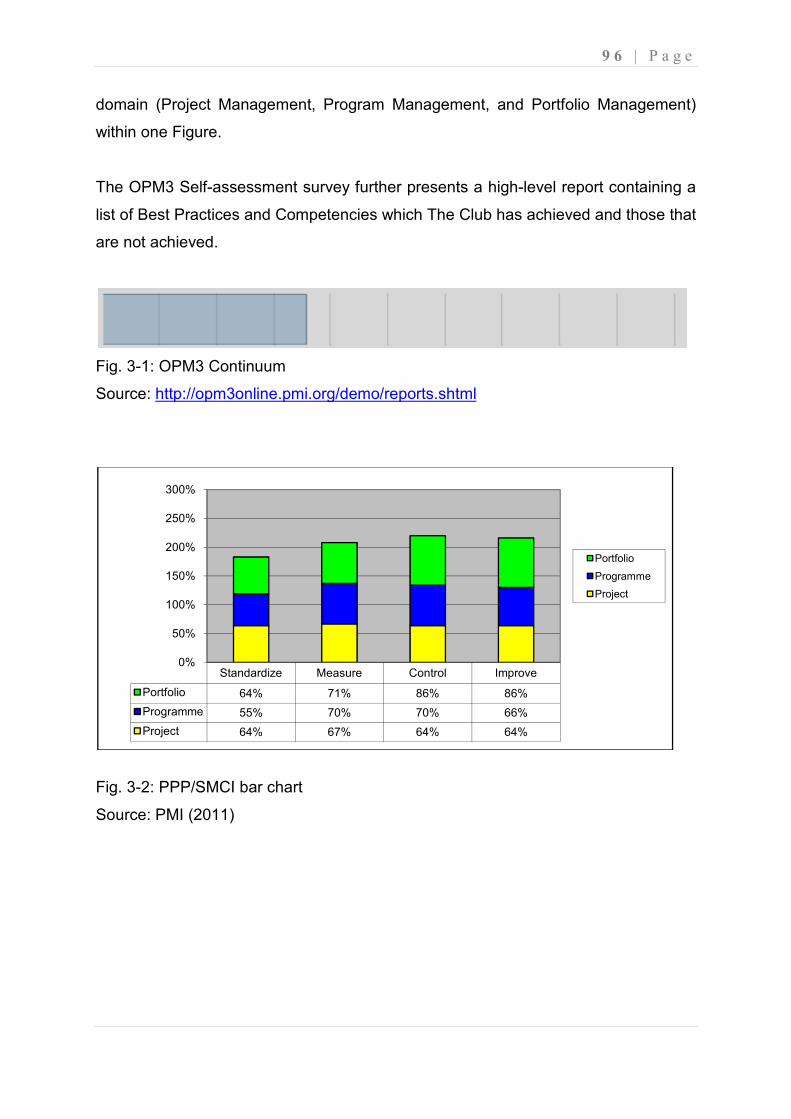
domain (Project Management, Program Management, and Portfolio Management)
within one Figure.
The OPM3 Self-assessment survey further presents a high
list of Best Practices and Competencies which The Club has achieved and those that
are not achieved.
Fig. 3-1: OPM3 Continuum
Source: http://opm3online.pmi.org/demo/reports.sh
Fig. 3-2: PPP/SMCI bar chart
Source: PMI (2011)
Standardize
Portfolio 64%
Programme 55%
Project 64%
0%
50%
100%
150%
200%
250%
300%
domain (Project Management, Program Management, and Portfolio Management)
assessment survey further presents a high-level report containing a
list of Best Practices and Competencies which The Club has achieved and those that
http://opm3online.pmi.org/demo/reports.shtml
PPP/SMCI bar chart
Measure Control Improve
71% 86% 86%
70% 70% 66%
67% 64% 64%
9 6 | P a g e
domain (Project Management, Program Management, and Portfolio Management)
eport containing a
list of Best Practices and Competencies which The Club has achieved and those that
Portfolio
Programme
Project
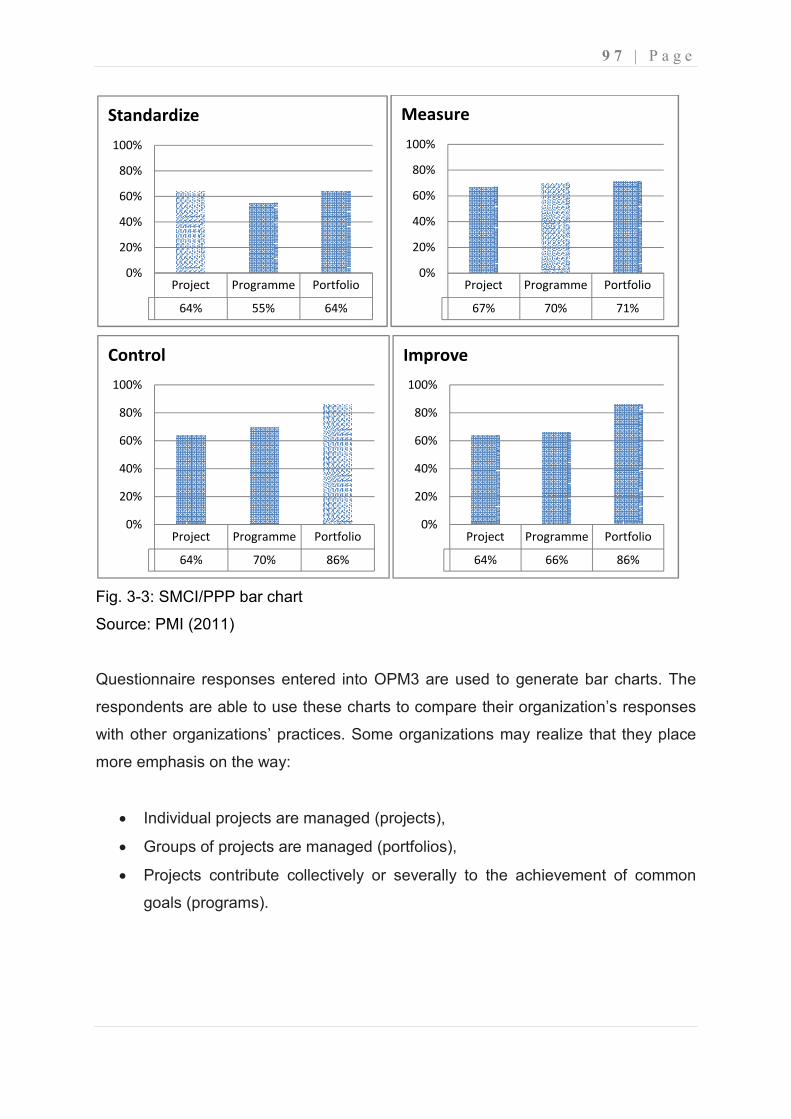
9 7 | P a g e
Fig. 3-3: SMCI/PPP bar chart
Source: PMI (2011)
Questionnaire responses entered into OPM3 are used to generate bar charts. The
respondents are able to use these charts to compare their organization’s responses
with other organizations’ practices. Some organizations may realize that they place
more emphasis on the way:
• Individual projects are managed (projects),
• Groups of projects are managed (portfolios),
• Projects contribute collectively or severally to the achievement of common
goals (programs).
Project Programme Portfolio
64% 55% 64%
0%
20%
40%
60%
80%
100%
Standardize
Project Programme Portfolio
67% 70% 71%
0%
20%
40%
60%
80%
100%
Measure
Project Programme Portfolio
64% 70% 86%
0%
20%
40%
60%
80%
100%
Control
Project Programme Portfolio
64% 66% 86%
0%
20%
40%
60%
80%
100%
Improve
9 8 | P a g e
The bar charts further display the emphasis of the responding organization on the
common process management categories:
• standardizing, measuring, controlling and improving processes,
• organizational elements,
• business elements to put the processes in place: policy, standards, training
and tools,
• actionable elements the PMO will use to implement the changes: methods,
procedures, techniques (such as the PMBOK and other PM practices).
It must be noted though that with the charts displaying user responses and providing
useful insight into organizational best practices, they cannot however express
whether the level of emphasis is the right one for any single organization, or the best
move to making improvements.
The club’s Senior Executive Management was responsible for recommending the
respondents. The respondents recommended were the Club/Team Manager, Media
liaison Manager, and Marketing. These respondents were selected because of their
senior positions and also being responsible for managing all of The Club’s high
priority/profile projects amongst them. The researcher provided the respondents with
the OPM3 directories which explain all the key concepts 2 days before the actual
survey took place. The researcher further provided a mini training to the respondents
on the day of the survey, to familiarise them with instructions of “How to Take the
OPM3 Self-Assessment” and “How to Interpret the Results.”
The respondents were given the Self-assessment survey questionnaire to complete
in full all the 151 questions and independent of each other. Once completed, the
researcher collected, compared and collated the responses in the presence of the
respondents. To avoid the ambiguity and exaggeration of responses, questions with
differing responses were debated by the respondents until consensus was reached
for the correct response. The survey took approximately 1hour per respondent to
complete and a further 2 hours was taken to clarify conflicting responses provided by
the respondents.
9 9 | P a g e
With the assistance of an independent OPM3 consultant, the finally agreed set of
responses were then taken and loaded into the OPM3 Self-assessment survey
online tool in accordance with the respondents’ responses to each question. When
completed with loading all the 151 answers given by all the respondents in the
OPM3 Self-assessment survey online tool, the researcher generated the
Assessment reports on the Self-Assessment tool.
The generated results provided two spreadsheets - one indicating the Best Practices
that the club appears to demonstrate and those Best Practices that the club does not
demonstrate, and the other sheet indicating charts. The Best Practices were grouped
in the order in which they are associated with each of the four stages of process
improvement.
The generated charts presented the following:
• The Club’s overall position on OPM3 continuum of Best Practices.
• The Club’s position on OPM3 continuum Maturity per Domain and Stage
(PPP/SCMI).
• The Club’s position on OPM3 continuum Maturity per Stage per Domain
(SCMI/ PPP).
The results of the survey will be covered in the Research Results chapter of the
study.
(iii) Interviews
According to Holmes & Walsh (2005) interviewing is one of the tools used by
assessors to compile the full breadth of information about the subject company that
is needed to complete the maturity assessment. Face-to-face interviewing may be
the most significant tool in the assessor’s toolbox, as it provides a bridge across the
relationship-gap between the assessor and the subject company employees.
1 0 0 | P a g e
As part of the data collection strategies, the researcher used an open-ended
interview questionnaire. The questionnaire was adopted from the Integrated
Management Systems Incorporated’s (IMSI) project management assessment
model.
Practitioners in the field have developed many maturity models for project
management. IMSI has examined a number of these candidate models, and from
this research, and the collective experiences of its employees, IMSI has developed
its own methodology for assessing the status of project management within a client
organization (Holmes & Walsh 2005).
According to Holmes & Walsh (2005) IMSI's project management assessment model
is a typical, five-step maturity model (see Figure 3-4), as this form provides a solid
foundation from which to build. IMSI does not, however, focus on reaching a maturity
rating for a company or organization. Instead, IMSI uses this model to guide an
evaluation of the levels of sophistication contained in various processes used by that
organization to manage its projects.
Holmes & Walsh (2005) further explain that the IMSI assessment model is employed
to identify incremental steps to improve how a company manages its projects and to
increase the likelihood of achieving project success. The IMSI assessment model
looks at each of the project management knowledge areas and the enablers, critical
elements and processes associated with them. If, as asserted earlier, the benefits
derived from project management increase in proportion to how well project
management processes are used, the intent of the IMSI project management
assessment model is to help organizations better use the project management
processes, elements, and enablers.
Appendix A contains a tabular summary of IMSI's PM Assessment Sheet,
segmented by the eight (8) key knowledge areas (Scope, Time, Cost, Quality, Risk,
HR, Communications, and Procurement). Each knowledge area is broken into
significant sub-elements, and for each sub-element, the model describes touch-
points on the continuum of improvement. While the model is characterized as a stair-
1 0 1 | P a g e
step process when shown graphically, it should more accurately be portrayed as a
series of slopes, up which an organization can travel Holmes & Walsh (2005).
The questionnaire contains a total of 95 questions. The IMSI’s open-ended Project
Management Assessment Interview Sheet is shown in Appendix E of this report. A
High priority list of projects was selected and forwarded as interview sample group
for the assessment by the Executive Management Team of The Club. These projects
were expected to represent various scopes of works, stages of lifecycle and contract
models. A key to the assessment was to interview the Project Managers and
Leaders as well as other team members for each project. This was expected to
provide insights from the various specialist services as well as project delivery within
the club.
The interview questions were aimed at evaluating five key competencies to score
project management capabilities and maturity level. These competencies include:
Needs Awareness; Organized & Documented; Bought In / Integrated; Portfolio, and
Improvement. An open questioning method was used to explore interviewees
understanding and application of the eight project management knowledge areas in
relation to the sample projects.
The above competencies are summarized in the following manner:
• Needs Awareness - Ad Hoc, No Formal PM Process
• Organized & Documented - Implementing a PM Methodology
• Bought In / Integrated - PM Practices used and Adapted
• Portfolio - PM Processes measured and Controlled
• Improvement - Focusing on Process Improvement
To effectively assess the above competences, the 95 interview questions were
divided into eight key competencies and twenty-six sub-components in the following
manner:
1 0 2 | P a g e
a. Scope Management: 12 questions. These questions are further divided into
the following five sub-components:
i. Scope Definition (3 questions)
ii. Requirements Definition (3 questions)
iii. Deliverables Identification (2 questions)
iv. Work Breakdown Structure (1 question)
v. Scope Change Control (3 questions)
b. Time Management: 11 questions. These questions are further divided into the
following two sub-components:
i. Schedule Development (9 questions)
ii. Schedule Integration (2 questions)
c. Cost Management: 16 questions. These questions are further divided into the
following four sub-components:
i. Project Cost Definition (9 questions)
ii. Resource Planning (1 question)
iii. Performance Measurement (4 questions)
iv. Cost Control (2 questions)
d. Quality Management: 13 questions. These questions are further divided into
the following three sub-components:
i. Quality Planning (7 questions)
ii. Quality Assurance (3 questions)
iii. Quality Control (3 questions)
e. Risk Management: 6 questions. These questions are further divided into the
following two sub-components:
i. Identification and Quantification (2 questions)
1 0 3 | P a g e
ii. Response Development and Documentation (4 questions)
f. HR Management: 15 questions. These questions are further divided into the
following four sub-components:
i. Organizational Planning (10 questions)
ii. Staff Acquisition (3 questions)
iii. Team development (1 question)
iv. Professional Development (1 question)
g. Communications Management: 10 questions. These questions are further
divided into the following four sub-components:
i. Communications Planning (4 questions)
ii. Information Distribution (2 questions)
iii. Performance Reporting (2 questions)
iv. Issue Tracking & Mgmt (2 questions)
h. Procurement Management: 3 questions. These questions are further divided
into the following two sub-components:
i. Procurement Planning (1 question)
ii. Solicitation / Source Control (2 questions)
The scores of the assessment were derived from a judgment-based scoring system,
to help determine a baseline understanding of the club’s current state of project
management maturity. The researcher used PMBOK as a standard against which
any comparative judgment is placed.
The answers to the above questions were first scored using the following rating 1:
Needs Awareness. 2: Organized and Documented. 3: Bought In / Integrated. 4:
Portfolio. 5: Improvement. The total scores under each competence were averaged
to provide the club’s present level of performance per knowledge area.
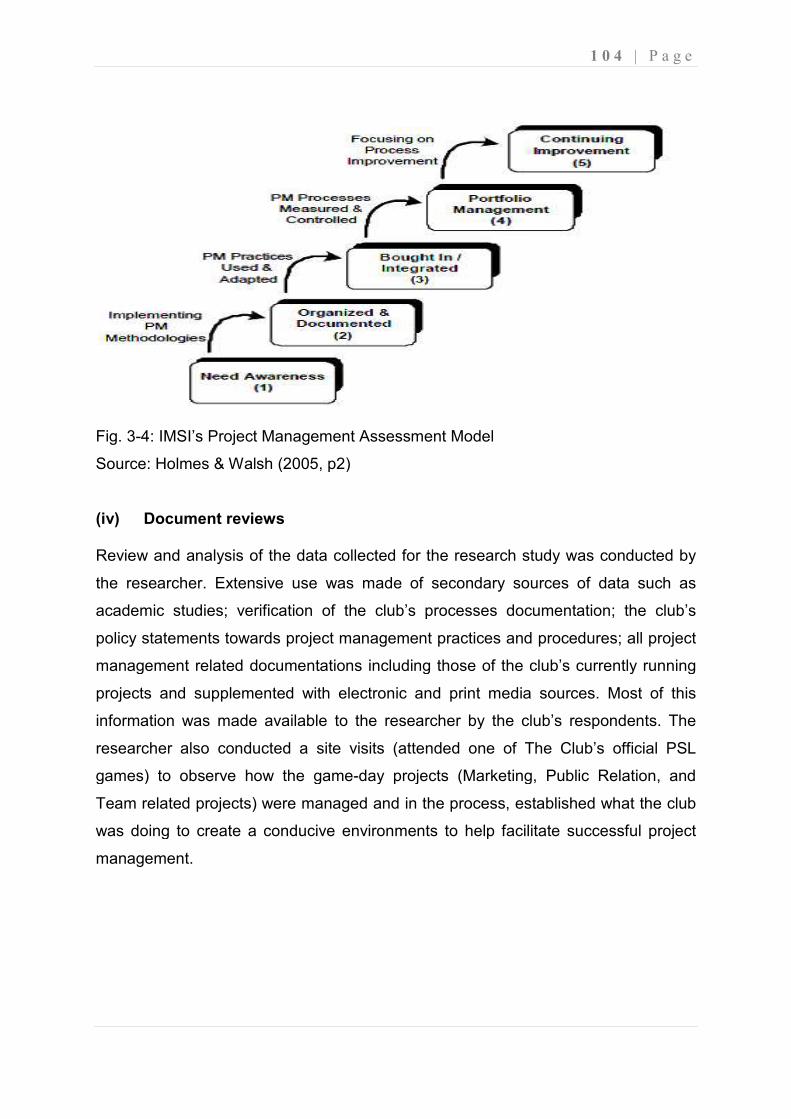
Fig. 3-4: IMSI’s Project Management Assessment
Source: Holmes & Walsh (2005, p2)
(iv) Document reviews Review and analysis of the data collected for the research study was conducted by
the researcher. Extensive use was made of secondary sources of data such as
academic studies; verification of the c
policy statements towards project management practices and procedures; all project
management related documentations including those of the club’s currently running
projects and supplemented with electronic and pri
information was made available to the researcher by the club’s respondents. The
researcher also conducted a site visits (attended one of The Club’s official PSL
games) to observe how the game
Team related projects) were managed and in the process, established what the club
was doing to create a conducive environments to help facilitate successful project
management.
4: IMSI’s Project Management Assessment Model
Holmes & Walsh (2005, p2)
Review and analysis of the data collected for the research study was conducted by
the researcher. Extensive use was made of secondary sources of data such as
academic studies; verification of the club’s processes documentation; the club’s
policy statements towards project management practices and procedures; all project
management related documentations including those of the club’s currently running
projects and supplemented with electronic and print media sources. Most of this
information was made available to the researcher by the club’s respondents. The
researcher also conducted a site visits (attended one of The Club’s official PSL
games) to observe how the game-day projects (Marketing, Public R
Team related projects) were managed and in the process, established what the club
was doing to create a conducive environments to help facilitate successful project
1 0 4 | P a g e
Review and analysis of the data collected for the research study was conducted by
the researcher. Extensive use was made of secondary sources of data such as
lub’s processes documentation; the club’s
policy statements towards project management practices and procedures; all project
management related documentations including those of the club’s currently running
nt media sources. Most of this
information was made available to the researcher by the club’s respondents. The
researcher also conducted a site visits (attended one of The Club’s official PSL
day projects (Marketing, Public Relation, and
Team related projects) were managed and in the process, established what the club
was doing to create a conducive environments to help facilitate successful project

1 0 5 | P a g e
3.6 Ethical Considerations
All ethical considerations requirements were observed by the researcher throughout
the study. As an example, the club requested that the anonymity of the respondents
as well as their managers should be protected in terms of not publishing any of their
personal details in the report that could be used to identify either the respondent or
the manager. The other requests were for the name of the club and its profile not to
be published in the research report, and only selected projects be used in the report.
All communication with the respondents was treated in the strictest confidence and
information was revealed to any external parties. All the above requests were
accepted by the researcher and no information pertaining to these requests is
communicated or published anywhere in this research report, or to any external
source.
3.7 Perceived Limitations of the Research
There appeared a couple of limitations to the study. Firstly The Club was reluctant to
participate in the study due to lack of understanding of the aims and objectives of the
study. It took a concerted effort from the researcher to persuade the senior
management to agree to this study. The researcher also used a personal internal
contact operating in a managerial position to assist with convincing senior
management. Secondly, it was challenging to get all the respondents available on
the same day due to their various projects and the PSL season being in full swing.
This delayed the data collection process, impacting negatively on the overall
research project completion readiness. Thirdly, due to some of the club’s HR
policies, some of the required information on projects such as financials were
regarded as confidential and could not be released for the study purposes. This
impacted on the quality of the data collected. Fourth, there was a non-disclosure
agreement between the researcher and The Club. This impacts on the quality of the
research report as some information about The Club (such as The Club’s profile and
other projects) cannot be reported in the research report document. Lastly, honesty
of the respondents in answering the survey and interview questions cannot really be
1 0 6 | P a g e
ascertained. This can impact negatively on the research results and the overall
project management position of the club.
3.8 Chapter Summary
This chapter discussed the research methodology, sampling design, and research
design of this study. The chapter firstly looked at the theory and practice of the
different research methodologies available for use in the study. The qualitative and
quantitative methods were discusses and compared to one another as the two types
of main research methods available. Mixed methods with special emphasis on
Triangulation were also discussed and highlighted as preferred method for this
current study. Other methods such as literature reviews, data analysis, and
documentation evaluation were also discussed.
Secondly, the sampling design methods were discussed and the selected methods
for this study identified. These include the target population, sampling frame,
sampling units, sampling method, and sample size. Thirdly, the chapter discussed
the research design undertaken in the study. The research method for this study was
explained and then the data collection strategies are also explained, with more
emphasis on PMI’s OPM3 Self Assessment survey as the main data collection tool
for this study, supported by the IMSI PM Maturity Assessment tool. A discussion of
how these tools are applied in this study was also presented. Justifications for
choosing these tools were also presented.
Lastly, the chapter discussed the ethical considerations for the study, and also
looked at the perceived research limitations that were experienced during the course
of the research. These limitations were identified and highlighted as compromising
the quality of the research report. The next chapter will present the study findings.
1 0 7 | P a g e
CHAPTER 4: RESEARCH RESULTS
4.1 Introduction
Chapter 3 discussed the research methods and procedures used in this study for
collecting and analyzing data. This chapter presents the results of “The Club”
obtained firstly through the application of OPM3 Self-assessment survey, and
secondly through the open-ended interview method as per the adopted hybrid,
triangulation approach undertaken for this study. Because of this hybrid approach,
two sets of results are presented; one covering results produced through the
application of quantitative research methods using OPM3 Self-assessment survey,
and the other covering results produced through the application of qualitative
research methods using open-ended interviews.
It is prudent, at this point in time, to note that the word “The Club” is used to describe
the PSL Club under study and their delegated questionnaire and interview
respondents are described as “The Respondents”. This is because of the agreement
reached between The Club and the researcher not to openly mention The Club’s
name and those is its employees. This is due to the reasons that the information
gathered conducting this study is regarded as confidential and may compromise The
Club’s competitive advantage if exposed to The Club’s competitors.
Table 4-1 provides a brief profile of the Three (3) Respondents which were
delegated to complete the questionnaires and respond to the interviews, highlighting
The Respondents’ positions, and their roles and responsibilities within The Club
structure. The Respondents were selected by The Club management due to them
being responsible for managing all of the high priority/profile projects between them
within The Club.
The Respondents were given the Self-assessment survey questionnaire to complete
in full and independent of each other. After completion, the researcher then
compared the responses provided by The Respondents, in their presence, and
where different responses were given, the concerned questions were discussed and
consensus was reached on the correct response by The Respondents. This assisted
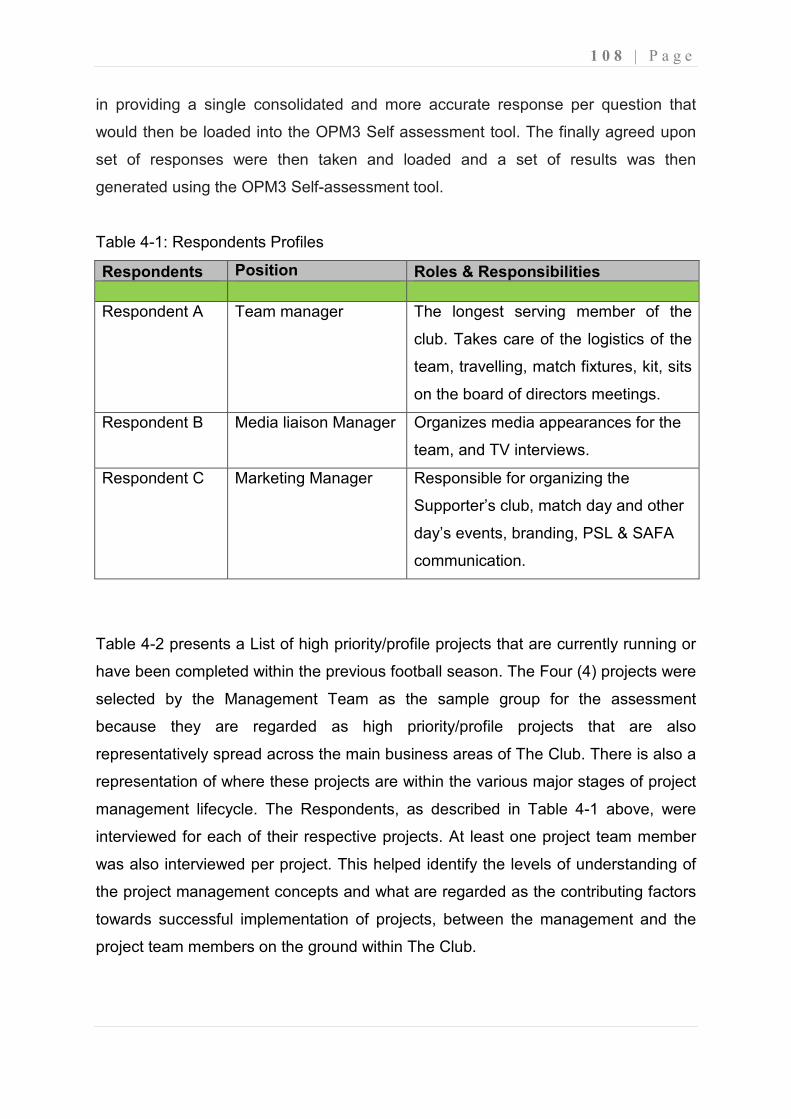
1 0 8 | P a g e
in providing a single consolidated and more accurate response per question that
would then be loaded into the OPM3 Self assessment tool. The finally agreed upon
set of responses were then taken and loaded and a set of results was then
generated using the OPM3 Self-assessment tool.
Table 4-1: Respondents Profiles
Respondents Position Roles & Responsibilities
Respondent A Team manager The longest serving member of the
club. Takes care of the logistics of the
team, travelling, match fixtures, kit, sits
on the board of directors meetings.
Respondent B Media liaison Manager Organizes media appearances for the
team, and TV interviews.
Respondent C Marketing Manager Responsible for organizing the
Supporter’s club, match day and other
day’s events, branding, PSL & SAFA
communication.
Table 4-2 presents a List of high priority/profile projects that are currently running or
have been completed within the previous football season. The Four (4) projects were
selected by the Management Team as the sample group for the assessment
because they are regarded as high priority/profile projects that are also
representatively spread across the main business areas of The Club. There is also a
representation of where these projects are within the various major stages of project
management lifecycle. The Respondents, as described in Table 4-1 above, were
interviewed for each of their respective projects. At least one project team member
was also interviewed per project. This helped identify the levels of understanding of
the project management concepts and what are regarded as the contributing factors
towards successful implementation of projects, between the management and the
project team members on the ground within The Club.
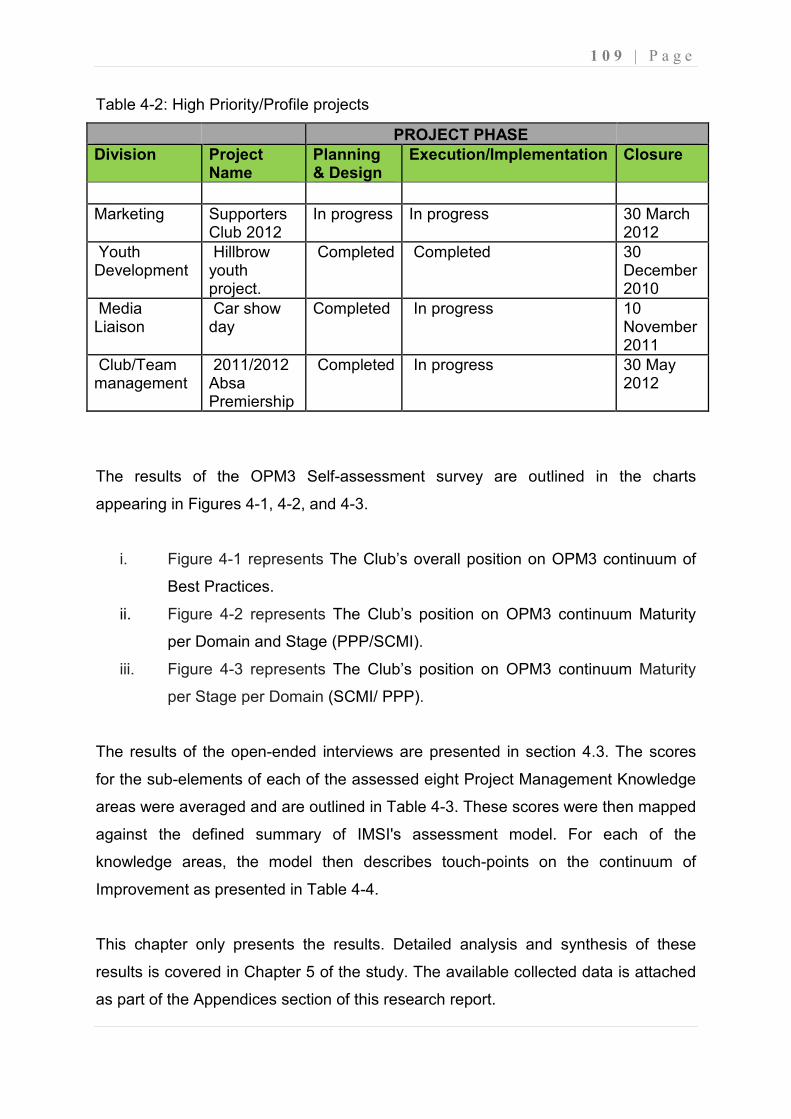
1 0 9 | P a g e
Table 4-2: High Priority/Profile projects
PROJECT PHASE
Division Project Name
Planning & Design
Execution/Implementation Closure
Marketing Supporters Club 2012
In progress In progress 30 March 2012
Youth Development
Hillbrow youth project.
Completed Completed 30 December 2010
Media Liaison
Car show day
Completed In progress 10 November 2011
Club/Team management
2011/2012 Absa Premiership
Completed In progress 30 May 2012
The results of the OPM3 Self-assessment survey are outlined in the charts
appearing in Figures 4-1, 4-2, and 4-3.
i. Figure 4-1 represents The Club’s overall position on OPM3 continuum of
Best Practices.
ii. Figure 4-2 represents The Club’s position on OPM3 continuum Maturity
per Domain and Stage (PPP/SCMI).
iii. Figure 4-3 represents The Club’s position on OPM3 continuum Maturity
per Stage per Domain (SCMI/ PPP).
The results of the open-ended interviews are presented in section 4.3. The scores
for the sub-elements of each of the assessed eight Project Management Knowledge
areas were averaged and are outlined in Table 4-3. These scores were then mapped
against the defined summary of IMSI's assessment model. For each of the
knowledge areas, the model then describes touch-points on the continuum of
Improvement as presented in Table 4-4.
This chapter only presents the results. Detailed analysis and synthesis of these
results is covered in Chapter 5 of the study. The available collected data is attached
as part of the Appendices section of this research report.
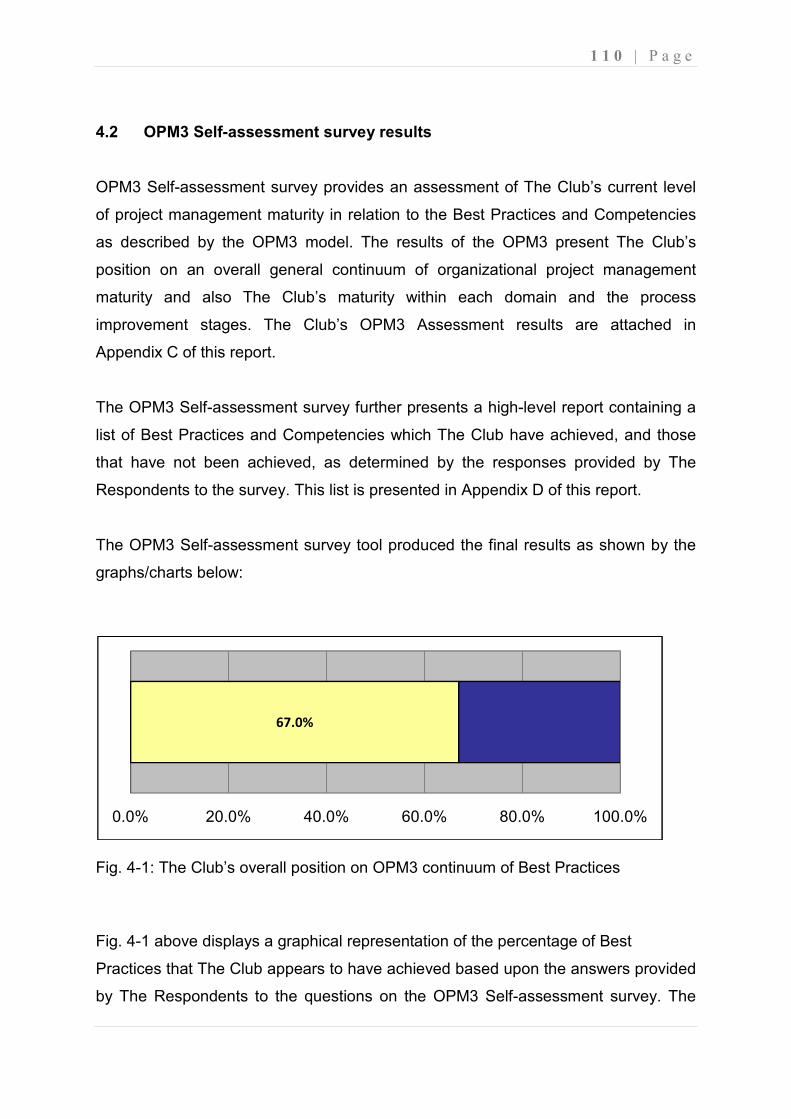
1 1 0 | P a g e
4.2 OPM3 Self-assessment survey results
OPM3 Self-assessment survey provides an assessment of The Club’s current level
of project management maturity in relation to the Best Practices and Competencies
as described by the OPM3 model. The results of the OPM3 present The Club’s
position on an overall general continuum of organizational project management
maturity and also The Club’s maturity within each domain and the process
improvement stages. The Club’s OPM3 Assessment results are attached in
Appendix C of this report.
The OPM3 Self-assessment survey further presents a high-level report containing a
list of Best Practices and Competencies which The Club have achieved, and those
that have not been achieved, as determined by the responses provided by The
Respondents to the survey. This list is presented in Appendix D of this report.
The OPM3 Self-assessment survey tool produced the final results as shown by the
graphs/charts below:
Fig. 4-1: The Club’s overall position on OPM3 continuum of Best Practices
Fig. 4-1 above displays a graphical representation of the percentage of Best
Practices that The Club appears to have achieved based upon the answers provided
by The Respondents to the questions on the OPM3 Self-assessment survey. The
67.0%
0.0% 20.0% 40.0% 60.0% 80.0% 100.0%
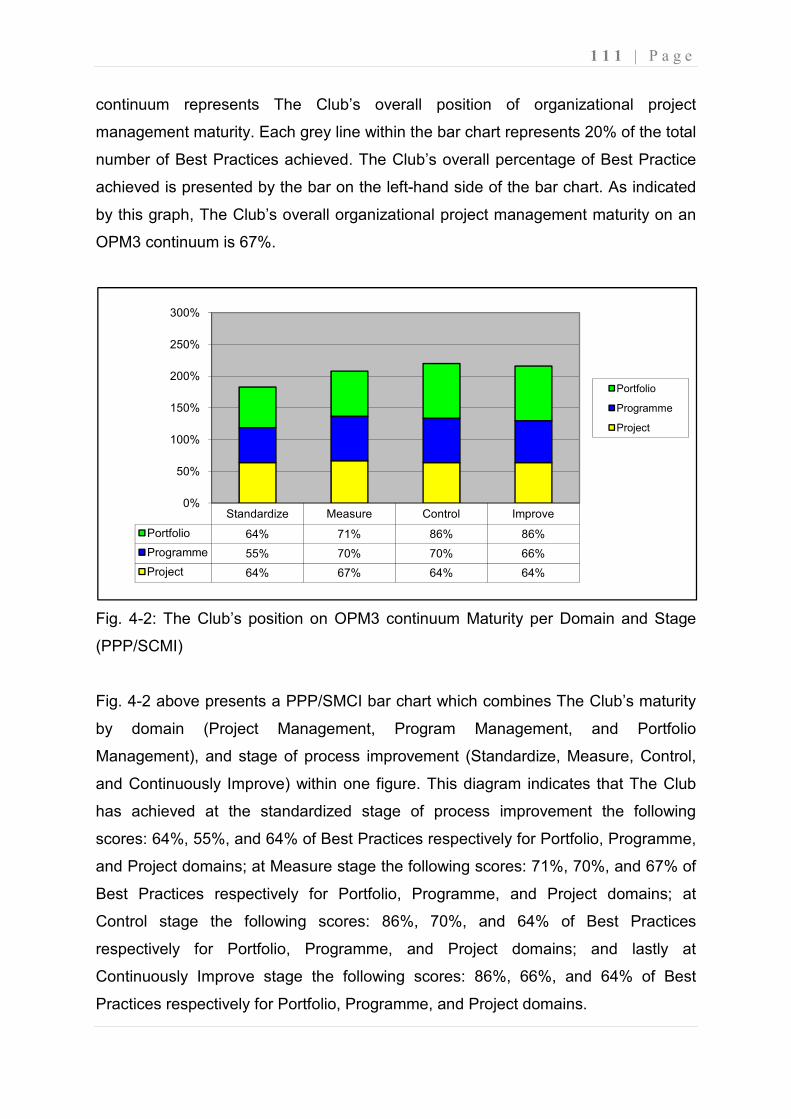
1 1 1 | P a g e
continuum represents The Club’s overall position of organizational project
management maturity. Each grey line within the bar chart represents 20% of the total
number of Best Practices achieved. The Club’s overall percentage of Best Practice
achieved is presented by the bar on the left-hand side of the bar chart. As indicated
by this graph, The Club’s overall organizational project management maturity on an
OPM3 continuum is 67%.
Fig. 4-2: The Club’s position on OPM3 continuum Maturity per Domain and Stage
(PPP/SCMI)
Fig. 4-2 above presents a PPP/SMCI bar chart which combines The Club’s maturity
by domain (Project Management, Program Management, and Portfolio
Management), and stage of process improvement (Standardize, Measure, Control,
and Continuously Improve) within one figure. This diagram indicates that The Club
has achieved at the standardized stage of process improvement the following
scores: 64%, 55%, and 64% of Best Practices respectively for Portfolio, Programme,
and Project domains; at Measure stage the following scores: 71%, 70%, and 67% of
Best Practices respectively for Portfolio, Programme, and Project domains; at
Control stage the following scores: 86%, 70%, and 64% of Best Practices
respectively for Portfolio, Programme, and Project domains; and lastly at
Continuously Improve stage the following scores: 86%, 66%, and 64% of Best
Practices respectively for Portfolio, Programme, and Project domains.
Standardize Measure Control Improve
Portfolio 64% 71% 86% 86%
Programme 55% 70% 70% 66%
Project 64% 67% 64% 64%
0%
50%
100%
150%
200%
250%
300%
Portfolio
Programme
Project
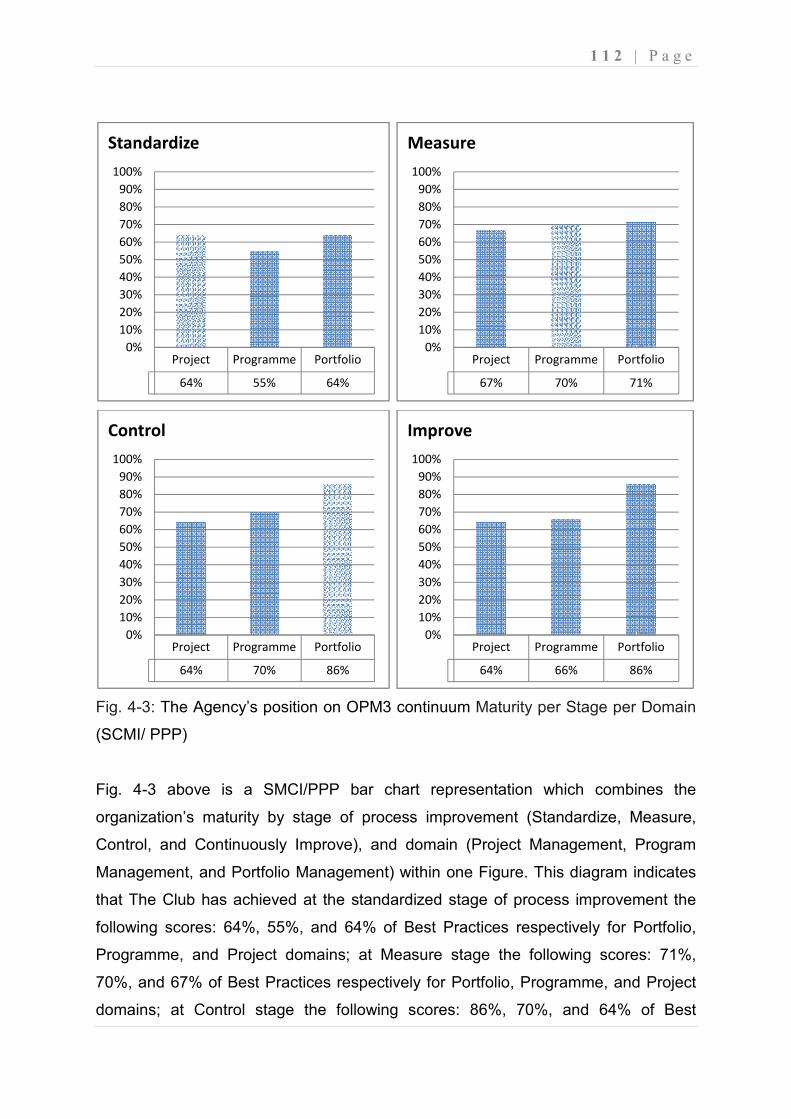
1 1 2 | P a g e
Fig. 4-3: The Agency’s position on OPM3 continuum Maturity per Stage per Domain
(SCMI/ PPP)
Fig. 4-3 above is a SMCI/PPP bar chart representation which combines the
organization’s maturity by stage of process improvement (Standardize, Measure,
Control, and Continuously Improve), and domain (Project Management, Program
Management, and Portfolio Management) within one Figure. This diagram indicates
that The Club has achieved at the standardized stage of process improvement the
following scores: 64%, 55%, and 64% of Best Practices respectively for Portfolio,
Programme, and Project domains; at Measure stage the following scores: 71%,
70%, and 67% of Best Practices respectively for Portfolio, Programme, and Project
domains; at Control stage the following scores: 86%, 70%, and 64% of Best
Project Programme Portfolio
64% 55% 64%
0%
10%
20%
30%
40%
50%
60%
70%
80%
90%
100%
Standardize
Project Programme Portfolio
67% 70% 71%
0%
10%
20%
30%
40%
50%
60%
70%
80%
90%
100%
Measure
Project Programme Portfolio
64% 70% 86%
0%
10%
20%
30%
40%
50%
60%
70%
80%
90%
100%
Control
Project Programme Portfolio
64% 66% 86%
0%
10%
20%
30%
40%
50%
60%
70%
80%
90%
100%
Improve
1 1 3 | P a g e
Practices respectively for Portfolio, Programme, and Project domains; and lastly at
Continuously Improve stage the following scores: 86%, 66%, and 64% of Best
Practices respectively for Portfolio, Programme, and Project domains.
4.3 IMSI Open-ended structured Interview results
The IMSI assessment model looks at each of the project management knowledge
areas and the enablers, critical elements and processes associated with them. The
researcher used the open-ended structured interviews and documentation review, to
assess The Club’s project management practices in relation the eight project
management body of knowledge (PMBOK) areas as provided by their sub-elements
maturity averaged scores.
According to Holmes & Walsh (2005) IMSI does not, however, focus on reaching a
maturity rating for a company or organization. Instead, IMSI uses this model to guide
an evaluation of the levels of sophistication of project management contained in
various processes used by that organization to manage its projects. It is on this
baseline assessment that recommendations for maturing of The Club’s various
project management processes’ level of sophistication within the individual Project
Management Knowledge areas will be based.
The information from the results is intended to benefit the entire South African PSL
football Clubs, therefore, the comparative judgment was made based on eight
components of project management body of knowledge (PMBOK) areas. A
judgment-based scoring system was also used to record the organization’s present
levels of sophistication of project management contained in various processes used
to manage the projects using the following rating scale: Needs Awareness;
Organized & Documented; Bought In / Integrated; Portfolio, and Improvement.
Each response to the interview question is assigned a numeric score value between
1.0 and 5.0. In this case, 1.0 represents the score indicating that limited or no project
management capability is practiced or applied by the organization which informs the
existence of the key sub-elements under consideration. A score of 5.0 represent the
highest incremental score assigned only if the organization appears to have
1 1 4 | P a g e
achieved 100% of a project management capability which informs the existence of
the key sub-elements under consideration.
The results were evaluated using the following IMSI project management
assessment model maturity levels or competencies:
Level 1: Need Awareness 1.0 – 1.9 Level 2: Organized and Documented 2.0 – 2.9 Level 3: Bought In / Integrated 3.0 – 3.9 Level 4: Portfolio 4.0 – 4.9 Level 5: Improvement 5.0
The IMSI open-ended interview questionnaire used to assign a rating to each
question is comprised of 95 questions which in turn are divided into eight project
management knowledge areas comprising of twenty-six sub-elements. The list of
IMSI open-ended Project Management Assessment “As Is” Interview Sheet and
allocated ratings are shown in Appendix E of this report.
The ratings assigned to each sub-element response, as informed by the responses
provided by The Respondents, were added up and averaged from the ratings of
questions under those respective sub-elements. The total ratings attained under
each of the eight project management knowledge areas were averaged and then the
averaged total ratings provide a description of the touch-points on the continuum of
improvement that help The Club to better use the project management processes,
elements, and enablers for better management of their projects.
The total averaged ratings for each of the eight project management knowledge
areas are indicated in Table 4-3 below and are mapped in Table 4-4 to show the
current touch-points on the continuum of project management improvement per
knowledge area of The Club.
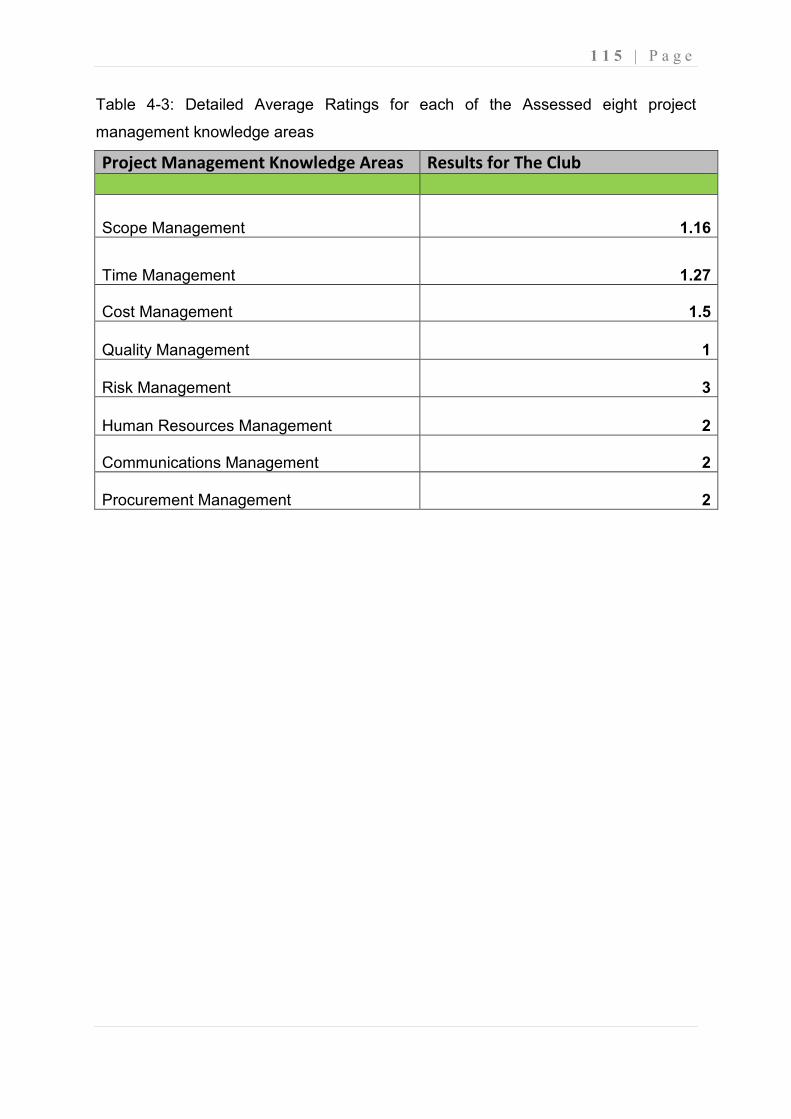
1 1 5 | P a g e
Table 4-3: Detailed Average Ratings for each of the Assessed eight project
management knowledge areas
Project Management Knowledge Areas Results for The Club
Scope Management 1.16
Time Management 1.27
Cost Management 1.5
Quality Management 1
Risk Management 3
Human Resources Management 2
Communications Management 2
Procurement Management 2
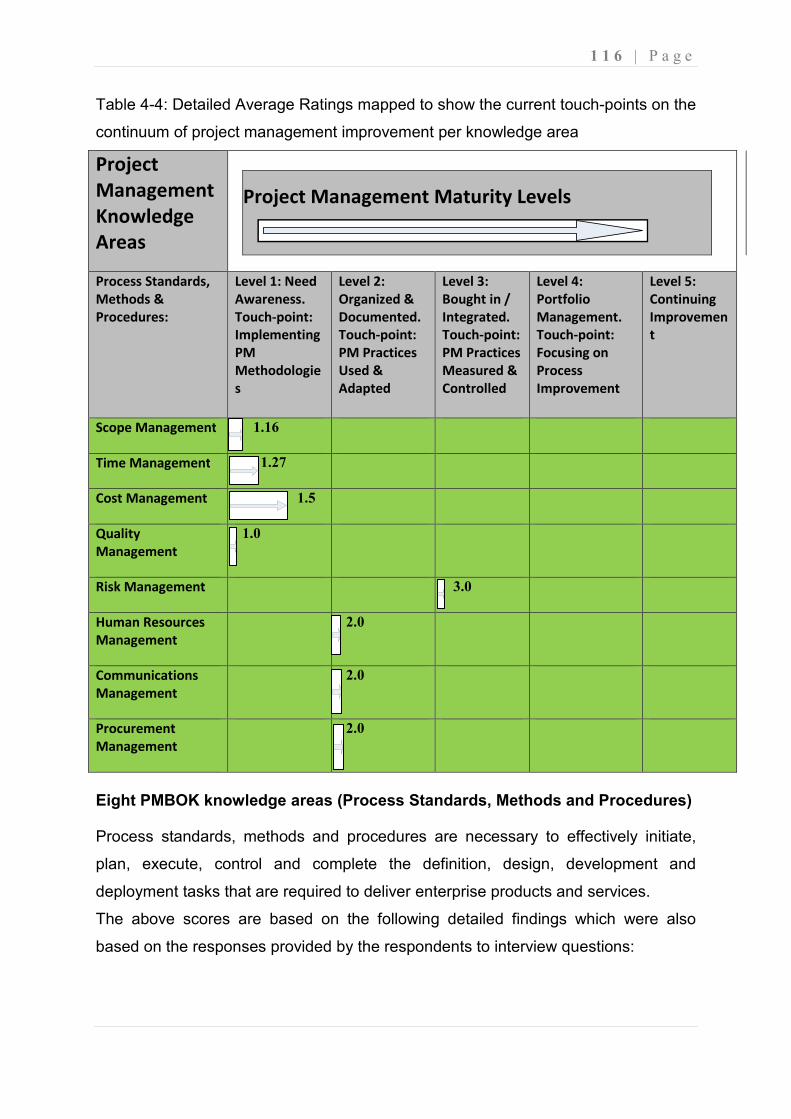
1 1 6 | P a g e
Table 4-4: Detailed Average Ratings mapped to show the current touch-points on the
continuum of project management improvement per knowledge area
Project
Management
Knowledge
Areas
Project Management Maturity Levels
Process Standards,
Methods &
Procedures:
Level 1: Need
Awareness.
Touch-point:
Implementing
PM
Methodologie
s
Level 2:
Organized &
Documented.
Touch-point:
PM Practices
Used &
Adapted
Level 3:
Bought in /
Integrated.
Touch-point:
PM Practices
Measured &
Controlled
Level 4:
Portfolio
Management.
Touch-point:
Focusing on
Process
Improvement
Level 5:
Continuing
Improvemen
t
Scope Management
1.16
Time Management
1.2 1.27
Cost Management
1.5
Quality
Management
1.0
Risk Management
3.0
Human Resources
Management
2.0
Communications
Management
2.0
Procurement
Management
2.0
Eight PMBOK knowledge areas (Process Standards, Methods and Procedures)
Process standards, methods and procedures are necessary to effectively initiate,
plan, execute, control and complete the definition, design, development and
deployment tasks that are required to deliver enterprise products and services.
The above scores are based on the following detailed findings which were also
based on the responses provided by the respondents to interview questions:
1 1 7 | P a g e
Scope Management
Average score obtained = 1.16
Under Scope Management the processes required to ensure that the project work
completes successfully are covered.
Current status: The Club currently displays that little or non-standard
documentations are used for project scope management. No visible and clearly
defined process for scope management plan is in place. Management has
knowledge about key milestones that needs to be achieved.
• There are no systems/tools currently in use to manage the project scope.
• There is no standard documentation for project scope management. Each
project manager uses their own templates.
• No standard documentation for gathering and documenting business
requirements.
• The scope is determined by The Club management according to their
respective Targets.
• There is no product oriented WBS in place.
• Scope change is determined by The Club management. No scope change
control process is in place.
• A program called Amiseo is used as a standard way to gather and document
technical requirements.
Time Management
Average score obtained = 1.27
Project Time Management refers to the processes required to ensure a timely
completion of the project.
Current status: The Club currently displays no visible established planning or
scheduling standards. There is also lack of documentation which makes it difficult to
achieve repeatable project success.
1 1 8 | P a g e
• There are no specific documents and templates used for time management.
Project managers use their own templates for planning and scheduling project
activities, which are mostly based on Excel spreadsheets. Activity scheduling
is very informal.
• There are no software or systems tools used for time management.
• Though there are internal standards for project schedules, the project
schedules rarely reflect the product development process.
• The project schedule rarely identifies the deliverables.
• The project managers revises the schedule as required with no use of
baselines, and only the Club manager or CEO are the only people responsible
for approving the project schedules and workload within the project teams.
• Project schedules are reviewed in monthly meetings attended by Marketing,
Media, Team, and Finance management departments, where the CEO
approves the project schedules.
• Team leaders classify the work of the people in their team between projects.
• Resource planning for a project is done based on the budget allocated by The
Club CEO.
• No documentation recovery plans or workaround plans are in place.
• Links between tasks across the functional departments are not formally
established and communicated.
Cost Management
Average score obtained = 1.5
Project Cost Management refers to processes required for ensuring that the project
activities do not exceed the approved budget.
Current status: The Club currently displays no established practices or standards.
Cost process documentation is ad hoc and individual project teams follow informal
practices for cost management.
1 1 9 | P a g e
• There is no cost management system in place which makes it difficult to
manage costs effectively.
• There is an expenditure plan in place and budgets are time-phased.
• Project managers and leaders generally have little knowledge of, interest in,
or control over project costs.
• Cost estimating is prepared by Finance department with the estimated inputs
gathered from the functional departments’ management. This normally results
in over-estimating the costs for most projects as functional management avoid
having to perform another estimation exercise.
• Project managers are responsible for tracking projects costs with no formal
practice used.
• Hours spent on projects are not adequately tracked to budgets using tools
such as timecards.
Quality Management
Average score obtained = 1.0
Project Quality Management includes the processes required to ensure that the
project will satisfy the needs for which it was undertaken.
Current status: The Club currently displays no visible established project quality
practices or standards. There is no clearly defined process for quality management
plan.
• There is no quality management strategy in place. Project quality for different
projects is managed differently according to the project manager.
• There are no quality goals methods and systems established for each project.
• There are no metrics for service quality performance as part of the project
development methodology for projects.
• There are no systems or reports in place to track progress against the
elements of quality control standards.
• There are no Club standards established for quality management.
1 2 0 | P a g e
Risk Management
Average score obtained = 3.0
Project Risk Management involves a process of systematically identifying, analyzing,
controlling and mitigating project risk.
Current status: The Club currently displays more visible, organized, clearly defined
and documented process for risk management plan. Risk management processes
are utilized for most projects. Metrics are used to support risk decisions at the project
and the program levels.
• There consists a consistent risk management strategy. Risks are consistently
identified, documented and tracked.
• There are defined processes in place to measure deliverable risk. Matches
are rated according to categories A (high profile match), B (medium profile
match) & C (low profile match) and a risk plan implemented according to a
classified category.
• Joined Club security, Police, and the Johannesburg Metro Police Department
are used in the risk management process
• Security plan, police clearance certificate, and PSL match meeting reports are
used as documents for capturing the project risk management plan.
• PSL match committee meetings are used to address risk planning. There are
formal risk plans for some projects such as match day projects, but this is not
consistent across the rest of the projects.
Human Resource Management
Average score obtained = 2.0
Project Human Resource Management involves the processes required to effectively
identify the requisite skill sets required for specific project activities, utilize the human
1 2 1 | P a g e
and other resources involved within the project for ensuring high productivity of those
resources for the successful implementation of projects.
Current status: The Club currently displays defined and repeatable processes for
HR management plan. Resource tracking is performed in high profile projects.
• There is an established PMO within The Club.
• There are written project management procedures manual from the PSL to
foster a standardized project management approach.
• The match meeting reports, team sheets reports, marketing reports, and
media campaigns reports are used as documentation to support project
management within the Club.
• Marketing manager, Team manager, Media officer are regarded as project
management champions for the Club.
• Project managers and project team members’ roles are clearly defined.
• All necessary skills are defined for project management roles.
• Internal grooming to be a project manager is normally done from the Sales
and Marketing departments, and team management departments.
• There are no formal project management training programmes provided that
leads to professional certification.
• There is an obvious lack of qualified project management professionals to
help carry out project management responsibilities according to best
practices.
• Some people are “accidentally” assigned to project manager position, but not
trained to be project managers.
Communications Management
Average score obtained = 2.0
Project Communications Management includes the processes of managing the
project data collection to categorization, dissemination, utilization and decision
making.
1 2 2 | P a g e
Current status: The Club currently displays defined basic process where large,
highly visible projects follow the process and provide progress reporting.
• There is an existing process for project communication management plan
carried out for high visibility projects.
• Status, progress and phase completion reports are in place such as the match
meeting reports and technical staff reports.
• Basic information retrieval and distribution process is in place for distributing
reports such as technical and youth development program.
• Reported issues are tracked and resolution plans discussed in Club meetings
and reviewed with impacted or affected departments’ management.
• Internal cross team communication occurs only through the Club meetings.
This kind of meetings are not entirely completely effective as a means of
sharing status and commitment information as people who are not part of
these meetings do not get the information on time to enable them to
effectively drive project deliverables.
Procurement Management
Average score obtained = 2.0
Project Procurement Management includes the processes required to acquire goods
and services. It also includes activities in managing the contract throughout the
period of performance and closing the contract upon completion.
• Basic process is documented for procurement of goods and services which is
mostly utilized by highly visible projects such as marketing projects.
• Schedules and cost targets are available during purchasing process and are
tracked by purchase orders that must be approved by the finance division.
• Quality and timing of goods and services such as the players training and
official match attires and equipments are specified to the vendors and the
vendors submit their delivery plans.
1 2 3 | P a g e
4.4 Chapter Summary
This chapter presented the research results obtained from conducting both the
OPM3 Self assessment survey and the open-ended subjective based assessment
interviews. Firstly, the OPM3 Self assessment survey results are presented and their
corresponding charts also reflected. The results of OPM3 Self – assessment survey
are presented in Figures:
• Figure 4-1, presenting The Club’s overall position on OPM3 continuum of Best Practices;
• Figure 4-2, presenting The Club’s position on OPM3 continuum Maturity per
Domain and Stage (PPP/SCMI); and
• Figure 4-3, presenting The Club’s position on OPM3 continuum Maturity per
Stage per Domain (SCMI/ PPP).
Lastly the open-ended interview results obtained using the IMSI’s project
management assessment model are presented, showing the total averaged ratings
for each of the eight project management knowledge areas. The detailed Average
ratings for each of the assessed eight project management knowledge areas are
presented in Table 4-1 and are also mapped along the Project Management Maturity
Levels in Table 4-2 to show the current touch-points on the continuum of project
management improvement per knowledge area of The Club.
These Tables show the total averaged scores of maturity assigned to each
knowledge area based on the responses given by The Respondents to the questions
asked under each specific knowledge area.
By interpreting IMSI Project Management Maturity Assessment Sheet, it was
possible to assign appropriate numerical values to answers and to link the findings to
the define touch-points on the continuum of improvement according to the IMSI PM
Assessment model. Chapter 5 presents an analysis and synthesis of the results.
CHAPTER 5: SYNTHESIS AND ANALYSIS OF RESULTS
1 2 4 | P a g e
5.1 Introduction
Chapter 4 presented the results of “The Club” obtained firstly through the application
of OPM3 Self-assessment survey, and secondly through the Integrated Management
Systems Incorporated’s (IMSI) Open-ended interview method as per the adopted
hybrid, triangulation approach undertaken for this study. In this chapter, both the
OPM3 Self assessment survey and the Open-ended interview results that were
presented in Chapter 4 are analysed, discussed and used to answer the research
questions.
The main objective of the study is to make a thorough review and assessment of the
level of organizational project management maturity of the South African PSL
football clubs using Organizational Project Management Maturity Model (OPM3)
Self-assessment survey model and IMSI Open-ended structured interviews.
The results obtained from the assessment are used to identify the areas where The
Club achieved project management excellence and those areas that are in need of
improvement.
5.2 Analysis of the OPM3 Self-assessment survey results
Figures 4-1, 4-2, and, 4-3 obtained from the OPM3 Self-assessment survey in
Chapter 4 are used to analyze the results. Fig. 4-1 presented a graphical
representation of The Club’s overall position on the OPM3 continuum of
organizational project management maturity. It presents the overall percentage of
the Best Practices the organization appears to have achieved. This percentage is
based upon results from the answers of the OPM3 Self Assessment survey that was
provided by The Club’s respondents. The chart is scaled into five grey equal units,
each representing 20% of the total number of Best Practices achieved. The chart
shows the overall organizational project management maturity on an OPM3
continuum of The Club to be at 67%. This percentage is above the fifty percent
(50%) mark on the OPM3 continuum of organizational project management maturity.
Therefore, The Club appears to be performing well on its project management
1 2 5 | P a g e
capabilities, as it can also be seen by the number of 326 Best Practices achieved out
of a total of 488, presented in The Club’s OPM3 Best Practices results list.
As noted when conducting the study, approximately 80% of The Club’s projects are
about managing the match day projects throughout the Football season.
Approximately 20% of the projects are about managing projects outside the match
day such as youth development and some of the Sales & Marketing projects. A point
to also note at this juncture is that, since the release of a report of the Commission of
Inquiry into the Elis Park Stadium Soccer Disaster of 11 April 2001(Ngoepe 2002),
the PSL have since instituted and implemented standard measures and procedures
that should be followed to manage game day projects. This was in response to the
recommendations presented by the commission. The clubs are also obliged to
ensure that all these standard measures and procedures are implemented to
manage their match day projects. Some of the commission’s recommendations
include:
• There ought to be a better fixture scheduling,
• The role and responsibilities of a match coordinator/commissioner should be
clearly defined,
• The responsibility to educate the supporters should be clearly defined,
planned, and executed,
• The keeping of proper records and the recording of events at the stadium by
the role players; for example, radio communications on crowd control,
• Adequate public address system both inside and outside the stadium should
be established,
• Proper monitoring of the crowd,
• The installation of perimeter fencing,
• Parking for vehicles or drop off points should be safely away from the
stadium, especially the entry points,
• Proper traffic control,
• Proper planning for the game should take place - to this end, meetings with all
role players must be timorously held before each game and as many times as
it is necessary,
1 2 6 | P a g e
• Games must be categorized according to a clearly defined risk-profile formula,
• Provision of Security enforcements agents - the enforcement of safety and
security must be in the hands of professional people,
• Regulations that governs employment of security personnel should be put in
place,
• The sale of tickets – pre-sale of tickets should be established,
• Criteria to be taken into account in determining the suitability of a Stadium,
Some of the standard measures and procedures instituted by the PSL that should be
adhered to and reported on by the clubs when managing game day projects includes
the use of a Game Security Plan, Match Meeting report, Phone Meeting report,
Compliance Kit Manual, and Team Sheet Templates. Due to limited space, these
document were not included as part of the Appendices in this report, but can be
made available on request. The implementation and use of these measures and
procedures, as a way of conducting its business in order to achieve its strategic
objectives, appears to be assisting The Club to be able to better manage the game
day related projects that forms approximately 80% of The Club’s overall projects.
This seems to be the driving force behind such a good score of the overall
percentage of organizational project management maturity on an OPM3 continuum
of The Club. These results seem to be a fair reflection of the true state of The Club’s
standing given all the drivers coming as requirements from the PSL since the 11
April 2001 Elis Park Soccer Disaster Commission report recommendations.
Fig. 4-2 presents a PPP/SMCI bar chart representation of the results which
combines the organization’s maturity by domain (Project Management, Program
Management, and Portfolio Management), and stage of process improvement
(Standardize, Measure, Control, and Continuously Improve) within one Figure.
Therefore, this chart shows the organization’s maturity in terms of the three domains
of project, program and portfolio within each process improvement stage. Except at
the Standardize stage of process improvement, the results presented in Fig. 4-2
shows The Club’s overall project management maturity level is higher on Portfolio
Management, high on Program Management, and lower on Project Management.
This can be evidently seen from the percentages of Best Practices The Club has
achieved as follows: 64%, 71%, and 86% on Portfolio at Standardize, Measure, and
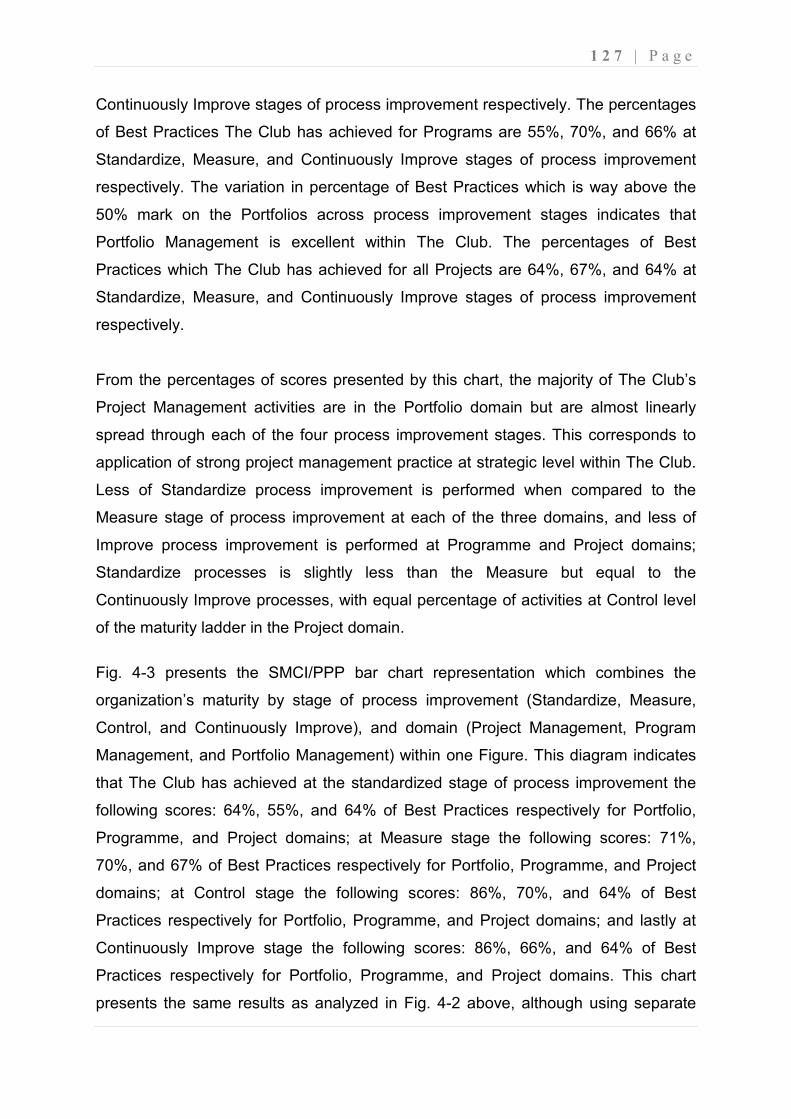
1 2 7 | P a g e
Continuously Improve stages of process improvement respectively. The percentages
of Best Practices The Club has achieved for Programs are 55%, 70%, and 66% at
Standardize, Measure, and Continuously Improve stages of process improvement
respectively. The variation in percentage of Best Practices which is way above the
50% mark on the Portfolios across process improvement stages indicates that
Portfolio Management is excellent within The Club. The percentages of Best
Practices which The Club has achieved for all Projects are 64%, 67%, and 64% at
Standardize, Measure, and Continuously Improve stages of process improvement
respectively.
From the percentages of scores presented by this chart, the majority of The Club’s
Project Management activities are in the Portfolio domain but are almost linearly
spread through each of the four process improvement stages. This corresponds to
application of strong project management practice at strategic level within The Club.
Less of Standardize process improvement is performed when compared to the
Measure stage of process improvement at each of the three domains, and less of
Improve process improvement is performed at Programme and Project domains;
Standardize processes is slightly less than the Measure but equal to the
Continuously Improve processes, with equal percentage of activities at Control level
of the maturity ladder in the Project domain.
Fig. 4-3 presents the SMCI/PPP bar chart representation which combines the
organization’s maturity by stage of process improvement (Standardize, Measure,
Control, and Continuously Improve), and domain (Project Management, Program
Management, and Portfolio Management) within one Figure. This diagram indicates
that The Club has achieved at the standardized stage of process improvement the
following scores: 64%, 55%, and 64% of Best Practices respectively for Portfolio,
Programme, and Project domains; at Measure stage the following scores: 71%,
70%, and 67% of Best Practices respectively for Portfolio, Programme, and Project
domains; at Control stage the following scores: 86%, 70%, and 64% of Best
Practices respectively for Portfolio, Programme, and Project domains; and lastly at
Continuously Improve stage the following scores: 86%, 66%, and 64% of Best
Practices respectively for Portfolio, Programme, and Project domains. This chart
presents the same results as analyzed in Fig. 4-2 above, although using separate
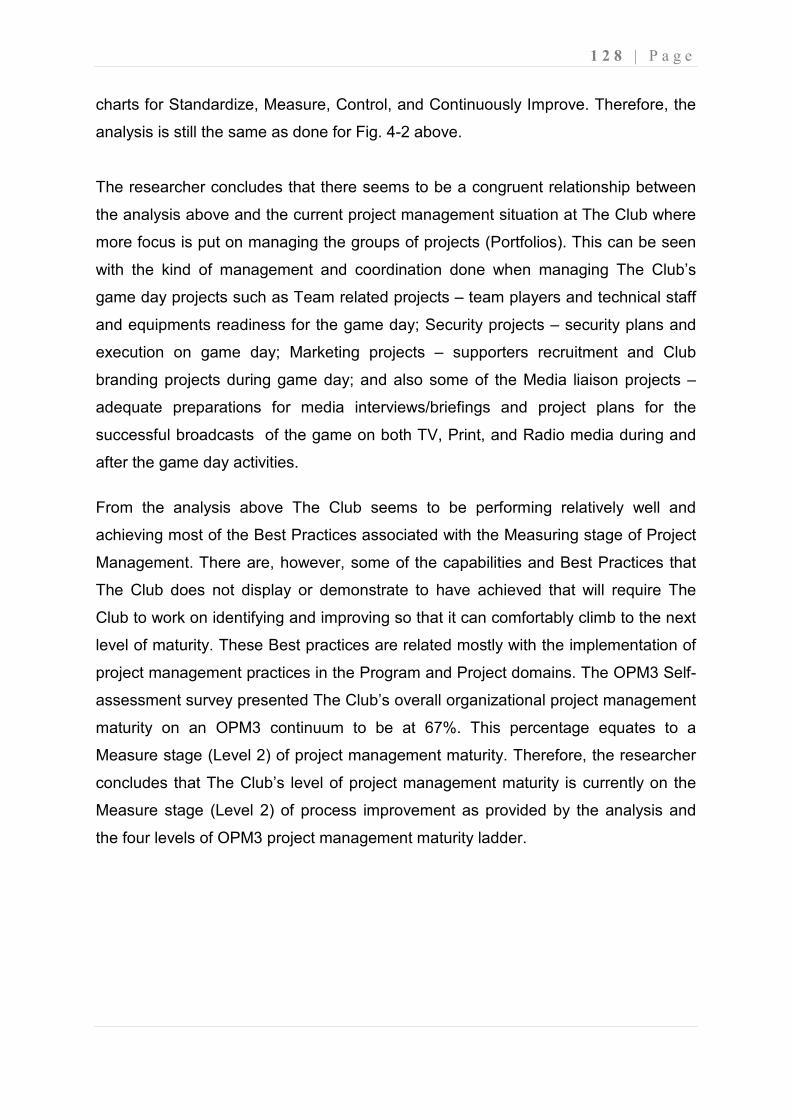
1 2 8 | P a g e
charts for Standardize, Measure, Control, and Continuously Improve. Therefore, the
analysis is still the same as done for Fig. 4-2 above.
The researcher concludes that there seems to be a congruent relationship between
the analysis above and the current project management situation at The Club where
more focus is put on managing the groups of projects (Portfolios). This can be seen
with the kind of management and coordination done when managing The Club’s
game day projects such as Team related projects – team players and technical staff
and equipments readiness for the game day; Security projects – security plans and
execution on game day; Marketing projects – supporters recruitment and Club
branding projects during game day; and also some of the Media liaison projects –
adequate preparations for media interviews/briefings and project plans for the
successful broadcasts of the game on both TV, Print, and Radio media during and
after the game day activities.
From the analysis above The Club seems to be performing relatively well and
achieving most of the Best Practices associated with the Measuring stage of Project
Management. There are, however, some of the capabilities and Best Practices that
The Club does not display or demonstrate to have achieved that will require The
Club to work on identifying and improving so that it can comfortably climb to the next
level of maturity. These Best practices are related mostly with the implementation of
project management practices in the Program and Project domains. The OPM3 Self-
assessment survey presented The Club’s overall organizational project management
maturity on an OPM3 continuum to be at 67%. This percentage equates to a
Measure stage (Level 2) of project management maturity. Therefore, the researcher
concludes that The Club’s level of project management maturity is currently on the
Measure stage (Level 2) of process improvement as provided by the analysis and
the four levels of OPM3 project management maturity ladder.
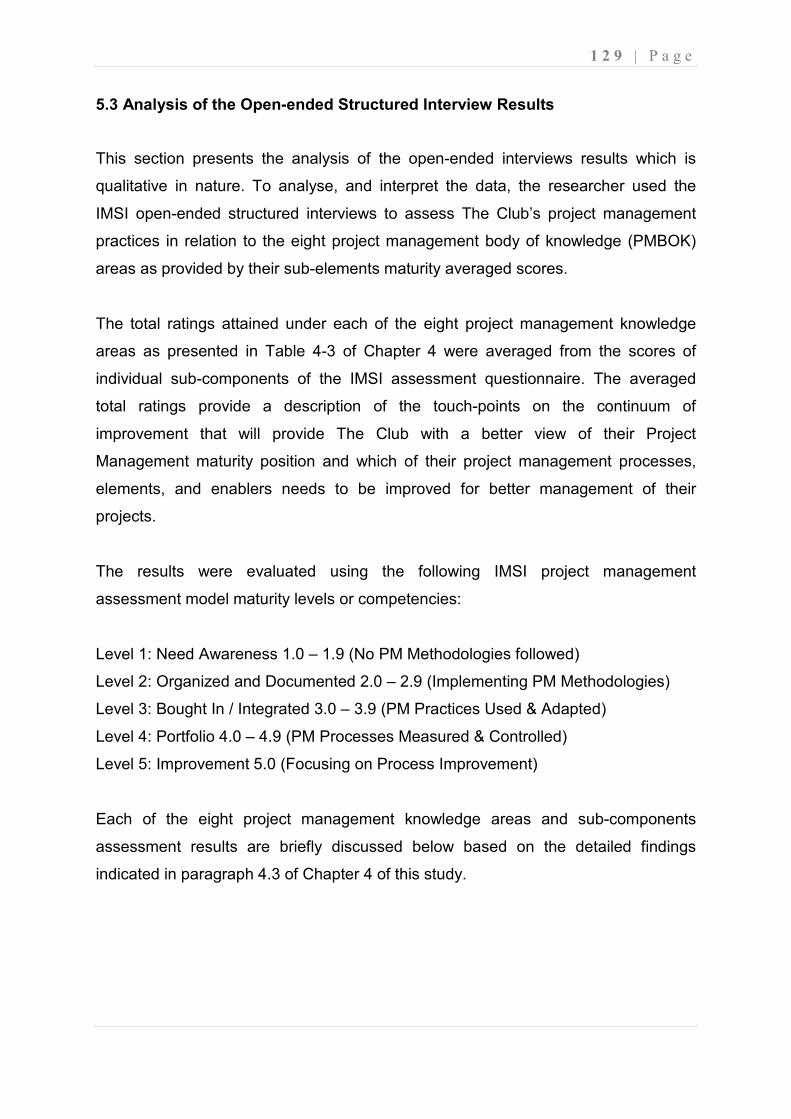
1 2 9 | P a g e
5.3 Analysis of the Open-ended Structured Interview Results
This section presents the analysis of the open-ended interviews results which is
qualitative in nature. To analyse, and interpret the data, the researcher used the
IMSI open-ended structured interviews to assess The Club’s project management
practices in relation to the eight project management body of knowledge (PMBOK)
areas as provided by their sub-elements maturity averaged scores.
The total ratings attained under each of the eight project management knowledge
areas as presented in Table 4-3 of Chapter 4 were averaged from the scores of
individual sub-components of the IMSI assessment questionnaire. The averaged
total ratings provide a description of the touch-points on the continuum of
improvement that will provide The Club with a better view of their Project
Management maturity position and which of their project management processes,
elements, and enablers needs to be improved for better management of their
projects.
The results were evaluated using the following IMSI project management
assessment model maturity levels or competencies:
Level 1: Need Awareness 1.0 – 1.9 (No PM Methodologies followed)
Level 2: Organized and Documented 2.0 – 2.9 (Implementing PM Methodologies)
Level 3: Bought In / Integrated 3.0 – 3.9 (PM Practices Used & Adapted)
Level 4: Portfolio 4.0 – 4.9 (PM Processes Measured & Controlled)
Level 5: Improvement 5.0 (Focusing on Process Improvement)
Each of the eight project management knowledge areas and sub-components
assessment results are briefly discussed below based on the detailed findings
indicated in paragraph 4.3 of Chapter 4 of this study.
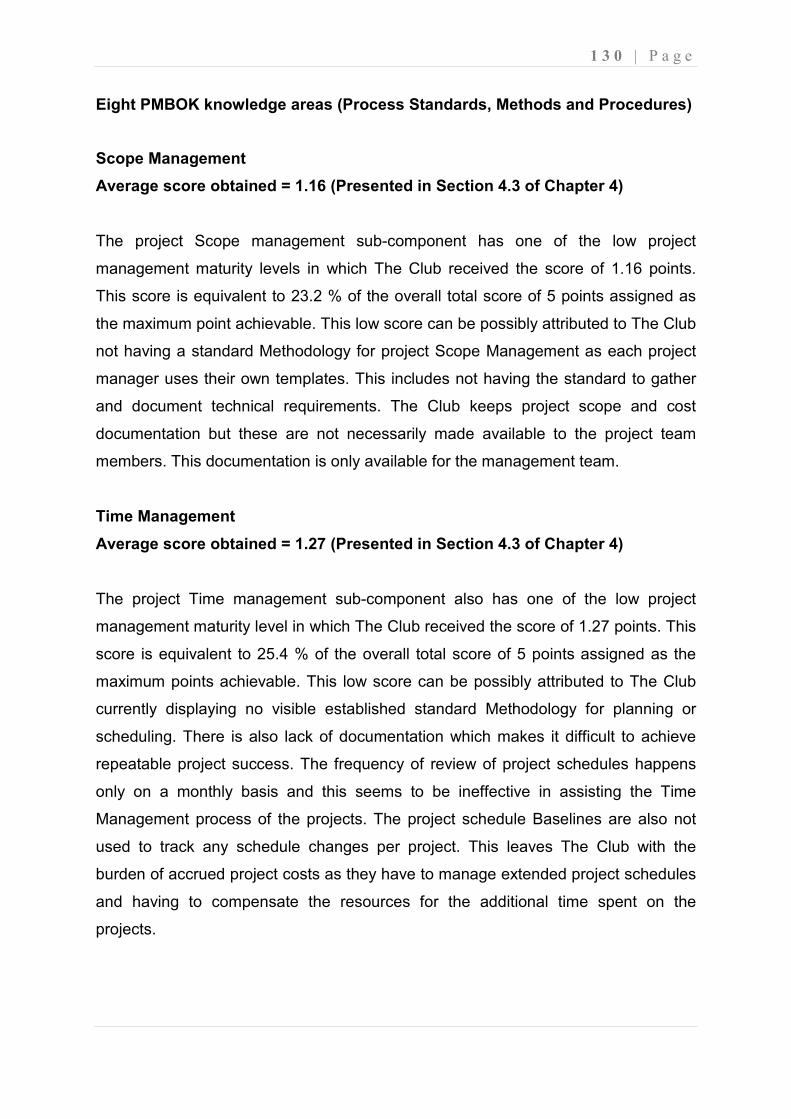
1 3 0 | P a g e
Eight PMBOK knowledge areas (Process Standards, Methods and Procedures)
Scope Management
Average score obtained = 1.16 (Presented in Section 4.3 of Chapter 4)
The project Scope management sub-component has one of the low project
management maturity levels in which The Club received the score of 1.16 points.
This score is equivalent to 23.2 % of the overall total score of 5 points assigned as
the maximum point achievable. This low score can be possibly attributed to The Club
not having a standard Methodology for project Scope Management as each project
manager uses their own templates. This includes not having the standard to gather
and document technical requirements. The Club keeps project scope and cost
documentation but these are not necessarily made available to the project team
members. This documentation is only available for the management team.
Time Management
Average score obtained = 1.27 (Presented in Section 4.3 of Chapter 4)
The project Time management sub-component also has one of the low project
management maturity level in which The Club received the score of 1.27 points. This
score is equivalent to 25.4 % of the overall total score of 5 points assigned as the
maximum points achievable. This low score can be possibly attributed to The Club
currently displaying no visible established standard Methodology for planning or
scheduling. There is also lack of documentation which makes it difficult to achieve
repeatable project success. The frequency of review of project schedules happens
only on a monthly basis and this seems to be ineffective in assisting the Time
Management process of the projects. The project schedule Baselines are also not
used to track any schedule changes per project. This leaves The Club with the
burden of accrued project costs as they have to manage extended project schedules
and having to compensate the resources for the additional time spent on the
projects.
1 3 1 | P a g e
Cost Management
Average score obtained = 1.5 (Presented in Section 4.3 of Chapter 4)
The project Cost management sub-component also has a low project management
maturity level in which The Club received the score of 1.5 points. This score is
equivalent to 30.0 % of the overall total score of 5 points assigned as the maximum
points achievable. This low score can be possibly attributed to The Club currently
displaying no established Cost Management practices or standards. Cost process
documentation is ad hoc and individual project teams follow informal practices for
cost management. Project managers and leaders generally have little knowledge of,
interest in, or control over project costs. Cost estimating is prepared by Finance
department with the estimated inputs gathered from the functional departments’
management. This normally results in over-estimating the costs for most projects as
functional management avoid having to perform another estimation exercise. The
hours spent on projects are not adequately tracked to budgets using tools such as
timecards.
Quality Management
Average score obtained = 1.0 (Presented in Section 4.3 of Chapter 4)
The project Quality Management sub-component has the lowest project
management maturity level in which The Club received the score of 1.0 point. This
score is equivalent to 20.0 % of the overall total score of 5 points assigned as the
maximum points achievable. This low score can be possibly attributed to The Club
currently displaying no established standard Methodology and Strategy for Quality
Management. Therefore different project leaders take different steps to ensure
quality in their projects. The Club currently displays no visible established project
quality practices or standards. There is no clearly defined process for quality
management plan. There are also no systems or reports in place to track progress
against the elements of quality control standards.
1 3 2 | P a g e
Risk Management
Average score obtained = 3.0 (Presented in Section 4.3 of Chapter 4)
The project Risk Management sub-component has the highest project management
maturity level in which The Club received the score of 3.0 points. This score is
equivalent to 60.0 % of the overall total score of 5 points assigned as the maximum
point achievable. This high score can be possibly attributed to The Club currently
approach of using adapted PM Practices. The Club displays more visible, organized,
clearly defined and documented process for risk management plan. There is a
consistent risk management strategy where Risks are consistently identified;
documented and tracked using security plan, police clearance certificates, and PSL
match meeting reports. Joined Club security, Police, and the Johannesburg Metro
Police Department are used in the risk management process, and Metrics are used
to support risk decisions at the project and the program levels.
Human Resource Management
Average score obtained = 2.0 (Presented in Section 4.3 of Chapter 4)
The project Human Resources Management sub-component has a relatively higher
project management maturity level in which The Club received the score of 2.0
points. This score is equivalent to 40.0 % of the overall total score of 5 points
assigned as the maximum point achievable. This score can be possibly attributed to
The Club currently displaying established standard PM Methodology and strategy for
Human Resources Management. The Club currently displays defined and repeatable
processes for HR management plan. Project managers and project team members’
roles are clearly defined and all the necessary skills are defined for project
management roles. Though The Club has established standards in place, there are
no formal project management training programmes provided that leads to
professional certification. This leads to The Club lacking qualified project
management professionals to be assigned to carry out project management
responsibilities according to Best Practices.
1 3 3 | P a g e
Communications Management
Average score obtained = 2.0 (Presented in Section 4.3 of Chapter 4)
The project Communications Management sub-component has a relatively higher
project management maturity level in which The Club received the score of 2.0
points. This score is equivalent to 40.0 % of the overall total score of 5 points
assigned as the maximum point achievable. This score can be possibly attributed to
The Club currently displaying established standard PM Methodology and strategy for
Communications Management. The Club currently displays defined basic plan where
large, highly visible projects follow established communications process and provide
progress reporting. Reported issues are tracked and resolution plans discussed in
Club meetings and reviewed with impacted or affected departments’ management.
Though Internal cross team communication does occur, it occurs only through the
Club meetings. This kind of meetings are not entirely completely effective as a
means of sharing status and commitment information as people who are not part of
these meetings do not get the information on time to enable them to effectively drive
project deliverables.
Procurement Management
Average score obtained = 2.0 (Presented in Section 4.3 of Chapter 4)
The project Procurement Management sub-component has a relatively higher project
management maturity level in which The Club received the score of 2.0 points. This
score is equivalent to 40.0 % of the overall total score of 5 points assigned as the
maximum point achievable. This score can be possibly attributed to The Club
currently displaying established standard PM Methodology and strategy for
Procurement Management. Basic process is documented for procurement of goods
and services which is mostly utilized by highly visible projects such as marketing
projects. Quality and timing of goods and services such as the players training and
official matches’ attire and equipments are specified to the vendors and the vendors
submit their delivery plans.
1 3 4 | P a g e
5.4 Overall Perspective of Maturity as Reflected by both Models
As already discussed above, there seems to be a congruent relationship between
the results produced by both the Open-ended interviews and OPM3 Self-assessment
survey. Both models produced and supported the results to the effect that The Club
is currently on Level 2 (Measure stage) of project management process maturity, as
presented by the OPM3 Self-assessment survey results and supported by the results
of the measured PMBOK Knowledge areas using the open-ended interviews.
However, in this study the qualitative assessment (open-ended interviews) was
considered a support tool for making an overall assessment.
The reasons for the congruency in the results presented by the two models will be
explained through comparing and reviewing the results as reflected by each model
under each PMBOK knowledge area and sub-components, and Best practices which
were assessed. This review and comparison of the results is presented in the
following paragraphs.
A list of OPM3 Best Practices which The Club appears to have achieved and those
that were not achieved is presented in Chapter 4. This list will be used in this
comparison. Only the results of the Best Practices corresponding to the results of the
sub-components of the open-ended interview conducted at The Club are compared
in this section. The comparison covers only the eight PMBOK knowledge areas and
their sub-components as follows:
Scope Management:
The OPM3 Survey Self Assessment results in Chapter 4 indicates that The Club has
not achieved the Best Practices at Project level domain for Define scope, Verify
scope, and Control scope processes, as well as the Create WBS process at both the
project and program management domains for all maturity stages (Standardize,
Measure, Control, and Improve). The Club appears to have only achieved the Best
Practices at Program level domain for Plan scope, and Monitor and Control scope
processes, for all the maturity stages. This indicates that there is still a number of
Best Practices that needs to be achieved at the Standardize stage. Project
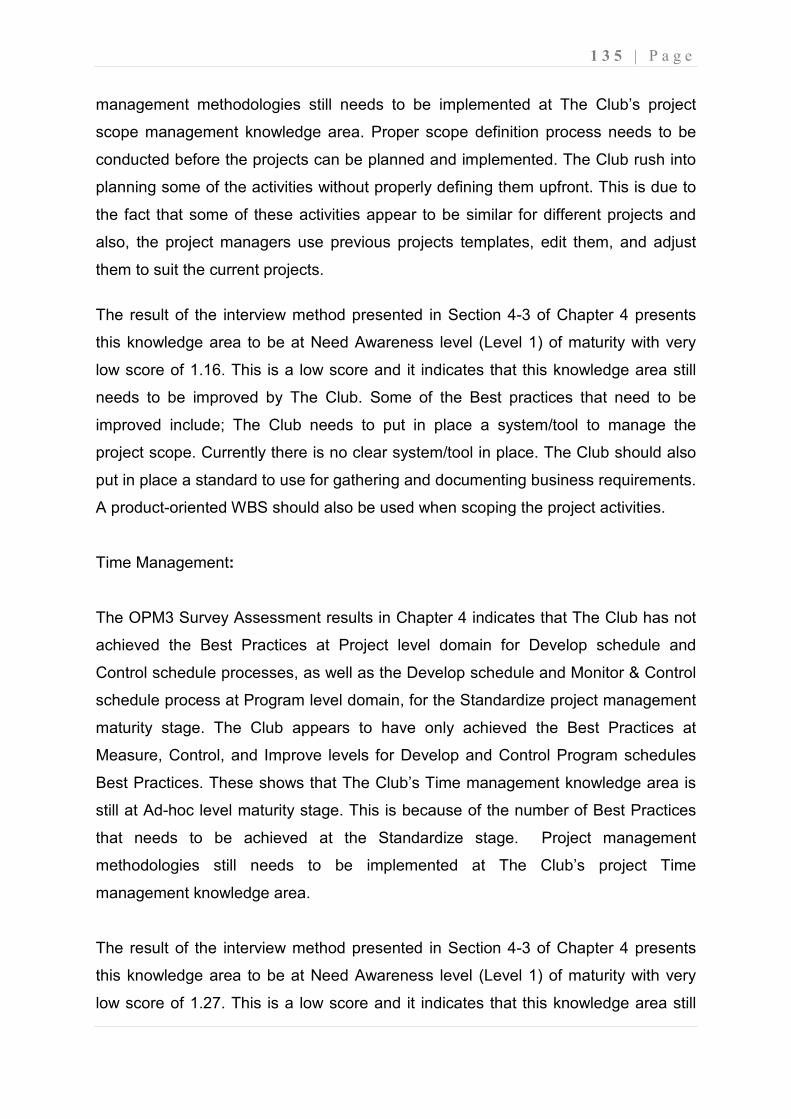
1 3 5 | P a g e
management methodologies still needs to be implemented at The Club’s project
scope management knowledge area. Proper scope definition process needs to be
conducted before the projects can be planned and implemented. The Club rush into
planning some of the activities without properly defining them upfront. This is due to
the fact that some of these activities appear to be similar for different projects and
also, the project managers use previous projects templates, edit them, and adjust
them to suit the current projects.
The result of the interview method presented in Section 4-3 of Chapter 4 presents
this knowledge area to be at Need Awareness level (Level 1) of maturity with very
low score of 1.16. This is a low score and it indicates that this knowledge area still
needs to be improved by The Club. Some of the Best practices that need to be
improved include; The Club needs to put in place a system/tool to manage the
project scope. Currently there is no clear system/tool in place. The Club should also
put in place a standard to use for gathering and documenting business requirements.
A product-oriented WBS should also be used when scoping the project activities.
Time Management:
The OPM3 Survey Assessment results in Chapter 4 indicates that The Club has not
achieved the Best Practices at Project level domain for Develop schedule and
Control schedule processes, as well as the Develop schedule and Monitor & Control
schedule process at Program level domain, for the Standardize project management
maturity stage. The Club appears to have only achieved the Best Practices at
Measure, Control, and Improve levels for Develop and Control Program schedules
Best Practices. These shows that The Club’s Time management knowledge area is
still at Ad-hoc level maturity stage. This is because of the number of Best Practices
that needs to be achieved at the Standardize stage. Project management
methodologies still needs to be implemented at The Club’s project Time
management knowledge area.
The result of the interview method presented in Section 4-3 of Chapter 4 presents
this knowledge area to be at Need Awareness level (Level 1) of maturity with very
low score of 1.27. This is a low score and it indicates that this knowledge area still
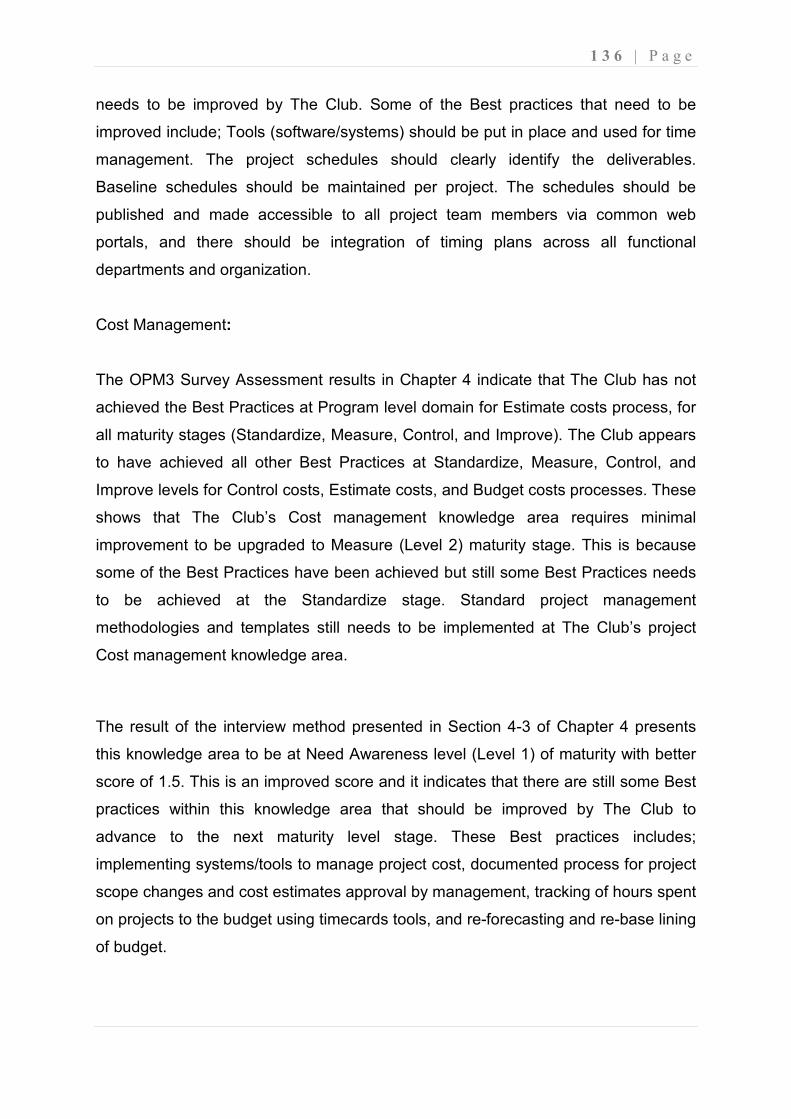
1 3 6 | P a g e
needs to be improved by The Club. Some of the Best practices that need to be
improved include; Tools (software/systems) should be put in place and used for time
management. The project schedules should clearly identify the deliverables.
Baseline schedules should be maintained per project. The schedules should be
published and made accessible to all project team members via common web
portals, and there should be integration of timing plans across all functional
departments and organization.
Cost Management:
The OPM3 Survey Assessment results in Chapter 4 indicate that The Club has not
achieved the Best Practices at Program level domain for Estimate costs process, for
all maturity stages (Standardize, Measure, Control, and Improve). The Club appears
to have achieved all other Best Practices at Standardize, Measure, Control, and
Improve levels for Control costs, Estimate costs, and Budget costs processes. These
shows that The Club’s Cost management knowledge area requires minimal
improvement to be upgraded to Measure (Level 2) maturity stage. This is because
some of the Best Practices have been achieved but still some Best Practices needs
to be achieved at the Standardize stage. Standard project management
methodologies and templates still needs to be implemented at The Club’s project
Cost management knowledge area.
The result of the interview method presented in Section 4-3 of Chapter 4 presents
this knowledge area to be at Need Awareness level (Level 1) of maturity with better
score of 1.5. This is an improved score and it indicates that there are still some Best
practices within this knowledge area that should be improved by The Club to
advance to the next maturity level stage. These Best practices includes;
implementing systems/tools to manage project cost, documented process for project
scope changes and cost estimates approval by management, tracking of hours spent
on projects to the budget using timecards tools, and re-forecasting and re-base lining
of budget.
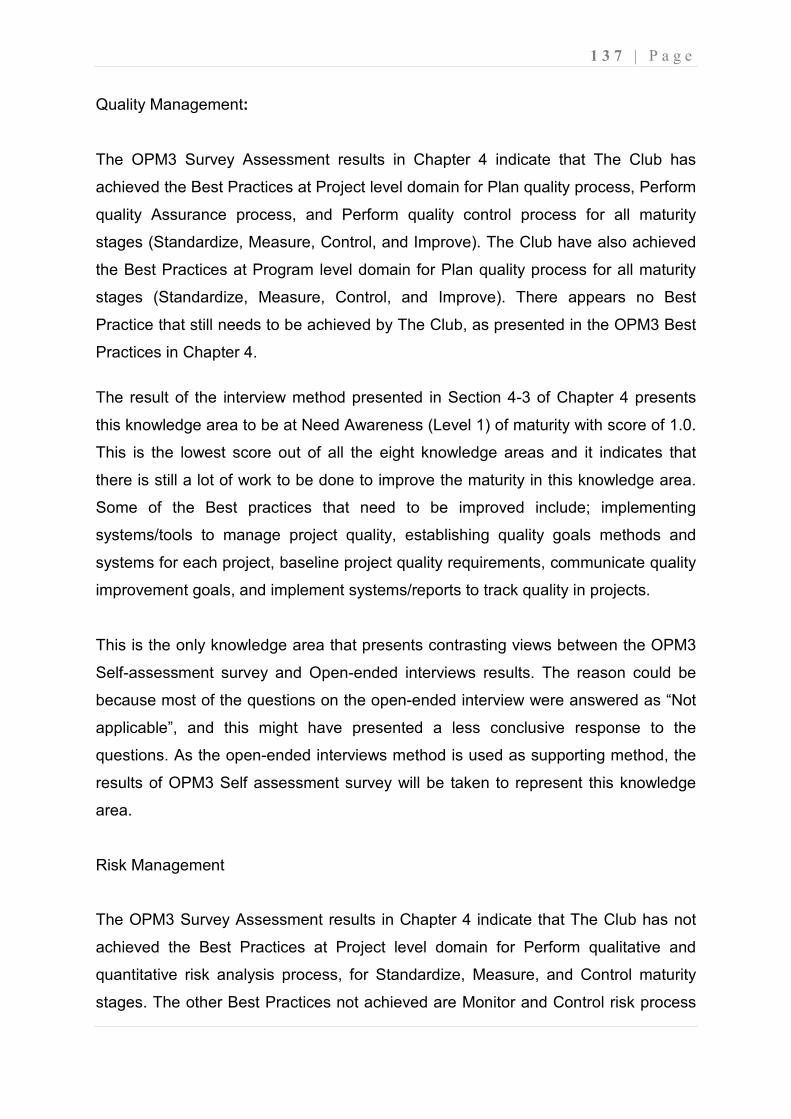
1 3 7 | P a g e
Quality Management:
The OPM3 Survey Assessment results in Chapter 4 indicate that The Club has
achieved the Best Practices at Project level domain for Plan quality process, Perform
quality Assurance process, and Perform quality control process for all maturity
stages (Standardize, Measure, Control, and Improve). The Club have also achieved
the Best Practices at Program level domain for Plan quality process for all maturity
stages (Standardize, Measure, Control, and Improve). There appears no Best
Practice that still needs to be achieved by The Club, as presented in the OPM3 Best
Practices in Chapter 4.
The result of the interview method presented in Section 4-3 of Chapter 4 presents
this knowledge area to be at Need Awareness (Level 1) of maturity with score of 1.0.
This is the lowest score out of all the eight knowledge areas and it indicates that
there is still a lot of work to be done to improve the maturity in this knowledge area.
Some of the Best practices that need to be improved include; implementing
systems/tools to manage project quality, establishing quality goals methods and
systems for each project, baseline project quality requirements, communicate quality
improvement goals, and implement systems/reports to track quality in projects.
This is the only knowledge area that presents contrasting views between the OPM3
Self-assessment survey and Open-ended interviews results. The reason could be
because most of the questions on the open-ended interview were answered as “Not
applicable”, and this might have presented a less conclusive response to the
questions. As the open-ended interviews method is used as supporting method, the
results of OPM3 Self assessment survey will be taken to represent this knowledge
area.
Risk Management
The OPM3 Survey Assessment results in Chapter 4 indicate that The Club has not
achieved the Best Practices at Project level domain for Perform qualitative and
quantitative risk analysis process, for Standardize, Measure, and Control maturity
stages. The other Best Practices not achieved are Monitor and Control risk process
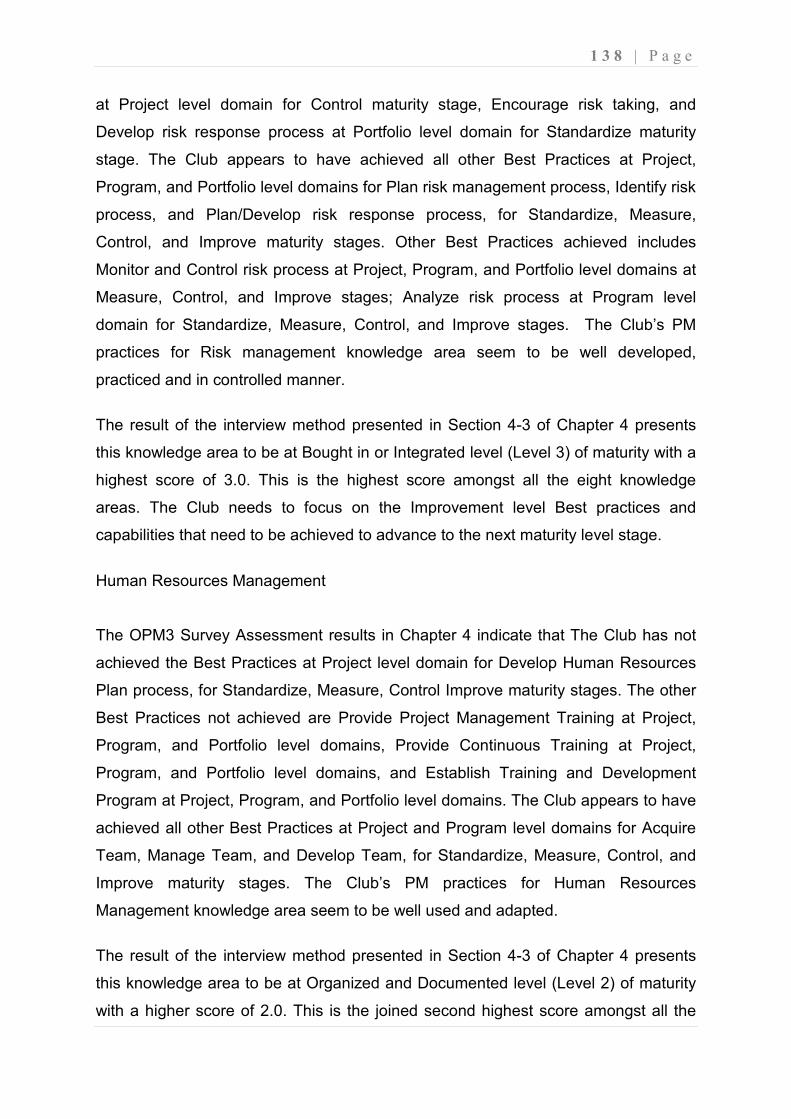
1 3 8 | P a g e
at Project level domain for Control maturity stage, Encourage risk taking, and
Develop risk response process at Portfolio level domain for Standardize maturity
stage. The Club appears to have achieved all other Best Practices at Project,
Program, and Portfolio level domains for Plan risk management process, Identify risk
process, and Plan/Develop risk response process, for Standardize, Measure,
Control, and Improve maturity stages. Other Best Practices achieved includes
Monitor and Control risk process at Project, Program, and Portfolio level domains at
Measure, Control, and Improve stages; Analyze risk process at Program level
domain for Standardize, Measure, Control, and Improve stages. The Club’s PM
practices for Risk management knowledge area seem to be well developed,
practiced and in controlled manner.
The result of the interview method presented in Section 4-3 of Chapter 4 presents
this knowledge area to be at Bought in or Integrated level (Level 3) of maturity with a
highest score of 3.0. This is the highest score amongst all the eight knowledge
areas. The Club needs to focus on the Improvement level Best practices and
capabilities that need to be achieved to advance to the next maturity level stage.
Human Resources Management
The OPM3 Survey Assessment results in Chapter 4 indicate that The Club has not
achieved the Best Practices at Project level domain for Develop Human Resources
Plan process, for Standardize, Measure, Control Improve maturity stages. The other
Best Practices not achieved are Provide Project Management Training at Project,
Program, and Portfolio level domains, Provide Continuous Training at Project,
Program, and Portfolio level domains, and Establish Training and Development
Program at Project, Program, and Portfolio level domains. The Club appears to have
achieved all other Best Practices at Project and Program level domains for Acquire
Team, Manage Team, and Develop Team, for Standardize, Measure, Control, and
Improve maturity stages. The Club’s PM practices for Human Resources
Management knowledge area seem to be well used and adapted.
The result of the interview method presented in Section 4-3 of Chapter 4 presents
this knowledge area to be at Organized and Documented level (Level 2) of maturity
with a higher score of 2.0. This is the joined second highest score amongst all the
1 3 9 | P a g e
eight knowledge areas. There are, however some Best practices that The Club still
needs to achieve to advance to the next maturity level stage. Some of the Best
practices that need to be improved include; implementing PM training, implementing
PM practices and processes that are consistent across functional groups and
divisions, and assigning trained staff to projects in areas of project schedule
management/project cost management/cost estimation/cost tracking, and scope
management.
Communications Management
The OPM3 Survey Assessment results in Chapter 4 indicate that The Club has not
achieved the Best Practices at Program level domain for Manage Issue process, for
both Standardize and Improve maturity stage. The Club appears to have achieved
Best Practices at Project level domains for Plan Communications process, Distribute
Information process, and Report Performance process, for Standardize maturity
stage. The Club also appears to have achieved Best Practices at Program level
domains for Plan Communications process and Distribute Information process, for
Standardize, Measure, and Control maturity stages. The Club’s Communications
Management knowledge area seem to be well used and adapted more especially at
Project and Program level domains.
The result of the interview method presented in Section 4-3 of Chapter 4 presents
this knowledge area to be at Organized and Documented level (Level 2) of maturity
with a higher score of 2.0. This is the joined second highest score amongst all the
eight knowledge areas. There are, however some Best practices that The Club still
needs to achieve to advance to the next maturity level stage such as the Issue
Tracking and Management, defining common management reporting requirements,
use of responsibility matrix in projects, and implementing software capable of
exchanging data across multiple projects and producing multiple summaries.
1 4 0 | P a g e
Procurement Management
The OPM3 Survey Assessment results in Chapter 4 indicate that The Club has not
achieved the Best Practices at Program level domain for Plan Procurement process,
Administer Procurement process, Close Procurement process, and Conduct
Procurement process, for all Standardize, Measure, Control, and Improve maturity
stages. The Club appears to have achieved Best Practices at Project level domain
for Plan Procurement process, Administer Procurement process, Close Procurement
process, and Conduct Procurement process, for all Standardize, Measure, Control,
and Improve maturity stages. The Club’s Procurement Management knowledge area
seems to be well used and adapted more especially at Project level domain.
The result of the interview method presents this knowledge area to be at Organized
and Documented level (Level 2) of maturity with a higher score of 2.0. This is the
joined second highest score amongst all the eight knowledge areas. There are,
however some Best practices at the Program level that The Club still needs to
achieve to advance to the next maturity level stage. Some of the Best practices that
need to be improved include; implementing a scope of work for each procurement
task along with selection criteria.
5.5 Revisiting Research Questions
In summary, the implications of the results and analysis when related back to the
research questions listed in the Proposal document for this study are as follows:
• Primary research question:
i. What is the level of organizational project management maturity of the
South African PSL Soccer clubs?
There seems to be a congruent relationship between the results of both the OPM3
Self assessment survey and the IMSI Open-ended Structured Interview. According
to the IMSI Open-ended Structured Interview results, The Club’s project
management competencies and practices (as per PMBOK knowledge areas) were
found to be operating between the Ad-hoc or Standardize stage (Level 1) and the
1 4 1 | P a g e
Measure stage (Level 2) as depicted by Table 4-4 in Chapter 4. The knowledge
areas operating at Level 1 are Scope, Time, Cost, and Quality management. Human
Resources, Communications, and Procurement management appears to be
operating at level 2, whilst Risk management is operating at Level 3.
The OPM3 Self-assessment survey provided The Club’s overall organizational
project management maturity on an OPM3 continuum to be at 67% as presented by
the chart of Fig. 4-1 in Chapter 4. This percentage equates to a Measure stage (level
2) of project management maturity.
Considering both sets of results from the two assessment types above, it can be
reasonably deduced, and the primary research question can be conclusively
answered by stating that The Club is currently operating in Measure stage (Level 2)
of the Organizational Project Management Maturity ladder.
The Club is also one of the oldest clubs and a founder member of the PSL, and has
also won silverware over the years of its existence in the league. A reasonable
inference can be drawn that The Club’s level of maturity is a high probable reflection
and indication of the level of maturity of the other PSL Clubs. Therefore, the level of
organizational project management maturity of the South African PSL Soccer clubs
can also be inferred to be at Measure stage (Level 2) of the maturity ladder.
• Research sub-questions:
i. Do PSL clubs perceive themselves as POOs?
The Club perceive itself as a project-oriented organization. This is seen by the efforts
they make to establish the project management policies and practices to manage
their various projects.
From the results presented in sections 4-2 and 4-3 in Chapter 4, and the analysis of
The Club’s results given in sections 5-2 and 5-3 above, The Club seems to be
performing relatively well and achieving some of the Best Practices associated with
the Measuring stage of Project Management. There are, however, some of the
1 4 2 | P a g e
capabilities and Best Practices that The Club does not display or demonstrate to
have achieved as discussed in Section 5.4 above. The OPM3 Self-assessment
survey presented The Club’s overall organizational project management maturity on
an OPM3 continuum to be at 67% or at Measure stage as presented by Fig. 4-1 in
Chapter 4. This indicates that The Club perceive itself as a POO that practices
Project Management in managing their projects, given by the overall 67% Best
Practices that they have achieved.
Therefore, a reasonable inference to The Club can be also drawn that The PSL
Clubs perceive themselves as POOs.
ii. Do PSL clubs define “Management by Projects” as an organizational
strategy?
There is an effort to use project management to drive organizational strategies of
The Cub though this needs to be cascaded down to all divisions of The Club.
As presented by the analysis in sections 5-2 and 5-3 above, and from the
percentages of scores presented by PPP/SMCI bar chart presented in Fig. 4-2 of
Chapter 4, the majority of The Club’s Project Management activities are handled in
the Portfolio domain but are almost linearly spread through each of the four process
improvement stages. This serves as an indication that the club do regards
management by projects as an organizational strategy as the strategy is developed
from the Portfolio level and cascaded downwards to the Projects level within The
Club. It is in this domain where majority of Project Management activities are
observed.
Therefore, a reasonable inference to The Club can be also drawn that The PSL
Clubs does define “Management by Projects” as an organizational strategy.
1 4 3 | P a g e
iii. Do PSL clubs have specific permanent organization units, such as a
PM Office and a Project Portfolio Group to help facilitate project
management efforts?
The Club do employ Project Management Office to help facilitate the project
management efforts as discussed in Section 4.3 in Chapter 4. However, at level two
stage the organization needs to be making concerted effort to use project
management and to develop processes that support its use. Though the PMO is
responsible for facilitating the project management efforts to help implement the
organizational strategy, there are some of the PMO roles that are not entirely
covered currently such as providing expertise to the organization and all project
managers. This is due to insufficiently skilled PMO personnel.
Therefore, a reasonable inference to The Club can be also drawn that The PSL
Clubs does employ Project Management Office to help facilitate the project
management efforts.
iv. Can something be done to improve the utilization of project
management practices by the PSL Clubs?
The Club’s project management competencies and practices were found to be
operating between the Standardize stage (Level 1) and the Measure stage (Level 2)
as depicted by Table 4-4 in Chapter 4. The Club do possess certain project
management competences and capabilities according to the results presented in
sections 4-2 and 4-3 of Chapter 4. The Club, however, still needs to work towards
achieving more of the Best Practices it currently has not achieve at level two to
enable it to improve their project management practices.
The Club has a great potential to improve on those competencies that are still
lacking behind to enable them to advance to Control stage (Level 3). There are,
however, a number of project management capabilities and Best Practices that still
needs to be achieved by The Club before it can move to level three of the
1 4 4 | P a g e
organizational project maturity ladder, as presented in the OPM3 Best practices list
that The Club has not achieved in Chapter 4.
From the analysis of the results above, it becomes imperative that The Club needs to
identify all the lacking key project management competences, capabilities, and Best
Practices that need to be developed and achieved in order to advance its individual
knowledge areas maturity levels from Levels 1 and 2 to Levels 2 and 3 respectively
in order to improve the utilization of its project management practices.
Therefore, a reasonable inference to The Club can be also drawn that The PSL
Clubs does need to identify all the lacking key project management competences,
capabilities, and Best Practices that need to be developed and achieved in order to
advance its individual knowledge areas maturity levels from Levels 1 and 2 to Levels
2 and 3 respectively in order to improve the utilization of their project management
practices.
v. What is the next step in the path to attaining a higher degree of
organizational project management maturity by PSL Soccer clubs?
The next step in the path to attaining a higher degree of organizational project
management maturity of The Club is to work on achieving Best Practice not
achieved currently at Level 2 as presented in the OPM3 Best practices list in Chapter
4, to enable progression to Level 3.
Reflecting on the results of the analysis of The Club’s project management maturity
presented in sections 4-2 and 4-3, it is clear that there is a necessity for The Club to
maintain its current status of maturity level, but also focus on developing project
management improvement plans that will assist them to improve their project
management competences and Best Practices to progress to the next higher
maturity levels.
1 4 5 | P a g e
It is evident from the number of competencies and Best Practices that The Club still
lacks as presented in the OPM3 Self-assessment Best Practices list in chapter 4 that
there is room for improvement by The Club to progress from the current overall
measure at Measure stage (Level 2) to Control stage (Level 3) of the project
management maturity levels. The Club needs to work towards identifying, improving
and achieving the Best Practices and Competencies not currently achieved through
effectively implementing project management practices at all levels of their business.
Therefore, a reasonable inference to The Club can be also drawn that The PSL
Clubs need to work towards identifying, improving and achieving the Best Practices
and Competencies not currently achieved through effectively implementing project
management practices at all levels of their business, as a step in the path to
attaining a higher degree of organizational project management maturity.
5.6 Chapter Summary
This Chapter presented the synthesis and analysis of both the OPM3 Self
assessment survey and the IMSI Open-ended interview results that were presented
in Chapter 4, and also answers to the research questions raised in the study
Proposal are provided.
The OPM3 Self Assessment survey presented a graphical representation of The
Club’s overall position on the OPM3 continuum of organizational project
management maturity, which was presented to be at 67%. These results presented
The Club to be performing well on its project management capabilities, and this was
supported by the number of 326 Best Practices achieved out of a total of 488,
presented in The Club’s OPM3 Best Practices results list.
It was also identified in this Chapter that, approximately 80% of The Club’s projects
are about managing the match day projects throughout the Football season, whilst
approximately 20% of the projects are about managing projects outside the match
day such as youth development and some of the Sales & Marketing projects.
1 4 6 | P a g e
Also discussed in this Chapter was the institution and implementation of standard
measures and procedures that the PSL Clubs are required to follow and implement
when managing their game day projects, since the release of a report of the
Commission of Inquiry into the Elis Park Stadium Soccer Disaster of 11 April 2001.
The results of the PPP/SMCI bar chart which combines the organization’s maturity
by domain (Project Management, Program Management, and Portfolio
Management), and stage of process improvement (Standardize, Measure, Control,
and Continuously Improve) within one Figure, were also analyzed. From the
percentages of scores presented by this chart, it was found that the majority of The
Club’s Project Management activities are in the Portfolio domain but are almost
linearly spread through each of the four process improvement stages.
The results of the SMCI/PPP bar chart which combines the organization’s maturity
by stage of process improvement (Standardize, Measure, Control, and Continuously
Improve), and domain (Project Management, Program Management, and Portfolio
Management) within one Figure, were also analyzed. The results of this chart,
however, presented the same results as analyzed in the PPP/SMCI although using
separate charts for Standardize, Measure, Control, and Continuously Improve, and
therefore, the analysis was deemed to be the same as done for the PPP/SMCI chart.
The overall analysis of The Club as per the OPM3 Self-assessment survey results
was then presented, highlighting both the achieved and non achieved Best practices,
and the overall level of maturity of The Club, was concluded to be on Level 2 on the
project management maturity ladder.
The synthesis and analysis of the IMSI open-ended interviews results was then
presented assessing The Club’s project management practices in relation to the
eight project management body of knowledge (PMBOK) areas as provided by their
sub-elements maturity averaged scores.
The reasons for the congruency in the results presented by the two models were
then explained through comparing and reviewing the results as reflected by each
model under each knowledge area and sub-components which were assessed. This
1 4 7 | P a g e
review was carried out in the section that reflected on the overall perspective of
maturity as presented by both Models and a comparison of the results was
presented.
Lastly, the implications of the results and analysis where related back to the research
questions listed in the Proposal document of this study and answers provided for all
the questions that were raised.
The next chapter will present the final conclusions and recommendations for this
study.
1 4 8 | P a g e
CHAPTER 6: CONCLUSIONS AND RECOMMENDATIONS
6.1 Introduction
The main objective of the study was to make a thorough review and assessment of
the level of organizational project management maturity of the South African PSL
football clubs using Organizational Project Management Maturity Model (OPM3)
Self-assessment survey and IMSI Open-ended structured interviews.
Chapter 5 presented Synthesis and Analysis of the research results. This chapter
presents a summary of the main conclusions drawn from the research results, as
well as the recommendations for the PSL Football Clubs and for future research on
this subject area.
6.2 Conclusions
6.2.1 The Club’s Maturity level
The case study Club is currently operating in Measure stage (Level 2) of the
Organizational Project Management Maturity ladder.
6.2.2 Industry Maturity Level
There are significant indications to suggest that the maturity of the South African
PSL Football Clubs is also at Level 2 of the project management maturity ladder.
6.2.3 The Club’s Project-oriented Approach
There are strong indications that suggest that The Club studied possesses sufficient
skills and abilities to manage its projects as a POO. The Club perceive itself as a
project-oriented organization. The Club’s project management competencies and
practices are found to be operating between the Ad-hoc or Standardize stage (Level
1) and the Measure stage (Level 2). There are some project management
deficiencies in the following knowledge areas - Scope, Time, Cost, and Quality
management. However, there are sufficient achievements of Best Practices,
1 4 9 | P a g e
implemented systems and procedures that exist in the following knowledge areas -
Human Resources, Communications, Procurement, and Risk management to overall
justify The Club’s position of perceiving itself as a POO.
6.2.4 Management by Projects and Organizational Strategy
The Club’s strategic development and management resides in the Portfolio domain.
The Club’s main project management activities are also facilitated from the Portfolio
domain and are almost linearly spread through each of the four process
improvement stages of OPM3. This indicates that the club regards management by
projects as an organizational strategy as they develop strategies at the Portfolio level
and cascade them to the Program and Project levels for implementation purposes.
6.2.5 Formal Project Management Organization Units
There is a Project Management Office established by The Club to help facilitate the
project management efforts to help implement the organizational strategy. However,
the Project Management Office is not entirely effective in providing project
management expertise to the organization and all project managers as a result of
insufficiently skilled PMO personnel.
6.2.6 Formal Project Management Processes
There are strong indications to show that The Club has formal project management
processes in place. However, being at Level 2 of project management maturity the
organization needs to be making concerted effort to effectively implement and
improve such processes.
6.2.7 Improving the Utilization of Project Management Practices
It seems that The Club is implementing formal project management practices and
has shown its intentions to organise and manage by projects. The Club has a great
potential to improve on those competencies that are still lacking behind to enable
them to advance to a higher level on the project management maturity ladder.
1 5 0 | P a g e
Adequate and effective project management planning and improvement aimed at
embracing Project Management as a core competence need to be undertaken in
order for The Club to move to the next level of maturity.
6.2.8 Project Integration Management
There appears a need for establishing standard Club-wide project management
processes. There are no standard methods for promulgating, enforcement and
usage tracking of the project management processes. Scope and Quality
management processes needs to be sufficient enough for control of project scoping
and project quality. There are no well established and generally recognized
standards for Time and Cost tracking processes for project resources and costs. The
Club has to establish these processes in order to attain a higher degree of
organizational project management maturity
6.2.9 Communications Systems
Communications processes of project information, particularly within The Club seem
to be reliable and effective. There seems to be internal cross team communication
within The Club mostly on large and highly visible projects. However, the
communication is not entirely effective as a means of sharing status and
commitment information as people who are not part of these meetings do not get the
information on time to enable their immediate attendance to project deliverables.
6.2.10 Professional Development and Training
The Club displays established standard methodology, strategy, defined and
repeatable processes for human resources management. However, The Club has
shown little commitment to developing project management skills, as indicated by
the lack of training opportunities and the absence of a project management career
path. The Club’s failure to consistently develop project management skills in its
personnel leads to non qualified personnel being assigned to manage some of the
projects. This in turn leads to poor performance that hampers successful project
delivery.
1 5 1 | P a g e
6.2.11 Project Management Systems
There is no project management software that is actively used by The Club as an
enterprise wide project management system. There are no technological project
management tools in use. Project managers use their own preferred tools such as
Microsoft Project and Microsoft Excel spreadsheets to document and track project
progress. No established central repository of projects and programs data exists
that would allow for easy and real time accessibility of current project data and
information.
6.2.12 Knowledge Management
Because of lack of a central repository or standard procedure of storing project
information for project and programs data, project documents are usually stored by
individual project managers per project, and are usually not shared across the
organization. The Club does not have adequate policies and procedures for
managing projects information.
6.2.13 Continuous Improvement
Lessons learned exercises are not adequately conducted to identify process
knowledge and improvement opportunities and as a result there is no organized or
consistent way to leverage and benefit on the information that can be gathered from
such exercises.
6.2.14 Organizational Structure
The Club’s organizational structure and culture does not effectively support project
management effort but top management only provide support on some of the top
priority projects. There is no formal division dedicated to project management in The
Club’s organizational structure and hence each division manages projects that are
related to their specific functions. Top management does not champion and enforce
conformance to proper project management processes on all projects and as a
1 5 2 | P a g e
result, the processes used by project managers, and their team members for
planning and executing projects are inconsistent.
6.2.15 Best Practices
Comparing The Club’s project management practices with some of the Best
Practices contained in the OPM3 and standard practices used in other industries, a
conclusion is made that The Club is fairly performing well in achieving most of the
best practices in a number of areas, but also falls short on some of the Best
Practices such as the following:
• Lack of effective standardized organization-wide project management policy.
• Lack of central repository for data storage and dissemination.
• Lack of control of changes in the scope, time, cost, and quality of projects.
• Lack of the standardized organization-wide project management systems.
• Lack of Identification, dissemination, and implementation of lessons learned.
• Lack of standardized systems and tools for managing project scope.
• Lack of cost and performance databases and information systems.
• Lack of effective and consistent training, and qualification of project managers.
• Lack of project management office core competency to support project managers.
6.3 Recommendations
The Club’s portfolio of projects consists of different types of projects. Some projects
are long-term, running throughout the PSL season or more; some are medium-term,
running less than a year; and some are short-term, running less than a month. There
are also cross combination of large, medium, and small projects across the different
durations. The projects are unique with different challenges, but most projects are
closely interdependent. Delivering projects of this nature where there is a close
interdependency amongst projects is a constant challenge that requires excellent
project management skills and sound leadership. The researcher hopes that the
findings indicated above and the recommendations that follow will provide the
guidelines that will assist The Club to firstly maintain the current Level 2 of project
management maturity; and secondly progress to Level 3 of project management
1 5 3 | P a g e
maturity. A concerted effort in practicing proper project management from all
involved at The Club will be required in order to progress The Club’s project
management maturity to a Level 3 on the maturity ladder.
The following recommendations for improvement are listed according to specific
findings or deficiencies they would address with a view to further strengthen and
improve project management at The Club:
6.3.1 Path to Higher Level Maturity
Since the organization is currently at project management maturity Level 2, the next
step in the path to full maturity is to first complete Level 2 processes and thereafter
put in a concerted effort towards achieving Level 2 Best Practices.
6.3.2 Change towards a Project Oriented Organization
To observe the project-orientation of an organization requires a special pair of
glasses of project-orientation, which allows to observe the practices of project-,
programme-, and project portfolio management and to observe the organizational
design and the personnel management, which support these managerial practices.
These observations are the basis for management interventions needed in order to
optimize the maturity as a POC.
The Club’s management is clearly required to focus more effort into inculcating the
culture and managerial practices of a POO at all levels within the organization in an
effort to optimize the maturity of The Club. They need to organize and structure the
organization design and personnel management in such a way that it will support
these managerial practices
It must be noted though that implementing these changes is not going to be a
smooth and quick exercise. This will require significant changes at The Club’s
organizational structure and motivation of people at all levels in the company to
accept and apply new concepts and methods of managing their work. Implementing
1 5 4 | P a g e
project management discipline and practices successfully is not a quick-fix solution,
but rather is a long-term, foundation-building effort.
6.3.3 Creating an Environment for Successful Project Management
To be able to function as a POO and achieve its goals and objectives and progress
to a higher level on the PM maturity ladder, The Club needs to establish an
environment for successful projects through building a project management centre of
excellence.
6.3.4 Project Execution Support
In order to effectively implement the improvement programs, the project
management office must include the necessary skilled staff required to support the
project managers and provide consistent methods and systems for project scope
management, cost estimation, time management, quality management, change
control, and earned value management. This process will require full and continuing
support of the executive management of The Club to ensure the support of the PMO
and the entire project management organization. The PMO should also implement all
project improvement programs and drive cultural changes within The Club.
6.3.5 Process Standards, Methods and Procedures
The Club should provide fundamental policies, procedures, models, templates, tools,
and standards for its project management system; train project staff to ensure
compliance of their use on all projects all the time.
6.3.6 Project Management Plan
A comprehensive project management plan document with standard format and
comprising of a statement of the project organization, the project stakeholders and a
description of their respective roles and responsibilities should be developed and its
use supported by The Club management. The Club should also institute the use of a
reporting system that will provide the necessary data for each level of management
1 5 5 | P a g e
to enable them to track and communicate the project risk, quality, cost, schedule,
and scope status.
6.3.7 Interdepartmental Input
To successfully execute projects require participation from many parts of the
organization. Therefore the successful implementation of project management
practices at The Club should be accomplished by a joined and co-ordinated effort
between all departments in the organizations. The skills of managing across
organization will have to be developed. This change must be systematic and
organization-wide.
6.3.8 Project Manager’s Development Program
The Club should establish an organization-wide training program for project
managers using an external consulting firm with a successful record of training
project managers. Attendance of the training should be compulsory for all of The
Club’s project managers and they must become certified. All contractors performing
project management work for The Club should be required to provide trained,
qualified, and experienced project managers for this work.
6.3.9 Project Management Information Systems
The Club should implement a Project Management Information System (PMIS) in its
structure to ensure proper facilitation of the communication within the project team,
between the project team and other project teams, and between the project team
and external stakeholders.
6.3.10 Assessment Metrics
The implemented improvement programs and actions should be assessed to monitor
their effectiveness. The Club needs to employ specific measurable metrics that will
provide a comparison between the current status and the status after implementation
of improvement programs. These metrics needs to be aligned to the organization’s
1 5 6 | P a g e
critical success factors. The target for these metrics will be to monitor and observe,
over time, how well an organization’s management of its projects is effective and to
also identify areas that needs continuous improvement to further increase the
effectiveness of the programs.
6.3.11 Continuous Improvement
The project management office should be the custodian of continuous improvement
programs and plans. The PMO should create a focus area to drive continuous
improvement programs across the organization. This is necessary in order to help
create a successful environment and provide support to guide the organizational
change necessary to sustain the environment.
6.3.12 Environment for Successful Projects
Senior management must create conducive environment for running successful
projects within the organization. Although project managers are mostly closely
responsible for the success of projects, upper managers ultimately create an
environment for project success. Senior management should ensure that the
environment to practice successful project management is established through
creation of dedicated committees such as Portfolio and Program committees that will
consistently review status and progress of the programs and projects in order to
ensure accomplishment of The Club’s strategic goals, and avert possible problems in
running projects that will lead to problems in running the entire organization.
6.3.13 Components of Environment for Successful Projects
There are ten components of an environment for successful projects that The Club’s
senior management should ensure their adoption and implementation in all
structures of the organization to help foster successful projects:
• The change to project-based organizations,
• Strategic emphasis of projects,
• Understand upper management influence,
1 5 7 | P a g e
• Develop a core team process,
• Organize for projects management,
• Develop a project management information system,
• Develop a plan for project manager selection and development,
• Develop a learning organization,
• Develop a project management initiative,
• Develop project management in the organization.
6.3.14 Time-based Interface Chart
A regularly updated time-based interface chart comprising of all projects, their
deliverables, dependencies and skills set should be used as a status report and
troubleshooting tool.
Given all the findings and recommendation provided above, and if acted upon by
The Club, the researcher is of the opinion that The Club should be able to firstly,
maintain their current maturity Level 2 and strengthen the competencies and
knowledge areas that still needs improvement to wholly operate in this maturity level.
Secondly, The Club’s project performance would be significantly improved to Level 3
on the project management maturity ladder.
6.3.15 Recommendation for future research
A new window of research opportunity has now arisen from this research report
where two important focus areas have been identified and the researcher is of the
opinion that they will become more important in the future for project management
practitioners – both academics and professionals. These focus areas are:
i. The need for more research to help to fully comprehend the project
management practices and processes that would contribute significantly
towards organizations becoming true POO’s, and leverage on the benefits
provided by “managing by projects” in their ways of conducting business.
1 5 8 | P a g e
ii. The need for more research work that would comprehensively help to
better define organizational project management maturity and to better
understand how it differs from industry to industry, and amongst project
types. For this research work to add value to the current body of
knowledge, there need to be a desire shown by the organizations that they
perceive project management maturity as an asset to their businesses.
The field of maturity models is still in its infant stage of development and
there has been a promulgation of many models, yet with no formal
consensus reached on which should be regarded as a standard model to
reference to. This is because of the widely differing assumptions and many
unanswered questions that are found in these models. With this differing
assumptions and unanswered questions, these models cannot be
regarded as the “Holy Gospel” for improving project success within
organizations. The use of these models by organizations as the main tool
for improving project success remains an “act of faith”. Maturity models
cannot be regarded as thee superior tools for measuring organizational
project management maturity in their current form.
In today’s competitive business environment where organizations strive to identify
competitive and performance advantages, and leverage them through improved
efficiency and delivery, management models designed to assess performance and
identify opportunities for improvement are increasingly important. Maturity models in
particular have become an essential tool in assessing organizations’ current
capabilities and helping them to implement change and improvements in a structured
way. Their use can enable organizations to reap the benefits brought by improved
capability at all levels.
Therefore, it becomes prudent that the process of assessment using project
management maturity models should be consistently reviewed and refined to
continually reinforce the advances and progress made in enriching the project
management knowledge base.
It therefore becomes evident that both these two areas requires further investigation
and study, and thus, should become core topics of ongoing research in the fields of

1 5 9 | P a g e
project management, organizational project management maturity and project
oriented organizations.
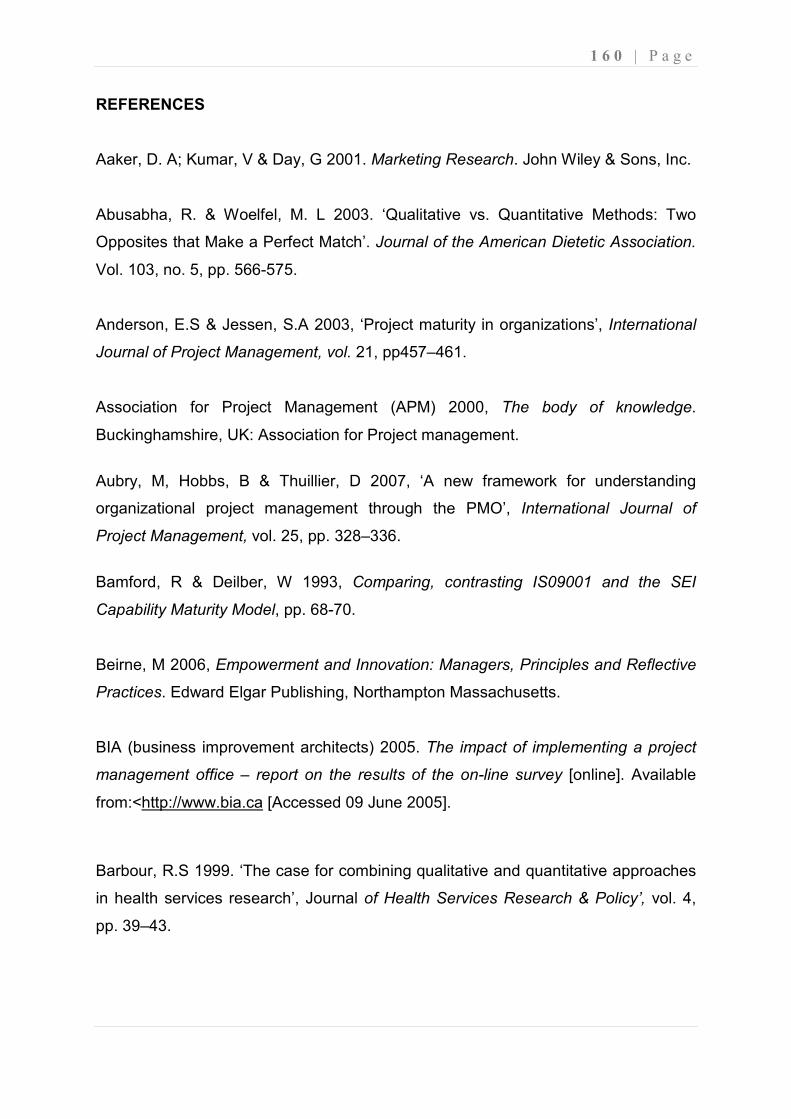
1 6 0 | P a g e
REFERENCES
Aaker, D. A; Kumar, V & Day, G 2001. Marketing Research. John Wiley & Sons, Inc.
Abusabha, R. & Woelfel, M. L 2003. ‘Qualitative vs. Quantitative Methods: Two
Opposites that Make a Perfect Match’. Journal of the American Dietetic Association.
Vol. 103, no. 5, pp. 566-575.
Anderson, E.S & Jessen, S.A 2003, ‘Project maturity in organizations’, International
Journal of Project Management, vol. 21, pp457–461.
Association for Project Management (APM) 2000, The body of knowledge.
Buckinghamshire, UK: Association for Project management.
Aubry, M, Hobbs, B & Thuillier, D 2007, ‘A new framework for understanding
organizational project management through the PMO’, International Journal of
Project Management, vol. 25, pp. 328–336.
Bamford, R & Deilber, W 1993, Comparing, contrasting IS09001 and the SEI
Capability Maturity Model, pp. 68-70.
Beirne, M 2006, Empowerment and Innovation: Managers, Principles and Reflective
Practices. Edward Elgar Publishing, Northampton Massachusetts.
BIA (business improvement architects) 2005. The impact of implementing a project
management office – report on the results of the on-line survey [online]. Available
from:<http://www.bia.ca [Accessed 09 June 2005].
Barbour, R.S 1999. ‘The case for combining qualitative and quantitative approaches
in health services research’, Journal of Health Services Research & Policy’, vol. 4,
pp. 39–43.
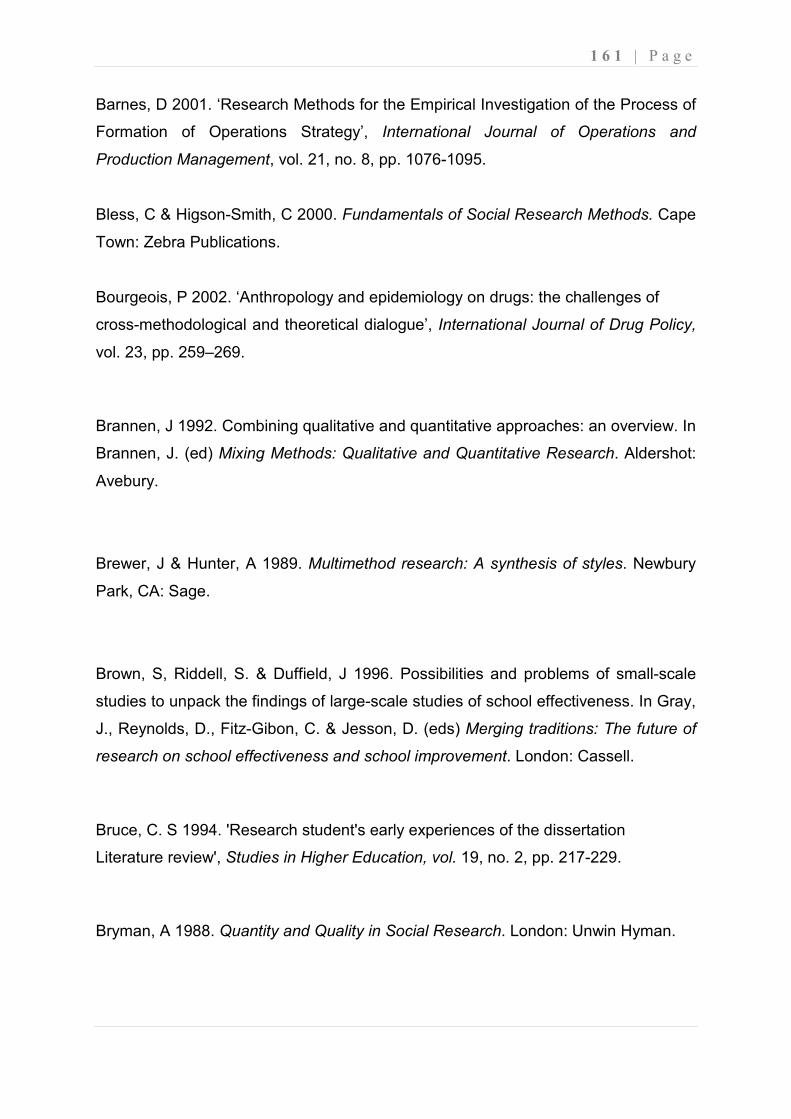
1 6 1 | P a g e
Barnes, D 2001. ‘Research Methods for the Empirical Investigation of the Process of
Formation of Operations Strategy’, International Journal of Operations and
Production Management, vol. 21, no. 8, pp. 1076-1095.
Bless, C & Higson-Smith, C 2000. Fundamentals of Social Research Methods. Cape
Town: Zebra Publications.
Bourgeois, P 2002. ‘Anthropology and epidemiology on drugs: the challenges of
cross-methodological and theoretical dialogue’, International Journal of Drug Policy,
vol. 23, pp. 259–269.
Brannen, J 1992. Combining qualitative and quantitative approaches: an overview. In
Brannen, J. (ed) Mixing Methods: Qualitative and Quantitative Research. Aldershot:
Avebury.
Brewer, J & Hunter, A 1989. Multimethod research: A synthesis of styles. Newbury
Park, CA: Sage.
Brown, S, Riddell, S. & Duffield, J 1996. Possibilities and problems of small-scale
studies to unpack the findings of large-scale studies of school effectiveness. In Gray,
J., Reynolds, D., Fitz-Gibon, C. & Jesson, D. (eds) Merging traditions: The future of
research on school effectiveness and school improvement. London: Cassell.
Bruce, C. S 1994. 'Research student's early experiences of the dissertation
Literature review', Studies in Higher Education, vol. 19, no. 2, pp. 217-229.
Bryman, A 1988. Quantity and Quality in Social Research. London: Unwin Hyman.
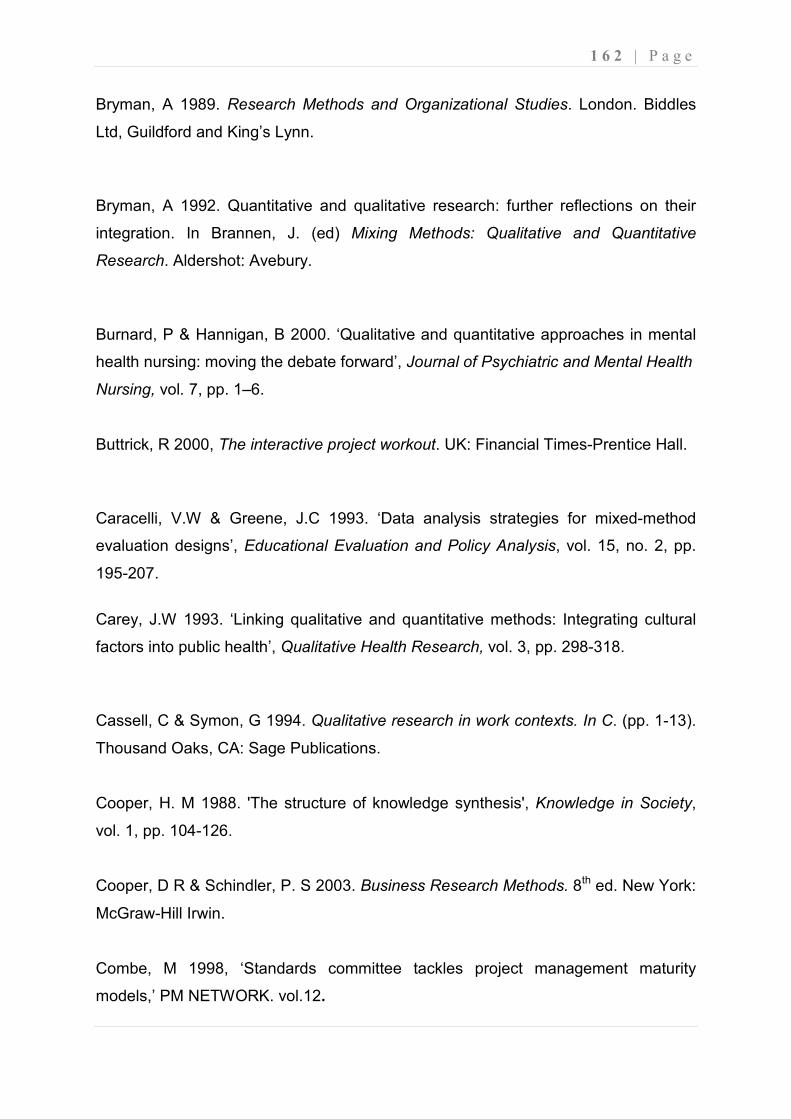
1 6 2 | P a g e
Bryman, A 1989. Research Methods and Organizational Studies. London. Biddles
Ltd, Guildford and King’s Lynn.
Bryman, A 1992. Quantitative and qualitative research: further reflections on their
integration. In Brannen, J. (ed) Mixing Methods: Qualitative and Quantitative
Research. Aldershot: Avebury.
Burnard, P & Hannigan, B 2000. ‘Qualitative and quantitative approaches in mental
health nursing: moving the debate forward’, Journal of Psychiatric and Mental Health
Nursing, vol. 7, pp. 1–6.
Buttrick, R 2000, The interactive project workout. UK: Financial Times-Prentice Hall.
Caracelli, V.W & Greene, J.C 1993. ‘Data analysis strategies for mixed-method
evaluation designs’, Educational Evaluation and Policy Analysis, vol. 15, no. 2, pp.
195-207.
Carey, J.W 1993. ‘Linking qualitative and quantitative methods: Integrating cultural
factors into public health’, Qualitative Health Research, vol. 3, pp. 298-318.
Cassell, C & Symon, G 1994. Qualitative research in work contexts. In C. (pp. 1-13).
Thousand Oaks, CA: Sage Publications.
Cooper, H. M 1988. 'The structure of knowledge synthesis', Knowledge in Society,
vol. 1, pp. 104-126.
Cooper, D R & Schindler, P. S 2003. Business Research Methods. 8th ed. New York:
McGraw-Hill Irwin.
Combe, M 1998, ‘Standards committee tackles project management maturity
models,’ PM NETWORK. vol.12.
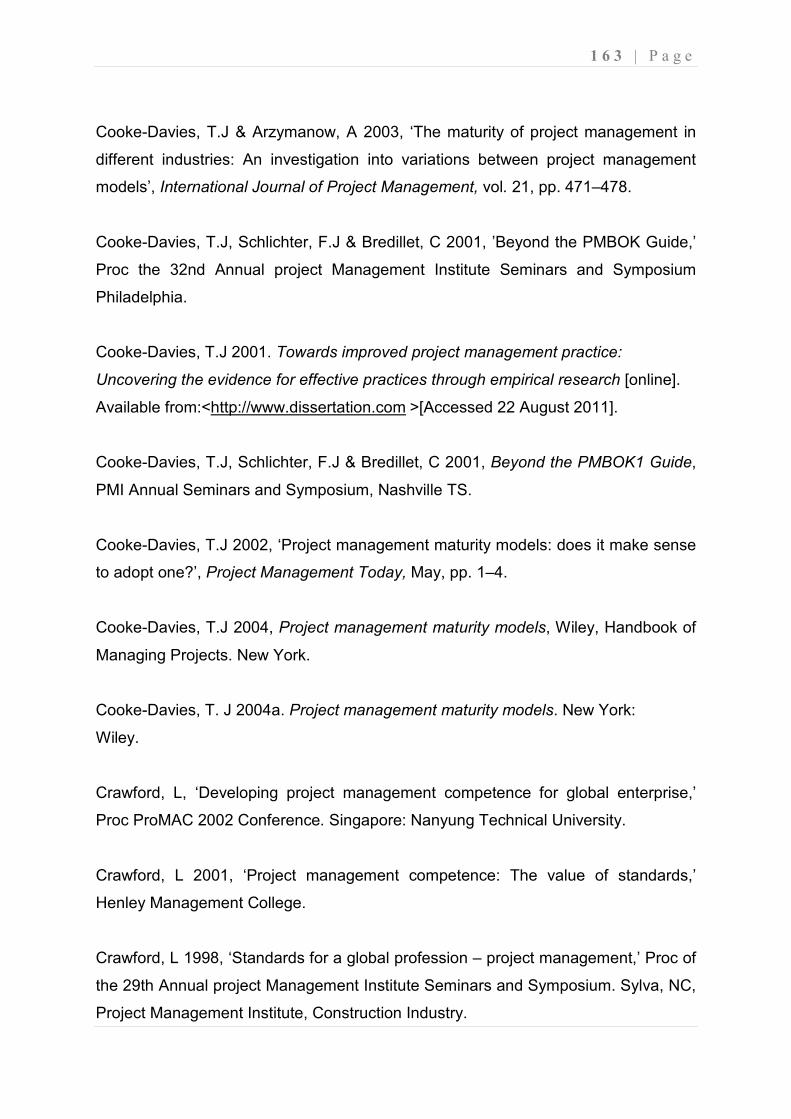
1 6 3 | P a g e
Cooke-Davies, T.J & Arzymanow, A 2003, ‘The maturity of project management in
different industries: An investigation into variations between project management
models’, International Journal of Project Management, vol. 21, pp. 471–478.
Cooke-Davies, T.J, Schlichter, F.J & Bredillet, C 2001, ’Beyond the PMBOK Guide,’
Proc the 32nd Annual project Management Institute Seminars and Symposium
Philadelphia.
Cooke-Davies, T.J 2001. Towards improved project management practice:
Uncovering the evidence for effective practices through empirical research [online].
Available from:<http://www.dissertation.com >[Accessed 22 August 2011].
Cooke-Davies, T.J, Schlichter, F.J & Bredillet, C 2001, Beyond the PMBOK1 Guide,
PMI Annual Seminars and Symposium, Nashville TS.
Cooke-Davies, T.J 2002, ‘Project management maturity models: does it make sense
to adopt one?’, Project Management Today, May, pp. 1–4.
Cooke-Davies, T.J 2004, Project management maturity models, Wiley, Handbook of
Managing Projects. New York.
Cooke-Davies, T. J 2004a. Project management maturity models. New York:
Wiley.
Crawford, L, ‘Developing project management competence for global enterprise,’
Proc ProMAC 2002 Conference. Singapore: Nanyung Technical University.
Crawford, L 2001, ‘Project management competence: The value of standards,’
Henley Management College.
Crawford, L 1998, ‘Standards for a global profession – project management,’ Proc of
the 29th Annual project Management Institute Seminars and Symposium. Sylva, NC,
Project Management Institute, Construction Industry.
1 6 4 | P a g e
Creswell, J. W 1998. Qualitative Inquiry and Research Design: Choosing Among
Five Traditions, 1st ed. Thousand Oaks, California: Sage Publications.
Creswell, J.W 2003. Research Design: Qualitative, Quantitative, and Mixed Methods
Approaches. 2nd ed. Thousand Oaks: Sage Publications.
Datta, L 1994. Paradigm wars: A basis for peaceful coexistence and beyond. In
Reichardt, C.S. & Rallis, S.F. (eds) The qualitative-quantitative debate: New
perspectives. San Francisco: Jossey-Bass.
Denzin, N.K 1978. The research act: An introduction to sociological methods. New
York: McGraw-Hill.
DeFillippi, R.J & Arthur, M 1998, ‘Paradox in project-based enterprise: the case of
filmmaking’, California Manage Rev, vol. 40, no. 2, pp. 125–39.
Demir, C & Kocabas, I 2010, ‘Project Management Maturity Model (PMMM) in
educational Organizations’, Procedia Social and Behavioral Sciences, vol. 9, pp.
1641–1645.
Dinsmore, P.C 1996, ‘Toward corporate project management: beefing up the bottom
line with MOBP’, PM Network, vol. June, pp. 9–11.
Fahrenkrog, S, Wesman, P.R, Lewandowski, A & Keuten, T (2003), ‘Project
Management Institute’s Organizational Project Management Maturity Model(OPM3)’,
Proceedings of the 17th IPMA World Congress, Moscow.
Flick, U 1998. An introduction to qualitative research. Thousand Oaks, CA: Sage.
Foreman, J. 2003. Corporate governance issues in professional sport [online].
Available from:<

1 6 5 | P a g e
http://www.commerce.adelaide.edu.au/apira/Dissertations/Foreman172.pdf>
[Accessed 15 February 2008].
Foster, G, Greyser, P & Walsh, B 2006. The business of sports: Texts and cases on
strategy and management. New York: Thomson.
Frankfort-Nachmias, C & Nachmias, D 1992. Research methods in the social
sciences. 4th ed. New York: St. Martin's Press.
Gareis, R 2003, ‘Management of the Project-Oriented Company’,
Projektmanagement Group, Version 2, pp 1-22.
Gareis, R 2004, Management of the project-oriented company. In: Morris PW, Pinto
JK, editors. The Wiley guide to managing projects. Hoboken, New Jersey: John
Wiley & Sons; p. 123–43.
Gareis, R 1989, ‘Management by projects: the management approach for the future’,
International Journal of Project Management, vol. 7, no. 4, pp. 243–9.
Gareis, R 2005, Happy Projects!, Manz, Vienna.
Gareis, R & Hueman, M 2000, Project managemnt competences in the project-
oriented organization. In: Turner JR, Sinister SJ, editors. Gower handbook of project
management. Aldershot: Gower.
Gareis, R 2003, ‘Management of the Project-Oriented Company’, Version 2,
University of Economics and Business Administration, Vienna.
Gillham, B 2000. Case study research methods. 1st ed. London: Continuum.
Goodwin, L.D & Goodwin, W.L 1984. ‘Qualitative versus quantitative research or
qualitative and quantitative research’, Nursing Research, vol. 33, pp. 378–380.
1 6 6 | P a g e
Greene, J.C, Caracelli, V.J & Graham, W.F 1989. ‘Toward a conceptual framework
for mixed-method evaluation designs’. Educational Evaluation and Policy Analysis,
vol. 11, pp. 255-274.
Hakamiyan, H 2005, “Assessing the role of OPM3 in petrochemical industrial,”
Unpublished.
Hathera, R.M, Burd, E.L & Boldyref, C 1996, ‘A method for Application management
maturity assessment’, Information and Software Technology, vol. 38, pp. 701-709.
Hartman, F 1977, ‘Trends and improvements: Looking beyond modern project
management,’ The 28th Annual Project Management Institute Seminars &
Symposium. Chicago, Project Management Institute.
Hobday, M 2000, ‘The project-based organization: an ideal form for managing
complex products and systems?’, Research Policy vol. 29, no. 7–8, pp. 871–93.
Holmes, S.J & Walsh, R.T 2005. ‘Conducting Effective Project Management Maturity
Assessment Interviews’, Integrated Management Systems, Inc., Ann Arbor, MI.
Hoye, R, Nicholson, M, & Smith, A 2008. Unique aspects of managing sport
organizations. In C. Wankle (Ed.), Sage handbook of 21st century management (pp.
501–509). London: Sage Publications.
Hoye, R, & Cuskelly, G 2007. Sport Governance. Oxford, UK: Elsevier.
Huemann, M 2010, ‘Considering Human Resource Management when developing a
project-oriented company: Case study of a telecommunication company’,
International Journal of Project Management, vol. 28, pp. 361–369.
Ibbs, W.C & Kwak, Y. H 2000, ‘Assessing project management maturity’, Project
Management Journal, vol. 31, no. 1, pp. 32-43.
1 6 7 | P a g e
Ika, L.A 2009, ‘Project success as a Topic in Project Management Journals’, Project
Management Journal, vol. 40, no. 4, pp. 6–19.
Jick, T.D 1979. Mixing qualitative and quantitative methods: Triangulation in action.
Administrative Science Quarterly, vol. 24, pp. 602-611.
Jugdev, K, & Thomas, J 2002, ‘Project management maturity models: The silver
bullets of competitive advantage, Student Dissertation award’, Project Management
Journal, vol. 33, no. 4, pp. 4–14.
Kerzner, H 2004, Advanced Project Management: Best Practices of Implementation.
USA: John Wiley and Sons Inc.
Khoshgoftar, M & Osman, O 2009, Comparison of maturity models [online]. Available
from:<http://www.Computer Science and Information Technology, ICCSIT. 2nd IEEE
International Conference on> [Accessed 15 August 2011].
Kinn, S & Curzio, J 2005. ‘Integrating qualitative and quantitative research Methods’,
Journal of Research in Nursing, vol. 10, no. 3, pp. 317–336.
Klimko, G 2001, ‘Knowledge management and maturity models: Building common
understanding’, Proc. of the 2nd European Conference on Knowledge Management.
Kumar, R 2005. Research Mathodology. 2nd ed. SAGE.
Kwak & Ibbs 2002, ‘Project Management Process Maturity (PM2) Model’, Journal of
Management in Engineering, vol. 18, no. 3, pp. 150-155.
Lampel, J & Jha P.P 2004, Models of project orientation in multiproject
organizations. In: Morris PWG, Pinto JK, editors. The Wiley guide to managing
projects. Hoboken, New Jersey: John Wiley & Sons; pp. 223–36.
1 6 8 | P a g e
Lang, K & Rattay, G 2005. Leben in Projekten: Projektorientierte Karriere- und
Laufbahnmodelle, Linde, Vienna.
Leedy, P. D. & Ormrod, J. A 2005. Practical Research – Planning and Design. 8th
edition. New Jersey: Pearson Prentice Hall.
Levin, G & Skulmoski, G 2000, ‘The project management maturity’, ESI Horizons,
vol. 2, no. 3, pp. 1–7.
Martin, L. A 2000. ‘Effective Data Collection’, Total Quality Management, Vol.11, no.
3, pp. 41.
Mason, S.A 1993. ‘Employing qualitative and quantitative methods in one study’,
British Journal of Nursing, vol. 2, pp. 869–872.
Maxwell, J.A, Bashook, P.G & Sandlow, C.J 1986. Combining ethnographic and
experimental methods in educational evaluation. In Fetterman, D.M. & Pitman M.A.
(eds), Educational evaluation: Ethnography in theory, practice, and politics. Bewerly
Hills, CA: Sage.
Maxwell, J 1997. Designing a qualitative study. In L. Bickman & D. J. Rog (Eds.)
Handbook of applied social research methods (pp. 69-100). Thousand Oaks, CA:
Sage.
McKinley, T.B 1993. ‘The promotion of health through socio-political change:
challenges for research and policy’, Social Sciences in Medicine, vol. 36, pp. 109–
113.
Morgan, G & Smircich, L 1980. ‘The case for qualitative research’. Academy of
Management Review, vol. 5, pp. 491–500.
Morris, P.W.G 2000, Researching the unanswered questions of project
management. In: Proceedings of the PMI Research Conference, Paris, PMI.
1 6 9 | P a g e
Morris, P.W.G 2003, ‘The irrelevance of project management as a professional
discipline’, 17th World Congress on Project Management Moscow: IPMA.
Morris, P.W.G 2001, ‘Updating the project management bodies of knowledge’,
Project Management Journal, vol. 32, pp.21-30.
Myers, M. D 1997. ‘Qualitative Research in Information Systems’. MIS Quarterly.
Vol. 21, no. 2, pp. 241–242.
Myers, S.T & Haase, J.E 1989. ‘Guidelines for integrating quantitative and qualitative
Approaches’, Nursing Research, vol. 38, pp. 798–799.
Ngoepe, B.M 2002. ‘Commission of Inquiry into the Elis Park Stadium Soccer
Disaster of 11 April 2001’, Final Report.
Niglas, K 1999. Quantitative and Qualitative Inquiry in Educational Research: is there
a paradigmatic difference between them? Dissertation given at ECER 1999 in Lahti.
Dissertation is available electronically in Education-line:
http://www.leeds.ac.uk/educol/
Niglas, K 2000. Combining Quantitative and Qualitative approaches. Dissertation
given at ECER 2000 in Edinburgh. Dissertation is available electronically in
Education-line: http://www.leeds.ac.uk/educol/documents/00001544.htm
Noll, R 2003, ‘The organization of sports leagues’, Oxford Review of Economic
Policy, vol. 19, pp. 530–551.
Office of Government Commerce (OGC) 2006. Portfolio, Programme and Project
Management Maturity Model (P3M3®). Introduction and Guide to P3M3®. Version
2.1 [online]. Available
1 7 0 | P a g e
from:<http://www.ogc.gov.uk/documents/P3M3_Introduction_and_Guide.pdf>
[Accessed 15 June 2011].
OGC 2006, Portfolio, Programme & Project Management Maturity Model (P3M3)
(Version 1.0), Office of Government Commerce (OGC), Crown. pp. 1-77.
Ong, B.N 1993. The Practice of Health Services Research. London: Chapman and Hall.
Organizational Project Management Maturity Models [online]. Available from:<
http://www.pmforum.org/standards/matmatrix.htm> [Accessed 22 August
2011].
Paulk, M.C, Curtis, B, Chrissis, M.B & Weber, C.V 1993, Capability Maturity Model
for Software (Version 1.1). Carnegie Mellon University, Software Engineering
Institute.
Pennypacker, J. S., and Grant, K. P. 2003. ‘Project management maturity: An
industry benchmark’, Project Management Journal, 34(1): 4-11.
Perry, C 2001. ‘Case Research in Marketing’, The Marketing Review, vol. 17, no. 3, pp. 303-323.
Peterson, A. S 2000, ‘The impact of PM maturity on integrated PM processes’,
Proceedings of the 31st Annual Project Management Institute 2000 Seminars and
Symposium Philadelphia: Project Management Institute.
PMI 2003, Organizational Project Management Maturity Model (OPM3®),
Knowledge Foundation. Newtown Square, Pennsylvania, USA: Project Management
Institute, Inc.
PMI 2008, A Guide to the Project Management Body of Knowledge, fourth ed.,
Project Management Institute (PMI), (PMBOK).
1 7 1 | P a g e
PMI 2008, Organizational Project Management Maturity Model (OPM3) Knowledge
Foundation, second ed., Project Management Institute (PMI).
Project Management Institute (PMI) 2011. Organizational Project Management
Maturity Model [online]. Available from:<http://www.pmi.org/Business-
Solutions/OPM3-Overview.aspx> [Accessed 08 June 2011].
(PMI 2011). What is PMI? [online]. Available from:<http://www.pmi.org/About-
Us/About-Us-What-is-PMI.aspx> [Accessed 31 August 2011].
PMI 2011. PMBOK® Guide and Standards [online]. Available
from:<(http://www.pmi.org/PMBOK-Guide-and-Standards.aspx)> [Accessed 31
August 2011].
Project Smart 2011. PMBOK & PMP [online]. Available
from:<http://www.projectsmart.co.uk/pmbok-and-pmp.html> [Accessed 01
September 2011]
PMI OPM3 Online 2011, [Online]. Available from:
http://opm3online.pmi.org/demo/reports_ppp.shtml [Accessed 12 September 2011].
PMI OPM3 Online 2011, [Online]. Available from:
http://opm3online.pmi.org/demo/reports_smci.shtml [Accessed 12 September 2011].
PMI OPM3 Online 2011, [Online]. Available from:
http://opm3online.pmi.org/demo/reports.shtml [Accessed 12 September 2011].
Slack, T 1996, ‘From the locker room to the boardroom: Changing the domain of
sport management’, Journal of Sport Management, vol. 10, pp. 97–105.
1 7 2 | P a g e
Slack, T 1998, ‘Is there anything unique about sport?’, Journal for Sport
Management, vol. 5, no. 2, pp. 21–29.
Senge, P 1994. The fifth discipline fieldbook: Strategies and tools for building a
learning organization. New York: Doubleday.
Smith A.C.T & Stewart, B 2010, ‘The special features of sport: A critical revisit’. Sport
Management Review, vol. 13, pp 1–13.
Smith M.J 1988. Contemporary communication research methods. Belmont, CA:
Wadsworth, Inc.
Sonnekus, R & Labuschagne, L 2004, ‘Establishing the relationship between IT
project management maturity and IT project success in a South African context’,
Proceedings of the 2004 PMSA International Conference ‘Global Knowledge for
Project Management Professionals’, Johannesburg, South Africa.
Springer, J 1998. International Journal of Document Analysis [Online]. Available
from: http://gort.ucsd.edu/newjour/i/msg02536.htmln [Accessed 20 September 2011].
Stewart, R & Smith, A 1999, ‘The special features of sport’, Annals of Leisure
Research, vol. 2, pp. 87–99.
Supic, H 2005, ‘Project management maturity of selected organizations in Croatia’,
8th International Conference on Telecommunications – ConTEL, Zagreb, Croatia,
ISBN: 953-184-081-4.
Syzmanski, S, & Kuypers, T 1999. Winners and losers: The business strategy of
football. Harmondsworth, UK: Viking Press.
Tashakkori, A & Teddlie, C 1998. Mixed Methodology: Combining Qualitative and
Quantitative Approaches. Thousand Oaks, CA:Sage.
1 7 3 | P a g e
Teddlie, C & Yu, F 2007, ‘Mixed Methods Sampling: A Typology With Examples’,
Journal of Mixed Methods Research, vol. 1, no. 1, pp. 77-100.
Ting-Toomey, S 1984. Qualitative research: An overview. In Gudykunst,
W.W. & Kim, Y.Y. (eds.), Methods for intercultural communication research
(pp 169–184). Beverly Hills, CA: Sage Publications.
Thiry, M & Deguire, M 2007, ‘Recent developments in project-based organizations’,
International Journal of Project Management, vol. 25, pp. 649–658.
Thomas, J, Connie, D.L, Judev, K & Buckle, P 2002, ‘Selling project management to
senior executives: The case for avoiding crisis sales’, Project Management Journal.
vol. 33, pp.19-29.
Turner, R.J & Keegan, A.E 1999, ‘The versatile project-based organization:
governance and operational control’, European Management Journal, vol. 17, no. 3,
pp. 296–309.
Vogel, A. J 2006. Guidelines for Preparation of Expatriates on International
Assignments in South African Maultinational Enteprises. Doctor Commercii
(Business Management) Dissertation. University of South Africa, Pretoria.
Von Wangenheim, C.G, Da Silva, D.A, Buglione, L, Scheidt, R & Prikladnicki, R
2010, ‘Best practice fusion of CMMI-DEV v1.2 (PP, PMC, SAM) and PMBOK 2008’,
Information and Software Technology, vol. 52. pp. 749–757.
Walsh, K 2003. ‘Qualitative Research: Advancing the Science and Practice of
Hospitality’. Cornell Hotel & Restaurant Quarterly. Vol. 44, no. 12. Pp. 66-75.
Webster 1988. The new lexicon Webster’s dictionary of the English language.
Edition. NY: Lexicon Publications.
1 7 4 | P a g e
Weerdmeester, R, Pocaterra, C & Hefke, M 2003, ‘VISION Next-Generation
knowledge management’, Information Societies Technology (IST) Programme.
Weik, A & Roberts, K 1993, ‘Collective mind in organizations heedful interrelating on
flight decks’, Administrative Quarterly 38.
Wysocki, R. K 2004, Project Management Process Improvement. Norwood: Artech
House, Inc.
Yin, Y. K 1994. Case Study Research: Design and Methods. Sage, Thousand Oaks,
CA.
Zeigler, E.F 1987, ‘Sport management: Past, present, future’, Journal of Sport
Management, vol.1, pp. 4-24.
Zeigler, E.F 1996, ‘From the Locker Room to the Board Room: Changing the Domain
of Sport Management’. Journal of Sport Management, vol. 10, pp. 97-105.
Zikmund , W. G 2003. Business Research Methods. 7th ed. Mason: Thomson South-
Western.
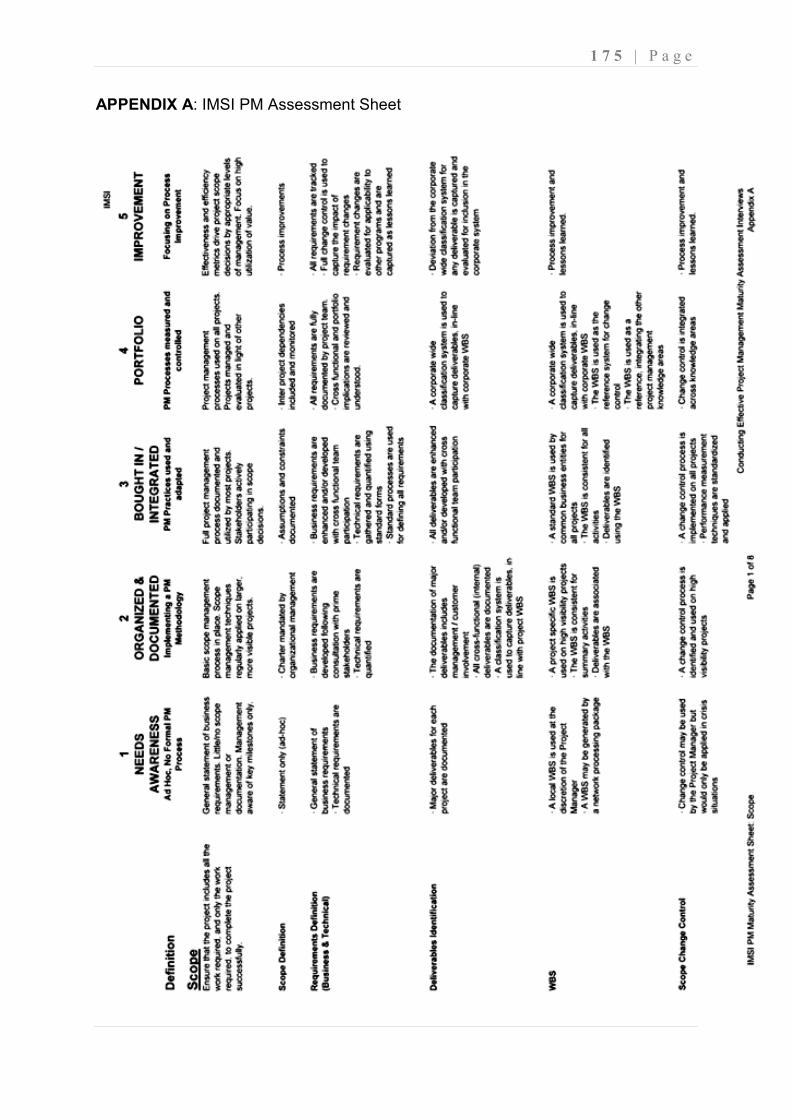
APPENDIX A: IMSI PM Assessment Sheet
IMSI PM Assessment Sheet
1 7 5 | P a g e
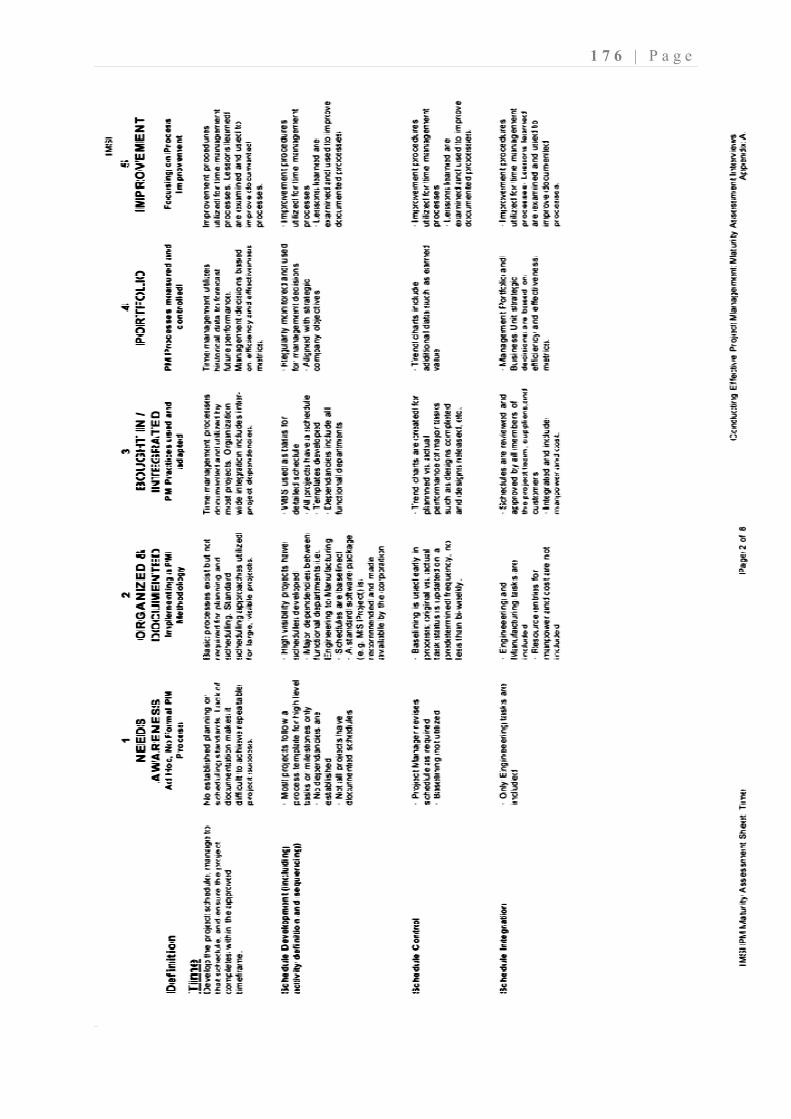
1 7 6 | P a g e
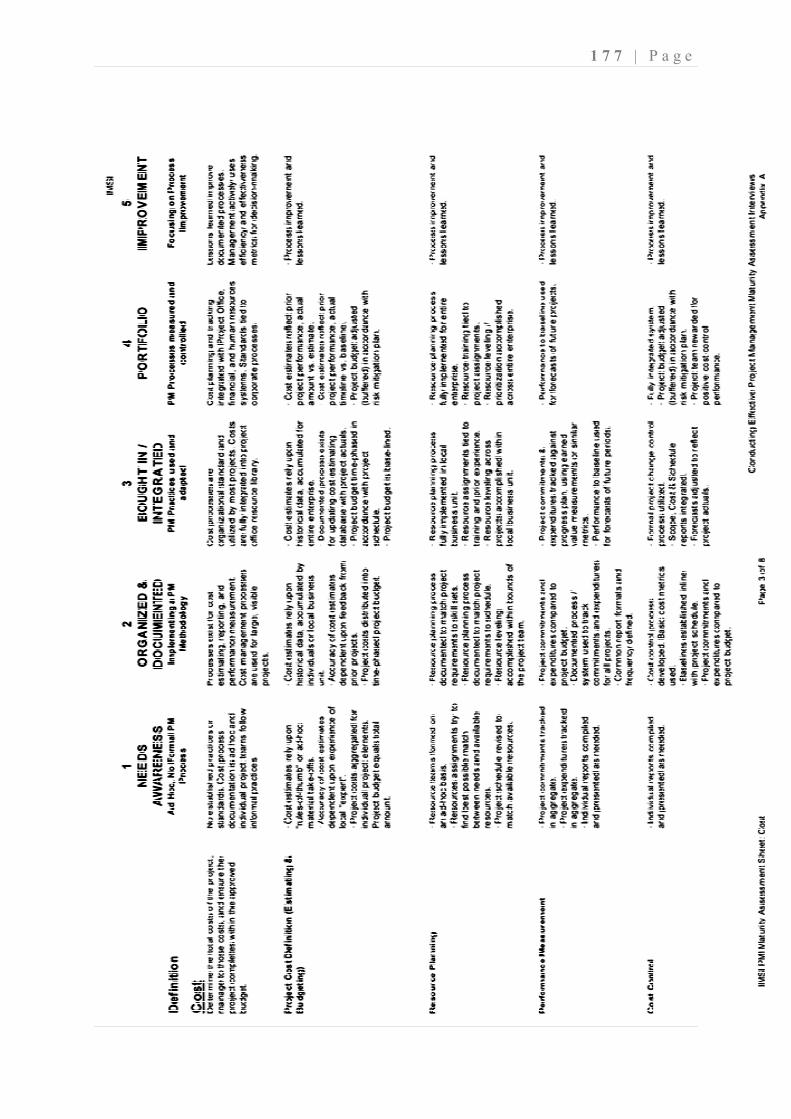
1 7 7 | P a g e
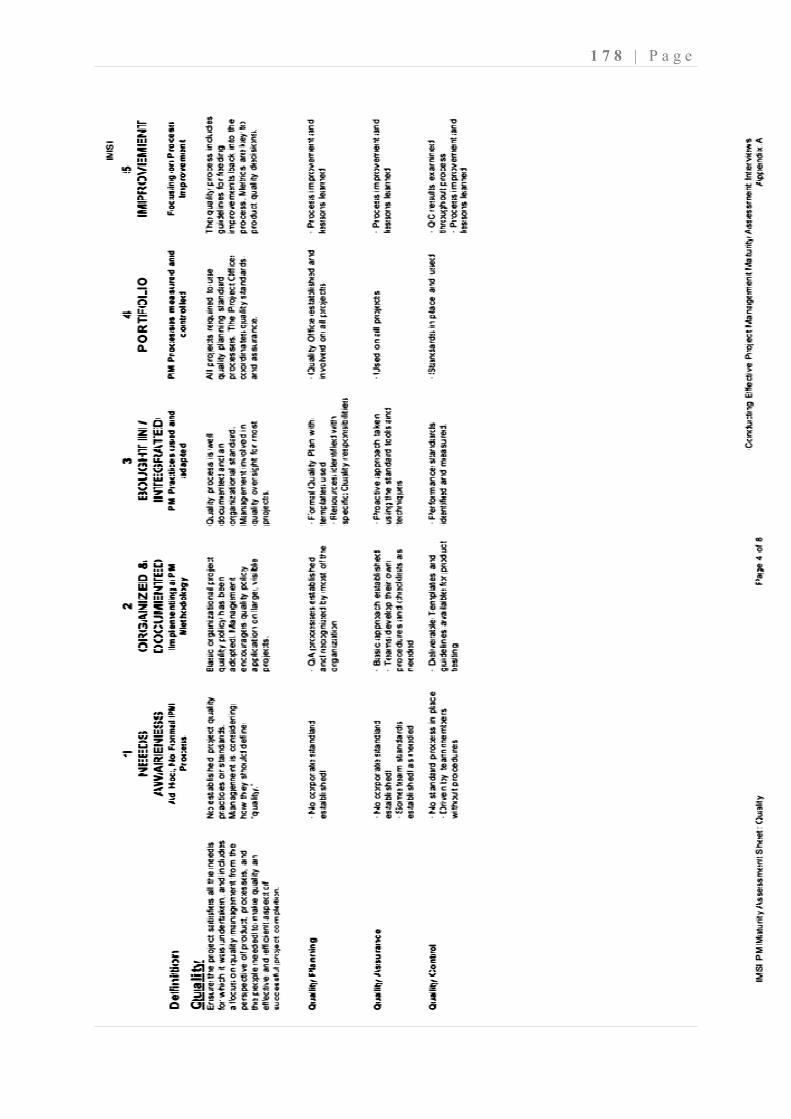
1 7 8 | P a g e
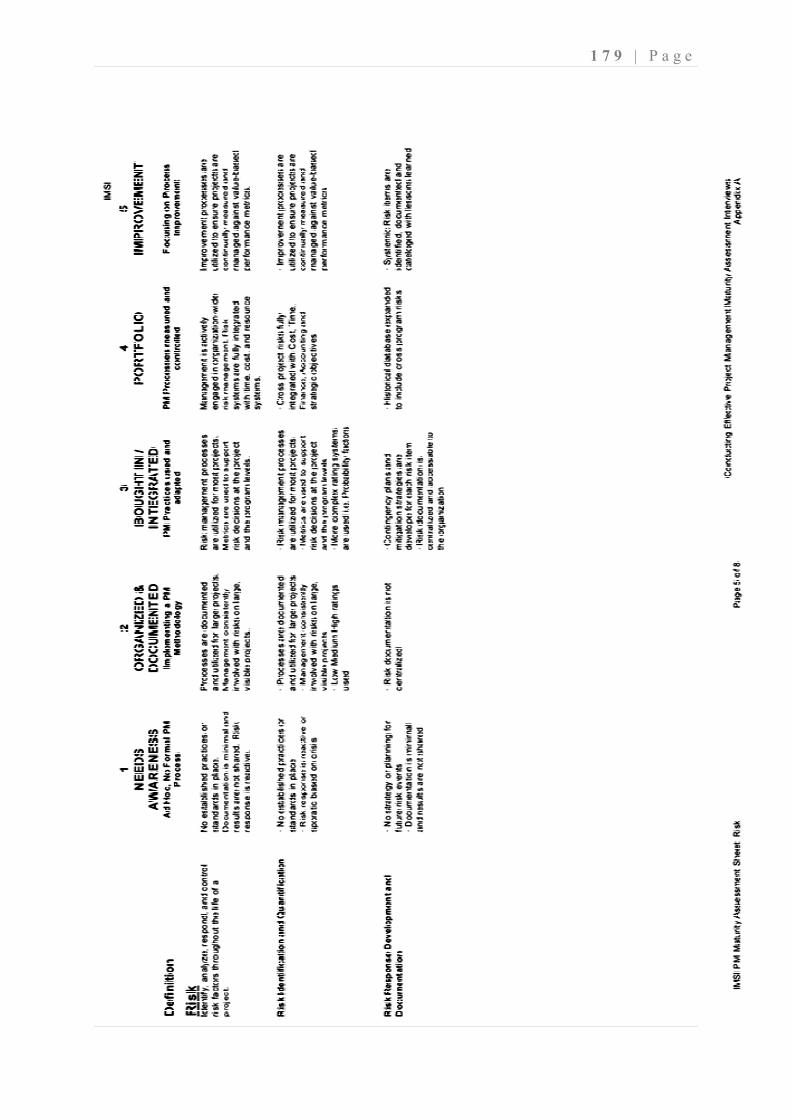
1 7 9 | P a g e
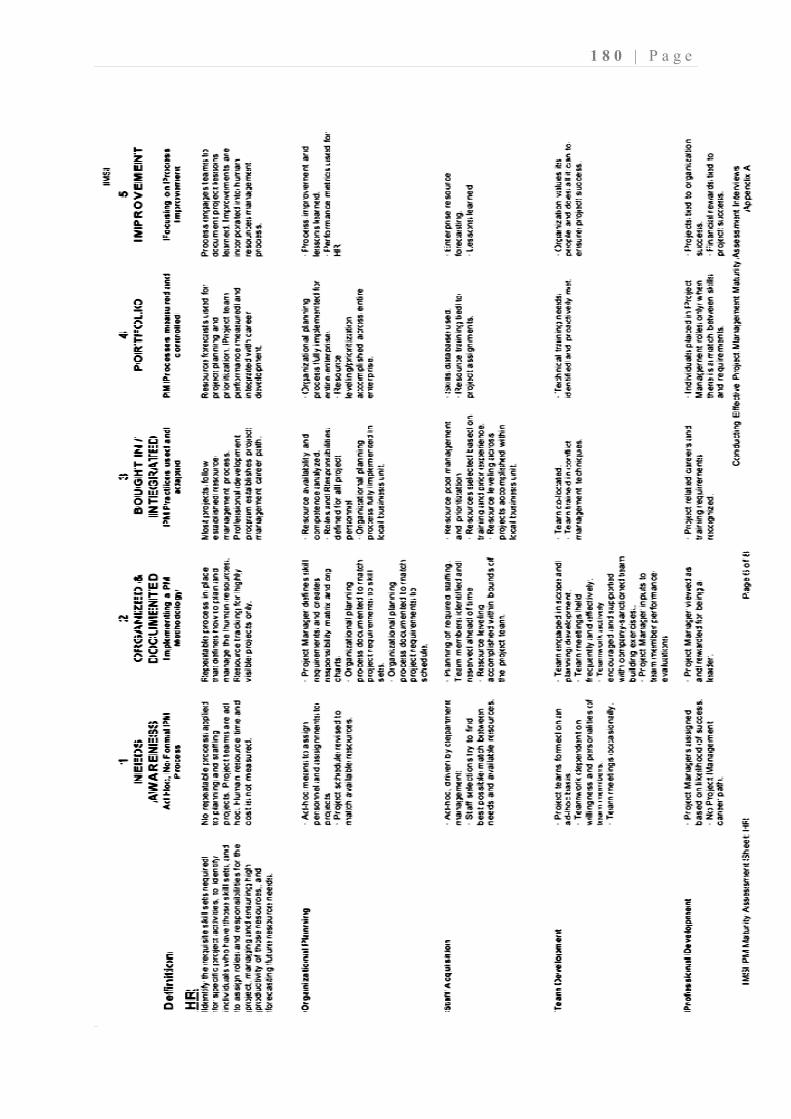
1 8 0 | P a g e
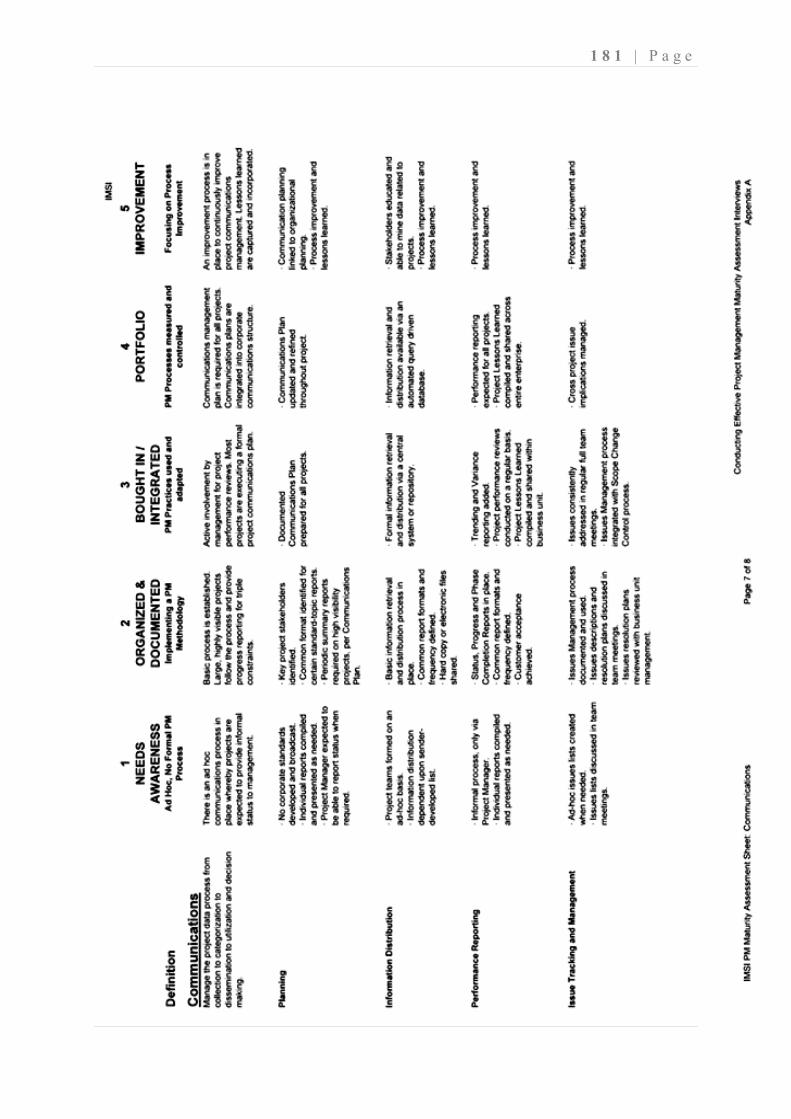
1 8 1 | P a g e
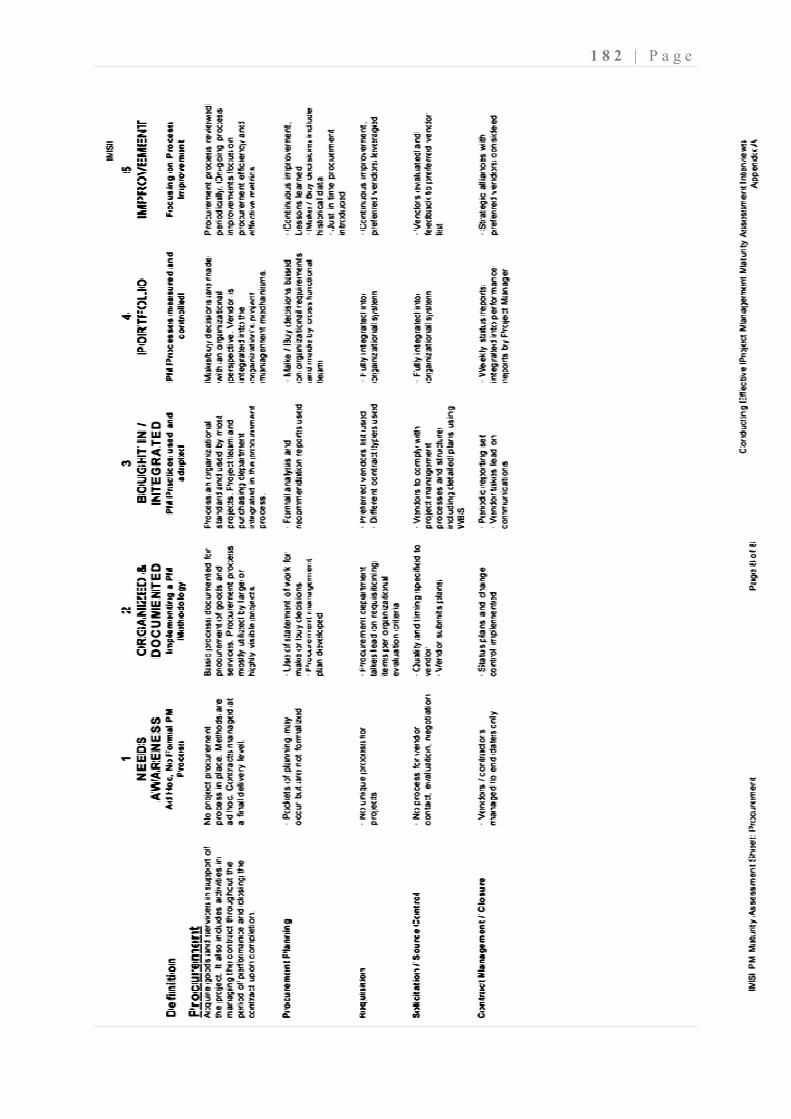
1 8 2 | P a g e
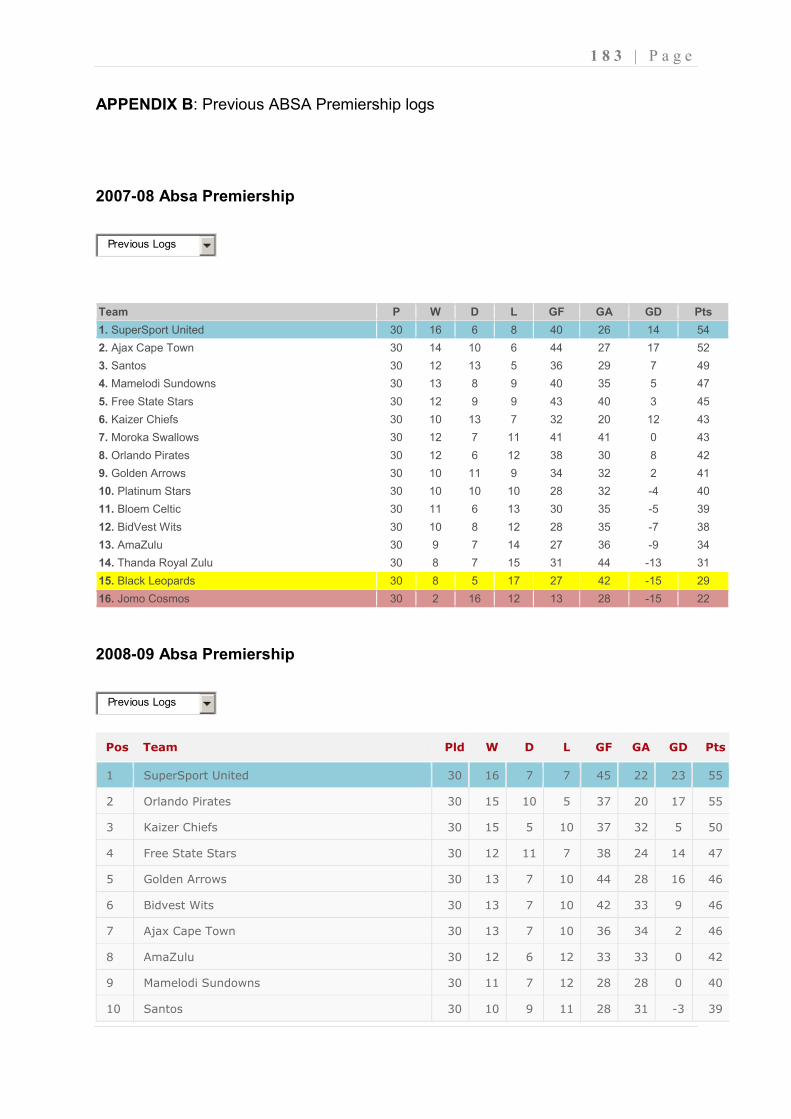
1 8 3 | P a g e
APPENDIX B: Previous ABSA Premiership logs
2007-08 Absa Premiership
Previous Logs
Team P W D L GF GA GD Pts
1. SuperSport United 30 16 6 8 40 26 14 54
2. Ajax Cape Town 30 14 10 6 44 27 17 52
3. Santos 30 12 13 5 36 29 7 49
4. Mamelodi Sundowns 30 13 8 9 40 35 5 47
5. Free State Stars 30 12 9 9 43 40 3 45
6. Kaizer Chiefs 30 10 13 7 32 20 12 43
7. Moroka Swallows 30 12 7 11 41 41 0 43
8. Orlando Pirates 30 12 6 12 38 30 8 42
9. Golden Arrows 30 10 11 9 34 32 2 41
10. Platinum Stars 30 10 10 10 28 32 -4 40
11. Bloem Celtic 30 11 6 13 30 35 -5 39
12. BidVest Wits 30 10 8 12 28 35 -7 38
13. AmaZulu 30 9 7 14 27 36 -9 34
14. Thanda Royal Zulu 30 8 7 15 31 44 -13 31
15. Black Leopards 30 8 5 17 27 42 -15 29
16. Jomo Cosmos 30 2 16 12 13 28 -15 22
2008-09 Absa Premiership
Previous Logs
Pos Team Pld W D L GF GA GD Pts
1 SuperSport United 30 16 7 7 45 22 23 55
2 Orlando Pirates 30 15 10 5 37 20 17 55
3 Kaizer Chiefs 30 15 5 10 37 32 5 50
4 Free State Stars 30 12 11 7 38 24 14 47
5 Golden Arrows 30 13 7 10 44 28 16 46
6 Bidvest Wits 30 13 7 10 42 33 9 46
7 Ajax Cape Town 30 13 7 10 36 34 2 46
8 AmaZulu 30 12 6 12 33 33 0 42
9 Mamelodi Sundowns 30 11 7 12 28 28 0 40
10 Santos 30 10 9 11 28 31 -3 39
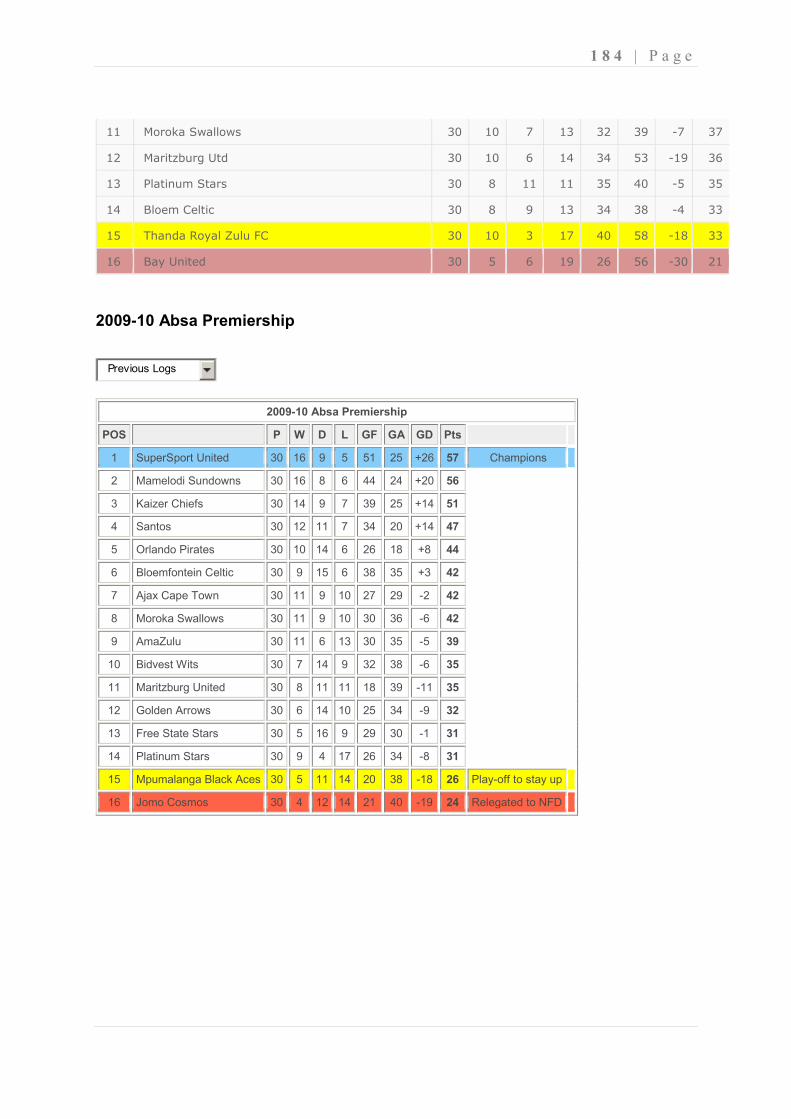
1 8 4 | P a g e
11 Moroka Swallows 30 10 7 13 32 39 -7 37
12 Maritzburg Utd 30 10 6 14 34 53 -19 36
13 Platinum Stars 30 8 11 11 35 40 -5 35
14 Bloem Celtic 30 8 9 13 34 38 -4 33
15 Thanda Royal Zulu FC 30 10 3 17 40 58 -18 33
16 Bay United 30 5 6 19 26 56 -30 21
2009-10 Absa Premiership
Previous Logs
2009-10 Absa Premiership
POS
P W D L GF GA GD Pts
1 SuperSport United 30 16 9 5 51 25 +26 57 Champions
2 Mamelodi Sundowns 30 16 8 6 44 24 +20 56
3 Kaizer Chiefs 30 14 9 7 39 25 +14 51
4 Santos 30 12 11 7 34 20 +14 47
5 Orlando Pirates 30 10 14 6 26 18 +8 44
6 Bloemfontein Celtic 30 9 15 6 38 35 +3 42
7 Ajax Cape Town 30 11 9 10 27 29 -2 42
8 Moroka Swallows 30 11 9 10 30 36 -6 42
9 AmaZulu 30 11 6 13 30 35 -5 39
10 Bidvest Wits 30 7 14 9 32 38 -6 35
11 Maritzburg United 30 8 11 11 18 39 -11 35
12 Golden Arrows 30 6 14 10 25 34 -9 32
13 Free State Stars 30 5 16 9 29 30 -1 31
14 Platinum Stars 30 9 4 17 26 34 -8 31
15 Mpumalanga Black Aces 30 5 11 14 20 38 -18 26 Play-off to stay up
16 Jomo Cosmos 30 4 12 14 21 40 -19 24 Relegated to NFD
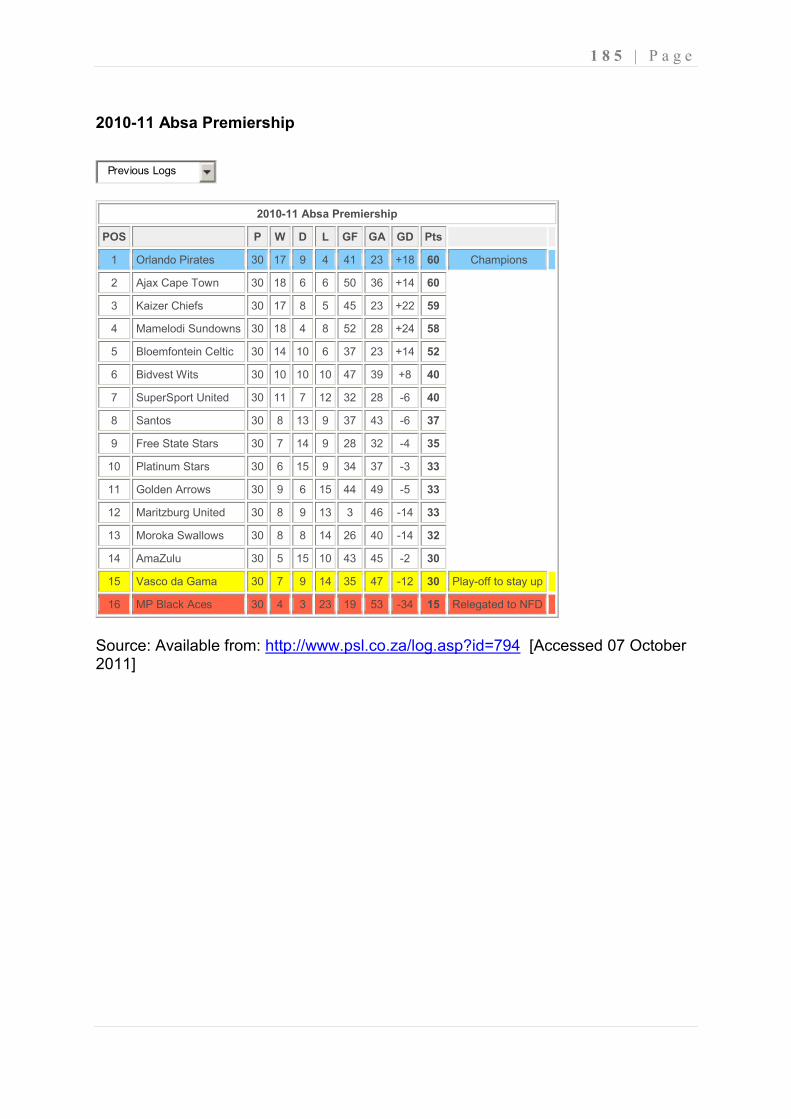
1 8 5 | P a g e
2010-11 Absa Premiership
Previous Logs
2010-11 Absa Premiership
POS
P W D L GF GA GD Pts
1 Orlando Pirates 30 17 9 4 41 23 +18 60 Champions
2 Ajax Cape Town 30 18 6 6 50 36 +14 60
3 Kaizer Chiefs 30 17 8 5 45 23 +22 59
4 Mamelodi Sundowns 30 18 4 8 52 28 +24 58
5 Bloemfontein Celtic 30 14 10 6 37 23 +14 52
6 Bidvest Wits 30 10 10 10 47 39 +8 40
7 SuperSport United 30 11 7 12 32 28 -6 40
8 Santos 30 8 13 9 37 43 -6 37
9 Free State Stars 30 7 14 9 28 32 -4 35
10 Platinum Stars 30 6 15 9 34 37 -3 33
11 Golden Arrows 30 9 6 15 44 49 -5 33
12 Maritzburg United 30 8 9 13 3 46 -14 33
13 Moroka Swallows 30 8 8 14 26 40 -14 32
14 AmaZulu 30 5 15 10 43 45 -2 30
15 Vasco da Gama 30 7 9 14 35 47 -12 30 Play-off to stay up
16 MP Black Aces 30 4 3 23 19 53 -34 15 Relegated to NFD
Source: Available from: http://www.psl.co.za/log.asp?id=794 [Accessed 07 October 2011]
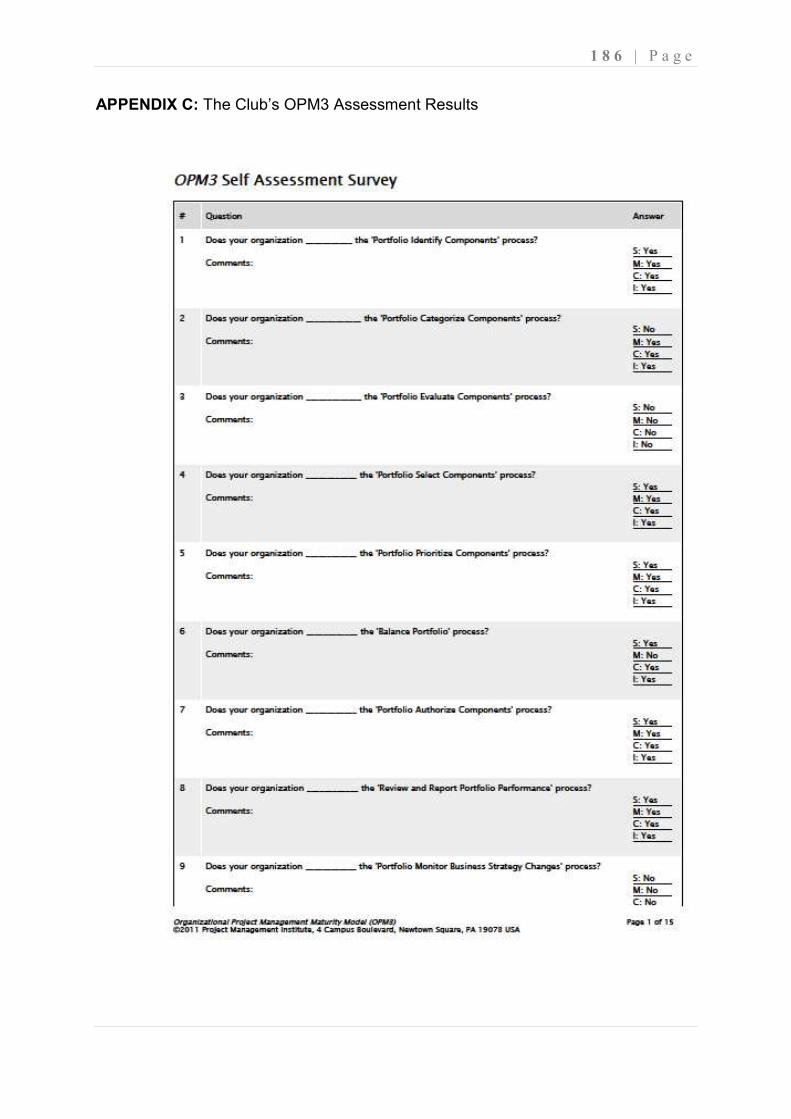
1 8 6 | P a g e
APPENDIX C: The Club’s OPM3 Assessment Results
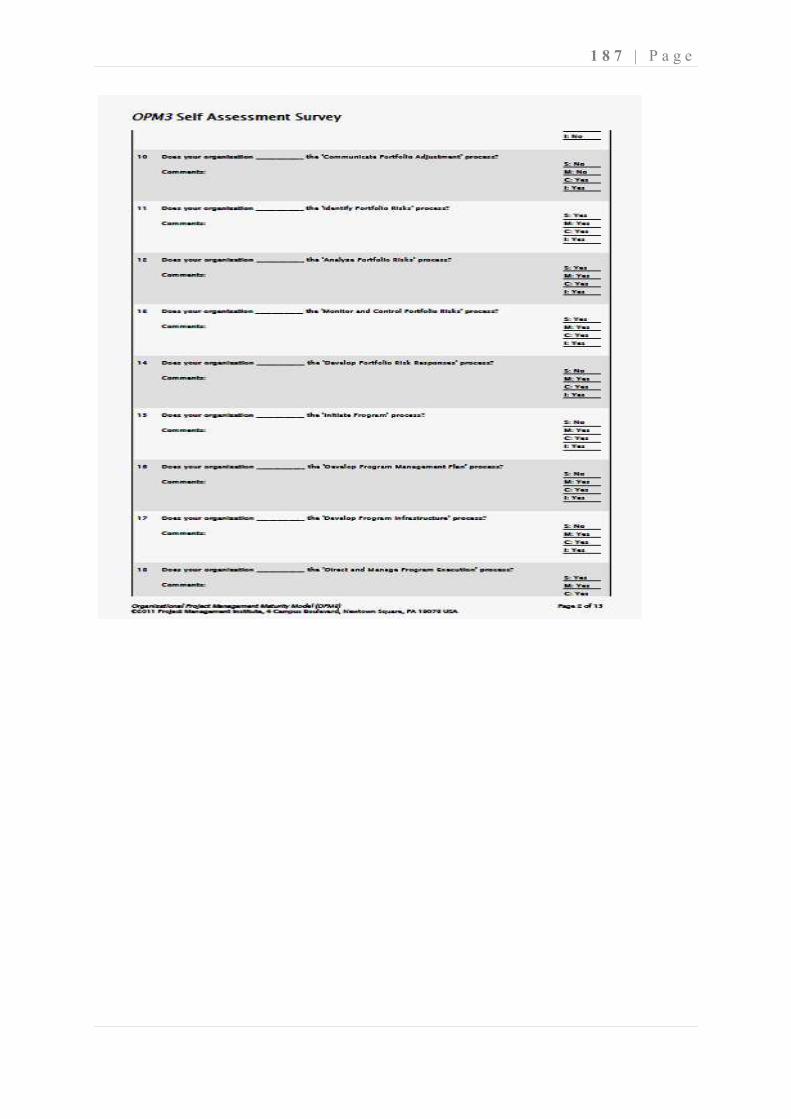
1 8 7 | P a g e
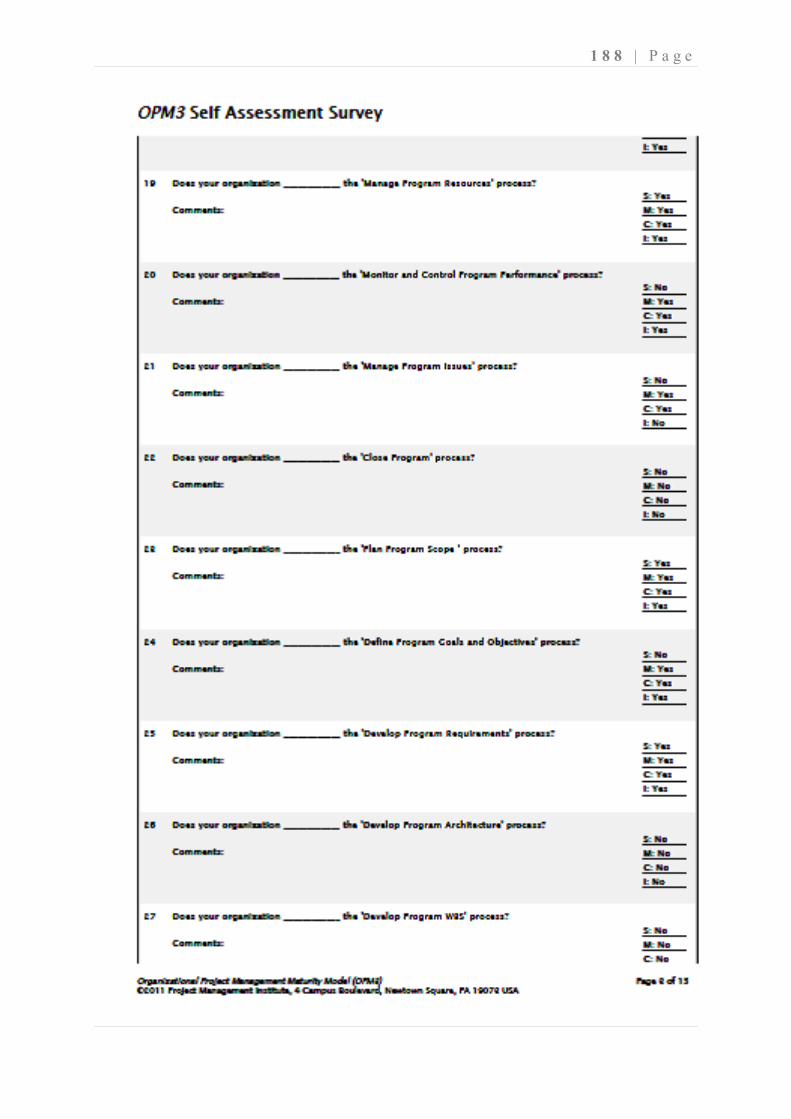
1 8 8 | P a g e
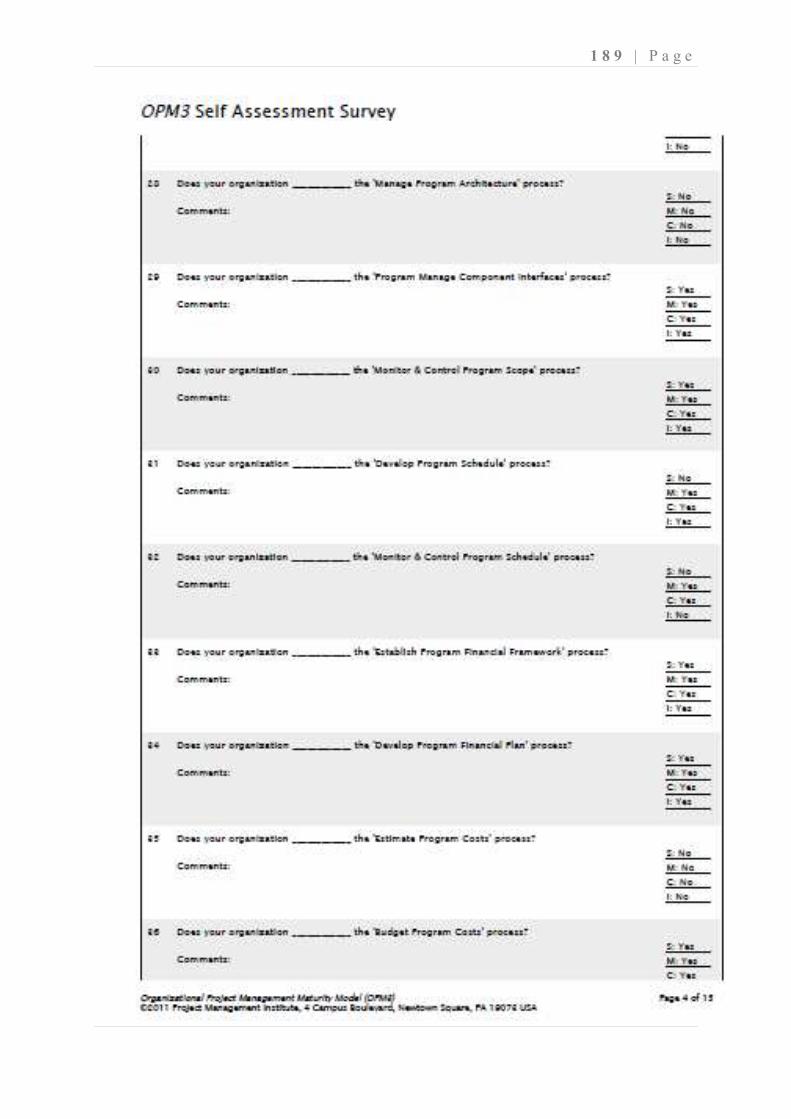
1 8 9 | P a g e
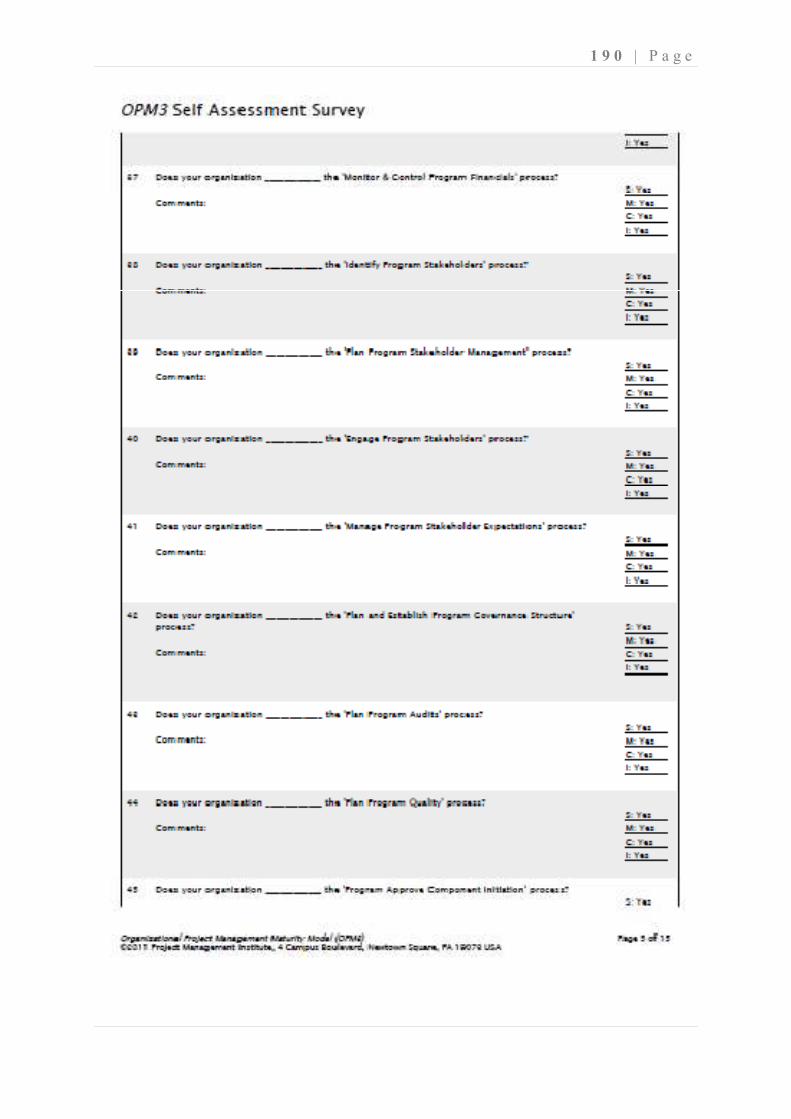
1 9 0 | P a g e
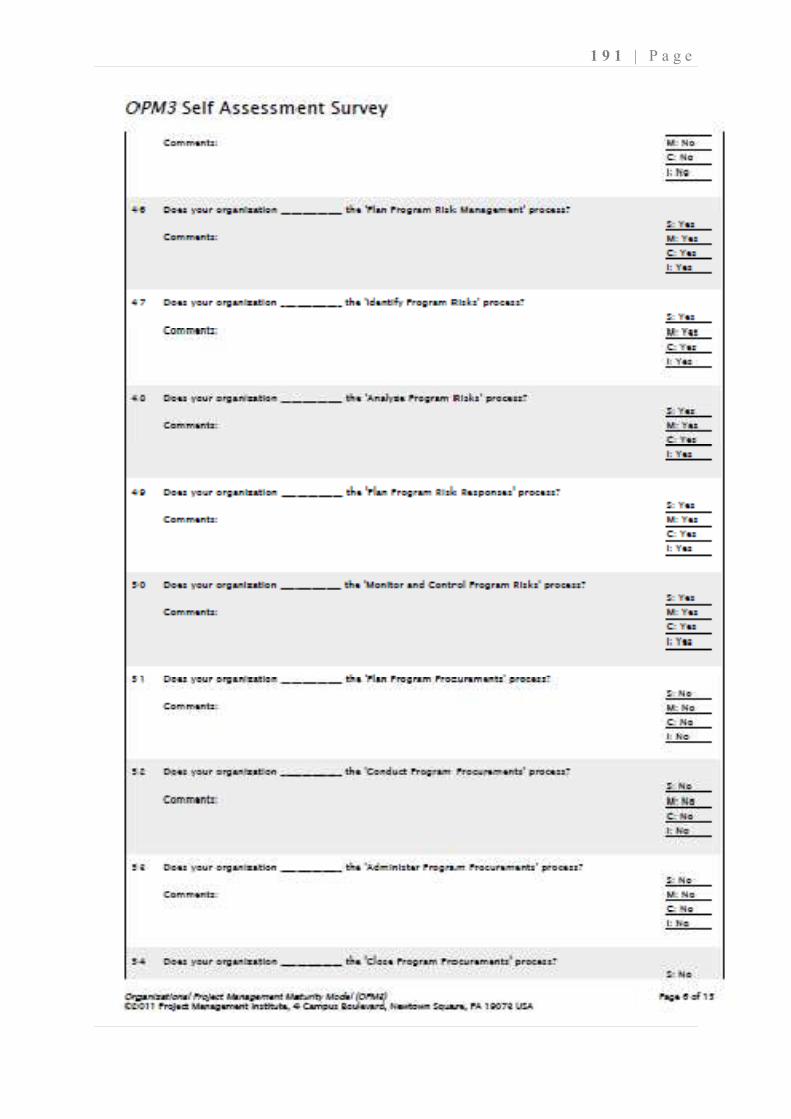
1 9 1 | P a g e
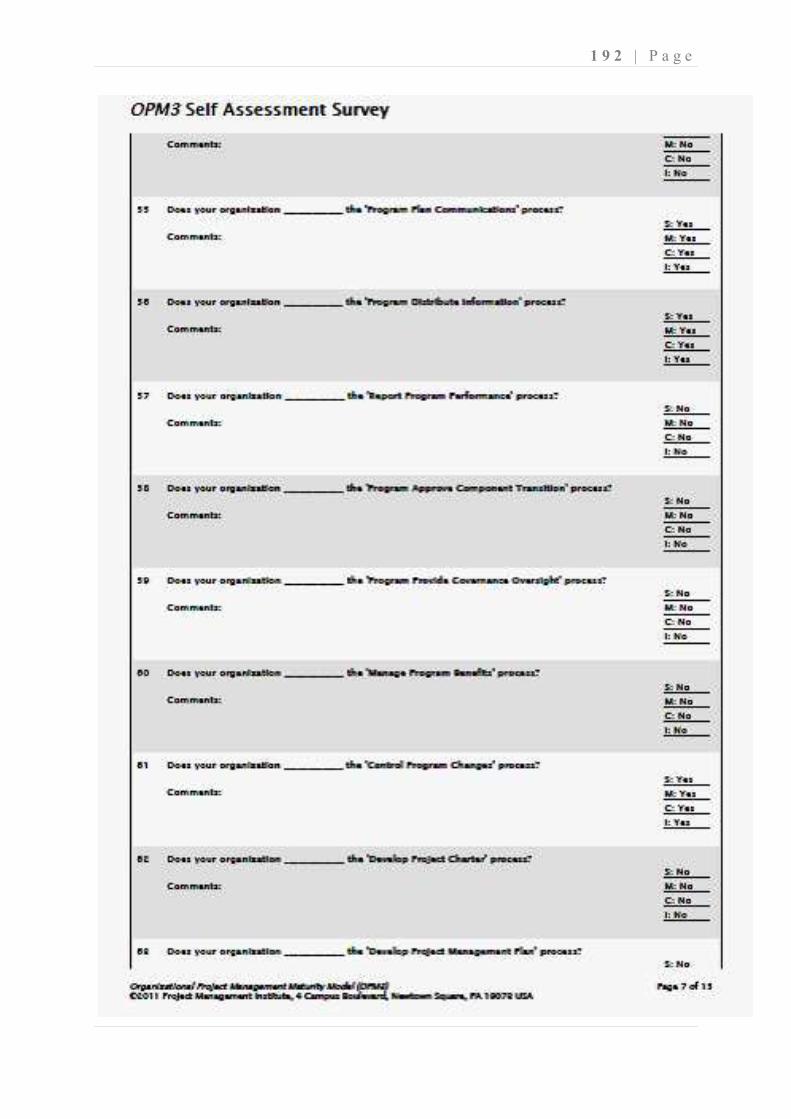
1 9 2 | P a g e
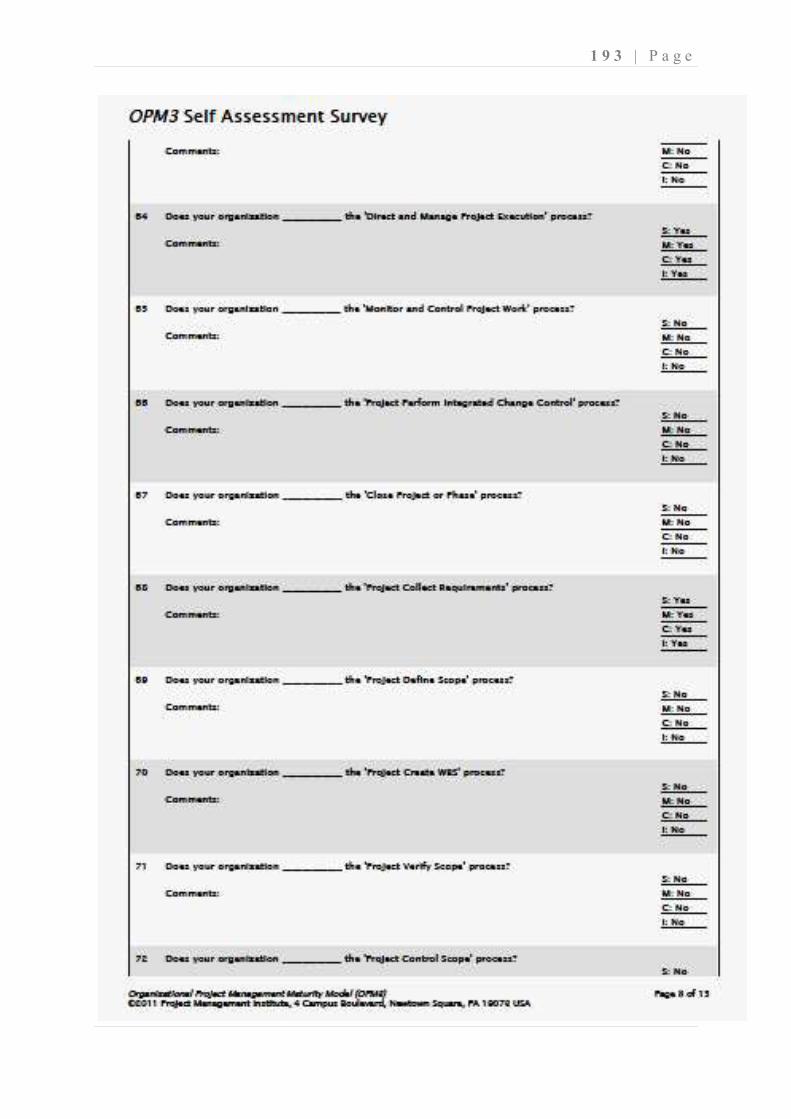
1 9 3 | P a g e
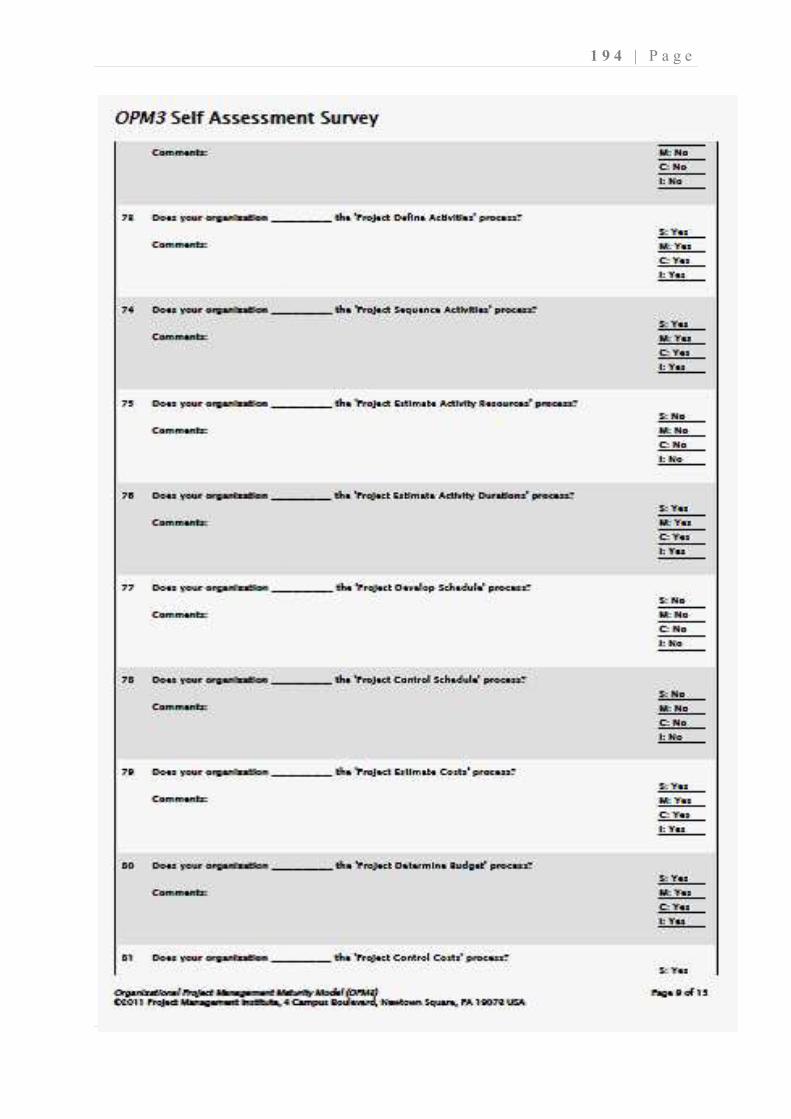
1 9 4 | P a g e
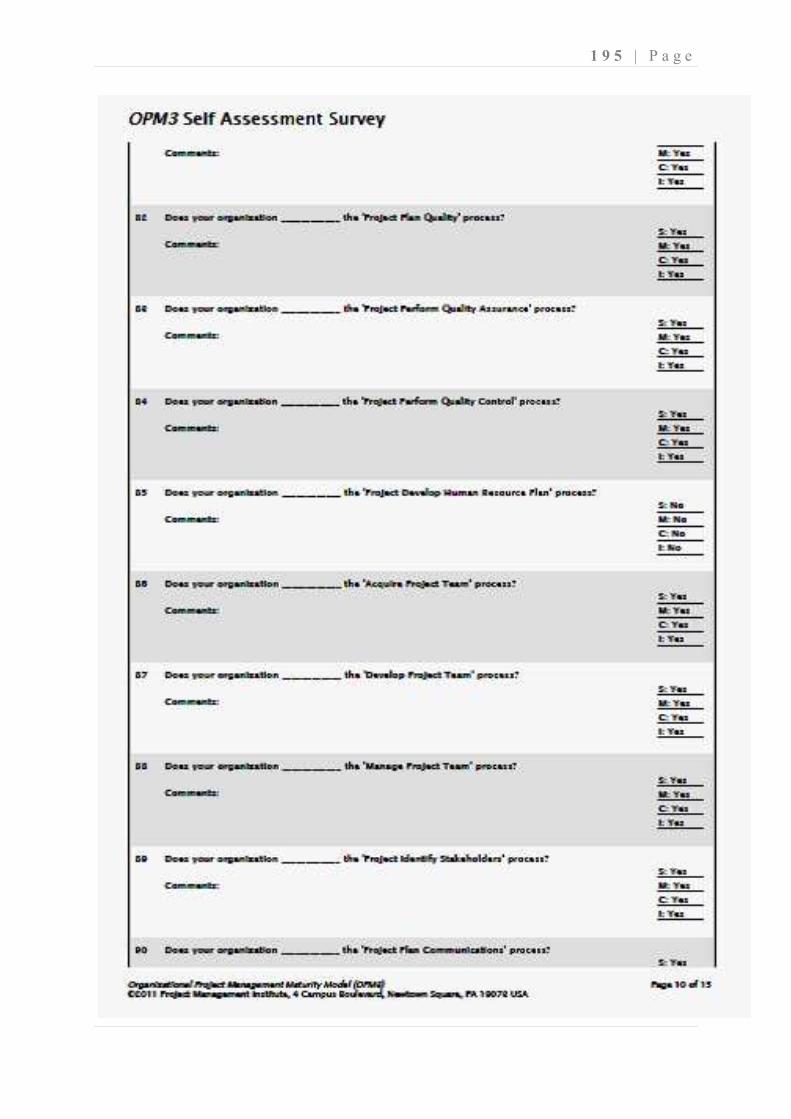
1 9 5 | P a g e
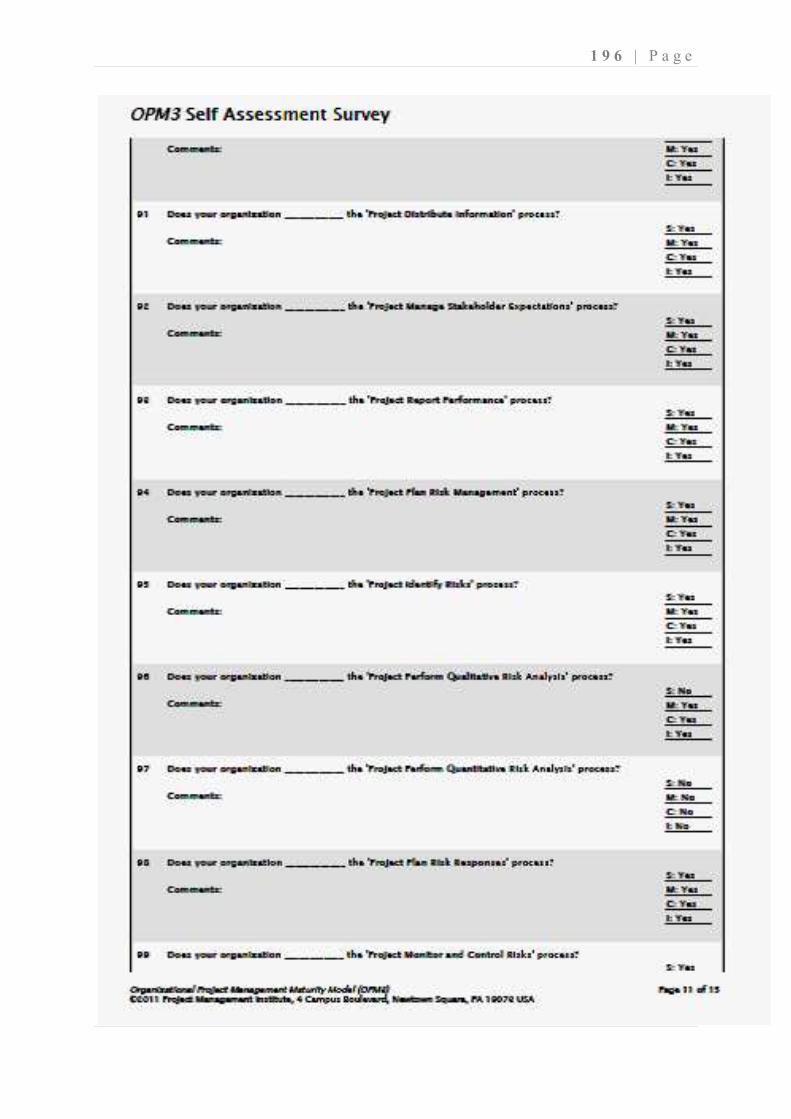
1 9 6 | P a g e
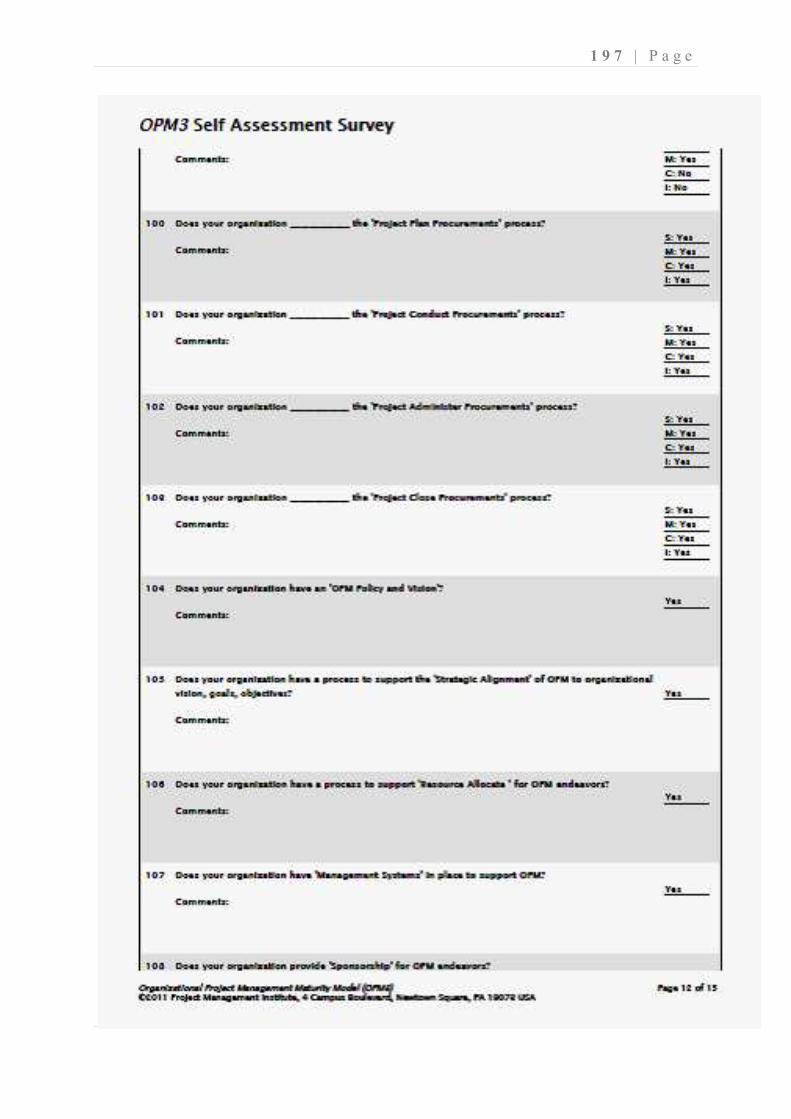
1 9 7 | P a g e
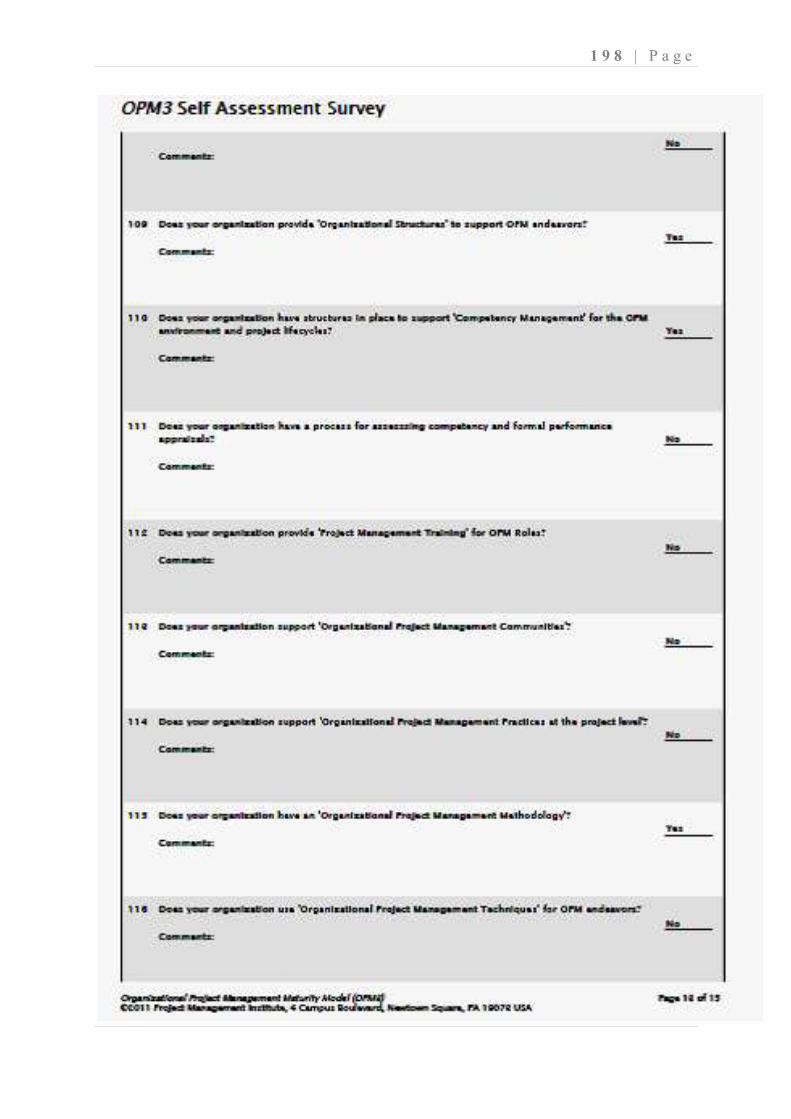
1 9 8 | P a g e
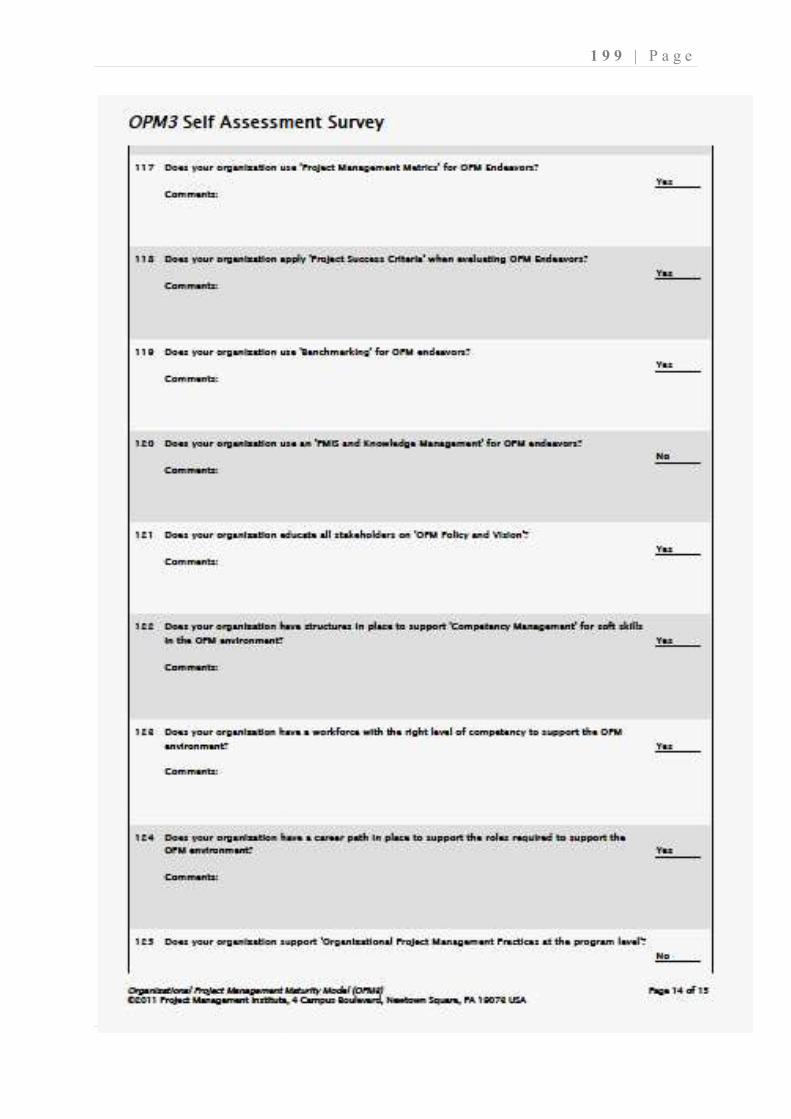
1 9 9 | P a g e
2 0 0 | P a g e
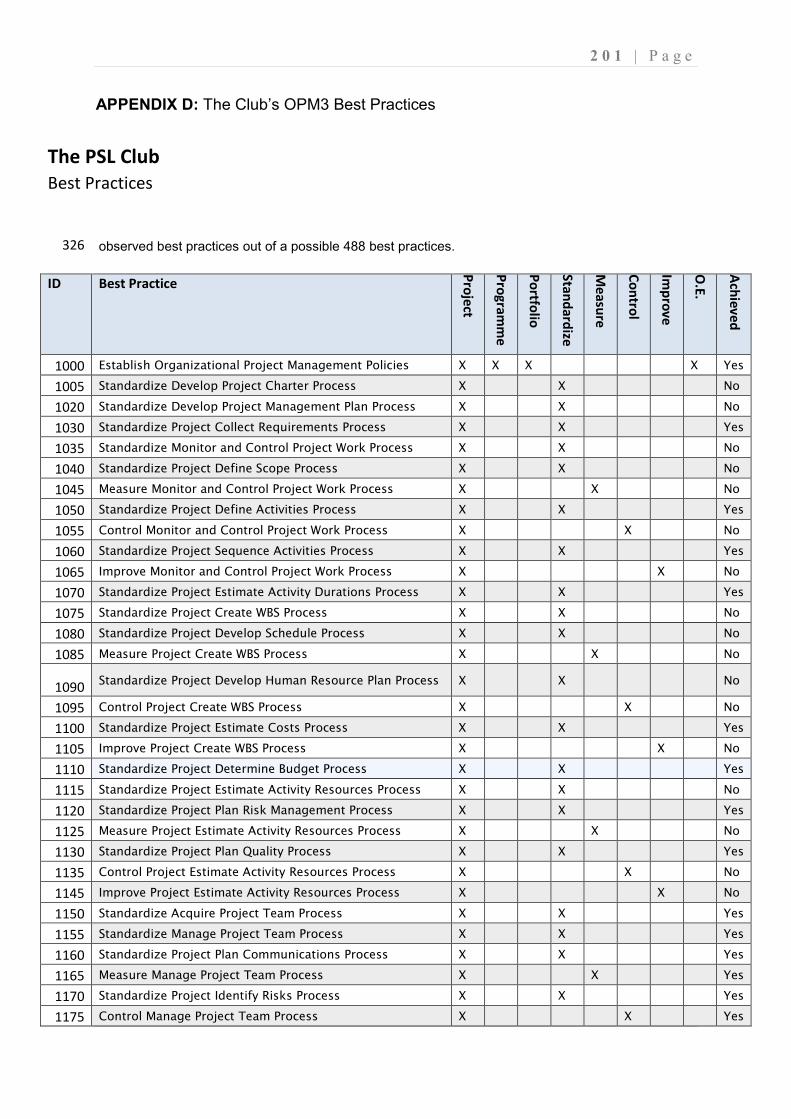
2 0 1 | P a g e
APPENDIX D: The Club’s OPM3 Best Practices
The PSL Club
Best Practices
326 observed best practices out of a possible 488 best practices.
ID Best Practice
Pro
ject
Pro
gra
mm
e
Po
rtfolio
Sta
nd
ard
ize
Me
asu
re
Co
ntro
l
Imp
rov
e
O.E
.
Ach
iev
ed
1000 Establish Organizational Project Management Policies X X X X Yes
1005 Standardize Develop Project Charter Process X X No
1020 Standardize Develop Project Management Plan Process X X No
1030 Standardize Project Collect Requirements Process X X Yes
1035 Standardize Monitor and Control Project Work Process X X No
1040 Standardize Project Define Scope Process X X No
1045 Measure Monitor and Control Project Work Process X X No
1050 Standardize Project Define Activities Process X X Yes
1055 Control Monitor and Control Project Work Process X X No
1060 Standardize Project Sequence Activities Process X X Yes
1065 Improve Monitor and Control Project Work Process X X No
1070 Standardize Project Estimate Activity Durations Process X X Yes
1075 Standardize Project Create WBS Process X X No
1080 Standardize Project Develop Schedule Process X X No
1085 Measure Project Create WBS Process X X No
1090 Standardize Project Develop Human Resource Plan Process X X No
1095 Control Project Create WBS Process X X No
1100 Standardize Project Estimate Costs Process X X Yes
1105 Improve Project Create WBS Process X X No
1110 Standardize Project Determine Budget Process X X Yes
1115 Standardize Project Estimate Activity Resources Process X X No
1120 Standardize Project Plan Risk Management Process X X Yes
1125 Measure Project Estimate Activity Resources Process X X No
1130 Standardize Project Plan Quality Process X X Yes
1135 Control Project Estimate Activity Resources Process X X No
1145 Improve Project Estimate Activity Resources Process X X No
1150 Standardize Acquire Project Team Process X X Yes
1155 Standardize Manage Project Team Process X X Yes
1160 Standardize Project Plan Communications Process X X Yes
1165 Measure Manage Project Team Process X X Yes
1170 Standardize Project Identify Risks Process X X Yes
1175 Control Manage Project Team Process X X Yes
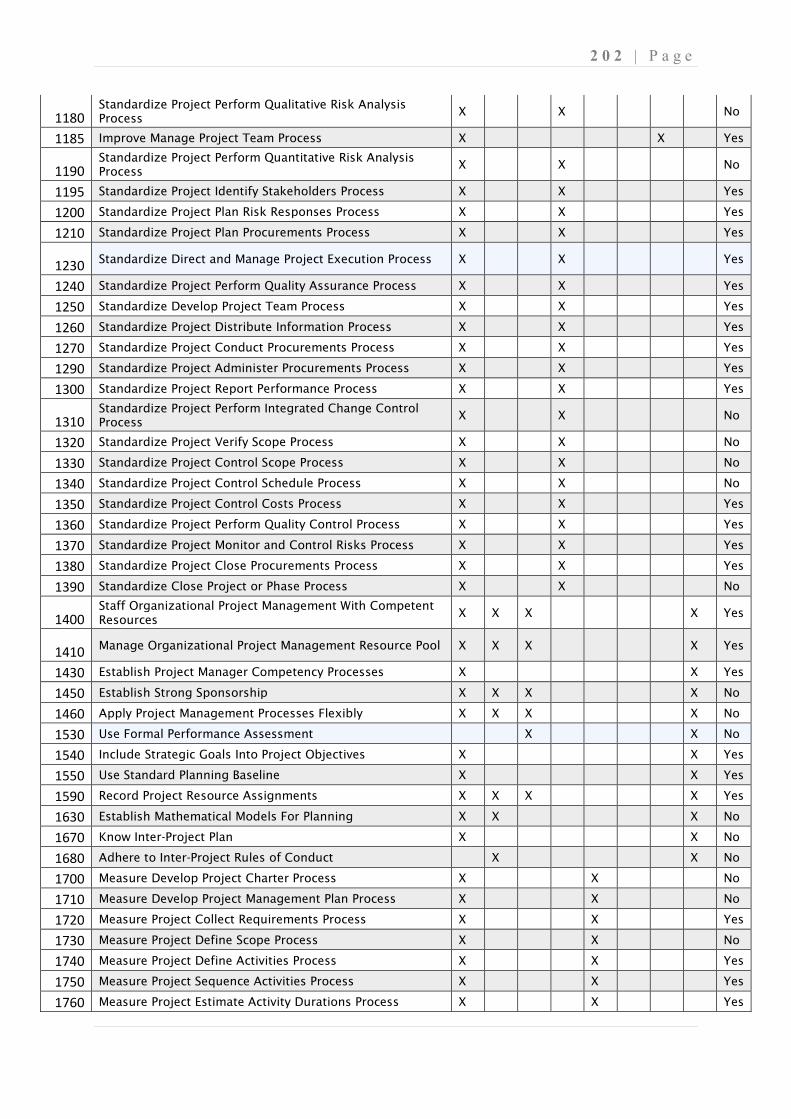
2 0 2 | P a g e
1180 Standardize Project Perform Qualitative Risk Analysis Process
X X No
1185 Improve Manage Project Team Process X X Yes
1190 Standardize Project Perform Quantitative Risk Analysis Process
X X No
1195 Standardize Project Identify Stakeholders Process X X Yes
1200 Standardize Project Plan Risk Responses Process X X Yes
1210 Standardize Project Plan Procurements Process X X Yes
1230 Standardize Direct and Manage Project Execution Process X X Yes
1240 Standardize Project Perform Quality Assurance Process X X Yes
1250 Standardize Develop Project Team Process X X Yes
1260 Standardize Project Distribute Information Process X X Yes
1270 Standardize Project Conduct Procurements Process X X Yes
1290 Standardize Project Administer Procurements Process X X Yes
1300 Standardize Project Report Performance Process X X Yes
1310 Standardize Project Perform Integrated Change Control Process
X X No
1320 Standardize Project Verify Scope Process X X No
1330 Standardize Project Control Scope Process X X No
1340 Standardize Project Control Schedule Process X X No
1350 Standardize Project Control Costs Process X X Yes
1360 Standardize Project Perform Quality Control Process X X Yes
1370 Standardize Project Monitor and Control Risks Process X X Yes
1380 Standardize Project Close Procurements Process X X Yes
1390 Standardize Close Project or Phase Process X X No
1400 Staff Organizational Project Management With Competent Resources
X X X X Yes
1410 Manage Organizational Project Management Resource Pool X X X X Yes
1430 Establish Project Manager Competency Processes X X Yes
1450 Establish Strong Sponsorship X X X X No
1460 Apply Project Management Processes Flexibly X X X X No
1530 Use Formal Performance Assessment X X No
1540 Include Strategic Goals Into Project Objectives X X Yes
1550 Use Standard Planning Baseline X X Yes
1590 Record Project Resource Assignments X X X X Yes
1630 Establish Mathematical Models For Planning X X X No
1670 Know Inter-Project Plan X X No
1680 Adhere to Inter-Project Rules of Conduct X X No
1700 Measure Develop Project Charter Process X X No
1710 Measure Develop Project Management Plan Process X X No
1720 Measure Project Collect Requirements Process X X Yes
1730 Measure Project Define Scope Process X X No
1740 Measure Project Define Activities Process X X Yes
1750 Measure Project Sequence Activities Process X X Yes
1760 Measure Project Estimate Activity Durations Process X X Yes
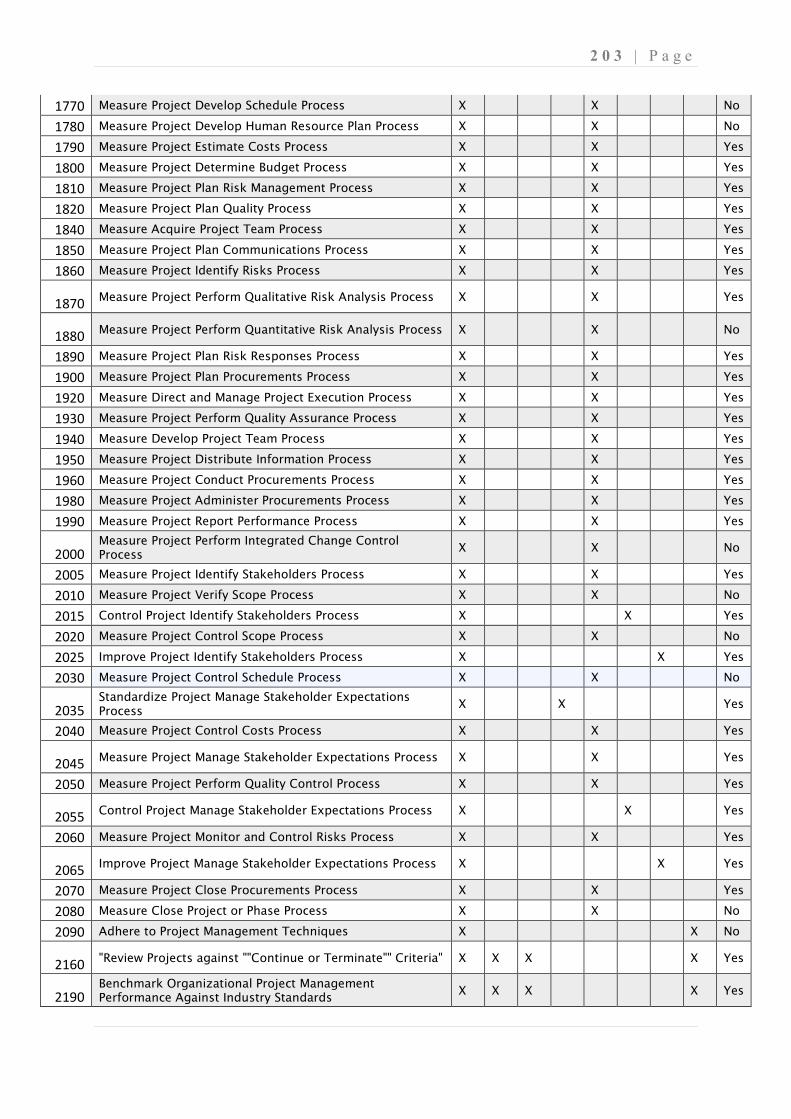
2 0 3 | P a g e
1770 Measure Project Develop Schedule Process X X No
1780 Measure Project Develop Human Resource Plan Process X X No
1790 Measure Project Estimate Costs Process X X Yes
1800 Measure Project Determine Budget Process X X Yes
1810 Measure Project Plan Risk Management Process X X Yes
1820 Measure Project Plan Quality Process X X Yes
1840 Measure Acquire Project Team Process X X Yes
1850 Measure Project Plan Communications Process X X Yes
1860 Measure Project Identify Risks Process X X Yes
1870 Measure Project Perform Qualitative Risk Analysis Process X X Yes
1880 Measure Project Perform Quantitative Risk Analysis Process X X No
1890 Measure Project Plan Risk Responses Process X X Yes
1900 Measure Project Plan Procurements Process X X Yes
1920 Measure Direct and Manage Project Execution Process X X Yes
1930 Measure Project Perform Quality Assurance Process X X Yes
1940 Measure Develop Project Team Process X X Yes
1950 Measure Project Distribute Information Process X X Yes
1960 Measure Project Conduct Procurements Process X X Yes
1980 Measure Project Administer Procurements Process X X Yes
1990 Measure Project Report Performance Process X X Yes
2000 Measure Project Perform Integrated Change Control Process
X X No
2005 Measure Project Identify Stakeholders Process X X Yes
2010 Measure Project Verify Scope Process X X No
2015 Control Project Identify Stakeholders Process X X Yes
2020 Measure Project Control Scope Process X X No
2025 Improve Project Identify Stakeholders Process X X Yes
2030 Measure Project Control Schedule Process X X No
2035 Standardize Project Manage Stakeholder Expectations Process
X X Yes
2040 Measure Project Control Costs Process X X Yes
2045 Measure Project Manage Stakeholder Expectations Process X X Yes
2050 Measure Project Perform Quality Control Process X X Yes
2055 Control Project Manage Stakeholder Expectations Process X X Yes
2060 Measure Project Monitor and Control Risks Process X X Yes
2065 Improve Project Manage Stakeholder Expectations Process X X Yes
2070 Measure Project Close Procurements Process X X Yes
2080 Measure Close Project or Phase Process X X No
2090 Adhere to Project Management Techniques X X No
2160 "Review Projects against ""Continue or Terminate"" Criteria" X X X X Yes
2190 Benchmark Organizational Project Management Performance Against Industry Standards
X X X X Yes
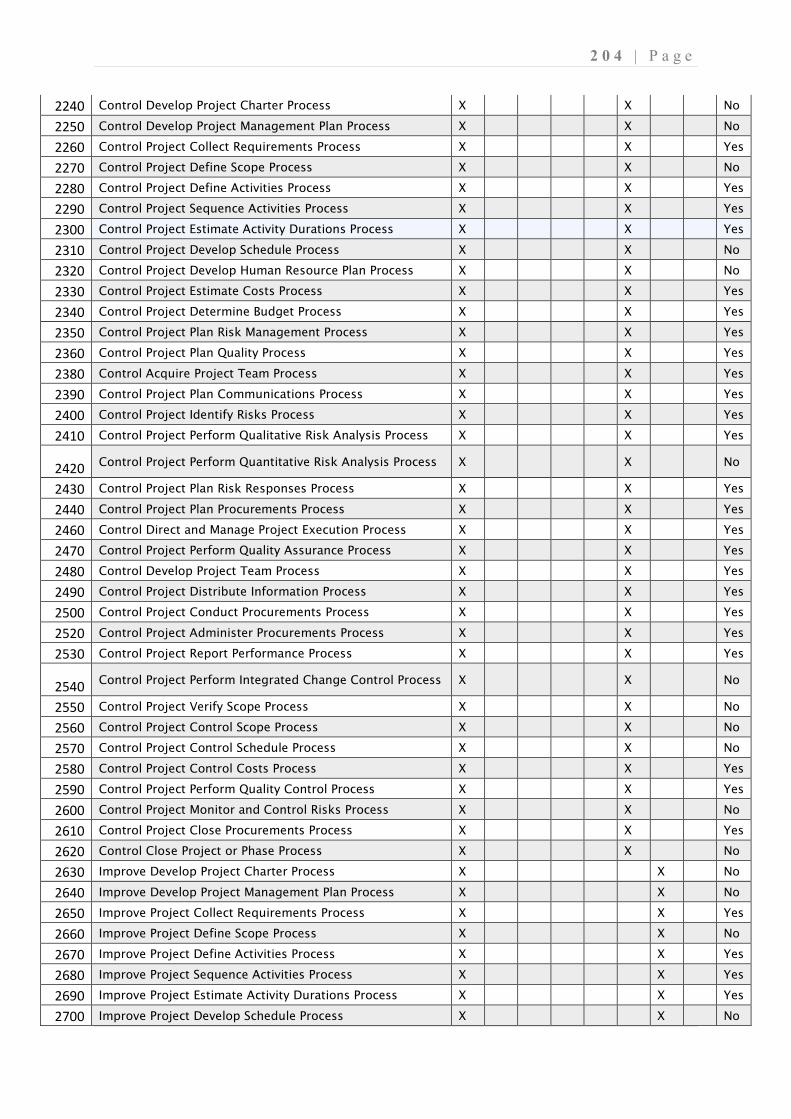
2 0 4 | P a g e
2240 Control Develop Project Charter Process X X No
2250 Control Develop Project Management Plan Process X X No
2260 Control Project Collect Requirements Process X X Yes
2270 Control Project Define Scope Process X X No
2280 Control Project Define Activities Process X X Yes
2290 Control Project Sequence Activities Process X X Yes
2300 Control Project Estimate Activity Durations Process X X Yes
2310 Control Project Develop Schedule Process X X No
2320 Control Project Develop Human Resource Plan Process X X No
2330 Control Project Estimate Costs Process X X Yes
2340 Control Project Determine Budget Process X X Yes
2350 Control Project Plan Risk Management Process X X Yes
2360 Control Project Plan Quality Process X X Yes
2380 Control Acquire Project Team Process X X Yes
2390 Control Project Plan Communications Process X X Yes
2400 Control Project Identify Risks Process X X Yes
2410 Control Project Perform Qualitative Risk Analysis Process X X Yes
2420 Control Project Perform Quantitative Risk Analysis Process X X No
2430 Control Project Plan Risk Responses Process X X Yes
2440 Control Project Plan Procurements Process X X Yes
2460 Control Direct and Manage Project Execution Process X X Yes
2470 Control Project Perform Quality Assurance Process X X Yes
2480 Control Develop Project Team Process X X Yes
2490 Control Project Distribute Information Process X X Yes
2500 Control Project Conduct Procurements Process X X Yes
2520 Control Project Administer Procurements Process X X Yes
2530 Control Project Report Performance Process X X Yes
2540 Control Project Perform Integrated Change Control Process X X No
2550 Control Project Verify Scope Process X X No
2560 Control Project Control Scope Process X X No
2570 Control Project Control Schedule Process X X No
2580 Control Project Control Costs Process X X Yes
2590 Control Project Perform Quality Control Process X X Yes
2600 Control Project Monitor and Control Risks Process X X No
2610 Control Project Close Procurements Process X X Yes
2620 Control Close Project or Phase Process X X No
2630 Improve Develop Project Charter Process X X No
2640 Improve Develop Project Management Plan Process X X No
2650 Improve Project Collect Requirements Process X X Yes
2660 Improve Project Define Scope Process X X No
2670 Improve Project Define Activities Process X X Yes
2680 Improve Project Sequence Activities Process X X Yes
2690 Improve Project Estimate Activity Durations Process X X Yes
2700 Improve Project Develop Schedule Process X X No
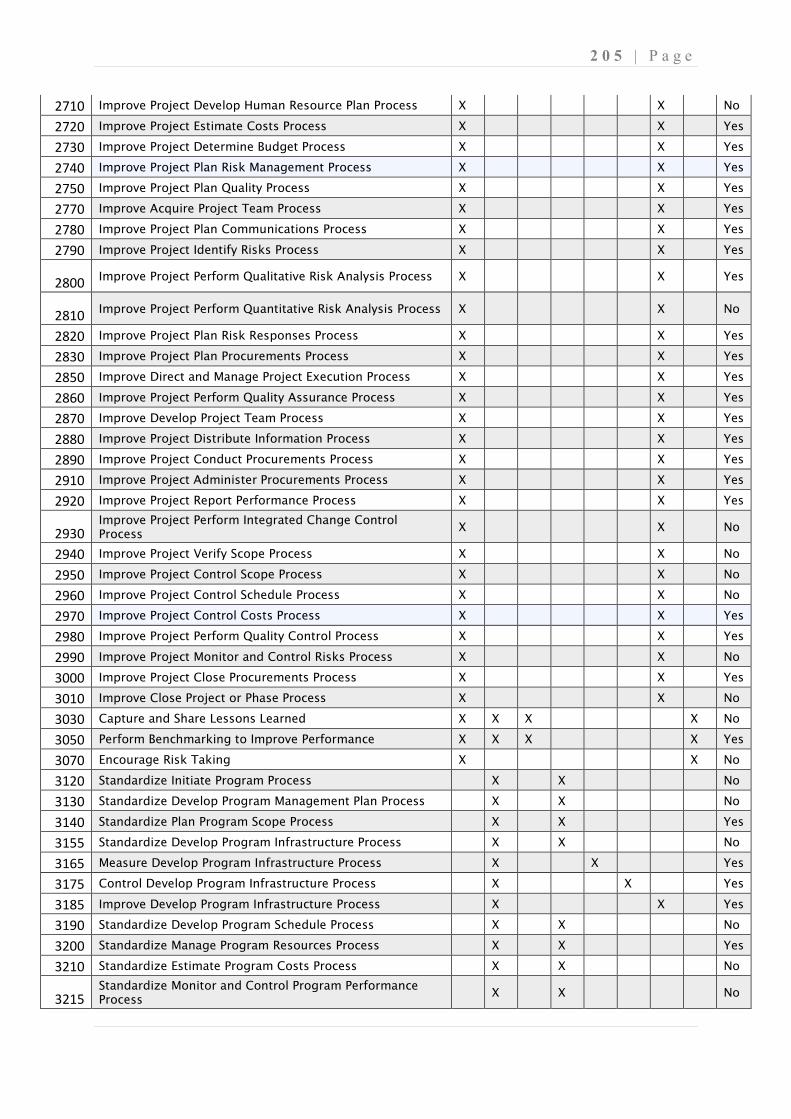
2 0 5 | P a g e
2710 Improve Project Develop Human Resource Plan Process X X No
2720 Improve Project Estimate Costs Process X X Yes
2730 Improve Project Determine Budget Process X X Yes
2740 Improve Project Plan Risk Management Process X X Yes
2750 Improve Project Plan Quality Process X X Yes
2770 Improve Acquire Project Team Process X X Yes
2780 Improve Project Plan Communications Process X X Yes
2790 Improve Project Identify Risks Process X X Yes
2800 Improve Project Perform Qualitative Risk Analysis Process X X Yes
2810 Improve Project Perform Quantitative Risk Analysis Process X X No
2820 Improve Project Plan Risk Responses Process X X Yes
2830 Improve Project Plan Procurements Process X X Yes
2850 Improve Direct and Manage Project Execution Process X X Yes
2860 Improve Project Perform Quality Assurance Process X X Yes
2870 Improve Develop Project Team Process X X Yes
2880 Improve Project Distribute Information Process X X Yes
2890 Improve Project Conduct Procurements Process X X Yes
2910 Improve Project Administer Procurements Process X X Yes
2920 Improve Project Report Performance Process X X Yes
2930 Improve Project Perform Integrated Change Control Process
X X No
2940 Improve Project Verify Scope Process X X No
2950 Improve Project Control Scope Process X X No
2960 Improve Project Control Schedule Process X X No
2970 Improve Project Control Costs Process X X Yes
2980 Improve Project Perform Quality Control Process X X Yes
2990 Improve Project Monitor and Control Risks Process X X No
3000 Improve Project Close Procurements Process X X Yes
3010 Improve Close Project or Phase Process X X No
3030 Capture and Share Lessons Learned X X X X No
3050 Perform Benchmarking to Improve Performance X X X X Yes
3070 Encourage Risk Taking X X No
3120 Standardize Initiate Program Process X X No
3130 Standardize Develop Program Management Plan Process X X No
3140 Standardize Plan Program Scope Process X X Yes
3155 Standardize Develop Program Infrastructure Process X X No
3165 Measure Develop Program Infrastructure Process X X Yes
3175 Control Develop Program Infrastructure Process X X Yes
3185 Improve Develop Program Infrastructure Process X X Yes
3190 Standardize Develop Program Schedule Process X X No
3200 Standardize Manage Program Resources Process X X Yes
3210 Standardize Estimate Program Costs Process X X No
3215 Standardize Monitor and Control Program Performance Process
X X No
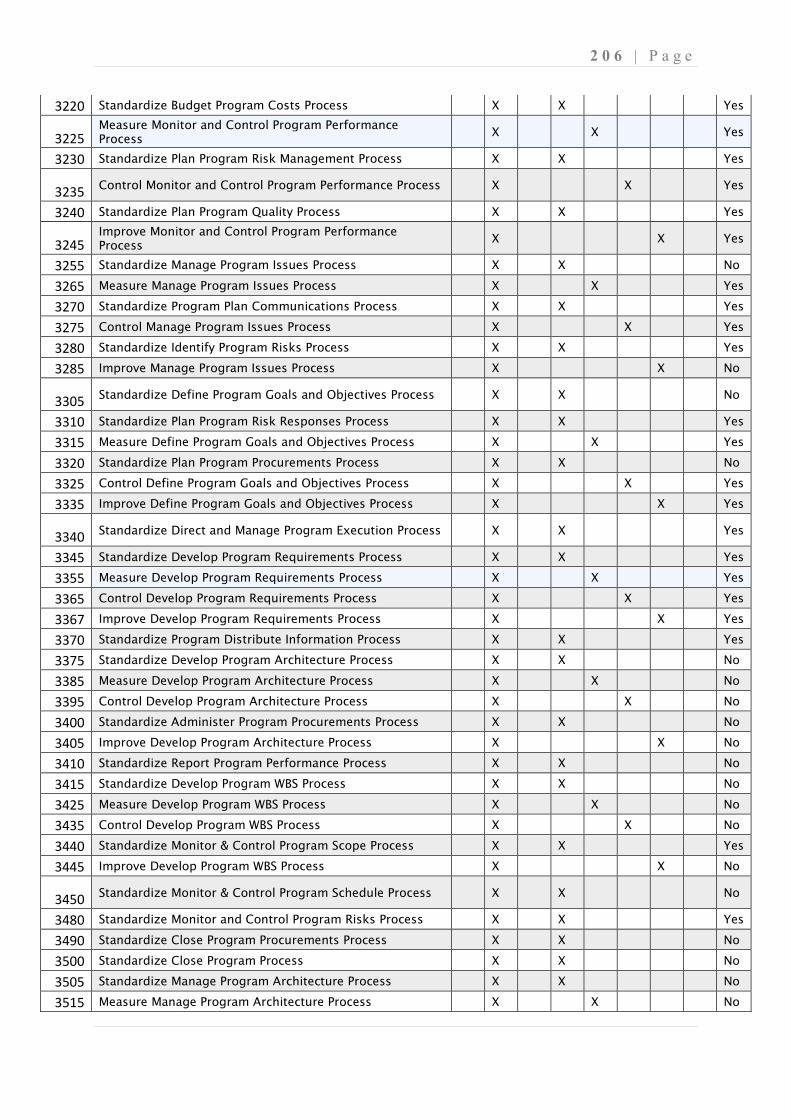
2 0 6 | P a g e
3220 Standardize Budget Program Costs Process X X Yes
3225 Measure Monitor and Control Program Performance Process
X X Yes
3230 Standardize Plan Program Risk Management Process X X Yes
3235 Control Monitor and Control Program Performance Process X X Yes
3240 Standardize Plan Program Quality Process X X Yes
3245 Improve Monitor and Control Program Performance Process
X X Yes
3255 Standardize Manage Program Issues Process X X No
3265 Measure Manage Program Issues Process X X Yes
3270 Standardize Program Plan Communications Process X X Yes
3275 Control Manage Program Issues Process X X Yes
3280 Standardize Identify Program Risks Process X X Yes
3285 Improve Manage Program Issues Process X X No
3305 Standardize Define Program Goals and Objectives Process X X No
3310 Standardize Plan Program Risk Responses Process X X Yes
3315 Measure Define Program Goals and Objectives Process X X Yes
3320 Standardize Plan Program Procurements Process X X No
3325 Control Define Program Goals and Objectives Process X X Yes
3335 Improve Define Program Goals and Objectives Process X X Yes
3340 Standardize Direct and Manage Program Execution Process X X Yes
3345 Standardize Develop Program Requirements Process X X Yes
3355 Measure Develop Program Requirements Process X X Yes
3365 Control Develop Program Requirements Process X X Yes
3367 Improve Develop Program Requirements Process X X Yes
3370 Standardize Program Distribute Information Process X X Yes
3375 Standardize Develop Program Architecture Process X X No
3385 Measure Develop Program Architecture Process X X No
3395 Control Develop Program Architecture Process X X No
3400 Standardize Administer Program Procurements Process X X No
3405 Improve Develop Program Architecture Process X X No
3410 Standardize Report Program Performance Process X X No
3415 Standardize Develop Program WBS Process X X No
3425 Measure Develop Program WBS Process X X No
3435 Control Develop Program WBS Process X X No
3440 Standardize Monitor & Control Program Scope Process X X Yes
3445 Improve Develop Program WBS Process X X No
3450 Standardize Monitor & Control Program Schedule Process X X No
3480 Standardize Monitor and Control Program Risks Process X X Yes
3490 Standardize Close Program Procurements Process X X No
3500 Standardize Close Program Process X X No
3505 Standardize Manage Program Architecture Process X X No
3515 Measure Manage Program Architecture Process X X No
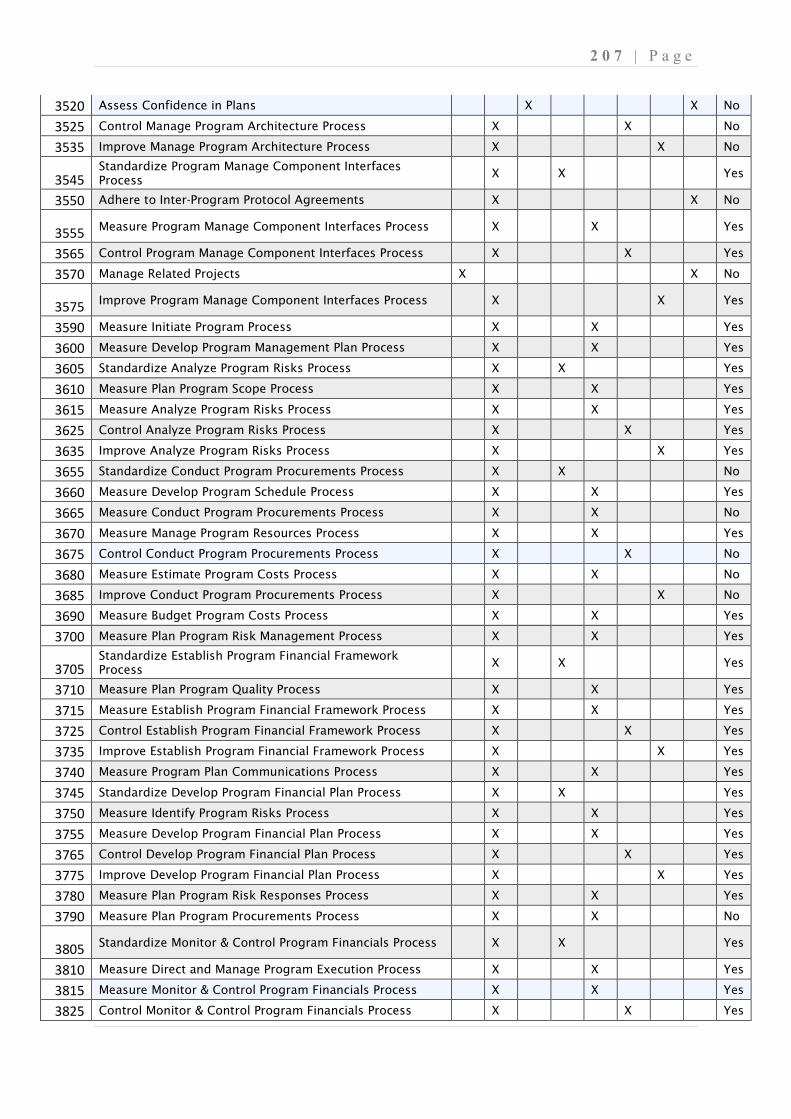
2 0 7 | P a g e
3520 Assess Confidence in Plans X X No
3525 Control Manage Program Architecture Process X X No
3535 Improve Manage Program Architecture Process X X No
3545 Standardize Program Manage Component Interfaces Process
X X Yes
3550 Adhere to Inter-Program Protocol Agreements X X No
3555 Measure Program Manage Component Interfaces Process X X Yes
3565 Control Program Manage Component Interfaces Process X X Yes
3570 Manage Related Projects X X No
3575 Improve Program Manage Component Interfaces Process X X Yes
3590 Measure Initiate Program Process X X Yes
3600 Measure Develop Program Management Plan Process X X Yes
3605 Standardize Analyze Program Risks Process X X Yes
3610 Measure Plan Program Scope Process X X Yes
3615 Measure Analyze Program Risks Process X X Yes
3625 Control Analyze Program Risks Process X X Yes
3635 Improve Analyze Program Risks Process X X Yes
3655 Standardize Conduct Program Procurements Process X X No
3660 Measure Develop Program Schedule Process X X Yes
3665 Measure Conduct Program Procurements Process X X No
3670 Measure Manage Program Resources Process X X Yes
3675 Control Conduct Program Procurements Process X X No
3680 Measure Estimate Program Costs Process X X No
3685 Improve Conduct Program Procurements Process X X No
3690 Measure Budget Program Costs Process X X Yes
3700 Measure Plan Program Risk Management Process X X Yes
3705 Standardize Establish Program Financial Framework Process
X X Yes
3710 Measure Plan Program Quality Process X X Yes
3715 Measure Establish Program Financial Framework Process X X Yes
3725 Control Establish Program Financial Framework Process X X Yes
3735 Improve Establish Program Financial Framework Process X X Yes
3740 Measure Program Plan Communications Process X X Yes
3745 Standardize Develop Program Financial Plan Process X X Yes
3750 Measure Identify Program Risks Process X X Yes
3755 Measure Develop Program Financial Plan Process X X Yes
3765 Control Develop Program Financial Plan Process X X Yes
3775 Improve Develop Program Financial Plan Process X X Yes
3780 Measure Plan Program Risk Responses Process X X Yes
3790 Measure Plan Program Procurements Process X X No
3805 Standardize Monitor & Control Program Financials Process X X Yes
3810 Measure Direct and Manage Program Execution Process X X Yes
3815 Measure Monitor & Control Program Financials Process X X Yes
3825 Control Monitor & Control Program Financials Process X X Yes
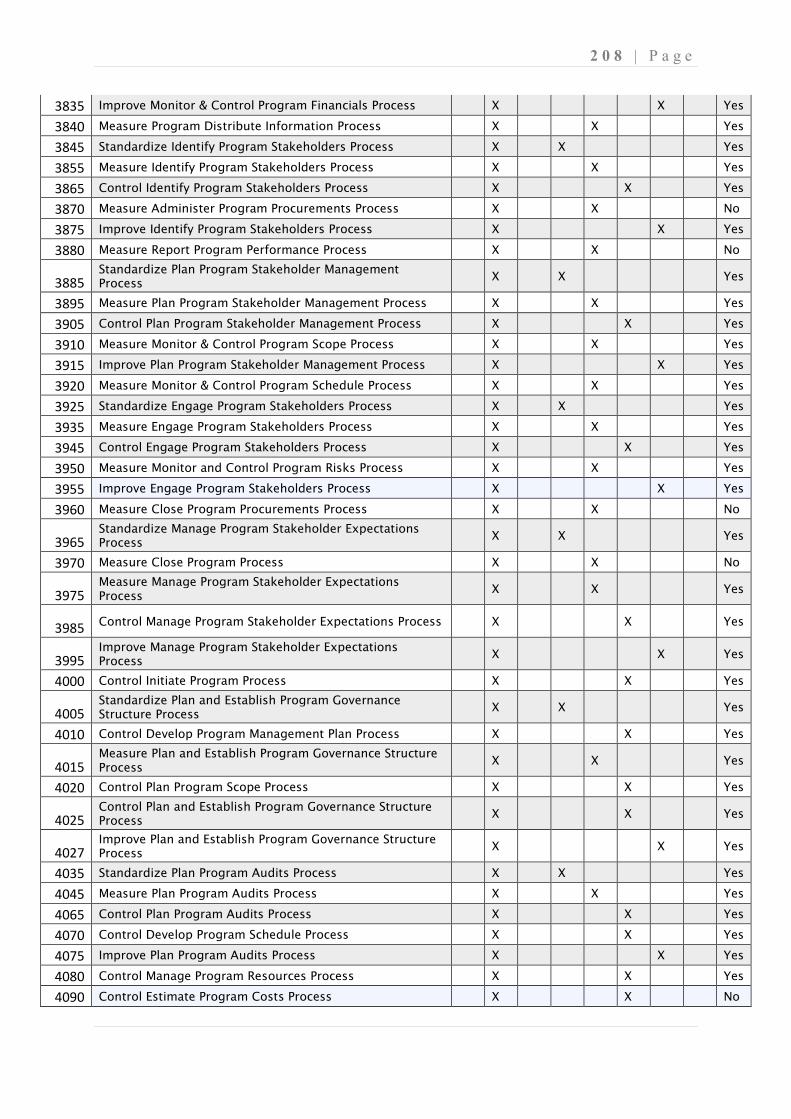
2 0 8 | P a g e
3835 Improve Monitor & Control Program Financials Process X X Yes
3840 Measure Program Distribute Information Process X X Yes
3845 Standardize Identify Program Stakeholders Process X X Yes
3855 Measure Identify Program Stakeholders Process X X Yes
3865 Control Identify Program Stakeholders Process X X Yes
3870 Measure Administer Program Procurements Process X X No
3875 Improve Identify Program Stakeholders Process X X Yes
3880 Measure Report Program Performance Process X X No
3885 Standardize Plan Program Stakeholder Management Process
X X Yes
3895 Measure Plan Program Stakeholder Management Process X X Yes
3905 Control Plan Program Stakeholder Management Process X X Yes
3910 Measure Monitor & Control Program Scope Process X X Yes
3915 Improve Plan Program Stakeholder Management Process X X Yes
3920 Measure Monitor & Control Program Schedule Process X X Yes
3925 Standardize Engage Program Stakeholders Process X X Yes
3935 Measure Engage Program Stakeholders Process X X Yes
3945 Control Engage Program Stakeholders Process X X Yes
3950 Measure Monitor and Control Program Risks Process X X Yes
3955 Improve Engage Program Stakeholders Process X X Yes
3960 Measure Close Program Procurements Process X X No
3965 Standardize Manage Program Stakeholder Expectations Process
X X Yes
3970 Measure Close Program Process X X No
3975 Measure Manage Program Stakeholder Expectations Process
X X Yes
3985 Control Manage Program Stakeholder Expectations Process X X Yes
3995 Improve Manage Program Stakeholder Expectations Process
X X Yes
4000 Control Initiate Program Process X X Yes
4005 Standardize Plan and Establish Program Governance Structure Process
X X Yes
4010 Control Develop Program Management Plan Process X X Yes
4015 Measure Plan and Establish Program Governance Structure Process
X X Yes
4020 Control Plan Program Scope Process X X Yes
4025 Control Plan and Establish Program Governance Structure Process
X X Yes
4027 Improve Plan and Establish Program Governance Structure Process
X X Yes
4035 Standardize Plan Program Audits Process X X Yes
4045 Measure Plan Program Audits Process X X Yes
4065 Control Plan Program Audits Process X X Yes
4070 Control Develop Program Schedule Process X X Yes
4075 Improve Plan Program Audits Process X X Yes
4080 Control Manage Program Resources Process X X Yes
4090 Control Estimate Program Costs Process X X No
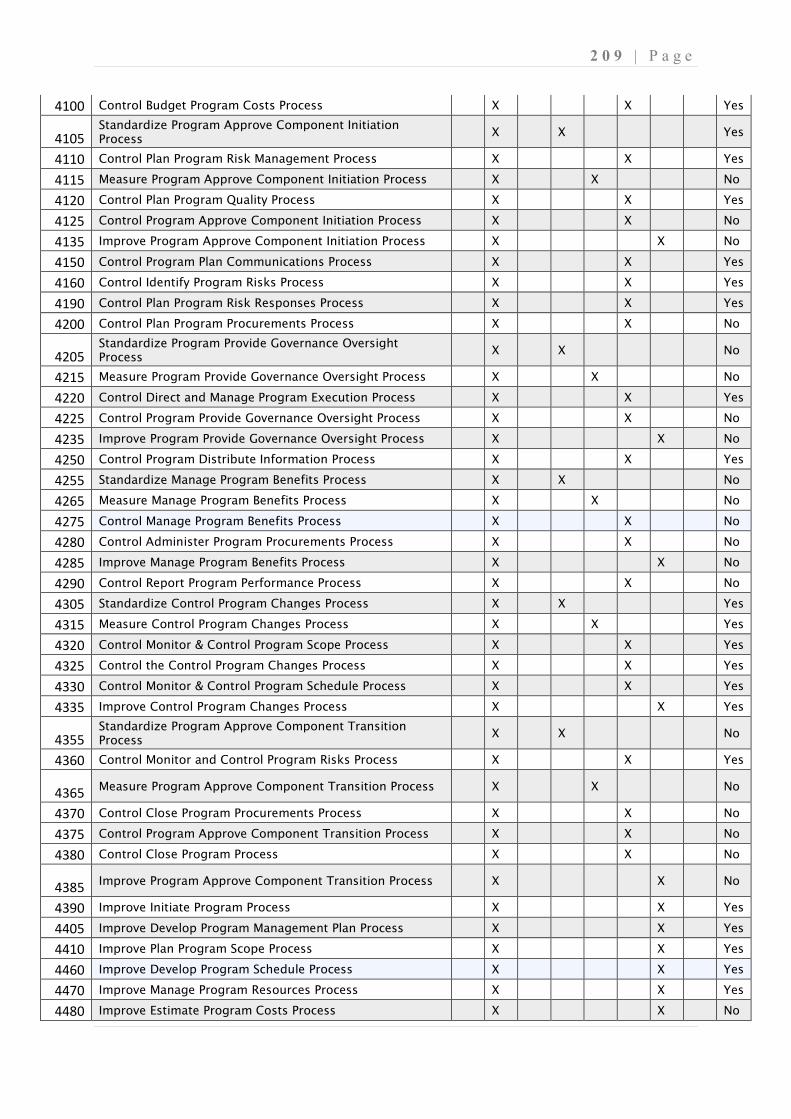
2 0 9 | P a g e
4100 Control Budget Program Costs Process X X Yes
4105 Standardize Program Approve Component Initiation Process
X X Yes
4110 Control Plan Program Risk Management Process X X Yes
4115 Measure Program Approve Component Initiation Process X X No
4120 Control Plan Program Quality Process X X Yes
4125 Control Program Approve Component Initiation Process X X No
4135 Improve Program Approve Component Initiation Process X X No
4150 Control Program Plan Communications Process X X Yes
4160 Control Identify Program Risks Process X X Yes
4190 Control Plan Program Risk Responses Process X X Yes
4200 Control Plan Program Procurements Process X X No
4205 Standardize Program Provide Governance Oversight Process
X X No
4215 Measure Program Provide Governance Oversight Process X X No
4220 Control Direct and Manage Program Execution Process X X Yes
4225 Control Program Provide Governance Oversight Process X X No
4235 Improve Program Provide Governance Oversight Process X X No
4250 Control Program Distribute Information Process X X Yes
4255 Standardize Manage Program Benefits Process X X No
4265 Measure Manage Program Benefits Process X X No
4275 Control Manage Program Benefits Process X X No
4280 Control Administer Program Procurements Process X X No
4285 Improve Manage Program Benefits Process X X No
4290 Control Report Program Performance Process X X No
4305 Standardize Control Program Changes Process X X Yes
4315 Measure Control Program Changes Process X X Yes
4320 Control Monitor & Control Program Scope Process X X Yes
4325 Control the Control Program Changes Process X X Yes
4330 Control Monitor & Control Program Schedule Process X X Yes
4335 Improve Control Program Changes Process X X Yes
4355 Standardize Program Approve Component Transition Process
X X No
4360 Control Monitor and Control Program Risks Process X X Yes
4365 Measure Program Approve Component Transition Process X X No
4370 Control Close Program Procurements Process X X No
4375 Control Program Approve Component Transition Process X X No
4380 Control Close Program Process X X No
4385 Improve Program Approve Component Transition Process X X No
4390 Improve Initiate Program Process X X Yes
4405 Improve Develop Program Management Plan Process X X Yes
4410 Improve Plan Program Scope Process X X Yes
4460 Improve Develop Program Schedule Process X X Yes
4470 Improve Manage Program Resources Process X X Yes
4480 Improve Estimate Program Costs Process X X No
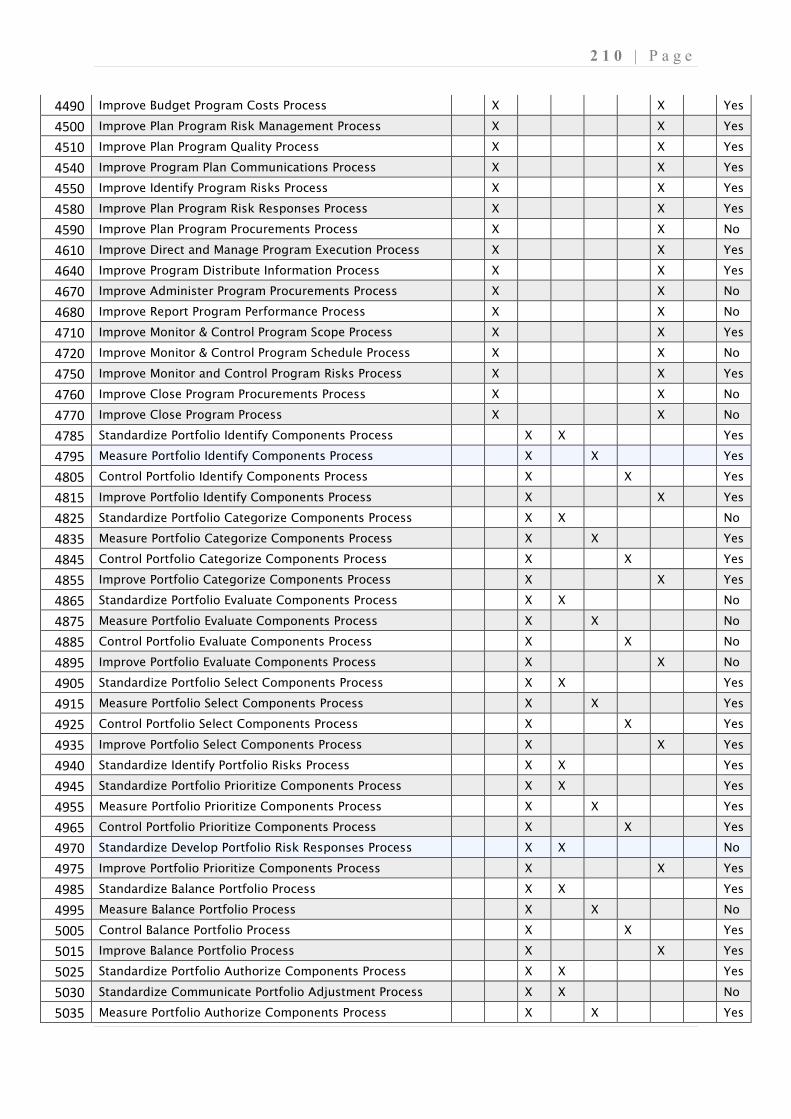
2 1 0 | P a g e
4490 Improve Budget Program Costs Process X X Yes
4500 Improve Plan Program Risk Management Process X X Yes
4510 Improve Plan Program Quality Process X X Yes
4540 Improve Program Plan Communications Process X X Yes
4550 Improve Identify Program Risks Process X X Yes
4580 Improve Plan Program Risk Responses Process X X Yes
4590 Improve Plan Program Procurements Process X X No
4610 Improve Direct and Manage Program Execution Process X X Yes
4640 Improve Program Distribute Information Process X X Yes
4670 Improve Administer Program Procurements Process X X No
4680 Improve Report Program Performance Process X X No
4710 Improve Monitor & Control Program Scope Process X X Yes
4720 Improve Monitor & Control Program Schedule Process X X No
4750 Improve Monitor and Control Program Risks Process X X Yes
4760 Improve Close Program Procurements Process X X No
4770 Improve Close Program Process X X No
4785 Standardize Portfolio Identify Components Process X X Yes
4795 Measure Portfolio Identify Components Process X X Yes
4805 Control Portfolio Identify Components Process X X Yes
4815 Improve Portfolio Identify Components Process X X Yes
4825 Standardize Portfolio Categorize Components Process X X No
4835 Measure Portfolio Categorize Components Process X X Yes
4845 Control Portfolio Categorize Components Process X X Yes
4855 Improve Portfolio Categorize Components Process X X Yes
4865 Standardize Portfolio Evaluate Components Process X X No
4875 Measure Portfolio Evaluate Components Process X X No
4885 Control Portfolio Evaluate Components Process X X No
4895 Improve Portfolio Evaluate Components Process X X No
4905 Standardize Portfolio Select Components Process X X Yes
4915 Measure Portfolio Select Components Process X X Yes
4925 Control Portfolio Select Components Process X X Yes
4935 Improve Portfolio Select Components Process X X Yes
4940 Standardize Identify Portfolio Risks Process X X Yes
4945 Standardize Portfolio Prioritize Components Process X X Yes
4955 Measure Portfolio Prioritize Components Process X X Yes
4965 Control Portfolio Prioritize Components Process X X Yes
4970 Standardize Develop Portfolio Risk Responses Process X X No
4975 Improve Portfolio Prioritize Components Process X X Yes
4985 Standardize Balance Portfolio Process X X Yes
4995 Measure Balance Portfolio Process X X No
5005 Control Balance Portfolio Process X X Yes
5015 Improve Balance Portfolio Process X X Yes
5025 Standardize Portfolio Authorize Components Process X X Yes
5030 Standardize Communicate Portfolio Adjustment Process X X No
5035 Measure Portfolio Authorize Components Process X X Yes
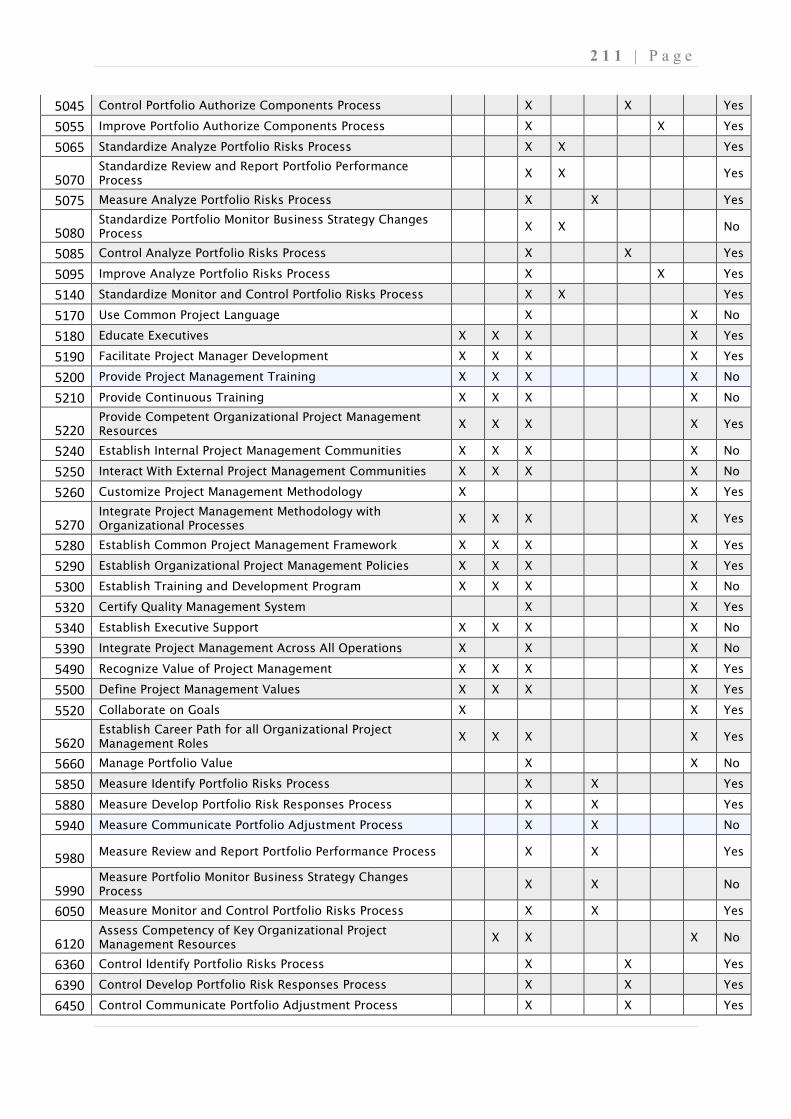
2 1 1 | P a g e
5045 Control Portfolio Authorize Components Process X X Yes
5055 Improve Portfolio Authorize Components Process X X Yes
5065 Standardize Analyze Portfolio Risks Process X X Yes
5070 Standardize Review and Report Portfolio Performance Process
X X Yes
5075 Measure Analyze Portfolio Risks Process X X Yes
5080 Standardize Portfolio Monitor Business Strategy Changes Process
X X No
5085 Control Analyze Portfolio Risks Process X X Yes
5095 Improve Analyze Portfolio Risks Process X X Yes
5140 Standardize Monitor and Control Portfolio Risks Process X X Yes
5170 Use Common Project Language X X No
5180 Educate Executives X X X X Yes
5190 Facilitate Project Manager Development X X X X Yes
5200 Provide Project Management Training X X X X No
5210 Provide Continuous Training X X X X No
5220 Provide Competent Organizational Project Management Resources
X X X X Yes
5240 Establish Internal Project Management Communities X X X X No
5250 Interact With External Project Management Communities X X X X No
5260 Customize Project Management Methodology X X Yes
5270 Integrate Project Management Methodology with Organizational Processes
X X X X Yes
5280 Establish Common Project Management Framework X X X X Yes
5290 Establish Organizational Project Management Policies X X X X Yes
5300 Establish Training and Development Program X X X X No
5320 Certify Quality Management System X X Yes
5340 Establish Executive Support X X X X No
5390 Integrate Project Management Across All Operations X X X No
5490 Recognize Value of Project Management X X X X Yes
5500 Define Project Management Values X X X X Yes
5520 Collaborate on Goals X X Yes
5620 Establish Career Path for all Organizational Project Management Roles
X X X X Yes
5660 Manage Portfolio Value X X No
5850 Measure Identify Portfolio Risks Process X X Yes
5880 Measure Develop Portfolio Risk Responses Process X X Yes
5940 Measure Communicate Portfolio Adjustment Process X X No
5980 Measure Review and Report Portfolio Performance Process X X Yes
5990 Measure Portfolio Monitor Business Strategy Changes Process
X X No
6050 Measure Monitor and Control Portfolio Risks Process X X Yes
6120 Assess Competency of Key Organizational Project Management Resources
X X X No
6360 Control Identify Portfolio Risks Process X X Yes
6390 Control Develop Portfolio Risk Responses Process X X Yes
6450 Control Communicate Portfolio Adjustment Process X X Yes
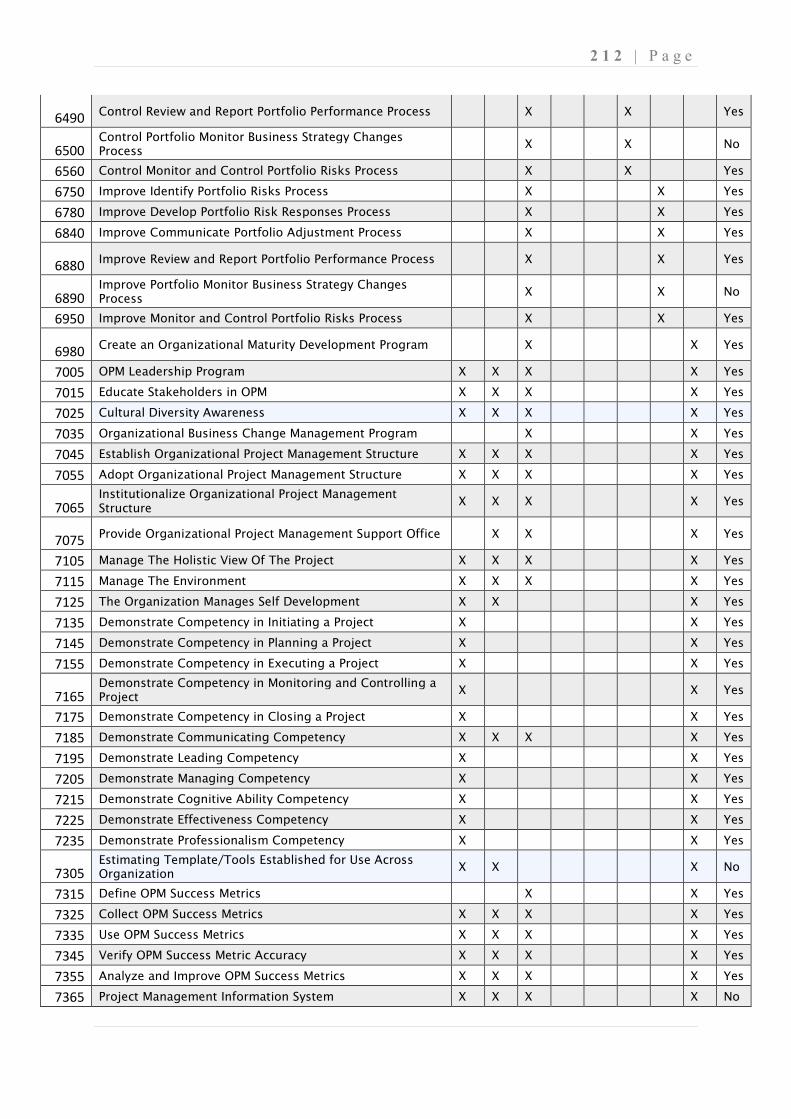
2 1 2 | P a g e
6490 Control Review and Report Portfolio Performance Process X X Yes
6500 Control Portfolio Monitor Business Strategy Changes Process
X X No
6560 Control Monitor and Control Portfolio Risks Process X X Yes
6750 Improve Identify Portfolio Risks Process X X Yes
6780 Improve Develop Portfolio Risk Responses Process X X Yes
6840 Improve Communicate Portfolio Adjustment Process X X Yes
6880 Improve Review and Report Portfolio Performance Process X X Yes
6890 Improve Portfolio Monitor Business Strategy Changes Process
X X No
6950 Improve Monitor and Control Portfolio Risks Process X X Yes
6980 Create an Organizational Maturity Development Program X X Yes
7005 OPM Leadership Program X X X X Yes
7015 Educate Stakeholders in OPM X X X X Yes
7025 Cultural Diversity Awareness X X X X Yes
7035 Organizational Business Change Management Program X X Yes
7045 Establish Organizational Project Management Structure X X X X Yes
7055 Adopt Organizational Project Management Structure X X X X Yes
7065 Institutionalize Organizational Project Management Structure
X X X X Yes
7075 Provide Organizational Project Management Support Office X X X Yes
7105 Manage The Holistic View Of The Project X X X X Yes
7115 Manage The Environment X X X X Yes
7125 The Organization Manages Self Development X X X Yes
7135 Demonstrate Competency in Initiating a Project X X Yes
7145 Demonstrate Competency in Planning a Project X X Yes
7155 Demonstrate Competency in Executing a Project X X Yes
7165 Demonstrate Competency in Monitoring and Controlling a Project
X X Yes
7175 Demonstrate Competency in Closing a Project X X Yes
7185 Demonstrate Communicating Competency X X X X Yes
7195 Demonstrate Leading Competency X X Yes
7205 Demonstrate Managing Competency X X Yes
7215 Demonstrate Cognitive Ability Competency X X Yes
7225 Demonstrate Effectiveness Competency X X Yes
7235 Demonstrate Professionalism Competency X X Yes
7305 Estimating Template/Tools Established for Use Across Organization
X X X No
7315 Define OPM Success Metrics X X Yes
7325 Collect OPM Success Metrics X X X X Yes
7335 Use OPM Success Metrics X X X X Yes
7345 Verify OPM Success Metric Accuracy X X X X Yes
7355 Analyze and Improve OPM Success Metrics X X X X Yes
7365 Project Management Information System X X X X No
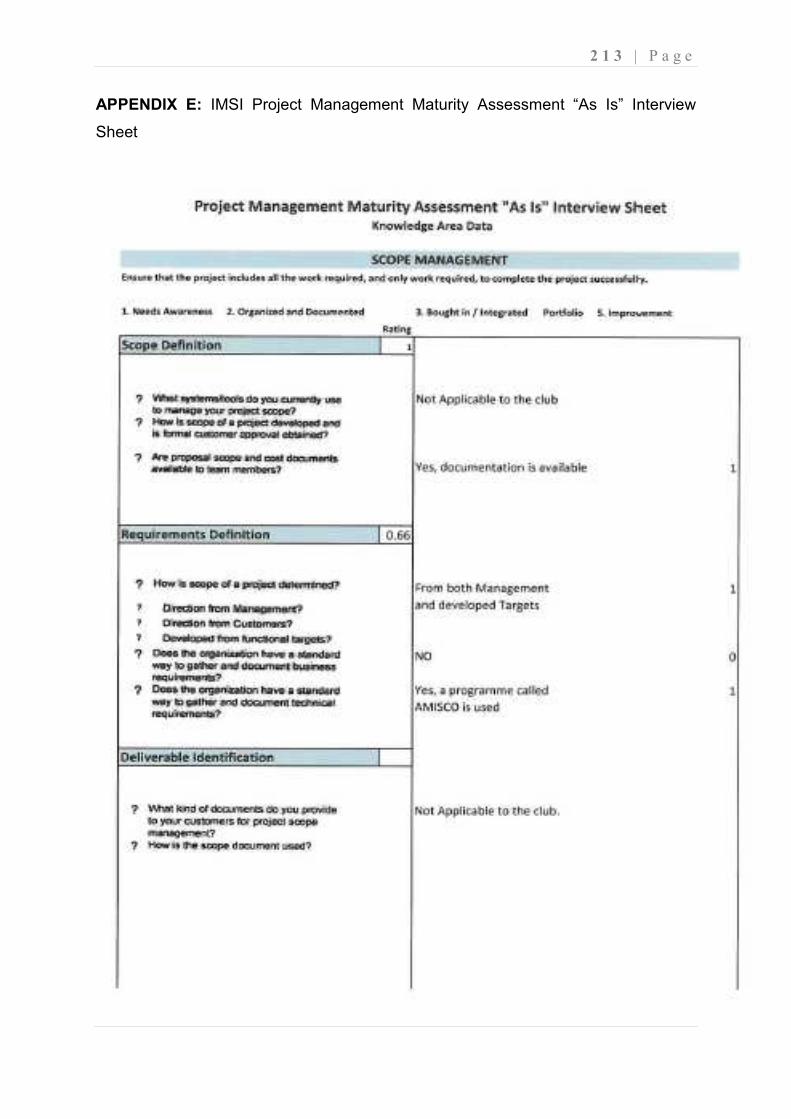
2 1 3 | P a g e
APPENDIX E: IMSI Project Management Maturity Assessment “As Is” Interview
Sheet
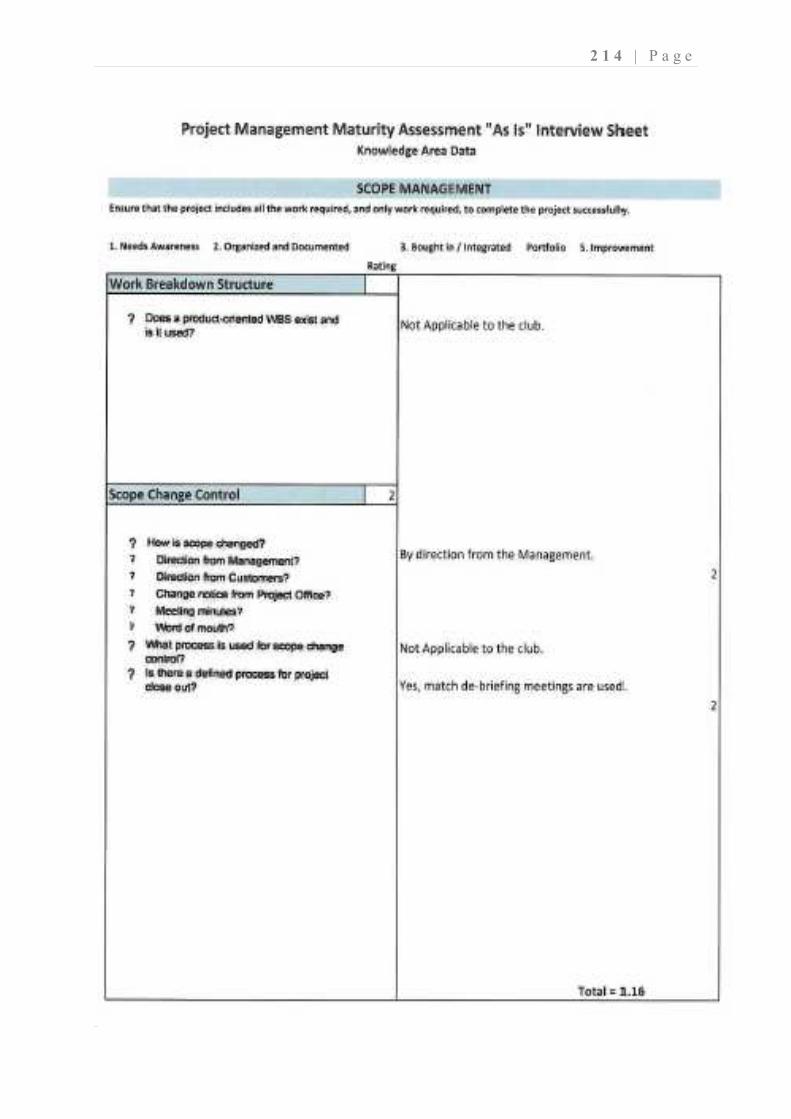
2 1 4 | P a g e
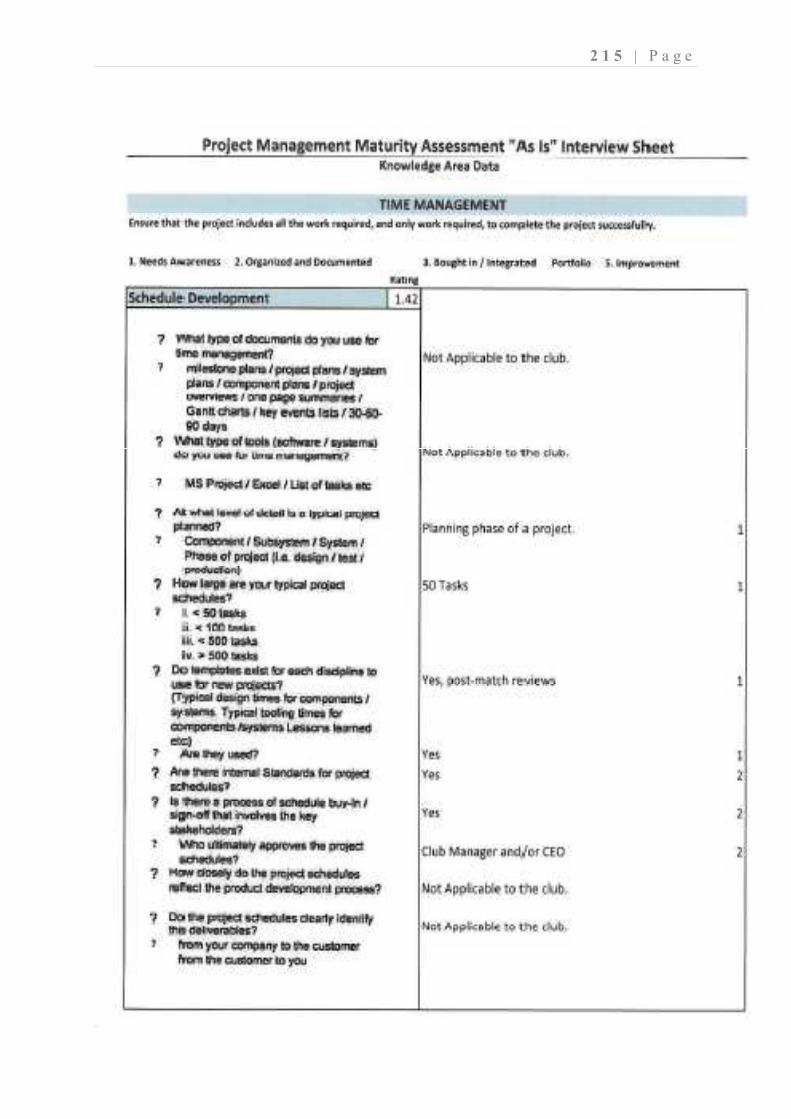
2 1 5 | P a g e
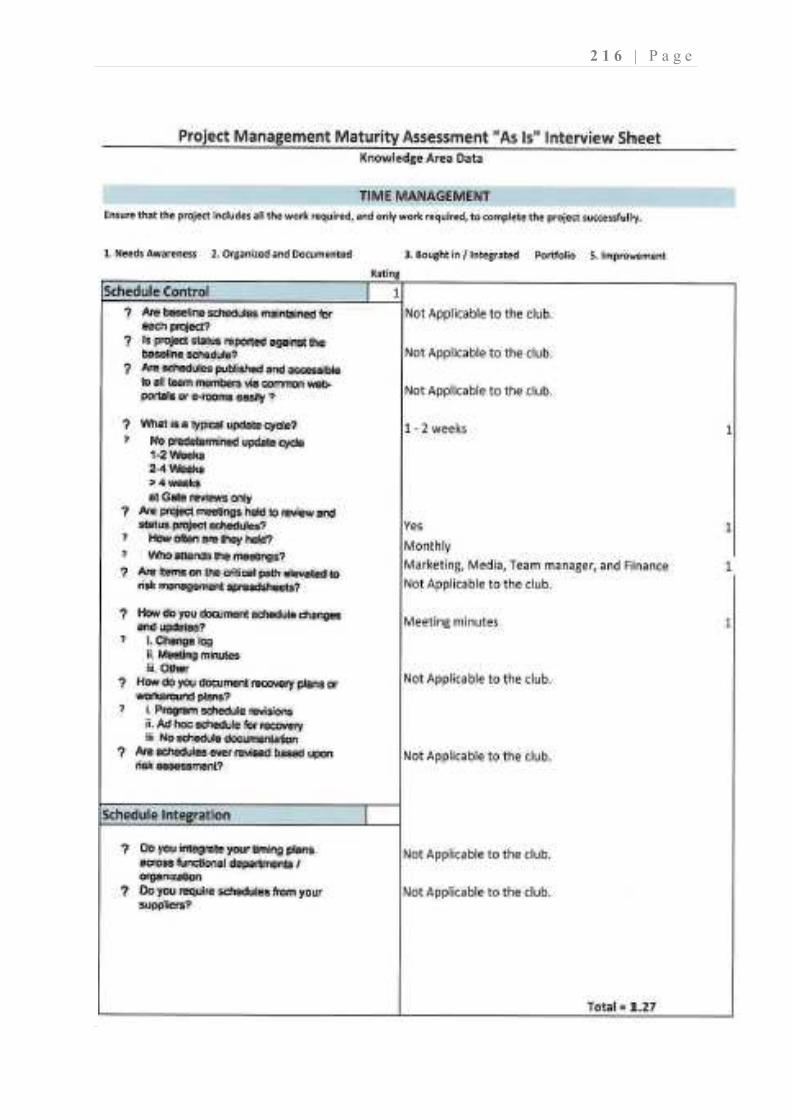
2 1 6 | P a g e
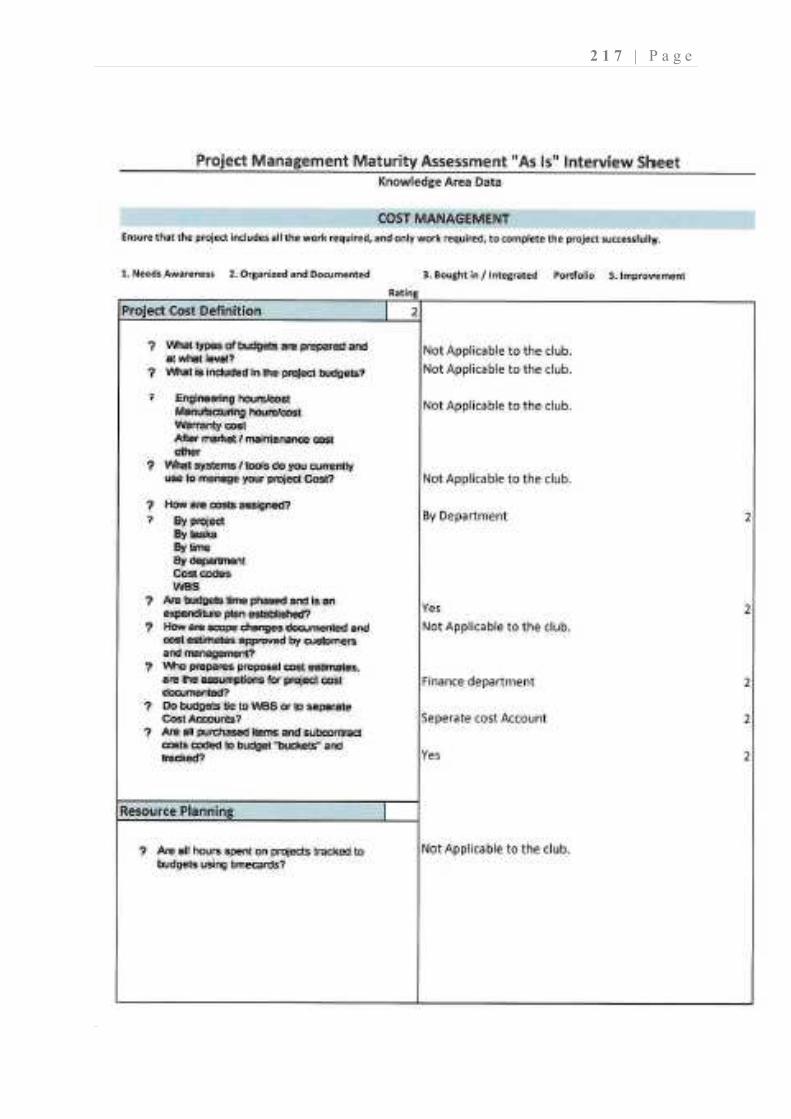
2 1 7 | P a g e
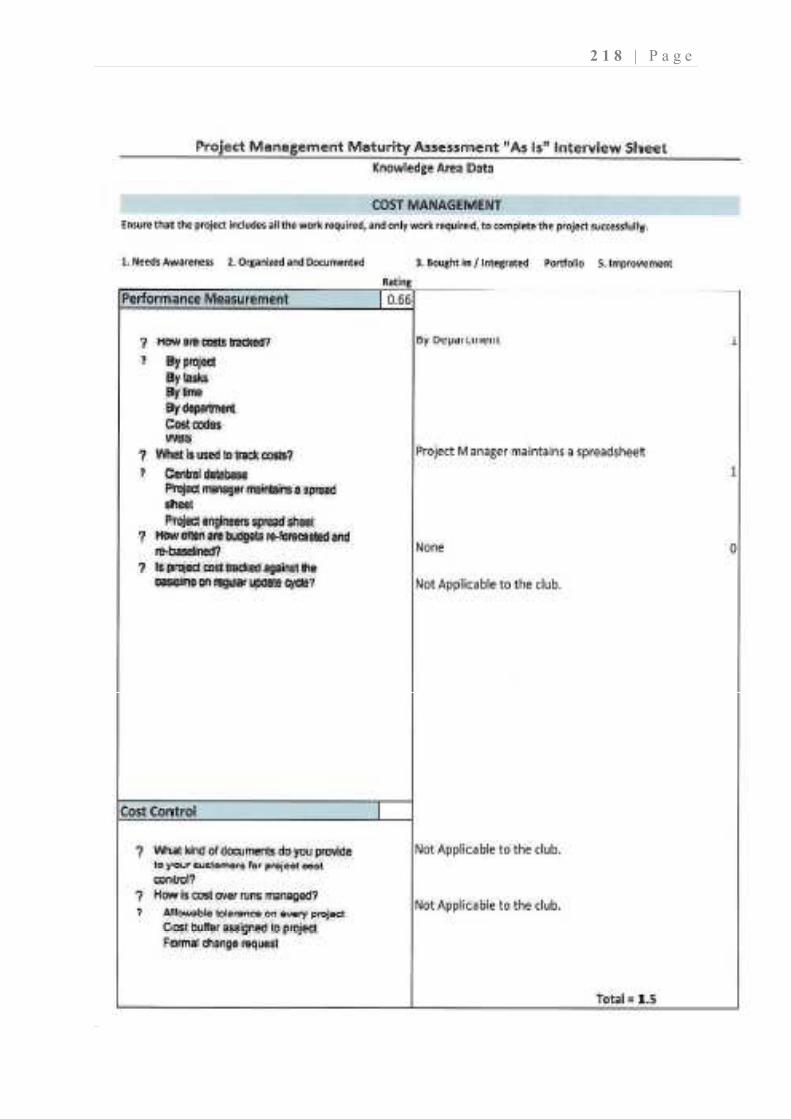
2 1 8 | P a g e
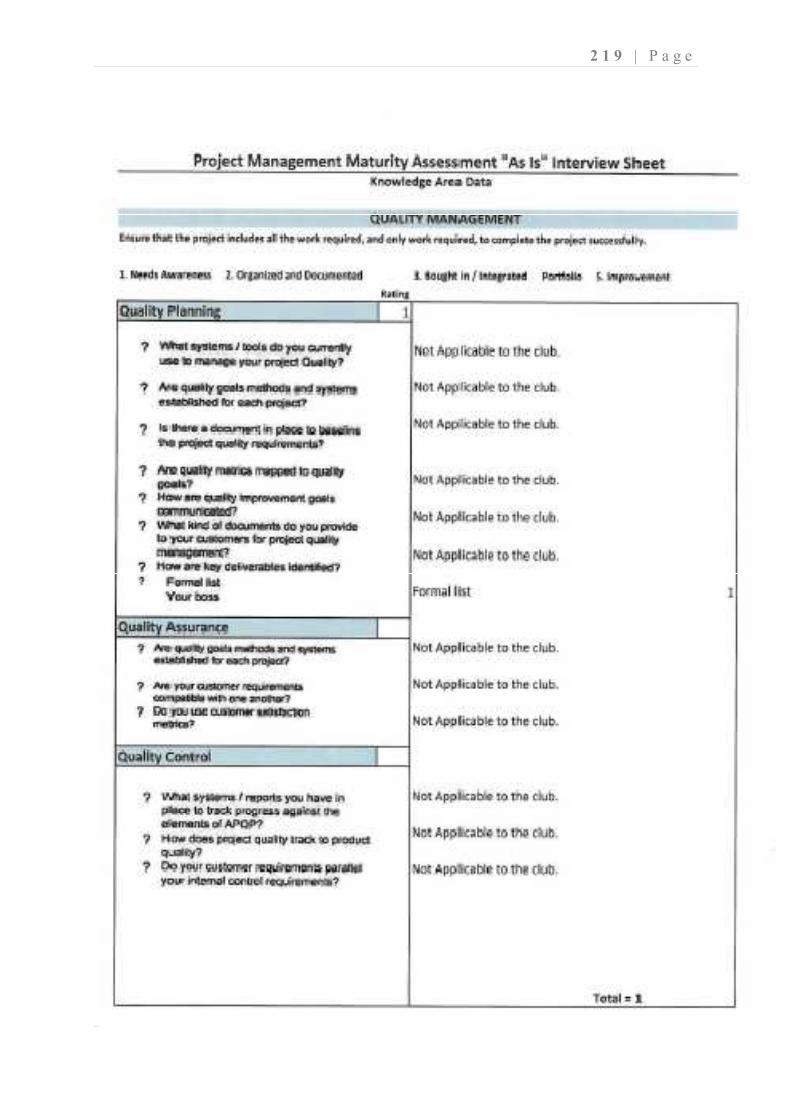
2 1 9 | P a g e
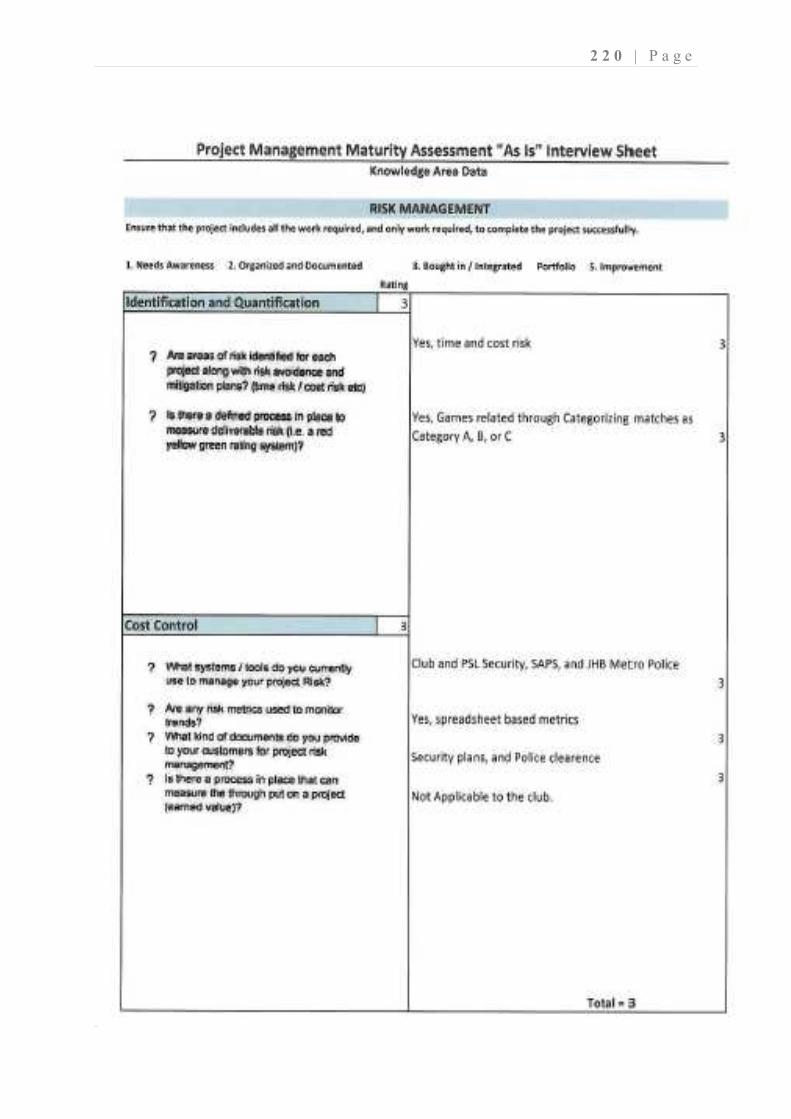
2 2 0 | P a g e
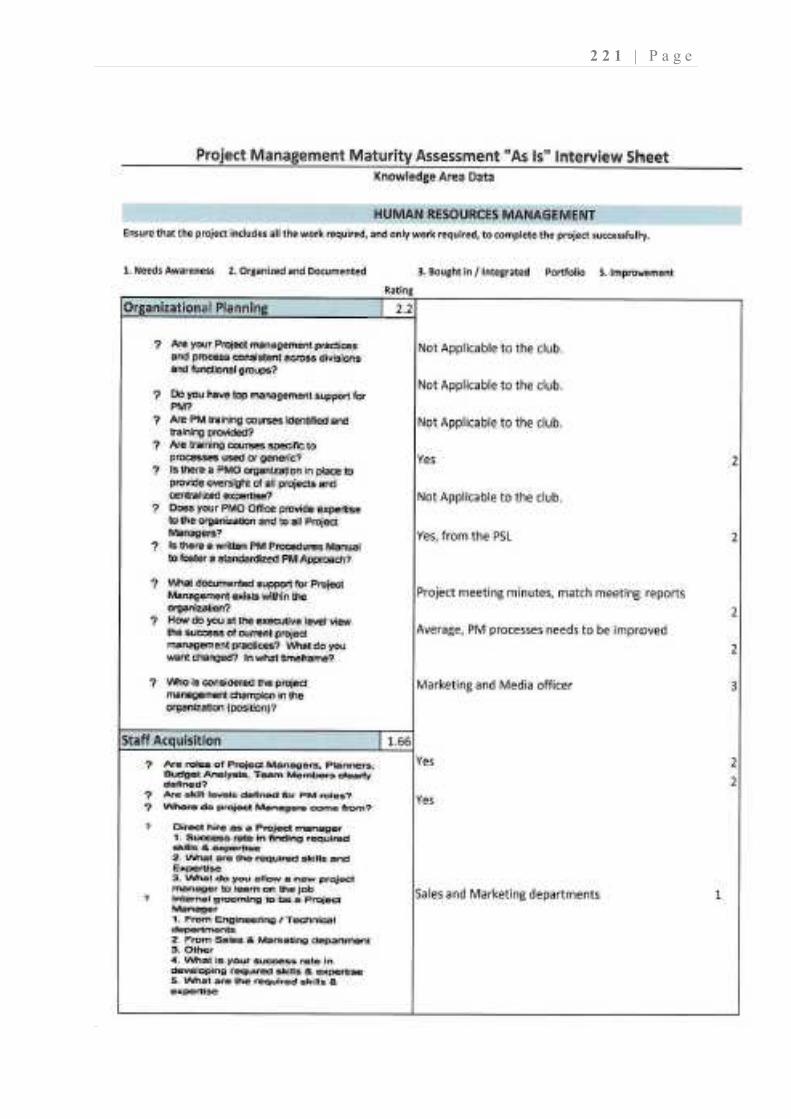
2 2 1 | P a g e
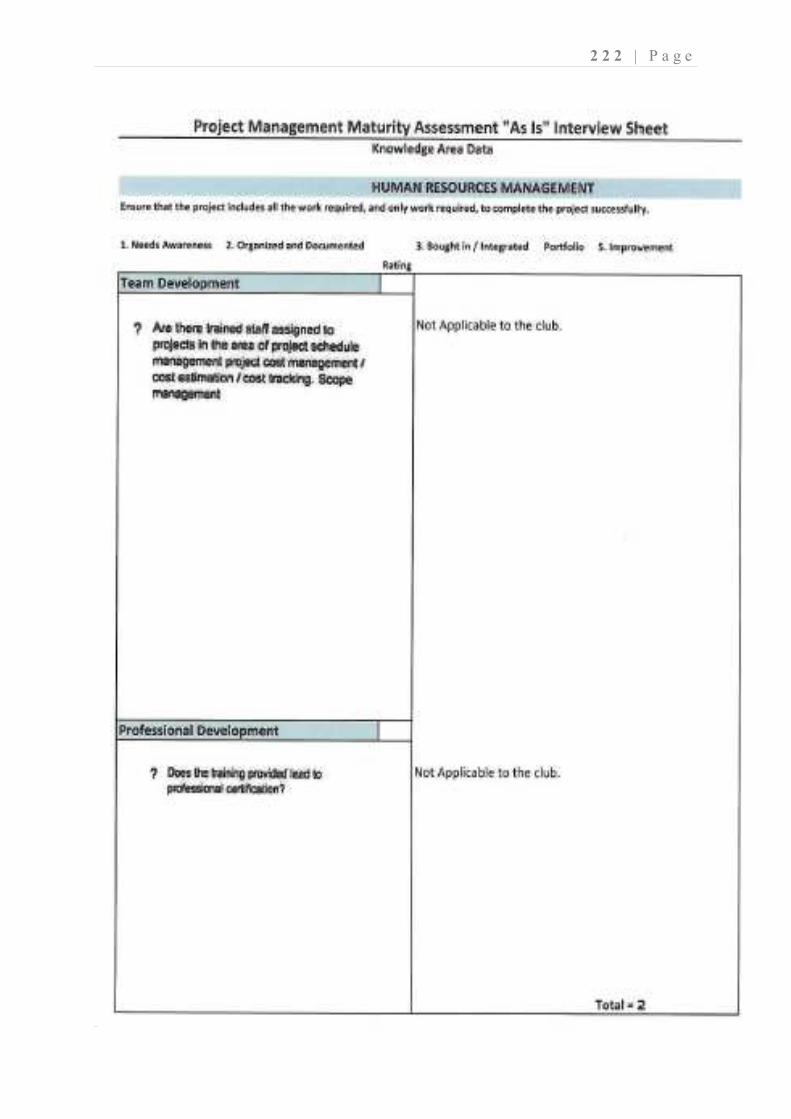
2 2 2 | P a g e
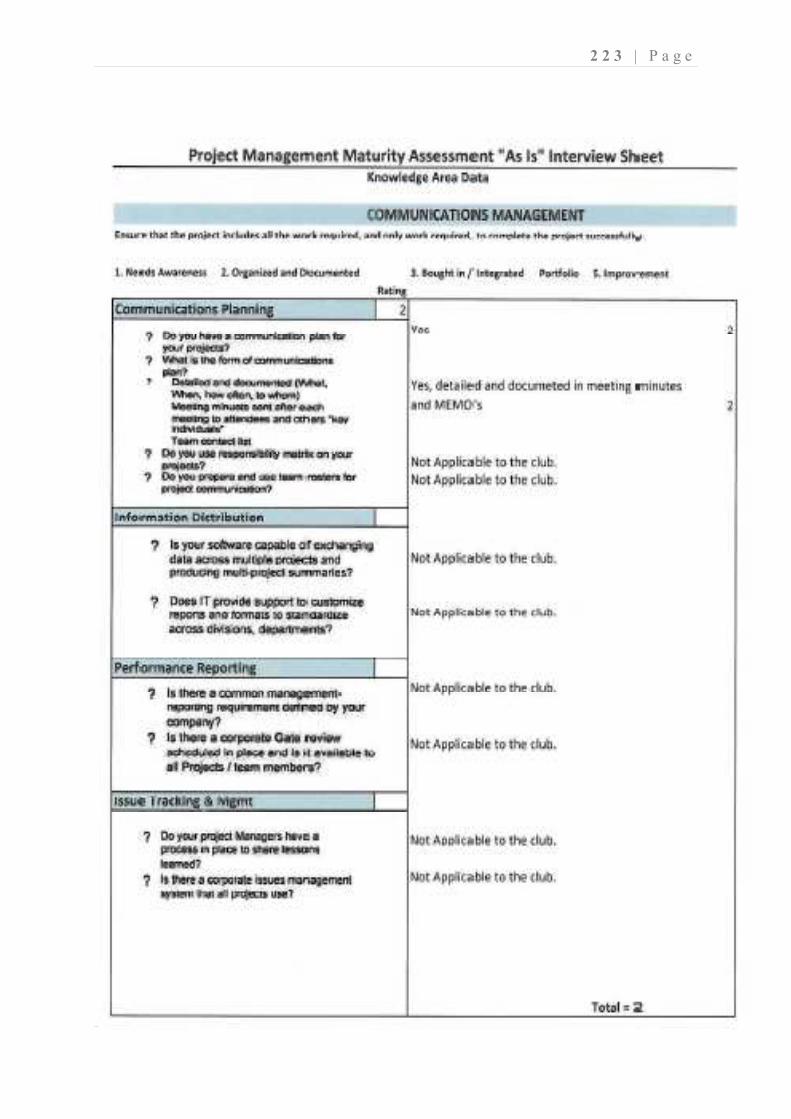
2 2 3 | P a g e
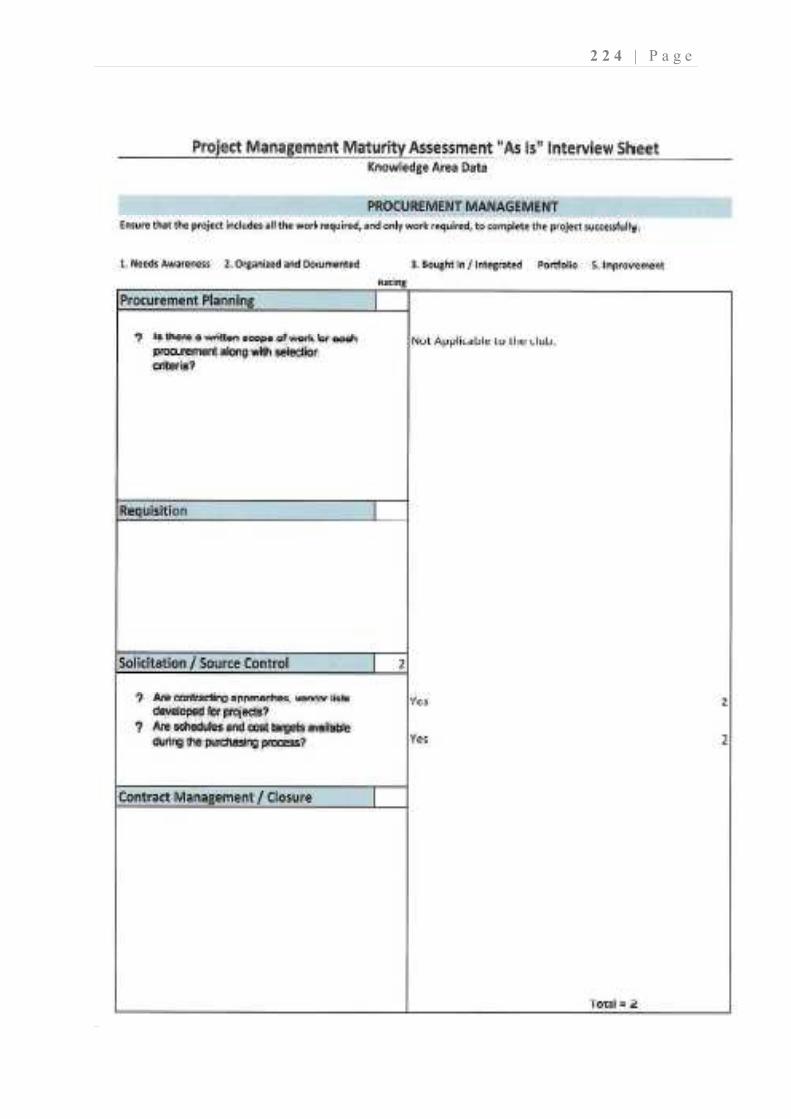
2 2 4 | P a g e

2 2 5 | P a g e
Recommended


![Journal VM-Daniel Kristiyanto [v3] - Institutional Repositoryrepository.uksw.edu/bitstream/123456789/1423/2/T1_672008264_Full... · ... sebagai keharusan untuk melakukan upgrade ke](https://img.pdfslide.net/doc/110x75/5abbffad7f8b9a8f058d1a02/journal-vm-daniel-kristiyanto-v3-institutional-sebagai-keharusan-untuk.jpg)


![CICADA - USENIX · 1 vm 2 vm 3 vm 4 vm 5vm 6 vm 7 vm 8 vm 9 vm 2 vm 3 vm 4 vm 5 vm 6 vm 7 vm 8 vm 9 vm 1 rigid application (similar to VOC [1]) vm 1 vm 2 vm 3 vm 4 vm 5vm 6 vm 7 vm](https://img.pdfslide.net/doc/110x75/5f3ade2be7477529602b0cb3/cicada-usenix-1-vm-2-vm-3-vm-4-vm-5vm-6-vm-7-vm-8-vm-9-vm-2-vm-3-vm-4-vm-5-vm.jpg)


![MBL3 Sandeep Raina Ver2[1]](https://img.pdfslide.net/doc/110x75/577cc9b21a28aba711a45b69/mbl3-sandeep-raina-ver21.jpg)