Bank Name NL - Coöperatieve Centrale Raiffeisen-Boerenleenbank B.A.
LEI Code DG3RU1DBUFHT4ZF9WN62
NL
NUK_WL_NR_XX
version
1809014
No restructuring
2014 EU-wide Stress Test
Actual figures as of 31 December 2013 mln EUR, % Actual figures as of 31 December 2013 mln EUR, %
Operating profit before impairments 2,602 Operating profit before impairments 2,602
Impairment losses on financial and non-financial assets in the banking book 4,444 Impairment losses on financial and non-financial assets in the banking book 4,444
Common Equity Tier 1 capital (1) 25,262 Common Equity Tier 1 capital (1) 25,262
Total Risk Exposure (1) 210,040 Total Risk Exposure (1) 210,040
Common Equity Tier 1 ratio, % (1) 12.0% Common Equity Tier 1 ratio, % (1) 12.0%
Outcome of the adverse scenario as of 31 December 2016 mln EUR, % Outcome of the baseline scenario as of 31 December 2016 mln EUR, %
3 yr cumulative operating profit before impairments 7,291 3 yr cumulative operating profit before impairments 9,846
3 yr cumulative impairment losses on financial and non-financial assets in the banking book 9,799 3 yr cumulative impairment losses on financial and non-financial assets in the banking book 4,150
3 yr cumulative losses from the stress in the trading book 1,727 3 yr cumulative losses from the stress in the trading book 1,422
Valuation losses due to sovereign shock after tax and prudential filters 102 Common Equity Tier 1 capital (1) 24,855
Common Equity Tier 1 capital (1) 20,434 Total Risk Exposure (1) 221,974
Total Risk Exposure (1) 244,592 Common Equity Tier 1 ratio, % (1) 11.2%
Common Equity Tier 1 ratio, % (1) 8.4%
Memorandum items mln EUR
Memorandum items mln EUR Common EU wide CET1 Threshold (8.0%) 17,758
Common EU wide CET1 Threshold (5.5%) 13,453
Total amount of instruments with mandatory conversion into ordinary shares upon a fixed date in
the 2014 -2016 period (cumulative conversions) (2)0
Total Additional Tier 1 and Tier 2 instruments eligible as regulatory capital under the CRR provisions
that convert into Common Equity Tier 1 or are written down upon a trigger event (3)2,859
Of which: eligible instruments whose trigger is above CET1 capital ratio in the adverse
scenario (3)0
(2) Conversions not considered for CET1 computation
(3) Excluding instruments with mandatory conversion into ordinary shares upon a fixed date in the 2014 -2016 period
(1) According to CRR/CRD4 definition transitional arrangements as per reporting date. Figures as of 31/12/2013 computed as of first day of application:
01/01/2014.
2014 EU-wide Stress Test 2014 EU-wide Stress TestSummary Baseline Scenario
NL - Coöperatieve Centrale Raiffeisen-Boerenleenbank B.A.
(1) According to CRR/CRD4 definition transitional arrangements as per reporting date. Figures as of 31/12/2013 computed as of first day of application:
01/01/2014.
Summary Adverse Scenario
NL - Coöperatieve Centrale Raiffeisen-Boerenleenbank B.A.

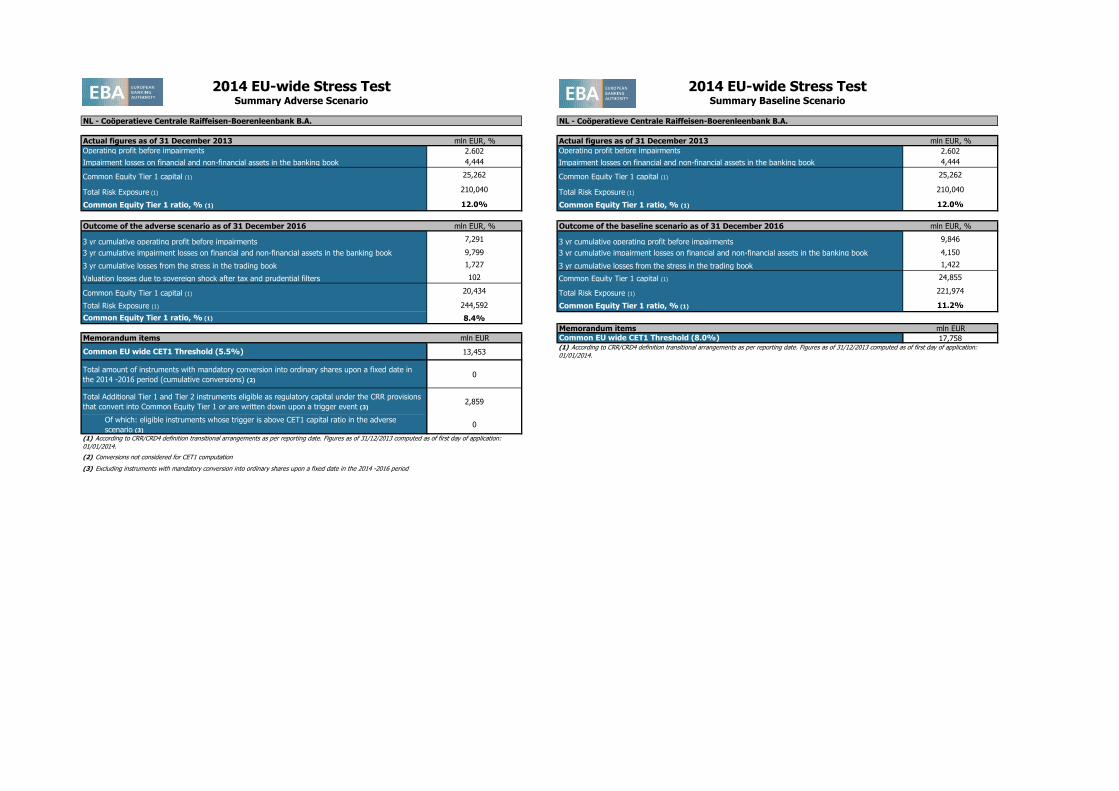
2014 EU-wide Stress TestCredit Risk
(mln EUR, %)
Non-defaulted Defaulted Non-defaulted Defaulted Non-defaulted Defaulted Non-defaulted Defaulted Non-defaulted Defaulted Non-defaulted Defaulted Non-defaulted Defaulted Non-defaulted Defaulted Non-defaulted Defaulted Impairment
rate
Stock of
Provisions
Coverage Ratio -
Default Stock
Impairment
rate
Stock of
Provisions
Coverage
Ratio - Default
Stock
Impairment
rate
Stock of
Provisions
Coverage
Ratio - Default
Stock
Impairment rateStock of
Provisions
Coverage
Ratio - Default
Stock
Impairment
rate
Stock of
Provisions
Coverage
Ratio - Default
Stock
Impairment
rate
Stock of
Provisions
Coverage
Ratio - Default
Stock
Central banks and central governments 0 0 81,015 49 4,522 0 0 0 1,103 0 3,245 0 0 0 0 1 0 0 0.00% 2 3.13% 0.00% 4 3.88% 0.00% 5 4.33% 0.00% 3 3.66% 0.00% 5 4.89% 0.00% 7 5.60%
Institutions 0 0 20,718 796 753 5 0 0 8,289 0 237 2 0 0 1 9 0 0 0.14% 36 3.80% 0.11% 55 5.51% 0.10% 73 6.83% 0.24% 54 5.48% 0.29% 107 9.22% 0.25% 151 11.52%
Corporates 0 0 211,137 11,202 11,286 1,494 0 0 81,534 2,228 10,412 1,787 0 0 242 4,554 37 2,062 0.53% 9,798 27.47% 0.44% 10,746 24.40% 0.35% 11,494 22.27% 0.76% 10,705 28.37% 0.86% 12,620 25.46% 0.84% 14,329 23.72%
Corporates - Of Which: Specialised Lending 0 0 14,218 2,255 1,416 0 0 0 10,906 0 1,416 0 0 0 76 699 0 24 - 0 - - 0 - - 0 - - 0 - - 0 - - 0 -
Corporates - Of Which: SME 0 0 109,385 7,617 5,890 1,258 0 0 36,289 393 5,137 1,557 0 0 105 3,246 35 1,944 - 0 - - 0 - - 0 - - 0 - - 0 - - 0 -
Retail 0 0 257,540 3,473 15,532 1,077 0 0 35,962 0 9,143 815 0 0 152 1,326 82 542 0.15% 2,858 30.62% 0.14% 3,261 26.96% 0.12% 3,644 24.90% 0.28% 3,383 30.50% 0.34% 4,441 27.37% 0.36% 5,482 25.47%
Retail - Secured on real estate property 80.6% 0 0 225,368 1,996 7,406 329 0 0 25,536 0 4,148 282 0 0 44 592 42 118 0.07% 1,189 25.06% 0.07% 1,356 21.71% 0.05% 1,521 19.97% 0.16% 1,523 25.89% 0.20% 2,098 23.74% 0.23% 2,679 22.30%
Retail - Secured on real estate property - Of
Which: SME76.0% 0 0 19,540 478 486 15 0 0 3,110 0 270 8 0 0 22 326 4 2 0.29% 460 52.67% 0.28% 517 45.06% 0.28% 573 40.16% 0.61% 549 48.95% 0.75% 725 42.72% 0.85% 901 39.08%
Retail - Secured on real estate property - Of
Which: non-SME81.0% 0 0 205,829 1,518 6,920 314 0 0 22,426 0 3,878 274 0 0 23 266 38 115 0.05% 729 18.40% 0.05% 838 16.14% 0.03% 948 15.08% 0.12% 974 20.24% 0.15% 1,373 19.12% 0.18% 1,779 18.25%
Retail - Qualifying Revolving 0 0 0 0 0 0 0 0 0 0 0 0 0 0 0 0 0 0 - 0 - - 0 - - 0 - - 0 - - 0 - - 0 -
Retail - Other Retail 0 0 32,172 1,477 8,126 748 0 0 10,425 0 4,995 533 0 0 107 734 39 424 0.61% 1,669 36.06% 0.58% 1,905 32.28% 0.55% 2,123 29.98% 0.95% 1,860 35.59% 1.13% 2,343 31.66% 1.19% 2,802 29.47%
Retail - Other Retail - Of Which: SME 0 0 26,335 1,287 4,593 519 0 0 9,207 0 2,565 365 0 0 100 683 29 300 0.68% 1,440 37.77% 0.65% 1,644 33.48% 0.63% 1,834 30.90% 1.09% 1,617 36.86% 1.31% 2,043 32.28% 1.40% 2,446 29.77%
Retail - Other Retail - Of Which: non-SME 0 0 5,837 190 3,533 229 0 0 1,219 0 2,430 168 0 0 7 51 10 124 0.38% 229 28.62% 0.34% 261 26.67% 0.30% 289 25.45% 0.48% 243 29.31% 0.54% 300 28.15% 0.55% 356 27.60%
Equity 4,991 0 0 0 0 0 12,083 0 0 0 0 0 0 0 0 0 0 0 0.00% 0 - 0.00% 0 - 0.00% 0 - 0.00% 0 - 0.00% 0 - 0.00% 0 -
Securitisation 4,530 0 6,798 0 0 0 3,079 0 879 0 0 0 0 0 0 0 0 0
Other non-credit obligation assets 0 0 0 0 10,035 0 0 0 0 0 13,281 0 0 0 0 0 1,172 0
TOTAL 9,522 0 577,207 15,520 42,128 2,577 15,162 0 127,767 2,228 36,317 2,605 0 0 395 5,890 1,291 2,604 0.28% 12,694 27.51% 0.24% 14,066 24.52% 0.19% 15,216 22.52% 0.44% 14,145 28.30% 0.50% 17,173 25.58% 0.50% 19,969 23.93%
Securitisation and re-securitisations positions deducted from capital * 2,023 0 0 0 0 0 1,437 0 0 0 0 0
(mln EUR, %)Non-defaulted Defaulted Non-defaulted Defaulted Non-defaulted Defaulted Non-defaulted Defaulted Non-defaulted Defaulted Non-defaulted Defaulted Non-defaulted Defaulted Non-defaulted Defaulted Non-defaulted Defaulted
Impairment
rate
Stock of
Provisions
Coverage Ratio -
Default Stock
Impairment
rate
Stock of
Provisions
Coverage
Ratio - Default
Stock
Impairment
rate
Stock of
Provisions
Coverage
Ratio - Default
Stock
Impairment rateStock of
Provisions
Coverage
Ratio - Default
Stock
Impairment
rate
Stock of
Provisions
Coverage
Ratio - Default
Stock
Impairment
rate
Stock of
Provisions
Coverage
Ratio - Default
Stock
Central banks and central governments 0 0 36,645 0 495 0 0 0 23 0 2,853 0 0 0 0 0 0 0 0.00% 0 4.55% 0.00% 0 4.75% 0.00% 0 4.91% 0.00% 0 4.51% 0.00% 0 4.46% 0.00% 1 4.61%
Institutions 0 0 6,988 767 30 0 0 0 4,810 0 8 0 0 0 1 9 0 0 0.18% 22 2.50% 0.12% 29 3.27% 0.09% 35 3.81% 0.32% 31 3.45% 0.34% 52 5.36% 0.27% 69 6.66%
Corporates 0 0 116,936 9,477 2,744 343 0 0 53,795 2,228 2,647 288 0 0 161 4,019 2 197 0.74% 6,853 23.89% 0.62% 7,553 21.27% 0.49% 8,088 19.43% 1.12% 7,596 25.02% 1.30% 8,953 22.56% 1.33% 10,232 21.17%
Corporates - Of Which: Specialised Lending 0 0 13,672 2,166 1,416 0 0 0 10,294 0 1,416 0 0 0 75 592 0 0 - 0 - - 0 - - 0 - - 0 - - 0 - - 0 -
Corporates - Of Which: SME 0 0 83,736 6,753 806 337 0 0 30,229 393 707 282 0 0 64 3,174 2 197 - 0 - - 0 - - 0 - - 0 - - 0 - - 0 -
Retail 0 0 244,160 3,051 4,627 232 0 0 33,141 0 2,694 151 0 0 106 1,154 7 51 0.12% 1,944 30.08% 0.11% 2,233 26.23% 0.10% 2,514 24.16% 0.22% 2,307 29.21% 0.28% 3,116 26.22% 0.32% 3,952 24.45%
Retail - Secured on real estate property 80.6% 0 0 225,368 1,996 2,491 115 0 0 25,536 0 1,218 69 0 0 44 591 3 12 0.07% 1,039 24.82% 0.07% 1,204 21.60% 0.06% 1,368 19.98% 0.16% 1,322 24.75% 0.20% 1,869 22.87% 0.23% 2,432 21.66%
Retail - Secured on real estate property - Of
Which: SME76.0% 0 0 19,540 478 8 1 0 0 3,110 0 2 0 0 0 22 326 0 0 0.29% 454 53.76% 0.29% 511 45.85% 0.29% 566 40.78% 0.62% 542 49.67% 0.77% 717 43.13% 0.86% 891 39.32%
Retail - Secured on real estate property - Of
Which: non-SME81.0% 0 0 205,829 1,518 2,483 114 0 0 22,426 0 1,216 68 0 0 23 265 3 12 0.05% 585 17.06% 0.05% 693 15.24% 0.03% 802 14.48% 0.12% 780 18.11% 0.15% 1,153 17.60% 0.17% 1,541 17.14%
Retail - Qualifying Revolving 0 0 0 0 0 0 0 0 0 0 0 0 0 0 0 0 0 0 - 0 - - 0 - - 0 - - 0 - - 0 - - 0 -
Retail - Other Retail 0 0 18,792 1,055 2,136 117 0 0 7,605 0 1,476 82 0 0 61 563 4 39 0.59% 905 39.78% 0.57% 1,028 35.03% 0.56% 1,146 32.21% 0.87% 984 38.94% 1.15% 1,246 33.91% 1.34% 1,520 31.01%
Retail - Other Retail - Of Which: SME 0 0 12,955 865 972 96 0 0 6,386 0 602 63 0 0 54 512 1 30 0.74% 813 44.10% 0.72% 918 38.76% 0.73% 1,020 35.48% 1.09% 882 42.58% 1.50% 1,109 36.47% 1.81% 1,348 32.92%
Retail - Other Retail - Of Which: non-SME 0 0 5,837 190 1,165 21 0 0 1,219 0 874 19 0 0 7 51 3 10 0.31% 92 22.28% 0.26% 111 20.24% 0.23% 127 19.10% 0.42% 102 23.18% 0.47% 138 22.18% 0.47% 172 21.68%
Equity 4,718 0 0 0 0 0 11,213 0 0 0 0 0 0 0 0 0 0 0 0.00% 0 - 0.00% 0 - 0.00% 0 - 0.00% 0 - 0.00% 0 - 0.00% 0 -
Securitisation 735 0 0 0 0 0 312 0 0 0 0 0 0 0 0 0 0 0
Other non-credit obligation assets 0 0 0 0 10,035 0 0 0 0 0 13,281 0 0 0 0 0 1,172 0
TOTAL 5,453 0 404,729 13,295 17,931 576 11,525 0 91,769 2,228 21,483 439 0 0 268 5,183 1,181 249 0.29% 8,819 24.36% 0.24% 9,815 21.77% 0.20% 10,637 20.02% 0.47% 9,934 25.30% 0.54% 12,122 23.02% 0.56% 14,253 21.72%
Securitisation and re-securitisations positions deducted from capital * 18 0 0 0 0 0 12 0 0 0 0 0
(mln EUR, %)Non-defaulted Defaulted Non-defaulted Defaulted Non-defaulted Defaulted Non-defaulted Defaulted Non-defaulted Defaulted Non-defaulted Defaulted Non-defaulted Defaulted Non-defaulted Defaulted Non-defaulted Defaulted
Impairment
rate
Stock of
Provisions
Coverage Ratio -
Default Stock
Impairment
rate
Stock of
Provisions
Coverage
Ratio - Default
Stock
Impairment
rate
Stock of
Provisions
Coverage
Ratio - Default
Stock
Impairment rateStock of
Provisions
Coverage
Ratio - Default
Stock
Impairment
rate
Stock of
Provisions
Coverage
Ratio - Default
Stock
Impairment
rate
Stock of
Provisions
Coverage
Ratio - Default
Stock
Central banks and central governments 0 0 20,883 1 1,974 0 0 0 64 0 0 0 0 0 0 1 0 0 0.00% 1 35.81% 0.00% 1 29.88% 0.00% 1 26.92% 0.00% 1 35.48% 0.00% 1 29.11% 0.00% 2 26.33%
Institutions 0 0 1,554 0 88 0 0 0 615 0 23 0 0 0 0 0 0 0 0.11% 2 38.06% 0.11% 3 38.11% 0.10% 4 38.21% 0.12% 2 38.27% 0.17% 4 38.94% 0.20% 7 39.44%
Corporates 0 0 32,106 250 2 0 0 0 8,249 0 1 0 0 0 38 45 0 0 0.12% 126 7.54% 0.10% 160 7.41% 0.09% 188 7.20% 0.14% 131 7.58% 0.20% 194 7.87% 0.19% 259 8.44%
Corporates - Of Which: Specialised Lending 0 0 0 0 0 0 0 0 0 0 0 0 0 0 0 0 0 0 - 0 - - 0 - - 0 - - 0 - - 0 - - 0 -
Corporates - Of Which: SME 0 0 7,349 45 1 0 0 0 1,822 0 1 0 0 0 13 9 0 0 - 0 - - 0 - - 0 - - 0 - - 0 - - 0 -
Retail 0 0 4,998 47 2,780 76 0 0 1,094 0 1,325 44 0 0 20 16 8 3 0.34% 75 18.51% 0.31% 100 19.31% 0.28% 122 19.65% 0.89% 117 20.27% 0.90% 185 20.94% 0.71% 237 21.14%
Retail - Secured on real estate property 0.0% 0 0 0 0 1,466 13 0 0 0 0 605 5 0 0 0 0 5 2 0.02% 8 11.52% 0.02% 8 9.38% 0.01% 8 8.00% 0.03% 8 11.23% 0.03% 8 9.93% 0.04% 10 10.67%
Retail - Secured on real estate property - Of
Which: SME0.0% 0 0 0 0 0 0 0 0 0 0 0 0 0 0 0 0 0 0 - 0 - - 0 - - 0 - - 0 - - 0 - - 0 -
Retail - Secured on real estate property - Of
Which: non-SME0.0% 0 0 0 0 1,466 13 0 0 0 0 605 5 0 0 0 0 5 2 0.02% 8 11.52% 0.02% 8 9.38% 0.01% 8 8.00% 0.03% 8 11.23% 0.03% 8 9.93% 0.04% 10 10.67%
Retail - Qualifying Revolving 0 0 0 0 0 0 0 0 0 0 0 0 0 0 0 0 0 0 - 0 - - 0 - - 0 - - 0 - - 0 - - 0 -
Retail - Other Retail 0 0 4,998 47 1,315 62 0 0 1,094 0 719 38 0 0 20 16 3 1 0.41% 67 19.24% 0.38% 92 20.25% 0.34% 114 20.71% 1.09% 110 20.82% 1.11% 177 21.50% 0.88% 227 21.67%
Retail - Other Retail - Of Which: SME 0 0 4,998 47 164 7 0 0 1,094 0 91 8 0 0 20 16 1 1 0.47% 63 25.58% 0.43% 86 24.52% 0.39% 107 24.06% 1.30% 106 24.11% 1.33% 171 23.44% 1.05% 219 23.19%
Retail - Other Retail - Of Which: non-SME 0 0 0 0 1,150 55 0 0 0 0 629 30 0 0 0 0 2 0 0.14% 4 2.49% 0.13% 5 4.28% 0.13% 7 5.61% 0.15% 4 2.76% 0.18% 6 5.02% 0.18% 8 6.64%
Equity 5 0 0 0 0 0 19 0 0 0 0 0 0 0 0 0 0 0 0.00% 0 - 0.00% 0 - 0.00% 0 - 0.00% 0 - 0.00% 0 - 0.00% 0 -
Securitisation 1,836 0 6,798 0 0 0 1,076 0 879 0 0 0 0 0 0 0 0 0
Other non-credit obligation assets 0 0 0 0 0 0 0 0 0 0 0 0 0 0 0 0 0 0
TOTAL 1,841 0 66,338 298 4,843 76 1,095 0 10,900 0 1,348 44 0 0 58 62 8 3 0.11% 204 9.63% 0.10% 264 9.76% 0.08% 315 9.69% 0.19% 251 11.06% 0.22% 384 11.62% 0.19% 505 12.10%
Securitisation and re-securitisations positions deducted from capital * 1,624 0 0 0 0 0 1,198 0 0 0 0 0
(mln EUR, %)Non-defaulted Defaulted Non-defaulted Defaulted Non-defaulted Defaulted Non-defaulted Defaulted Non-defaulted Defaulted Non-defaulted Defaulted Non-defaulted Defaulted Non-defaulted Defaulted Non-defaulted Defaulted
Impairment
rate
Stock of
Provisions
Coverage Ratio -
Default Stock
Impairment
rate
Stock of
Provisions
Coverage
Ratio - Default
Stock
Impairment
rate
Stock of
Provisions
Coverage
Ratio - Default
Stock
Impairment rateStock of
Provisions
Coverage
Ratio - Default
Stock
Impairment
rate
Stock of
Provisions
Coverage
Ratio - Default
Stock
Impairment
rate
Stock of
Provisions
Coverage
Ratio - Default
Stock
Central banks and central governments 0 0 1,352 0 0 0 0 0 5 0 0 0 0 0 0 0 0 0 0.03% 0 33.55% 0.03% 0 33.54% 0.03% 0 33.54% 0.02% 0 33.55% 0.04% 0 33.54% 0.04% 0 33.54%
Institutions 0 0 517 0 2 0 0 0 52 0 0 0 0 0 0 0 0 0 0.03% 0 23.90% 0.03% 0 23.90% 0.03% 1 23.91% 0.03% 0 23.89% 0.04% 0 23.91% 0.04% 1 23.92%
Corporates 0 0 15,946 513 51 1 0 0 3,762 0 51 1 0 0 12 2 0 0 0.18% 43 4.34% 0.15% 66 5.97% 0.13% 86 6.87% 0.22% 48 4.77% 0.25% 86 6.99% 0.26% 124 8.08%
Corporates - Of Which: Specialised Lending 0 0 0 0 0 0 0 0 0 0 0 0 0 0 0 0 0 0 - 0 - - 0 - - 0 - - 0 - - 0 - - 0 -
Corporates - Of Which: SME 0 0 11,668 506 1 0 0 0 2,615 0 1 0 0 0 9 0 0 0 - 0 - - 0 - - 0 - - 0 - - 0 - - 0 -
Retail 0 0 641 6 146 0 0 0 149 0 48 0 0 0 1 3 0 0 0.45% 8 29.02% 0.40% 11 26.43% 0.37% 14 25.36% 0.56% 8 28.01% 0.73% 14 25.23% 0.83% 20 24.19%
Retail - Secured on real estate property 0.0% 0 0 0 0 0 0 0 0 0 0 0 0 0 0 0 0 0 0 - 0 - - 0 - - 0 - - 0 - - 0 - - 0 -
Retail - Secured on real estate property - Of
Which: SME0.0% 0 0 0 0 0 0 0 0 0 0 0 0 0 0 0 0 0 0 - 0 - - 0 - - 0 - - 0 - - 0 - - 0 -
Retail - Secured on real estate property - Of
Which: non-SME0.0% 0 0 0 0 0 0 0 0 0 0 0 0 0 0 0 0 0 0 - 0 - - 0 - - 0 - - 0 - - 0 - - 0 -
Retail - Qualifying Revolving 0 0 0 0 0 0 0 0 0 0 0 0 0 0 0 0 0 0 - 0 - - 0 - - 0 - - 0 - - 0 - - 0 -
Retail - Other Retail 0 0 641 6 146 0 0 0 149 0 48 0 0 0 1 3 0 0 0.45% 8 29.02% 0.40% 11 26.43% 0.37% 14 25.36% 0.56% 8 28.01% 0.73% 14 25.23% 0.83% 20 24.19%
Retail - Other Retail - Of Which: SME 0 0 641 6 146 0 0 0 149 0 48 0 0 0 1 3 0 0 0.45% 8 29.02% 0.40% 11 26.43% 0.37% 14 25.36% 0.56% 8 28.01% 0.73% 14 25.23% 0.83% 20 24.19%
Retail - Other Retail - Of Which: non-SME 0 0 0 0 0 0 0 0 0 0 0 0 0 0 0 0 0 0 - 0 - - 0 - - 0 - - 0 - - 0 - - 0 -
Equity 0 0 0 0 0 0 0 0 0 0 0 0 0 0 0 0 0 0 0.00% 0 - 0.00% 0 - 0.00% 0 - 0.00% 0 - 0.00% 0 - 0.00% 0 -
Securitisation 190 0 0 0 0 0 62 0 0 0 0 0 0 0 0 0 0 0
Other non-credit obligation assets 0 0 0 0 0 0 0 0 0 0 0 0 0 0 0 0 0 0
TOTAL 190 0 18,456 519 199 1 62 0 3,969 0 99 1 0 0 13 5 0 0 0.19% 51 5.10% 0.15% 77 6.78% 0.14% 100 7.70% 0.23% 57 5.56% 0.26% 101 7.86% 0.27% 145 8.97%
Securitisation and re-securitisations positions deducted from capital * 0 0 0 0 0 0 0 0 0 0 0 0
(mln EUR, %)Non-defaulted Defaulted Non-defaulted Defaulted Non-defaulted Defaulted Non-defaulted Defaulted Non-defaulted Defaulted Non-defaulted Defaulted Non-defaulted Defaulted Non-defaulted Defaulted Non-defaulted Defaulted
Impairment
rate
Stock of
Provisions
Coverage Ratio -
Default Stock
Impairment
rate
Stock of
Provisions
Coverage
Ratio - Default
Stock
Impairment
rate
Stock of
Provisions
Coverage
Ratio - Default
Stock
Impairment rateStock of
Provisions
Coverage
Ratio - Default
Stock
Impairment
rate
Stock of
Provisions
Coverage
Ratio - Default
Stock
Impairment
rate
Stock of
Provisions
Coverage
Ratio - Default
Stock
Central banks and central governments 0 0 6,425 0 0 0 0 0 0 0 0 0 0 0 0 0 0 0 0.00% 0 - 0.00% 0 0.00% 0.00% 0 0.00% 0.00% 0 0.00% 0.00% 0 0.00% 0.00% 0 0.00%
Institutions 0 0 1,546 2 2 0 0 0 694 0 0 0 0 0 0 0 0 0 0.13% 2 25.83% 0.12% 4 28.51% 0.15% 6 30.11% 0.45% 7 33.63% 0.72% 17 36.69% 0.58% 25 37.53%
Corporates 0 0 3,283 66 58 0 0 0 1,128 0 50 0 0 0 2 12 0 0 0.32% 25 21.64% 0.27% 34 22.78% 0.28% 43 23.26% 0.62% 34 22.31% 0.71% 58 22.87% 0.54% 75 22.83%
Corporates - Of Which: Specialised Lending 0 0 0 0 0 0 0 0 0 0 0 0 0 0 0 0 0 0 - 0 - - 0 - - 0 - - 0 - - 0 - - 0 -
Corporates - Of Which: SME 0 0 13 0 0 0 0 0 6 0 0 0 0 0 0 0 0 0 - 0 - - 0 - - 0 - - 0 - - 0 - - 0 -
Retail 0 0 922 12 0 0 0 0 145 0 0 0 0 0 3 4 0 0 0.58% 13 20.68% 0.56% 18 18.66% 0.57% 23 17.85% 0.69% 13 20.10% 0.79% 21 18.10% 0.82% 28 17.38%
Retail - Secured on real estate property 0.0% 0 0 0 0 0 0 0 0 0 0 0 0 0 0 0 0 0 0 - 0 - - 0 - - 0 - - 0 - - 0 - - 0 -
Retail - Secured on real estate property - Of
Which: SME0.0% 0 0 0 0 0 0 0 0 0 0 0 0 0 0 0 0 0 0 - 0 - - 0 - - 0 - - 0 - - 0 - - 0 -
Retail - Secured on real estate property - Of
Which: non-SME0.0% 0 0 0 0 0 0 0 0 0 0 0 0 0 0 0 0 0 0 - 0 - - 0 - - 0 - - 0 - - 0 - - 0 -
Retail - Qualifying Revolving 0 0 0 0 0 0 0 0 0 0 0 0 0 0 0 0 0 0 - 0 - - 0 - - 0 - - 0 - - 0 - - 0 -
Retail - Other Retail 0 0 922 12 0 0 0 0 145 0 0 0 0 0 3 4 0 0 0.58% 13 20.68% 0.56% 18 18.66% 0.57% 23 17.85% 0.69% 13 20.10% 0.79% 21 18.10% 0.82% 28 17.38%
Retail - Other Retail - Of Which: SME 0 0 922 12 0 0 0 0 145 0 0 0 0 0 3 4 0 0 0.58% 13 20.68% 0.56% 18 18.66% 0.57% 23 17.85% 0.69% 13 20.10% 0.79% 21 18.10% 0.82% 28 17.38%
Retail - Other Retail - Of Which: non-SME 0 0 0 0 0 0 0 0 0 0 0 0 0 0 0 0 0 0 - 0 - - 0 - - 0 - - 0 - - 0 - - 0 -
Equity 3 0 0 0 0 0 11 0 0 0 0 0 0 0 0 0 0 0 0.00% 0 - 0.00% 0 - 0.00% 0 - 0.00% 0 - 0.00% 0 - 0.00% 0 -
Securitisation 547 0 0 0 0 0 69 0 0 0 0 0 0 0 0 0 0 0
Other non-credit obligation assets 0 0 0 0 0 0 0 0 0 0 0 0 0 0 0 0 0 0
TOTAL 550 0 12,176 80 60 0 80 0 1,966 0 51 0 0 0 5 16 0 0 0.15% 39 21.55% 0.13% 55 21.61% 0.13% 71 21.62% 0.27% 55 22.70% 0.34% 96 23.20% 0.27% 128 23.10%
Securitisation and re-securitisations positions deducted from capital * 172 0 0 0 0 0 122 0 0 0 0 0
(mln EUR, %)Non-defaulted Defaulted Non-defaulted Defaulted Non-defaulted Defaulted Non-defaulted Defaulted Non-defaulted Defaulted Non-defaulted Defaulted Non-defaulted Defaulted Non-defaulted Defaulted Non-defaulted Defaulted
Impairment
rate
Stock of
Provisions
Coverage Ratio -
Default Stock
Impairment
rate
Stock of
Provisions
Coverage
Ratio - Default
Stock
Impairment
rate
Stock of
Provisions
Coverage
Ratio - Default
Stock
Impairment rateStock of
Provisions
Coverage
Ratio - Default
Stock
Impairment
rate
Stock of
Provisions
Coverage
Ratio - Default
Stock
Impairment
rate
Stock of
Provisions
Coverage
Ratio - Default
Stock
Central banks and central governments 0 0 20 0 2,045 0 0 0 17 0 387 0 0 0 0 0 0 0 0.01% 0 56.04% 0.01% 0 55.60% 0.01% 0 55.52% 0.06% 0 32.01% 0.07% 1 32.73% 0.07% 1 33.30%
Institutions 0 0 2 0 131 0 0 0 1 0 45 0 0 0 0 0 0 0 0.01% 0 31.65% 0.01% 0 31.09% 0.01% 0 30.63% 0.01% 0 31.31% 0.02% 0 30.01% 0.02% 0 29.02%
Corporates 0 0 84 0 2,835 200 0 0 32 0 2,454 173 0 0 0 0 8 99 0.20% 113 28.62% 0.18% 118 25.51% 0.16% 123 23.25% 0.23% 115 28.53% 0.28% 133 27.41% 0.32% 151 26.66%
Corporates - Of Which: Specialised Lending 0 0 0 0 0 0 0 0 0 0 0 0 0 0 0 0 0 0 - 0 - - 0 - - 0 - - 0 - - 0 - - 0 -
Corporates - Of Which: SME 0 0 0 0 1,170 88 0 0 0 0 941 71 0 0 0 0 6 30 - 0 - - 0 - - 0 - - 0 - - 0 - - 0 -
Retail 0 0 0 0 4,844 310 0 0 0 0 3,296 209 0 0 0 0 18 209 0.45% 248 38.63% 0.43% 269 37.34% 0.40% 287 36.26% 0.51% 255 39.26% 0.59% 291 39.21% 0.63% 332 39.81%
Retail - Secured on real estate property 0.0% 0 0 0 0 2,879 47 0 0 0 0 1,955 33 0 0 0 0 9 10 0.07% 21 15.11% 0.06% 23 13.61% 0.04% 24 12.31% 0.10% 23 17.75% 0.14% 31 20.75% 0.18% 41 24.74%
Retail - Secured on real estate property - Of
Which: SME0.0% 0 0 0 0 478 14 0 0 0 0 268 8 0 0 0 0 4 2 0.07% 6 11.83% 0.06% 7 11.28% 0.04% 7 10.63% 0.10% 7 13.80% 0.13% 8 16.88% 0.17% 10 20.72%
Retail - Secured on real estate property - Of
Which: non-SME0.0% 0 0 0 0 2,401 33 0 0 0 0 1,687 25 0 0 0 0 5 8 0.07% 15 16.22% 0.06% 16 14.33% 0.04% 17 12.79% 0.10% 17 19.07% 0.14% 23 21.90% 0.18% 31 25.86%
Retail - Qualifying Revolving 0 0 0 0 0 0 0 0 0 0 0 0 0 0 0 0 0 0 - 0 - - 0 - - 0 - - 0 - - 0 - - 0 -
Retail - Other Retail 0 0 0 0 1,965 263 0 0 0 0 1,341 176 0 0 0 0 9 199 1.00% 227 42.14% 0.98% 246 41.38% 0.94% 264 40.75% 1.11% 232 42.51% 1.26% 260 42.47% 1.32% 290 42.79%
Retail - Other Retail - Of Which: SME 0 0 0 0 754 118 0 0 0 0 420 66 0 0 0 0 3 91 0.98% 102 42.63% 0.96% 109 41.91% 0.93% 116 41.32% 1.07% 103 42.79% 1.21% 113 42.36% 1.24% 123 42.17%
Retail - Other Retail - Of Which: non-SME 0 0 0 0 1,211 145 0 0 0 0 922 110 0 0 0 0 6 108 1.01% 126 41.74% 0.99% 137 40.96% 0.94% 148 40.31% 1.13% 129 42.29% 1.30% 147 42.55% 1.37% 167 43.25%
Equity 0 0 0 0 0 0 0 0 0 0 0 0 0 0 0 0 0 0 0.00% 0 - 0.00% 0 - 0.00% 0 - 0.00% 0 - 0.00% 0 - 0.00% 0 -
Securitisation 0 0 0 0 0 0 0 0 0 0 0 0 0 0 0 0 0 0
Other non-credit obligation assets 0 0 0 0 0 0 0 0 0 0 0 0 0 0 0 0 0 0
TOTAL 0 0 107 0 9,855 510 0 0 50 0 6,183 382 0 0 0 0 27 308 0.33% 362 34.82% 0.31% 387 32.72% 0.29% 410 31.08% 0.38% 370 35.16% 0.45% 424 34.55% 0.48% 483 34.49%
Securitisation and re-securitisations positions deducted from capital * 0 0 0 0 0 0 0 0 0 0 0 0
as of 31/12/2016 as of 31/12/2014 as of 31/12/2015 as of 31/12/2016
Poland
F-IRB A-IRB STA as of 31/12/2014 as of 31/12/2015LTV % (as of
31/12/2013)
Exposure values (as of 31/12/2013) Risk exposure amounts (as of 31/12/2013) Value adjustments and provisions (as of 31/12/2013) Baseline Scenario Adverse Scenario
F-IRB A-IRB STA F-IRB A-IRB STA
LTV % (as of
31/12/2013)
Exposure values (as of 31/12/2013) Risk exposure amounts (as of 31/12/2013) Value adjustments and provisions (as of 31/12/2013) Baseline Scenario Adverse Scenario
F-IRB A-IRB STA F-IRB A-IRB STA F-IRB as of 31/12/2014 as of 31/12/2015 as of 31/12/2016A-IRB STA as of 31/12/2014 as of 31/12/2015 as of 31/12/2016
LTV % (as of
31/12/2013)
Exposure values (as of 31/12/2013) Risk exposure amounts (as of 31/12/2013) Value adjustments and provisions (as of 31/12/2013) Baseline Scenario Adverse Scenario
F-IRB A-IRB STA F-IRB A-IRB STA F-IRB A-IRB as of 31/12/2015 as of 31/12/2016STA as of 31/12/2014 as of 31/12/2015 as of 31/12/2016 as of 31/12/2014
Risk exposure amounts (as of 31/12/2013)
Baseline Scenario Adverse Scenario
F-IRB A-IRB STA F-IRB A-IRB STA F-IRB A-IRB STA as of 31/12/2014 as of 31/12/2015 as of 31/12/2016 as of 31/12/2014 as of 31/12/2015 as of 31/12/2016
as of 31/12/2016
Netherlands
LTV % (as of
31/12/2013)
Exposure values (as of 31/12/2013) Risk exposure amounts (as of 31/12/2013) Value adjustments and provisions (as of 31/12/2013)
Adverse Scenario
F-IRB A-IRB STA F-IRB A-IRB STA F-IRB A-IRB STA as of 31/12/2014 as of 31/12/2015 as of 31/12/2016 as of 31/12/2014 as of 31/12/2015 as of 31/12/2016LTV % (as of
31/12/2013)
Exposure values (as of 31/12/2013)
NL - Coöperatieve Centrale
Raiffeisen-Boerenleenbank B.A.
(*) Refers to the part of Securitization exposure that is deducted from capital and is not included in RWA
Value adjustments and provisions (as of 31/12/2013) Baseline Scenario
LTV % (as of
31/12/2013)
Exposure values (as of 31/12/2013) Risk exposure amounts (as of 31/12/2013) Value adjustments and provisions (as of 31/12/2013) Adverse Scenario
F-IRB A-IRB STA F-IRB A-IRB STA F-IRB A-IRB STA
Baseline Scenario
as of 31/12/2014 as of 31/12/2015 as of 31/12/2016 as of 31/12/2014 as of 31/12/2015
(*) Refers to the part of Securitization exposure that is deducted from capital and is not included in RWA
(*) Refers to the part of Securitization exposure that is deducted from capital and is not included in RWA
(*) Refers to the part of Securitization exposure that is deducted from capital and is not included in RWA
(*) Refers to the part of Securitization exposure that is deducted from capital and is not included in RWA
(*) Refers to the part of Securitization exposure that is deducted from capital and is not included in RWA
United States
Australia
United Kingdom
2014 EU-wide Stress TestCredit Risk
LTV % (as of
31/12/2013)
Exposure values (as of 31/12/2013) Risk exposure amounts (as of 31/12/2013) Value adjustments and provisions (as of 31/12/2013) Adverse ScenarioBaseline Scenario
(mln EUR, %)Non-defaulted Defaulted Non-defaulted Defaulted Non-defaulted Defaulted Non-defaulted Defaulted Non-defaulted Defaulted Non-defaulted Defaulted Non-defaulted Defaulted Non-defaulted Defaulted Non-defaulted Defaulted
Impairment
rate
Stock of
Provisions
Coverage Ratio -
Default Stock
Impairment
rate
Stock of
Provisions
Coverage
Ratio - Default
Stock
Impairment
rate
Stock of
Provisions
Coverage
Ratio - Default
Stock
Impairment rateStock of
Provisions
Coverage
Ratio - Default
Stock
Impairment
rate
Stock of
Provisions
Coverage
Ratio - Default
Stock
Impairment
rate
Stock of
Provisions
Coverage
Ratio - Default
Stock
Central banks and central governments 0 0 3,079 0 0 0 0 0 0 0 0 0 0 0 0 0 0 0 0.00% 0 - 0.00% 0 0.00% 0.00% 0 0.00% 0.00% 0 0.00% 0.00% 0 0.00% 0.00% 0 0.00%
Institutions 0 0 1,364 0 82 0 0 0 254 0 16 0 0 0 0 0 0 0 0.07% 1 42.72% 0.05% 1 42.46% 0.05% 2 42.15% 0.16% 2 40.85% 0.16% 3 40.26% 0.11% 4 39.97%
Corporates 0 0 3,199 29 195 7 0 0 1,483 0 195 7 0 0 2 67 0 0 0.57% 88 96.31% 0.48% 104 75.65% 0.41% 118 65.59% 0.77% 95 77.99% 0.77% 121 58.59% 0.63% 142 51.58%
Corporates - Of Which: Specialised Lending 0 0 378 7 0 0 0 0 507 0 0 0 0 0 1 64 0 0 - 0 - - 0 - - 0 - - 0 - - 0 - - 0 -
Corporates - Of Which: SME 0 0 0 0 0 0 0 0 0 0 0 0 0 0 0 0 0 0 - 0 - - 0 - - 0 - - 0 - - 0 - - 0 -
Retail 0 0 986 32 768 27 0 0 205 0 424 15 0 0 4 11 0 0 0.43% 23 17.81% 0.43% 30 17.53% 0.44% 38 17.39% 0.50% 24 17.75% 0.60% 34 17.44% 0.65% 45 17.30%
Retail - Secured on real estate property 0.0% 0 0 0 0 0 0 0 0 0 0 0 0 0 0 0 0 0 0 - 0 - - 0 - - 0 - - 0 - - 0 - - 0 -
Retail - Secured on real estate property - Of
Which: SME0.0% 0 0 0 0 0 0 0 0 0 0 0 0 0 0 0 0 0 0 - 0 - - 0 - - 0 - - 0 - - 0 - - 0 -
Retail - Secured on real estate property - Of
Which: non-SME0.0% 0 0 0 0 0 0 0 0 0 0 0 0 0 0 0 0 0 0 - 0 - - 0 - - 0 - - 0 - - 0 - - 0 -
Retail - Qualifying Revolving 0 0 0 0 0 0 0 0 0 0 0 0 0 0 0 0 0 0 - 0 - - 0 - - 0 - - 0 - - 0 - - 0 -
Retail - Other Retail 0 0 986 32 768 27 0 0 205 0 424 15 0 0 4 11 0 0 0.43% 23 17.81% 0.43% 30 17.53% 0.44% 38 17.39% 0.50% 24 17.75% 0.60% 34 17.44% 0.65% 45 17.30%
Retail - Other Retail - Of Which: SME 0 0 986 32 768 27 0 0 205 0 424 15 0 0 4 11 0 0 0.43% 23 17.81% 0.43% 30 17.53% 0.44% 38 17.39% 0.50% 24 17.75% 0.60% 34 17.44% 0.65% 45 17.30%
Retail - Other Retail - Of Which: non-SME 0 0 0 0 0 0 0 0 0 0 0 0 0 0 0 0 0 0 - 0 - - 0 - - 0 - - 0 - - 0 - - 0 -
Equity 52 0 0 0 0 0 191 0 0 0 0 0 0 0 0 0 0 0 0.00% 0 - 0.00% 0 - 0.00% 0 - 0.00% 0 - 0.00% 0 - 0.00% 0 -
Securitisation 13 0 0 0 0 0 9 0 0 0 0 0 0 0 0 0 0 0
Other non-credit obligation assets 0 0 0 0 0 0 0 0 0 0 0 0 0 0 0 0 0 0
TOTAL 65 0 8,628 61 1,045 34 200 0 1,942 0 635 22 0 0 6 78 0 0 0.45% 112 53.75% 0.39% 136 44.97% 0.36% 157 40.32% 0.59% 120 48.67% 0.62% 159 39.65% 0.55% 191 35.65%
Securitisation and re-securitisations positions deducted from capital * 15 0 0 0 0 0 0 0 0 0 0 0
(mln EUR, %)Non-defaulted Defaulted Non-defaulted Defaulted Non-defaulted Defaulted Non-defaulted Defaulted Non-defaulted Defaulted Non-defaulted Defaulted Non-defaulted Defaulted Non-defaulted Defaulted Non-defaulted Defaulted
Impairment
rate
Stock of
Provisions
Coverage Ratio -
Default Stock
Impairment
rate
Stock of
Provisions
Coverage
Ratio - Default
Stock
Impairment
rate
Stock of
Provisions
Coverage
Ratio - Default
Stock
Impairment rateStock of
Provisions
Coverage
Ratio - Default
Stock
Impairment
rate
Stock of
Provisions
Coverage
Ratio - Default
Stock
Impairment
rate
Stock of
Provisions
Coverage
Ratio - Default
Stock
Central banks and central governments 0 0 4,597 0 0 0 0 0 2 0 0 0 0 0 0 0 0 0 - 0 - - 0 - - 0 - - 0 - - 0 - - 0 -
Institutions 0 0 589 0 43 0 0 0 193 0 9 0 0 0 0 0 0 0 0.17% 1 47.25% 0.16% 2 46.95% 0.14% 2 46.69% 0.48% 3 47.37% 0.77% 7 47.27% 0.60% 10 47.16%
Corporates 0 0 2,299 36 220 18 0 0 1,069 0 220 18 0 0 1 22 0 0 0.33% 31 34.59% 0.30% 39 32.27% 0.28% 45 30.93% 0.66% 40 32.96% 0.84% 61 30.47% 0.64% 76 29.37%
Corporates - Of Which: Specialised Lending 0 0 35 0 0 0 0 0 5 0 0 0 0 0 0 0 0 0 - 0 - - 0 - - 0 - - 0 - - 0 - - 0 -
Corporates - Of Which: SME 0 0 0 0 0 0 0 0 0 0 0 0 0 0 0 0 0 0 - 0 - - 0 - - 0 - - 0 - - 0 - - 0 -
Retail 0 0 1,296 57 75 6 0 0 226 0 41 3 0 0 4 17 0 0 0.51% 28 22.72% 0.49% 35 21.26% 0.47% 41 20.49% 0.56% 29 22.51% 0.65% 37 20.86% 0.70% 46 20.01%
Retail - Secured on real estate property 0.0% 0 0 0 0 0 0 0 0 0 0 0 0 0 0 0 0 0 0 - 0 - - 0 - - 0 - - 0 - - 0 - - 0 -
Retail - Secured on real estate property - Of
Which: SME0.0% 0 0 0 0 0 0 0 0 0 0 0 0 0 0 0 0 0 0 - 0 - - 0 - - 0 - - 0 - - 0 - - 0 -
Retail - Secured on real estate property - Of
Which: non-SME0.0% 0 0 0 0 0 0 0 0 0 0 0 0 0 0 0 0 0 0 - 0 - - 0 - - 0 - - 0 - - 0 - - 0 -
Retail - Qualifying Revolving 0 0 0 0 0 0 0 0 0 0 0 0 0 0 0 0 0 0 - 0 - - 0 - - 0 - - 0 - - 0 - - 0 -
Retail - Other Retail 0 0 1,296 57 75 6 0 0 226 0 41 3 0 0 4 17 0 0 0.51% 28 22.72% 0.49% 35 21.26% 0.47% 41 20.49% 0.56% 29 22.51% 0.65% 37 20.86% 0.70% 46 20.01%
Retail - Other Retail - Of Which: SME 0 0 1,296 57 75 6 0 0 226 0 41 3 0 0 4 17 0 0 0.51% 28 22.72% 0.49% 35 21.26% 0.47% 41 20.49% 0.56% 29 22.51% 0.65% 37 20.86% 0.70% 46 20.01%
Retail - Other Retail - Of Which: non-SME 0 0 0 0 0 0 0 0 0 0 0 0 0 0 0 0 0 0 - 0 - - 0 - - 0 - - 0 - - 0 - - 0 -
Equity 0 0 0 0 0 0 0 0 0 0 0 0 0 0 0 0 0 0 0.00% 0 - 0.00% 0 - 0.00% 0 - 0.00% 0 - 0.00% 0 - 0.00% 0 -
Securitisation 41 0 0 0 0 0 6 0 0 0 0 0 0 0 0 0 0 0
Other non-credit obligation assets 0 0 0 0 0 0 0 0 0 0 0 0 0 0 0 0 0 0
TOTAL 41 0 8,781 93 338 24 6 0 1,489 0 270 22 0 0 5 38 0 0 0.36% 60 28.23% 0.34% 75 26.43% 0.31% 89 25.43% 0.60% 71 28.32% 0.76% 105 26.88% 0.65% 132 25.99%
Securitisation and re-securitisations positions deducted from capital * 0 0 0 0 0 0 0 0 0 0 0 0
(mln EUR, %)Non-defaulted Defaulted Non-defaulted Defaulted Non-defaulted Defaulted Non-defaulted Defaulted Non-defaulted Defaulted Non-defaulted Defaulted Non-defaulted Defaulted Non-defaulted Defaulted Non-defaulted Defaulted
Impairment
rate
Stock of
Provisions
Coverage Ratio -
Default Stock
Impairment
rate
Stock of
Provisions
Coverage
Ratio - Default
Stock
Impairment
rate
Stock of
Provisions
Coverage
Ratio - Default
Stock
Impairment rateStock of
Provisions
Coverage
Ratio - Default
Stock
Impairment
rate
Stock of
Provisions
Coverage
Ratio - Default
Stock
Impairment
rate
Stock of
Provisions
Coverage
Ratio - Default
Stock
Central banks and central governments 0 0 362 0 0 0 0 0 1 0 0 0 0 0 0 0 0 0 0.03% 0 33.44% 0.03% 0 33.44% 0.03% 0 33.44% 0.02% 0 33.44% 0.03% 0 33.44% 0.04% 0 33.44%
Institutions 0 0 14 0 2 0 0 0 2 0 0 0 0 0 0 0 0 0 0.03% 0 24.57% 0.03% 0 24.55% 0.04% 0 24.53% 0.03% 0 24.77% 0.05% 0 24.68% 0.05% 0 24.66%
Corporates 0 0 7,250 314 0 0 0 0 1,839 0 0 0 0 0 10 56 0 0 0.24% 85 16.85% 0.19% 98 15.90% 0.16% 111 15.18% 0.28% 87 16.79% 0.29% 109 15.73% 0.29% 129 14.83%
Corporates - Of Which: Specialised Lending 0 0 0 0 0 0 0 0 0 0 0 0 0 0 0 0 0 0 - 0 - - 0 - - 0 - - 0 - - 0 - - 0 -
Corporates - Of Which: SME 0 0 6,311 314 0 0 0 0 1,543 0 0 0 0 0 9 56 0 0 - 0 - - 0 - - 0 - - 0 - - 0 - - 0 -
Retail 0 0 1 0 183 2 0 0 0 0 95 1 0 0 0 0 1 0 0.36% 1 10.67% 0.34% 2 12.55% 0.34% 3 13.41% 0.43% 1 11.23% 0.54% 2 13.28% 0.63% 4 14.14%
Retail - Secured on real estate property 0.0% 0 0 0 0 0 0 0 0 0 0 0 0 0 0 0 0 0 0 - 0 - - 0 - - 0 - - 0 - - 0 - - 0 -
Retail - Secured on real estate property - Of
Which: SME0.0% 0 0 0 0 0 0 0 0 0 0 0 0 0 0 0 0 0 0 - 0 - - 0 - - 0 - - 0 - - 0 - - 0 -
Retail - Secured on real estate property - Of
Which: non-SME0.0% 0 0 0 0 0 0 0 0 0 0 0 0 0 0 0 0 0 0 - 0 - - 0 - - 0 - - 0 - - 0 - - 0 -
Retail - Qualifying Revolving 0 0 0 0 0 0 0 0 0 0 0 0 0 0 0 0 0 0 - 0 - - 0 - - 0 - - 0 - - 0 - - 0 -
Retail - Other Retail 0 0 1 0 183 2 0 0 0 0 95 1 0 0 0 0 1 0 0.36% 1 10.67% 0.34% 2 12.55% 0.34% 3 13.41% 0.43% 1 11.23% 0.54% 2 13.28% 0.63% 4 14.14%
Retail - Other Retail - Of Which: SME 0 0 1 0 183 2 0 0 0 0 95 1 0 0 0 0 1 0 0.36% 1 10.67% 0.34% 2 12.55% 0.34% 3 13.41% 0.43% 1 11.23% 0.54% 2 13.28% 0.63% 4 14.14%
Retail - Other Retail - Of Which: non-SME 0 0 0 0 0 0 0 0 0 0 0 0 0 0 0 0 0 0 - 0 - - 0 - - 0 - - 0 - - 0 - - 0 -
Equity 0 0 0 0 0 0 0 0 0 0 0 0 0 0 0 0 0 0 - 0 - - 0 - - 0 - - 0 - - 0 - - 0 -
Securitisation 0 0 0 0 0 0 0 0 0 0 0 0 0 0 0 0 0 0
Other non-credit obligation assets 0 0 0 0 0 0 0 0 0 0 0 0 0 0 0 0 0 0
TOTAL 0 0 7,626 314 186 2 0 0 1,843 0 96 1 0 0 10 56 1 0 0.24% 86 16.76% 0.19% 100 15.84% 0.17% 113 15.14% 0.28% 89 16.70% 0.30% 111 15.68% 0.30% 133 14.81%
Securitisation and re-securitisations positions deducted from capital * 0 0 0 0 0 0 0 0 0 0 0 0
(mln EUR, %)Non-defaulted Defaulted Non-defaulted Defaulted Non-defaulted Defaulted Non-defaulted Defaulted Non-defaulted Defaulted Non-defaulted Defaulted Non-defaulted Defaulted Non-defaulted Defaulted Non-defaulted Defaulted
Impairment
rate
Stock of
Provisions
Coverage Ratio -
Default Stock
Impairment
rate
Stock of
Provisions
Coverage
Ratio - Default
Stock
Impairment
rate
Stock of
Provisions
Coverage
Ratio - Default
Stock
Impairment rateStock of
Provisions
Coverage
Ratio - Default
Stock
Impairment
rate
Stock of
Provisions
Coverage
Ratio - Default
Stock
Impairment
rate
Stock of
Provisions
Coverage
Ratio - Default
Stock
Central banks and central governments 0 0 560 0 0 0 0 0 292 0 0 0 0 0 0 0 0 0 0.18% 0 52.00% 0.18% 0 52.00% 0.18% 0 52.00% 0.24% 0 52.00% 0.47% 0 52.00% 0.36% 0 52.00%
Institutions 0 0 197 0 1 0 0 0 109 0 1 0 0 0 0 0 0 0 0.46% 1 44.89% 0.45% 2 44.38% 0.43% 3 43.88% 0.63% 1 42.69% 1.22% 4 39.03% 0.88% 5 38.39%
Corporates 0 0 2,738 36 1,623 32 0 0 1,403 0 1,558 31 0 0 3 21 9 13 0.25% 58 30.71% 0.23% 68 25.69% 0.22% 77 22.68% 0.35% 62 29.41% 0.63% 95 27.23% 0.54% 121 26.29%
Corporates - Of Which: Specialised Lending 0 0 0 0 0 0 0 0 0 0 0 0 0 0 0 0 0 0 - 0 - - 0 - - 0 - - 0 - - 0 - - 0 -
Corporates - Of Which: SME 0 0 1 0 1,623 32 0 0 0 0 1,558 31 0 0 0 0 9 13 - 0 - - 0 - - 0 - - 0 - - 0 - - 0 -
Retail 0 0 1,497 170 0 0 0 0 327 0 0 0 0 0 12 82 0 0 1.08% 111 36.94% 1.02% 127 32.38% 0.94% 140 30.01% 2.37% 130 31.56% 2.40% 162 27.23% 2.00% 185 25.60%
Retail - Secured on real estate property 0.0% 0 0 0 0 0 0 0 0 0 0 0 0 0 0 0 0 0 0 - 0 - - 0 - - 0 - - 0 - - 0 - - 0 -
Retail - Secured on real estate property - Of
Which: SME0.0% 0 0 0 0 0 0 0 0 0 0 0 0 0 0 0 0 0 0 - 0 - - 0 - - 0 - - 0 - - 0 - - 0 -
Retail - Secured on real estate property - Of
Which: non-SME0.0% 0 0 0 0 0 0 0 0 0 0 0 0 0 0 0 0 0 0 - 0 - - 0 - - 0 - - 0 - - 0 - - 0 -
Retail - Qualifying Revolving 0 0 0 0 0 0 0 0 0 0 0 0 0 0 0 0 0 0 - 0 - - 0 - - 0 - - 0 - - 0 - - 0 -
Retail - Other Retail 0 0 1,497 170 0 0 0 0 327 0 0 0 0 0 12 82 0 0 1.08% 111 36.94% 1.02% 127 32.38% 0.94% 140 30.01% 2.37% 130 31.56% 2.40% 162 27.23% 2.00% 185 25.60%
Retail - Other Retail - Of Which: SME 0 0 1,497 170 0 0 0 0 327 0 0 0 0 0 12 82 0 0 1.08% 111 36.94% 1.02% 127 32.38% 0.94% 140 30.01% 2.37% 130 31.56% 2.40% 162 27.23% 2.00% 185 25.60%
Retail - Other Retail - Of Which: non-SME 0 0 0 0 0 0 0 0 0 0 0 0 0 0 0 0 0 0 - 0 - - 0 - - 0 - - 0 - - 0 - - 0 -
Equity 0 0 0 0 0 0 0 0 0 0 0 0 0 0 0 0 0 0 0.00% 0 - 0.00% 0 - 0.00% 0 - 0.00% 0 - 0.00% 0 - 0.00% 0 -
Securitisation 265 0 0 0 0 0 37 0 0 0 0 0 0 0 0 0 0 0
Other non-credit obligation assets 0 0 0 0 0 0 0 0 0 0 0 0 0 0 0 0 0 0
TOTAL 265 0 4,993 206 1,624 32 37 0 2,131 0 1,559 31 0 0 14 103 9 13 0.46% 170 34.79% 0.43% 196 29.97% 0.39% 220 27.25% 0.85% 193 30.97% 1.04% 261 27.37% 0.85% 312 26.03%
Securitisation and re-securitisations positions deducted from capital * 0 0 0 0 0 0 0 0 0 0 0 0
(mln EUR, %)Non-defaulted Defaulted Non-defaulted Defaulted Non-defaulted Defaulted Non-defaulted Defaulted Non-defaulted Defaulted Non-defaulted Defaulted Non-defaulted Defaulted Non-defaulted Defaulted Non-defaulted Defaulted
Impairment
rate
Stock of
Provisions
Coverage Ratio -
Default Stock
Impairment
rate
Stock of
Provisions
Coverage
Ratio - Default
Stock
Impairment
rate
Stock of
Provisions
Coverage
Ratio - Default
Stock
Impairment rateStock of
Provisions
Coverage
Ratio - Default
Stock
Impairment
rate
Stock of
Provisions
Coverage
Ratio - Default
Stock
Impairment
rate
Stock of
Provisions
Coverage
Ratio - Default
Stock
Central banks and central governments 0 0 70 0 9 0 0 0 49 0 5 0 0 0 0 0 0 0 0.34% 0 46.51% 0.29% 1 46.51% 0.28% 1 46.51% 0.47% 0 46.51% 0.47% 1 46.51% 0.43% 1 46.51%
Institutions 0 0 107 0 194 0 0 0 112 0 4 0 0 0 0 0 0 0 0.24% 1 61.66% 0.21% 1 60.94% 0.20% 2 60.45% 0.35% 1 63.19% 0.35% 2 62.59% 0.33% 3 61.84%
Corporates 0 0 1,521 53 651 782 0 0 636 0 698 1,172 0 0 0 24 8 1,710 4.71% 1,966 70.60% 3.77% 2,043 69.35% 2.96% 2,101 68.58% 5.57% 2,068 73.43% 5.25% 2,281 75.57% 4.15% 2,399 75.94%
Corporates - Of Which: Specialised Lending 0 0 0 26 0 0 0 0 0 0 0 0 0 0 0 13 0 0 - 0 - - 0 - - 0 - - 0 - - 0 - - 0 -
Corporates - Of Which: SME 0 0 0 0 484 768 0 0 0 0 530 1,153 0 0 0 0 8 1,696 - 0 - - 0 - - 0 - - 0 - - 0 - - 0 -
Retail 0 0 42 1 1,074 386 0 0 9 0 649 371 0 0 0 0 48 262 1.15% 324 34.39% 0.56% 329 30.06% 0.21% 331 26.77% 2.13% 412 44.36% 2.60% 459 41.43% 2.69% 481 37.58%
Retail - Secured on real estate property 0.0% 0 0 0 0 570 154 0 0 0 0 370 175 0 0 0 0 25 93 0.36% 120 30.90% 0.00% 120 26.12% 0.00% 120 22.78% 1.17% 168 45.42% 1.51% 188 42.04% 1.53% 195 36.99%
Retail - Secured on real estate property - Of
Which: SME0.0% 0 0 0 0 0 0 0 0 0 0 0 0 0 0 0 0 0 0 - 0 - - 0 - - 0 - - 0 - - 0 - - 0 -
Retail - Secured on real estate property - Of
Which: non-SME0.0% 0 0 0 0 570 154 0 0 0 0 370 175 0 0 0 0 25 93 0.36% 120 30.90% 0.00% 120 26.12% 0.00% 120 22.78% 1.17% 168 45.42% 1.51% 188 42.04% 1.53% 195 36.99%
Retail - Qualifying Revolving 0 0 0 0 0 0 0 0 0 0 0 0 0 0 0 0 0 0 - 0 - - 0 - - 0 - - 0 - - 0 - - 0 -
Retail - Other Retail 0 0 42 1 503 233 0 0 9 0 279 197 0 0 0 0 23 169 1.98% 203 36.57% 1.19% 209 32.57% 0.47% 211 29.37% 3.14% 244 43.70% 3.84% 271 41.03% 4.12% 286 37.96%
Retail - Other Retail - Of Which: SME 0 0 42 1 497 225 0 0 9 0 274 187 0 0 0 0 23 162 1.98% 196 36.31% 1.19% 202 32.28% 0.47% 204 29.07% 3.13% 235 43.39% 3.83% 262 40.68% 4.12% 277 37.61%
Retail - Other Retail - Of Which: non-SME 0 0 0 0 7 8 0 0 0 0 5 9 0 0 0 0 0 7 2.07% 7 44.19% 1.02% 7 41.95% 0.00% 7 39.93% 3.54% 9 52.96% 4.44% 9 52.61% 4.85% 9 50.50%
Equity 0 0 0 0 0 0 0 0 0 0 0 0 0 0 0 0 0 0 0.00% 0 - 0.00% 0 - 0.00% 0 - 0.00% 0 - 0.00% 0 - 0.00% 0 -
Securitisation 668 0 0 0 0 0 1,250 0 0 0 0 0 0 0 0 0 0 0
Other non-credit obligation assets 0 0 0 0 0 0 0 0 0 0 0 0 0 0 0 0 0 0
TOTAL 668 0 1,740 54 1,927 1,169 1,250 0 806 0 1,356 1,543 0 0 0 24 56 1,972 3.17% 2,291 62.48% 2.42% 2,373 59.85% 1.85% 2,435 57.82% 4.00% 2,482 66.84% 3.94% 2,743 67.09% 3.29% 2,884 65.64%
Securitisation and re-securitisations positions deducted from capital * 155 0 0 0 0 0 88 0 0 0 0 0
LTV % (as of
31/12/2013)
Exposure values (as of 31/12/2013) Risk exposure amounts (as of 31/12/2013) Value adjustments and provisions (as of 31/12/2013) Baseline Scenario Adverse Scenario
F-IRB A-IRB STA F-IRB A-IRB STA as of 31/12/2016 as of 31/12/2014 as of 31/12/2015 as of 31/12/2016F-IRB A-IRB STA as of 31/12/2014 as of 31/12/2015
LTV % (as of
31/12/2013)
Exposure values (as of 31/12/2013) Risk exposure amounts (as of 31/12/2013) Value adjustments and provisions (as of 31/12/2013) Baseline Scenario Adverse Scenario
F-IRB A-IRB STA F-IRB A-IRB STA F-IRB as of 31/12/2014 as of 31/12/2015 as of 31/12/2016A-IRB STA as of 31/12/2014 as of 31/12/2015 as of 31/12/2016
LTV % (as of
31/12/2013)
Exposure values (as of 31/12/2013) Risk exposure amounts (as of 31/12/2013) Value adjustments and provisions (as of 31/12/2013) Baseline Scenario Adverse Scenario
F-IRB A-IRB STA F-IRB A-IRB STA F-IRB A-IRB as of 31/12/2015 as of 31/12/2016STA as of 31/12/2014 as of 31/12/2015 as of 31/12/2016 as of 31/12/2014
Adverse Scenario
F-IRB A-IRB STA F-IRB A-IRB STA F-IRB A-IRB STA as of 31/12/2014 as of 31/12/2015 as of 31/12/2016 as of 31/12/2014 as of 31/12/2015 as of 31/12/2016LTV % (as of
31/12/2013)
Exposure values (as of 31/12/2013) Risk exposure amounts (as of 31/12/2013) Value adjustments and provisions (as of 31/12/2013)
Adverse Scenario
F-IRB A-IRB STA F-IRB A-IRB STA F-IRB A-IRB STA as of 31/12/2014 as of 31/12/2015 as of 31/12/2016 as of 31/12/2014 as of 31/12/2015 as of 31/12/2016LTV % (as of
31/12/2013)
Exposure values (as of 31/12/2013) Risk exposure amounts (as of 31/12/2013)
Baseline Scenario
Value adjustments and provisions (as of 31/12/2013) Baseline Scenario
(*) Refers to the part of Securitization exposure that is deducted from capital and is not included in RWA
(*) Refers to the part of Securitization exposure that is deducted from capital and is not included in RWA
(*) Refers to the part of Securitization exposure that is deducted from capital and is not included in RWA
(*) Refers to the part of Securitization exposure that is deducted from capital and is not included in RWA
(*) Refers to the part of Securitization exposure that is deducted from capital and is not included in RWA
Germany
France
New Zealand
Ireland
Brazil
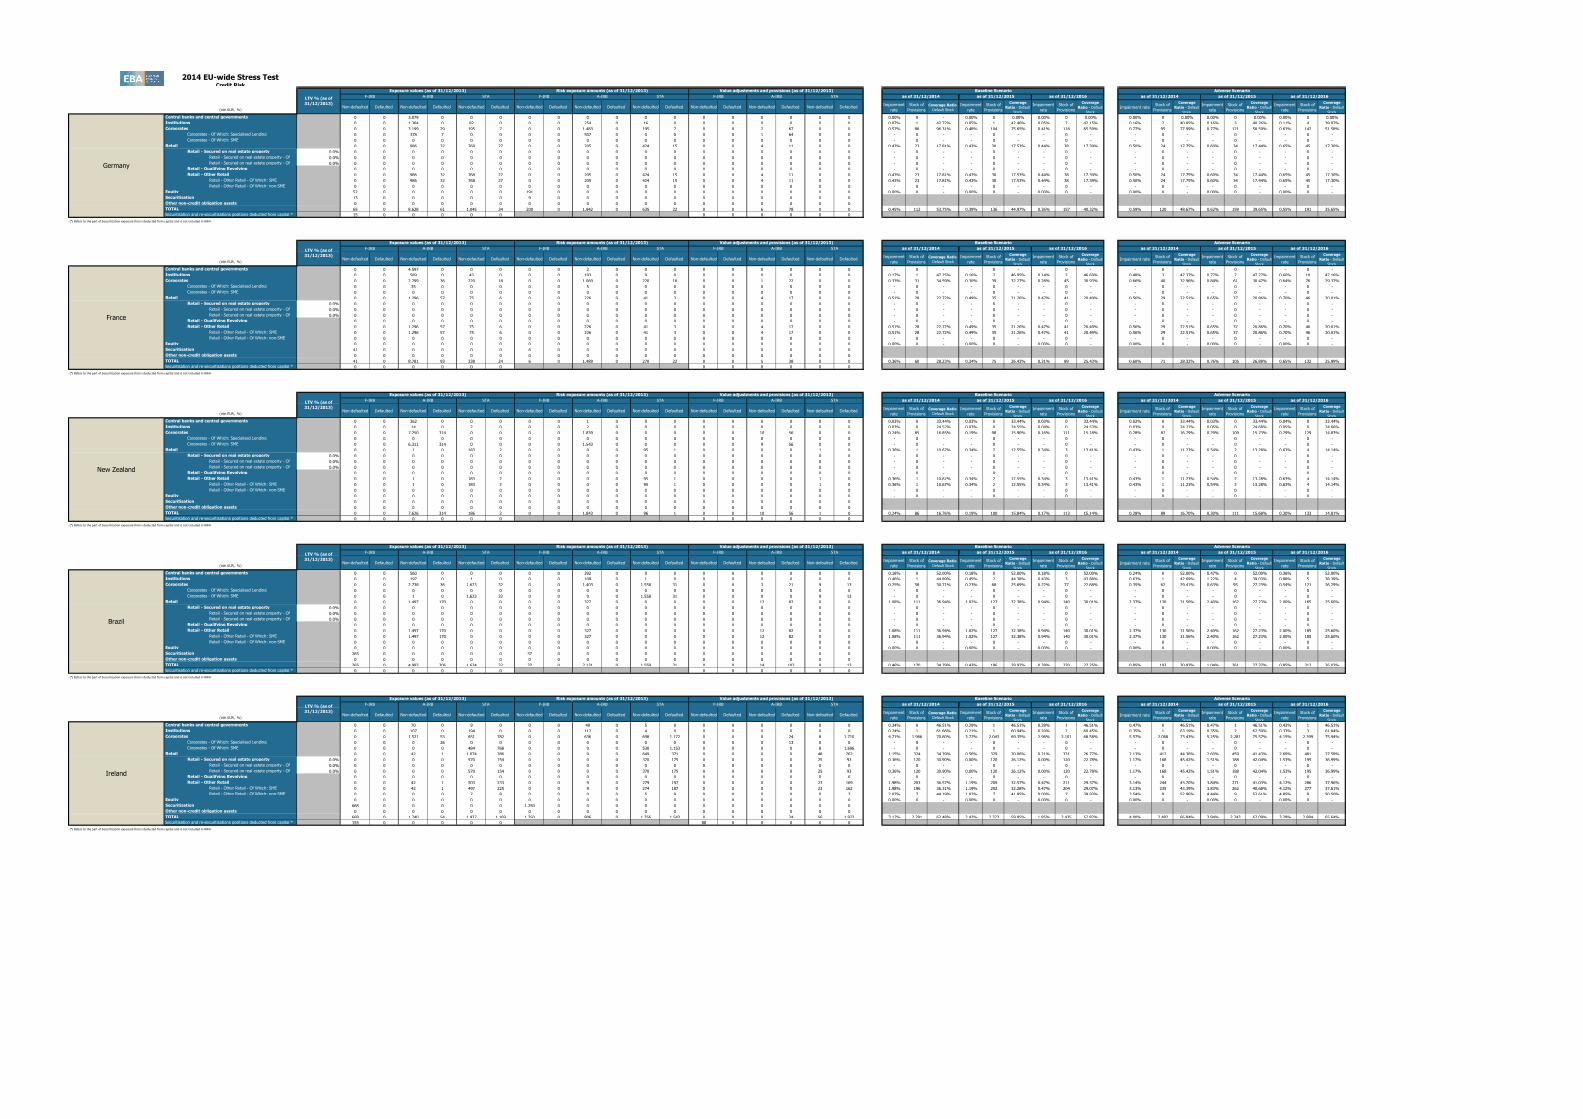
2014 EU-wide Stress Test P&L
(mln EUR) 31/12/2014 31/12/2015 31/12/2016 31/12/2014 31/12/2015 31/12/2016
Net interest income 9,093 9,093 9,093 9,093 8,283 8,324 8,596
Net trading income -438 -154 -12 -591 -245 -73
of which trading losses from stress scenarios -711 -427 -284 -863 -518 -345
Other operating income -161 1,003 953 964 892 948 954
Operating profit before impairments 2,602 3,075 3,309 3,462 1,986 2,427 2,878
Impairment of financial assets (-) -4,257 -1,865 -1,404 -1,179 -3,318 -3,098 -2,925
Impairment of financial assets other than instruments designated at fair value
through P&L (-)-4,369 -1,865 -1,404 -1,179 -3,318 -3,098 -2,925
Impairment Financial assets designated at fair value through P&L (-) 112 0 0 0 0 0 0
Impairment on non financial assets (-) -187 18 109 172 -208 -172 -79
Operating profit after impairments from stress scenarios -1,842 1,227 2,014 2,455 -1,540 -842 -125
Other Income and expenses 1,830 165 165 165 165 165 165
Pre-Tax profit -13 1,392 2,179 2,619 -1,375 -678 39
Tax 455 -418 -654 -786 413 203 -12
Net income 442 975 1,525 1,833 -963 -474 28
Attributable to owners of the parent 391 923 1,473 1,782 -1,014 -526 -24
of which carried over to capital through retained earnings -640 -68 399 712 -1,453 -915 -408
of which distributed as dividends 1,030 991 1,075 1,070 438 389 384
In the figures above, the original (official published) 2013 P&L figures may have been adjusted as part of the ECB Comprehensive Assessment join-up calculation.
31/12/2013
Baseline Scenario Adverse Scenario
2014 EU-wide Stress Test
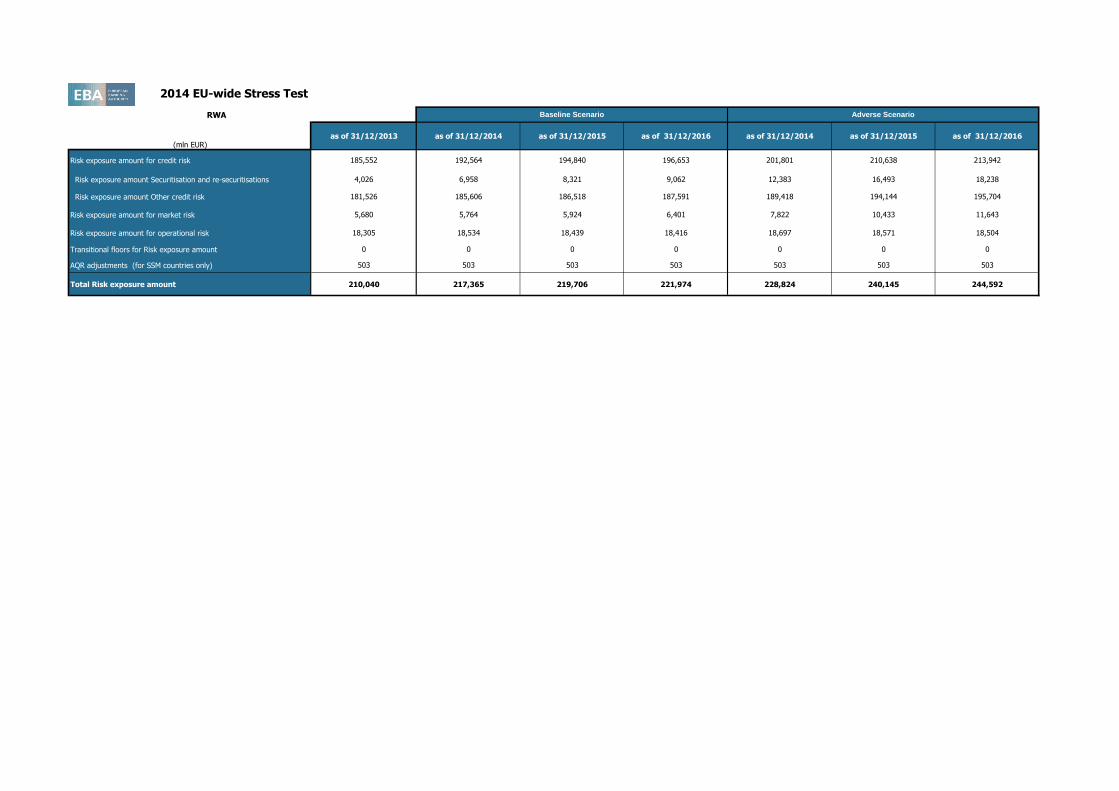
RWA
(mln EUR)as of 31/12/2013 as of 31/12/2014 as of 31/12/2015 as of 31/12/2016 as of 31/12/2014 as of 31/12/2015 as of 31/12/2016
Risk exposure amount for credit risk 185,552 192,564 194,840 196,653 201,801 210,638 213,942
Risk exposure amount Securitisation and re-securitisations 4,026 6,958 8,321 9,062 12,383 16,493 18,238
Risk exposure amount Other credit risk 181,526 185,606 186,518 187,591 189,418 194,144 195,704
Risk exposure amount for market risk 5,680 5,764 5,924 6,401 7,822 10,433 11,643
Risk exposure amount for operational risk 18,305 18,534 18,439 18,416 18,697 18,571 18,504
Transitional floors for Risk exposure amount 0 0 0 0 0 0 0
AQR adjustments (for SSM countries only) 503 503 503 503 503 503 503
Total Risk exposure amount 210,040 217,365 219,706 221,974 228,824 240,145 244,592
Baseline Scenario Adverse Scenario
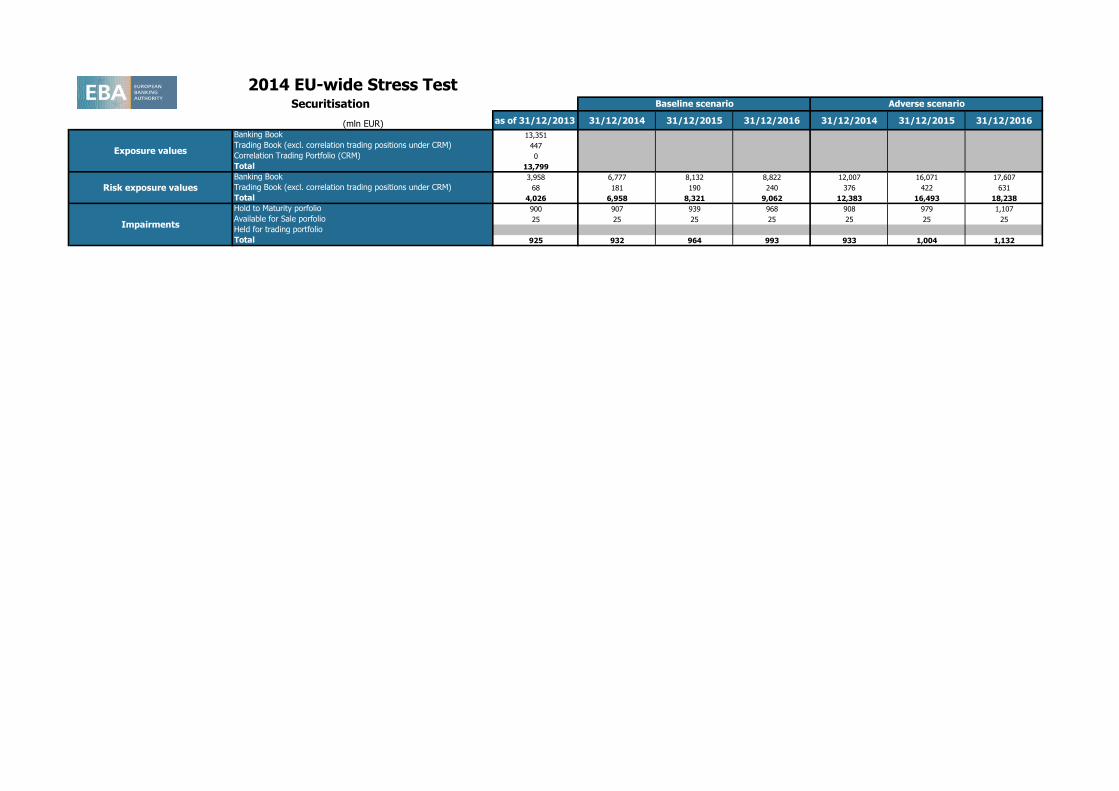
(mln EUR) as of 31/12/2013 31/12/2014 31/12/2015 31/12/2016 31/12/2014 31/12/2015 31/12/2016
Banking Book 13,351
Trading Book (excl. correlation trading positions under CRM) 447
Correlation Trading Portfolio (CRM) 0
Total 13,799
Banking Book 3,958 6,777 8,132 8,822 12,007 16,071 17,607
Trading Book (excl. correlation trading positions under CRM) 68 181 190 240 376 422 631
Total 4,026 6,958 8,321 9,062 12,383 16,493 18,238
Hold to Maturity porfolio 900 907 939 968 908 979 1,107
Available for Sale porfolio 25 25 25 25 25 25 25
Held for trading portfolio
Total 925 932 964 993 933 1,004 1,132
2014 EU-wide Stress Test
Impairments
Baseline scenario Adverse scenario
Exposure values
Risk exposure values
Securitisation
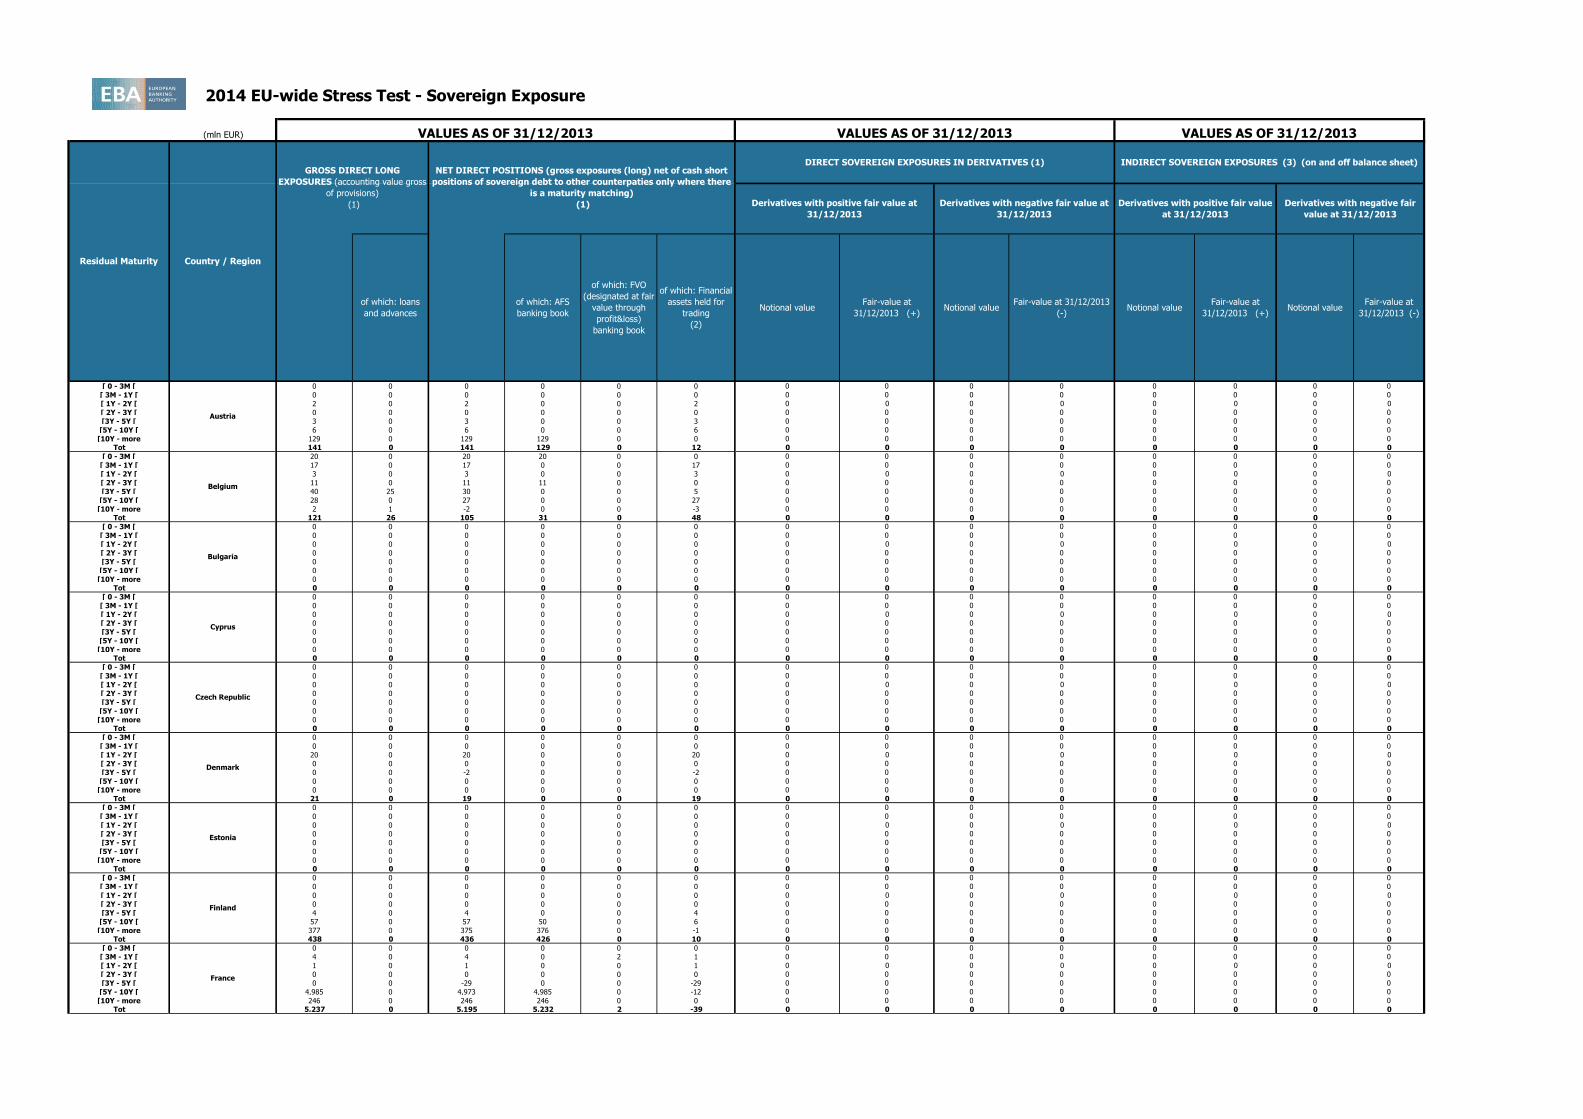
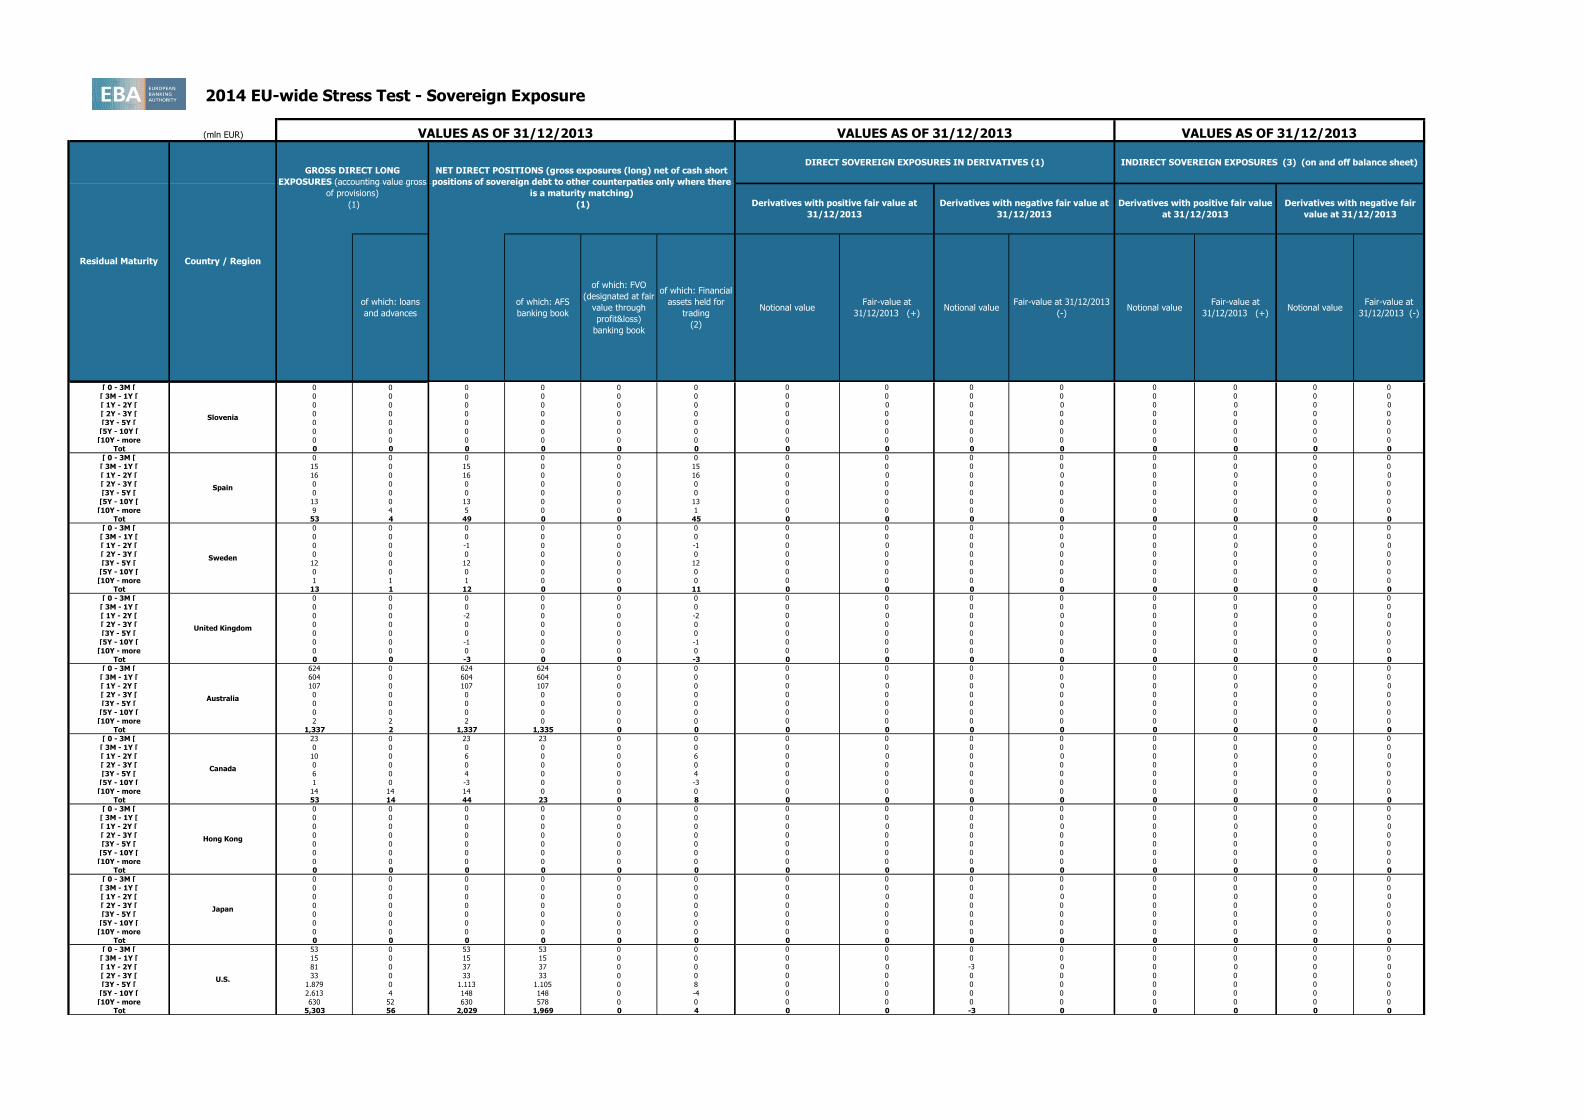
2014 EU-wide Stress Test - Sovereign Exposure
(mln EUR)
[ 0 - 3M [ 0 0 0 0 0 0 0 0 0 0 0 0 0 0
[ 3M - 1Y [ 0 0 0 0 0 0 0 0 0 0 0 0 0 0
[ 1Y - 2Y [ 2 0 2 0 0 2 0 0 0 0 0 0 0 0
[ 2Y - 3Y [ 0 0 0 0 0 0 0 0 0 0 0 0 0 0
[3Y - 5Y [ 3 0 3 0 0 3 0 0 0 0 0 0 0 0
[5Y - 10Y [ 6 0 6 0 0 6 0 0 0 0 0 0 0 0
[10Y - more 129 0 129 129 0 0 0 0 0 0 0 0 0 0
Tot 141 0 141 129 0 12 0 0 0 0 0 0 0 0
[ 0 - 3M [ 20 0 20 20 0 0 0 0 0 0 0 0 0 0
[ 3M - 1Y [ 17 0 17 0 0 17 0 0 0 0 0 0 0 0
[ 1Y - 2Y [ 3 0 3 0 0 3 0 0 0 0 0 0 0 0
[ 2Y - 3Y [ 11 0 11 11 0 0 0 0 0 0 0 0 0 0
[3Y - 5Y [ 40 25 30 0 0 5 0 0 0 0 0 0 0 0
[5Y - 10Y [ 28 0 27 0 0 27 0 0 0 0 0 0 0 0
[10Y - more 2 1 -2 0 0 -3 0 0 0 0 0 0 0 0
Tot 121 26 105 31 0 48 0 0 0 0 0 0 0 0
[ 0 - 3M [ 0 0 0 0 0 0 0 0 0 0 0 0 0 0
[ 3M - 1Y [ 0 0 0 0 0 0 0 0 0 0 0 0 0 0
[ 1Y - 2Y [ 0 0 0 0 0 0 0 0 0 0 0 0 0 0
[ 2Y - 3Y [ 0 0 0 0 0 0 0 0 0 0 0 0 0 0
[3Y - 5Y [ 0 0 0 0 0 0 0 0 0 0 0 0 0 0
[5Y - 10Y [ 0 0 0 0 0 0 0 0 0 0 0 0 0 0
[10Y - more 0 0 0 0 0 0 0 0 0 0 0 0 0 0
Tot 0 0 0 0 0 0 0 0 0 0 0 0 0 0
[ 0 - 3M [ 0 0 0 0 0 0 0 0 0 0 0 0 0 0
[ 3M - 1Y [ 0 0 0 0 0 0 0 0 0 0 0 0 0 0
[ 1Y - 2Y [ 20 0 20 0 0 20 0 0 0 0 0 0 0 0
[ 2Y - 3Y [ 0 0 0 0 0 0 0 0 0 0 0 0 0 0
[3Y - 5Y [ 0 0 -2 0 0 -2 0 0 0 0 0 0 0 0
[5Y - 10Y [ 0 0 0 0 0 0 0 0 0 0 0 0 0 0
[10Y - more 0 0 0 0 0 0 0 0 0 0 0 0 0 0
Tot 21 0 19 0 0 19 0 0 0 0 0 0 0 0
[ 0 - 3M [ 0 0 0 0 0 0 0 0 0 0 0 0 0 0
[ 3M - 1Y [ 0 0 0 0 0 0 0 0 0 0 0 0 0 0
[ 1Y - 2Y [ 0 0 0 0 0 0 0 0 0 0 0 0 0 0
[ 2Y - 3Y [ 0 0 0 0 0 0 0 0 0 0 0 0 0 0
[3Y - 5Y [ 0 0 0 0 0 0 0 0 0 0 0 0 0 0
[5Y - 10Y [ 0 0 0 0 0 0 0 0 0 0 0 0 0 0
[10Y - more 0 0 0 0 0 0 0 0 0 0 0 0 0 0
Tot 0 0 0 0 0 0 0 0 0 0 0 0 0 0
[ 0 - 3M [ 0 0 0 0 0 0 0 0 0 0 0 0 0 0
[ 3M - 1Y [ 0 0 0 0 0 0 0 0 0 0 0 0 0 0
[ 1Y - 2Y [ 0 0 0 0 0 0 0 0 0 0 0 0 0 0
[ 2Y - 3Y [ 0 0 0 0 0 0 0 0 0 0 0 0 0 0
[3Y - 5Y [ 4 0 4 0 0 4 0 0 0 0 0 0 0 0
[5Y - 10Y [ 57 0 57 50 0 6 0 0 0 0 0 0 0 0
[10Y - more 377 0 375 376 0 -1 0 0 0 0 0 0 0 0
Tot 438 0 436 426 0 10 0 0 0 0 0 0 0 0
[ 0 - 3M [ 0 0 0 0 0 0 0 0 0 0 0 0 0 0
[ 3M - 1Y [ 4 0 4 0 2 1 0 0 0 0 0 0 0 0
[ 1Y - 2Y [ 1 0 1 0 0 1 0 0 0 0 0 0 0 0
[ 2Y - 3Y [ 0 0 0 0 0 0 0 0 0 0 0 0 0 0
[3Y - 5Y [ 0 0 -29 0 0 -29 0 0 0 0 0 0 0 0
[5Y - 10Y [ 4,985 0 4,973 4,985 0 -12 0 0 0 0 0 0 0 0
[10Y - more 246 0 246 246 0 0 0 0 0 0 0 0 0 0
Tot 5,237 0 5,195 5,232 2 -39 0 0 0 0 0 0 0 0
Residual Maturity Country / Region
GROSS DIRECT LONG
EXPOSURES (accounting value gross
of provisions)
(1)
NET DIRECT POSITIONS (gross exposures (long) net of cash short
positions of sovereign debt to other counterpaties only where there
is a maturity matching)
(1)
DIRECT SOVEREIGN EXPOSURES IN DERIVATIVES (1)
of which: loans
and advances
of which: AFS
banking book
of which: FVO
(designated at fair
value through
profit&loss)
banking book
of which: Financial
assets held for
trading
(2)
Derivatives with positive fair value at
31/12/2013
Derivatives with negative fair value at
31/12/2013
Derivatives with positive fair value
at 31/12/2013
Derivatives with negative fair
value at 31/12/2013
VALUES AS OF 31/12/2013 VALUES AS OF 31/12/2013 VALUES AS OF 31/12/2013
INDIRECT SOVEREIGN EXPOSURES (3) (on and off balance sheet)
Fair-value at
31/12/2013 (+)Notional value
Fair-value at
31/12/2013 (-)Notional value
Fair-value at
31/12/2013 (+)Notional value
Fair-value at 31/12/2013
(-)
Austria
Belgium
Bulgaria
Cyprus
Notional value
Czech Republic
Denmark
Estonia
Finland
France

2014 EU-wide Stress Test - Sovereign Exposure
(mln EUR)
Residual Maturity Country / Region
GROSS DIRECT LONG
EXPOSURES (accounting value gross
of provisions)
(1)
NET DIRECT POSITIONS (gross exposures (long) net of cash short
positions of sovereign debt to other counterpaties only where there
is a maturity matching)
(1)
DIRECT SOVEREIGN EXPOSURES IN DERIVATIVES (1)
of which: loans
and advances
of which: AFS
banking book
of which: FVO
(designated at fair
value through
profit&loss)
banking book
of which: Financial
assets held for
trading
(2)
Derivatives with positive fair value at
31/12/2013
Derivatives with negative fair value at
31/12/2013
Derivatives with positive fair value
at 31/12/2013
Derivatives with negative fair
value at 31/12/2013
VALUES AS OF 31/12/2013 VALUES AS OF 31/12/2013 VALUES AS OF 31/12/2013
INDIRECT SOVEREIGN EXPOSURES (3) (on and off balance sheet)
Fair-value at
31/12/2013 (+)Notional value
Fair-value at
31/12/2013 (-)Notional value
Fair-value at
31/12/2013 (+)Notional value
Fair-value at 31/12/2013
(-)
Austria
Notional value
[ 0 - 3M [ 0 0 0 0 0 0 0 0 0 0 0 0 0 0
[ 3M - 1Y [ 0 0 0 0 0 0 0 0 0 0 0 0 0 0
[ 1Y - 2Y [ 0 0 0 0 0 0 0 0 0 0 0 0 0 0
[ 2Y - 3Y [ 0 0 0 0 0 0 0 0 0 0 0 0 0 0
[3Y - 5Y [ 0 0 0 0 0 0 0 0 0 0 0 0 0 0
[5Y - 10Y [ 0 0 0 0 0 0 0 0 0 0 0 0 0 0
[10Y - more 4,406 0 4,406 4,406 0 0 0 0 0 0 0 0 0 0
Tot 4,406 0 4,406 4,406 0 0 0 0 0 0 0 0 0 0
[ 0 - 3M [ 0 0 0 0 0 0 0 0 0 0 0 0 0 0
[ 3M - 1Y [ 0 0 0 0 0 0 0 0 0 0 0 0 0 0
[ 1Y - 2Y [ 0 0 0 0 0 0 0 0 0 0 0 0 0 0
[ 2Y - 3Y [ 0 0 0 0 0 0 0 0 0 0 0 0 0 0
[3Y - 5Y [ 0 0 0 0 0 0 0 0 0 0 0 0 0 0
[5Y - 10Y [ 0 0 0 0 0 0 0 0 0 0 0 0 0 0
[10Y - more 0 0 0 0 0 0 0 0 0 0 0 0 0 0
Tot 0 0 0 0 0 0 0 0 0 0 0 0 0 0
[ 0 - 3M [ 0 0 0 0 0 0 0 0 0 0 0 0 0 0
[ 3M - 1Y [ 0 0 0 0 0 0 0 0 0 0 0 0 0 0
[ 1Y - 2Y [ 0 0 0 0 0 0 0 0 0 0 0 0 0 0
[ 2Y - 3Y [ 0 0 0 0 0 0 0 0 0 0 0 0 0 0
[3Y - 5Y [ 0 0 0 0 0 0 0 0 0 0 0 0 0 0
[5Y - 10Y [ 0 0 0 0 0 0 0 0 0 0 0 0 0 0
[10Y - more 0 0 0 0 0 0 0 0 0 0 0 0 0 0
Tot 0 0 0 0 0 0 0 0 0 0 0 0 0 0
[ 0 - 3M [ 0 0 0 0 0 0 0 0 0 0 0 0 0 0
[ 3M - 1Y [ 0 0 0 0 0 0 0 0 0 0 0 0 0 0
[ 1Y - 2Y [ 11 5 11 6 0 0 0 0 0 0 0 0 0 0
[ 2Y - 3Y [ 0 0 0 0 0 0 0 0 0 0 0 0 0 0
[3Y - 5Y [ 0 0 0 0 0 0 0 0 0 0 0 0 0 0
[5Y - 10Y [ 0 0 0 0 0 0 0 0 0 0 0 0 0 0
[10Y - more 0 0 0 0 0 0 0 0 0 0 0 0 0 0
Tot 12 5 12 6 0 0 0 0 0 0 0 0 0 0
[ 0 - 3M [ 0 0 0 0 0 0 0 0 0 0 0 0 0 0
[ 3M - 1Y [ 61 0 61 10 51 0 0 0 0 0 0 0 0 0
[ 1Y - 2Y [ 13 0 13 0 12 1 0 0 0 0 0 0 0 0
[ 2Y - 3Y [ 0 0 0 0 0 0 0 0 0 0 0 0 0 0
[3Y - 5Y [ 14 0 14 14 0 0 0 0 0 0 0 0 0 0
[5Y - 10Y [ 35 0 35 35 0 0 0 0 0 0 0 0 0 0
[10Y - more 0 0 0 0 0 0 0 0 0 0 0 0 0 0
Tot 124 0 124 59 63 1 0 0 0 0 0 0 0 0
[ 0 - 3M [ 0 0 0 0 0 0 0 0 0 0 0 0 0 0
[ 3M - 1Y [ 0 0 0 0 0 0 0 0 0 0 0 0 0 0
[ 1Y - 2Y [ 0 0 0 0 0 0 0 0 0 0 0 0 0 0
[ 2Y - 3Y [ 0 0 0 0 0 0 0 0 0 0 0 0 0 0
[3Y - 5Y [ 0 0 0 0 0 0 0 0 0 0 0 0 0 0
[5Y - 10Y [ 0 0 0 0 0 0 0 0 0 0 0 0 0 0
[10Y - more 0 0 0 0 0 0 0 0 0 0 0 0 0 0
Tot 0 0 0 0 0 0 0 0 0 0 0 0 0 0
[ 0 - 3M [ 0 0 0 0 0 0 0 0 0 0 0 0 0 0
[ 3M - 1Y [ 0 0 0 0 0 0 0 0 0 0 0 0 0 0
[ 1Y - 2Y [ 0 0 0 0 0 0 0 0 0 0 0 0 0 0
[ 2Y - 3Y [ 0 0 0 0 0 0 0 0 0 0 0 0 0 0
[3Y - 5Y [ 0 0 0 0 0 0 0 0 0 0 0 0 0 0
[5Y - 10Y [ 0 0 0 0 0 0 0 0 0 0 0 0 0 0
[10Y - more 0 0 0 0 0 0 0 0 0 0 0 0 0 0
Tot 0 0 0 0 0 0 0 0 0 0 0 0 0 0
Latvia
Germany
Greece
Hungary
Iceland
Ireland
Italy
Croatia
Liechtenstein
2014 EU-wide Stress Test - Sovereign Exposure
(mln EUR)
Residual Maturity Country / Region
GROSS DIRECT LONG
EXPOSURES (accounting value gross
of provisions)
(1)
NET DIRECT POSITIONS (gross exposures (long) net of cash short
positions of sovereign debt to other counterpaties only where there
is a maturity matching)
(1)
DIRECT SOVEREIGN EXPOSURES IN DERIVATIVES (1)
of which: loans
and advances
of which: AFS
banking book
of which: FVO
(designated at fair
value through
profit&loss)
banking book
of which: Financial
assets held for
trading
(2)
Derivatives with positive fair value at
31/12/2013
Derivatives with negative fair value at
31/12/2013
Derivatives with positive fair value
at 31/12/2013
Derivatives with negative fair
value at 31/12/2013
VALUES AS OF 31/12/2013 VALUES AS OF 31/12/2013 VALUES AS OF 31/12/2013
INDIRECT SOVEREIGN EXPOSURES (3) (on and off balance sheet)
Fair-value at
31/12/2013 (+)Notional value
Fair-value at
31/12/2013 (-)Notional value
Fair-value at
31/12/2013 (+)Notional value
Fair-value at 31/12/2013
(-)
Austria
Notional value
[ 0 - 3M [ 0 0 0 0 0 0 0 0 0 0 0 0 0 0
[ 3M - 1Y [ 0 0 0 0 0 0 0 0 0 0 0 0 0 0
[ 1Y - 2Y [ 0 0 0 0 0 0 0 0 0 0 0 0 0 0
[ 2Y - 3Y [ 0 0 0 0 0 0 0 0 0 0 0 0 0 0
[3Y - 5Y [ 0 0 0 0 0 0 0 0 0 0 0 0 0 0
[5Y - 10Y [ 0 0 0 0 0 0 0 0 0 0 0 0 0 0
[10Y - more 0 0 0 0 0 0 0 0 0 0 0 0 0 0
Tot 0 0 0 0 0 0 0 0 0 0 0 0 0 0
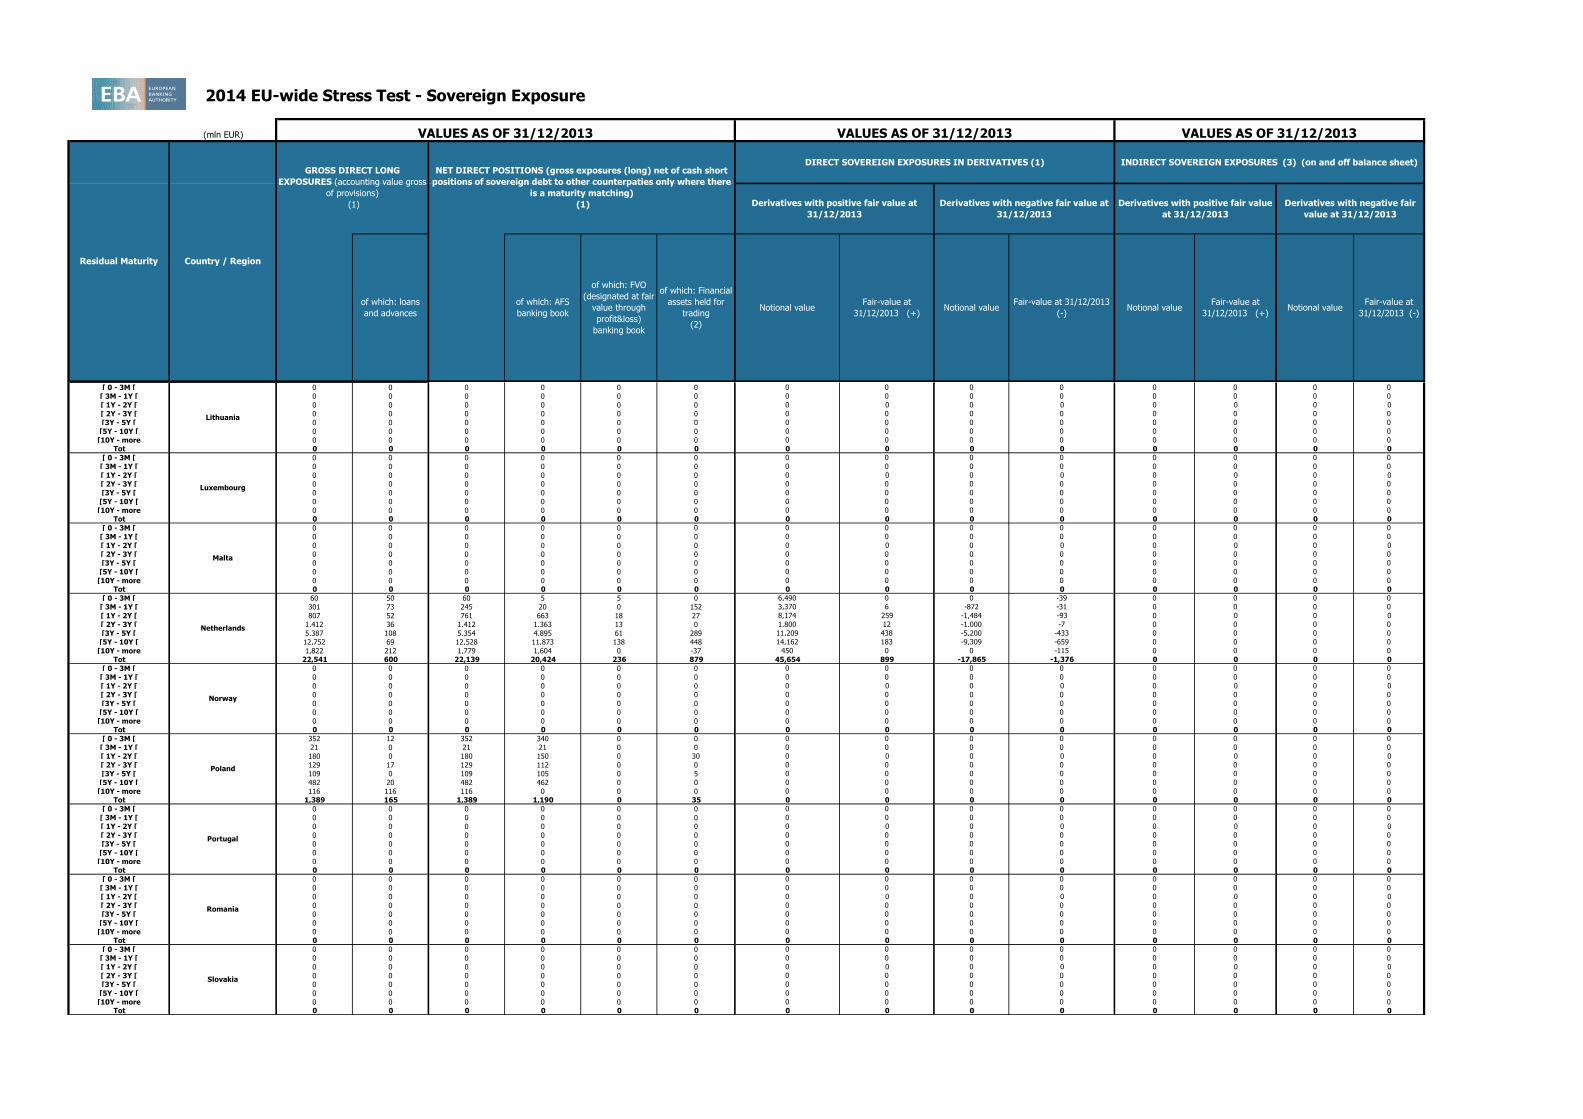
[ 0 - 3M [ 60 50 60 5 5 0 6,490 0 0 -39 0 0 0 0
[ 3M - 1Y [ 301 73 245 20 0 152 3,370 6 -872 -31 0 0 0 0
[ 1Y - 2Y [ 807 52 761 663 18 27 8,174 259 -1,484 -93 0 0 0 0
[ 2Y - 3Y [ 1,412 36 1,412 1,363 13 0 1,800 12 -1,000 -7 0 0 0 0
[3Y - 5Y [ 5,387 108 5,354 4,895 61 289 11,209 438 -5,200 -433 0 0 0 0
[5Y - 10Y [ 12,752 69 12,528 11,873 138 448 14,162 183 -9,309 -659 0 0 0 0
[10Y - more 1,822 212 1,779 1,604 0 -37 450 0 0 -115 0 0 0 0
Tot 22,541 600 22,139 20,424 236 879 45,654 899 -17,865 -1,376 0 0 0 0
[ 0 - 3M [ 0 0 0 0 0 0 0 0 0 0 0 0 0 0
[ 3M - 1Y [ 0 0 0 0 0 0 0 0 0 0 0 0 0 0
[ 1Y - 2Y [ 0 0 0 0 0 0 0 0 0 0 0 0 0 0
[ 2Y - 3Y [ 0 0 0 0 0 0 0 0 0 0 0 0 0 0
[3Y - 5Y [ 0 0 0 0 0 0 0 0 0 0 0 0 0 0
[5Y - 10Y [ 0 0 0 0 0 0 0 0 0 0 0 0 0 0
[10Y - more 0 0 0 0 0 0 0 0 0 0 0 0 0 0
Tot 0 0 0 0 0 0 0 0 0 0 0 0 0 0
[ 0 - 3M [ 352 12 352 340 0 0 0 0 0 0 0 0 0 0
[ 3M - 1Y [ 21 0 21 21 0 0 0 0 0 0 0 0 0 0
[ 1Y - 2Y [ 180 0 180 150 0 30 0 0 0 0 0 0 0 0
[ 2Y - 3Y [ 129 17 129 112 0 0 0 0 0 0 0 0 0 0
[3Y - 5Y [ 109 0 109 105 0 5 0 0 0 0 0 0 0 0
[5Y - 10Y [ 482 20 482 462 0 0 0 0 0 0 0 0 0 0
[10Y - more 116 116 116 0 0 0 0 0 0 0 0 0 0 0
Tot 1,389 165 1,389 1,190 0 35 0 0 0 0 0 0 0 0
[ 0 - 3M [ 0 0 0 0 0 0 0 0 0 0 0 0 0 0
[ 3M - 1Y [ 0 0 0 0 0 0 0 0 0 0 0 0 0 0
[ 1Y - 2Y [ 0 0 0 0 0 0 0 0 0 0 0 0 0 0
[ 2Y - 3Y [ 0 0 0 0 0 0 0 0 0 0 0 0 0 0
[3Y - 5Y [ 0 0 0 0 0 0 0 0 0 0 0 0 0 0
[5Y - 10Y [ 0 0 0 0 0 0 0 0 0 0 0 0 0 0
[10Y - more 0 0 0 0 0 0 0 0 0 0 0 0 0 0
Tot 0 0 0 0 0 0 0 0 0 0 0 0 0 0
Lithuania
Luxembourg
Malta
Netherlands
Norway
Poland
Portugal
Romania
Slovakia
2014 EU-wide Stress Test - Sovereign Exposure
(mln EUR)
Residual Maturity Country / Region
GROSS DIRECT LONG
EXPOSURES (accounting value gross
of provisions)
(1)
NET DIRECT POSITIONS (gross exposures (long) net of cash short
positions of sovereign debt to other counterpaties only where there
is a maturity matching)
(1)
DIRECT SOVEREIGN EXPOSURES IN DERIVATIVES (1)
of which: loans
and advances
of which: AFS
banking book
of which: FVO
(designated at fair
value through
profit&loss)
banking book
of which: Financial
assets held for
trading
(2)
Derivatives with positive fair value at
31/12/2013
Derivatives with negative fair value at
31/12/2013
Derivatives with positive fair value
at 31/12/2013
Derivatives with negative fair
value at 31/12/2013
VALUES AS OF 31/12/2013 VALUES AS OF 31/12/2013 VALUES AS OF 31/12/2013
INDIRECT SOVEREIGN EXPOSURES (3) (on and off balance sheet)
Fair-value at
31/12/2013 (+)Notional value
Fair-value at
31/12/2013 (-)Notional value
Fair-value at
31/12/2013 (+)Notional value
Fair-value at 31/12/2013
(-)
Austria
Notional value
[ 0 - 3M [ 0 0 0 0 0 0 0 0 0 0 0 0 0 0
[ 3M - 1Y [ 0 0 0 0 0 0 0 0 0 0 0 0 0 0
[ 1Y - 2Y [ 0 0 0 0 0 0 0 0 0 0 0 0 0 0
[ 2Y - 3Y [ 0 0 0 0 0 0 0 0 0 0 0 0 0 0
[3Y - 5Y [ 0 0 0 0 0 0 0 0 0 0 0 0 0 0
[5Y - 10Y [ 0 0 0 0 0 0 0 0 0 0 0 0 0 0
[10Y - more 0 0 0 0 0 0 0 0 0 0 0 0 0 0
Tot 0 0 0 0 0 0 0 0 0 0 0 0 0 0
[ 0 - 3M [ 0 0 0 0 0 0 0 0 0 0 0 0 0 0
[ 3M - 1Y [ 15 0 15 0 0 15 0 0 0 0 0 0 0 0
[ 1Y - 2Y [ 16 0 16 0 0 16 0 0 0 0 0 0 0 0
[ 2Y - 3Y [ 0 0 0 0 0 0 0 0 0 0 0 0 0 0
[3Y - 5Y [ 0 0 0 0 0 0 0 0 0 0 0 0 0 0
[5Y - 10Y [ 13 0 13 0 0 13 0 0 0 0 0 0 0 0
[10Y - more 9 4 5 0 0 1 0 0 0 0 0 0 0 0
Tot 53 4 49 0 0 45 0 0 0 0 0 0 0 0
[ 0 - 3M [ 0 0 0 0 0 0 0 0 0 0 0 0 0 0
[ 3M - 1Y [ 0 0 0 0 0 0 0 0 0 0 0 0 0 0
[ 1Y - 2Y [ 0 0 -1 0 0 -1 0 0 0 0 0 0 0 0
[ 2Y - 3Y [ 0 0 0 0 0 0 0 0 0 0 0 0 0 0
[3Y - 5Y [ 12 0 12 0 0 12 0 0 0 0 0 0 0 0
[5Y - 10Y [ 0 0 0 0 0 0 0 0 0 0 0 0 0 0
[10Y - more 1 1 1 0 0 0 0 0 0 0 0 0 0 0
Tot 13 1 12 0 0 11 0 0 0 0 0 0 0 0
[ 0 - 3M [ 0 0 0 0 0 0 0 0 0 0 0 0 0 0
[ 3M - 1Y [ 0 0 0 0 0 0 0 0 0 0 0 0 0 0
[ 1Y - 2Y [ 0 0 -2 0 0 -2 0 0 0 0 0 0 0 0
[ 2Y - 3Y [ 0 0 0 0 0 0 0 0 0 0 0 0 0 0
[3Y - 5Y [ 0 0 0 0 0 0 0 0 0 0 0 0 0 0
[5Y - 10Y [ 0 0 -1 0 0 -1 0 0 0 0 0 0 0 0
[10Y - more 0 0 0 0 0 0 0 0 0 0 0 0 0 0
Tot 0 0 -3 0 0 -3 0 0 0 0 0 0 0 0
[ 0 - 3M [ 624 0 624 624 0 0 0 0 0 0 0 0 0 0
[ 3M - 1Y [ 604 0 604 604 0 0 0 0 0 0 0 0 0 0
[ 1Y - 2Y [ 107 0 107 107 0 0 0 0 0 0 0 0 0 0
[ 2Y - 3Y [ 0 0 0 0 0 0 0 0 0 0 0 0 0 0
[3Y - 5Y [ 0 0 0 0 0 0 0 0 0 0 0 0 0 0
[5Y - 10Y [ 0 0 0 0 0 0 0 0 0 0 0 0 0 0
[10Y - more 2 2 2 0 0 0 0 0 0 0 0 0 0 0
Tot 1,337 2 1,337 1,335 0 0 0 0 0 0 0 0 0 0
[ 0 - 3M [ 23 0 23 23 0 0 0 0 0 0 0 0 0 0
[ 3M - 1Y [ 0 0 0 0 0 0 0 0 0 0 0 0 0 0
[ 1Y - 2Y [ 10 0 6 0 0 6 0 0 0 0 0 0 0 0
[ 2Y - 3Y [ 0 0 0 0 0 0 0 0 0 0 0 0 0 0
[3Y - 5Y [ 6 0 4 0 0 4 0 0 0 0 0 0 0 0
[5Y - 10Y [ 1 0 -3 0 0 -3 0 0 0 0 0 0 0 0
[10Y - more 14 14 14 0 0 0 0 0 0 0 0 0 0 0
Tot 53 14 44 23 0 8 0 0 0 0 0 0 0 0
[ 0 - 3M [ 0 0 0 0 0 0 0 0 0 0 0 0 0 0
[ 3M - 1Y [ 0 0 0 0 0 0 0 0 0 0 0 0 0 0
[ 1Y - 2Y [ 0 0 0 0 0 0 0 0 0 0 0 0 0 0
[ 2Y - 3Y [ 0 0 0 0 0 0 0 0 0 0 0 0 0 0
[3Y - 5Y [ 0 0 0 0 0 0 0 0 0 0 0 0 0 0
[5Y - 10Y [ 0 0 0 0 0 0 0 0 0 0 0 0 0 0
[10Y - more 0 0 0 0 0 0 0 0 0 0 0 0 0 0
Tot 0 0 0 0 0 0 0 0 0 0 0 0 0 0
[ 0 - 3M [ 0 0 0 0 0 0 0 0 0 0 0 0 0 0
[ 3M - 1Y [ 0 0 0 0 0 0 0 0 0 0 0 0 0 0
[ 1Y - 2Y [ 0 0 0 0 0 0 0 0 0 0 0 0 0 0
[ 2Y - 3Y [ 0 0 0 0 0 0 0 0 0 0 0 0 0 0
[3Y - 5Y [ 0 0 0 0 0 0 0 0 0 0 0 0 0 0
[5Y - 10Y [ 0 0 0 0 0 0 0 0 0 0 0 0 0 0
[10Y - more 0 0 0 0 0 0 0 0 0 0 0 0 0 0
Tot 0 0 0 0 0 0 0 0 0 0 0 0 0 0
[ 0 - 3M [ 53 0 53 53 0 0 0 0 0 0 0 0 0 0
[ 3M - 1Y [ 15 0 15 15 0 0 0 0 0 0 0 0 0 0
[ 1Y - 2Y [ 81 0 37 37 0 0 0 0 -3 0 0 0 0 0
[ 2Y - 3Y [ 33 0 33 33 0 0 0 0 0 0 0 0 0 0
[3Y - 5Y [ 1,879 0 1,113 1,105 0 8 0 0 0 0 0 0 0 0
[5Y - 10Y [ 2,613 4 148 148 0 -4 0 0 0 0 0 0 0 0
[10Y - more 630 52 630 578 0 0 0 0 0 0 0 0 0 0
Tot 5,303 56 2,029 1,969 0 4 0 0 -3 0 0 0 0 0
Spain
Slovenia
Sweden
United Kingdom
Australia
Canada
Hong Kong
Japan
U.S.

2014 EU-wide Stress Test - Sovereign Exposure
(mln EUR)
Residual Maturity Country / Region
GROSS DIRECT LONG
EXPOSURES (accounting value gross
of provisions)
(1)
NET DIRECT POSITIONS (gross exposures (long) net of cash short
positions of sovereign debt to other counterpaties only where there
is a maturity matching)
(1)
DIRECT SOVEREIGN EXPOSURES IN DERIVATIVES (1)
of which: loans
and advances
of which: AFS
banking book
of which: FVO
(designated at fair
value through
profit&loss)
banking book
of which: Financial
assets held for
trading
(2)
Derivatives with positive fair value at
31/12/2013
Derivatives with negative fair value at
31/12/2013
Derivatives with positive fair value
at 31/12/2013
Derivatives with negative fair
value at 31/12/2013
VALUES AS OF 31/12/2013 VALUES AS OF 31/12/2013 VALUES AS OF 31/12/2013
INDIRECT SOVEREIGN EXPOSURES (3) (on and off balance sheet)
Fair-value at
31/12/2013 (+)Notional value
Fair-value at
31/12/2013 (-)Notional value
Fair-value at
31/12/2013 (+)Notional value
Fair-value at 31/12/2013
(-)
Austria
Notional value
[ 0 - 3M [ 0 0 0 0 0 0 0 0 0 0 0 0 0 0
[ 3M - 1Y [ 0 0 0 0 0 0 0 0 0 0 0 0 0 0
[ 1Y - 2Y [ 0 0 0 0 0 0 0 0 0 0 0 0 0 0
[ 2Y - 3Y [ 0 0 0 0 0 0 0 0 0 0 0 0 0 0
[3Y - 5Y [ 0 0 0 0 0 0 0 0 0 0 0 0 0 0
[5Y - 10Y [ 0 0 0 0 0 0 0 0 0 0 0 0 0 0
[10Y - more 0 0 0 0 0 0 0 0 0 0 0 0 0 0
Tot 0 0 0 0 0 0 0 0 0 0 0 0 0 0
[ 0 - 3M [ 0 0 0 0 0 0 0 0 0 0 0 0 0 0
[ 3M - 1Y [ 0 0 0 0 0 0 0 0 0 0 0 0 0 0
[ 1Y - 2Y [ 0 0 0 0 0 0 0 0 0 0 0 0 0 0
[ 2Y - 3Y [ 0 0 0 0 0 0 0 0 0 0 0 0 0 0
[3Y - 5Y [ 0 0 0 0 0 0 0 0 0 0 0 0 0 0
[5Y - 10Y [ 0 0 0 0 0 0 0 0 0 0 0 0 0 0
[10Y - more 0 0 0 0 0 0 0 0 0 0 0 0 0 0
Tot 0 0 0 0 0 0 0 0 0 0 0 0 0 0
[ 0 - 3M [ 183 0 183 183 0 0 0 0 0 0 0 0 0 0
[ 3M - 1Y [ 220 0 219 181 0 37 0 0 0 0 0 0 0 0
[ 1Y - 2Y [ 0 0 0 0 0 0 0 0 0 0 0 0 0 0
[ 2Y - 3Y [ 0 0 0 0 0 0 0 0 0 0 0 0 0 0
[3Y - 5Y [ 0 0 0 0 0 0 0 0 0 0 0 0 0 0
[5Y - 10Y [ 0 0 0 0 0 0 0 0 0 0 0 0 0 0
[10Y - more 0 0 0 0 0 0 0 0 0 0 0 0 0 0
Tot 403 0 401 364 0 37 0 0 0 0 0 0 0 0
[ 0 - 3M [ 0 0 0 0 0 0 0 0 0 0 0 0 0 0
[ 3M - 1Y [ 0 0 0 0 0 0 0 0 0 0 0 0 0 0
[ 1Y - 2Y [ 0 0 0 0 0 0 0 0 0 0 0 0 0 0
[ 2Y - 3Y [ 0 0 0 0 0 0 0 0 0 0 0 0 0 0
[3Y - 5Y [ 0 0 0 0 0 0 0 0 0 0 0 0 0 0
[5Y - 10Y [ 0 0 0 0 0 0 0 0 0 0 0 0 0 0
[10Y - more 0 0 0 0 0 0 0 0 0 0 0 0 0 0
Tot 0 0 0 0 0 0 0 0 0 0 0 0 0 0
[ 0 - 3M [ 135 0 135 135 0 0 0 0 0 0 0 0 0 0
[ 3M - 1Y [ 325 33 325 267 0 25 0 0 0 0 0 0 0 0
[ 1Y - 2Y [ 151 67 151 84 0 0 0 0 0 0 0 1 0 -1
[ 2Y - 3Y [ 49 0 49 49 0 0 0 0 0 0 0 0 0 0
[3Y - 5Y [ 117 70 117 47 0 0 0 0 0 0 0 2 0 -2
[5Y - 10Y [ 0 0 0 0 0 0 0 0 0 0 0 0 0 0
[10Y - more 0 0 0 0 0 0 0 0 0 0 0 0 0 0
Tot 777 170 777 582 0 25 0 0 0 0 0 3 0 -3
[ 0 - 3M [ 0 0 0 0 0 0 0 0 0 0 0 0 0 0
[ 3M - 1Y [ 0 0 0 0 0 0 0 0 0 0 0 0 0 0
[ 1Y - 2Y [ 0 0 0 0 0 0 0 0 0 0 0 0 0 0
[ 2Y - 3Y [ 0 0 0 0 0 0 0 0 0 0 0 0 0 0
[3Y - 5Y [ 0 0 0 0 0 0 0 0 0 0 0 0 0 0
[5Y - 10Y [ 0 0 0 0 0 0 0 0 0 0 0 0 0 0
[10Y - more 52 52 52 0 0 0 0 0 0 0 0 0 0 0
Tot 52 52 52 0 0 0 0 0 0 0 0 0 0 0
[ 0 - 3M [ 39 0 39 39 0 0 0 0 0 0 0 0 0 0
[ 3M - 1Y [ 62 1 62 61 0 0 0 0 0 0 0 0 0 0
[ 1Y - 2Y [ 6 6 6 0 0 0 0 0 0 0 0 0 0 0
[ 2Y - 3Y [ 4 4 4 0 0 0 0 0 0 0 0 0 0 0
[3Y - 5Y [ 92 92 92 0 0 0 0 0 0 0 0 0 0 0
[5Y - 10Y [ 136 136 136 0 0 0 0 0 0 0 0 0 0 0
[10Y - more 232 232 232 0 0 0 0 0 0 0 0 0 0 0Tot 570 470 570 99 0 0 0 0 0 0 0 0 0 0
Notes and definitions
(1) The exposures reported cover only exposures to central, regional and local governments on immediate borrower basis, and do not include exposures to other counterparts with full or partial government guarantees
(2) The banks disclose the exposures in the "Financial assets held for trading" portfolio after offsetting the cash short positions having the same maturities. (3) The exposures reported include the positions towards counterparts (other than sovereign) on sovereign credit risk (i.e. CDS, financial guarantees) booked in all the accounting portfolio (on-off balance sheet). 'Irrespective of the denomination and or accounting classification of the positions the economic substance over the form must be used as a criteria for the identification of the exposures to be included in this column. This item does not include exposures to counterparts (other than sovereign) with full or partial government guarantees by central, regional and local governments
Latin America and the
Caribbean
Africa
Others
Middle East
China
Switzerland
Other advanced economies
non EEA
Other Central and eastern
Europe countries non EEA
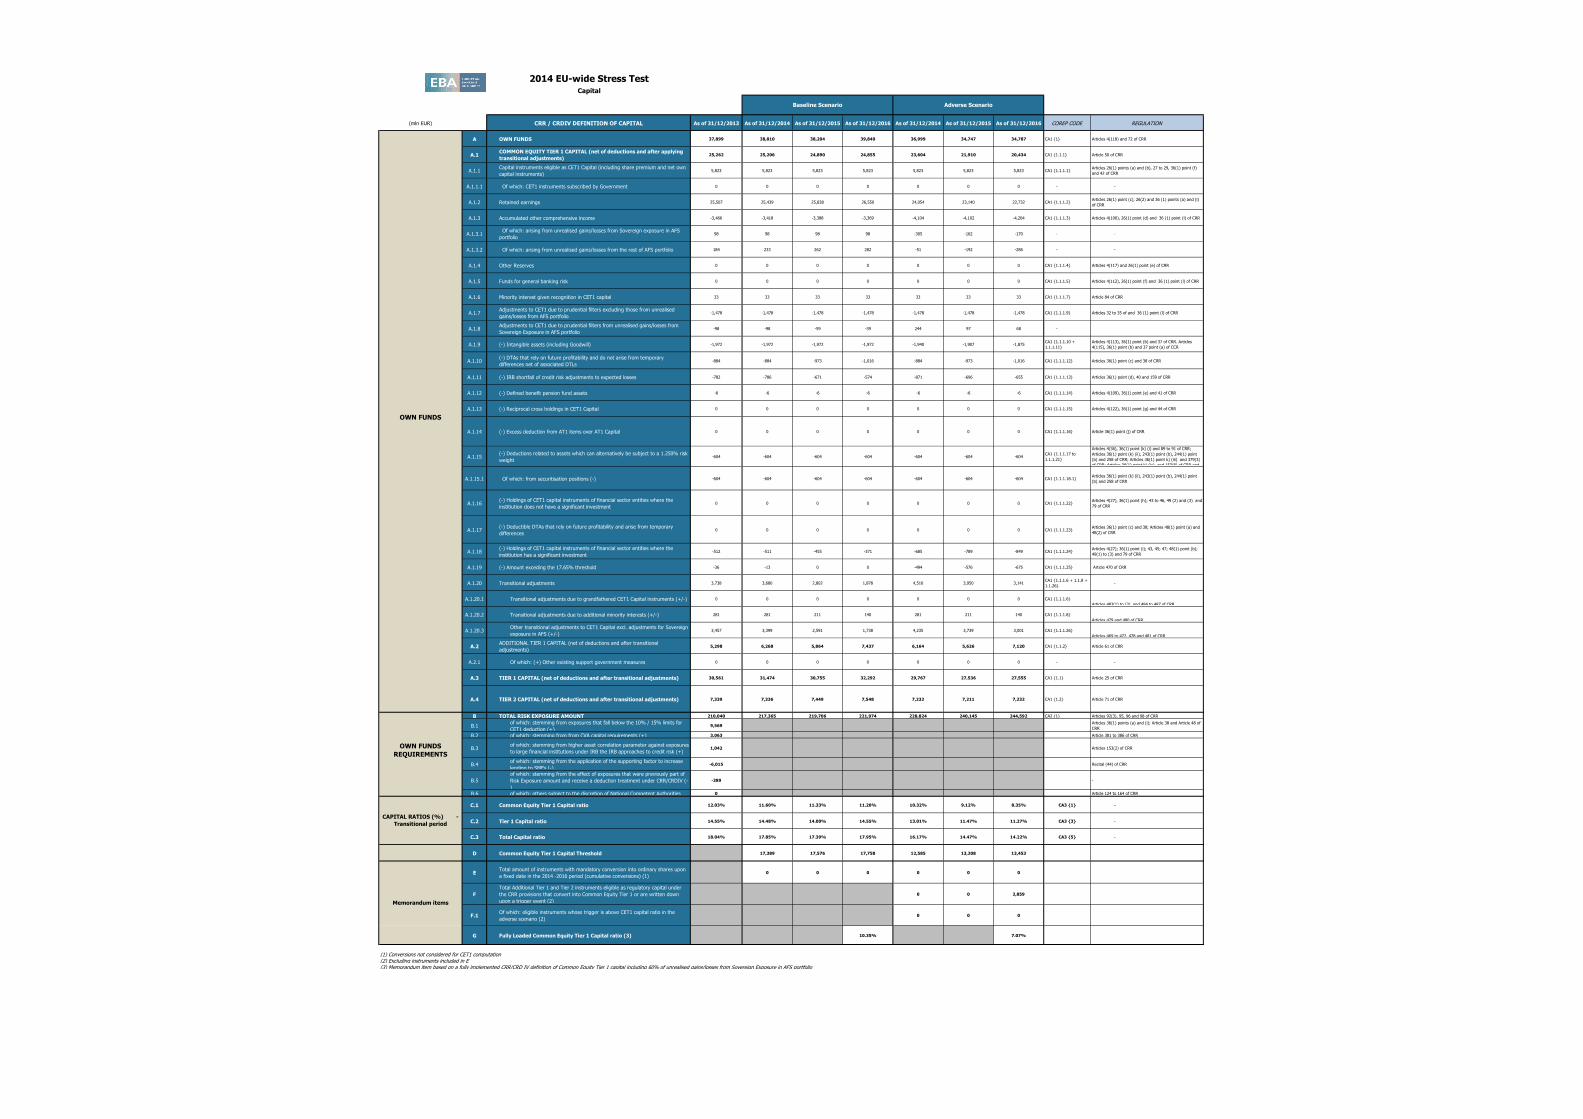
2014 EU-wide Stress TestCapital
(mln EUR) CRR / CRDIV DEFINITION OF CAPITAL As of 31/12/2013 As of 31/12/2014 As of 31/12/2015 As of 31/12/2016 As of 31/12/2014 As of 31/12/2015 As of 31/12/2016 COREP CODE REGULATION
A OWN FUNDS 37,899 38,810 38,204 39,840 36,999 34,747 34,787 CA1 {1} Articles 4(118) and 72 of CRR
A.1COMMON EQUITY TIER 1 CAPITAL (net of deductions and after applying
transitional adjustments)25,262 25,206 24,890 24,855 23,604 21,910 20,434 CA1 {1.1.1} Article 50 of CRR
A.1.1Capital instruments eligible as CET1 Capital (including share premium and net own
capital instruments)5,823 5,823 5,823 5,823 5,823 5,823 5,823 CA1 {1.1.1.1}
Articles 26(1) points (a) and (b), 27 to 29, 36(1) point (f)
and 42 of CRR
A.1.1.1 Of which: CET1 instruments subscribed by Government 0 0 0 0 0 0 0 - -
A.1.2 Retained earnings 25,507 25,439 25,838 26,550 24,054 23,140 22,732 CA1 {1.1.1.2}Articles 26(1) point (c), 26(2) and 36 (1) points (a) and (l)
of CRR
A.1.3 Accumulated other comprehensive income -3,466 -3,418 -3,388 -3,369 -4,104 -4,102 -4,204 CA1 {1.1.1.3} Articles 4(100), 26(1) point (d) and 36 (1) point (l) of CRR
A.1.3.1 Of which: arising from unrealised gains/losses from Sovereign exposure in AFS
portfolio98 98 98 98 -305 -162 -170 - -
A.1.3.2 Of which: arising from unrealised gains/losses from the rest of AFS portfolio 184 233 262 282 -51 -192 -286 - -
A.1.4 Other Reserves 0 0 0 0 0 0 0 CA1 {1.1.1.4} Articles 4(117) and 26(1) point (e) of CRR
A.1.5 Funds for general banking risk 0 0 0 0 0 0 0 CA1 {1.1.1.5} Articles 4(112), 26(1) point (f) and 36 (1) point (l) of CRR
A.1.6 Minority interest given recognition in CET1 capital 33 33 33 33 33 33 33 CA1 {1.1.1.7} Article 84 of CRR
A.1.7Adjustments to CET1 due to prudential filters excluding those from unrealised
gains/losses from AFS portfolio-1,478 -1,478 -1,478 -1,478 -1,478 -1,478 -1,478 CA1 {1.1.1.9} Articles 32 to 35 of and 36 (1) point (l) of CRR
A.1.8Adjustments to CET1 due to prudential filters from unrealised gains/losses from
Sovereign Exposure in AFS portfolio-98 -98 -59 -39 244 97 68 -
A.1.9 (-) Intangible assets (including Goodwill) -1,972 -1,972 -1,972 -1,972 -1,940 -1,907 -1,875CA1 {1.1.1.10 +
1.1.1.11}
Articles 4(113), 36(1) point (b) and 37 of CRR. Articles
4(115), 36(1) point (b) and 37 point (a) of CCR
A.1.10(-) DTAs that rely on future profitability and do not arise from temporary
differences net of associated DTLs -884 -884 -973 -1,016 -884 -973 -1,016 CA1 {1.1.1.12} Articles 36(1) point (c) and 38 of CRR
A.1.11 (-) IRB shortfall of credit risk adjustments to expected losses -782 -786 -671 -574 -871 -696 -655 CA1 {1.1.1.13} Articles 36(1) point (d), 40 and 159 of CRR
A.1.12 (-) Defined benefit pension fund assets -6 -6 -6 -6 -6 -6 -6 CA1 {1.1.1.14} Articles 4(109), 36(1) point (e) and 41 of CRR
A.1.13 (-) Reciprocal cross holdings in CET1 Capital 0 0 0 0 0 0 0 CA1 {1.1.1.15} Articles 4(122), 36(1) point (g) and 44 of CRR
A.1.14 (-) Excess deduction from AT1 items over AT1 Capital 0 0 0 0 0 0 0 CA1 {1.1.1.16} Article 36(1) point (j) of CRR
A.1.15(-) Deductions related to assets which can alternatively be subject to a 1.250% risk
weight-604 -604 -604 -604 -604 -604 -604
CA1 {1.1.1.17 to
1.1.1.21}
Articles 4(36), 36(1) point (k) (i) and 89 to 91 of CRR;
Articles 36(1) point (k) (ii), 243(1) point (b), 244(1) point
(b) and 258 of CRR; Articles 36(1) point k) (iii) and 379(3)
of CRR; Articles 36(1) point k) (iv) and 153(8) of CRR and
A.1.15.1 Of which: from securitisation positions (-) -604 -604 -604 -604 -604 -604 -604 CA1 {1.1.1.18.1}Articles 36(1) point (k) (ii), 243(1) point (b), 244(1) point
(b) and 258 of CRR
A.1.16(-) Holdings of CET1 capital instruments of financial sector entities where the
institiution does not have a significant investment0 0 0 0 0 0 0 CA1 {1.1.1.22}
Articles 4(27), 36(1) point (h); 43 to 46, 49 (2) and (3) and
79 of CRR
A.1.17(-) Deductible DTAs that rely on future profitability and arise from temporary
differences0 0 0 0 0 0 0 CA1 {1.1.1.23}
Articles 36(1) point (c) and 38; Articles 48(1) point (a) and
48(2) of CRR
A.1.18(-) Holdings of CET1 capital instruments of financial sector entities where the
institiution has a significant investment-512 -511 -455 -371 -685 -789 -849 CA1 {1.1.1.24}
Articles 4(27); 36(1) point (i); 43, 45; 47; 48(1) point (b);
49(1) to (3) and 79 of CRR
A.1.19 (-) Amount exceding the 17.65% threshold -36 -13 0 0 -494 -576 -675 CA1 {1.1.1.25} Article 470 of CRR
A.1.20 Transitional adjustments 3,738 3,680 2,802 1,878 4,516 3,950 3,141CA1 {1.1.1.6 + 1.1.8 +
1.1.26}-
A.1.20.1 Transitional adjustments due to grandfathered CET1 Capital instruments (+/-) 0 0 0 0 0 0 0 CA1 {1.1.1.6}
Articles 483(1) to (3), and 484 to 487 of CRR
A.1.20.2 Transitional adjustments due to additional minority interests (+/-) 281 281 211 140 281 211 140 CA1 {1.1.1.8}
Articles 479 and 480 of CRR
A.1.20.3Other transitional adjustments to CET1 Capital excl. adjustments for Sovereign
exposure in AFS (+/-)3,457 3,399 2,591 1,738 4,235 3,739 3,001 CA1 {1.1.1.26}
Articles 469 to 472, 478 and 481 of CRR
A.2ADDITIONAL TIER 1 CAPITAL (net of deductions and after transitional
adjustments)5,298 6,268 5,864 7,437 6,164 5,626 7,120 CA1 {1.1.2} Article 61 of CRR
A.2.1 Of which: (+) Other existing support government measures 0 0 0 0 0 0 0 - -
A.3 TIER 1 CAPITAL (net of deductions and after transitional adjustments) 30,561 31,474 30,755 32,292 29,767 27,536 27,555 CA1 {1.1} Article 25 of CRR
A.4 TIER 2 CAPITAL (net of deductions and after transitional adjustments) 7,339 7,336 7,449 7,548 7,232 7,211 7,232 CA1 {1.2} Article 71 of CRR
B TOTAL RISK EXPOSURE AMOUNT 210,040 217,365 219,706 221,974 228,824 240,145 244,592 CA2 {1} Articles 92(3), 95, 96 and 98 of CRR
B.1of which: stemming from exposures that fall below the 10% / 15% limits for
CET1 deduction (+)9,569 0 0 0 0 0 0
Articles 36(1) points (a) and (i); Article 38 and Article 48 of
CRR
B.2 of which: stemming from from CVA capital requirements (+) 3,063 0 0 0 0 0 0 Article 381 to 386 of CRR
B.3of which: stemming from higher asset correlation parameter against exposures
to large financial institutions under IRB the IRB approaches to credit risk (+)1,042 0 0 0 0 0 0 Articles 153(2) of CRR
B.4of which: stemming from the application of the supporting factor to increase
lending to SMEs (-)-6,015 0 0 0 0 0 0 Recital (44) of CRR
B.5
of which: stemming from the effect of exposures that were previously part of
Risk Exposure amount and receive a deduction treatment under CRR/CRDIV (-
)
-389 0 0 0 0 0 0 -
B.6 of which: others subject to the discretion of National Competent Authorities 0 0 0 0 0 0 0 Article 124 to 164 of CRR
C.1 Common Equity Tier 1 Capital ratio 12.03% 11.60% 11.33% 11.20% 10.32% 9.12% 8.35% CA3 {1} -
C.2 Tier 1 Capital ratio 14.55% 14.48% 14.00% 14.55% 13.01% 11.47% 11.27% CA3 {3} -
C.3 Total Capital ratio 18.04% 17.85% 17.39% 17.95% 16.17% 14.47% 14.22% CA3 {5} -
D Common Equity Tier 1 Capital Threshold 17,389 17,576 17,758 12,585 13,208 13,453
ETotal amount of instruments with mandatory conversion into ordinary shares upon
a fixed date in the 2014 -2016 period (cumulative conversions) (1)0 0 0 0 0 0
F
Total Additional Tier 1 and Tier 2 instruments eligible as regulatory capital under
the CRR provisions that convert into Common Equity Tier 1 or are written down
upon a trigger event (2)
0 0 2,859
F.1Of which: eligible instruments whose trigger is above CET1 capital ratio in the
adverse scenario (2)0 0 0
G Fully Loaded Common Equity Tier 1 Capital ratio (3) 10.35% 7.07%
(1) Conversions not considered for CET1 computation(2) Excluding instruments included in E(3) Memorandum item based on a fully implemented CRR/CRD IV definition of Common Equity Tier 1 capital including 60% of unrealised gains/losses from Sovereign Exposure in AFS portfolio
Memorandum items
Baseline Scenario Adverse Scenario
OWN FUNDS
OWN FUNDS
REQUIREMENTS
CAPITAL RATIOS (%) -
Transitional period
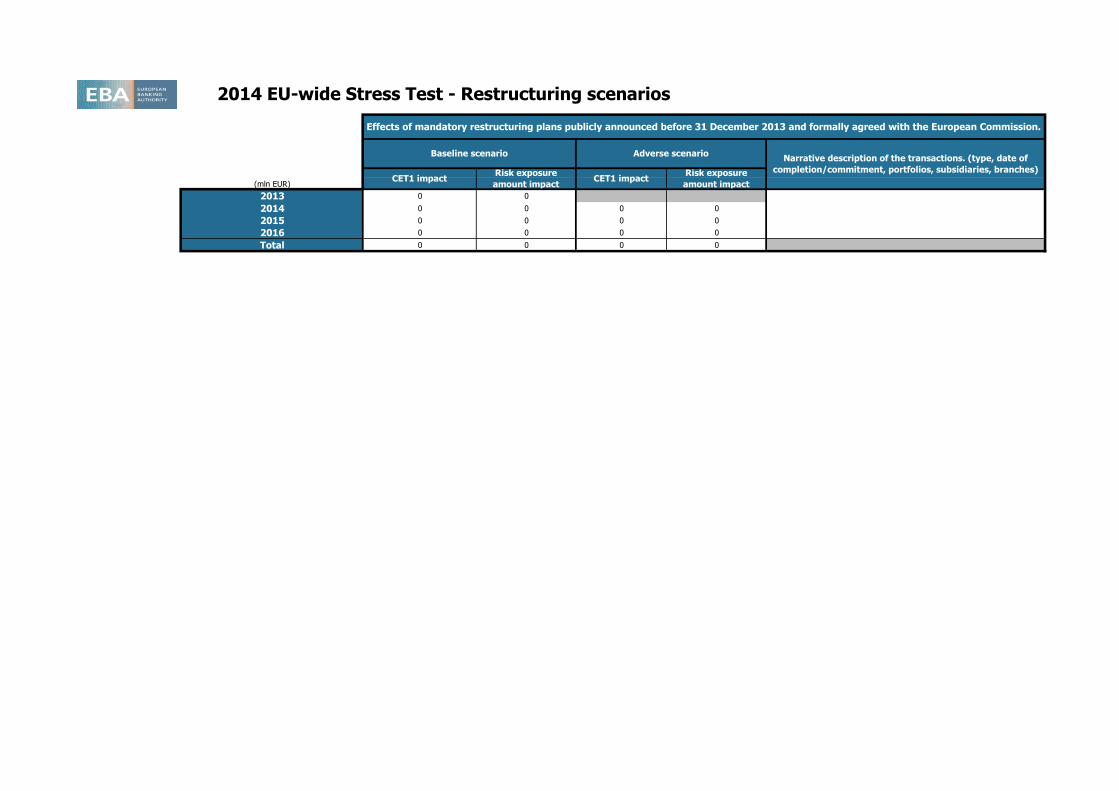
2014 EU-wide Stress Test - Restructuring scenarios
(mln EUR)
2013 0 0
2014 0 0 0 0
2015 0 0 0 0
2016 0 0 0 0
Total 0 0 0 0
Effects of mandatory restructuring plans publicly announced before 31 December 2013 and formally agreed with the European Commission.
Baseline scenario Adverse scenarioNarrative description of the transactions. (type, date of
completion/commitment, portfolios, subsidiaries, branches) CET1 impact
Risk exposure
amount impactCET1 impact
Risk exposure
amount impact
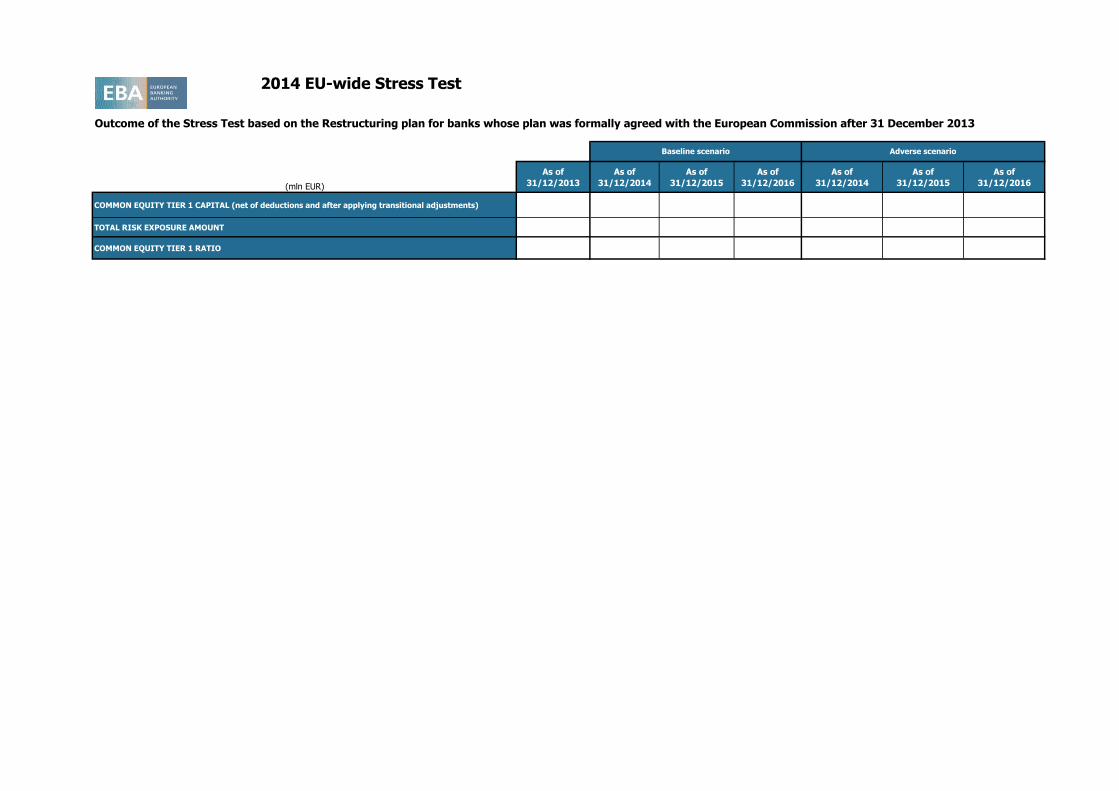
2014 EU-wide Stress Test
Outcome of the Stress Test based on the Restructuring plan for banks whose plan was formally agreed with the European Commission after 31 December 2013
(mln EUR)
As of
31/12/2013
As of
31/12/2014
As of
31/12/2015
As of
31/12/2016
As of
31/12/2014
As of
31/12/2015
As of
31/12/2016
COMMON EQUITY TIER 1 CAPITAL (net of deductions and after applying transitional adjustments)
TOTAL RISK EXPOSURE AMOUNT
COMMON EQUITY TIER 1 RATIO #DIV/0! #DIV/0! #DIV/0! #DIV/0! #DIV/0! #DIV/0! #DIV/0!
Baseline scenario Adverse scenario
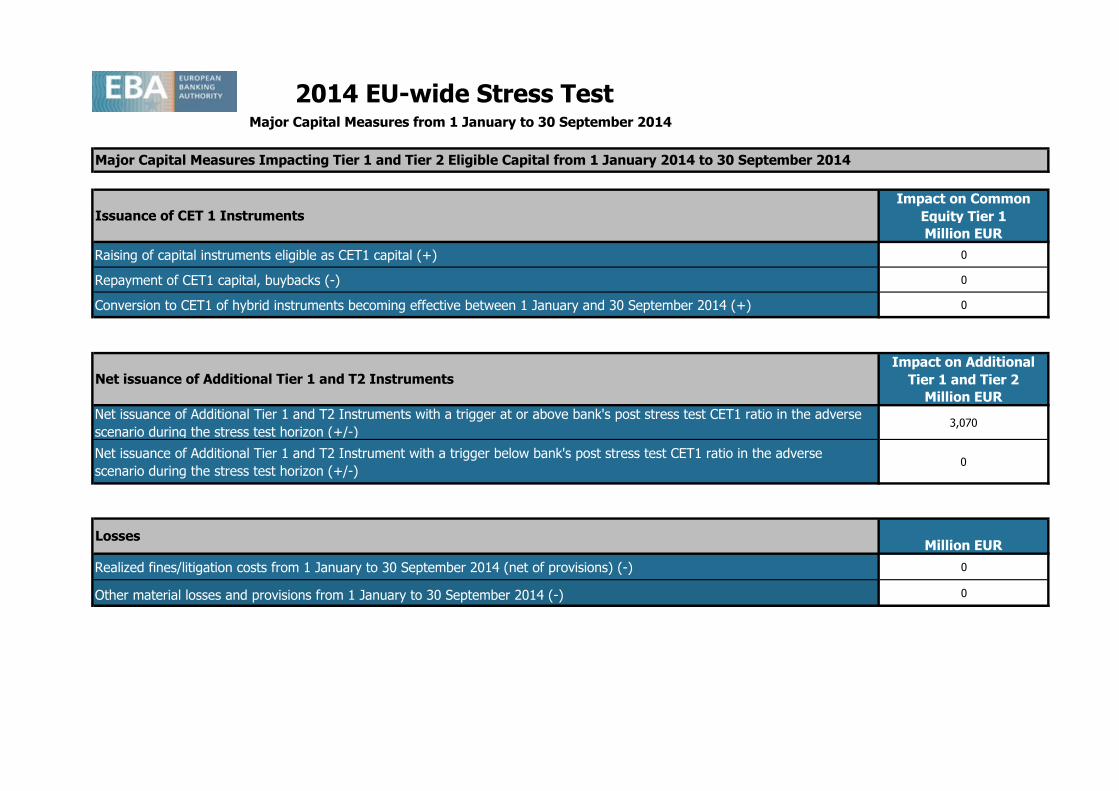
2014 EU-wide Stress Test
Impact on Common
Equity Tier 1
Million EUR
Raising of capital instruments eligible as CET1 capital (+) 0
Repayment of CET1 capital, buybacks (-) 0
Conversion to CET1 of hybrid instruments becoming effective between 1 January and 30 September 2014 (+) 0
Impact on Additional
Tier 1 and Tier 2
Million EUR
Net issuance of Additional Tier 1 and T2 Instruments with a trigger at or above bank's post stress test CET1 ratio in the adverse
scenario during the stress test horizon (+/-)3,070
Net issuance of Additional Tier 1 and T2 Instrument with a trigger below bank's post stress test CET1 ratio in the adverse
scenario during the stress test horizon (+/-)0
Million EUR
Realized fines/litigation costs from 1 January to 30 September 2014 (net of provisions) (-) 0
Other material losses and provisions from 1 January to 30 September 2014 (-) 0
Major Capital Measures from 1 January to 30 September 2014
Losses
Net issuance of Additional Tier 1 and T2 Instruments
Issuance of CET 1 Instruments
Major Capital Measures Impacting Tier 1 and Tier 2 Eligible Capital from 1 January 2014 to 30 September 2014
Recommended