2015 United States National
Postconsumer Plastic Bottle
Recycling Report
www.plasticsrecycling.org
www.americanchemistry.com
2
Copyright © 2016 American Chemistry Council and Association of Plastic Recyclers. All rights reserved.
2015 US National Postconsumer Plastic Bottle Recycling Rate Report
INTRODUCTION
The 2015 edition of the United States National Postconsumer Plastics Bottle Recycling Report is the 26th
annual report on plastic bottle recycling. This study is a cooperative effort between the Plastics Division
of the American Chemistry Council (ACC) and the Association of Plastic Recyclers (APR), the goal of
which is to quantify the amount of high density polyethylene (HDPE) and polypropylene (PP) bottles
collected for recycling, as well as the rate of recycling of those bottles. This study includes
postconsumer recycling values and comments for polyethylene terephthalate (PET) developed by the
National Association for PET Container Resources (NAPCOR) and the Association of Plastic Recyclers
(APR). The reclaimer survey portion of the study, other than for PET, was conducted by Moore
Recycling Associates, Inc.
PLEASE NOTE: After publishing the 2014 United States National Postconsumer Plastics Bottle
Recycling Report we found and corrected an error in the methodology used for polypropylene bottles.
Some pounds of polypropylene were mis-reported as bottles when the pounds were for non-bottle rigid
packaging. Totals cited last year were in fact recycled, just not necessarily all as bottles. We have also
corrected for pounds of HDPE missed in 2014. The statements in this report reflect comparisons with
the corrected 2014 values. Corrected values for 2014 are given Table 1.
HIGHLIGHTS / SUMMARY FOR 2015
Plastic Bottle Pounds Collected for Recycling in the United States
The total pounds of plastic bottles collected for recycling reached 2,977 million pounds in an
economically difficult year.
The total plastic bottle recycling collection rate was 31.1%, a decrease of 0.6 percentage points compared to 2014.
The total pounds of plastic bottles collected decreased by 14 million pounds for 2015 compared to 2014, with decreases for PET and HDPE and a slight increase for PP bottle resins. The
annualized change in pounds of plastic bottles collected for recycling was -0.5%
The five year compounded annual growth rate for plastic bottle recycling was 2.9%.
PET bottles collected decreased by 15 million pounds for a total of 1,797 million pounds in 2015. The recycling collection rate dipped from 31.0% in 2014 to 30.1% in 2015. The
numerator dropped while the denominator rose.
Compared to 2014, HDPE bottles collected fell by 4.8 million pounds to 1,143.8 million pounds. The HDPE bottle recycling collection rate dropped to 34.4% in 2015 compared to the 2014 rate
of 34.8%. The numerator dropped while the denominator rose slightly.
PP bottle recycling collection totaled 31.8 million pounds, an increase of 19.5% over the corrected 2014 total of 26.6 million pounds. The collection rate rose to 17.9% in 2015 compared
to 15.0% in 2014, with the numerator rising while the denominator held steady in 2015
compared to 2014.
Exports of USA-collected HDPE bottle material dropped from 219 million pounds in 2014 to
184 million pounds in 2015. The 184 million pounds represented 16.1% of the domestically
collected material with approximately 66% of the exports leaving North America.
3
Copyright © 2016 American Chemistry Council and Association of Plastic Recyclers. All rights reserved.
2015 US National Postconsumer Plastic Bottle Recycling Rate Report
Compared to 2014, imports of postconsumer HDPE to the United States rose by 25% to 65.9 million pounds in 2015, which combined with near steady domestic collection and decreased
exports resulted in increased purchases for United States reclamation plants, up 43.7 million
pounds since last year to 1025.7 million pounds.
Plastic Bottle Recycling Overview for 2015
The postconsumer plastic bottle recycling industry experienced a difficult year in 2015 with lower bale
prices and lower competing virgin polymer prices for reclaimers. Margins were tight both for bale
sellers and for plastic bottle reclaimers.
Recycled natural and pigmented HDPE bottle bale prices fell in 2015 compared to 2014 with
momentary uptick in the second quarter followed by continued falling prices. PET bottle bale prices fell
throughout 2015 compared to 2014. The average price for baled postconsumer plastic bottles fell by
31% for baled bottle plastic (a composite of separate HDPE and PET bales, not a mixed bale) in 2015
compared to 2014 even as crude oil fell by 47% with resulting lower virgin plastics prices.
The numerator of pounds of all bottles collected fell 14 million pounds or 0.5%, well below the three
year running average bottle collection growth rate of 2.3% per year. Considering the denominator, light-
weighting and „right-sizing‟ of PET and HDPE bottles continued as has been the case for several years.
More of the light-weighted containers were lost into the postconsumer paper stream at the sorting plants.
Many consumer products are being sold in smaller bottles as household demographics change. The
sales of PET for bottles increased over 2014 while sales of HDPE for bottles continued to hold nearly
steady. The total for all bottles in the marketplace increased by 148 million pounds, or 1.6% which
matches the three year running average bottle marketplace growth rate of 1.6%. 2015 was a positive
year for total bottle usage, but static on a per capita basis.
Sales of virgin HDPE resin for bottles rose by 0.17% and sales of recycled HDPE resin for bottles rose
by 6.5% compared to 2014 results. Sales of virgin PET resin for bottles rose by 2.2% and sales of
recycled PET resin for bottles gained slightly as fiber uses, film uses, and strapping uses fell in the same
time frame.
Exports of all postconsumer plastic bottle bales continued the long term trend downward with a decrease
of 21.5 million pounds compared to 2014 and a fall to the lowest percentage of total exports in nine
years. In 2015 20.8% of overall collected postconsumer bottles were exported from the United States.
HDPE exports fell substantially in 2015 compared to 2014, to 16.1% of collected material. PET exports
rose in both absolute tonnage and percentage of material collected, 23.6%, compared to 2014, but were
still less than years prior to 2014. The export of recycled PP bottles rose in 2015 to 27.9% of that
collected. The PP bottle exports were in mixed rigids bales, not discrete bales of PP bottles.
The processing of recycled PET, sourced domestically and imported, fell in 2015 over 2014 by 120
million pounds. The processing of recycled HDPE, sourced domestically and imported, rose by 44
million pounds in 2015 compared to 2014. The processing of recycled PP bottles, sourced domestically
and imported, decreased by 3.8 million pounds in 2015 over 2014.
4
Copyright © 2016 American Chemistry Council and Association of Plastic Recyclers. All rights reserved.
2015 US National Postconsumer Plastic Bottle Recycling Rate Report
Bottle resin use per capita gained back the 0.6% lost in 2014 and was a return to the slow growth seen since the 2008/2009 recession. The growth seen before the recession has been replaced by less
plastic use and continual lightweighting.
Bale prices for recycled bottles moved down throughout 2015 for PET. HDPE natural prices were
weak in the first quarter, rose and fell and repeated the weakness in the fourth quarter. HDPE
copolymer bale prices followed a similar pattern.
Single stream collection of household recyclables continued growth, generally resulting in higher overall household participation rates and more challenges from contaminated bales of bottles with
bale yields as dismal as in recent years. Materials recovery facility, MRF, operations were hurt by
falling product prices and no commensurate drop in costs. Tension in the reclamation industry
continued with increased share of material from single stream collection and more challenging
processing requirements. As a continuing example, sleeve labels on PET bottles added to poor bale
yields. Conversely, PET thermoforms continued to represent a growing opportunity for additional
raw material for recycling processing.
California Container Redemption Value redemption centers collected not only PET, but also HDPE, PP, PVC, LDPE bottles and “OTHER” bottles.
Plastic bottle recycling continues to be an international business with U.S.-based reclaimers competing effectively in 2015 as they did in 2014.
Active “all bottle” collection, which takes all bottles regardless of resin identification number,
continued the collection of LDPE and PVC bottles, although the tonnage continues to be small. We
see a small amount of “#7, OTHER”, bottles collected, but we do not have data for the denominators
of those bottles. The LDPE and PVC bottles were often exported as part of mixed bales.
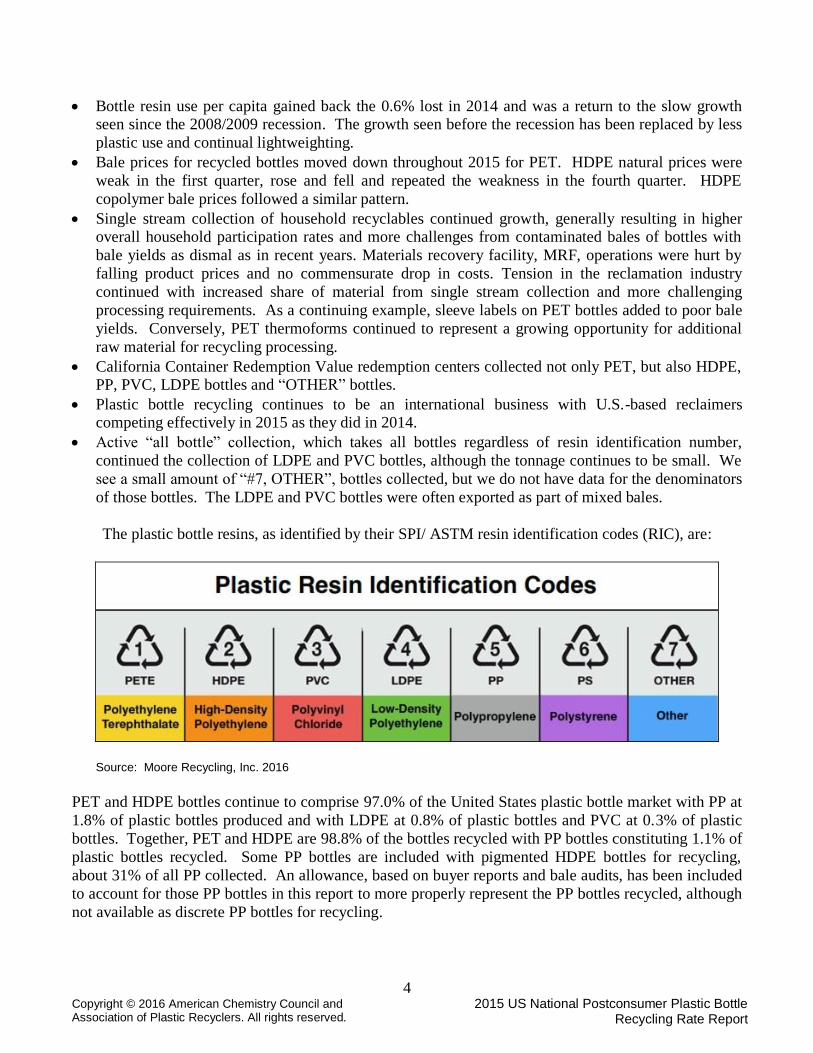
The plastic bottle resins, as identified by their SPI/ ASTM resin identification codes (RIC), are:
Source: Moore Recycling, Inc. 2016
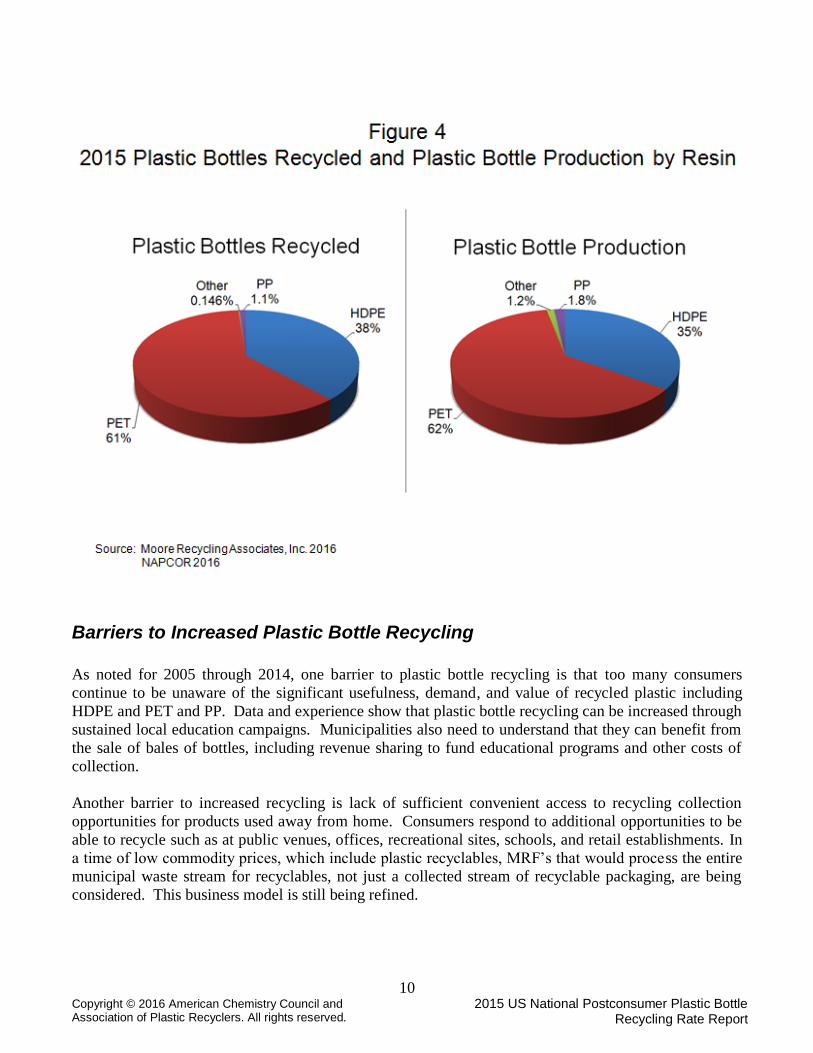
PET and HDPE bottles continue to comprise 97.0% of the United States plastic bottle market with PP at
1.8% of plastic bottles produced and with LDPE at 0.8% of plastic bottles and PVC at 0.3% of plastic
bottles. Together, PET and HDPE are 98.8% of the bottles recycled with PP bottles constituting 1.1% of
plastic bottles recycled. Some PP bottles are included with pigmented HDPE bottles for recycling,
about 31% of all PP collected. An allowance, based on buyer reports and bale audits, has been included
to account for those PP bottles in this report to more properly represent the PP bottles recycled, although
not available as discrete PP bottles for recycling.
5
Copyright © 2016 American Chemistry Council and Association of Plastic Recyclers. All rights reserved.
2015 US National Postconsumer Plastic Bottle Recycling Rate Report
Although bottles made with the #3 through #7 resins are recyclable, and to varying degrees are recycled,
the actual level of recycling is limited by the continuing challenge to reach a critical mass of readily
recognizable bottles for economical collection and processing. However, it should be noted that bottles
made from resins #3 through #7 make up just 3.0% of the plastic bottle market.
Finally, bottles coded with “#7, OTHER” are included in this report as a discrete category, but are not
included in the total for TOTAL BOTTLES shown on Table 1. Bottles coded #7 may include, among
others, HDPE or PET or PP resins with barrier layer materials. These bottles are often recycled with the
primary resins used in each container. Bottles coded #7 may also be made from resins other than those
listed above, such as polycarbonate. No information is available for the denominator for “#7, OTHER”.
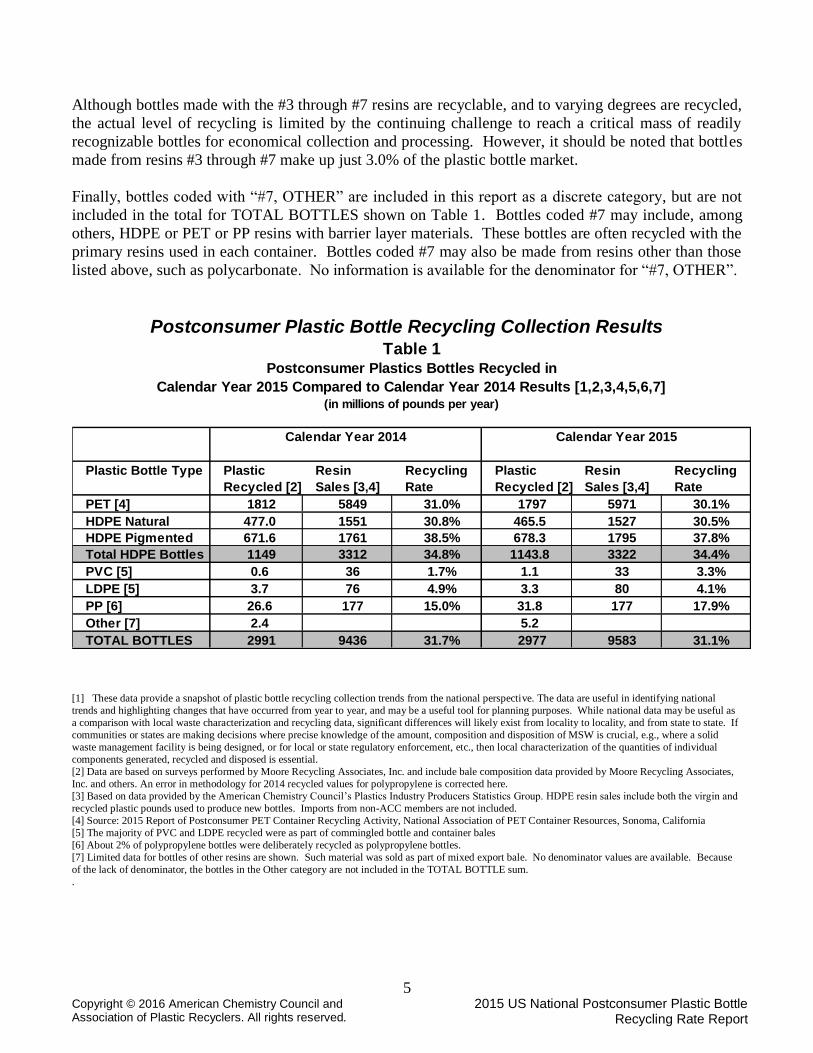
Postconsumer Plastic Bottle Recycling Collection Results
Plastic Bottle Type Plastic Resin Recycling Plastic Resin Recycling
Recycled [2] Sales [3,4] Rate Recycled [2] Sales [3,4] Rate
PET [4] 1812 5849 31.0% 1797 5971 30.1%
HDPE Natural 477.0 1551 30.8% 465.5 1527 30.5%
HDPE Pigmented 671.6 1761 38.5% 678.3 1795 37.8%
Total HDPE Bottles 1149 3312 34.8% 1143.8 3322 34.4%
PVC [5] 0.6 36 1.7% 1.1 33 3.3%
LDPE [5] 3.7 76 4.9% 3.3 80 4.1%
PP [6] 26.6 177 15.0% 31.8 177 17.9%
Other [7] 2.4 5.2
TOTAL BOTTLES 2991 9436 31.7% 2977 9583 31.1%
Table 1Postconsumer Plastics Bottles Recycled in
Calendar Year 2015 Compared to Calendar Year 2014 Results [1,2,3,4,5,6,7](in millions of pounds per year)
Calendar Year 2014 Calendar Year 2015
[1] These data provide a snapshot of plastic bottle recycling collection trends from the national perspective. The data are useful in identifying national
trends and highlighting changes that have occurred from year to year, and may be a useful tool for planning purposes. While national data may be useful as
a comparison with local waste characterization and recycling data, significant differences will likely exist from locality to locality, and from state to state. If
communities or states are making decisions where precise knowledge of the amount, composition and disposition of MSW is crucial, e.g., where a solid
waste management facility is being designed, or for local or state regulatory enforcement, etc., then local characterization of the quantities of individual
components generated, recycled and disposed is essential. [2] Data are based on surveys performed by Moore Recycling Associates, Inc. and include bale composition data provided by Moore Recycling Associates,
Inc. and others. An error in methodology for 2014 recycled values for polypropylene is corrected here. [3] Based on data provided by the American Chemistry Council‟s Plastics Industry Producers Statistics Group. HDPE resin sales include both the virgin and
recycled plastic pounds used to produce new bottles. Imports from non-ACC members are not included. [4] Source: 2015 Report of Postconsumer PET Container Recycling Activity, National Association of PET Container Resources, Sonoma, California [5] The majority of PVC and LDPE recycled were as part of commingled bottle and container bales [6] About 2% of polypropylene bottles were deliberately recycled as polypropylene bottles. [7] Limited data for bottles of other resins are shown. Such material was sold as part of mixed export bale. No denominator values are available. Because
of the lack of denominator, the bottles in the Other category are not included in the TOTAL BOTTLE sum. .
6
Copyright © 2016 American Chemistry Council and Association of Plastic Recyclers. All rights reserved.
2015 US National Postconsumer Plastic Bottle Recycling Rate Report
The 2015 PET bottle denominator increased by 122 million pounds to 5,971 million pounds compared to
the 2014 value. The 2015 PET bottle numerator, not including thermoforms, decreased by 15 million
pounds to 1,797 million pounds collected. Many natural homopolymer HDPE milk bottles are
pigmented, the usual visual indicator of the use of copolymer, and those bottles are included in the
usually pigmented copolymer bottles. The split for recycled HDPE between natural HDPE (presumed to
all be homopolymer) and pigmented HDPE (usually presumed to be copolymer) was based on buyer
estimates. The “Total HDPE Bottles” values on Table 1 are likely more accurate numbers. In
comparison with 2014, the 2015 HDPE denominator (i.e. bottles in the market place) rose by 11 million
pounds, or 0.3%. In a tough economic environment, even slight gains are appreciated as more pounds of
plastic used mean more opportunity to gain economies of scale. The HDPE numerator (i.e. bottles
collected for recycling) decreased by 4.8 million pounds, or -0.4%. The collection rate for HDPE bottle
recycling fell in 2015 to 34.4% versus 2014 at 34.8% with fewer pounds recycled and the denominator
rising slightly. Both natural HDPE and pigmented HDPE recycling rates, as defined, fell in 2015 versus
2014. Overall, HDPE bottle recycling saw a slight decrease in pounds collected for recycling.
About 6.6% of the total #2 through #7 bottles collected was part of commingled bottles bales. For
HDPE bottles the contribution from commingled bottles bales and mixed rigids bales was about 2.8% of
the total HDPE bottles collected in 2015. For PP bottles the contribution from commingled bottles bales
and mixed rigids bales was about 67% of the total bottles collected. For PVC bottles the contribution
from commingled bottles bales and mixed rigids bales was about 98% of the total bottles collected. For
LDPE bottles the contribution from commingled bottles bales and mixed rigids bales was about 100% of
the total bottles collected.
Domestic processing of postconsumer PP bottles totaled 23.7 million pounds, a 14% decrease from
2014. PP recycling collection saw a 5.2 million pound increase in collected material and a steady usage
of PP for initial bottles, resulting in an increase in the collection rate for recycling to 17.9% from a
revised 2014 collection rate of 15.0%. Exports of PP bottles as part of mixed bales increased in 2015.
In addition to bottles, PP from injection molded closures was also recycled, but that amount is not part
of this report on bottles. For information on PP from injection molded closures, please refer to Moore
Recycling‟s Non-Bottle Rigid Plastic Recycling Annual Reports.
7
Copyright © 2016 American Chemistry Council and Association of Plastic Recyclers. All rights reserved.
2015 US National Postconsumer Plastic Bottle Recycling Rate Report
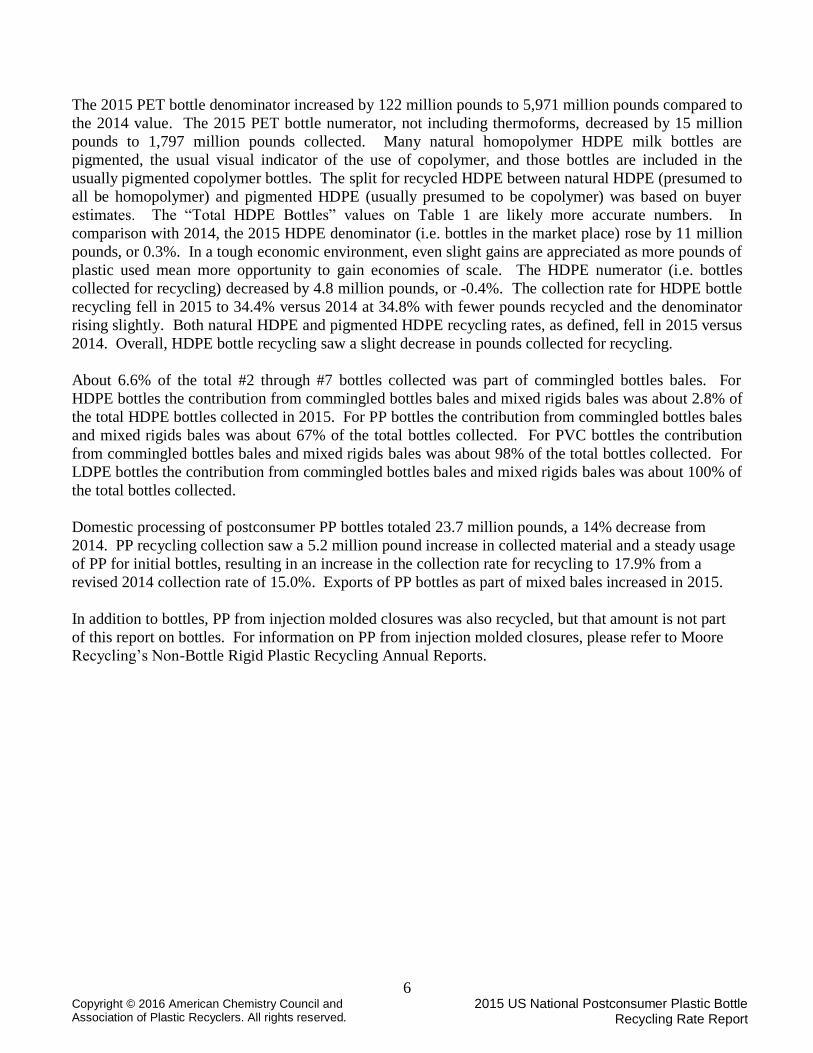
The total pounds of postconsumer bottles collected for recycling in 2015 was 2,977 million pounds for
#1 through #6 plastic bottles. The change from 2014 was a decrease of 14 million pounds of recycled
bottles, or a decrease of 0.5%. This happened with modest increase in plastic bottle resin usage and the
moderate real GDP growth of 2.4% for 2015.
Bottle Resin Sales
The denominator used to calculate the recycling rate is composed of both virgin resin and recycled resin
used for bottle making.
Plastic bottle light-weighting continued to occur for all bottle resins. Light-weighting helps companies
to meet economic and sustainability goals and is a relentless force in bottle making. Many HDPE bottle
applications are using product concentrates, which means an increasing number of smaller bottles, or
fewer bottles made for the total number of uses, such as laundry loads. Recycling is denominated by
weight and reduced weight per container adversely affects recycling economics. Reclaimers have
noticed a decrease in available bales of natural HDPE milk bottles, perhaps showing a shift in packaging
types.
8
Copyright © 2016 American Chemistry Council and Association of Plastic Recyclers. All rights reserved.
2015 US National Postconsumer Plastic Bottle Recycling Rate Report
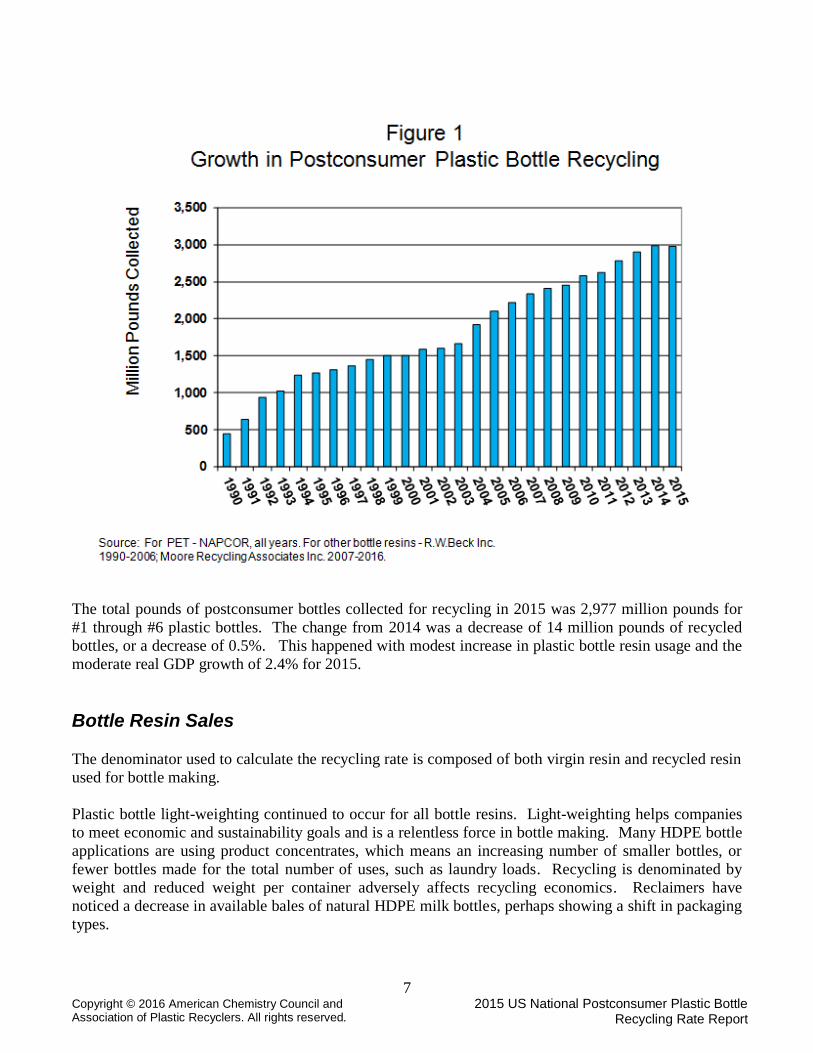
The change in total resins used to make bottles resulted in an increase of 148 million pounds, or an
increase in bottle polymer production of 1.6%. Use of HDPE to make bottles increased by 11 million
pounds, or 0.3%, up from the amount used in 2014, and almost back to the levels used in 2009 and
previous years. Use of PET to make bottles increased by 122 million pounds, or 2.1%, to an all-time
high. The 2015 use of 9,583 million pounds of #1-#6 resins for bottles is an all-time high.
It is vital for the growth of plastic bottle recycling that bottles are present in the marketplace and
consumers appropriately recycle used bottles. The pounds of material in bottles used by consumers
shown in Figure 2 include recycled content. Without available pounds of recycled material to be
industrial feedstock, plastics recycling may grow in recycling rate, but not in the tons needed for a
robust industry. Inability to secure wanted feedstocks has increased reclaimer interest in additional
resins and non-bottle items such as PET thermoforms.
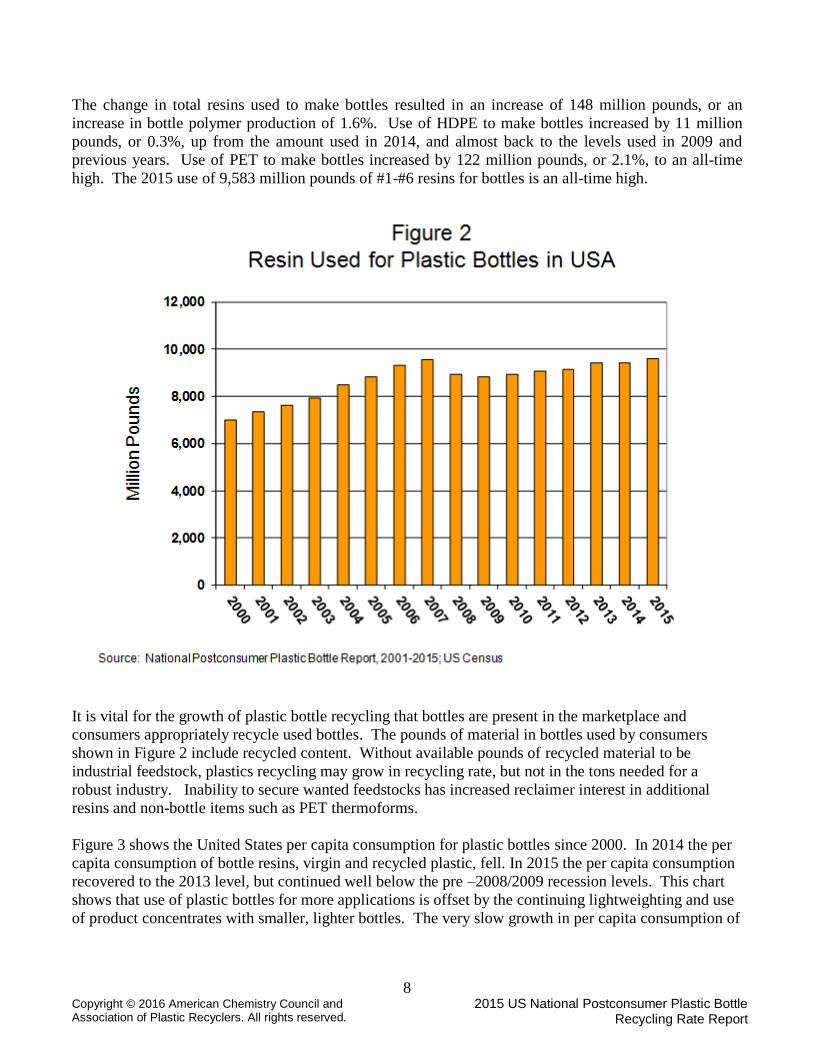
Figure 3 shows the United States per capita consumption for plastic bottles since 2000. In 2014 the per
capita consumption of bottle resins, virgin and recycled plastic, fell. In 2015 the per capita consumption
recovered to the 2013 level, but continued well below the pre –2008/2009 recession levels. This chart
shows that use of plastic bottles for more applications is offset by the continuing lightweighting and use
of product concentrates with smaller, lighter bottles. The very slow growth in per capita consumption of
9
Copyright © 2016 American Chemistry Council and Association of Plastic Recyclers. All rights reserved.
2015 US National Postconsumer Plastic Bottle Recycling Rate Report
plastics for bottles signals that growth in supply of bottles must come from more effective collection, not
just simple growth in the pool of bottles created.
PET and HDPE continued to dominate as selected resins to produce plastic bottles: 97.0% by weight of
produced bottles were made of PET or HDPE. PET and HDPE bottles also continued to dominate the
bottles collected for recycling, collectively at 98.8% and PP at 1.1% of the total bottles recycled.
10
Copyright © 2016 American Chemistry Council and Association of Plastic Recyclers. All rights reserved.
2015 US National Postconsumer Plastic Bottle Recycling Rate Report
Barriers to Increased Plastic Bottle Recycling
As noted for 2005 through 2014, one barrier to plastic bottle recycling is that too many consumers
continue to be unaware of the significant usefulness, demand, and value of recycled plastic including
HDPE and PET and PP. Data and experience show that plastic bottle recycling can be increased through
sustained local education campaigns. Municipalities also need to understand that they can benefit from
the sale of bales of bottles, including revenue sharing to fund educational programs and other costs of
collection.
Another barrier to increased recycling is lack of sufficient convenient access to recycling collection
opportunities for products used away from home. Consumers respond to additional opportunities to be
able to recycle such as at public venues, offices, recreational sites, schools, and retail establishments. In
a time of low commodity prices, which include plastic recyclables, MRF‟s that would process the entire
municipal waste stream for recyclables, not just a collected stream of recyclable packaging, are being
considered. This business model is still being refined.
11
Copyright © 2016 American Chemistry Council and Association of Plastic Recyclers. All rights reserved.
2015 US National Postconsumer Plastic Bottle Recycling Rate Report
The impact of fluctuating crude oil and natural gas byproduct prices made for a very tough competitive
market for postconsumer plastics in 2015. The lower cost of petroleum and petrochemicals impacted the
price of virgin plastics and that challenged the competitiveness of postconsumer plastic.
With the influence of four major factors: the increase in single stream collection of recyclables at
household residences, the increased interest to collect more than bottles, the overall reduced quantity of
export material, and the extreme economic pressure on the bale suppliers, the quality of available
postconsumer bottle material to U.S. reclaimers slumped slightly for HDPE. For PET with an increasing
variety of packaging applications, the quality of bales as reflected by bale yields, continued to be a
challenge. Use of the APR Design® Guide for Plastics Recyclability by packaging designers can help
reduce economic and technical barriers to plastic bottle recycling.
HDPE Reclamation Industry Update – Reclaimers’ Reporting
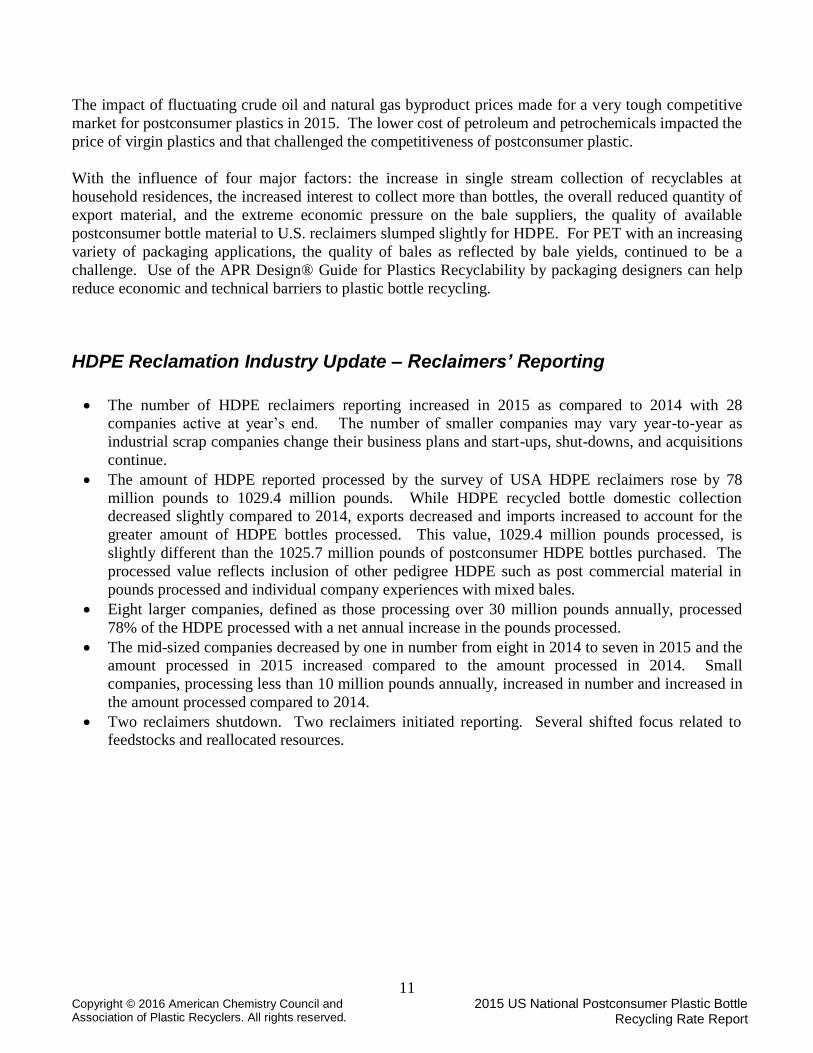
The number of HDPE reclaimers reporting increased in 2015 as compared to 2014 with 28 companies active at year‟s end. The number of smaller companies may vary year-to-year as
industrial scrap companies change their business plans and start-ups, shut-downs, and acquisitions
continue.
The amount of HDPE reported processed by the survey of USA HDPE reclaimers rose by 78
million pounds to 1029.4 million pounds. While HDPE recycled bottle domestic collection decreased slightly compared to 2014, exports decreased and imports increased to account for the
greater amount of HDPE bottles processed. This value, 1029.4 million pounds processed, is
slightly different than the 1025.7 million pounds of postconsumer HDPE bottles purchased. The
processed value reflects inclusion of other pedigree HDPE such as post commercial material in
pounds processed and individual company experiences with mixed bales.
Eight larger companies, defined as those processing over 30 million pounds annually, processed
78% of the HDPE processed with a net annual increase in the pounds processed.
The mid-sized companies decreased by one in number from eight in 2014 to seven in 2015 and the amount processed in 2015 increased compared to the amount processed in 2014. Small
companies, processing less than 10 million pounds annually, increased in number and increased in
the amount processed compared to 2014.
Two reclaimers shutdown. Two reclaimers initiated reporting. Several shifted focus related to feedstocks and reallocated resources.
12
Copyright © 2016 American Chemistry Council and Association of Plastic Recyclers. All rights reserved.
2015 US National Postconsumer Plastic Bottle Recycling Rate Report
13
Copyright © 2016 American Chemistry Council and Association of Plastic Recyclers. All rights reserved.
2015 US National Postconsumer Plastic Bottle Recycling Rate Report
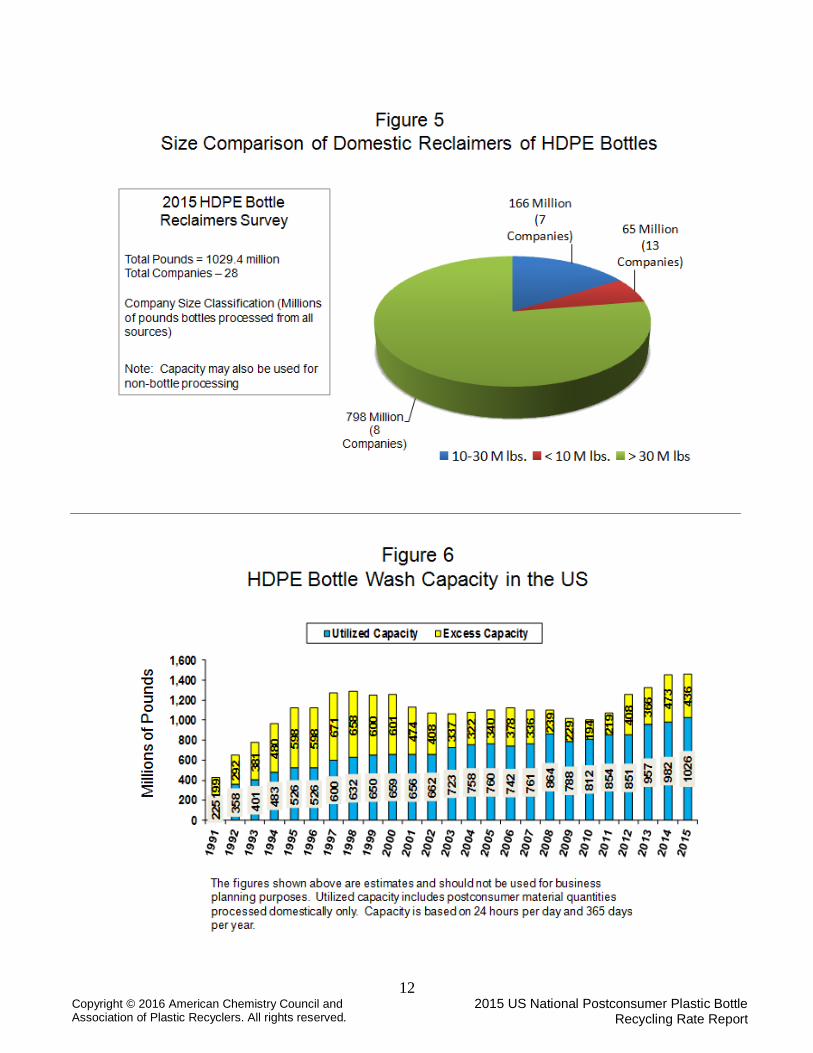
The capacity utilization is shown for the given conditions of hours worked. The capacity utilization, as
calculated, rose to 70% for 2015 as compared to 68% in 2014. Production capacity increased and more
production occurred with a net increase in utilization. The HDPE reclaimers continue to use assets to
process non-bottle postconsumer HDPE and PP from varying sources. The total utilized capacity rose in
2015 to 1,026 million pounds, compared to 982 million pounds in 2014. The overall USA industry
capacity, as calculated, increased to 1,461 million pounds of HDPE postconsumer reclamation capacity.
As reported, USA PET reclamation capacity utilization was about 58%, a reflection of less recycled
material being used in competitive markets and an increase in available capacity to process recycled
PET.
Export and Import Markets
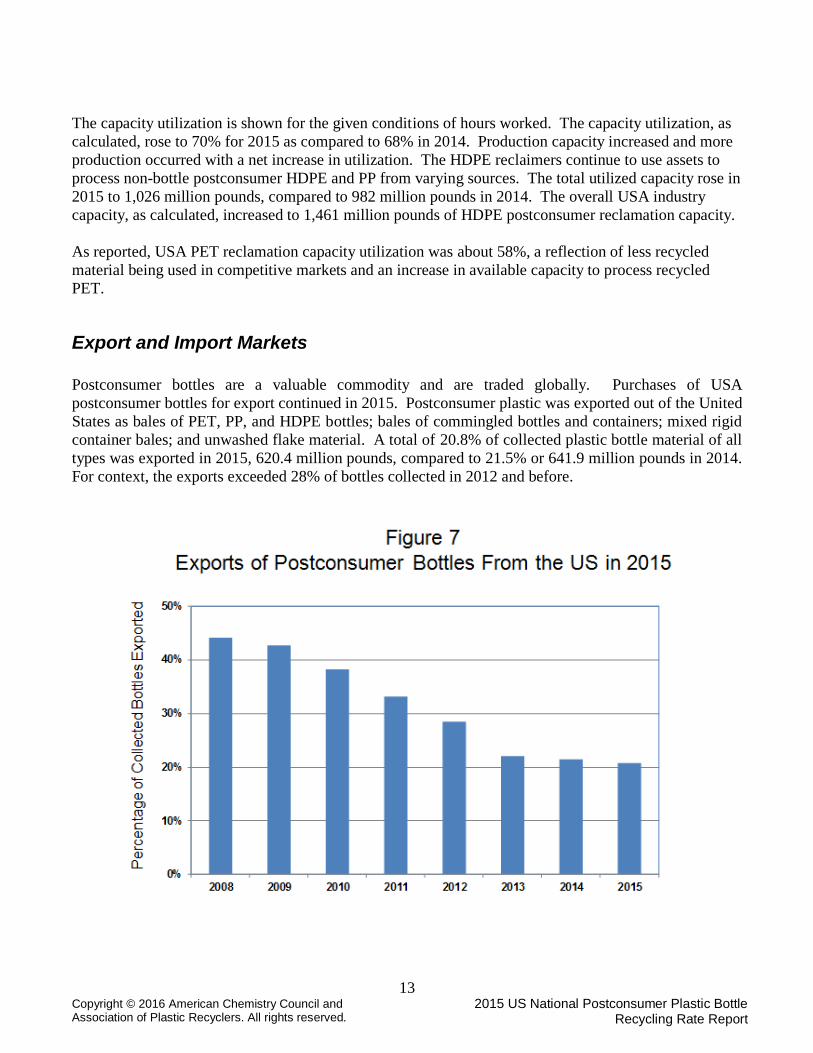
Postconsumer bottles are a valuable commodity and are traded globally. Purchases of USA
postconsumer bottles for export continued in 2015. Postconsumer plastic was exported out of the United
States as bales of PET, PP, and HDPE bottles; bales of commingled bottles and containers; mixed rigid
container bales; and unwashed flake material. A total of 20.8% of collected plastic bottle material of all
types was exported in 2015, 620.4 million pounds, compared to 21.5% or 641.9 million pounds in 2014.
For context, the exports exceeded 28% of bottles collected in 2012 and before.
14
Copyright © 2016 American Chemistry Council and Association of Plastic Recyclers. All rights reserved.
2015 US National Postconsumer Plastic Bottle Recycling Rate Report
For USA-collected HDPE bottle material, 184 million pounds were exported. This amount represented
16.1% of the total HDPE bottle material collected domestically, a decrease of 35 million pounds since
2014. Of those exported pounds, 34% went to Canada. The trade in bales is not one-sided. USA HDPE
reclaimers imported 66 million pounds in 2015, up from 52 million pounds of postconsumer HDPE
bottle bales imported in 2014. The imported pounds of postconsumer resin are not included in the totals
of pounds collected in the USA and are not part of the totals on Table 1.
2015 PET exports totaled 23.6% of the total PET bottles collected with most exports going to China and
Hong Kong. This percentage is more than the experience in 2014, when 22.9% of the USA-collected
PET was exported. The Chinese “Green Fence” initiative continued to slow imports into China of
postconsumer baled bottles in 2015 as the flow to Hong Kong stayed steady.
The exports for PP bottles rose in 2015 from 4.9 in 2014 to 8.9 million pounds, most as part of mixed
bales. The PP exports rose from 19% in 2014 to 28% in 2015 for bottle material. 61% of PVC bottles
were exported, a total of 0.66 million pounds. 89% of LDPE bottles were exported, a total of 2.9 million
pounds, mostly in bales of rigid containers. These quantity values reflect updated bale content analyses.
End Use Markets for Recycled Plastics in 2015
Per the annual survey of postconsumer reclaimers:
Natural HDPE postconsumer recycled resin‟s primary markets continued to be for non-food application bottles, such as for detergent, motor oil, household cleaners, etc. and for film.
Pigmented HDPE postconsumer recycled resin‟s markets continued to include pipe, lawn products, and non-food application bottles.
Plastic lumber continued to consume a broad range of materials including recycled HDPE, LDPE,
mixed rigid containers, and wide-specification virgin resin.
PET postconsumer resin retained its traditional markets for fiber, film and sheet, and food bottles. Fiber and sheet & film applications for recycled PET fell in 2015, particularly for fiber.
Competitive economics was the driving force for decreased recycled PET fiber usage in 2015. Use
of PET postconsumer resin for bottles held steady in 2015. The use of recycled PET for strapping
dropped significantly.
Postconsumer polypropylene bottles uses were not reported for 2015. Anecdotal reports suggest the uses were the same as reported in 2014: pallets, crates, and buckets.
15
Copyright © 2016 American Chemistry Council and Association of Plastic Recyclers. All rights reserved.
2015 US National Postconsumer Plastic Bottle Recycling Rate Report
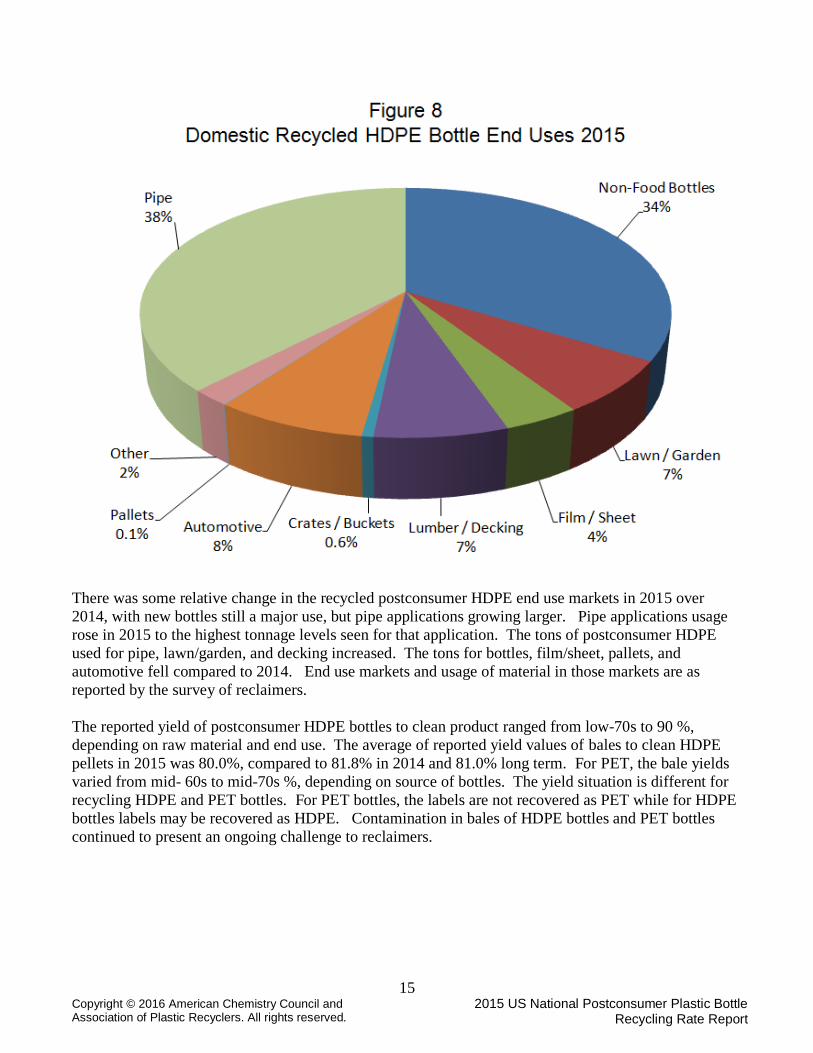
There was some relative change in the recycled postconsumer HDPE end use markets in 2015 over
2014, with new bottles still a major use, but pipe applications growing larger. Pipe applications usage
rose in 2015 to the highest tonnage levels seen for that application. The tons of postconsumer HDPE
used for pipe, lawn/garden, and decking increased. The tons for bottles, film/sheet, pallets, and
automotive fell compared to 2014. End use markets and usage of material in those markets are as
reported by the survey of reclaimers.
The reported yield of postconsumer HDPE bottles to clean product ranged from low-70s to 90 %,
depending on raw material and end use. The average of reported yield values of bales to clean HDPE
pellets in 2015 was 80.0%, compared to 81.8% in 2014 and 81.0% long term. For PET, the bale yields
varied from mid- 60s to mid-70s %, depending on source of bottles. The yield situation is different for
recycling HDPE and PET bottles. For PET bottles, the labels are not recovered as PET while for HDPE
bottles labels may be recovered as HDPE. Contamination in bales of HDPE bottles and PET bottles
continued to present an ongoing challenge to reclaimers.
16
Copyright © 2016 American Chemistry Council and Association of Plastic Recyclers. All rights reserved.
2015 US National Postconsumer Plastic Bottle Recycling Rate Report
Economic Impact
The estimated value of purchased bales of postconsumer bottles of PET and of HDPE in 2015 was
approximately 508 million dollars compared to 744 million dollars in 2014 due almost exclusively to
low prices for bales.
Additional Information
The Association of Plastic Recyclers (APR) is The Voice of Plastics Recycling®. As the international
trade association representing the plastics recycling industry, membership includes independent
recycling companies of all sizes, processing numerous resins, as well as consumer product companies,
equipment manufacturers, testing laboratories, organizations, and others committed to the success of
plastics recycling. APR advocates the recycling of all plastics. Visit www.PlasticsRecycling.org for
more information.
The American Chemistry Council’s (ACC) Plastics Division represents the leading U.S.
manufacturers of plastic resins. ACC offers resources to communities that wish to increase
postconsumer plastic collection, including some targeted specifically at bottles and rigid plastics, as well
as others focusing on plastic films, bags and wraps, and applications such as mattresses that are outside
the scope of this Report. Details on the highly successful All Plastic Bottle collection programs can be
found at www.allplasticbottles.org. A database for the recycling of clean plastic film and grocery/retail
bags is provided at www.plasticfilmrecycling.org. Additional resources on plastic recycling can be
found at www.recycleyourplastics.org.
Moore Recycling Associates Inc., supported by ACC, APR, J store front, and Resource Recycling,
manages www.plasticsmarkets.org, a database of buyers and sellers of recycled plastic, open to all
market participants. The website also provides other useful information, such as historical scrap prices
and guidance for handling and bailing guidelines.
NAPCOR provides additional information about PET at its website, www.napcor.com.
Legal Notice The 2015 United States National Post Consumer Plastics Bottle Recycling Report has been prepared to
provide helpful ideas and information for parties interested in recycling plastics. Facilities developing a
recycling process and all entities involved in the chain of collection, processing, distribution, and sale of
recycled products have an independent obligation to ascertain that their plans, actions, and practices
meet all relevant laws and represent sound business practices for their particular operations. Facilities
may vary their approach with respect to particular operations, products, or locations based on specific
factual circumstances, the practicality and effectiveness of particular actions and economic and
technological feasibilities. This report is not designed or intended to define or create legal rights or
obligations. Although the information contained in this document has been produced and processed
from sources believed to be reliable, no warranty expressed or implied is made regarding the accuracy,
adequacy, completeness, legality, reliability or usefulness of any information, and this information is
provided on an "as is" basis. NO WARRANTIES ARE GIVEN; ALL IMPLIED WARRANTIES
OF MERCHANTABILITY OR FITNESS FOR A PARTICULAR PURPOSE ARE EXPRESSLY
17
Copyright © 2016 American Chemistry Council and Association of Plastic Recyclers. All rights reserved.
2015 US National Postconsumer Plastic Bottle Recycling Rate Report
EXCLUDED. Neither ACC nor APR assumes any liability of any kind whatsoever resulting from the
use of or reliance upon any information, conclusions, or options contained herein.
The Association of Plastic Recyclers and the Plastics Division of the American Chemistry Council
produced this report.
The United States National Postconsumer Plastics Bottle Recycling Report is published by the
Association of Plastic Recyclers and the Plastics Division of the American Chemistry Council.
Recommended