2016
CARE HOMES TRADING PERFORMANCE REVIEW
HIGHLIGHTSOccupancy rates edge up to 88.4% and average weekly fees rise to £694
Staff costs continue to increase and now consume 58.2% of income
EBITDARM rises for the first time in four years, to stand at 27.5% of income
RESEARCH
32
2015/16 RESULTS AT A GLANCE
OCCUPANCY AND FEESThe care home occupancy rate edged up during FY 2015/16, to 88.4%.
2013/14 RESULTS AT A GLANCEAll care LFL annual
changePersonal
careLFL annual
changeCare with nursing
LFL annual change
Occupancy 87.6% 91.2% 86.6%
Average Weekly Fees £660 £566 £688
Staff Costs (% of income) 56.9% 55.1% 57.3%
EBITDARM (% income) 27.5% 29.2% 27.1%
Source: Knight Frank
OCCUPANCY AVERAGE WEEKLYFEES
STAFF COSTS(% OF INCOME)
EBITDARM(% INCOME)
ALL CARE PERSONAL NURSING
87.6% 91.2% 86.6% £660 £566 £688 56.9% 55.1% 57.3% 27.5% 29.2% 27.1%
ALL CARE PERSONAL NURSING ALL CARE PERSONAL NURSING ALL CARE PERSONAL NURSING
LFL ANNUAL CHANGE
OCCUPANCY AVERAGE WEEKLYFEES
STAFF COSTS(% OF INCOME)
EBITDARM(% INCOME)
ALL CARE PERSONAL NURSING
87.6% 91.2% 86.6% £660 £566 £688 56.9% 55.1% 57.3% 27.5% 29.2% 27.1%
ALL CARE PERSONAL NURSING ALL CARE PERSONAL NURSING ALL CARE PERSONAL NURSING
LFL ANNUAL CHANGE
OCCUPANCY AVERAGE WEEKLYFEES
STAFF COSTS(% OF INCOME)
EBITDARM(% INCOME)
ALL CARE PERSONAL NURSING
88.4% 90.7% 87.7% £694 £600 £726 58.2% 52.3% 59.5% 27.5% 32.3% 26.4%
ALL CARE PERSONAL NURSING ALL CARE PERSONAL NURSING ALL CARE PERSONAL NURSING
PMS 2995
PMS 3015
PMS 258
PMS 5205
PMS 452
Source: Knight Frank Research
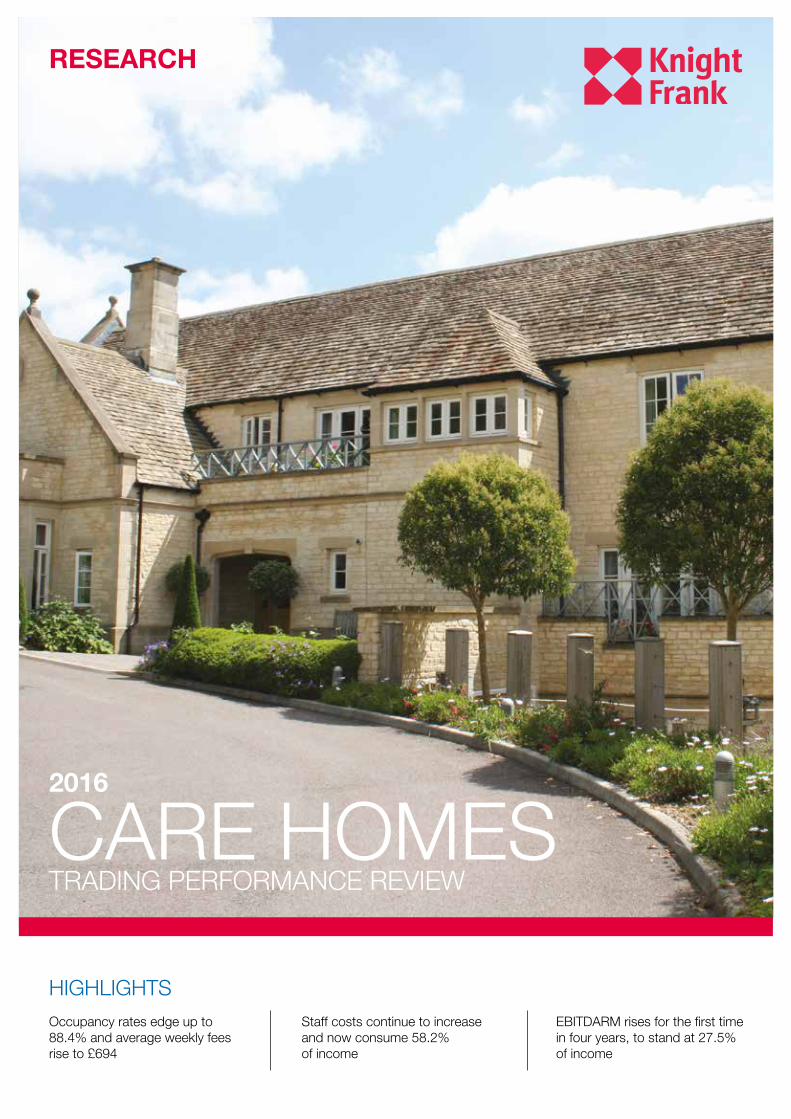
OccupancyOccupancy rates continued to increase in the financial year 2015/16. Whilst there was only a marginal uplift from 88.3% , the latest figure of 88.4% marks the fifth consecutive year of growing occupancy and the highest rate since 2008 as shown in figure 3. Throughout the history of the dataset, occupancy levels sit within the 87% to 90% range suggesting a degree of equilibrium taking into account the natural level of vacancy from turnover of residents.
Regional disaggregation of occupancy rates shows a range between 86.2% and 92.1% very similar to the range over time for the wider UK market, reinforcing current equilibrium levels (figure 4). Northern Ireland has the highest occupancy level of 92.1%, some way above Scotland at 90.4%. The North West is the only other region to stand out above the national average with occupancy at 89.5%. Occupancy in Greater London has fallen since last year’s reporting where it topped the regional league, falling from 90.2% to 88.8%. At the other end of the table the two regions with the lowest occupancy match last year with the South West &
North East delivering occupancy rates of 86.3% and 86.2% respectively. Positive news for these regions is that both had sizeable increases over their 2014/15 rates of 85.0% and 83.8% as the spread between regions has fallen.
Occupancy rates in personal care homes are consistently higher than those in nursing care homes, across all regions, driven by demand for modern facilities provided by privately funded personal care homes. Nationally, personal care home occupancy stands at 90.7% compared to 87.7% for nursing homes. Regionally, occupancy in nursing homes ranges from 84.8% in the North East to 92.0% in Northern Ireland, personal care occupancy ranges from 86.6% in the South West to 95.4% in Northern Ireland.
With demographic projections showing a steady rise in life expectancy and population aged over 80, long term demand trends suggest upward pressure on occupancy at current supply and development rates. United Nations projections predict UK life expectancy will rise from 80.4 years in 2013 to 81.2 years in 2018 before hitting 82.0 years in
Source: Knight Frank Research
FIGURE 4
Occupancy rates by region (FY 2015/16)
Source: Knight Frank Research
FIGURE 3
UK care home occupancy rate %
2014
2016
2015
2013
2012
2011
2010
2009
2008
2007
2006
85%
86%
87%
88%
89%
90%
80%
82%
84%
86%
88%
90%
92%
94%
No
rthe
rn Ir
elan
d
Sco
tland
No
rth
Wes
t
Gre
ater
Lo
ndo
n
Wal
es
Wes
t M
idla
nds
Eas
t
Eas
t M
idla
nds
So
uth
Eas
t
York
s &
Hum
ber
So
uth
Wes
t
No
rth
Eas
t
All UK
CARE HOMES TRADING PERFORMANCE REVIEW RESEARCH
EAST 11%EAST MIDLANDS 7%GREATER LONDON 8%NORTH EAST 7%NORTH WEST 14%NORTHERN IRELAND 4%SCOTLAND 11%SOUTH EAST 12%SOUTH WEST 7%WALES 3%WEST MIDLANDS 8%YORKS & HUMBER 9%
FY 2015/16 SHARE OF BEDS
FIGURE 1
Regional share of the sample % of total care beds
Source: Knight Frank Research
FIGURE 2
Share of the sample by size % of total care beds
1-39 40-59 60-79NUMBER OF BEDS
80-99 100+
18% 40% 26% 9% 6%
FOREWORD
Knight Frank is pleased to introduce the fifth annual review of trading performance in the UK care home sector.
Over the five years that we have been analysing the rich datasets kindly provided by leading care home operators, we have learnt a lot about the key metrics used in the industry and about the depth of analysis which can be carried out.
The Care Homes Trading Performance Index provides industry-leading benchmarks on occupancy rates, levels of private and publicly-funded income, average weekly fees, costs such as staff and agency outlays, and profitability.
As figures 1 & 2 show, the distribution of homes in our sample is geographically diverse and covers a range of sizes from care homes with fewer than 40 beds to those with more than 100 beds. This allows for some interesting regional analysis as well as the ability to look at the variation of performance by size, type of care and combinations of these.
Headline results show that for the 2015/16 financial year occupancy rates edged marginally higher and average fee levels outstripped RPI inflation for the third consecutive year. Issues with rising staff costs which we highlighted in last year’s report have continued, with labour costs increasing again both in absolute terms and as a percentage of income. Staffing seems to be the biggest and most uncertain issue facing the industry with the introduction of the National Living Wage and uncertainty on freedom of movement of labour within the EU following the referendum.
The main headline however is that increased costs are offset by the higher income, leading to an uptick in profitability across the sector. Annual profit levels have grown for only the second time in the nine years of historical data which we have compiled. This is clearly a welcome result for operators battling in these challenging times.
We aim to increase our analytical capabilities in relation to the healthcare sector over the coming months so look out for more insightful analysis in the future along with the ability to look at long-term trends when we interrogate a decade long time-series in the next edition of this report.
Dr Lee Elliott Head of Commercial Research
Nursing careCare home withprofessionally qualifiednursing staff
Personal careResidential care homewith non-professionallyqualified care staff
Extra careRetirement housing, whereresidents live independentlywith care services attachedas required
Domiciliary careCare provided at theresident’s own home
ELDERLY CARE
CARE FACILITY
AT HOME
ELDERLY CARE PROVISION
This report assesses care facilities with a bias towards nursing homes in our sample. Note that many facilities provide both nursing care and personal care on-site,
and these fall under Nursing in our analysis
4
Source: Knight Frank Research
FIGURE 5
Average weekly fees £ per week
Source: Knight Frank Research
FIGURE 6
Average weekly fees by region (FY 2015/16) £ per week
£400
£450
£500
£550
£600
£650
£700
£750
£800
£850
£900
PERSONAL CARE
NURSING
Sou
th E
ast
Gre
ater
Lon
don
Sou
th W
est
Wes
t Mid
land
s
East
Sco
tland
East
Mid
land
s
Wal
es
York
s &
Hum
ber
Nor
th W
est
Nor
ther
n Ire
land
Nor
th E
ast
2023 and 82.8 years by 2028. This drives forecast population growth for those over 80 from 3.0 million in 2015 to 3.3 million in 2020, and 5.0 million by 2035.
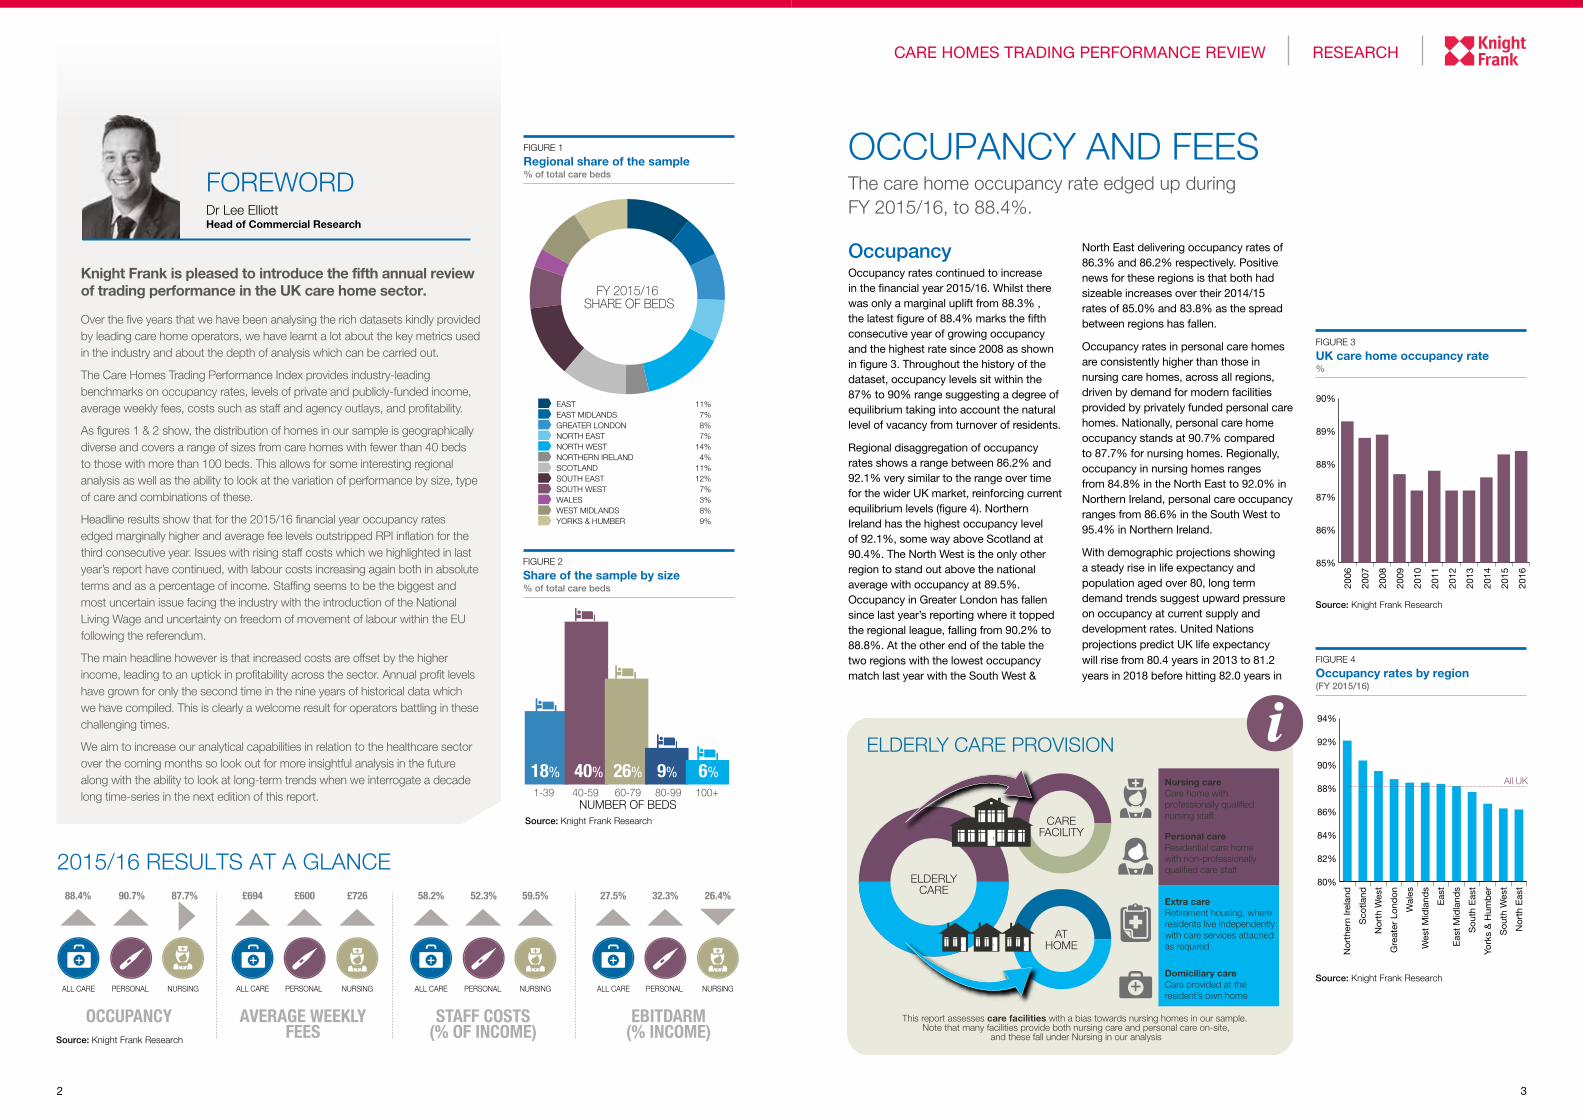
Average weekly feesAverage weekly fees for care homes rose in the last financial year from £675 to £694, a growth rate of 2.7%, picking up pace from 2.3% the year prior, and marking the fifth consecutive year of growth and another all-time high (figure 5). In real terms average weekly fees have been rising since 2012/13 and have now surpassed their 2006/7 levels, the start date for the historical dataset.
This is the first time this level has been breached since 2009/10 as fees have outstripped the low levels of inflation of the last couple of years. Current fee levels are significantly higher for nursing care where staff costs are augmented by the higher qualification levels required by staff. Growth rates in average weekly fees were higher for nursing care than for personal care, a reversal of the recent trend. This may be explained by higher wage growth for the more highly qualified nursing staff as labour markets became tighter in an environment where national unemployment dropped below 5%.
As shown in figure 6, analysis by type and region shows the most lucrative average fees of £897 are made in nursing homes situated in the South East, a product of higher property & labour costs in the region coupled with high levels of demand and a more affluent population. London also has high nursing home fees in relation to other parts of the UK, at £856.
The demand driver for higher fees is evident in the levels of income coming from self-funding clients. In the South East for example, where there is the largest pool of
affluent people, 51.2% of income is derived from private revenue. The North East by contrast sees only 19.5% of income from self-funding clients.
The range of average weekly fees is much greater than that of occupancy rates with those in nursing care running from the £897 in the South East to £566 in the North East. For personal care the range is tighter but still spread from £727 in the South East to £530 in Northern Ireland. The premium paid for nursing over personal care ranges between 11% and 21% across all regions other than the North East where nursing only offers 4% higher fees for operators.
The reasons behind this are likely to be very low levels of private funding for residents. Nursing care relies on NHS & local authority funding for 64% of income which contrasts to personal care where private funding is just over 50%. By region and type this reliance on government funding is least evident for personal care in the South West with 78.5% of income coming from private individuals driven by demand from wealthier individuals to be resident in some of the most desirable locations in the UK.
The evidence available in the six months since the end of the financial year suggests that income has increased from the data we are able to analyse to end-March 2016. Initial analysis suggests local authority income has increased by around 4-5% in the latest financial year. Additionally the increase in NHS income from funded nursing care will also feed through to higher income. Whilst only an interim measure, the independent review of the rate paid by the NHS to nursing homes, has led to a rise from £112.00 per week to £156.25, a 40% increase. The government accepted the recommendations and back-dated the rise to April 1st which will add a step change to income from the previous to the current financial year.
As the demand driver of average weekly fees is a combination of residents’ affluence and government income, the future is reliant on the outcome of government health policy, and the capital pots of potential residents. The former is likely to be impacted by the political and economic uncertainty surrounding the UK’s negotiations to leave the EU, though changes to health spending may benefit. The latter may be impacted by the future of the residential property market as many people sell their homes to use the capital for residential care.
AVERAGE WEEKLY FEES
Personal Care £600 2.2%
Care with Nursing £726 3.9%
All Care Homes £694 2.8%
1.6%RPI inflation (FY 2015/16)
ANNUALCHANGE (LFL)
AVERAGEWEEKLY FEE
£400
£450
£500
£550
£600
£650
£700
ACTUALREAL TERMS (2006 PRICES)
2015
/16
2014
/15
2013
/14
2012
/13
2011
/12
2010
/11
2009
/10
2008
/09
2007
/08
2006
/07
CARE HOMES TRADING PERFORMANCE REVIEW RESEARCH
5
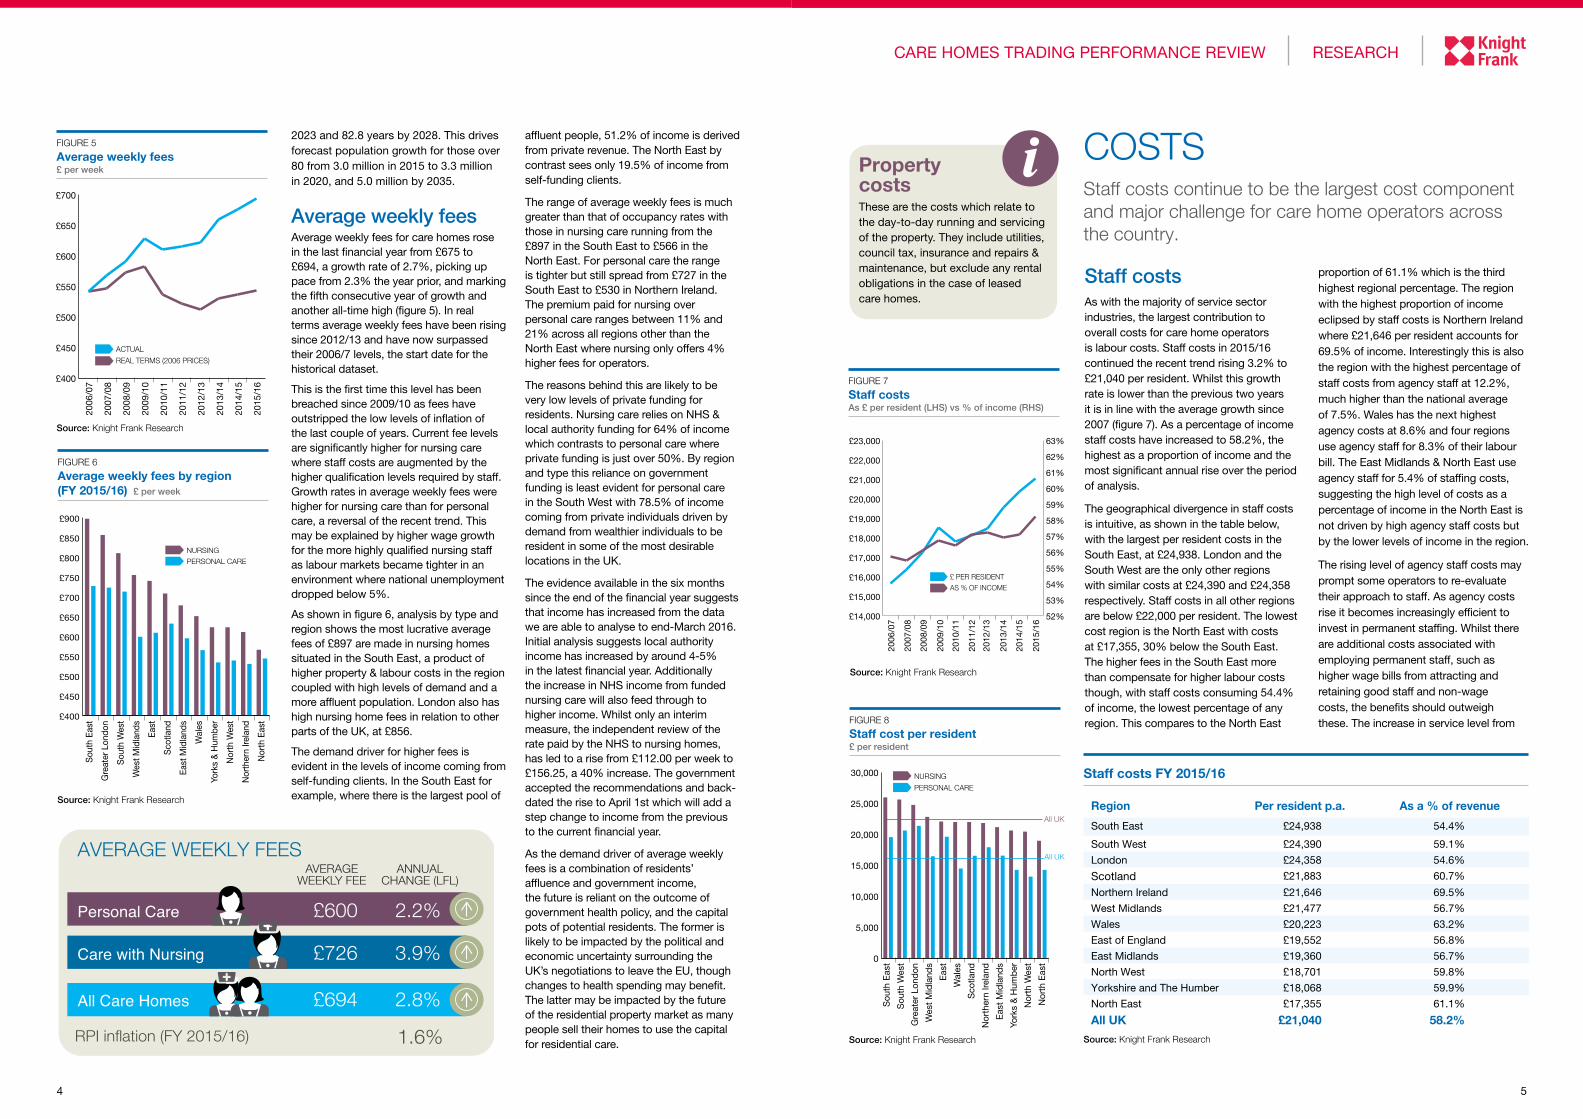
Staff costs FY 2015/16
Region Per resident p.a. As a % of revenue
South East £24,938 54.4%
South West £24,390 59.1%
London £24,358 54.6%
Scotland £21,883 60.7%
Northern Ireland £21,646 69.5%
West Midlands £21,477 56.7%
Wales £20,223 63.2%
East of England £19,552 56.8%
East Midlands £19,360 56.7%
North West £18,701 59.8%
Yorkshire and The Humber £18,068 59.9%
North East £17,355 61.1%
All UK £21,040 58.2%
COSTSStaff costs continue to be the largest cost component and major challenge for care home operators across the country.
Staff costsAs with the majority of service sector industries, the largest contribution to overall costs for care home operators is labour costs. Staff costs in 2015/16 continued the recent trend rising 3.2% to £21,040 per resident. Whilst this growth rate is lower than the previous two years it is in line with the average growth since 2007 (figure 7). As a percentage of income staff costs have increased to 58.2%, the highest as a proportion of income and the most significant annual rise over the period of analysis.
The geographical divergence in staff costs is intuitive, as shown in the table below, with the largest per resident costs in the South East, at £24,938. London and the South West are the only other regions with similar costs at £24,390 and £24,358 respectively. Staff costs in all other regions are below £22,000 per resident. The lowest cost region is the North East with costs at £17,355, 30% below the South East. The higher fees in the South East more than compensate for higher labour costs though, with staff costs consuming 54.4% of income, the lowest percentage of any region. This compares to the North East
proportion of 61.1% which is the third highest regional percentage. The region with the highest proportion of income eclipsed by staff costs is Northern Ireland where £21,646 per resident accounts for 69.5% of income. Interestingly this is also the region with the highest percentage of staff costs from agency staff at 12.2%, much higher than the national average of 7.5%. Wales has the next highest agency costs at 8.6% and four regions use agency staff for 8.3% of their labour bill. The East Midlands & North East use agency staff for 5.4% of staffing costs, suggesting the high level of costs as a percentage of income in the North East is not driven by high agency staff costs but by the lower levels of income in the region.
The rising level of agency staff costs may prompt some operators to re-evaluate their approach to staff. As agency costs rise it becomes increasingly efficient to invest in permanent staffing. Whilst there are additional costs associated with employing permanent staff, such as higher wage bills from attracting and retaining good staff and non-wage costs, the benefits should outweigh these. The increase in service level from
Source: Knight Frank Research
Source: Knight Frank Research
FIGURE 7
Staff costs As £ per resident (LHS) vs % of income (RHS)
£14,000
£15,000
£16,000
£17,000
£18,000
£19,000
£20,000
£21,000
£22,000
£23,000
2015
/16
2014
/15
2013
/14
2012
/13
2011
/12
2010
/11
2009
/10
2008
/09
2007
/08
2006
/07
£ PER RESIDENTAS % OF INCOME
52%
53%
54%
55%
56%
57%
58%
59%
60%
61%
62%
63%
0
5,000
10,000
15,000
20,000
25,000
30,000
PERSONAL CARE
NURSING
Sou
th E
ast
Sou
th W
est
Gre
ater
Lon
don
Wes
t M
idla
nds
Eas
t
Wal
es
Sco
tland
Nor
ther
n Ire
land
Eas
t M
idla
nds
York
s &
Hum
ber
Nor
th W
est
Nor
th E
ast
All UK
All UK
Source: Knight Frank Research
FIGURE 8
Staff cost per resident £ per resident
Property costsThese are the costs which relate to the day-to-day running and servicing of the property. They include utilities, council tax, insurance and repairs & maintenance, but exclude any rental obligations in the case of leased care homes.
76
low staff turnover should allow for fee rises over time, particularly in affluent areas, and the reputational risk to an operator should reduce as staff engagement and loyalty produce better results.
It is important to note the analysis period ends 31st March 2016 and thus does not include the impact from implementation of the National Living Wage on 1st April 2016 which increased minimum hourly wages from £6.70 to £7.20 for workers aged 25 or above. This 7.5% increase for lower paid staff will impact staff cost increases next year and years to come if the government sticks to its existing future rises.
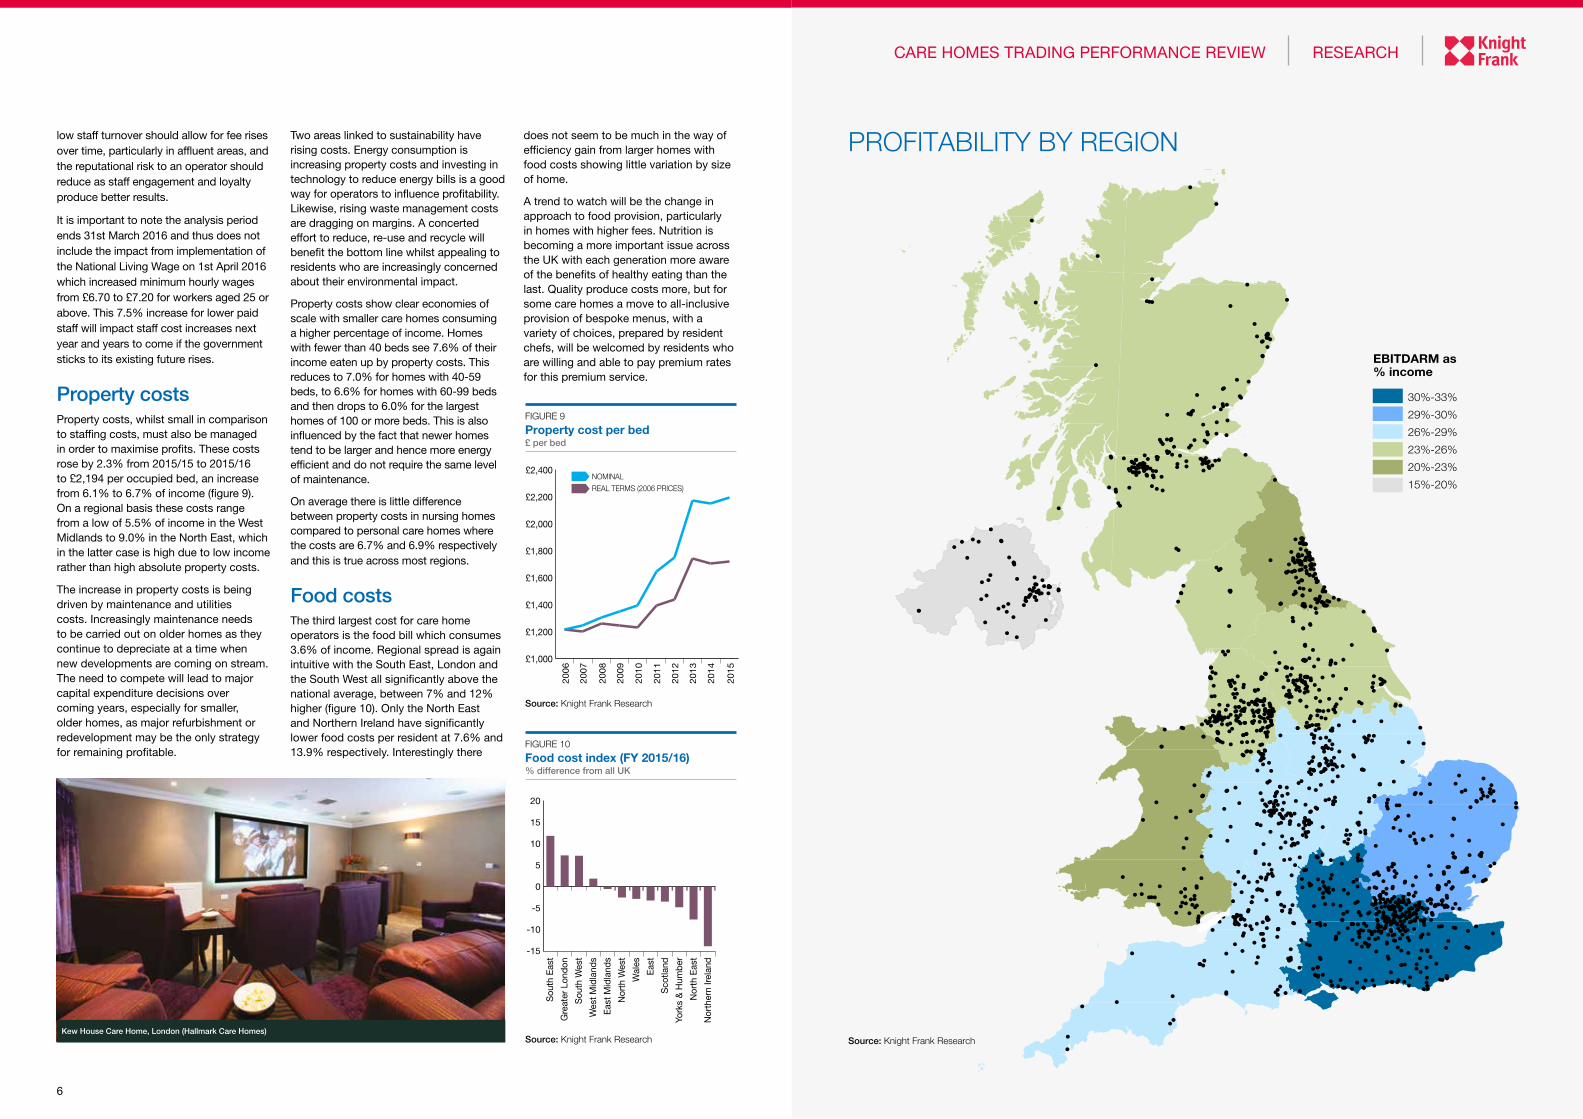
Property costsProperty costs, whilst small in comparison to staffing costs, must also be managed in order to maximise profits. These costs rose by 2.3% from 2015/15 to 2015/16 to £2,194 per occupied bed, an increase from 6.1% to 6.7% of income (figure 9). On a regional basis these costs range from a low of 5.5% of income in the West Midlands to 9.0% in the North East, which in the latter case is high due to low income rather than high absolute property costs.
The increase in property costs is being driven by maintenance and utilities costs. Increasingly maintenance needs to be carried out on older homes as they continue to depreciate at a time when new developments are coming on stream. The need to compete will lead to major capital expenditure decisions over coming years, especially for smaller, older homes, as major refurbishment or redevelopment may be the only strategy for remaining profitable.
Two areas linked to sustainability have rising costs. Energy consumption is increasing property costs and investing in technology to reduce energy bills is a good way for operators to influence profitability. Likewise, rising waste management costs are dragging on margins. A concerted effort to reduce, re-use and recycle will benefit the bottom line whilst appealing to residents who are increasingly concerned about their environmental impact.
Property costs show clear economies of scale with smaller care homes consuming a higher percentage of income. Homes with fewer than 40 beds see 7.6% of their income eaten up by property costs. This reduces to 7.0% for homes with 40-59 beds, to 6.6% for homes with 60-99 beds and then drops to 6.0% for the largest homes of 100 or more beds. This is also influenced by the fact that newer homes tend to be larger and hence more energy efficient and do not require the same level of maintenance.
On average there is little difference between property costs in nursing homes compared to personal care homes where the costs are 6.7% and 6.9% respectively and this is true across most regions.
Food costsThe third largest cost for care home operators is the food bill which consumes 3.6% of income. Regional spread is again intuitive with the South East, London and the South West all significantly above the national average, between 7% and 12% higher (figure 10). Only the North East and Northern Ireland have significantly lower food costs per resident at 7.6% and 13.9% respectively. Interestingly there
Source: Knight Frank Research
FIGURE 9
Property cost per bed £ per bed
£1,000
£1,200
£1,400
£1,600
£1,800
£2,000
£2,200
£2,400
2014
2015
2013
2012
2011
2010
2009
2008
2007
2006
NOMINALREAL TERMS (2006 PRICES)
Source: Knight Frank Research
FIGURE 10
Food cost index (FY 2015/16) % difference from all UK
-15
-10
-5
0
5
10
15
20
Sou
th E
ast
Gre
ater
Lon
don
Sou
th W
est
Wes
t Mid
land
s
Eas
t Mid
land
s
Nor
th W
est
Wal
es
Eas
t
Sco
tland
York
s &
Hum
ber
Nor
th E
ast
Nor
ther
n Ire
land
Kew House Care Home, London (Hallmark Care Homes)
CARE HOMES TRADING PERFORMANCE REVIEW RESEARCH
does not seem to be much in the way of efficiency gain from larger homes with food costs showing little variation by size of home.
A trend to watch will be the change in approach to food provision, particularly in homes with higher fees. Nutrition is becoming a more important issue across the UK with each generation more aware of the benefits of healthy eating than the last. Quality produce costs more, but for some care homes a move to all-inclusive provision of bespoke menus, with a variety of choices, prepared by resident chefs, will be welcomed by residents who are willing and able to pay premium rates for this premium service.
!(
!
!
!!
!!
! !! !!! !! !!! !!! !! ! !!!!!! !! !! !! ! ! ! !! ! !! !!! !!! !!
! !!! !!! !!!! !!! !!! !! !!! !! ! !! !! !! !!
!! !! !! !! !! !!! !! !!! ! !! ! ! !!! ! ! !! !!! ! !!! !! !! !! ! !!! ! !! !! ! ! !! !!! ! !! ! !!!! ! !! !!! !!!!! !!! !!! !! !! !! ! !! !! !!!! !! !! !! ! !! !! ! !! !! !! !! !!! !!! !! !! ! ! !! !!! ! !! !! ! !! !! !!!! !! !! ! !! !! !!! !!!!! !! ! !! ! !! !! ! ! !! !! !! !! !! !!! ! !! !!! !!!!! !! !!! !! !!! ! ! ! ! !!! !! ! !! !! !! !! !!! !! ! !!! !! !!! !!!! !! ! !! !!!!! !!!!! !! ! !! !!!!! ! !!!! ! ! !!! ! !!!!! ! !! !! ! !!! ! ! !!!!! !!!!! !! !!! !!! !! !!!! !!! !!! !! !!!! !! !! !! ! !! !! !!! !!! !!! ! !!! ! !!!!! !!! ! !! !!! ! ! !!! !!! !! !! ! ! !!!!! ! ! !! !!! !! ! !! ! ! !! !! !!! !! !! !! !! ! !! !!! !! ! ! !!! ! !! !!! !! ! !! !!! !!! !! !! !!! ! !!! !! ! ! !! !!!! ! ! !!!! !!! !! !! ! !!! !!!! !!!! !! ! !!! !! !! !!! !!! !! ! !! !! !! !! !!!!! !!!! !!! ! !! !! !!! ! !! !!!! ! !!!!! !!!! ! !!! !!! !! !! !!!!!! !! !!!! !!! !! ! !!!! !!! !! !! !! !!! !! !!! !! !!!! ! !!!! !! !! !! !!! ! ! !! !! !! !!! !! !! !!!! !!! !!!!! ! ! !! ! !!! !! ! !!! !!!! !! !! !! !!!! !!! !
!!! !!! !! !! !!! ! !! ! !!!! !! ! !! ! !! !!! !!!!! !! !!! !!!! !! !! ! !! !! !!!!!!!! ! !! !! !!!!!!! !!! !! !!! ! !!! !! ! !!!! !!! !! !!! ! !!!! ! !!!!! ! !!!!! !!! ! ! !!!!! !! ! ! !! !!! !!! !!! !!! !! !!! !!!!!! ! !!! !!! !! !! ! !! !!!!! ! !! !! ! !!! !! !!! ! ! !!! !!!!!! ! !!! !! !! ! !!! !!! ! !!!!! ! !! !!!!! !! !!! !! !! !! !!!!! ! !!!! !! ! !! !!! !!! ! !!!!! ! ! ! !!! !!! !! !!!! !!! !! !!! !!!! !!! !!! ! ! !!! !!!!! !!!!!!!! !!!! !!! !!!! !! !!!!! !! !!! !! !! !! !!! !! ! !! !!! !!!!! !! !!! !! !!! !! ! !!!! !!!! ! !! !!!!!!!!
! !! !!!! ! ! !!! !!! !!!!! !!!! !!! !!
!! !!
!! !!
! !!! !!! !!! !!
!! !!! ! !!! !!! !!! !!! !!!! !!! !!!! !!! ! !! ! !! !!!! !!! ! !!! !!! !!! ! !! !!! !!! ! !!!!! !! !!! ! !! ! !!! ! !!!!!! !!!! !!! !!!!!! !! !!!! !! !! !!!! !! ! !!!! ! !!!! !! !!!! !! ! !!! !!! !!!! !! ! !!!!! !!!! !! ! !! !!!!!!!! !! !!!!!!!!!!!! ! !! !! ! !!!
!
!!!
! !! !!! !
!! !! !!! !
! !!! !! !! !! !! !!! !!! !! ! !! !!! !!! !!!!!! !!!!! !!!!! !!!! !! !!! !!! !! !! !!! !! !!!!!!! !! !! !! !!! !!
!!! !!
!! !
! !!!!
!! !!!
!!!
!!
!!
!
!!
!!!
!!!! !!!!
!
!! !!! !
!!
!
!
!
!
Subject Property
30%-33%
29%-30%
26%-29%
23%-26%
20%-23%
15%-20%
EBITDARM as% income
PROFITABILITY BY REGION
Source: Knight Frank Research
98
CARE HOMES TRADING PERFORMANCE REVIEW RESEARCH
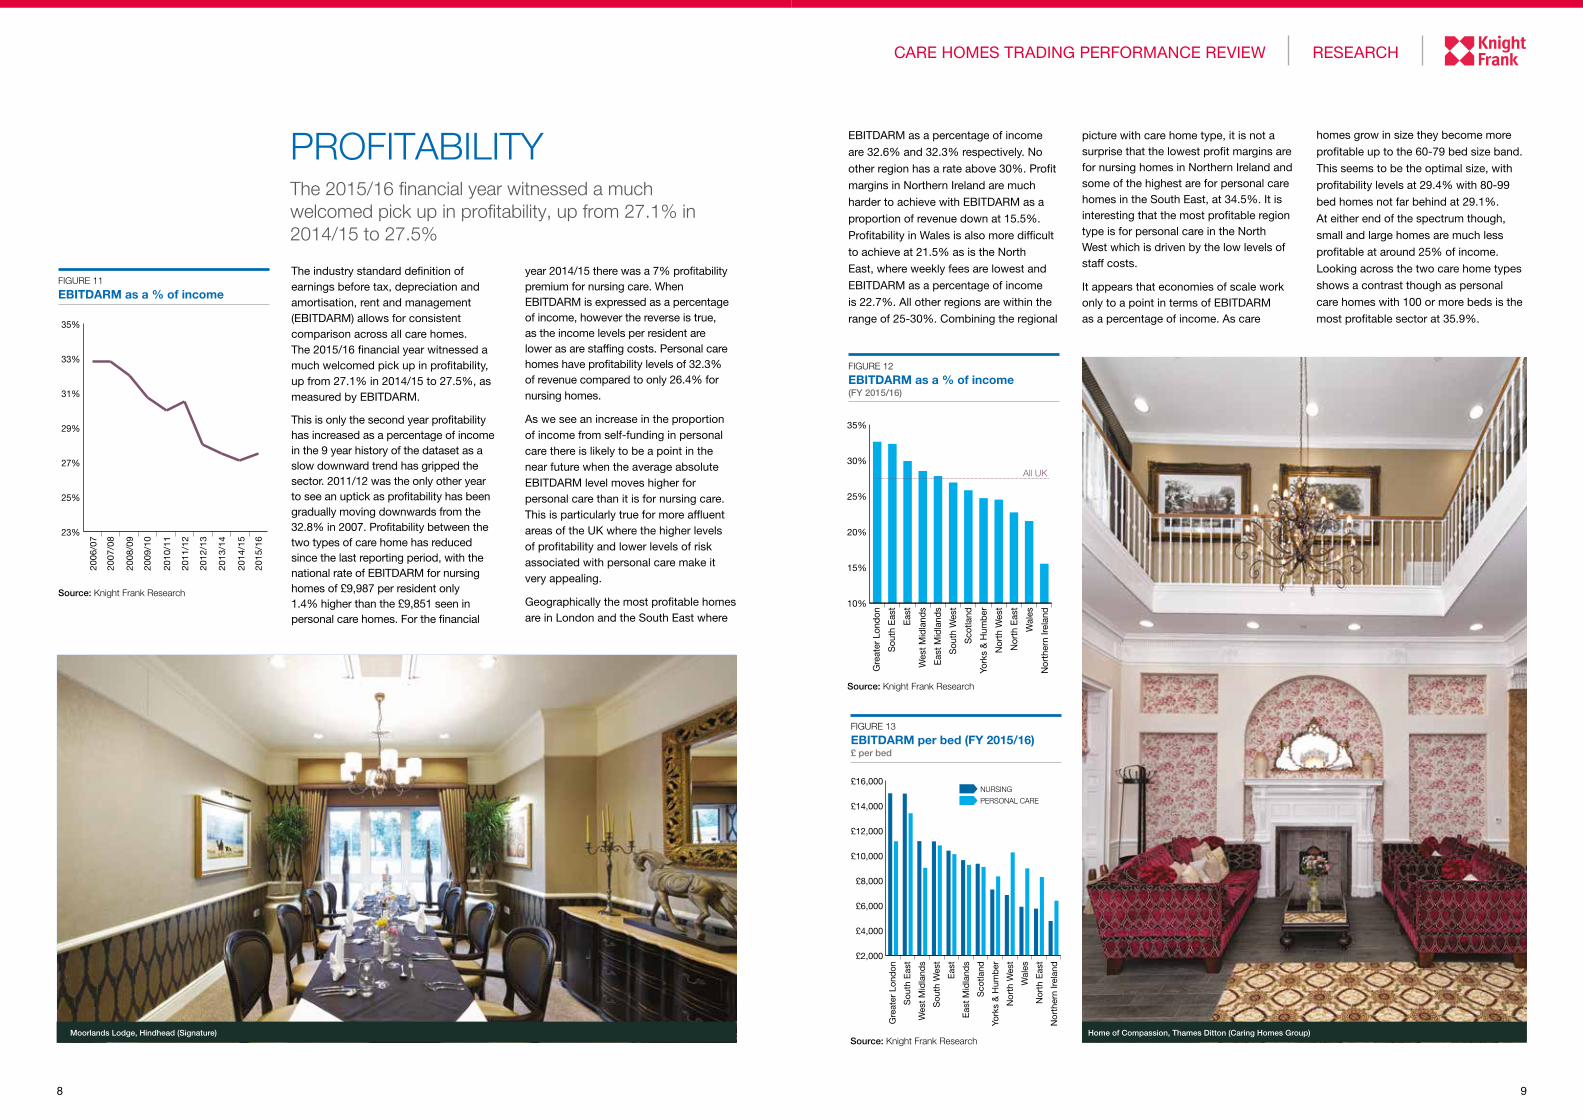
PROFITABILITYThe 2015/16 financial year witnessed a much welcomed pick up in profitability, up from 27.1% in 2014/15 to 27.5%
The industry standard definition of earnings before tax, depreciation and amortisation, rent and management (EBITDARM) allows for consistent comparison across all care homes. The 2015/16 financial year witnessed a much welcomed pick up in profitability, up from 27.1% in 2014/15 to 27.5%, as measured by EBITDARM.
This is only the second year profitability has increased as a percentage of income in the 9 year history of the dataset as a slow downward trend has gripped the sector. 2011/12 was the only other year to see an uptick as profitability has been gradually moving downwards from the 32.8% in 2007. Profitability between the two types of care home has reduced since the last reporting period, with the national rate of EBITDARM for nursing homes of £9,987 per resident only 1.4% higher than the £9,851 seen in personal care homes. For the financial
year 2014/15 there was a 7% profitability premium for nursing care. When EBITDARM is expressed as a percentage of income, however the reverse is true, as the income levels per resident are lower as are staffing costs. Personal care homes have profitability levels of 32.3% of revenue compared to only 26.4% for nursing homes.
As we see an increase in the proportion of income from self-funding in personal care there is likely to be a point in the near future when the average absolute EBITDARM level moves higher for personal care than it is for nursing care. This is particularly true for more affluent areas of the UK where the higher levels of profitability and lower levels of risk associated with personal care make it very appealing.
Geographically the most profitable homes are in London and the South East where
Source: Knight Frank Research
FIGURE 11
EBITDARM as a % of income
23%
25%
27%
29%
31%
33%
35%
2013
/14
2015
/16
2014
/15
2012
/13
2011
/12
2010
/11
2009
/10
2008
/09
2007
/08
2006
/07
Source: Knight Frank Research
FIGURE 12
EBITDARM as a % of income (FY 2015/16)
10%
15%
20%
25%
30%
35%
All UK
Gre
ater
Lon
don
Sou
th E
ast
Eas
t
Wes
t Mid
land
s
Eas
t Mid
land
s
Sou
th W
est
Sco
tland
York
s &
Hum
ber
Nor
th W
est
Nor
th E
ast
Wal
es
Nor
ther
n Ire
land
Source: Knight Frank Research
FIGURE 13
EBITDARM per bed (FY 2015/16) £ per bed
£2,000
£4,000
£6,000
£8,000
£10,000
£12,000
£14,000
£16,000
Gre
ater
Lon
don
Sou
th E
ast
Wes
t M
idla
nds
Sou
th W
est
Eas
t
Eas
t M
idla
nds
Sco
tland
York
s &
Hum
ber
Nor
th W
est
Wal
es
Nor
th E
ast
Nor
ther
n Ire
land
PERSONAL CARE
NURSING
Moorlands Lodge, Hindhead (Signature) Home of Compassion, Thames Ditton (Caring Homes Group)
EBITDARM as a percentage of income
are 32.6% and 32.3% respectively. No
other region has a rate above 30%. Profit
margins in Northern Ireland are much
harder to achieve with EBITDARM as a
proportion of revenue down at 15.5%.
Profitability in Wales is also more difficult
to achieve at 21.5% as is the North
East, where weekly fees are lowest and
EBITDARM as a percentage of income
is 22.7%. All other regions are within the
range of 25-30%. Combining the regional
picture with care home type, it is not a surprise that the lowest profit margins are for nursing homes in Northern Ireland and some of the highest are for personal care homes in the South East, at 34.5%. It is interesting that the most profitable region type is for personal care in the North West which is driven by the low levels of staff costs.
It appears that economies of scale work only to a point in terms of EBITDARM as a percentage of income. As care
homes grow in size they become more
profitable up to the 60-79 bed size band.
This seems to be the optimal size, with
profitability levels at 29.4% with 80-99
bed homes not far behind at 29.1%.
At either end of the spectrum though,
small and large homes are much less
profitable at around 25% of income.
Looking across the two care home types
shows a contrast though as personal
care homes with 100 or more beds is the
most profitable sector at 35.9%.
1110
CARE HOMES TRADING PERFORMANCE REVIEW RESEARCH
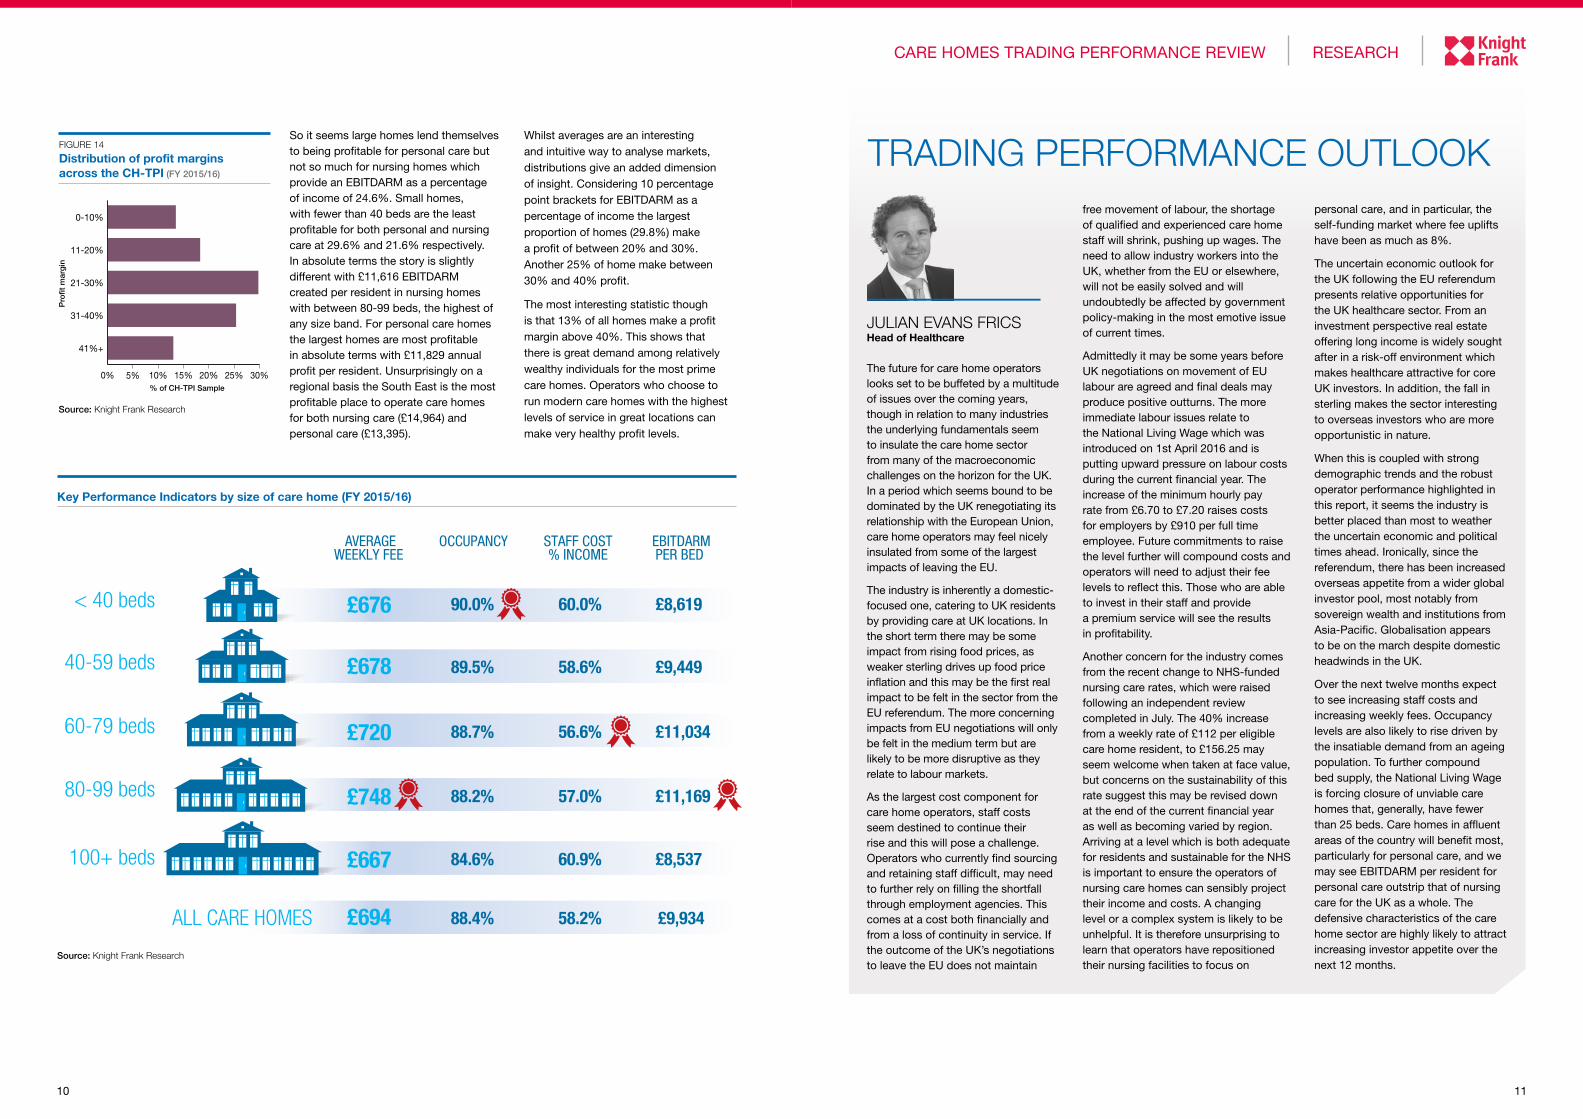
So it seems large homes lend themselves to being profitable for personal care but not so much for nursing homes which provide an EBITDARM as a percentage of income of 24.6%. Small homes, with fewer than 40 beds are the least profitable for both personal and nursing care at 29.6% and 21.6% respectively. In absolute terms the story is slightly different with £11,616 EBITDARM created per resident in nursing homes with between 80-99 beds, the highest of any size band. For personal care homes the largest homes are most profitable in absolute terms with £11,829 annual profit per resident. Unsurprisingly on a regional basis the South East is the most profitable place to operate care homes for both nursing care (£14,964) and personal care (£13,395).
TRADING PERFORMANCE OUTLOOK
JULIAN EVANS FRICS Head of Healthcare
Key Performance Indicators by size of care home (FY 2015/16)
AVERAGEWEEKLY FEE
OCCUPANCY STAFF COST% INCOME
EBITDARMPER BED
£676
£678
£720
£748
£667
£694
< 40 beds
40-59 beds
60-79 beds
80-99 beds
100+ beds
ALL CARE HOMES
£8,61990.0% 60.0%
£9,44989.5% 58.6%
£11,03488.7% 56.6%
£11,16988.2% 57.0%
£8,53784.6% 60.9%
88.4% 58.2% £9,934
Source: Knight Frank Research
Source: Knight Frank Research
FIGURE 14
Distribution of profit margins across the CH-TPI (FY 2015/16)
0% 5% 10% 15% 20% 25% 30%
41%+
31-40%
21-30%
11-20%
0-10%
Pro
fit m
arg
in
% of CH-TPI Sample
Whilst averages are an interesting and intuitive way to analyse markets, distributions give an added dimension of insight. Considering 10 percentage point brackets for EBITDARM as a percentage of income the largest proportion of homes (29.8%) make a profit of between 20% and 30%. Another 25% of home make between 30% and 40% profit.
The most interesting statistic though is that 13% of all homes make a profit margin above 40%. This shows that there is great demand among relatively wealthy individuals for the most prime care homes. Operators who choose to run modern care homes with the highest levels of service in great locations can make very healthy profit levels.
The future for care home operators looks set to be buffeted by a multitude of issues over the coming years, though in relation to many industries the underlying fundamentals seem to insulate the care home sector from many of the macroeconomic challenges on the horizon for the UK. In a period which seems bound to be dominated by the UK renegotiating its relationship with the European Union, care home operators may feel nicely insulated from some of the largest impacts of leaving the EU.
The industry is inherently a domestic-focused one, catering to UK residents by providing care at UK locations. In the short term there may be some impact from rising food prices, as weaker sterling drives up food price inflation and this may be the first real impact to be felt in the sector from the EU referendum. The more concerning impacts from EU negotiations will only be felt in the medium term but are likely to be more disruptive as they relate to labour markets.
As the largest cost component for care home operators, staff costs seem destined to continue their rise and this will pose a challenge. Operators who currently find sourcing and retaining staff difficult, may need to further rely on filling the shortfall through employment agencies. This comes at a cost both financially and from a loss of continuity in service. If the outcome of the UK’s negotiations to leave the EU does not maintain
free movement of labour, the shortage of qualified and experienced care home staff will shrink, pushing up wages. The need to allow industry workers into the UK, whether from the EU or elsewhere, will not be easily solved and will undoubtedly be affected by government policy-making in the most emotive issue of current times.
Admittedly it may be some years before UK negotiations on movement of EU labour are agreed and final deals may produce positive outturns. The more immediate labour issues relate to the National Living Wage which was introduced on 1st April 2016 and is putting upward pressure on labour costs during the current financial year. The increase of the minimum hourly pay rate from £6.70 to £7.20 raises costs for employers by £910 per full time employee. Future commitments to raise the level further will compound costs and operators will need to adjust their fee levels to reflect this. Those who are able to invest in their staff and provide a premium service will see the results in profitability.
Another concern for the industry comes from the recent change to NHS-funded nursing care rates, which were raised following an independent review completed in July. The 40% increase from a weekly rate of £112 per eligible care home resident, to £156.25 may seem welcome when taken at face value, but concerns on the sustainability of this rate suggest this may be revised down at the end of the current financial year as well as becoming varied by region. Arriving at a level which is both adequate for residents and sustainable for the NHS is important to ensure the operators of nursing care homes can sensibly project their income and costs. A changing level or a complex system is likely to be unhelpful. It is therefore unsurprising to learn that operators have repositioned their nursing facilities to focus on
personal care, and in particular, the self-funding market where fee uplifts have been as much as 8%.
The uncertain economic outlook for the UK following the EU referendum presents relative opportunities for the UK healthcare sector. From an investment perspective real estate offering long income is widely sought after in a risk-off environment which makes healthcare attractive for core UK investors. In addition, the fall in sterling makes the sector interesting to overseas investors who are more opportunistic in nature.
When this is coupled with strong demographic trends and the robust operator performance highlighted in this report, it seems the industry is better placed than most to weather the uncertain economic and political times ahead. Ironically, since the referendum, there has been increased overseas appetite from a wider global investor pool, most notably from sovereign wealth and institutions from Asia-Pacific. Globalisation appears to be on the march despite domestic headwinds in the UK.
Over the next twelve months expect to see increasing staff costs and increasing weekly fees. Occupancy levels are also likely to rise driven by the insatiable demand from an ageing population. To further compound bed supply, the National Living Wage is forcing closure of unviable care homes that, generally, have fewer than 25 beds. Care homes in affluent areas of the country will benefit most, particularly for personal care, and we may see EBITDARM per resident for personal care outstrip that of nursing care for the UK as a whole. The defensive characteristics of the care home sector are highly likely to attract increasing investor appetite over the next 12 months.
Important Notice© Knight Frank LLP 2016 – This report is published for general information only and not to be relied upon in any way. Although high standards have been used in the preparation of the information, analysis, views and projections presented in this report, no responsibility or liability whatsoever can be accepted by Knight Frank LLP for any loss or damage resultant from any use of, reliance on or reference to the contents of this document. As a general report, this material does not necessarily represent the view of Knight Frank LLP in relation to particular properties or projects. Reproduction of this report in whole or in part is not allowed without prior written approval of Knight Frank LLP to the form and content within which it appears. Knight Frank LLP is a limited liability partnership registered in England with registered number OC305934. Our registered office is 55 Baker Street, London, W1U 8AN, where you may look at a list of members’ names.
COMMERCIAL RESEARCH Dr Lee Elliott Head of Commercial Research +44 20 7861 5008 [email protected]
Mark Clacy-Jones Head of Data & Analytics +44 20 3861 6986 [email protected]
HEALTHCARE Julian Evans FRICS Head of Healthcare +44 20 7861 1147 [email protected]
Patrick Evans MRICS Head of Corporate Valuations +44 20 7861 1757 [email protected]
Kieren Cole MRICS Head of Commercial Valuations +44 20 7861 1563 [email protected]
For the latest news, views and analysisof the commercial property market, visitknightfrankblog.com/commercial-briefing/
COMMERCIAL BRIEFING
Knight Frank Research Reports are available at KnightFrank.com/Research
RECENT MARKET-LEADING RESEARCH PUBLICATIONS
Healthcare Capital Markets - 2016
HEALTHCARE CAPITAL MARKETS 2016
HIGHLIGHTSUK healthcare performed well in 2015, achieving a double-digit total return for the first time in five years
Favourable demographics will continue to support demand for UK healthcare in the post Brexit environment
The lower investment risk associated with healthcare should see it perform well in relation to wider UK property
RESEARCH
Knight Frank Research provides strategic advice, consultancy services and forecasting to a wide range of clients worldwide including developers, investors, funding organisations, corporate institutions and the public sector. All our clients recognise the need for expert independent advice customised to their specific needs.
Front cover image: Richmond Painswick, Richmond Villages (Bupa)
RESEARCH
EUROPEAN QUARTERLYCOMMERCIAL PROPERTY OUTLOOK Q2 2016
OCCUPIER TRENDS INVESTMENT TRENDS MARKET INDICATORS
European Quarterly Report - Q2 2016
Global Cities - 2017
THE 2017 REPORT
The Future Of Real Estate In The World’s Leading Cities
Specialist Property Report 2016 - Momentum
OVERVIEW POTENTIAL BRAKES OUTLOOK
SPECIALIST PROPERTY
momentum
2016
RESEARCH
Recommended