2016 RATES & FEES
General Charges
2016 RATES & FEES
General Charges
2016 Rates & Fees:
General Charges
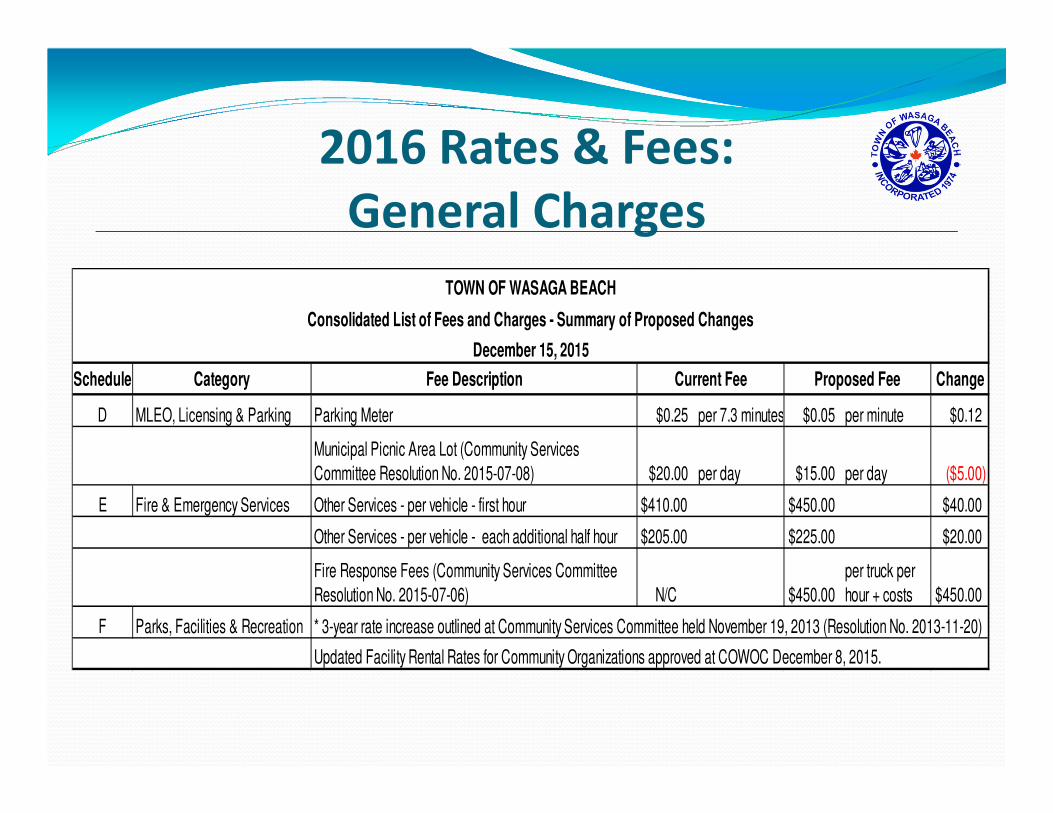
Schedule Category Fee Description Change
D MLEO, Licensing & Parking Parking Meter $0.25 per 7.3 minutes $0.05 per minute $0.12
Municipal Picnic Area Lot (Community Services
Committee Resolution No. 2015-07-08) $20.00 per day $15.00 per day ($5.00)
E Fire & Emergency Services Other Services - per vehicle - first hour $410.00 $450.00 $40.00
Other Services - per vehicle - each additional half hour $205.00 $225.00 $20.00
Fire Response Fees (Community Services Committee
Resolution No. 2015-07-06) N/C $450.00
per truck per
hour + costs $450.00
F Parks, Facilities & Recreation * 3-year rate increase outlined at Community Services Committee held November 19, 2013 (Resolution No. 2013-11-20)
Updated Facility Rental Rates for Community Organizations approved at COWOC December 8, 2015.
Current Fee Proposed Fee
TOWN OF WASAGA BEACH
Consolidated List of Fees and Charges - Summary of Proposed Changes
December 15, 2015
2016 Rates & Fees:
General Charges
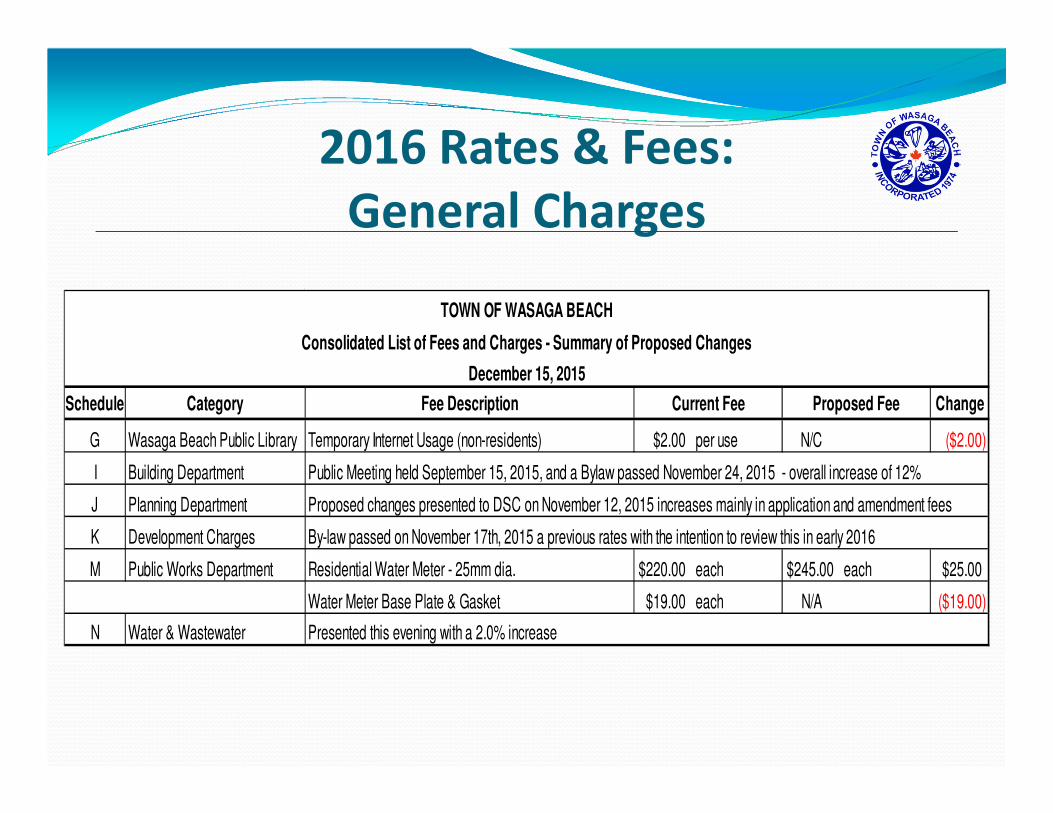
Schedule Category Fee Description Change
G Wasaga Beach Public Library Temporary Internet Usage (non-residents) $2.00 per use N/C ($2.00)
I Building Department
J Planning Department
K Development Charges
M Public Works Department Residential Water Meter - 25mm dia. $220.00 each $245.00 each $25.00
Water Meter Base Plate & Gasket $19.00 each N/A ($19.00)
N Water & Wastewater
Current Fee Proposed Fee
December 15, 2015
Consolidated List of Fees and Charges - Summary of Proposed Changes
Public Meeting held September 15, 2015, and a Bylaw passed November 24, 2015 - overall increase of 12%
By-law passed on November 17th, 2015 a previous rates with the intention to review this in early 2016
Presented this evening with a 2.0% increase
Proposed changes presented to DSC on November 12, 2015 increases mainly in application and amendment fees
TOWN OF WASAGA BEACH
2016 Operating and Capital Budget Presentation

Presentation Outline
1. Draft #5 Update – Assessment Roll Closure
2. Budget Process
3. Council’s Mission & Vision
4. Overall 2016 Budget (i.e. Revenue &
Expenditures breakdowns)
5. 2016’s Impact on the Tax Payer
6. State of Reserves & Reserve Funds
7. Department Presentations
8. 4 Year Capital & Operating Plans
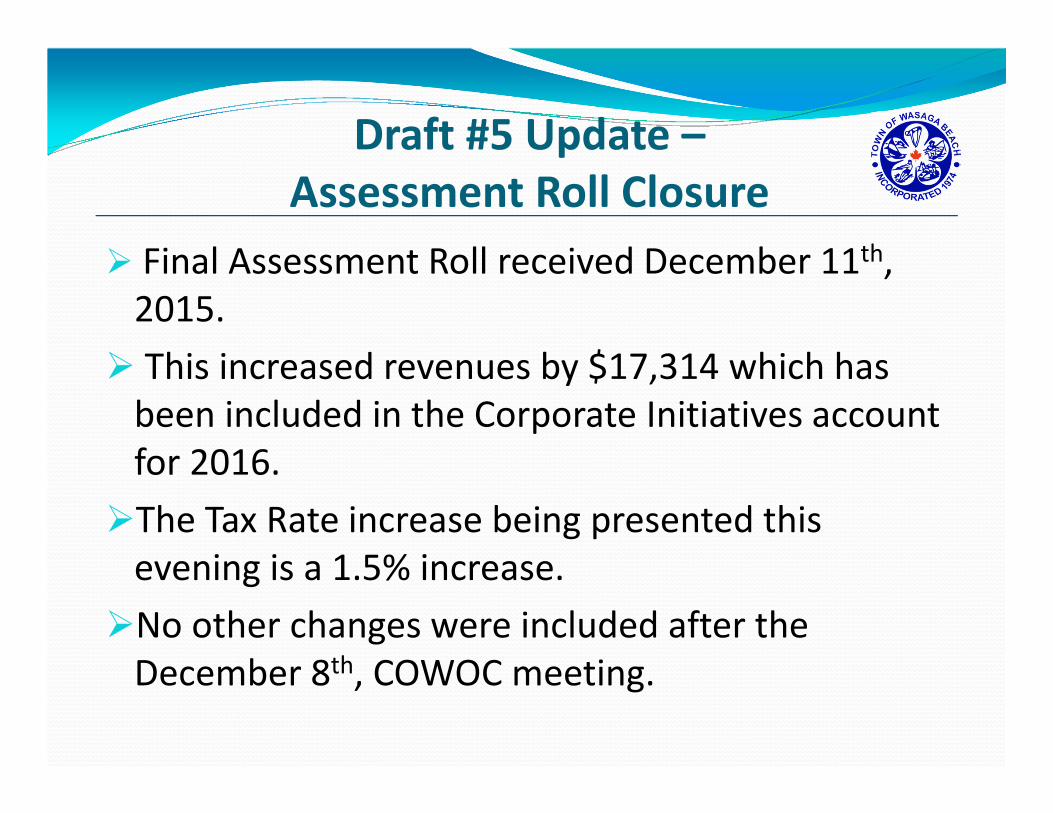
Draft #5 Update –
Assessment Roll Closure
� Final Assessment Roll received December 11th,
2015.
� This increased revenues by $17,314 which has
been included in the Corporate Initiatives account
for 2016.
�The Tax Rate increase being presented this
evening is a 1.5% increase.
�No other changes were included after the
December 8th, COWOC meeting.
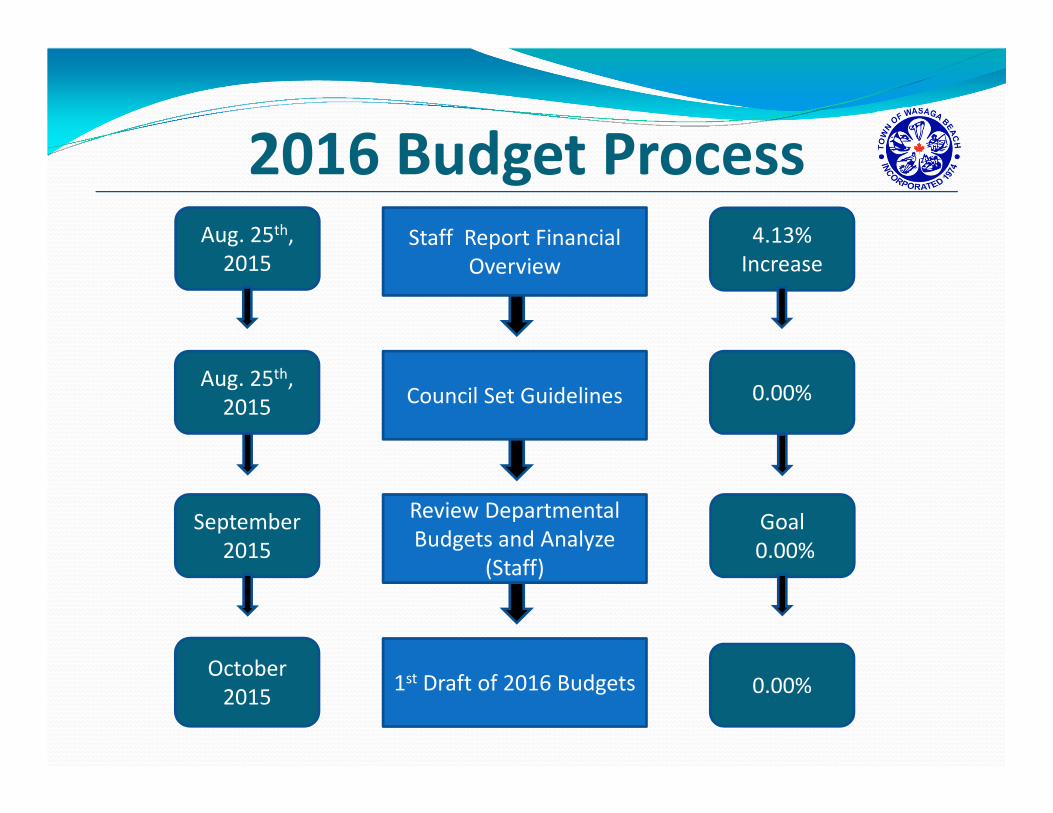
2016 Budget ProcessStaff Report Financial
Overview
Aug. 25th,
2015
4.13%
Increase
Council Set GuidelinesAug. 25th,
20150.00%
Review Departmental
Budgets and Analyze
(Staff)
September
2015
Goal
0.00%
1st Draft of 2016 BudgetsOctober
20150.00%
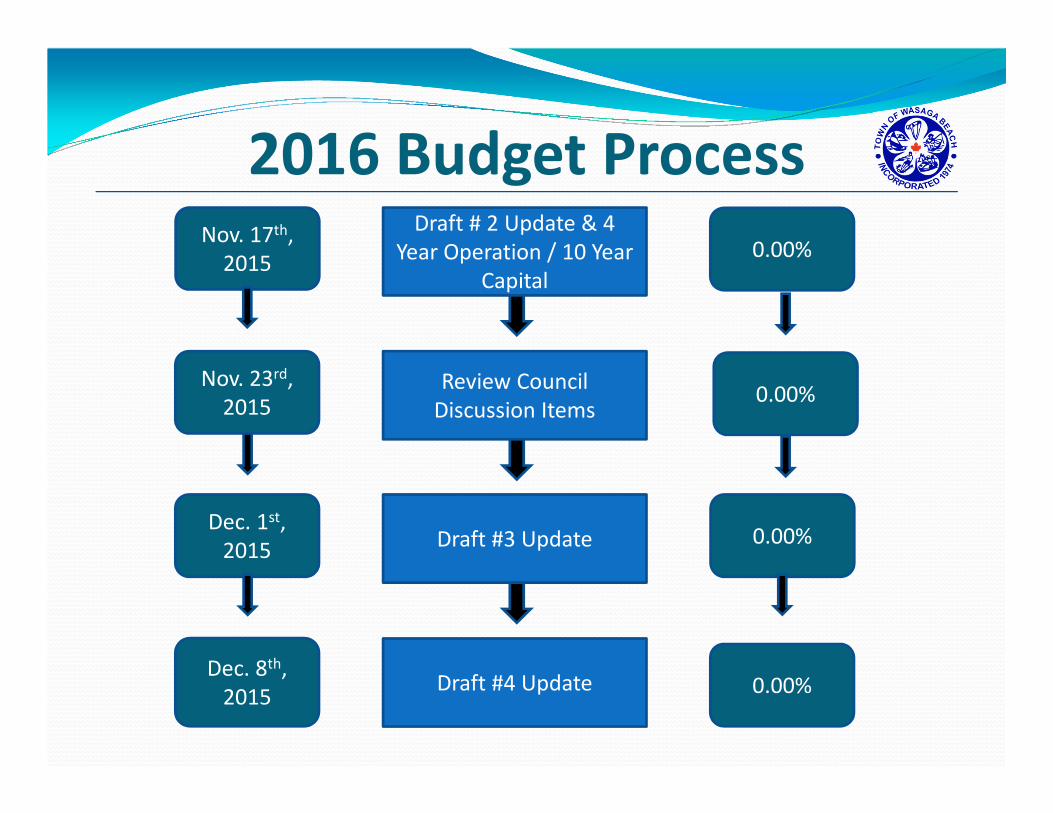
2016 Budget ProcessDraft # 2 Update & 4
Year Operation / 10 Year
Capital
Nov. 17th,
20150.00%
Review Council
Discussion Items
Nov. 23rd,
2015
Draft #3 UpdateDec. 1st,
20150.00%
Draft #4 UpdateDec. 8th,
20150.00%
0.00%

2016 Budget ProcessPublic Presentation
Draft # 5
Dec. 15th,
20151.50%
Consideration and
Adoption of 2016
Budget
Dec. 22nd,
20151.50%
2016 Budget ProcessThe 2016 Budget is Financed through:
1. Taxation
2. Reserves
3. User Fees
4. Development Charge Reserve Funds
5. Ontario Community Infrastructure Fund
(Formula Based component only)
6. Small Communities Fund (not yet awarded)
7. Debt
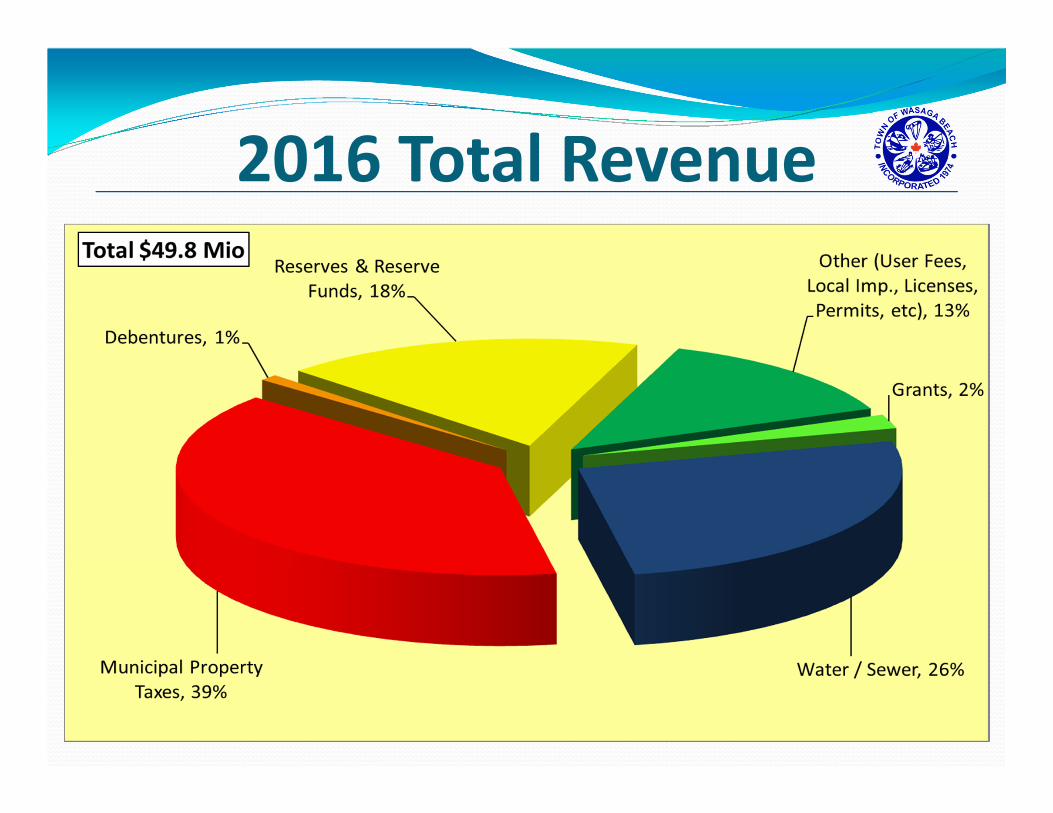
2016 Total Revenue
2016 Budget:
Council’s MissionCouncil is responsible for the delivery of municipal services
to residents, businesses and tourists in a customer friendly,
cost effective, creative and environmentally sensitive
manner that provides opportunities for all to enjoy family
life, earn a living and pursue leisure activities.
Council is committed to supporting the development of a
sustainable and inclusive community in a managed fashion
that understands the link between health, well-being and
the environment while enabling everyone to enjoy our
unique geography and quality of life.
Note: As approved at February 3rd, 2015 COWOC
2016 Budget:
Council’s VisionWasaga Beach is a thriving fully serviced community,
respectful of its history and culture, offering a variety of
residential, educational and commercial choices in
neighbourhoods developed in harmony with the
environment that provides its residents, businesses and
visitors with a full range of services while promoting a
healthy lifestyle, high community standards, business
success and harmonious relationships.
Note: As approved at February 3rd, 2015 COWOC
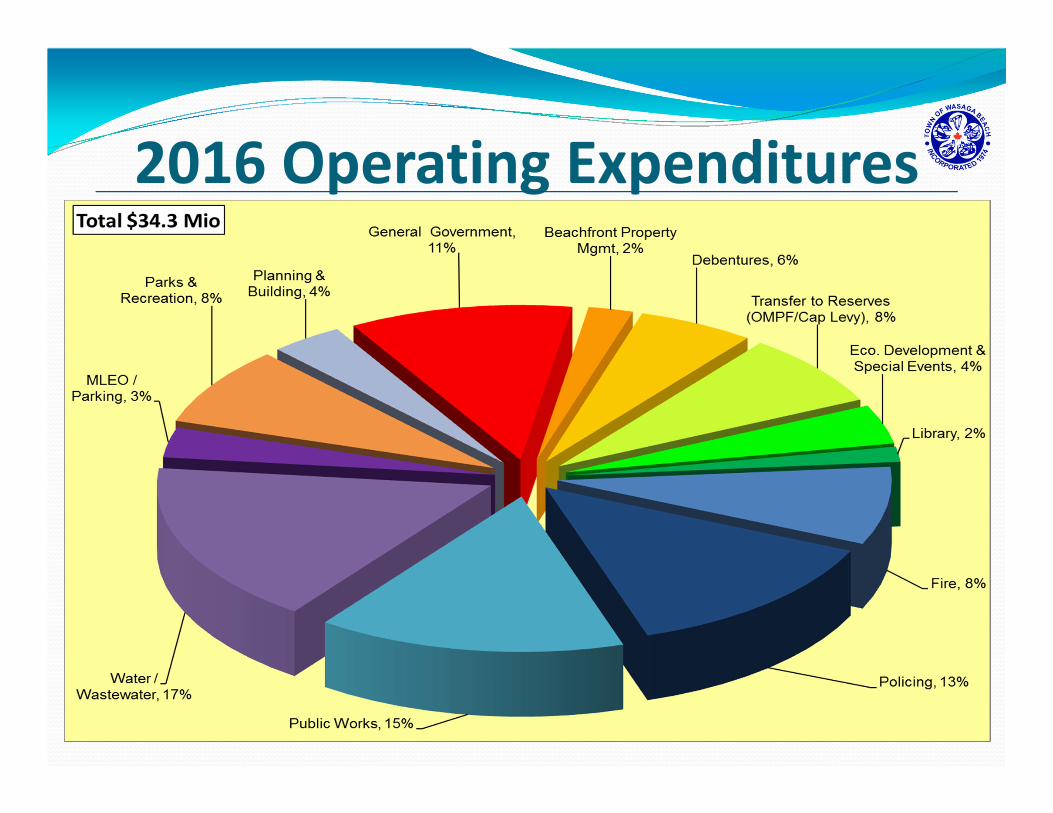
2016 Operating Expenditures
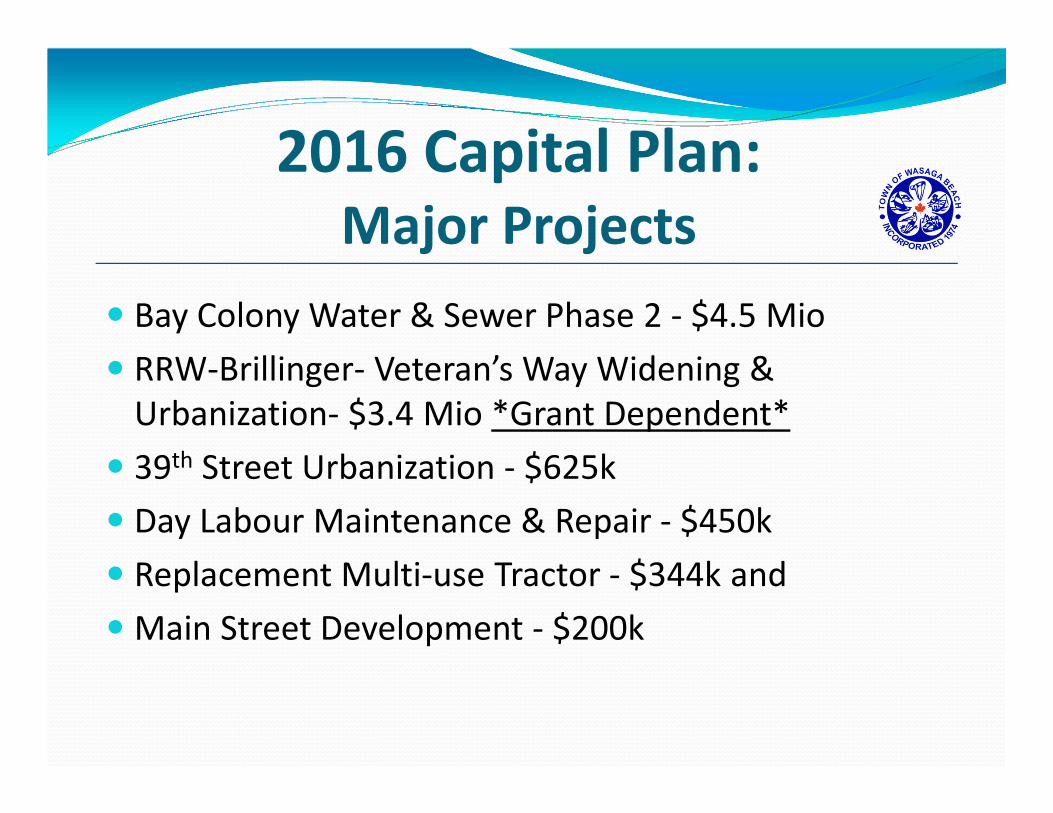
2016 Capital Plan: Major Projects
� Bay Colony Water & Sewer Phase 2 - $4.5 Mio
� RRW-Brillinger- Veteran’s Way Widening &
Urbanization- $3.4 Mio *Grant Dependent*
� 39th Street Urbanization - $625k
� Day Labour Maintenance & Repair - $450k
� Replacement Multi-use Tractor - $344k and
� Main Street Development - $200k

2016 Capital Plan: Funding
� Reserve - $4,777,330
� Reserve Funds - $4,216,440
� Taxation - $1,977380
� Benefiting owners - $2,547,600
� Grant Funding - $1,053,870
� Federal Gas Tax - $507,790 (transfer to reserve funds)
� Borrowing - $235,800
� Land Sales - $200,000

2016 Capital Expenditures
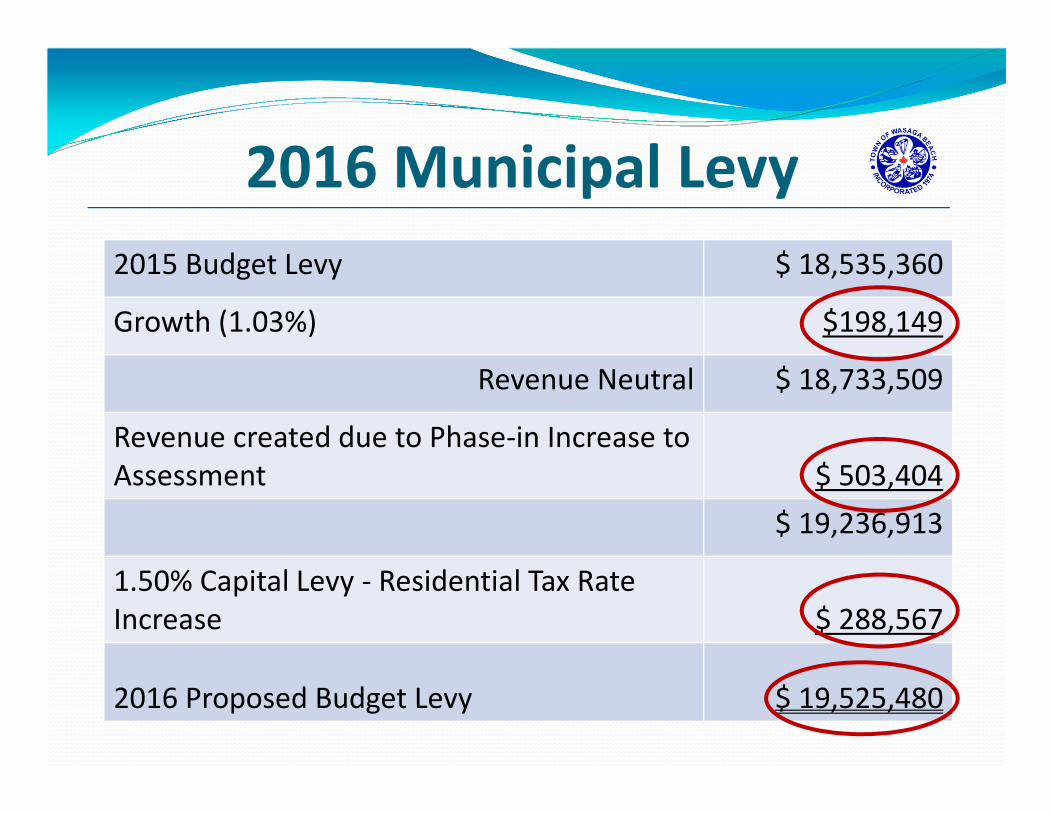
2016 Municipal Levy
2015 Budget Levy $ 18,535,360
Growth (1.03%) $198,149
Revenue Neutral $ 18,733,509
Revenue created due to Phase-in Increase to
Assessment $ 503,404
$ 19,236,913
1.50% Capital Levy - Residential Tax Rate
Increase $ 288,567
2016 Proposed Budget Levy $ 19,525,480
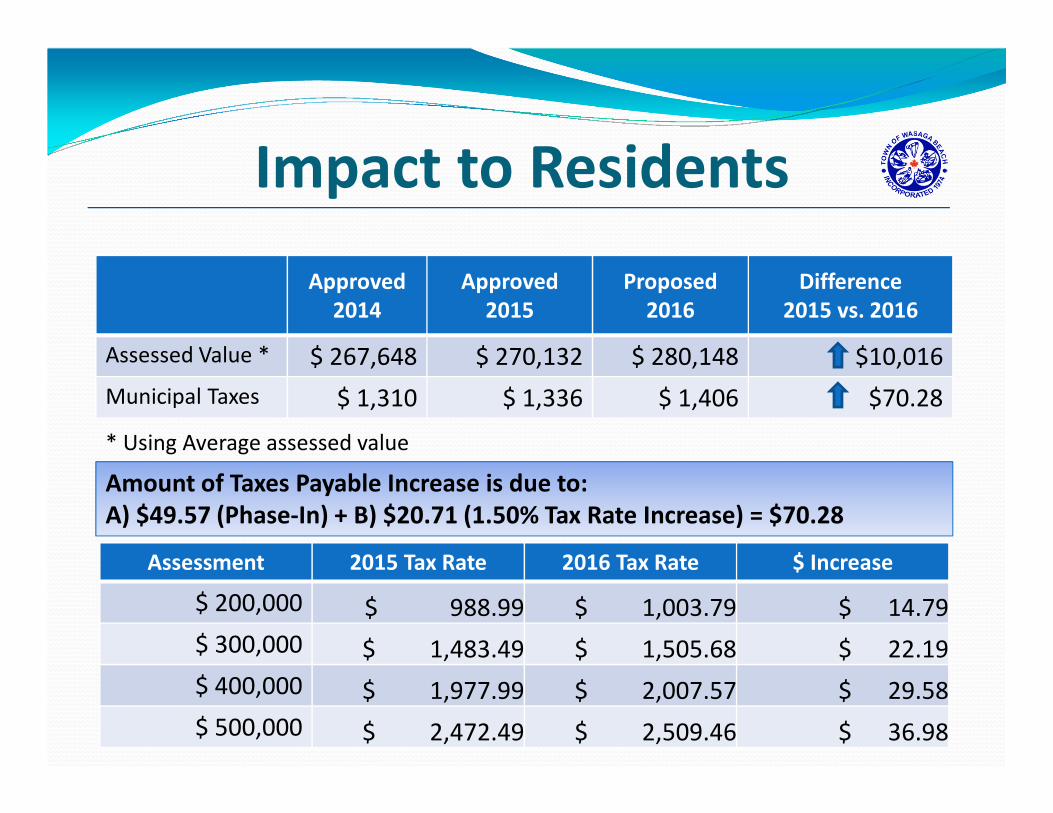
Impact to Residents
Approved
2014
Approved
2015
Proposed
2016
Difference
2015 vs. 2016
Assessed Value * $ 267,648 $ 270,132 $ 280,148 $10,016
Municipal Taxes $ 1,310 $ 1,336 $ 1,406 $70.28
Assessment 2015 Tax Rate 2016 Tax Rate $ Increase
$ 200,000 $ 988.99 $ 1,003.79 $ 14.79
$ 300,000 $ 1,483.49 $ 1,505.68 $ 22.19
$ 400,000 $ 1,977.99 $ 2,007.57 $ 29.58
$ 500,000 $ 2,472.49 $ 2,509.46 $ 36.98
* Using Average assessed value
Amount of Taxes Payable Increase is due to:
A) $49.57 (Phase-In) + B) $20.71 (1.50% Tax Rate Increase) = $70.28
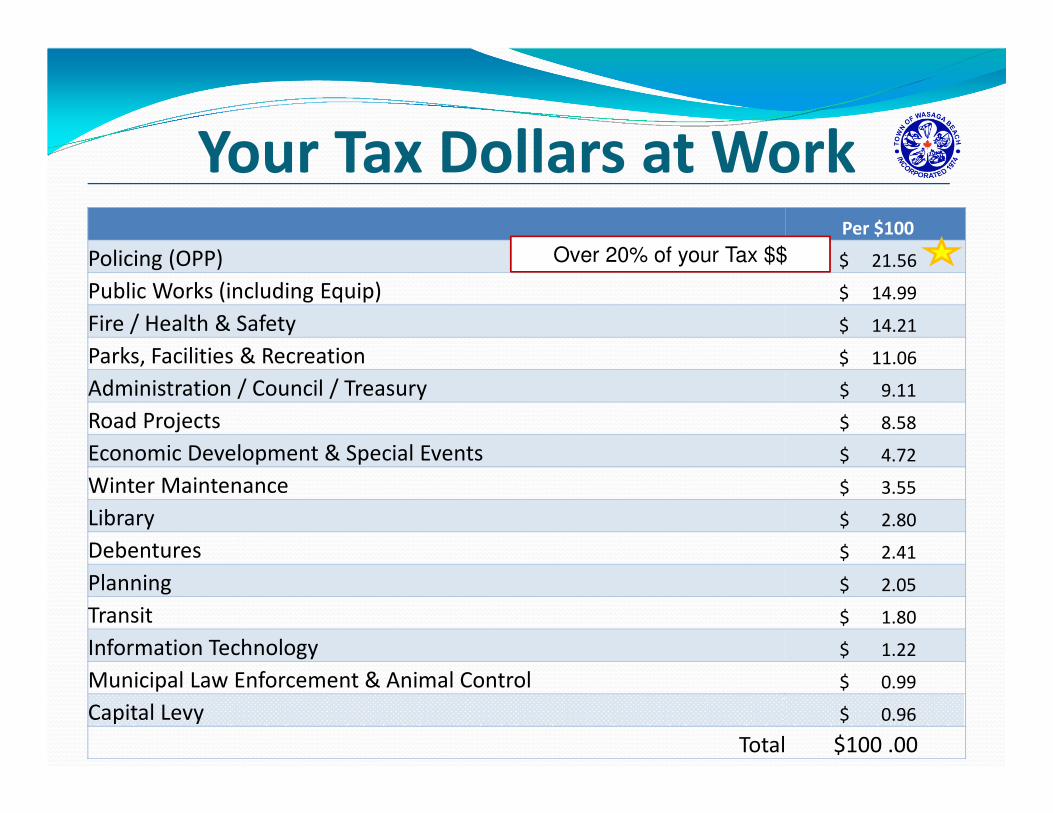
Your Tax Dollars at WorkPer $100
Policing (OPP) $ 21.56
Public Works (including Equip) $ 14.99
Fire / Health & Safety $ 14.21
Parks, Facilities & Recreation $ 11.06
Administration / Council / Treasury $ 9.11
Road Projects $ 8.58
Economic Development & Special Events $ 4.72
Winter Maintenance $ 3.55
Library $ 2.80
Debentures $ 2.41
Planning $ 2.05
Transit $ 1.80
Information Technology $ 1.22
Municipal Law Enforcement & Animal Control $ 0.99
Capital Levy $ 0.96
Total $100 .00
Over 20% of your Tax $$

Operating Budget – Service Level
EnhancementsStaffing Changes
1. Communications & Special Projects - $128k (2015 Approval);
2. Main Street Market - $124k – (Special Events Coordinator, Lifeguards and Rental/Info Person);
3. Fire Department – Proposed 2 additional Firefighters currently included in the 2016 budget, to be brought to Standing committee prior to hiring for approval - $85k (July Start);
4. Jr. Economic Development - $93k – Job evaluation must be completed and approval from Committee prior to hiring;
5. Jr. Planner - $93k – Job evaluation must be completed and approval from Committee prior to hiring;
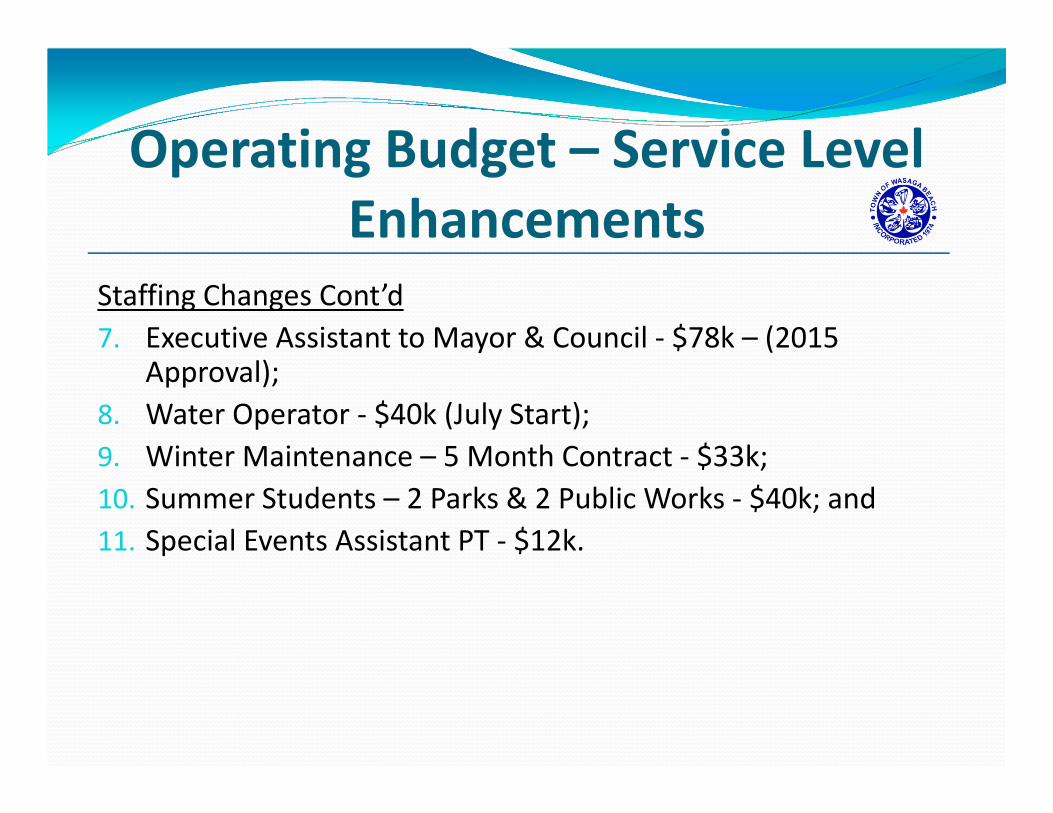
Operating Budget – Service Level
Enhancements
Staffing Changes Cont’d
7. Executive Assistant to Mayor & Council - $78k – (2015 Approval);
8. Water Operator - $40k (July Start);
9. Winter Maintenance – 5 Month Contract - $33k;
10. Summer Students – 2 Parks & 2 Public Works - $40k; and
11. Special Events Assistant PT - $12k.
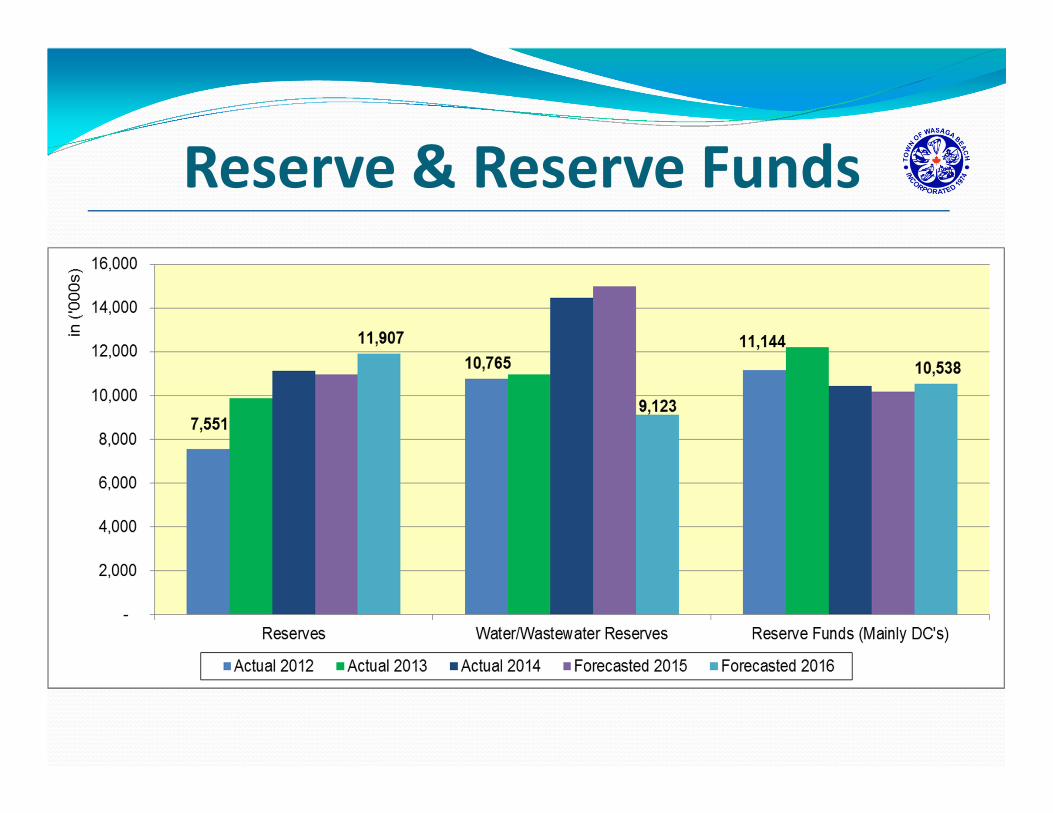
Reserve & Reserve Funds

Departmental Presentations
General Government Committee� Council
� Administration, Committees, Cemetery & Archives
� Beachfront Property Management
� Treasury
� Information Technology
� Economic Development
� Main Street Market
� Chamber of Commerce
� Special Events

Departmental Presentations
Council
2016 Highlights
� Additional $50k to complete
Efficiency Review of Town
operations.
Departmental Presentations
Administration/Clerk’s Office/
Cemetery & Archives
2016 Highlights
� Transfer of 82% OMPF to reserves - $2.4 Mio
� Reorganization of Department staffing –Records Mgmt and Special Projects.
Departmental Presentations
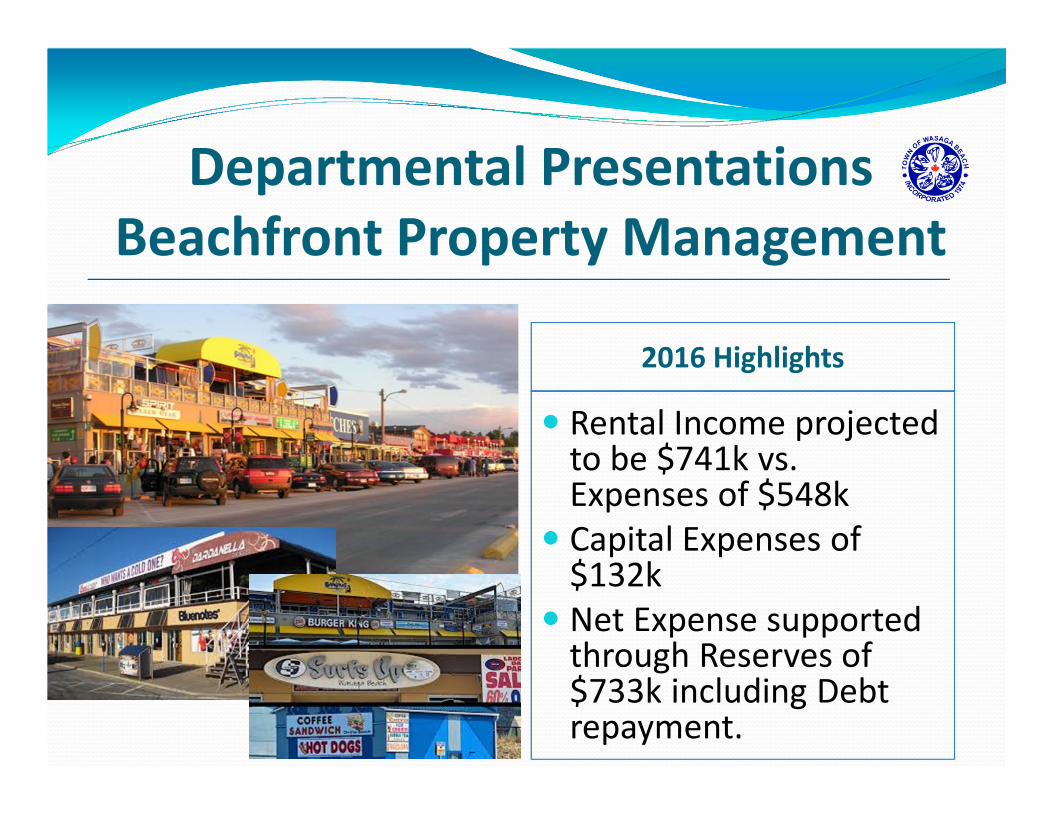
Beachfront Property Management
2016 Highlights
� Rental Income projected to be $741k vs. Expenses of $548k
� Capital Expenses of $132k
� Net Expense supported through Reserves of $733k including Debt repayment.
Departmental Presentations
Treasury
2016 Highlights
� Maintain Dividends Payable to reflect historical value
� Increase in Investment Income – through the ONE fund
� Maintaining of Interest on accounts as collections improve
� Audit Fees have decreased as Actuarial Review not required in 2016.
Departmental Presentations
Information Technology
2016 Highlights
� Improve efficiencies;
� Review e-commerce
solutions; and
� Continuous Web
development and
improvement.

Departmental Presentations
Economic Development
2016 Highlights
� Downtown Plan - $500k (net tax impact - $200k – offset with grants)
� Advertising - $25k (grant from Simcoe County – still to be finalized)
� New Employee - $93k Jr. EDO� Tourism Partnerships - $40k
includes Promote Wasaga and Tourism Initiatives with Blue Mountain, Simcoe County and Parks Ontario
� Doctor Recruitment – reduced to $0k.
Departmental Presentations
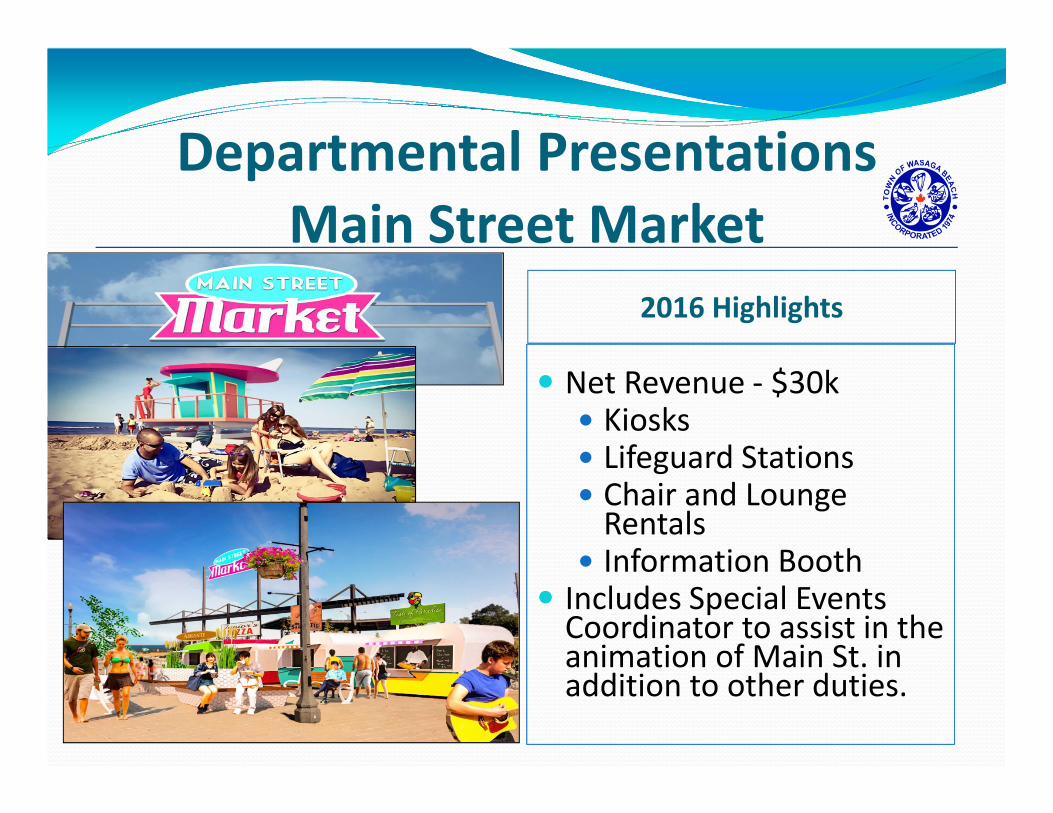
Main Street Market
2016 Highlights
� Net Revenue - $30k� Kiosks� Lifeguard Stations� Chair and Lounge
Rentals� Information Booth
� Includes Special Events Coordinator to assist in the animation of Main St. in addition to other duties.
Departmental Presentations
Special Events
2016 Highlights
� Continued implementation of recommendations from the Special Events Strategy
� External Events - $100k
� Blues Festival - $20k.
Departmental Presentations
Chamber of Commerce
2016 Highlights
� Fee Service Contract
reduced by $5k
� Continued collaboration
with EDO to promote and
encourage business in the
Town.
Departmental Presentations
Community Services Committee
� Ontario Provincial Police
� Municipal Law Enforcement/Parking/Animal Control
� Community Policing
� Fire, Emergency Mgmt & Occupational H&S
� Parks, Facilities & Recreation
� Library
Departmental Presentations
Policing
2016 Highlights
� POA Revenues - $110k
� OPP Costs increases to $4.5 Mio due to the “New Costing Formula”
� Community Policing costs remain in-line with 2015
Departmental Presentations
MLEO, Parking & Animal Control
� Beach Area 2 Picnic Area
completed – payback over
the next 5 years
� By-law – impact to Taxation
- $168k
� Animal Control – *New
Feral Cat Control Program
2016 Highlights
Departmental Presentations
Fire & Emergency Mgmt
2016 Highlights
� (2) New Firefighters - $85k
� Digital Radios $35k
� Continued emphasis on Fire
Prevention and Awareness
� Contract in negotiations.
Departmental Presentations
Parks, Facilities & Recreation
2016 Highlights
� RecPlex Maint. & Imp - $95k
� Tennis/Pickle Ball Courts -
$58k
� New LD Truck – $40k
� Community Events - $41k
� Fernbrook Centre Imp - $25k
� 2 new Summer Student
Positions - $20k
Departmental Presentations
Library
2016 Highlights
� Reorganization of Staffing –
conversion from PT to FT -
$0 Tax Impact
� New Books - $47k
� Continued support for
programming - $4.5k

Departmental Presentations
�Public Works Committee
�Transit
�Building & Planning
Departmental Presentations
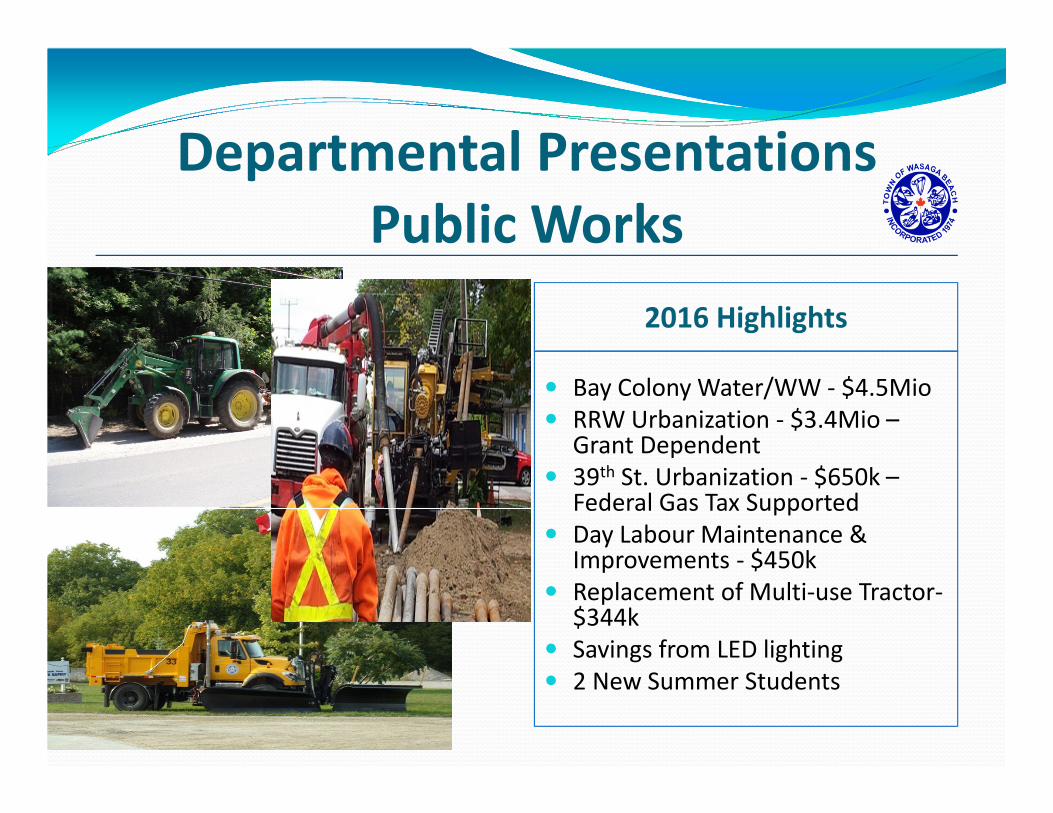
Public Works
2016 Highlights
� Bay Colony Water/WW - $4.5Mio
� RRW Urbanization - $3.4Mio –Grant Dependent
� 39th St. Urbanization - $650k –Federal Gas Tax Supported
� Day Labour Maintenance & Improvements - $450k
� Replacement of Multi-use Tractor-$344k
� Savings from LED lighting
� 2 New Summer Students

Departmental Presentations
Transit
2016 Highlights
� Youth Passes continue at $5
each
� Provincial Gas Tax Funding -
$178k
� Implementation of Transit Fare
Program.
Departmental Presentations
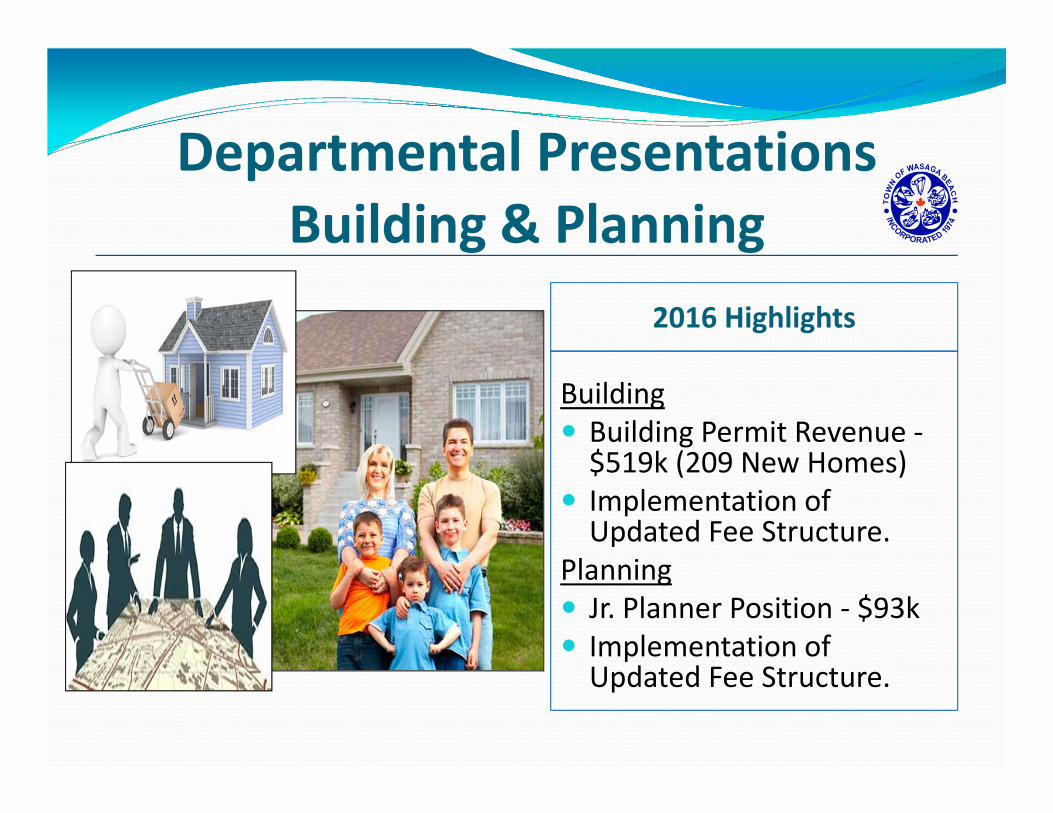
Building & Planning
2016 Highlights
Building
� Building Permit Revenue -$519k (209 New Homes)
� Implementation of Updated Fee Structure.
Planning
� Jr. Planner Position - $93k
� Implementation of Updated Fee Structure.
Planning for the Future
2017 – 2020 Plan
�Assumptions
�Major Capital Projects
�Forecasted Tax Rates from 2017 through to
2020
�Forecasted General Reserve Balances
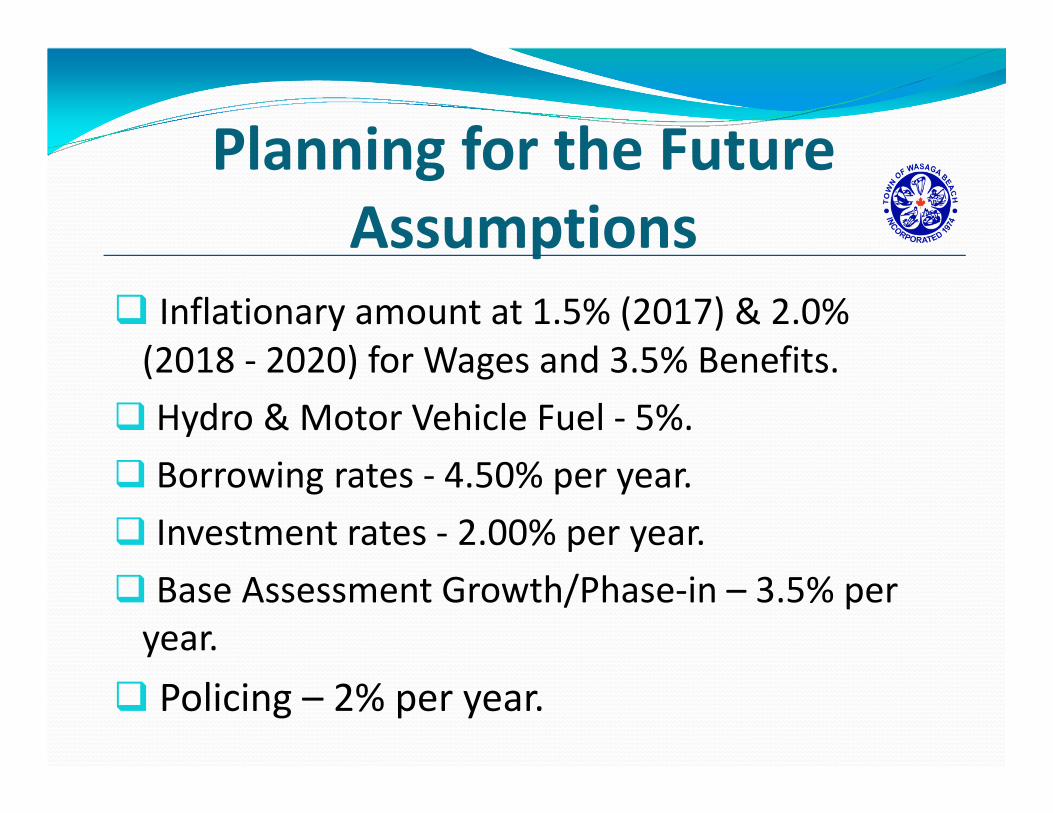
Planning for the Future
Assumptions
� Inflationary amount at 1.5% (2017) & 2.0%
(2018 - 2020) for Wages and 3.5% Benefits.
� Hydro & Motor Vehicle Fuel - 5%.
� Borrowing rates - 4.50% per year.
� Investment rates - 2.00% per year.
� Base Assessment Growth/Phase-in – 3.5% per
year.
� Policing – 2% per year.
Planning for the Future
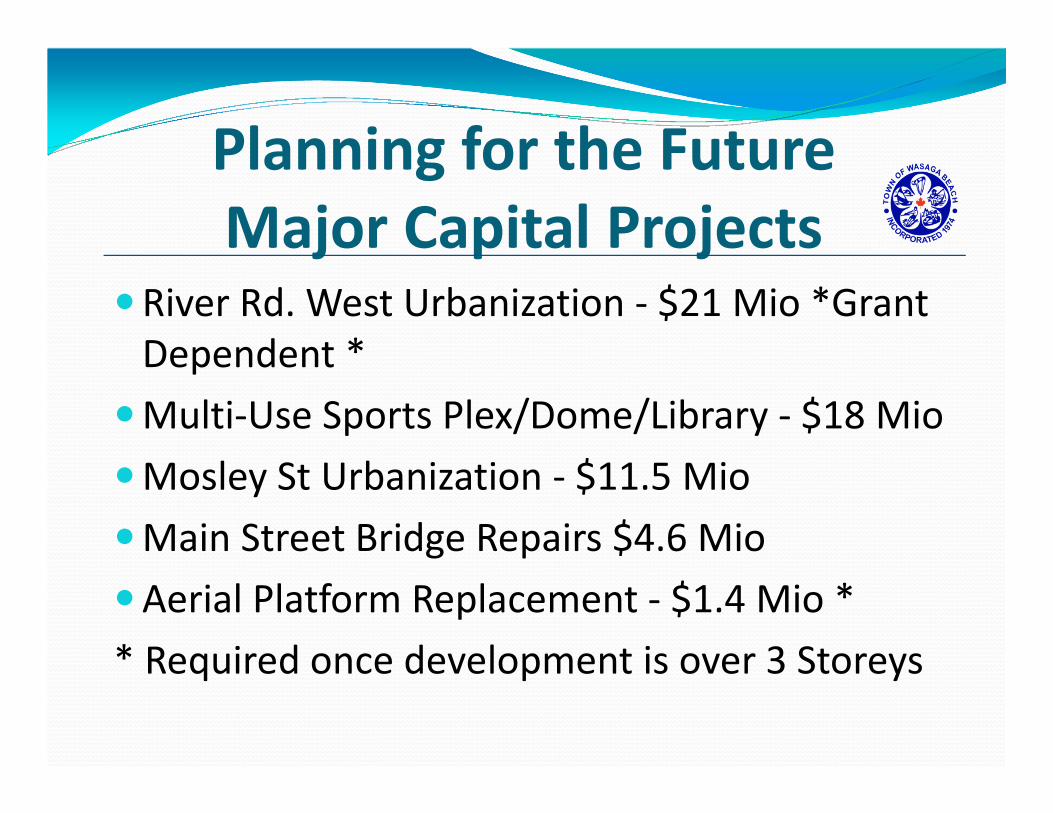
Major Capital Projects�River Rd. West Urbanization - $21 Mio *Grant
Dependent *
�Multi-Use Sports Plex/Dome/Library - $18 Mio
�Mosley St Urbanization - $11.5 Mio
�Main Street Bridge Repairs $4.6 Mio
�Aerial Platform Replacement - $1.4 Mio *
* Required once development is over 3 Storeys

Planning for the Future
Estimated Tax Rates
* These are estimated rates based on information that is available
today and form part of a 5 Year Plan, and are Not Approved *
In Thousands 2017
%
Change 2018
%
Change 2019
%
Change 2020
%
Change
Operational 18,462 5.2% 19,461 5.4% 20,471 5.2% 21,197 3.5%
Capital 2,026 2.5% 1,914 -5.6% 2,228 16.4% 2,526 13.4%
Total
Expenditures 20,488 4.9% 21,375 4.3% 22,698 6.2% 23,723 4.5%
Tax Rate 0.00511 1.72% 0.00519 1.57% 0.00534 2.92% 0.00545 2.19%

Planning for the Future
Reserves & Reserve Funds
* Forecasted for Information Only*
Thank You!!
� Thank you to Staff and Council the budget is very much a Team Effort, we appreciate everyone’s hard work!
� A special thank you to Cindy Moore our Budget Analyst!
� Questions??
Recommended