2017 Financial Performance and
Medium-Term Perspectives for the
Banking Sector
Ricardo G. Fernández D.
Superintendent of Banks
March 20, 2018
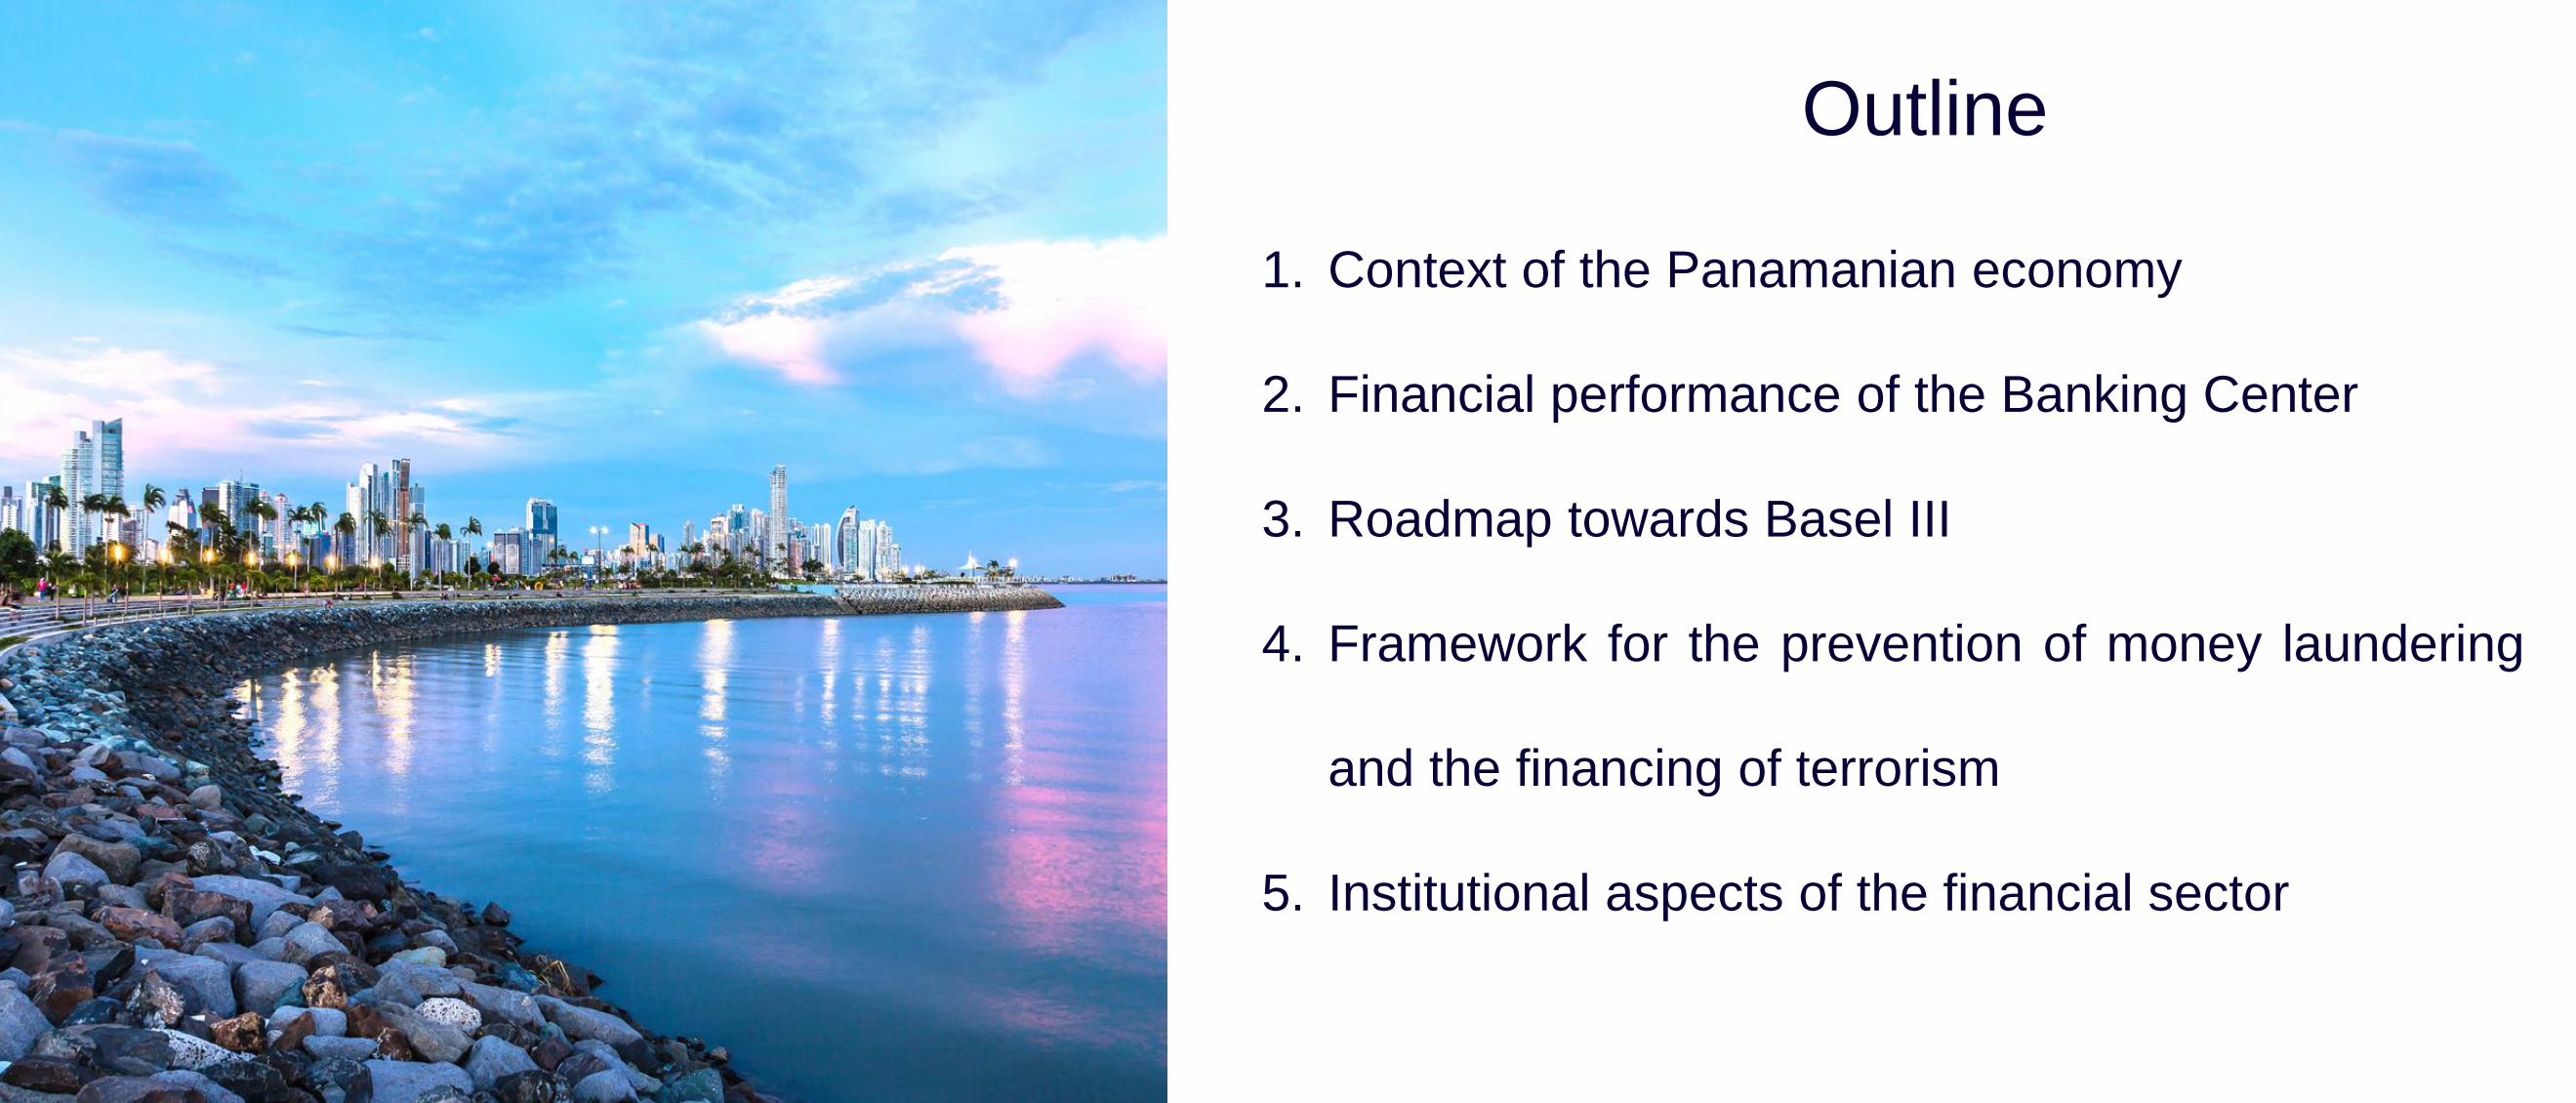
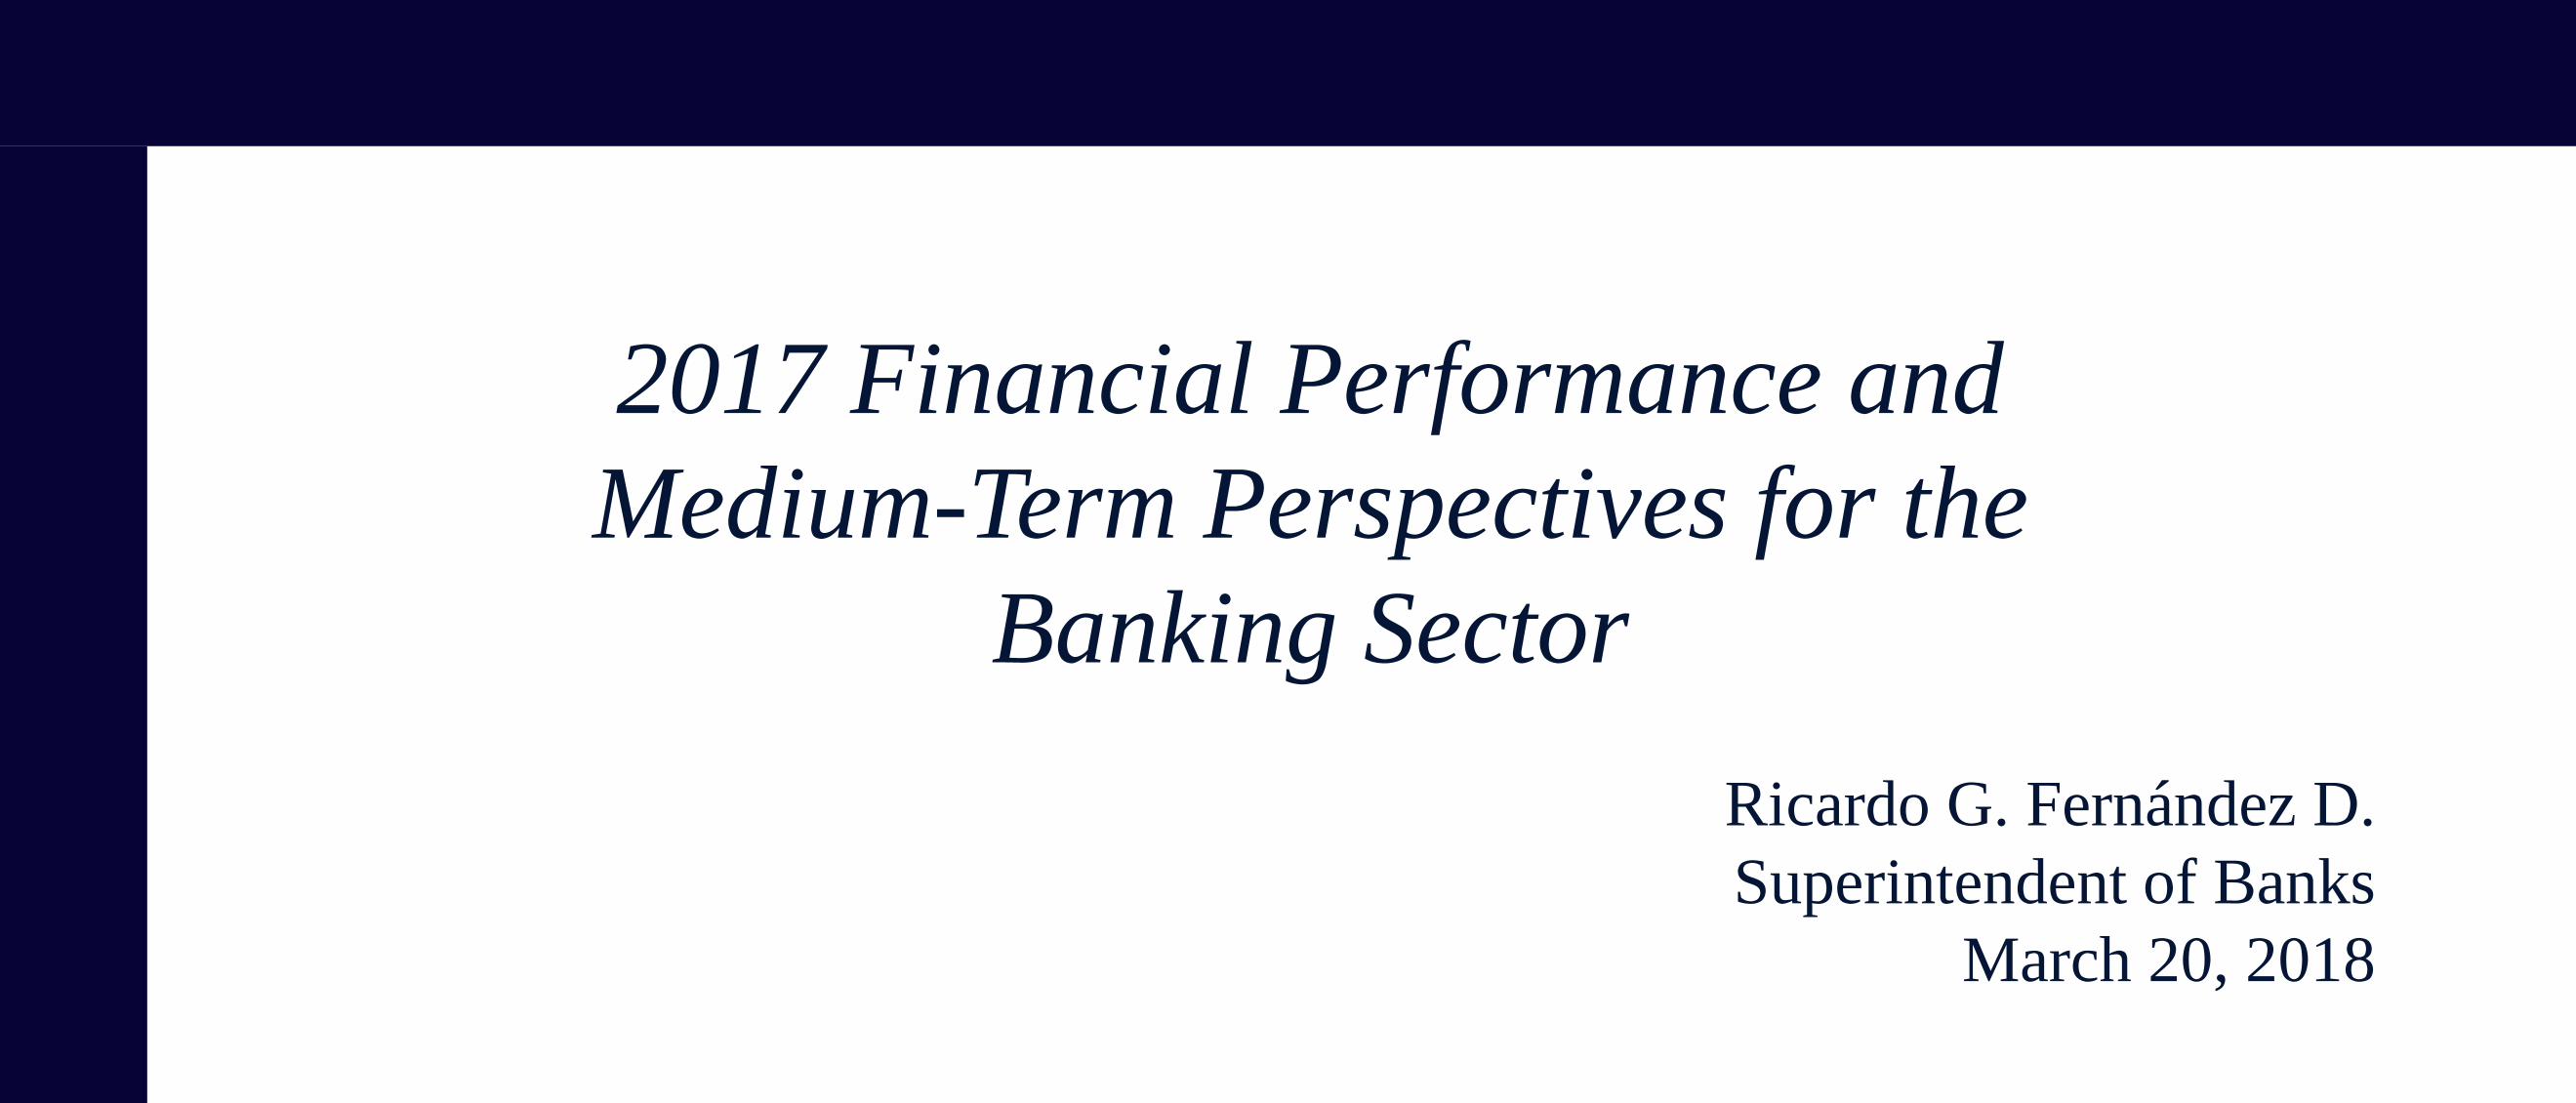
Outline
1. Context of the Panamanian economy
2. Financial performance of the Banking Center
3. Roadmap towards Basel III
4. Framework for the prevention of money laundering
and the financing of terrorism
5. Institutional aspects of the financial sector
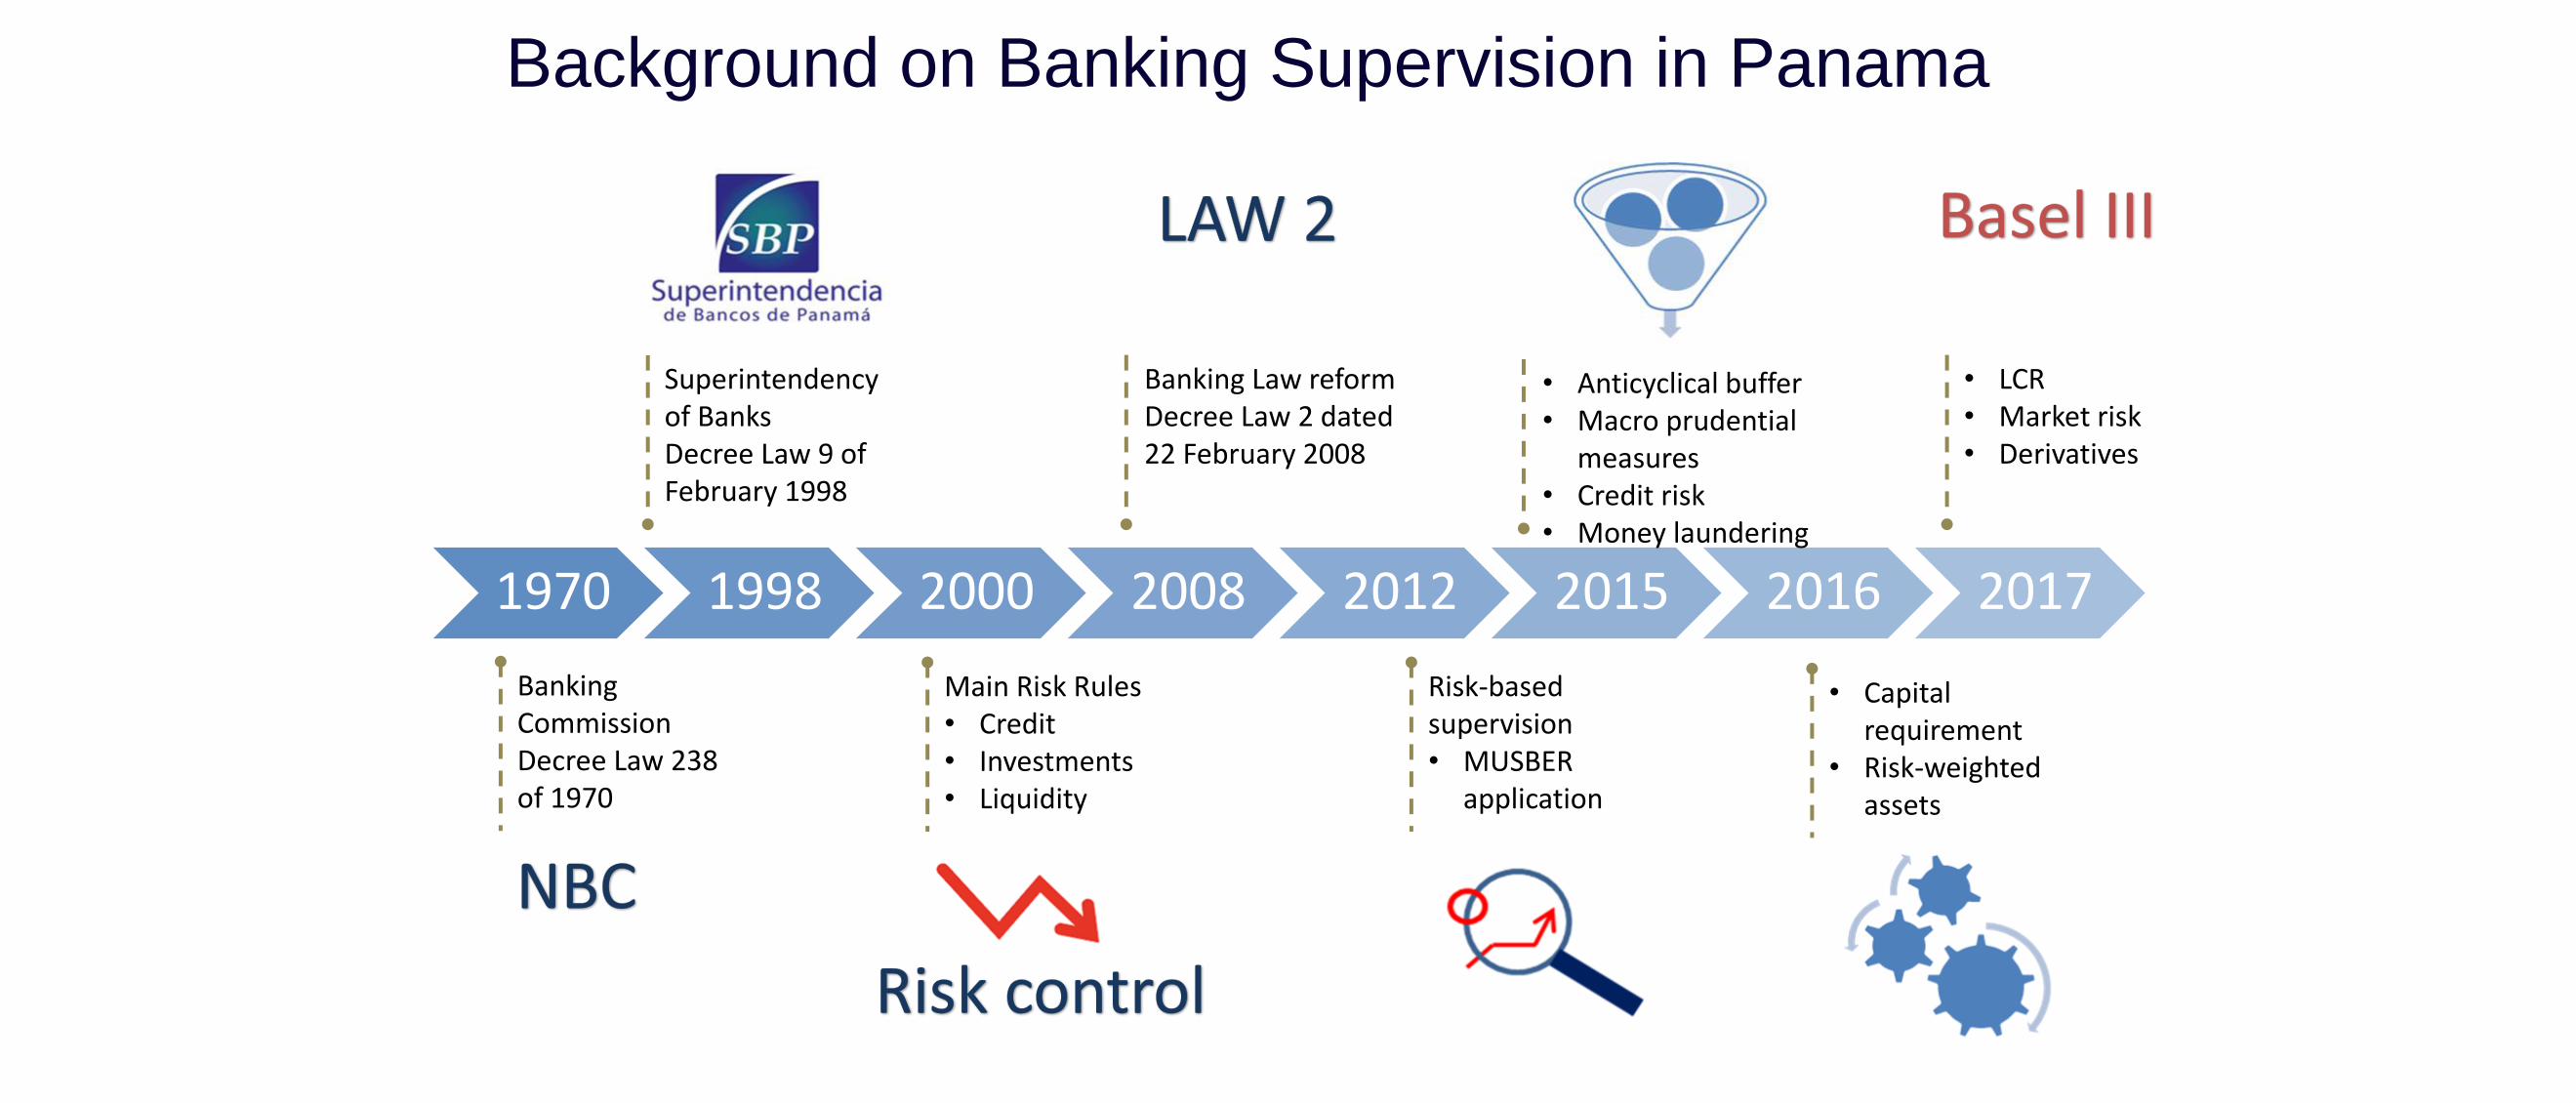
Background on Banking Supervision in Panama
1970 1998 2000 2008 2012 2015 2016 2017
Superintendencyof BanksDecree Law 9 of February 1998
Banking Law reformDecree Law 2 dated 22 February 2008
• Anticyclical buffer• Macro prudential
measures• Credit risk• Money laundering
• LCR• Market risk• Derivatives
Banking Commission Decree Law 238 of 1970
Main Risk Rules• Credit• Investments• Liquidity
Risk-based supervision• MUSBER
application
• Capital requirement
• Risk-weighted assets
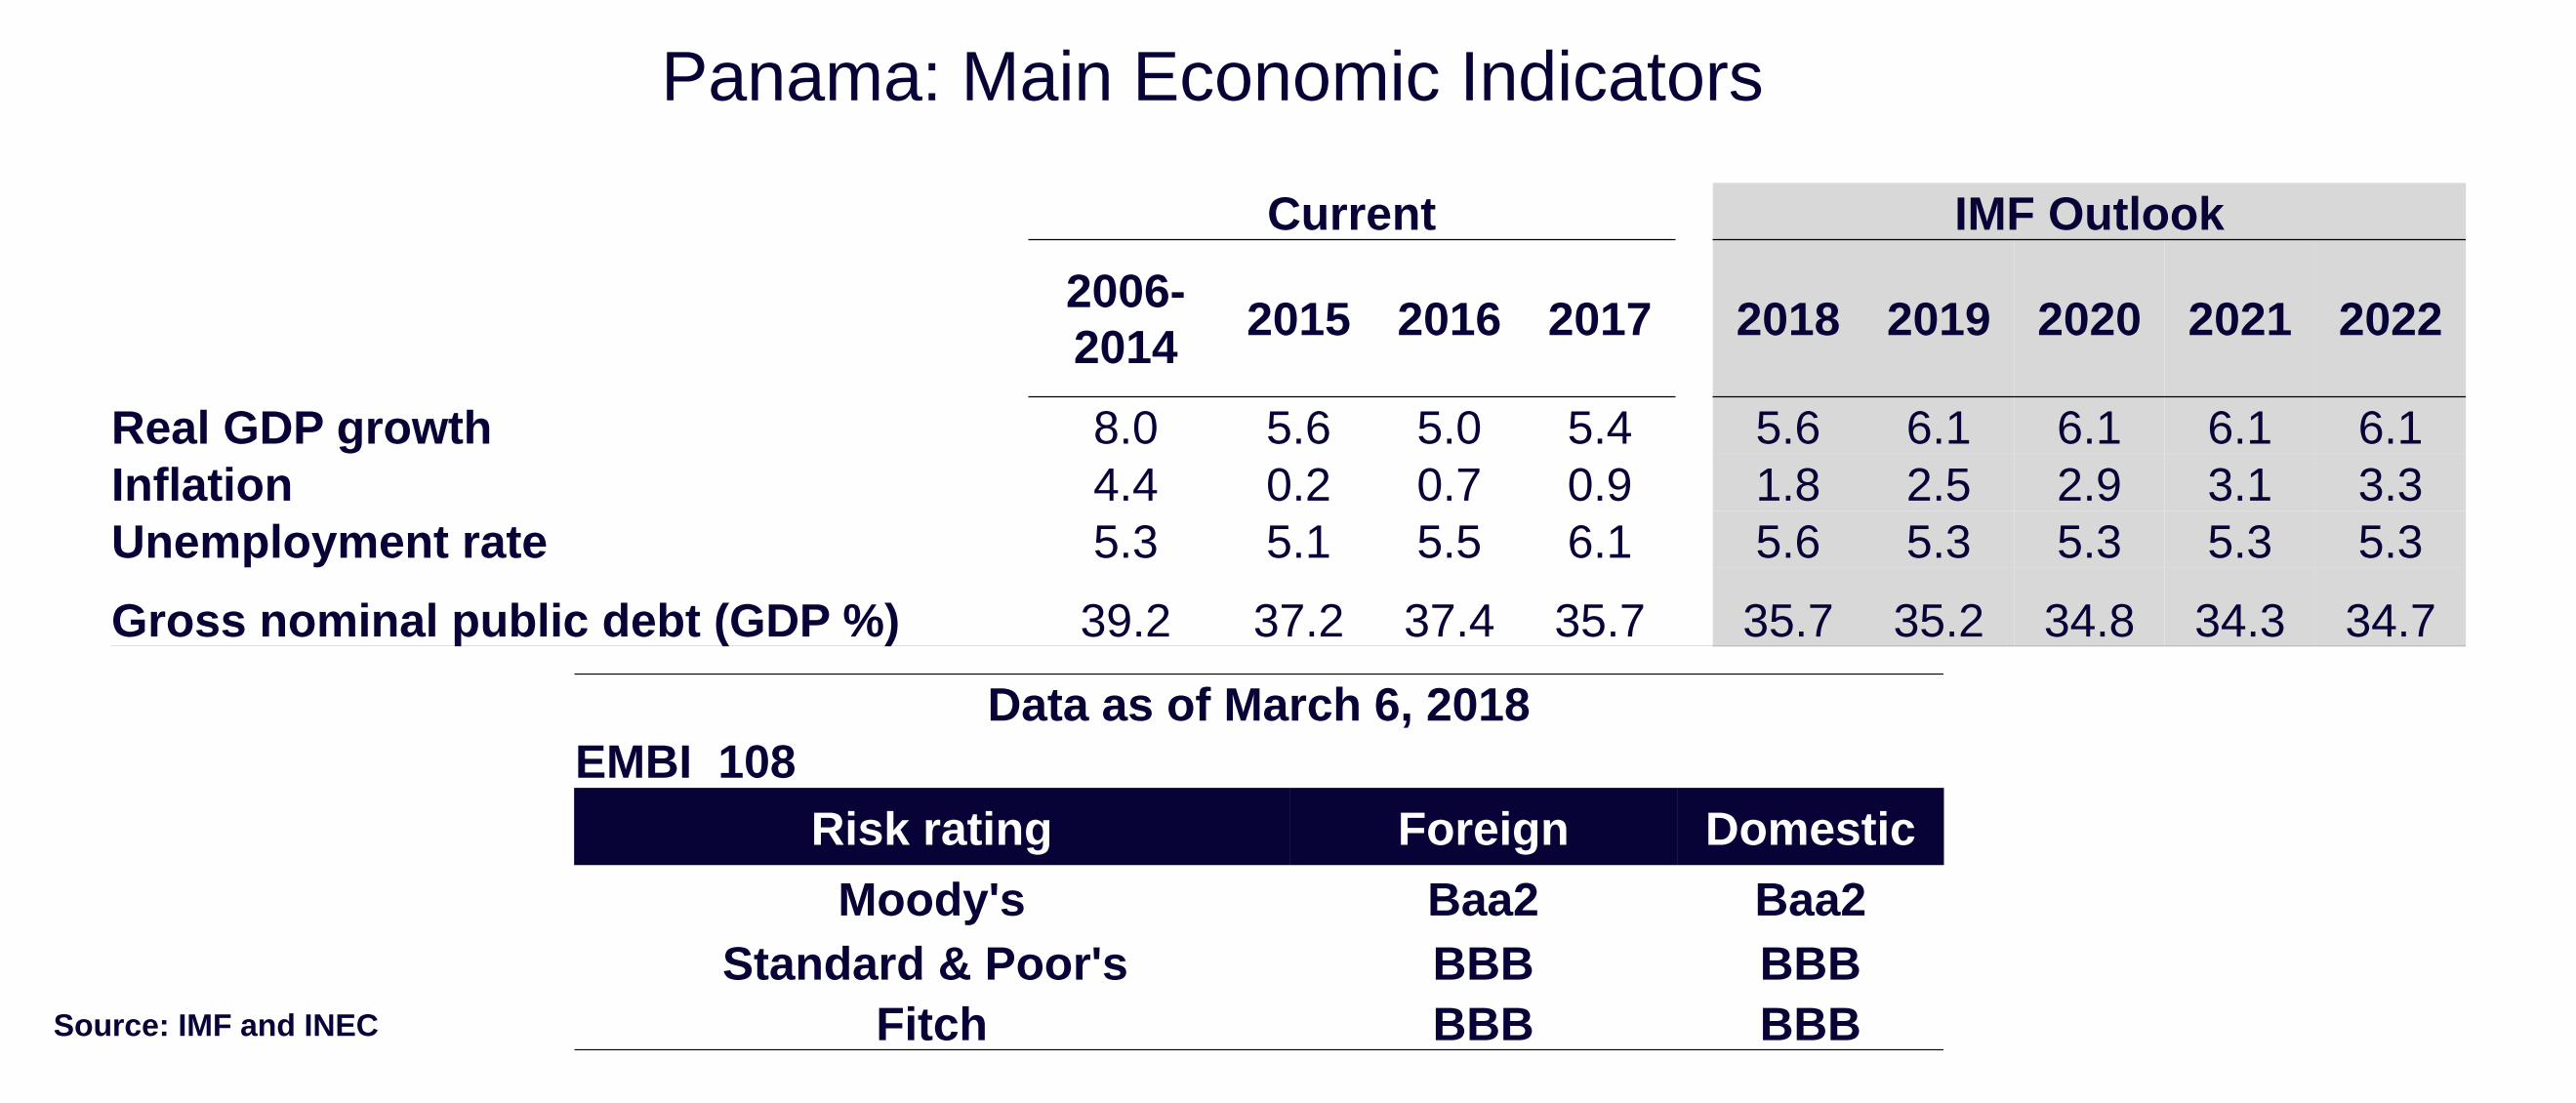
Panama: Main Economic Indicators
Source: IMF and INEC
Data as of March 6, 2018
EMBI 108
Risk rating Foreign Domestic
Moody's Baa2 Baa2
Standard & Poor's BBB BBB
Fitch BBB BBB
Current IMF Outlook
2006-
20142015 2016 2017 2018 2019 2020 2021 2022
Real GDP growth 8.0 5.6 5.0 5.4 5.6 6.1 6.1 6.1 6.1
Inflation 4.4 0.2 0.7 0.9 1.8 2.5 2.9 3.1 3.3
Unemployment rate 5.3 5.1 5.5 6.1 5.6 5.3 5.3 5.3 5.3
Gross nominal public debt (GDP %) 39.2 37.2 37.4 35.7 35.7 35.2 34.8 34.3 34.7
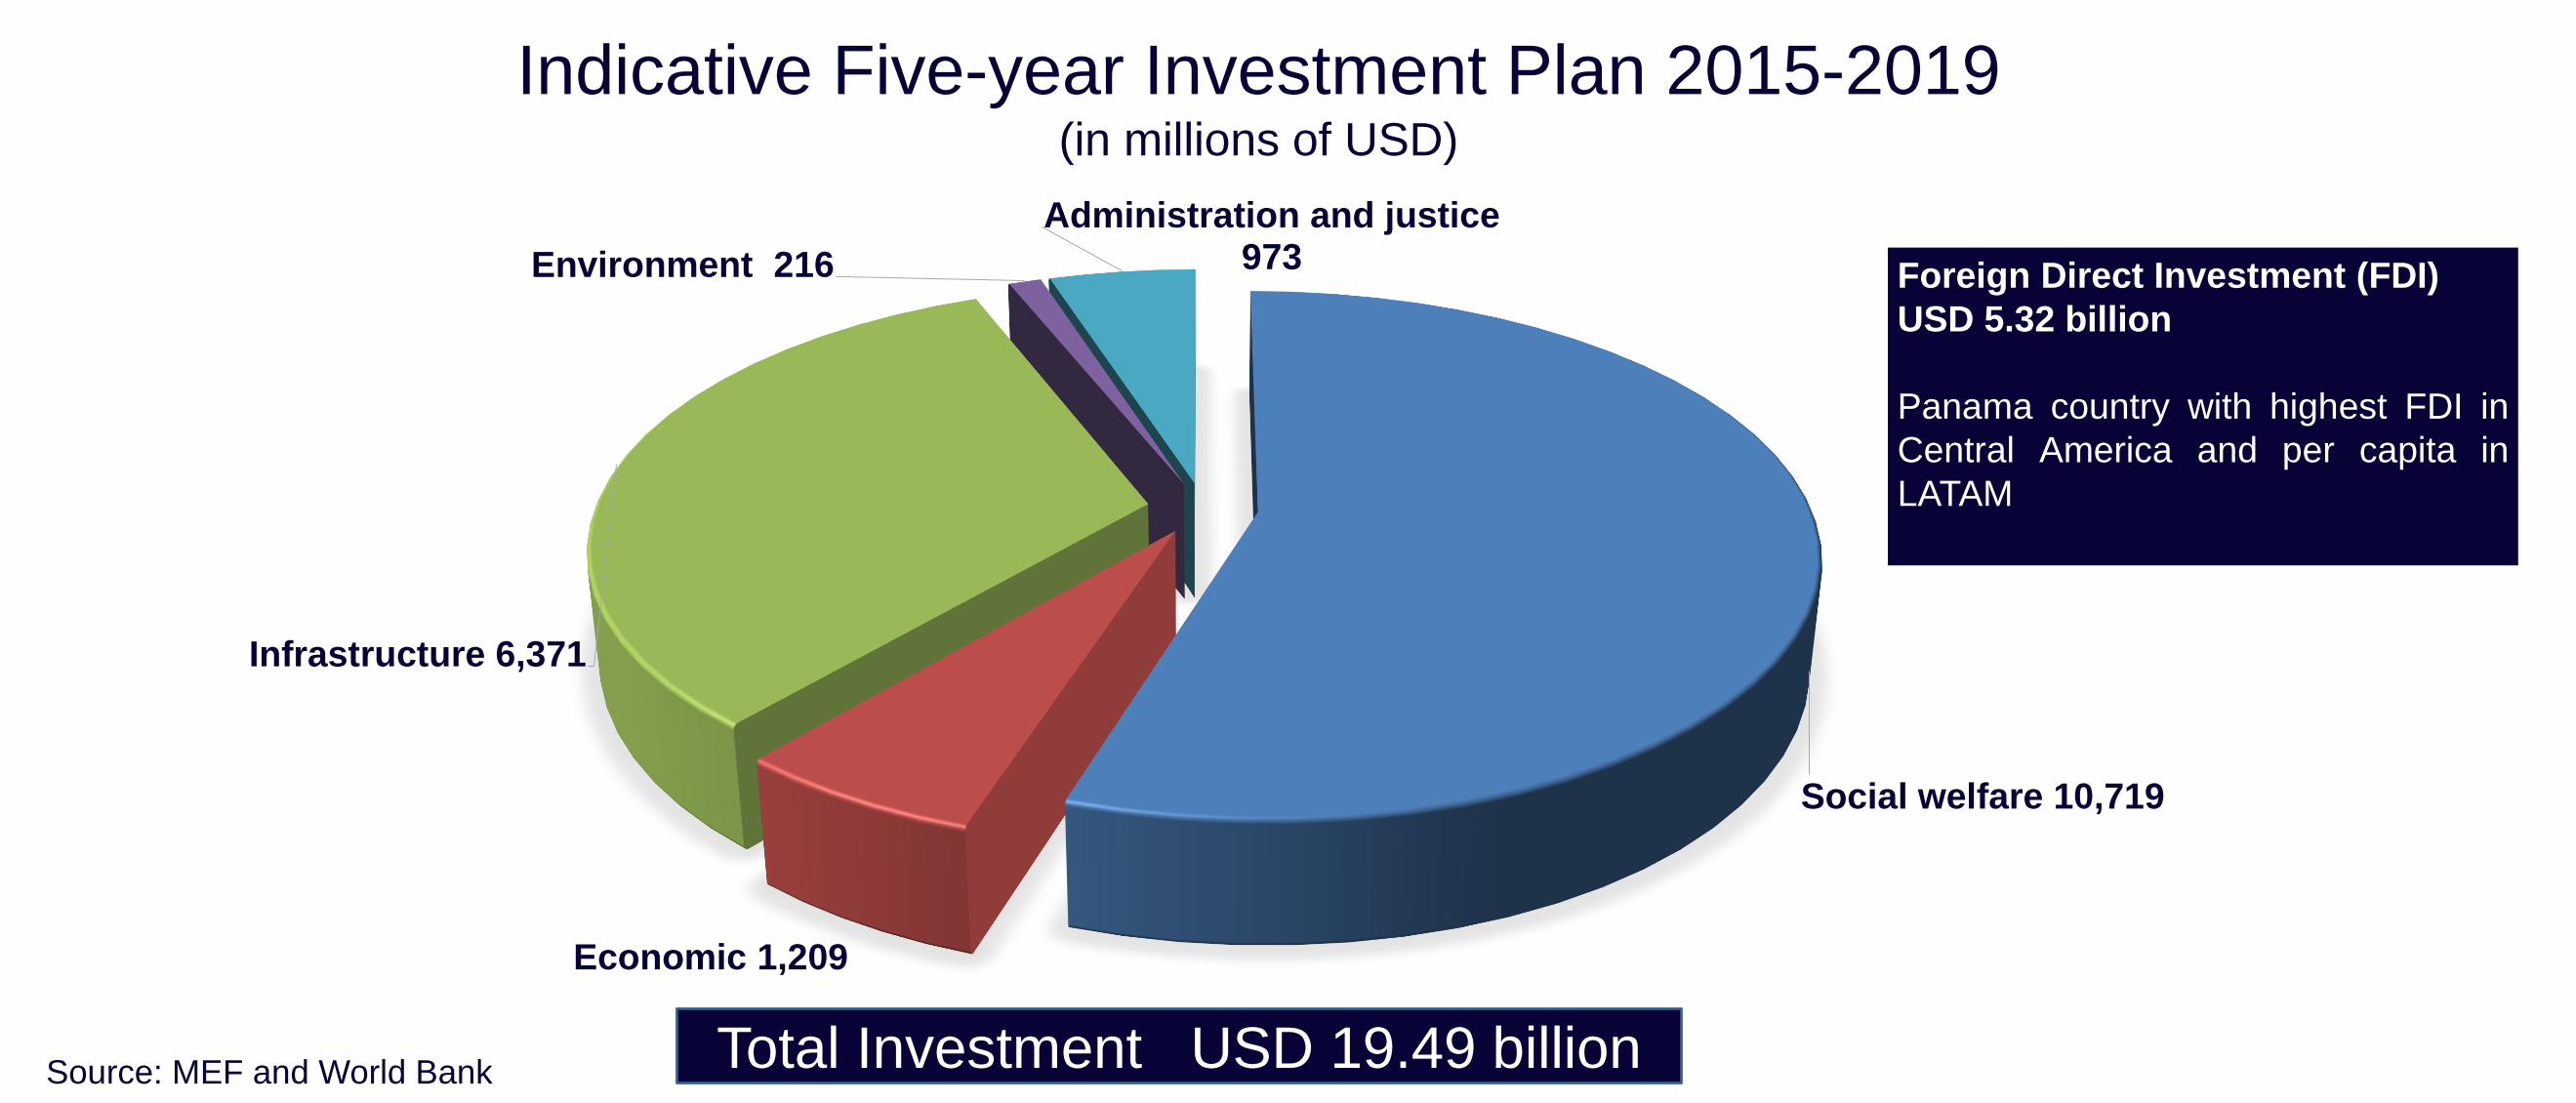
Social welfare 10,719
Economic 1,209
Infrastructure 6,371
Environment 216
Administration and justice973
Source: MEF and World Bank Total Investment USD 19.49 billion
Indicative Five-year Investment Plan 2015-2019(in millions of USD)
Foreign Direct Investment (FDI)
USD 5.32 billion
Panama country with highest FDI in
Central America and per capita in
LATAM
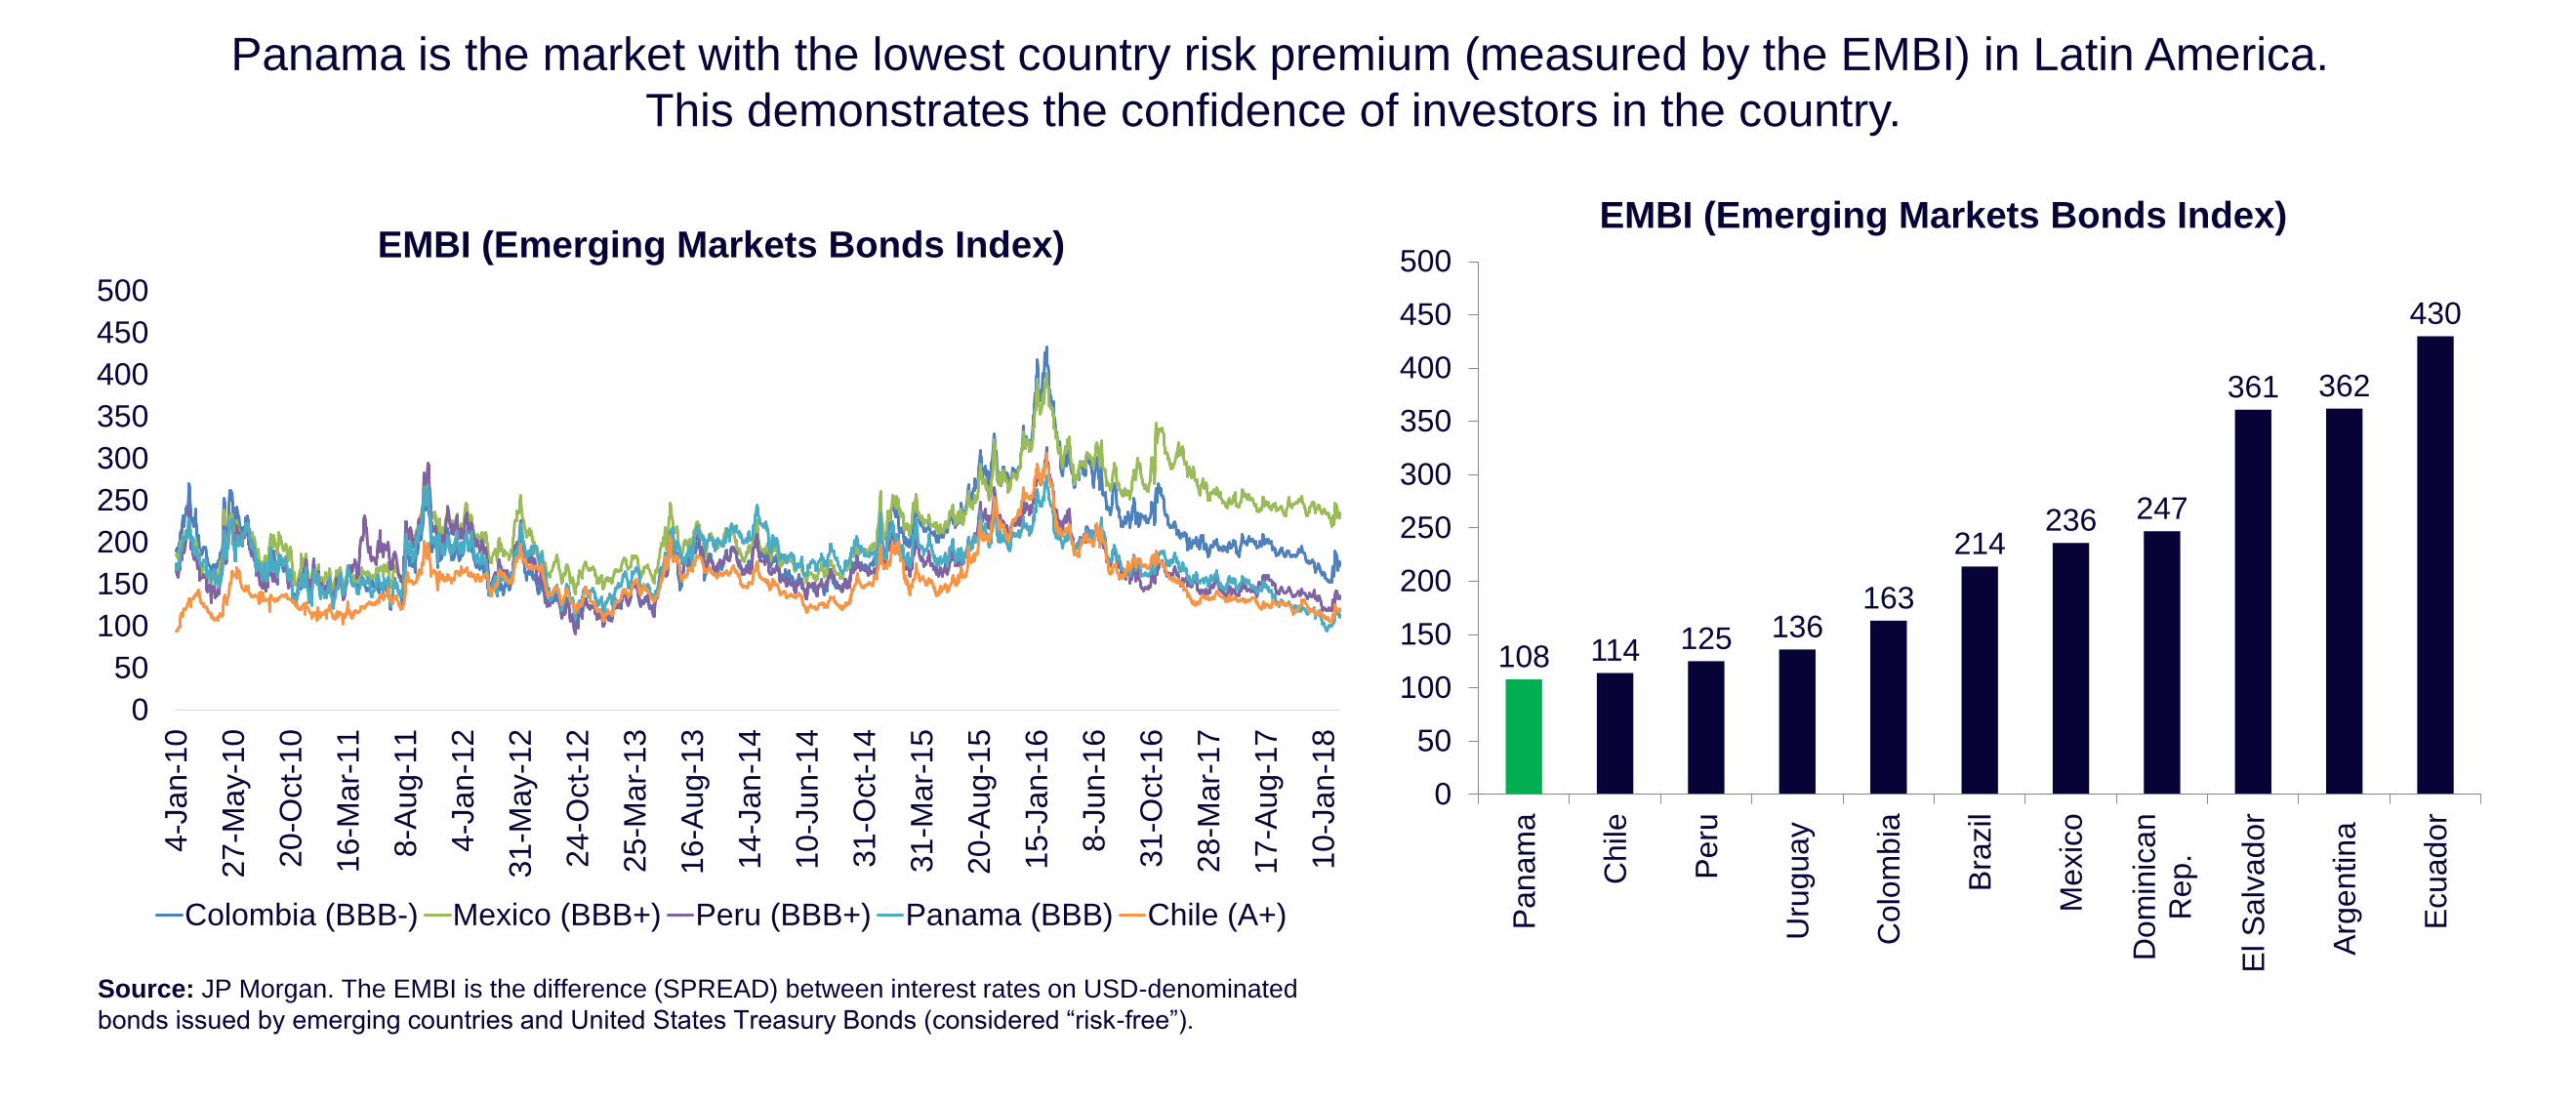
Source: JP Morgan. The EMBI is the difference (SPREAD) between interest rates on USD-denominated
bonds issued by emerging countries and United States Treasury Bonds (considered “risk-free”).
Panama is the market with the lowest country risk premium (measured by the EMBI) in Latin America.
This demonstrates the confidence of investors in the country.
0
50
100
150
200
250
300
350
400
450
500
4-J
an-1
0
27
-May-1
0
20
-Oct-
10
16
-Mar-
11
8-A
ug-1
1
4-J
an-1
2
31
-May-1
2
24
-Oct-
12
25
-Mar-
13
16
-Aug-1
3
14
-Jan
-14
10
-Jun
-14
31
-Oct-
14
31
-Mar-
15
20
-Aug-1
5
15
-Jan
-16
8-J
un-1
6
31
-Oct-
16
28
-Mar-
17
17
-Aug-1
7
10
-Jan
-18
EMBI (Emerging Markets Bonds Index)
Colombia (BBB-) Mexico (BBB+) Peru (BBB+) Panama (BBB) Chile (A+)
108 114 125 136163
214236 247
361 362
430
0
50
100
150
200
250
300
350
400
450
500
Panam
a
Chile
Peru
Uru
guay
Colo
mbia
Bra
zil
Mexic
o
Dom
inic
an
Rep.
El S
alv
ador
Arg
entina
Ecuador
EMBI (Emerging Markets Bonds Index)
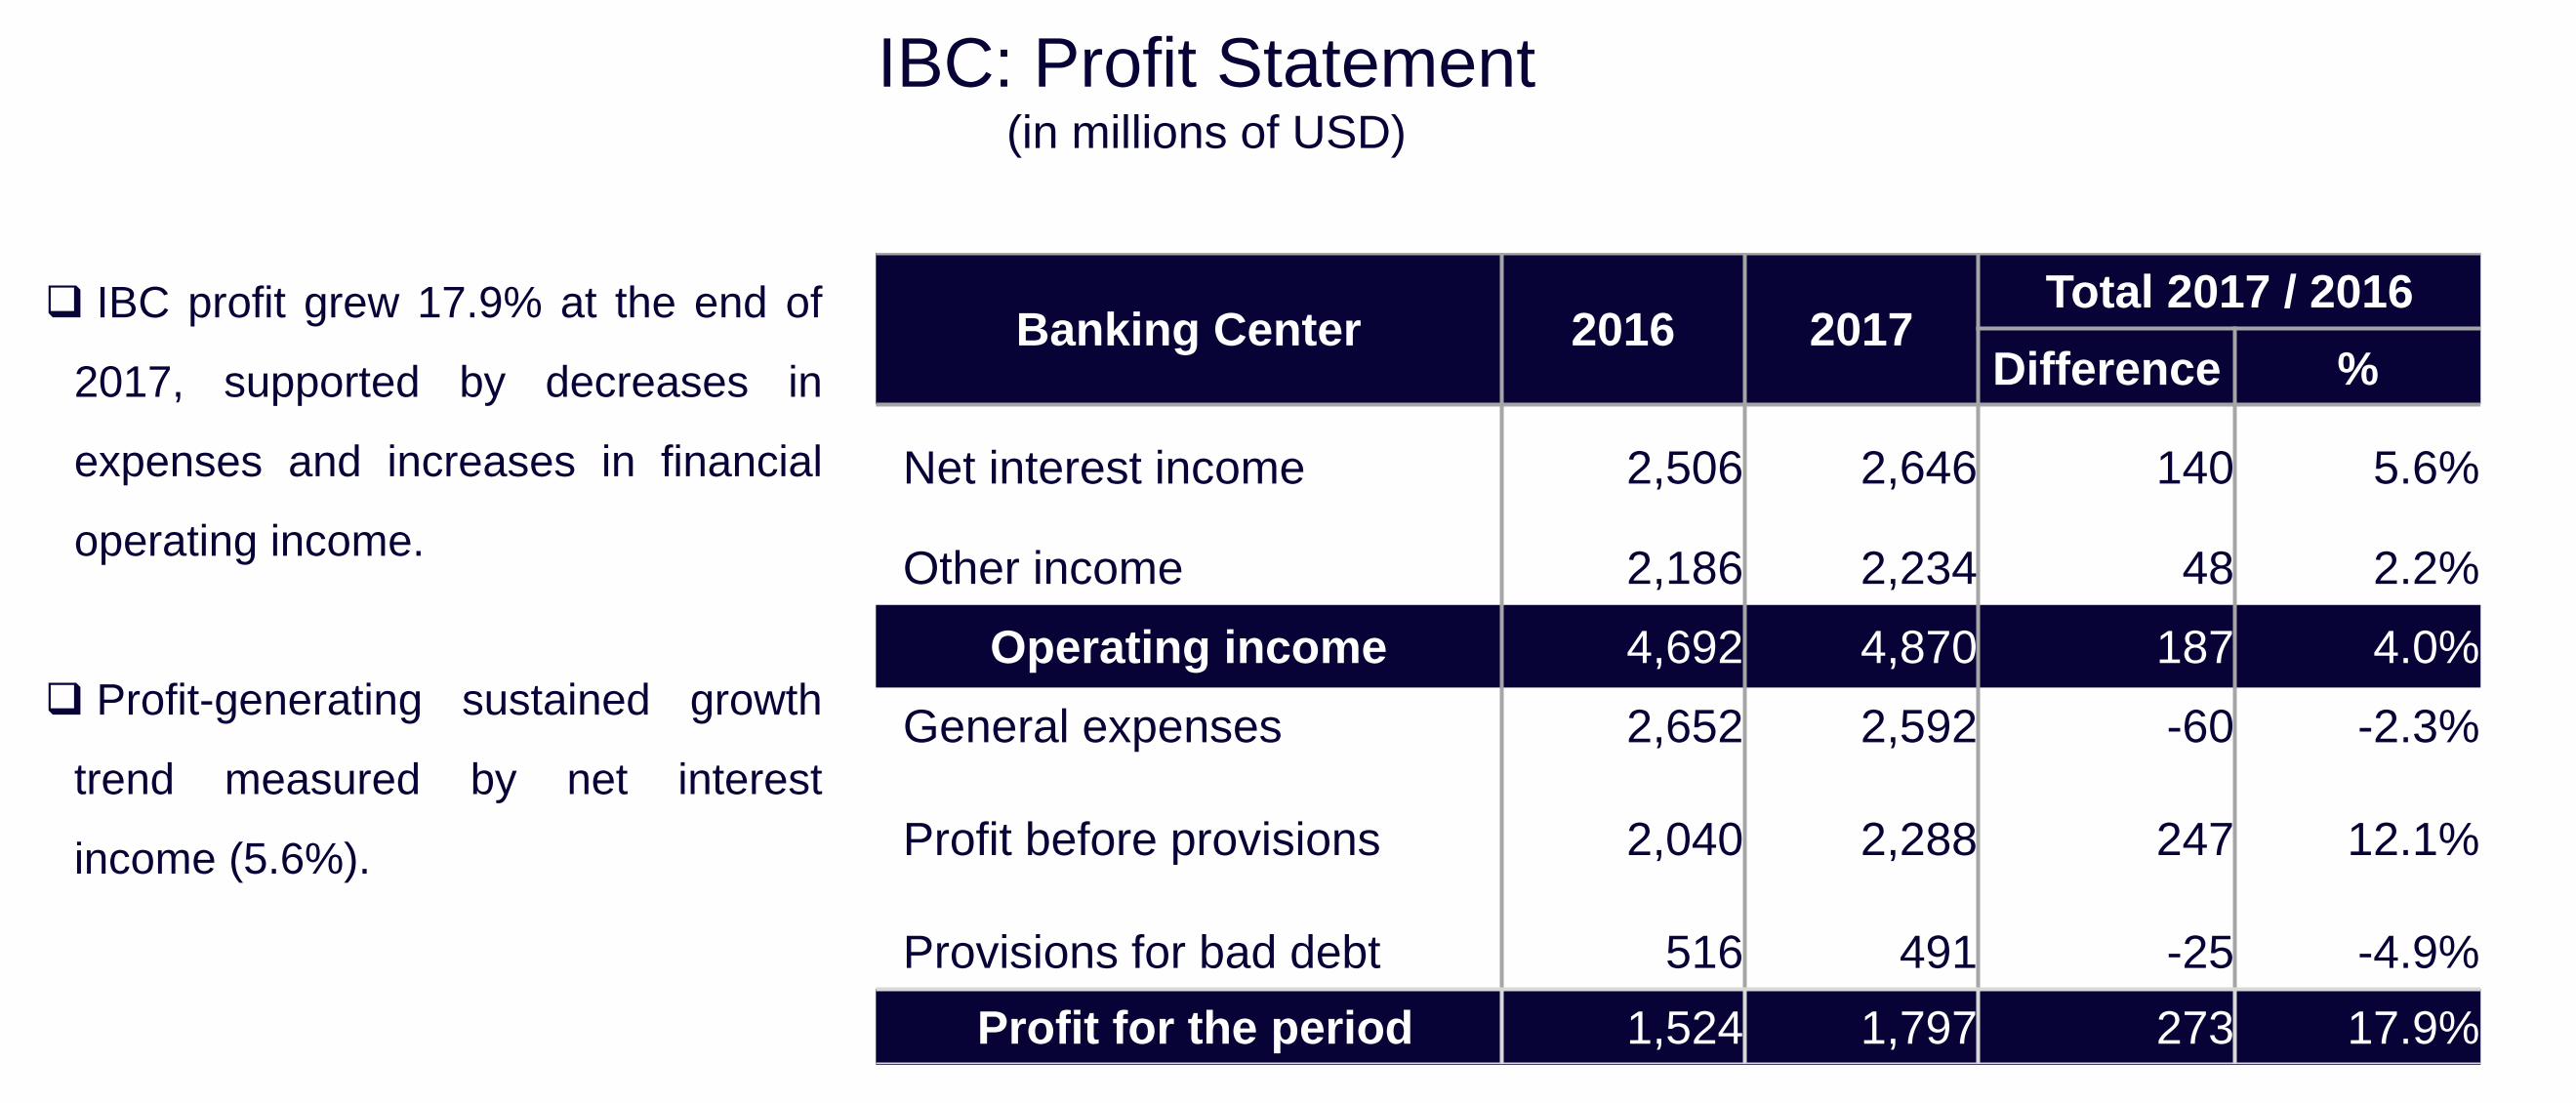
Banking Center 2016 2017Total 2017 / 2016
Difference %
Net interest income 2,506 2,646 140 5.6%
Other income 2,186 2,234 48 2.2%
Operating income 4,692 4,870 187 4.0%
General expenses 2,652 2,592 -60 -2.3%
Profit before provisions 2,040 2,288 247 12.1%
Provisions for bad debt 516 491 -25 -4.9%
Profit for the period 1,524 1,797 273 17.9%
IBC profit grew 17.9% at the end of
2017, supported by decreases in
expenses and increases in financial
operating income.
Profit-generating sustained growth
trend measured by net interest
income (5.6%).
IBC: Profit Statement(in millions of USD)
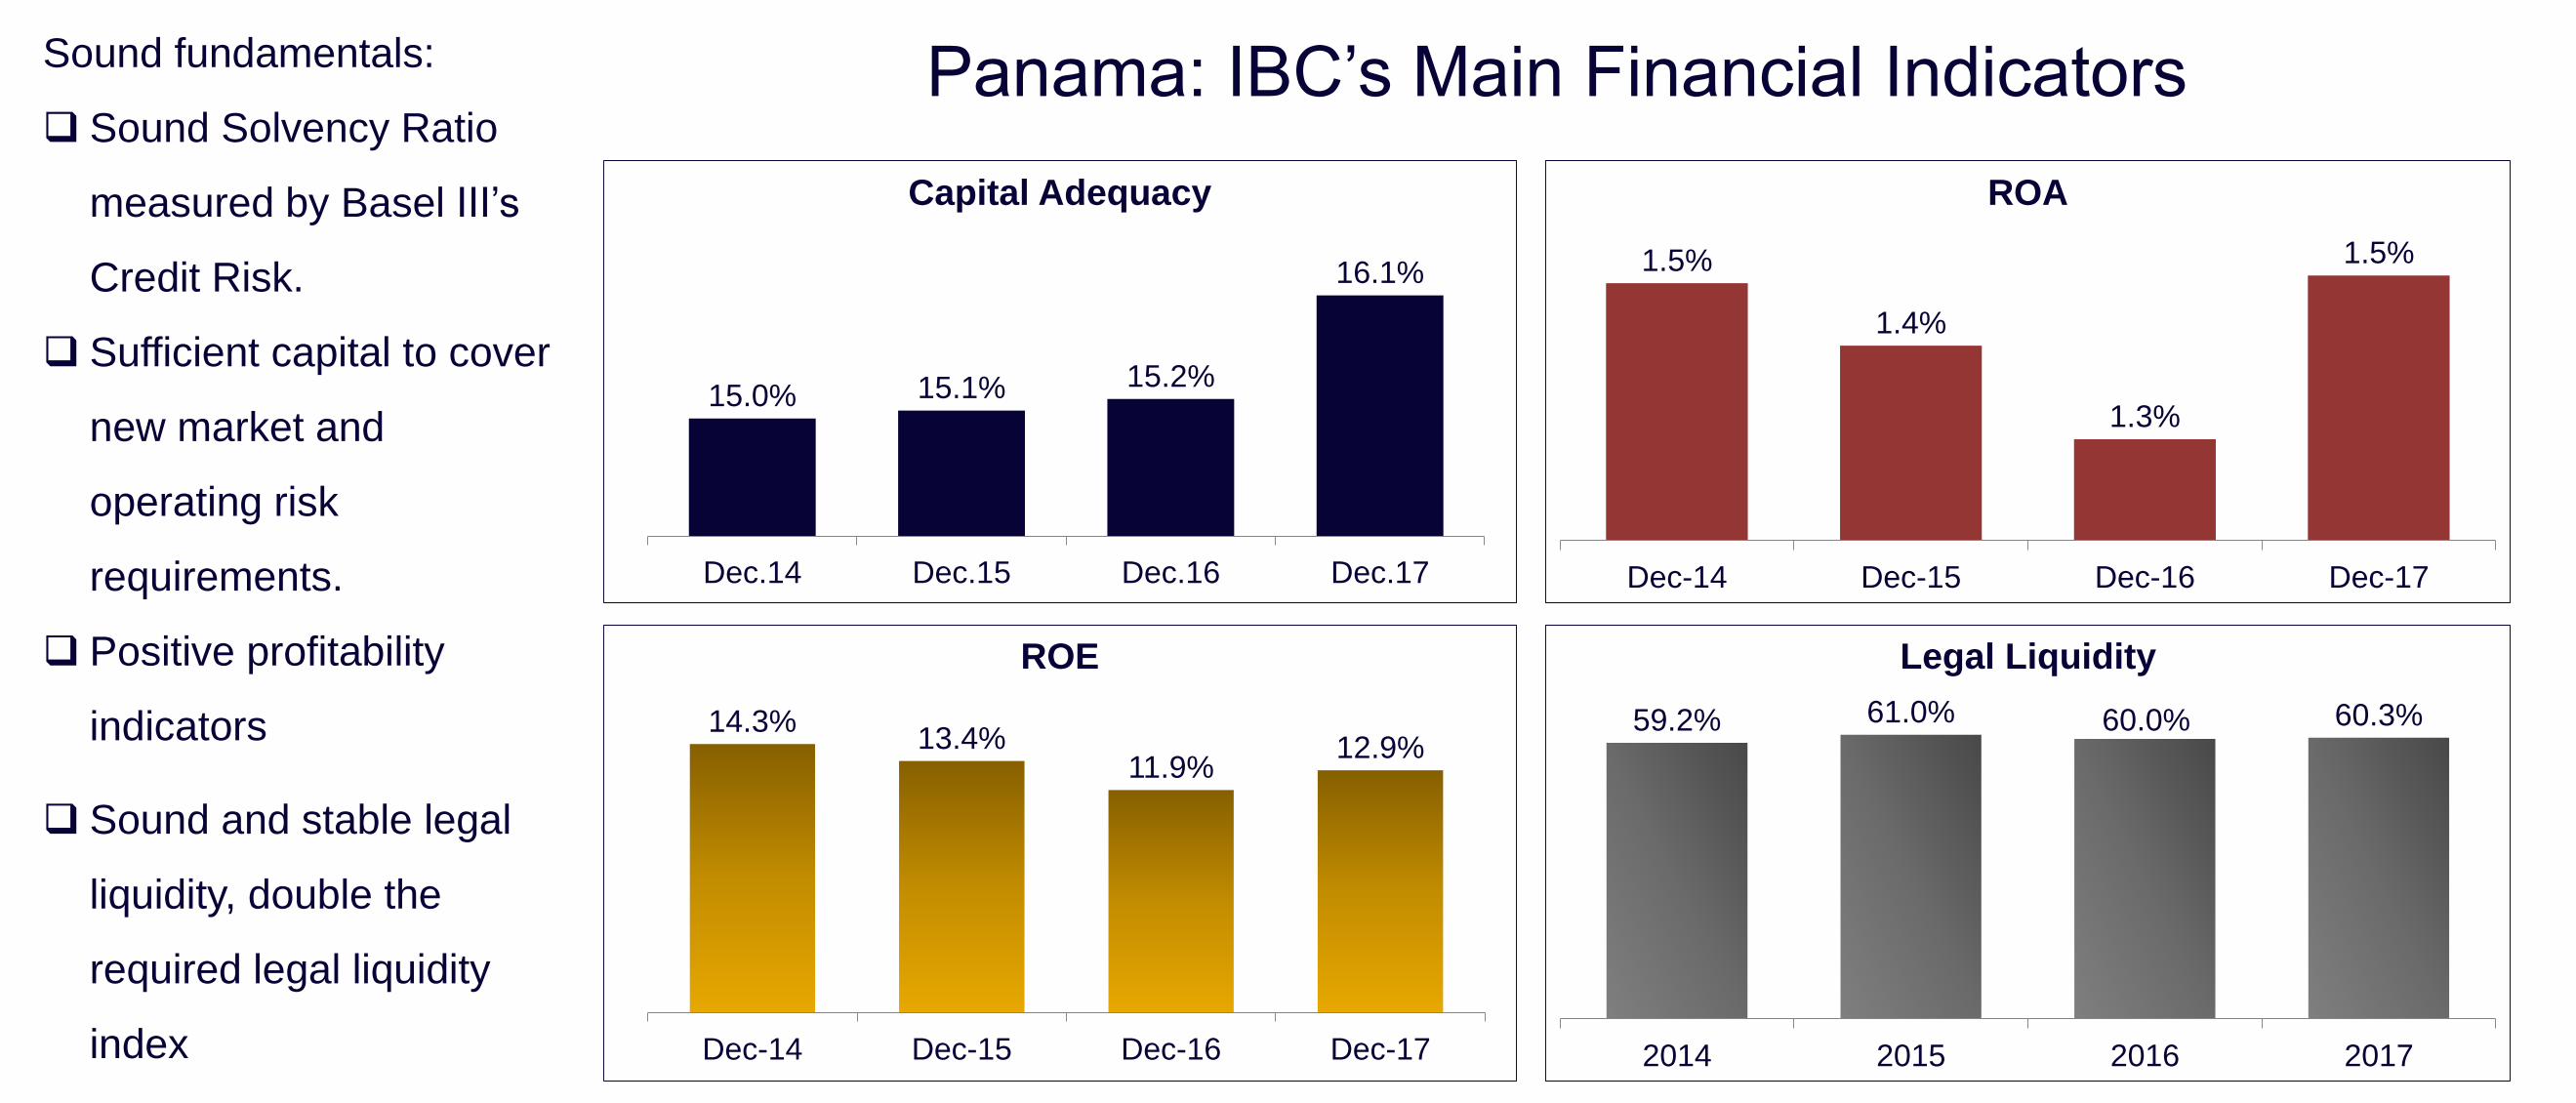
15.0% 15.1% 15.2%
16.1%
Dec.14 Dec.15 Dec.16 Dec.17
Capital Adequacy
59.2% 61.0% 60.0% 60.3%
2014 2015 2016 2017
Legal Liquidity
14.3%13.4%
11.9%12.9%
Dec-14 Dec-15 Dec-16 Dec-17
ROE
1.5%
1.4%
1.3%
1.5%
Dec-14 Dec-15 Dec-16 Dec-17
ROA
Panama: IBC’s Main Financial IndicatorsSound fundamentals:
Sound Solvency Ratio
measured by Basel III’s
Credit Risk.
Sufficient capital to cover
new market and
operating risk
requirements.
Positive profitability
indicators
Sound and stable legal
liquidity, double the
required legal liquidity
index
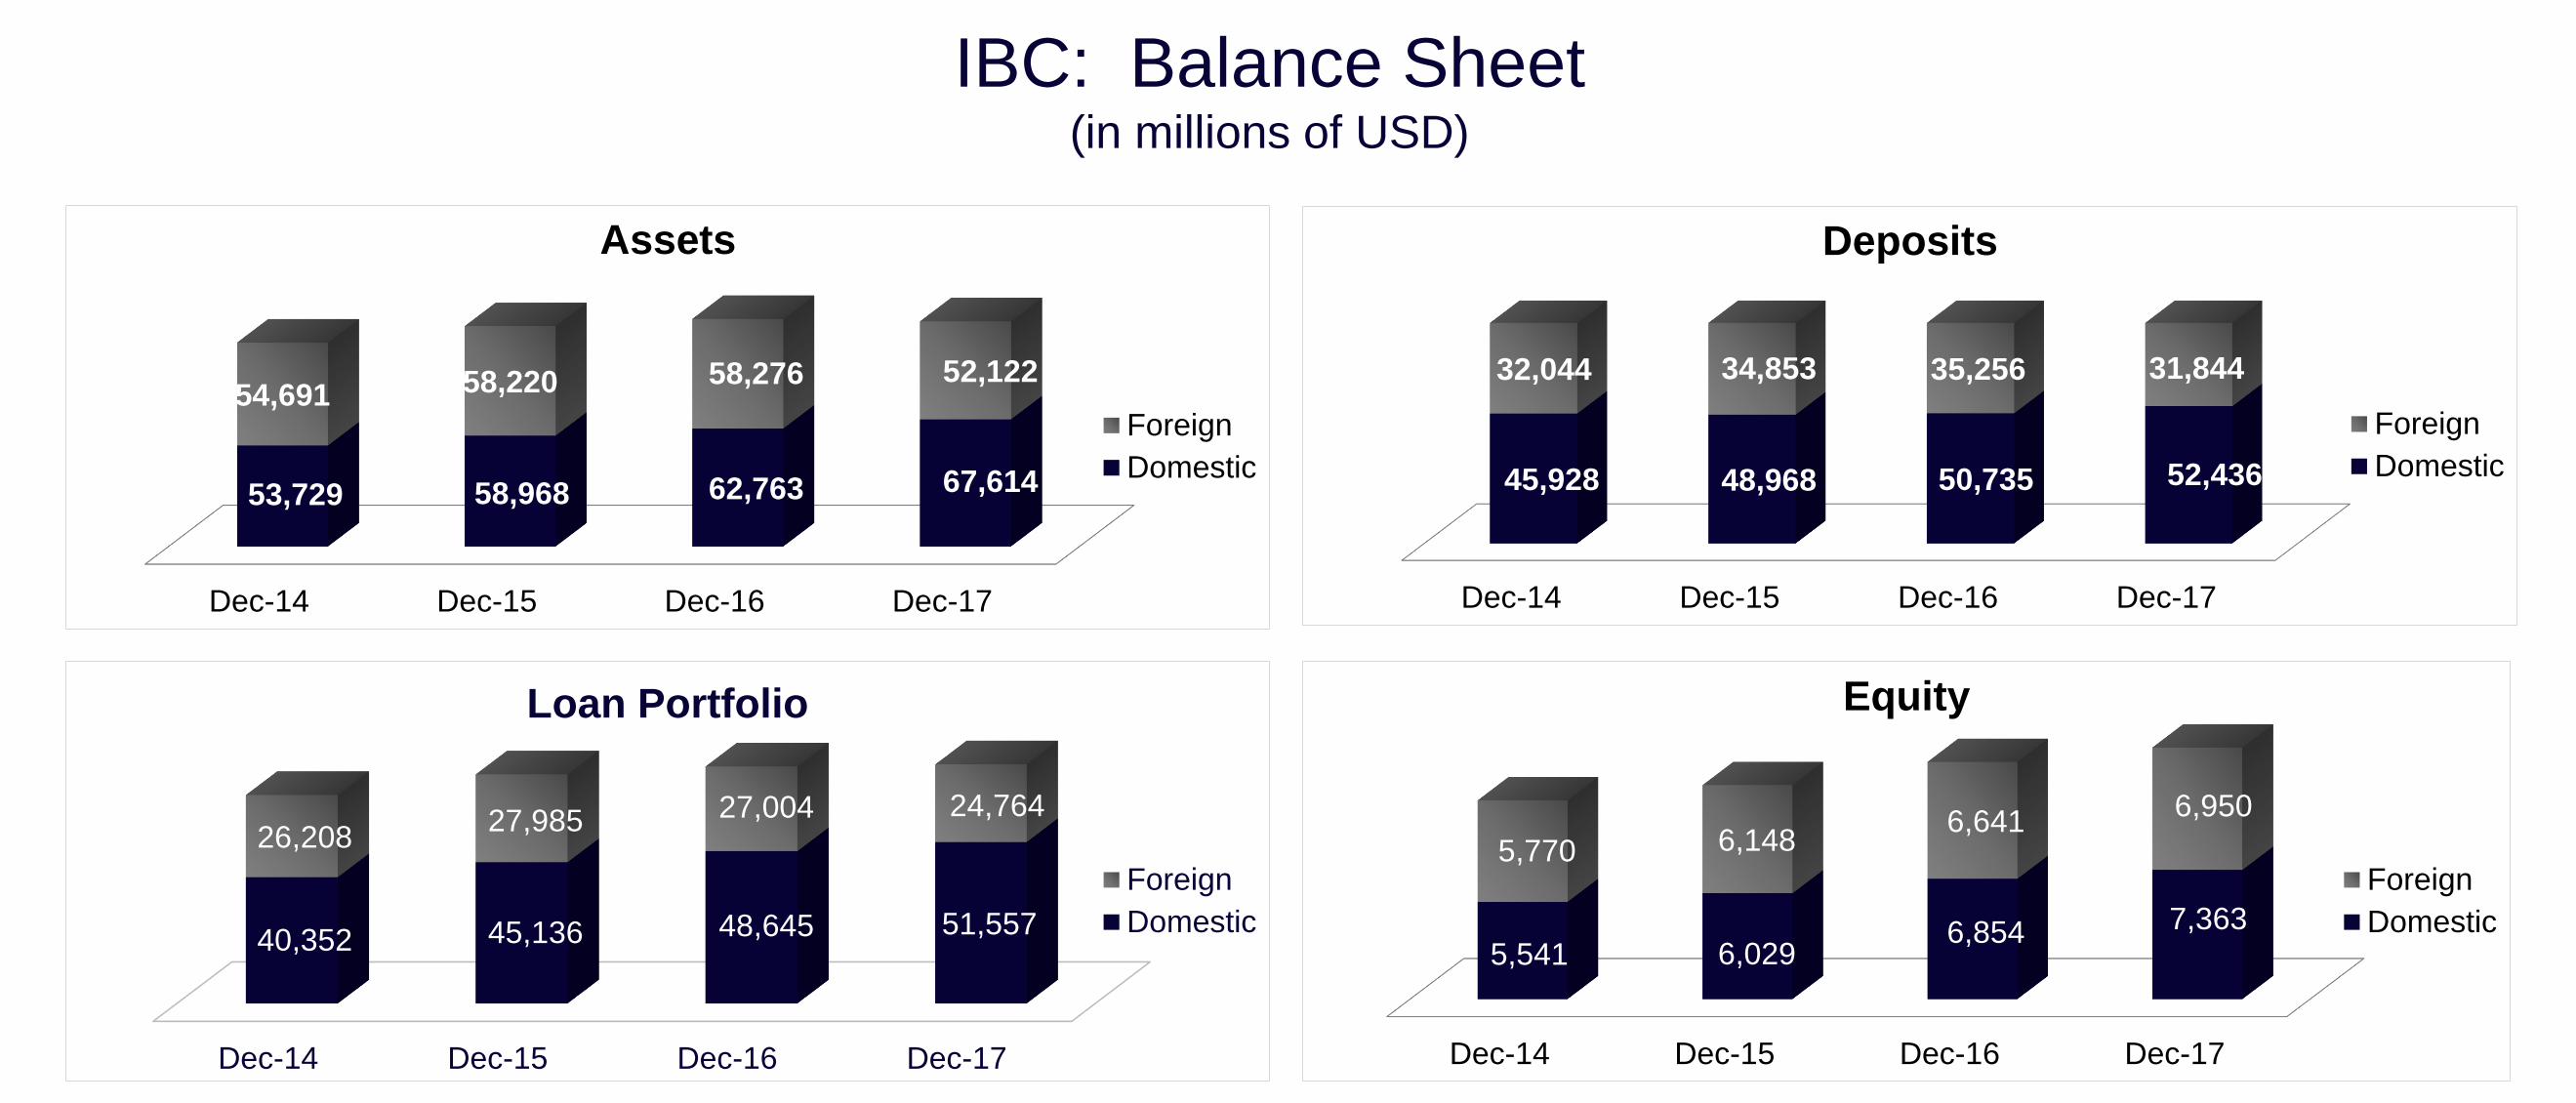
IBC: Balance Sheet (in millions of USD)
Dec-14 Dec-15 Dec-16 Dec-17
53,729 58,968 62,763 67,614
54,691 58,220 58,276 52,122
Assets
Foreign
Domestic
Dec-14 Dec-15 Dec-16 Dec-17
45,928 48,968 50,735 52,436
32,044 34,853 35,256 31,844
Deposits
Foreign
Domestic
Dec-14 Dec-15 Dec-16 Dec-17
40,352 45,136 48,645 51,557
26,20827,985 27,004 24,764
Loan Portfolio
Foreign
Domestic
Dec-14 Dec-15 Dec-16 Dec-17
5,541 6,0296,854 7,363
5,770 6,1486,641
6,950
Equity
Foreign
Domestic
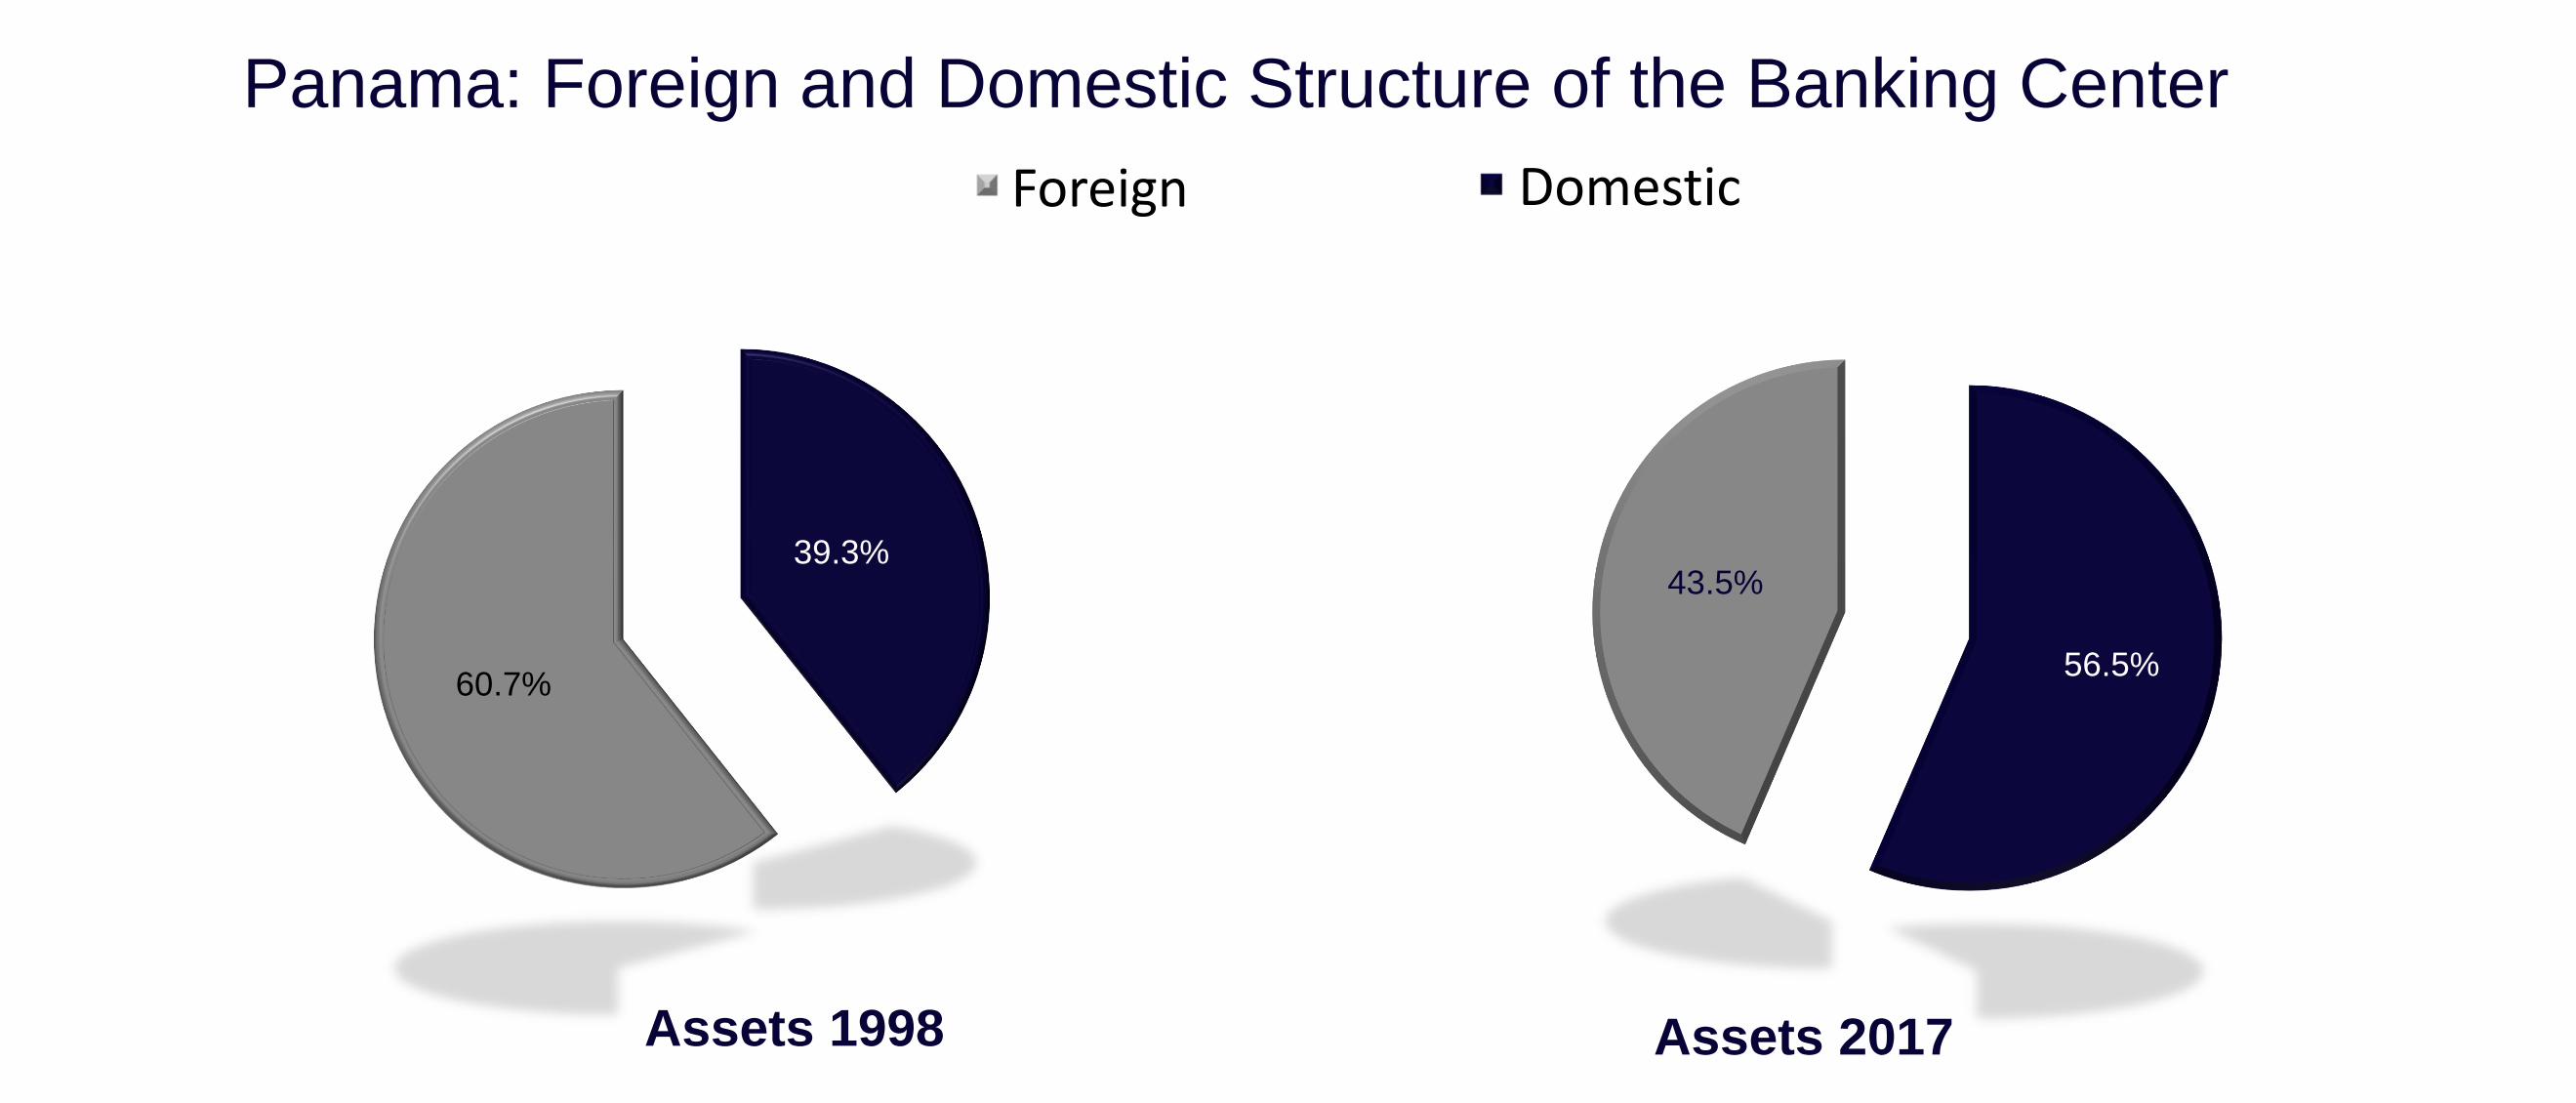
39.3%
60.7%
Assets 1998
56.5%
43.5%
Assets 2017
Panama: Foreign and Domestic Structure of the Banking Center
Foreign Domestic
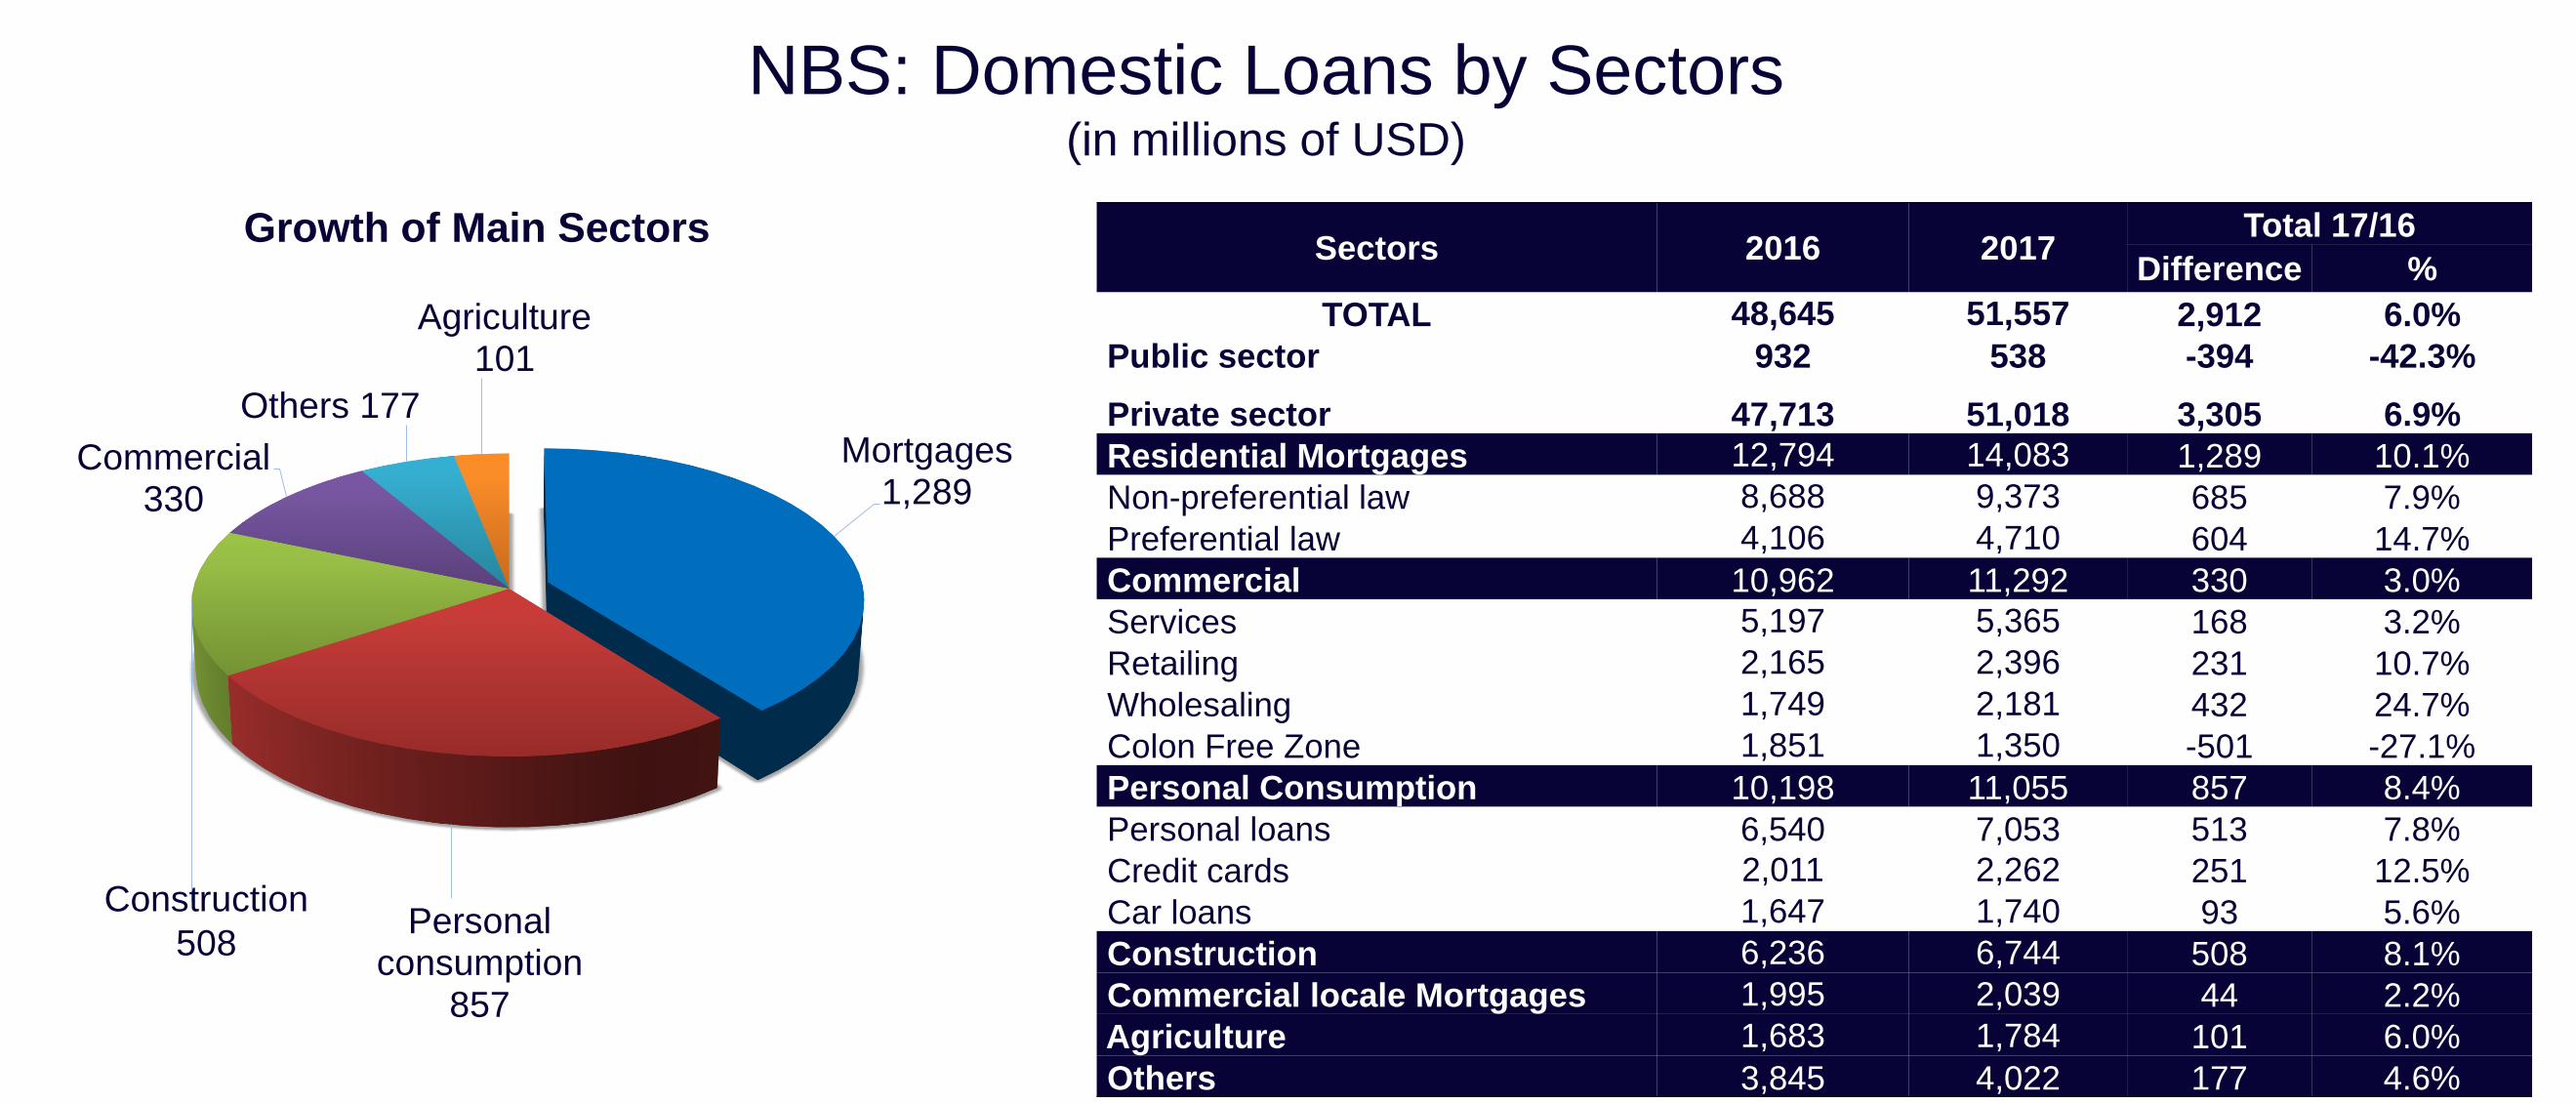
Sectors 2016 2017Total 17/16
Difference %
TOTAL 48,645 51,557 2,912 6.0%
Public sector 932 538 -394 -42.3%
Private sector 47,713 51,018 3,305 6.9%
Residential Mortgages 12,794 14,083 1,289 10.1%
Non-preferential law 8,688 9,373 685 7.9%
Preferential law 4,106 4,710 604 14.7%
Commercial 10,962 11,292 330 3.0%
Services 5,197 5,365 168 3.2%
Retailing 2,165 2,396 231 10.7%
Wholesaling 1,749 2,181 432 24.7%
Colon Free Zone 1,851 1,350 -501 -27.1%
Personal Consumption 10,198 11,055 857 8.4%
Personal loans 6,540 7,053 513 7.8%
Credit cards 2,011 2,262 251 12.5%
Car loans 1,647 1,740 93 5.6%
Construction 6,236 6,744 508 8.1%
Commercial locale Mortgages 1,995 2,039 44 2.2%
Agriculture 1,683 1,784 101 6.0%
Others 3,845 4,022 177 4.6%
Mortgages1,289
Personal consumption
857
Construction
508
Commercial330
Others 177
Agriculture 101
Growth of Main Sectors
NBS: Domestic Loans by Sectors(in millions of USD)
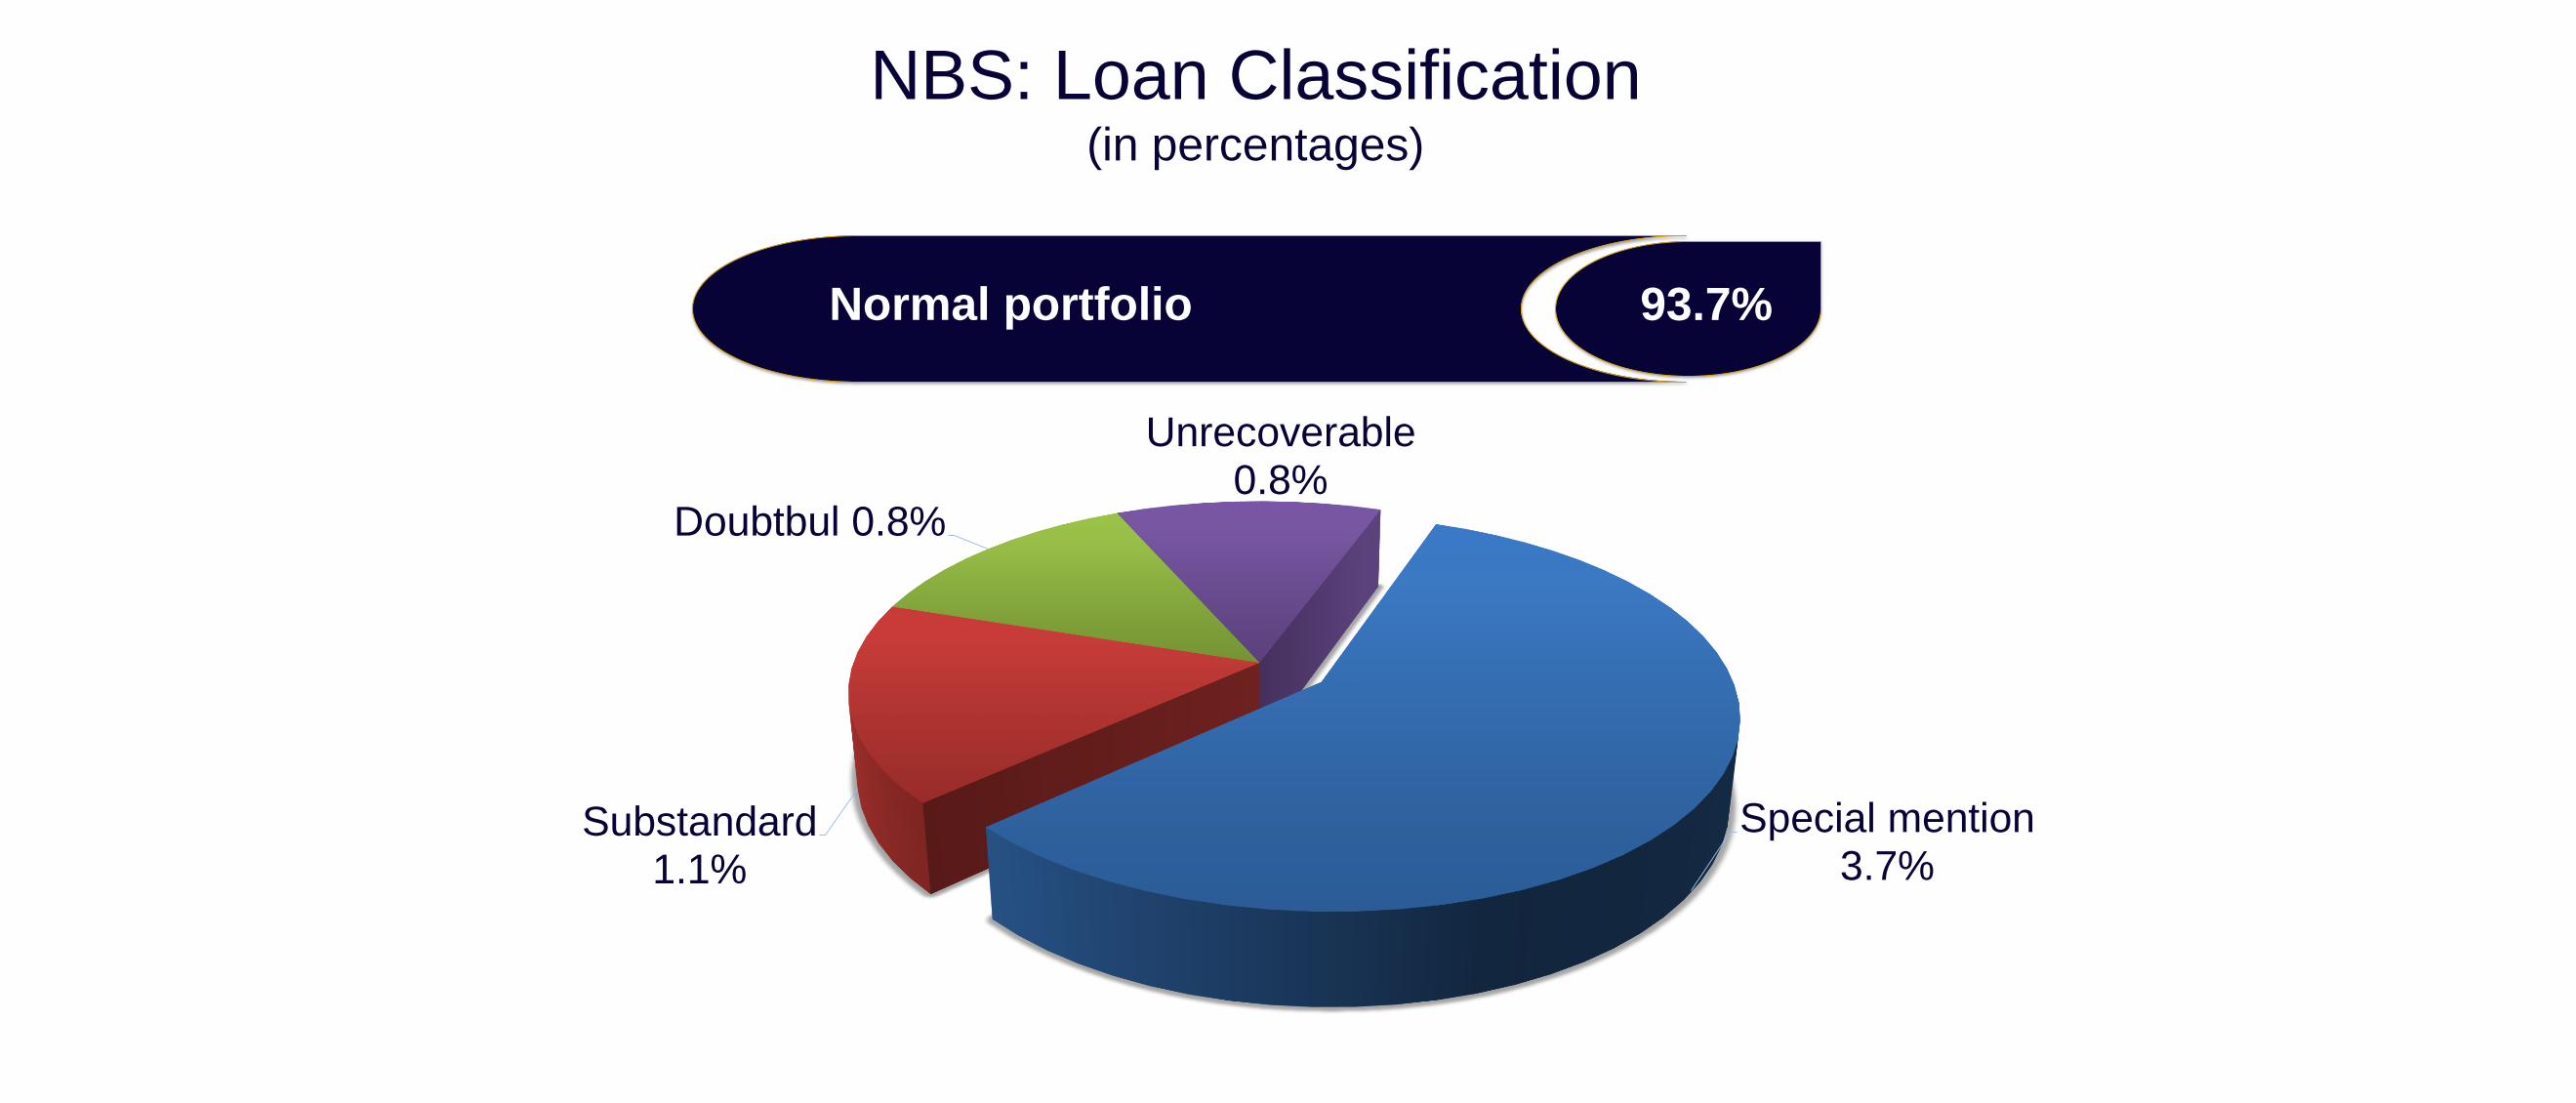
93.7%Normal portfolio
Special mention3.7%
Substandard1.1%
Doubtbul 0.8%
Unrecoverable0.8%
NBS: Loan Classification(in percentages)
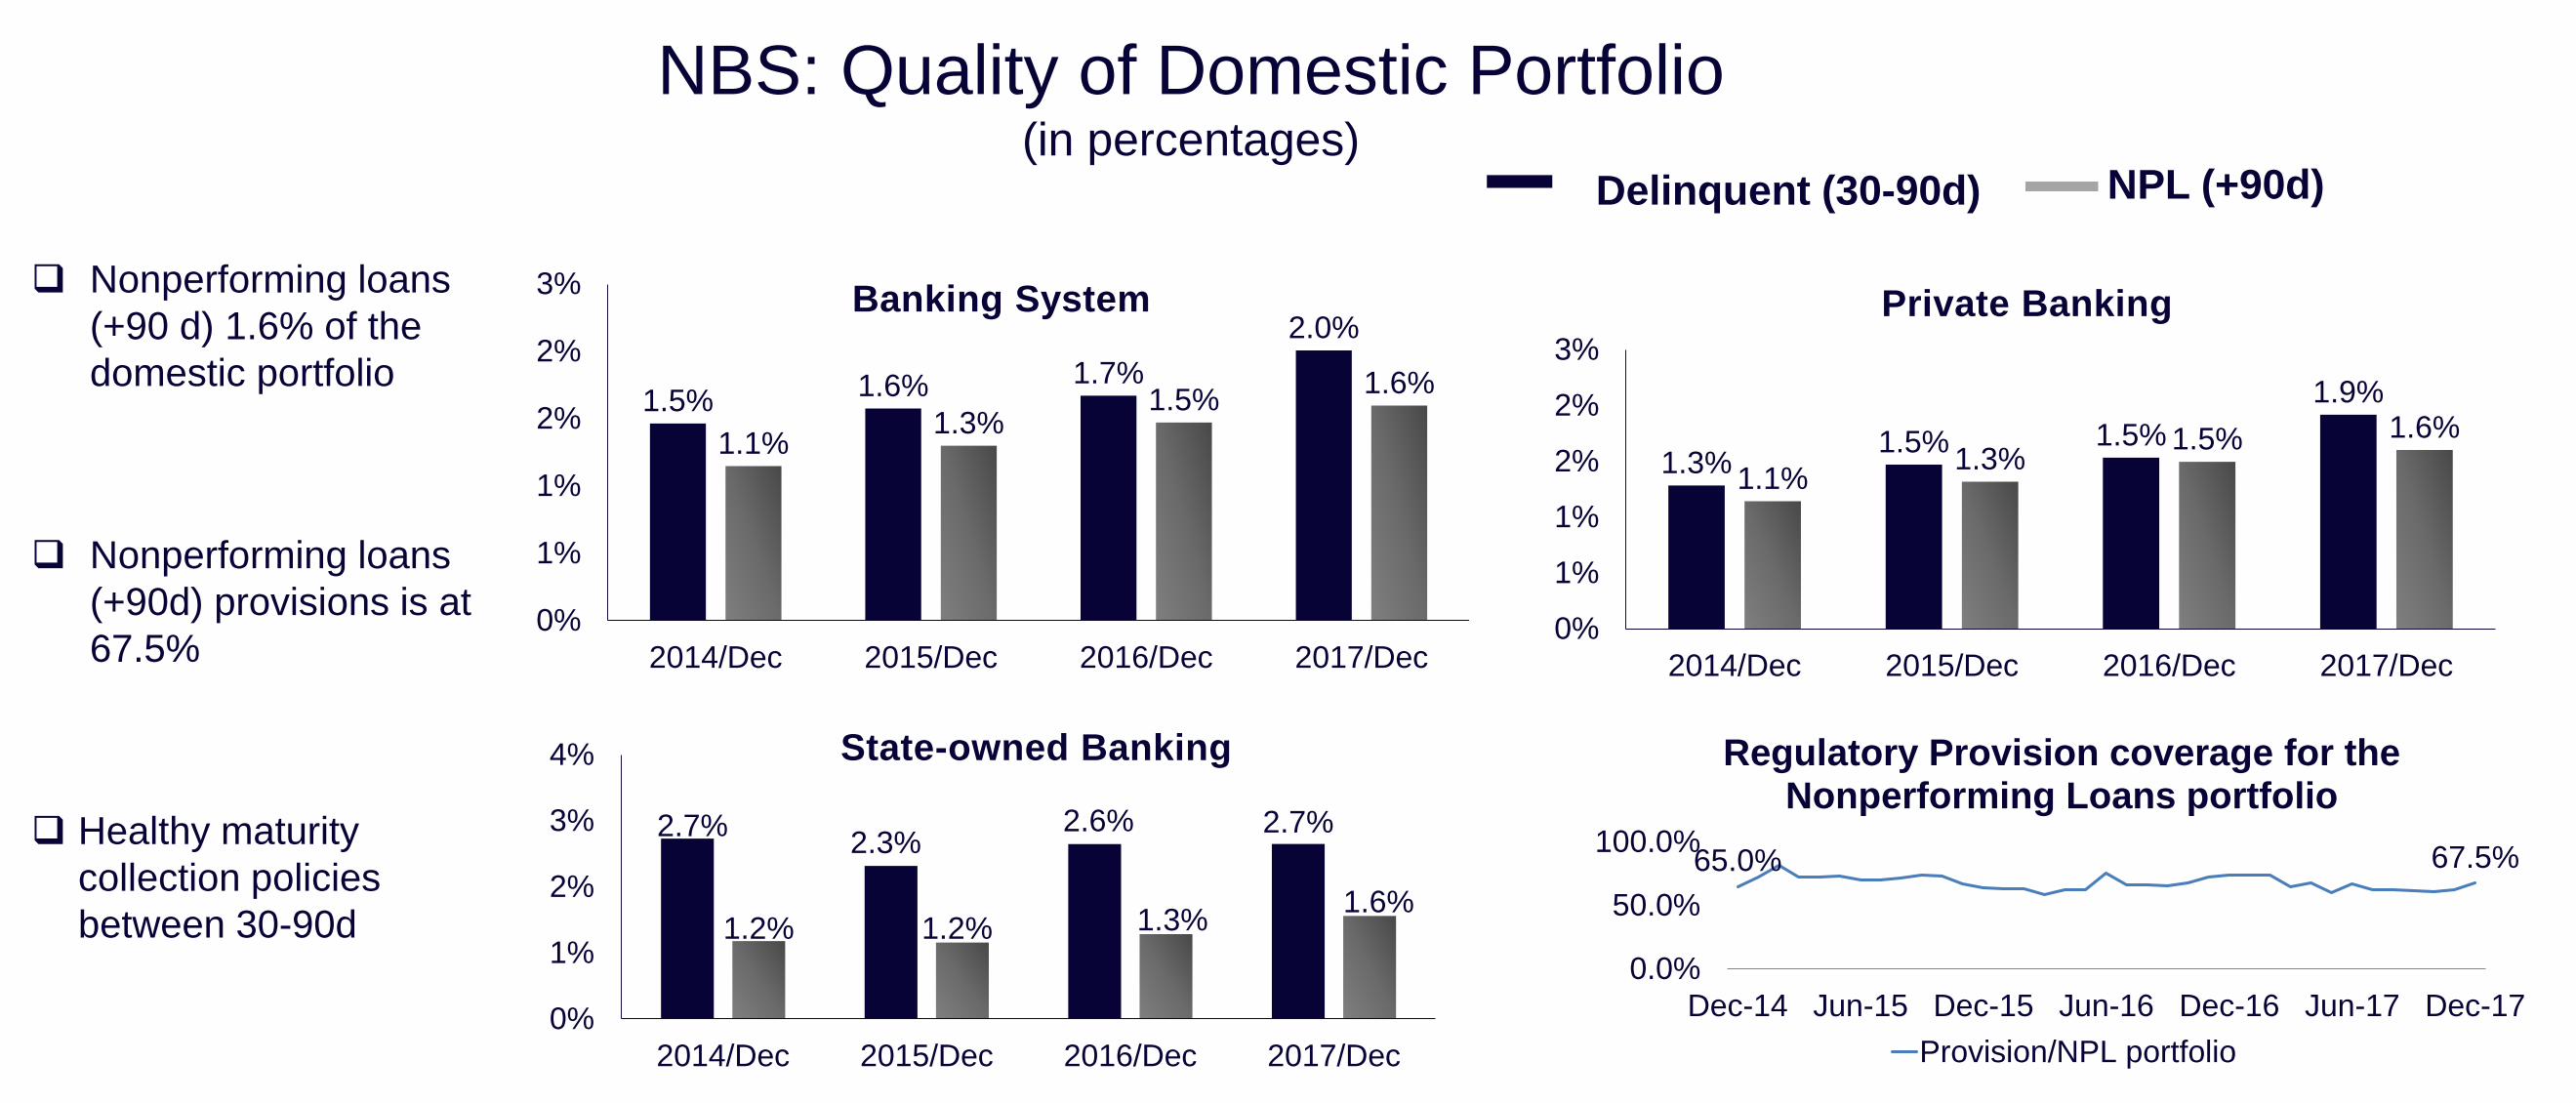
NPL (+90d)Delinquent (30-90d)
NBS: Quality of Domestic Portfolio(in percentages)
Nonperforming loans
(+90 d) 1.6% of the
domestic portfolio
Nonperforming loans
(+90d) provisions is at
67.5%
Healthy maturity
collection policies
between 30-90d
1.5%1.6% 1.7%
2.0%
1.1%1.3%
1.5%1.6%
0%
1%
1%
2%
2%
3%
2014/Dec 2015/Dec 2016/Dec 2017/Dec
Banking System
1.3%1.5% 1.5%
1.9%
1.1%1.3%
1.5% 1.6%
0%
1%
1%
2%
2%
3%
2014/Dec 2015/Dec 2016/Dec 2017/Dec
Private Banking
2.7%2.3%
2.6% 2.7%
1.2% 1.2% 1.3%1.6%
0%
1%
2%
3%
4%
2014/Dec 2015/Dec 2016/Dec 2017/Dec
State-owned Banking
65.0% 67.5%
0.0%
50.0%
100.0%
Dec-14 Jun-15 Dec-15 Jun-16 Dec-16 Jun-17 Dec-17
Regulatory Provision coverage for the Nonperforming Loans portfolio
Provision/NPL portfolio
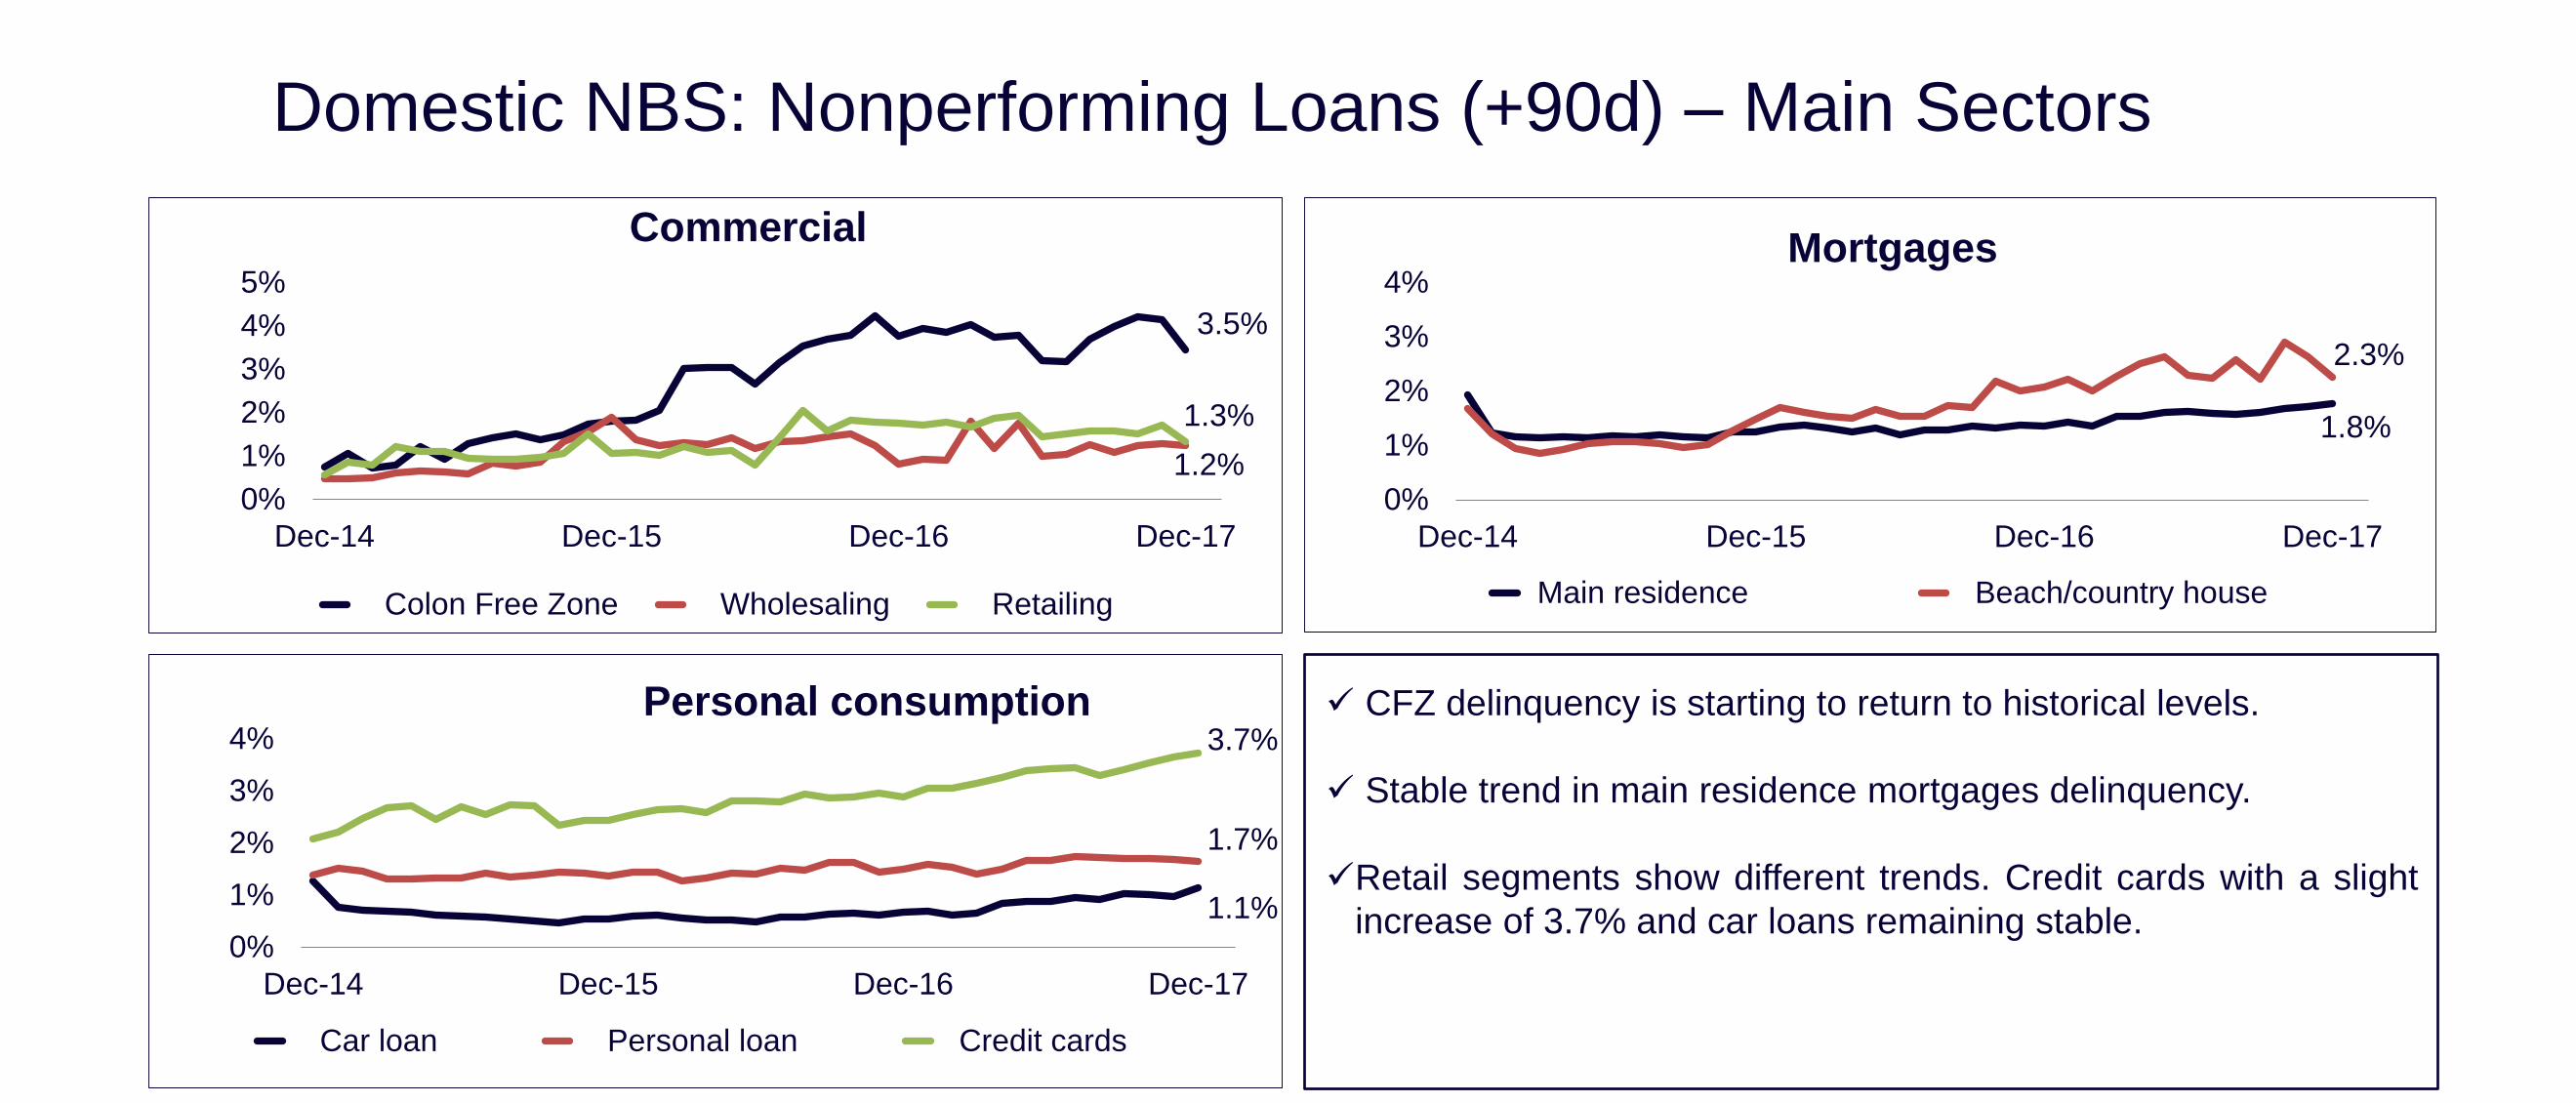
Domestic NBS: Nonperforming Loans (+90d) – Main Sectors
3.5%
1.2%
1.3%
0%
1%
2%
3%
4%
5%
Dec-14 Dec-15 Dec-16 Dec-17
Commercial
Colon Free Zone Wholesaling Retailing
1.1%
1.7%
3.7%
0%
1%
2%
3%
4%
Dec-14 Dec-15 Dec-16 Dec-17
Personal consumption
Car loan Personal loan Credit cards
1.8%
2.3%
0%
1%
2%
3%
4%
Dec-14 Dec-15 Dec-16 Dec-17
Mortgages
Main residence Beach/country house
✓ CFZ delinquency is starting to return to historical levels.
✓ Stable trend in main residence mortgages delinquency.
✓Retail segments show different trends. Credit cards with a slight
increase of 3.7% and car loans remaining stable.
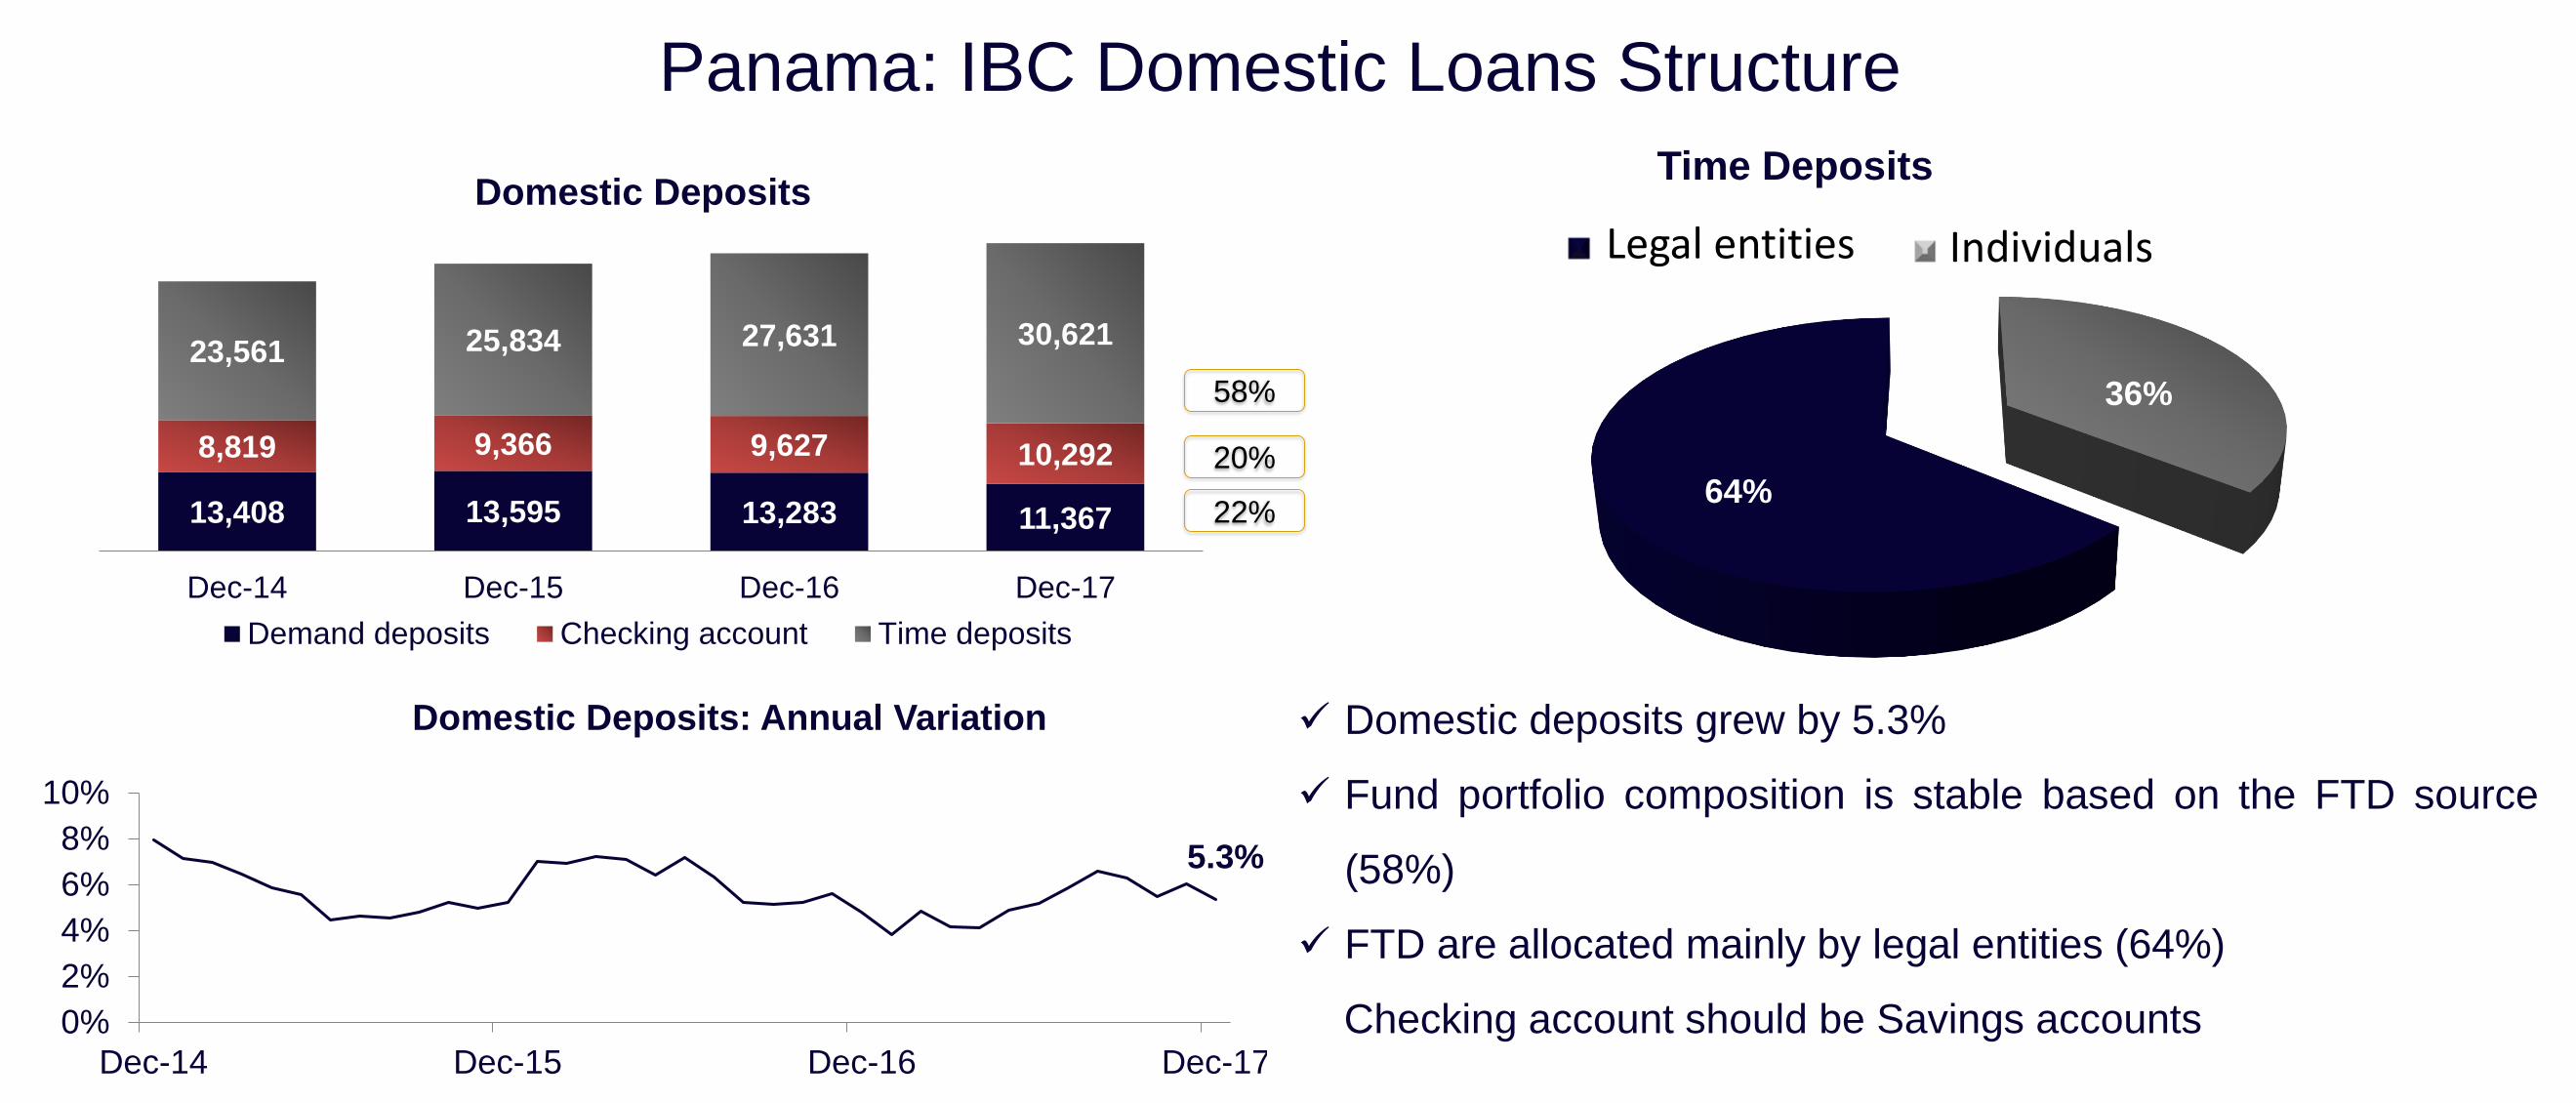
Panama: IBC Domestic Loans Structure
20%
58%
22%
36%
64%
Time Deposits
✓ Domestic deposits grew by 5.3%
✓ Fund portfolio composition is stable based on the FTD source
(58%)
✓ FTD are allocated mainly by legal entities (64%)
Checking account should be Savings accounts
5.3%
0%
2%
4%
6%
8%
10%
Dec-14 Dec-15 Dec-16 Dec-17
Domestic Deposits: Annual Variation
IndividualsLegal entities
13,408 13,595 13,283 11,367
8,819 9,366 9,627 10,292
23,561 25,834 27,631 30,621
Dec-14 Dec-15 Dec-16 Dec-17
Domestic Deposits
Demand deposits Checking account Time deposits
0
200
400
600
800
1,000
1,200
1,400
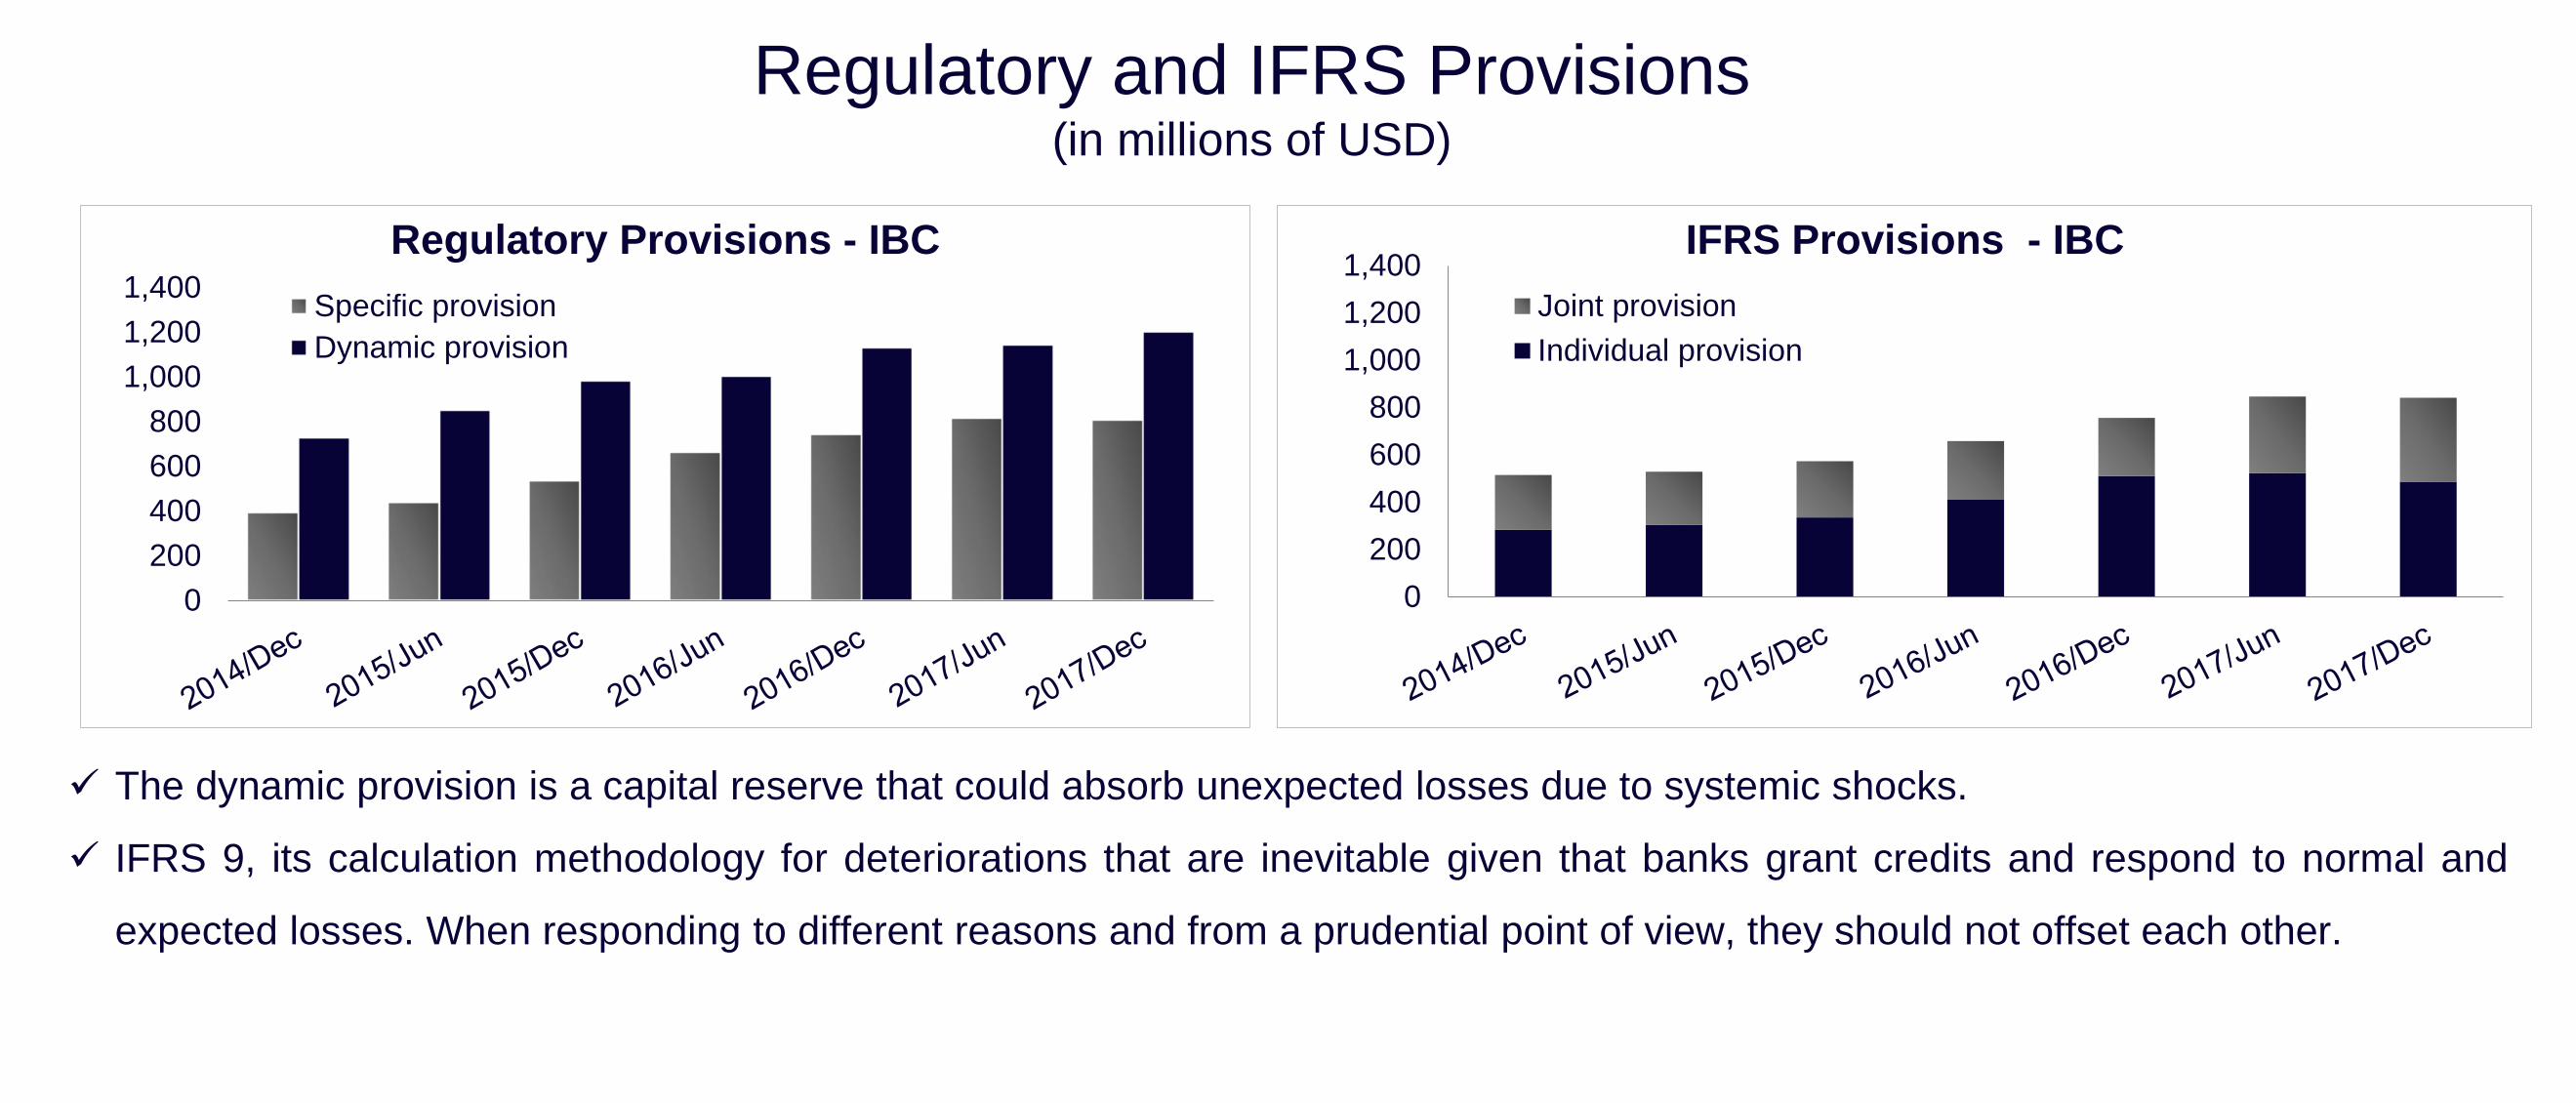
Regulatory Provisions - IBC
Specific provision
Dynamic provision
0
200
400
600
800
1,000
1,200
1,400IFRS Provisions - IBC
Joint provision
Individual provision
✓ The dynamic provision is a capital reserve that could absorb unexpected losses due to systemic shocks.
✓ IFRS 9, its calculation methodology for deteriorations that are inevitable given that banks grant credits and respond to normal and
expected losses. When responding to different reasons and from a prudential point of view, they should not offset each other.
Regulatory and IFRS Provisions(in millions of USD)
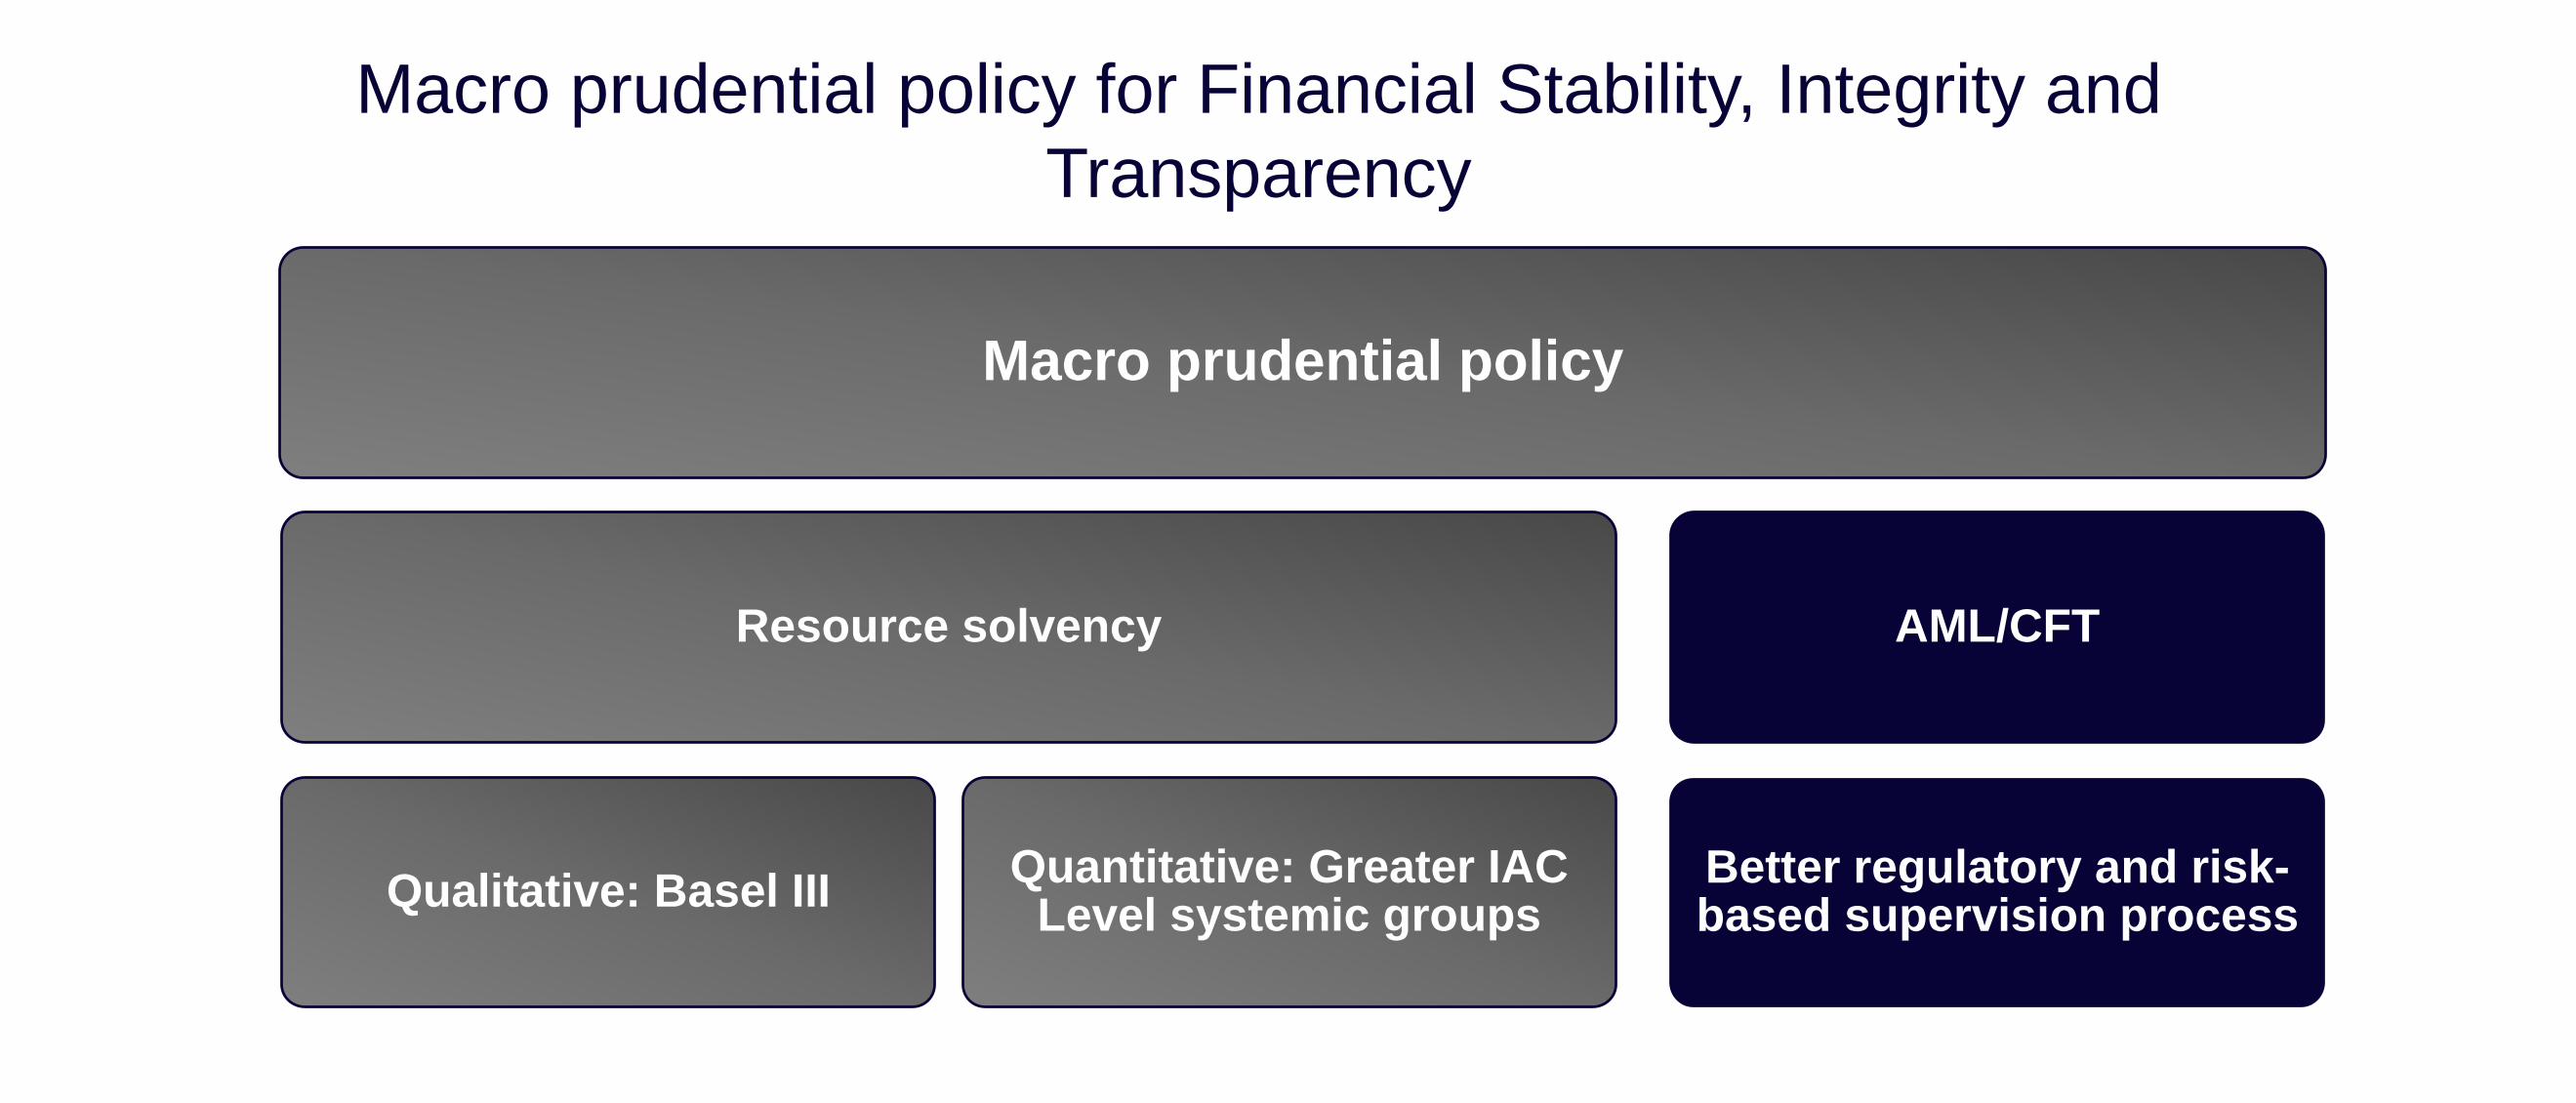
Macro prudential policy
Resource solvency
Qualitative: Basel IIIQuantitative: Greater IAC
Level systemic groups
AML/CFT
Better regulatory and risk-based supervision process
Macro prudential policy for Financial Stability, Integrity and
Transparency
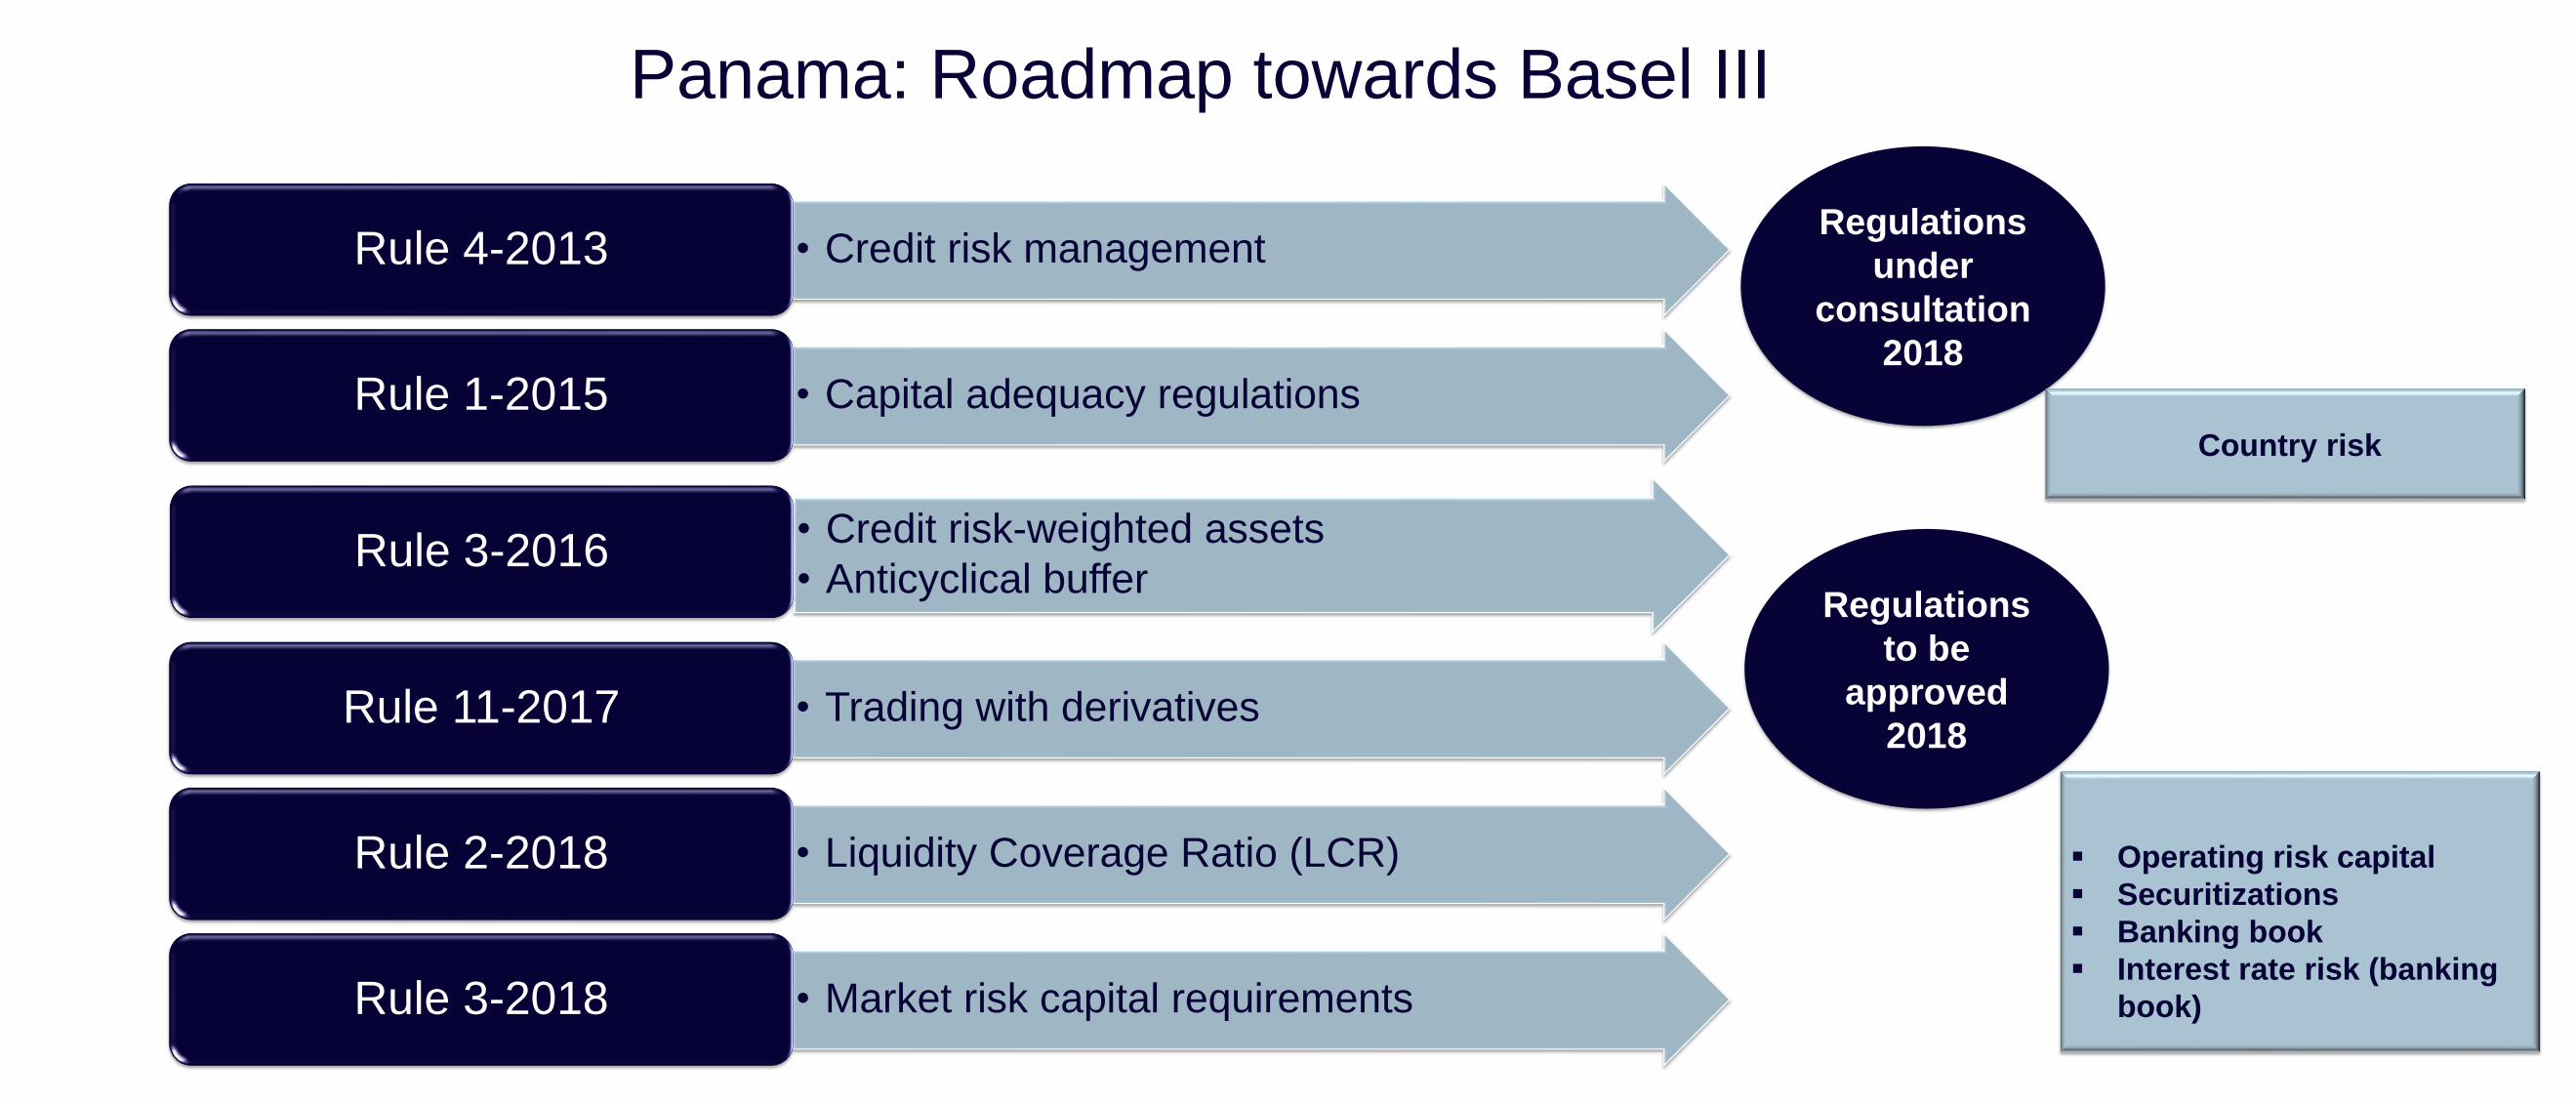
• Credit risk managementRule 4-2013
• Capital adequacy regulationsRule 1-2015
• Credit risk-weighted assets
• Anticyclical bufferRule 3-2016
• Trading with derivativesRule 11-2017
• Liquidity Coverage Ratio (LCR)Rule 2-2018
• Market risk capital requirementsRule 3-2018
Panama: Roadmap towards Basel III
Regulations
to be
approved
2018
▪ Operating risk capital
▪ Securitizations
▪ Banking book
▪ Interest rate risk (banking
book)
Regulations
under
consultation
2018
Country risk
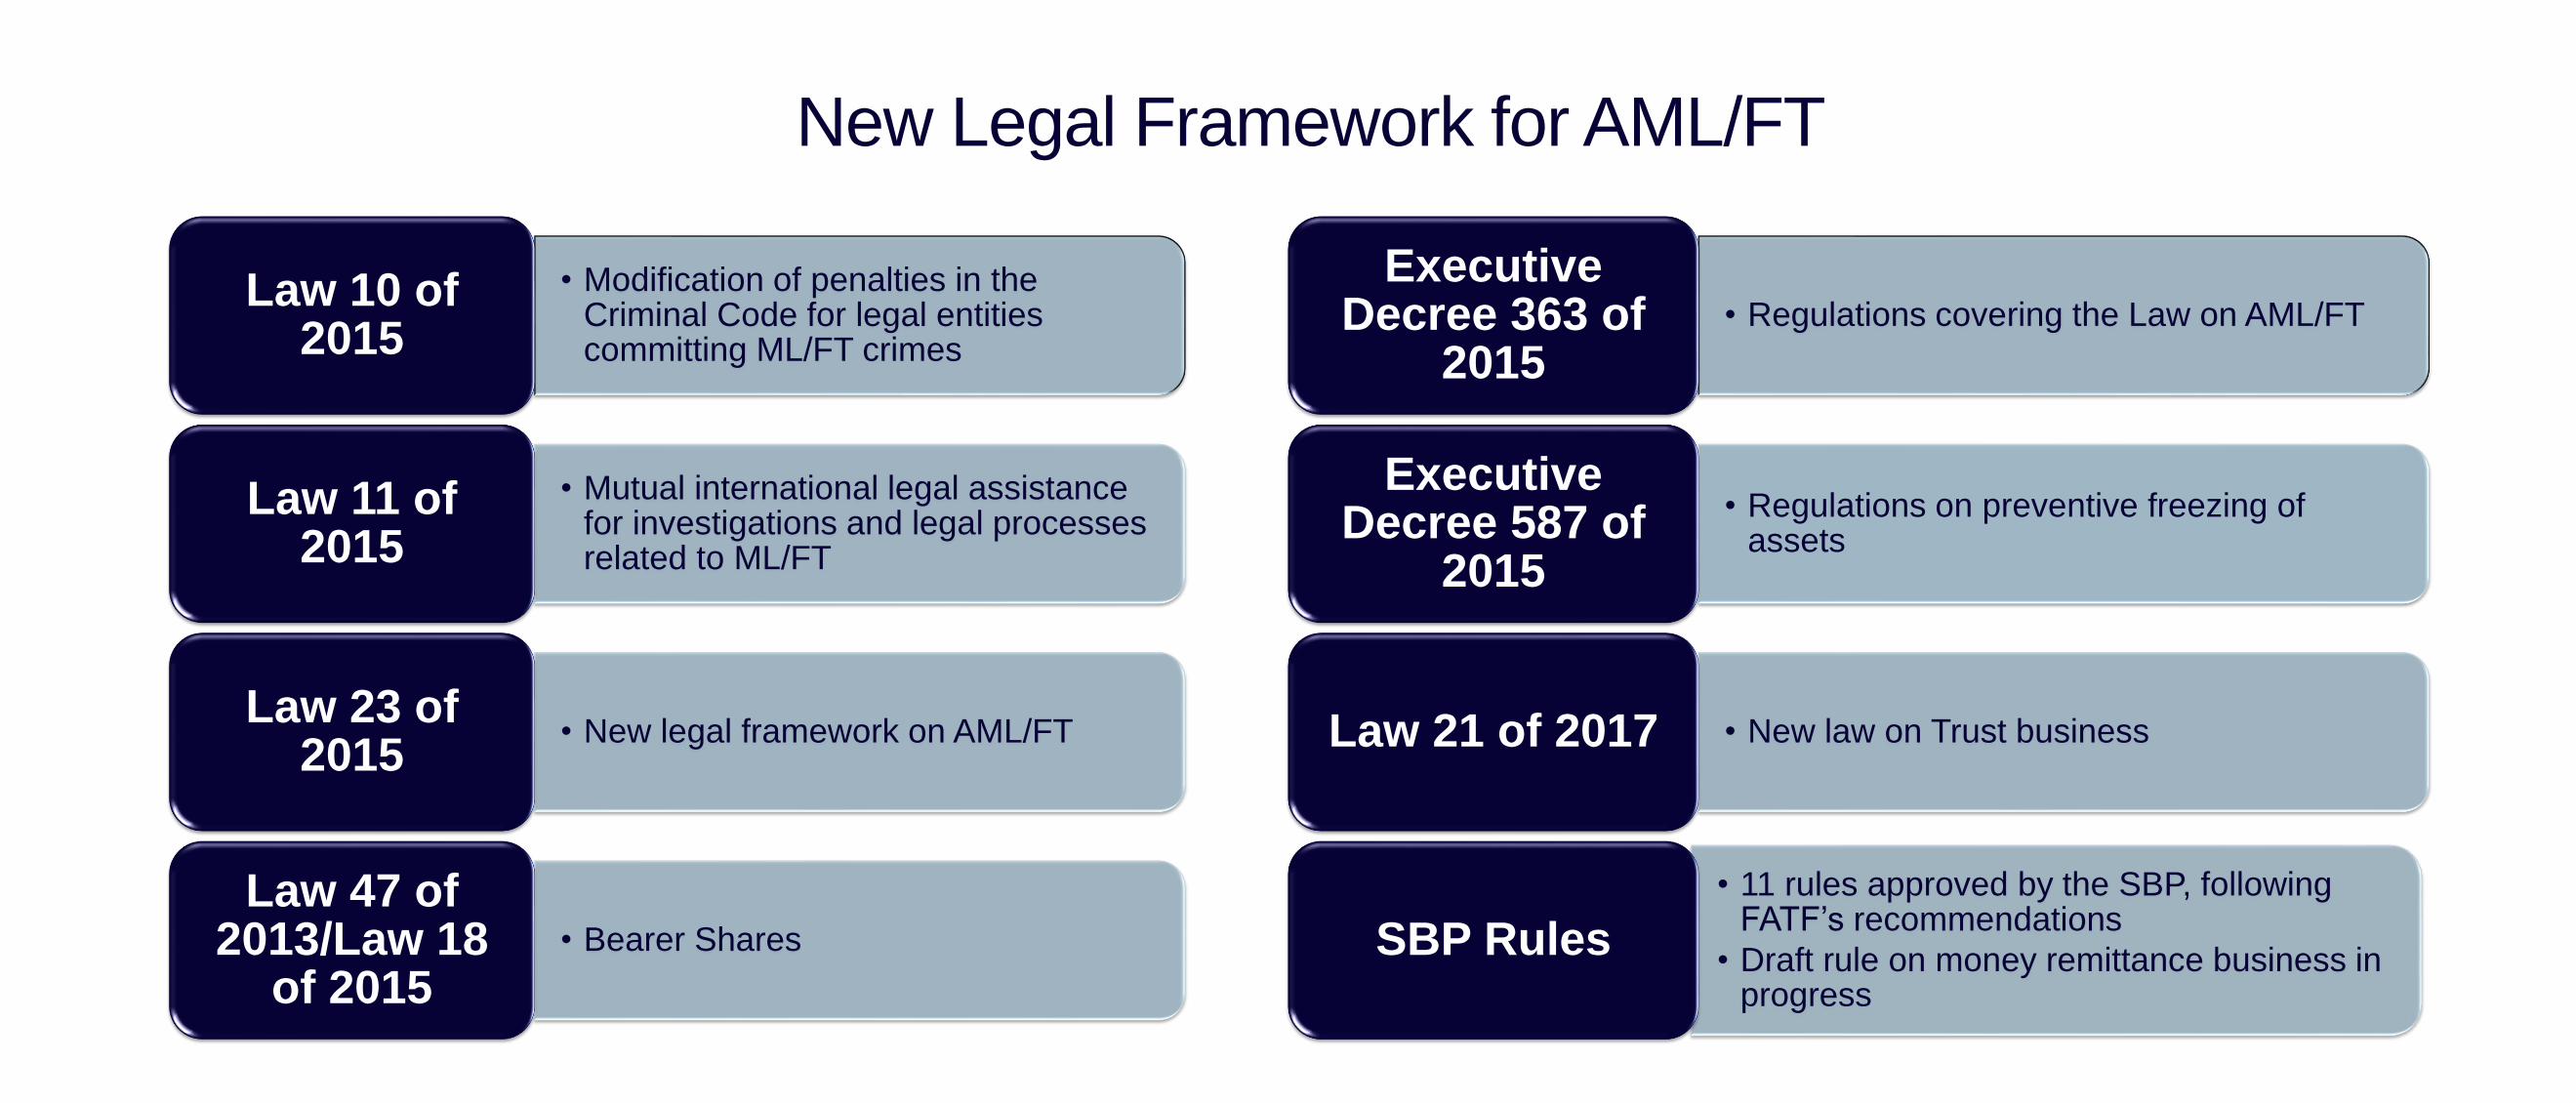
New Legal Framework for AML/FT
• Modification of penalties in the Criminal Code for legal entities committing ML/FT crimes
Law 10 of 2015
• Mutual international legal assistance for investigations and legal processes related to ML/FT
Law 11 of 2015
• New legal framework on AML/FTLaw 23 of
2015
• Bearer Shares
Law 47 of 2013/Law 18
of 2015
• Regulations covering the Law on AML/FT
Executive Decree 363 of
2015
• Regulations on preventive freezing of assets
Executive Decree 587 of
2015
• New law on Trust businessLaw 21 of 2017
• 11 rules approved by the SBP, following FATF’s recommendations
• Draft rule on money remittance business in progress
SBP Rules
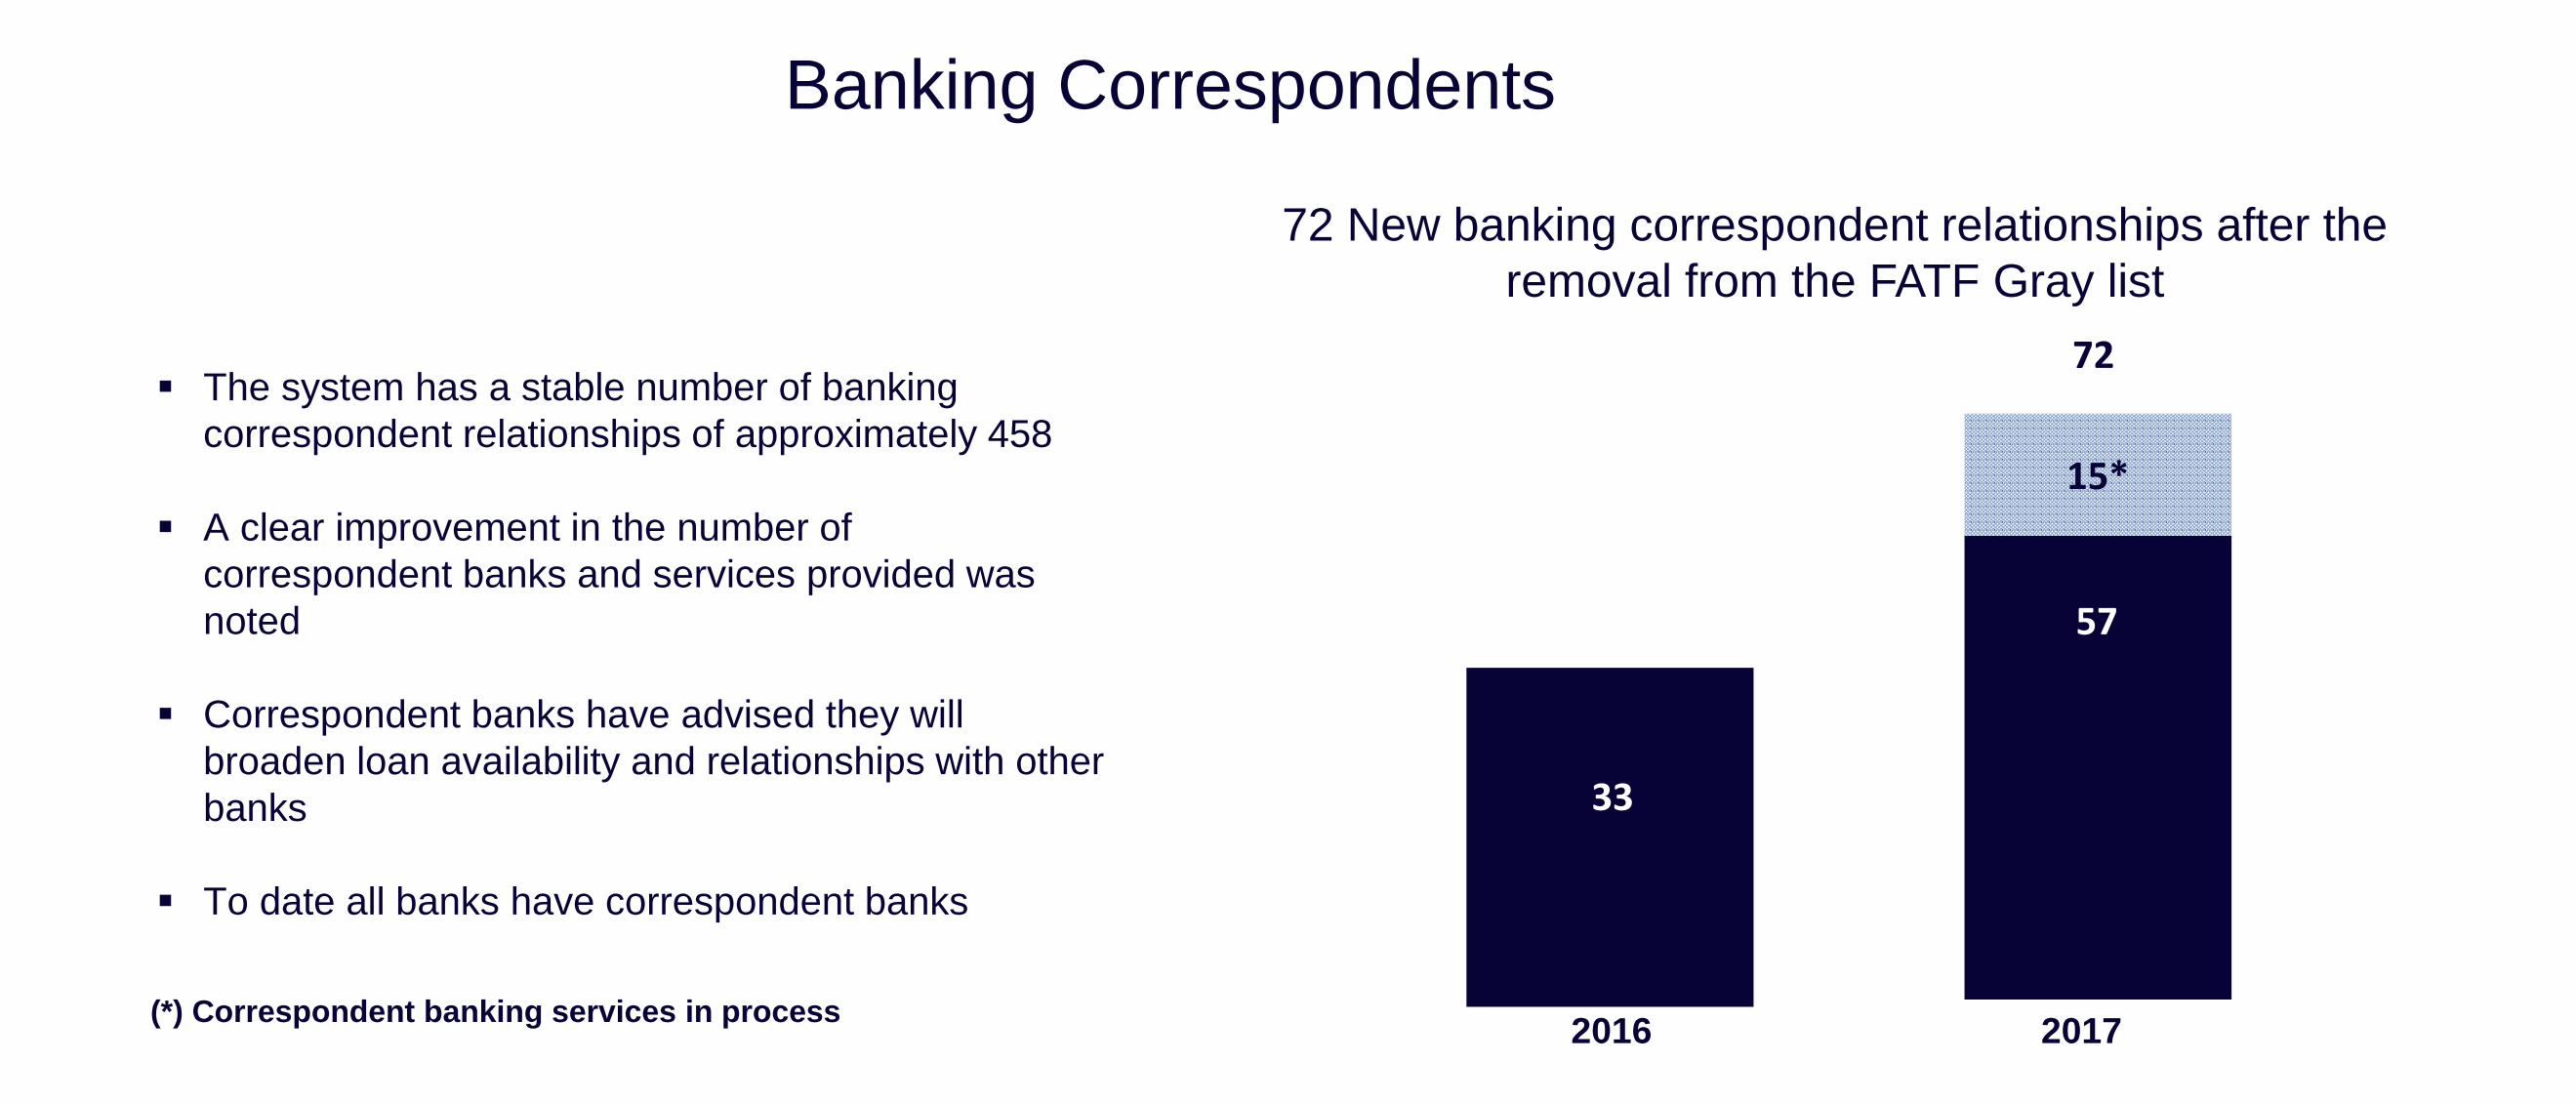
Banking Correspondents
72 New banking correspondent relationships after the
removal from the FATF Gray list
▪ The system has a stable number of banking
correspondent relationships of approximately 458
▪ A clear improvement in the number of
correspondent banks and services provided was
noted
▪ Correspondent banks have advised they will
broaden loan availability and relationships with other
banks
▪ To date all banks have correspondent banks
33
2016
57
15*
72
2017(*) Correspondent banking services in process
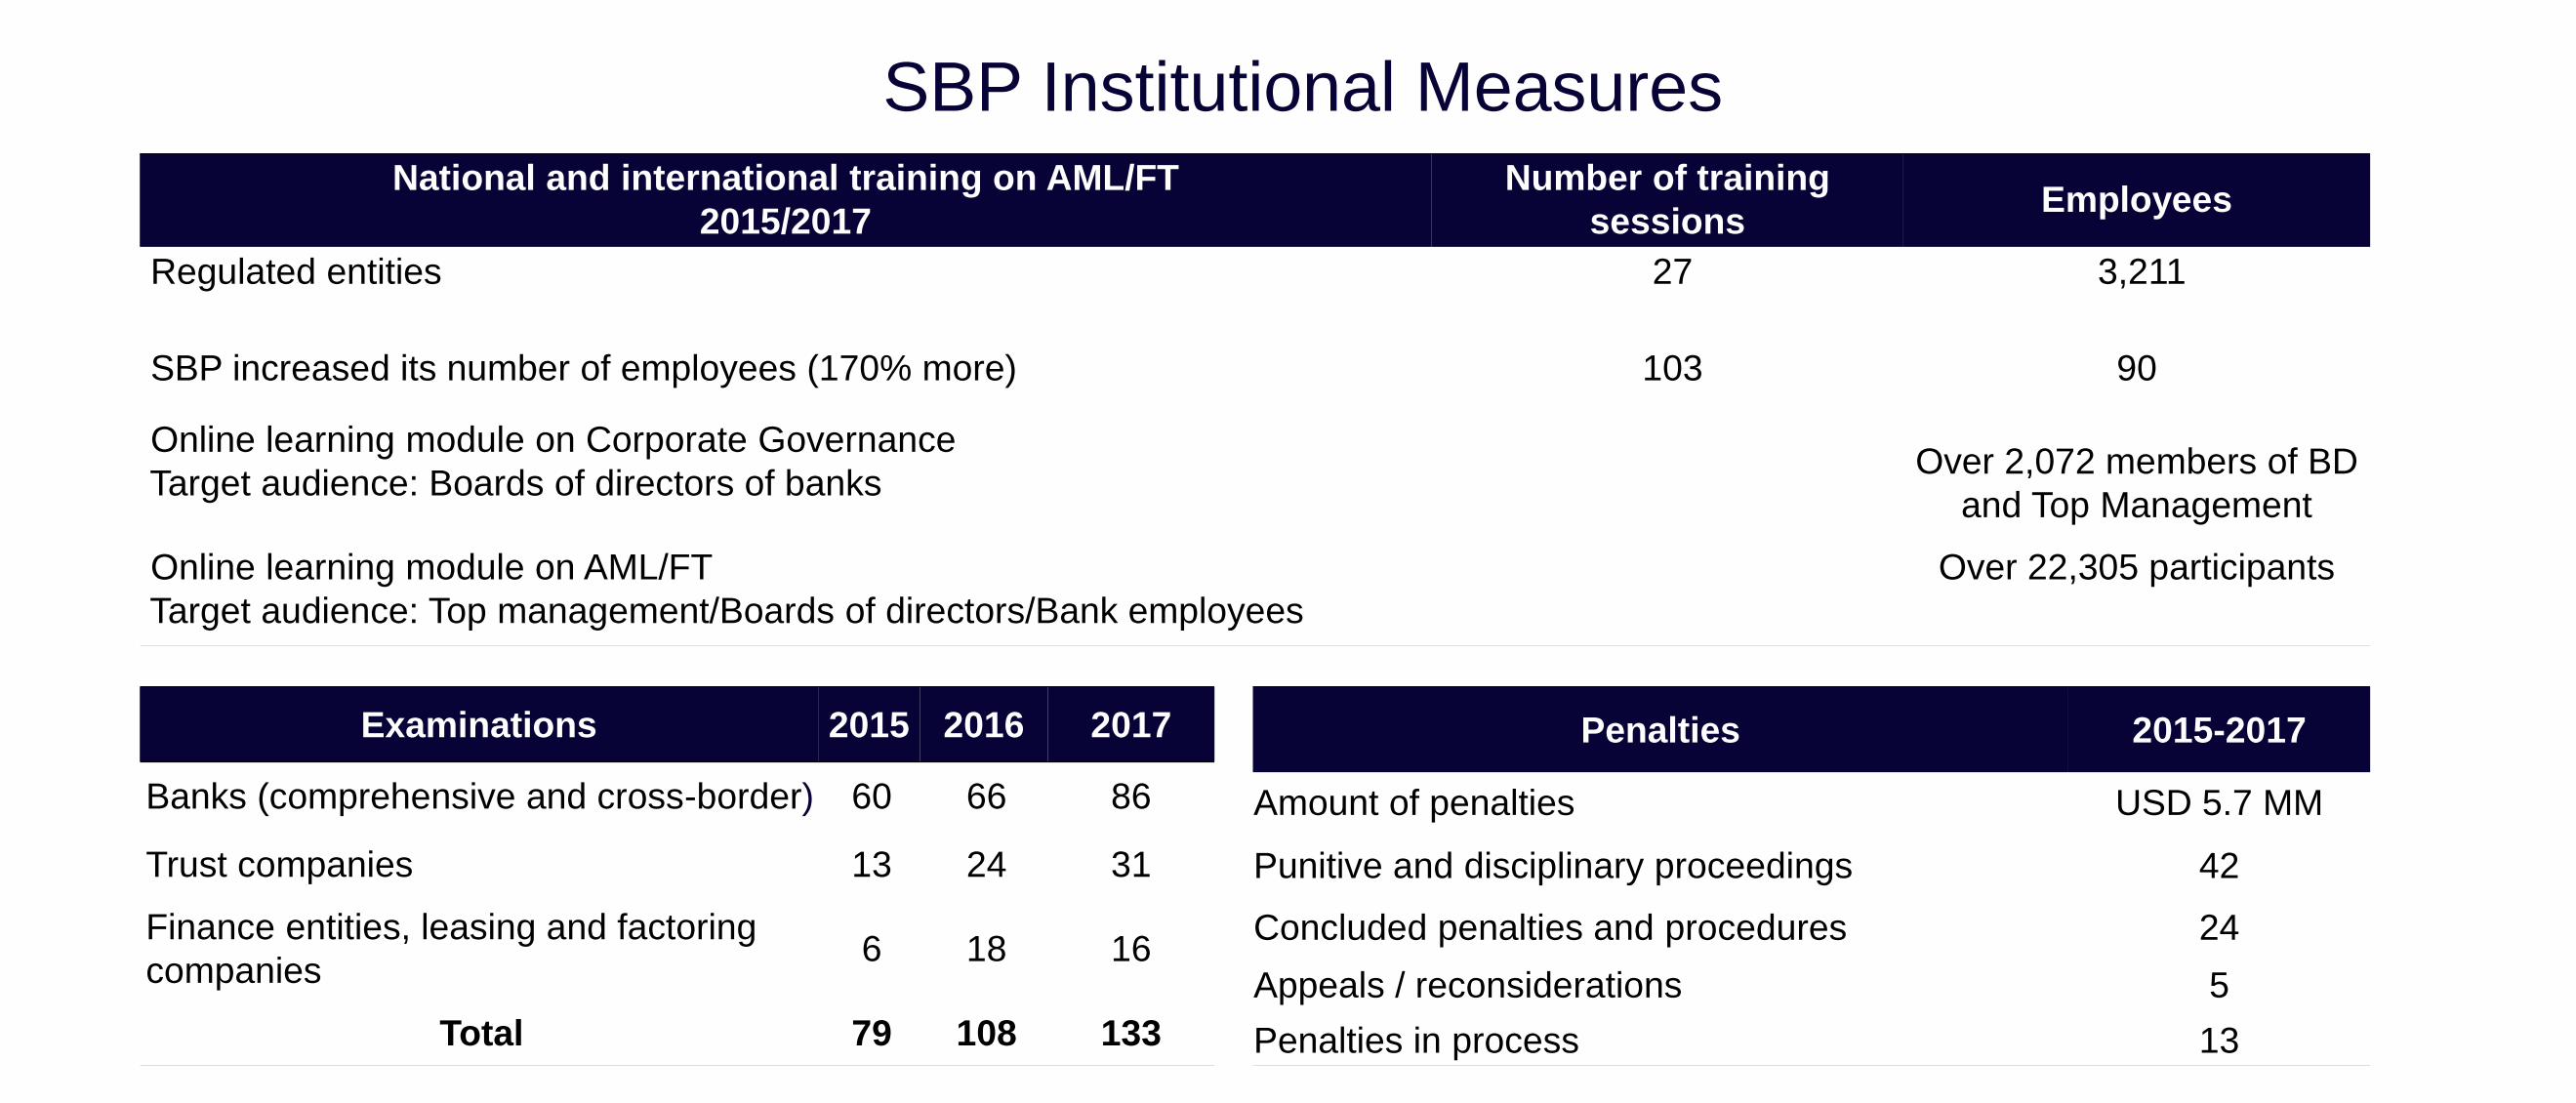
National and international training on AML/FT
2015/2017
Number of training
sessionsEmployees
Regulated entities 27 3,211
SBP increased its number of employees (170% more) 103 90
Online learning module on Corporate Governance
Target audience: Boards of directors of banksOver 2,072 members of BD
and Top Management
Online learning module on AML/FT
Target audience: Top management/Boards of directors/Bank employees
Over 22,305 participants
Penalties 2015-2017
Amount of penalties USD 5.7 MM
Punitive and disciplinary proceedings 42
Concluded penalties and procedures 24
Appeals / reconsiderations 5
Penalties in process 13
Examinations 2015 2016 2017
Banks (comprehensive and cross-border) 60 66 86
Trust companies 13 24 31
Finance entities, leasing and factoring
companies6 18 16
Total 79 108 133
SBP Institutional Measures
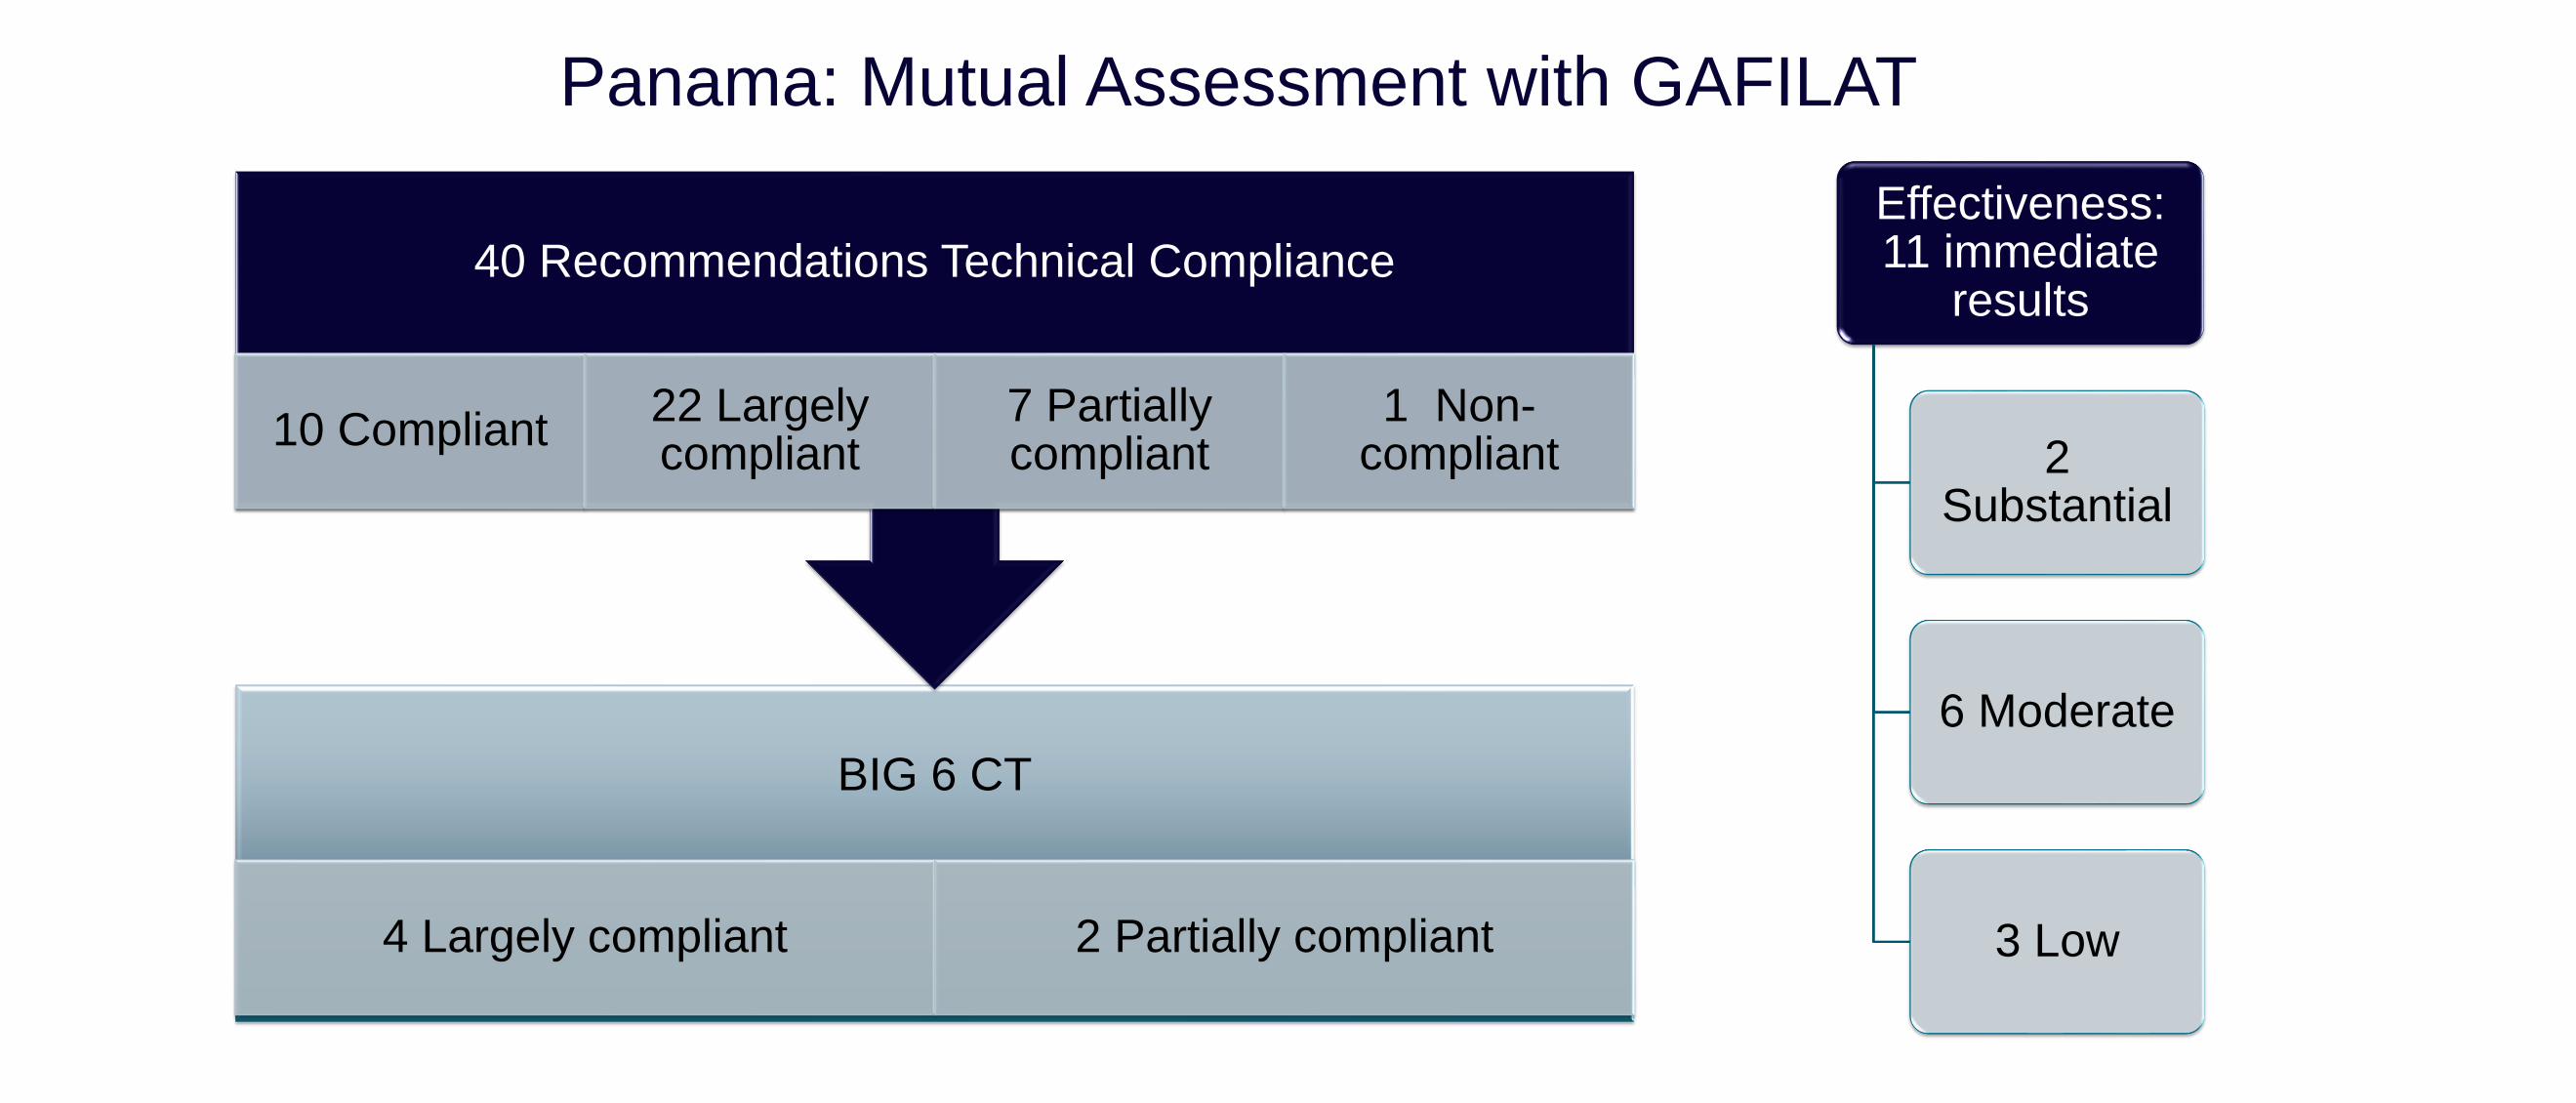
BIG 6 CT
4 Largely compliant 2 Partially compliant
40 Recommendations Technical Compliance
10 Compliant22 Largely compliant
7 Partially compliant
1 Non-compliant
Effectiveness: 11 immediate
results
2 Substantial
6 Moderate
3 Low
Panama: Mutual Assessment with GAFILAT
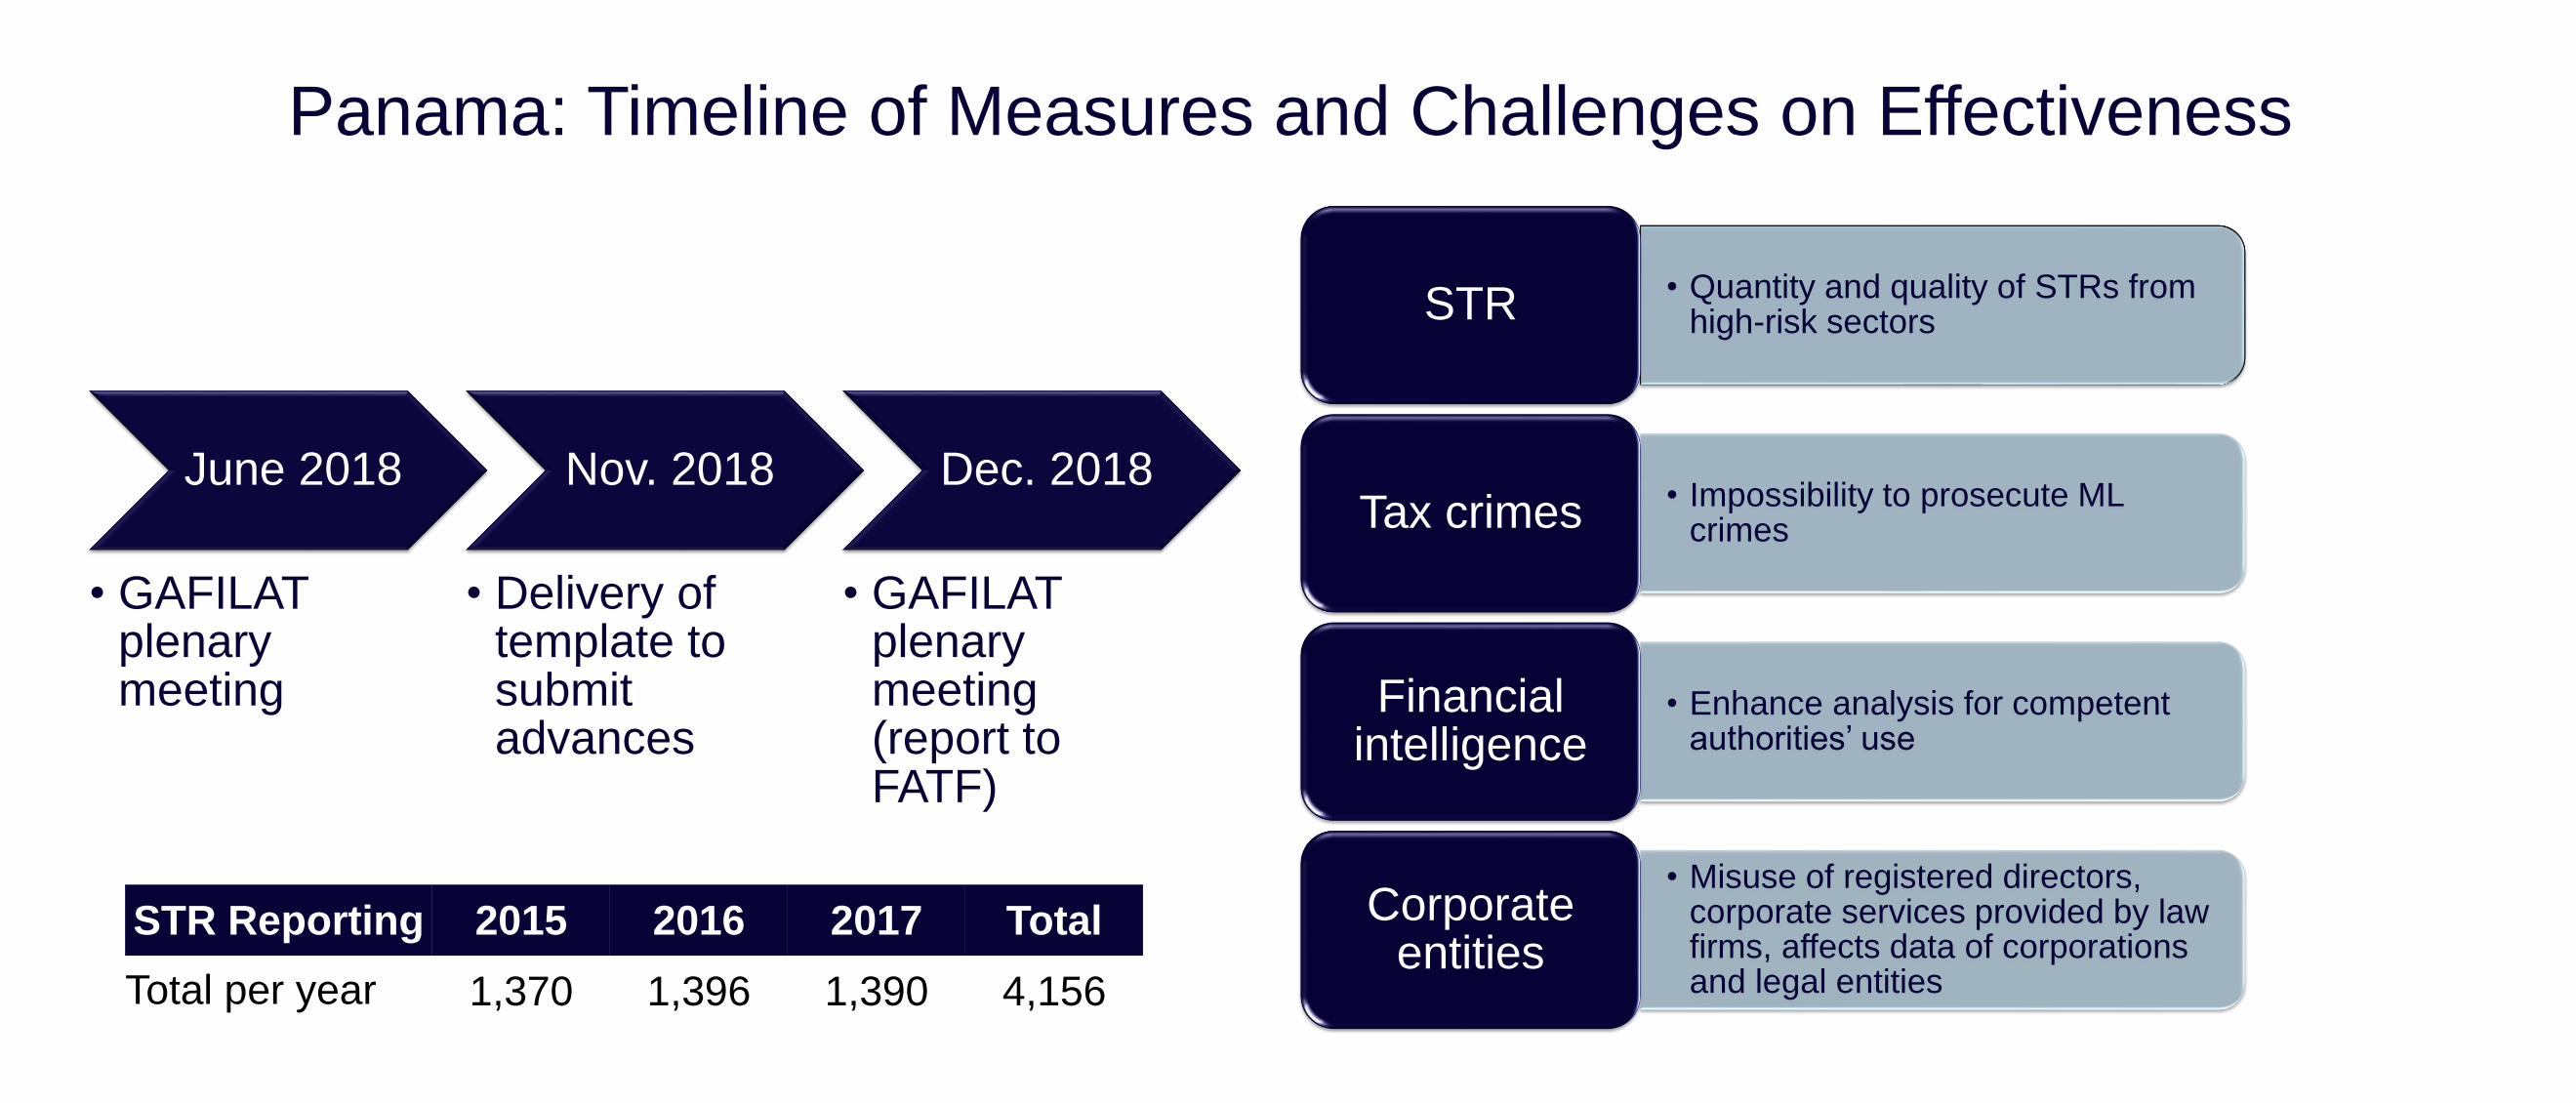
June 2018
• GAFILATplenary meeting
Nov. 2018
• Delivery of template to submit advances
Dec. 2018
• GAFILATplenary meeting (report to FATF)
• Quantity and quality of STRs from high-risk sectorsSTR
• Impossibility to prosecute ML crimesTax crimes
• Enhance analysis for competent authorities’ use
Financial intelligence
• Misuse of registered directors, corporate services provided by law firms, affects data of corporations and legal entities
Corporate entities
Panama: Timeline of Measures and Challenges on Effectiveness
STR Reporting 2015 2016 2017 Total
Total per year 1,370 1,396 1,390 4,156
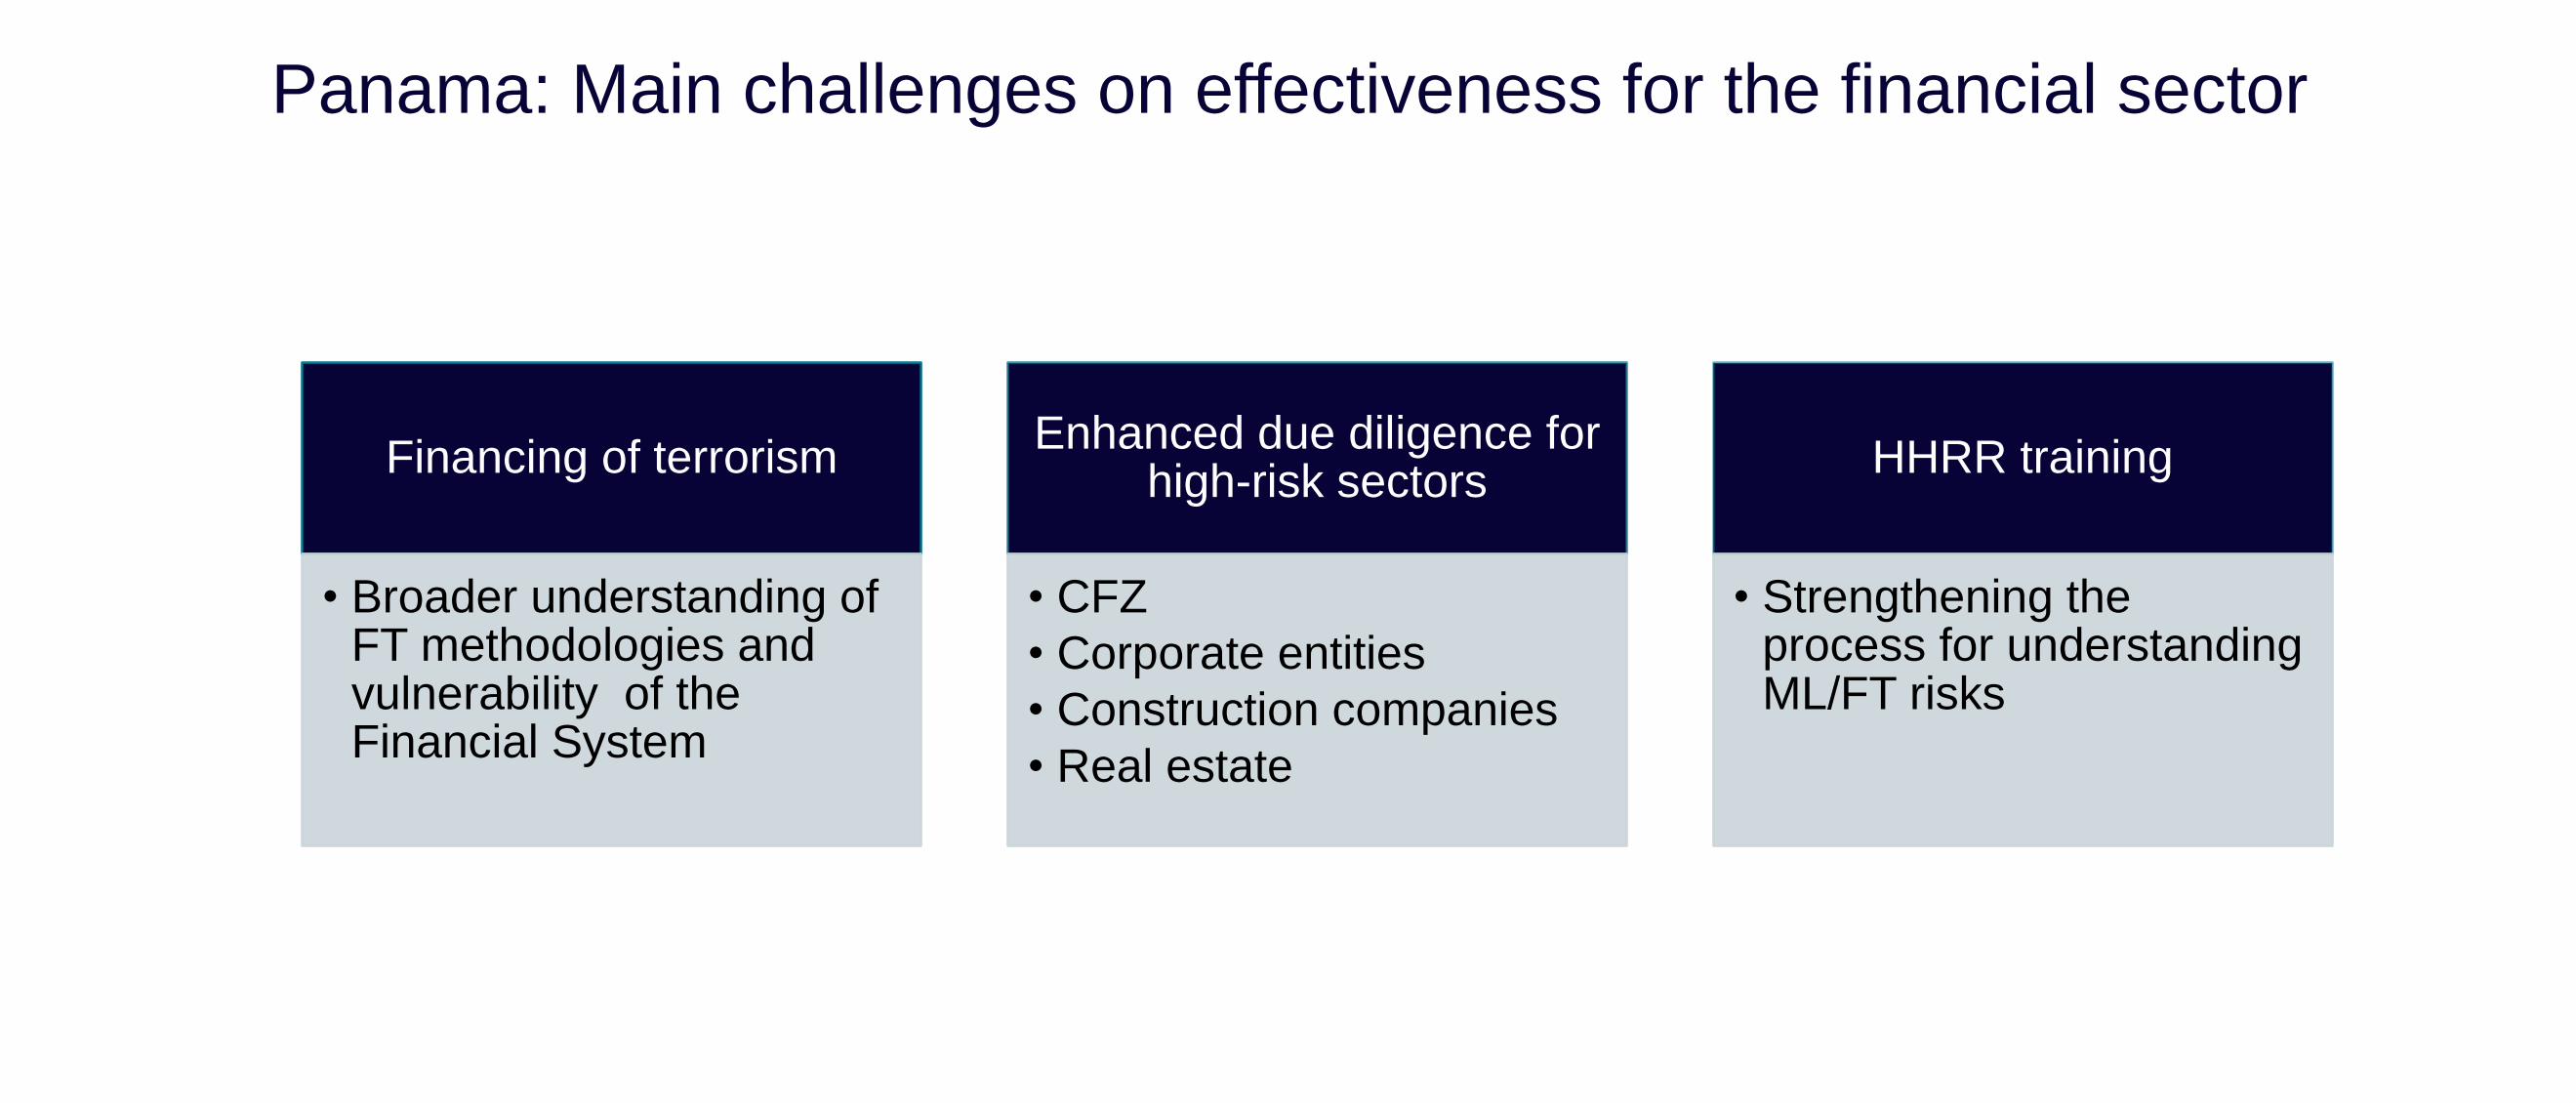
Financing of terrorism
• Broader understanding of FT methodologies and vulnerability of the Financial System
Enhanced due diligence for high-risk sectors
• CFZ
• Corporate entities
• Construction companies
• Real estate
HHRR training
• Strengthening the process for understanding ML/FT risks
Panama: Main challenges on effectiveness for the financial sector

Prevention: Regulatory bodies
• Supervision and regulation of the
financial system and DNFBPs
Financial Intelligence: FAU
• Intelligence analysis of
information for suppression
Suppression: Public Ministry
• ML/FT punishment
Integrity and
transparency of the
System
Inter-institutional
cooperation
Panama: Outline for the Prevention of money laundering, financing of terrorism
and financing the proliferation of weapons of mass destruction
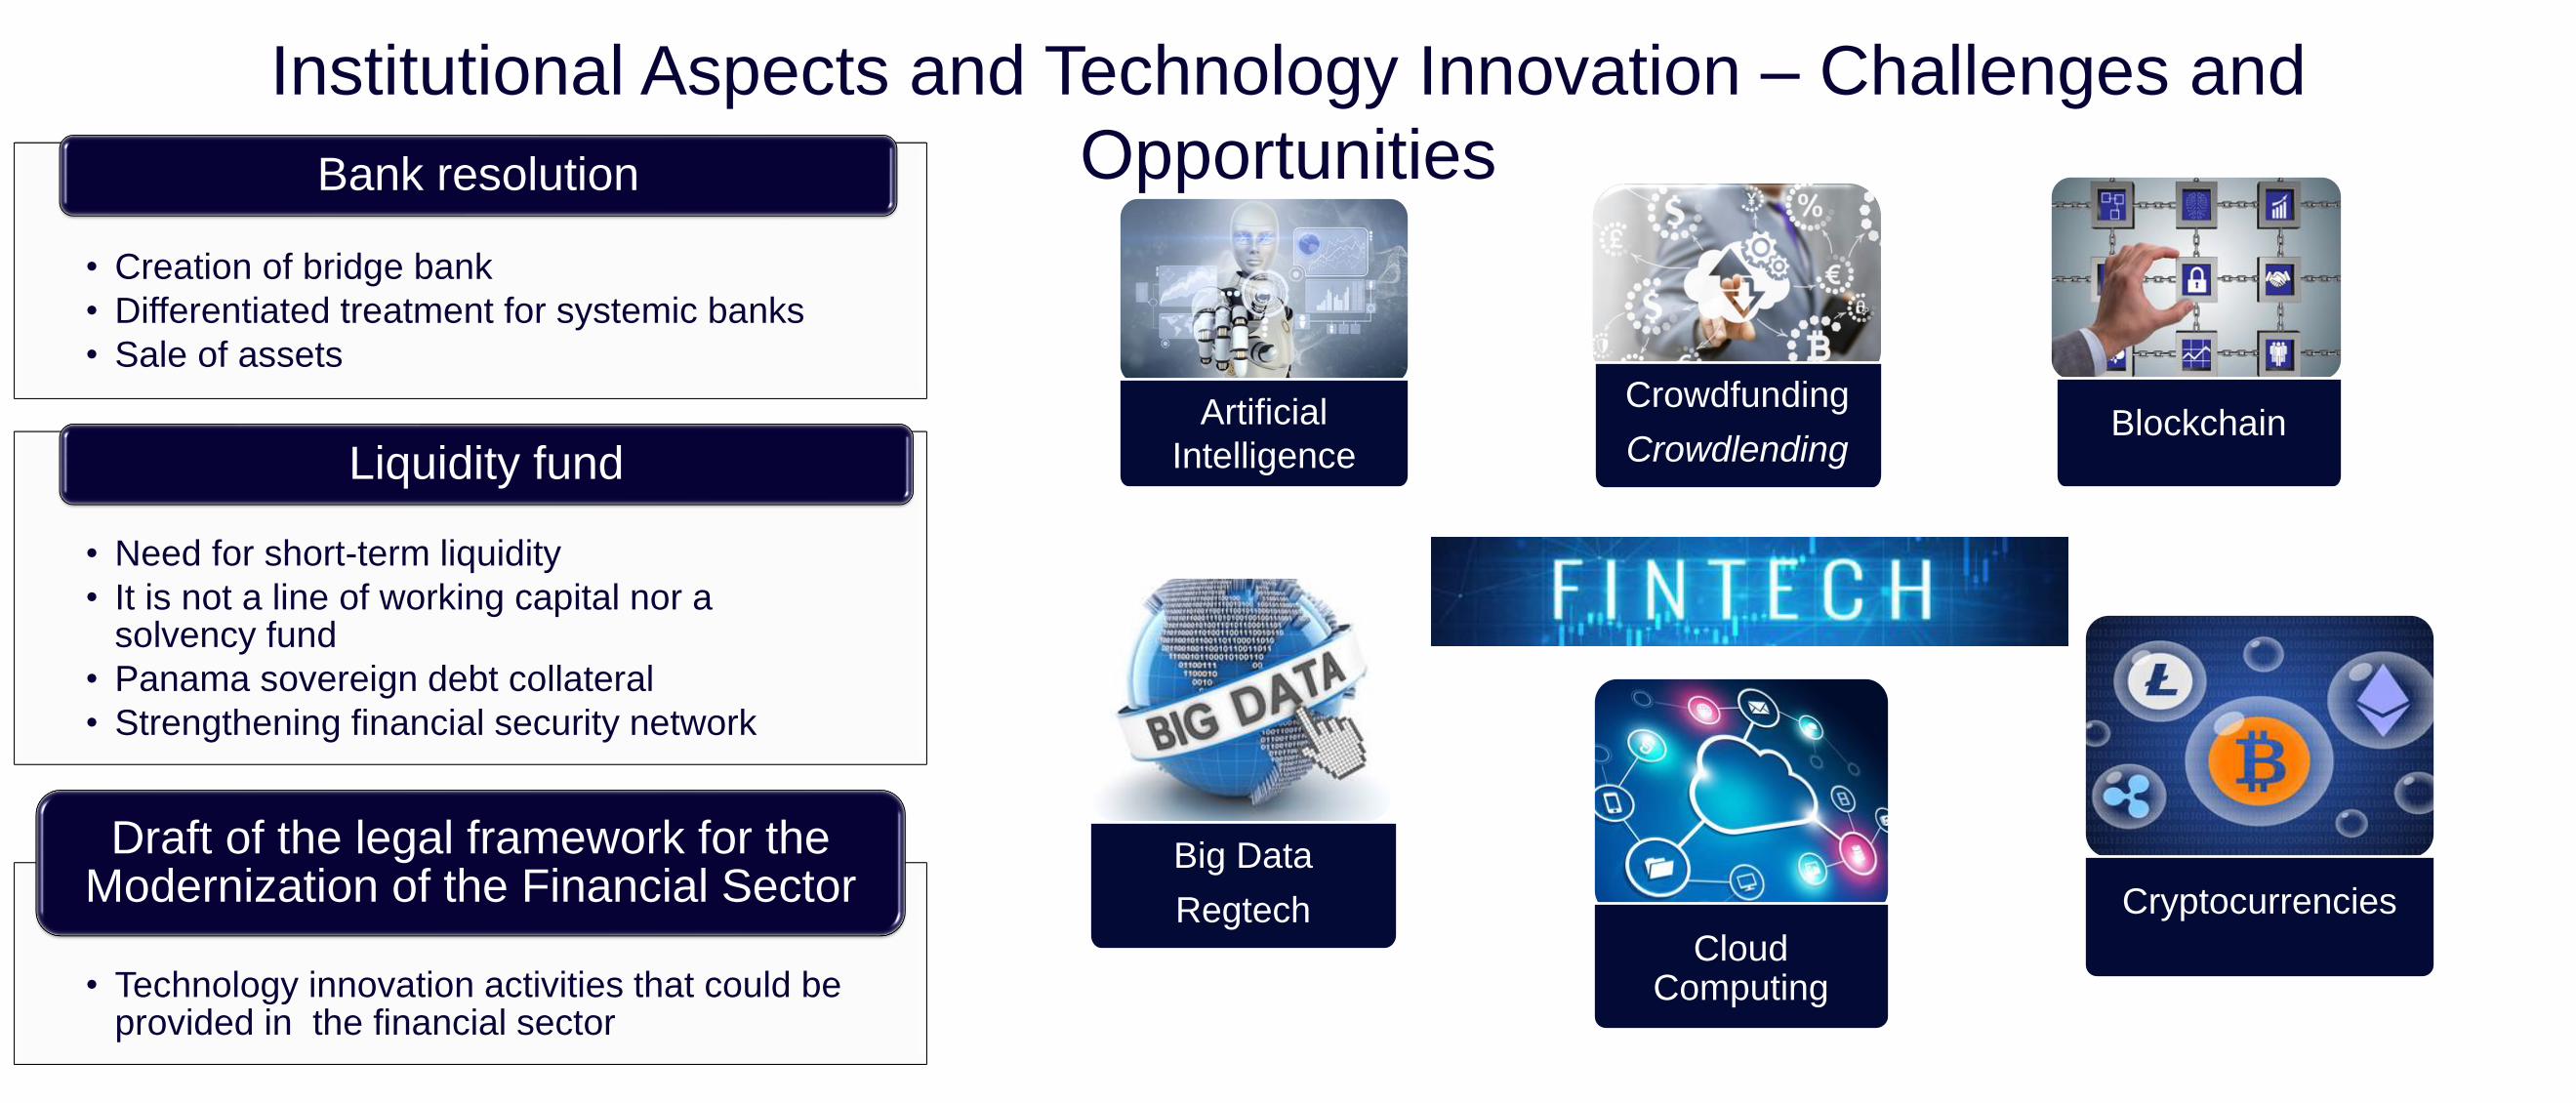
• Creation of bridge bank
• Differentiated treatment for systemic banks
• Sale of assets
Bank resolution
• Need for short-term liquidity
• It is not a line of working capital nor a solvency fund
• Panama sovereign debt collateral
• Strengthening financial security network
Liquidity fund
• Technology innovation activities that could be provided in the financial sector
Draft of the legal framework for the Modernization of the Financial Sector
Institutional Aspects and Technology Innovation – Challenges and
Opportunities
BlockchainArtificial
Intelligence
Big Data
RegtechCloud
Computing
Cryptocurrencies
Crowdfunding
Crowdlending
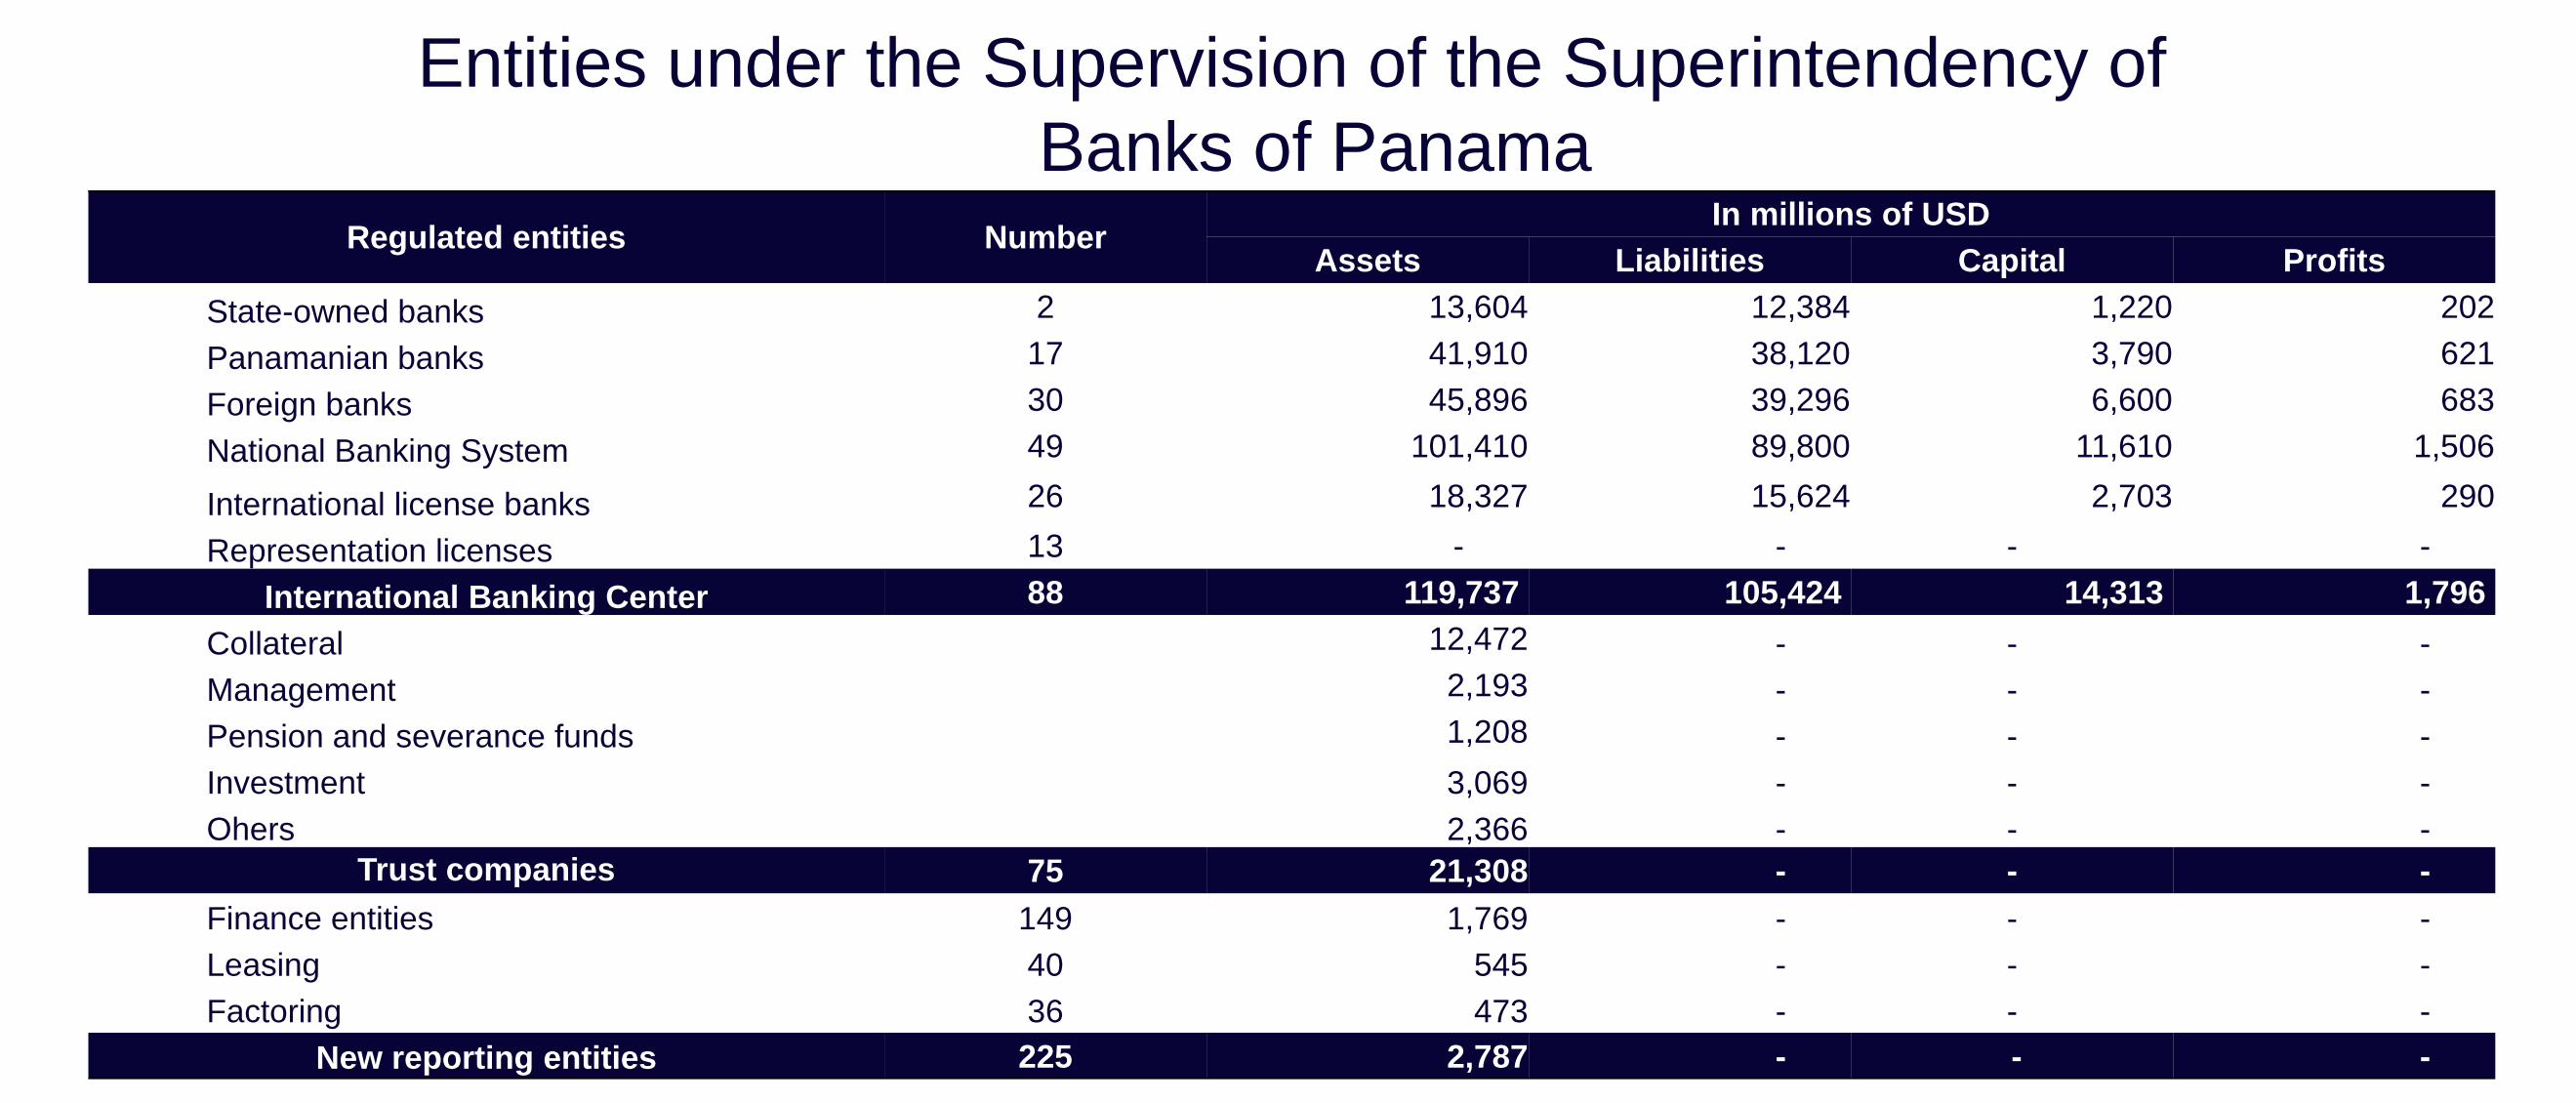
Regulated entities Number In millions of USD
Assets Liabilities Capital Profits
State-owned banks 2 13,604 12,384 1,220 202
Panamanian banks 17 41,910 38,120 3,790 621
Foreign banks 30 45,896 39,296 6,600 683
National Banking System 49 101,410 89,800 11,610 1,506
International license banks 26 18,327 15,624 2,703 290
Representation licenses 13 - - - -
International Banking Center 88 119,737 105,424 14,313 1,796
Collateral 12,472 - - -
Management 2,193 - - -
Pension and severance funds 1,208 - - -
Investment 3,069 - - -
Ohers 2,366 - - -
Trust companies 75 21,308 - - -
Finance entities 149 1,769 - - -
Leasing 40 545 - - -
Factoring 36 473 - - -
New reporting entities 225 2,787 - - -
Entities under the Supervision of the Superintendency of
Banks of Panama
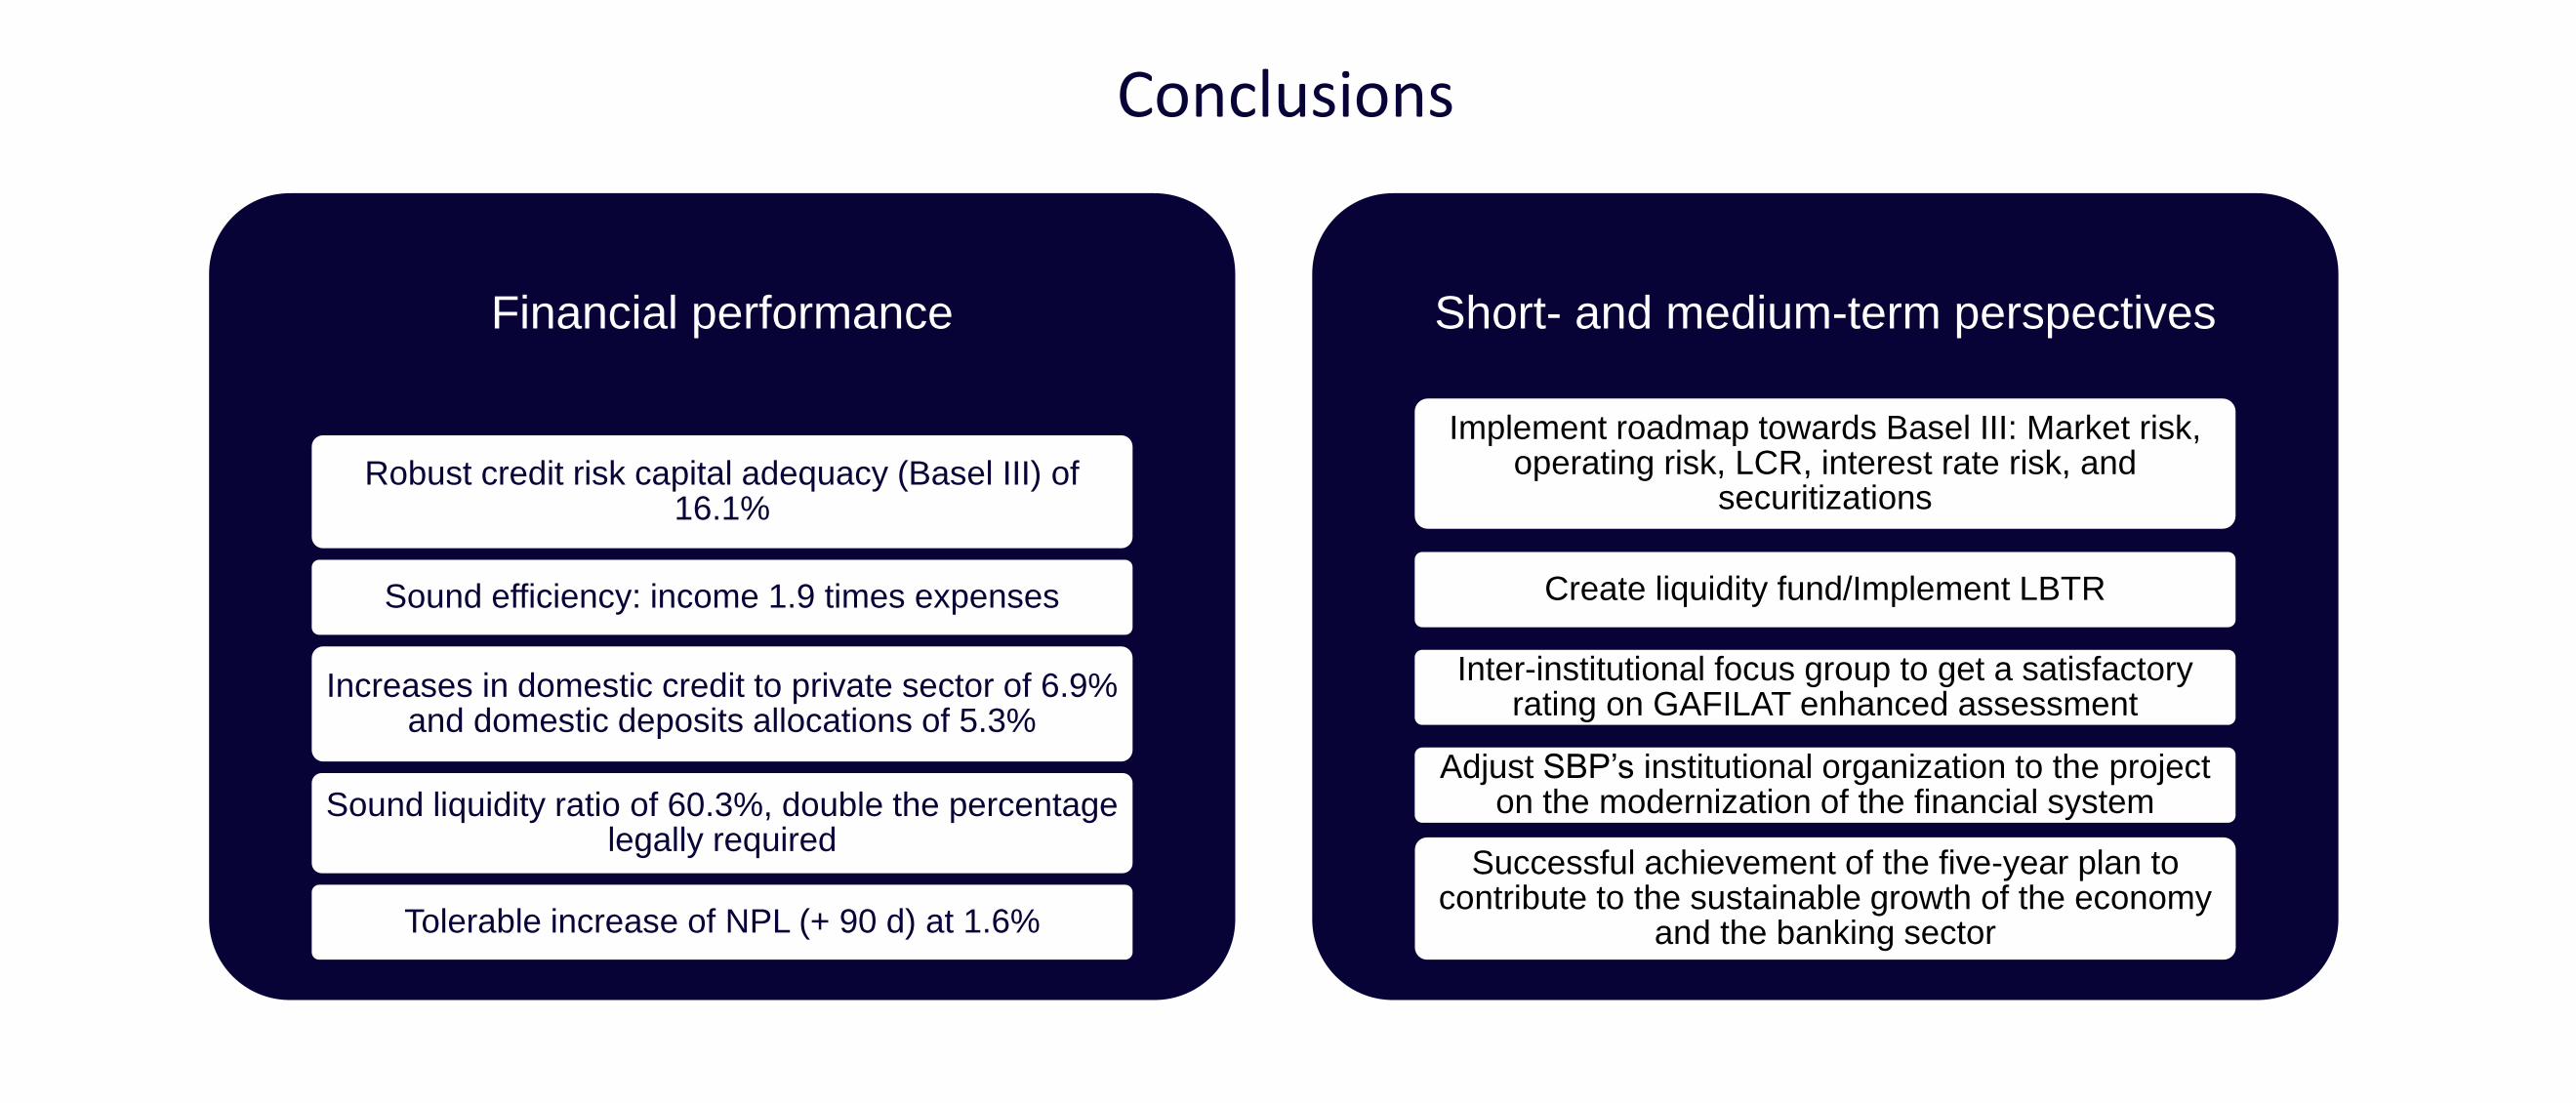
Financial performance
Robust credit risk capital adequacy (Basel III) of 16.1%
Sound efficiency: income 1.9 times expenses
Increases in domestic credit to private sector of 6.9% and domestic deposits allocations of 5.3%
Sound liquidity ratio of 60.3%, double the percentage legally required
Tolerable increase of NPL (+ 90 d) at 1.6%
Short- and medium-term perspectives
Implement roadmap towards Basel III: Market risk, operating risk, LCR, interest rate risk, and
securitizations
Create liquidity fund/Implement LBTR
Inter-institutional focus group to get a satisfactory rating on GAFILAT enhanced assessment
Adjust SBP’s institutional organization to the project on the modernization of the financial system
Successful achievement of the five-year plan to contribute to the sustainable growth of the economy
and the banking sector
Conclusions

Muchas Gracias
Thank you!
Recommended