DATALOGIC GROUP 2017 Financial Report
GROUP STRUCTURE pag. 1 COMPOSITION OF CORPORATE BODIES pag. 2 MANAGEMENT REPORT pag. 3
CONSOLIDATED FINANCIAL STATEMENTS Statement of financial position - assets pag.21 Statement of financial position - liabilities pag.22 Statement of income pag.23 Statement of comprehensive income pag.24 Statement of cash flow pag.25 Statement of shareholders’ equity pag.26 EXPLANATORY NOTES TO THE CONSOLIDATED FINANCIAL STATEMENTS
Presentation and content pag.27 Information on the statement of financial position pag.63 Information on the income statement pag.91

DATALOGIC S.p.A. 2017 Financial Report
FINANCIAL STATEMENTS Statement of financial position - assets pag.101 Statement of financial position - liabilities pag.102 Statement of income pag.103 Statement of comprehensive income pag.104 Statement of cash flow pag.105 Statement of shareholders’ equity pag.106 EXPLANATORY NOTES TO THE FINANCIAL STATEMENTS
Presentation and content pag.107 Information on the statement of financial position pag.130 Information on the income statement pag.146 ANNEXES
1. List of equity investments in subsidiaries and affiliates as at 31 December 2017 (art. 2427
no. 5 of the Italian Civil Code)
2. 2016 Restated consolidated statement of income
3. Declarations pursuant to Art. 81-ter, Consob Regulation no. 11971 of 14 May 1999

Datalogic Technologia de Mexico S.r.l.
(99,99%)
Legal entity
Branch
DATALOGIC S.p.A.
Datalogic S.r.I
(100%)
Laservall Asia Co Ltd. (33%)
Laservall China Co Ltd. (100%)
(53,9%)
WASP Barcode Technologies Ltd.
(100%)
(0,001%)
(0,001%)
Datalogic Real Estate GmbH (100%)
Datalogic Real Estate France Sas (100%)
Datalogic Real Estate UK Ltd (100%)
Datalogic Vietnam LLC
(100%)
Datalogic Slovakia S.r.o. (100%)
Datalogic (Shenzhen) Industrial Automation
Co., Ltd. (100%)
Informatics Holdings, Inc. (100%)
Datalogic S.r.l. [Succursale en France]
Datalogic S.r.l. Ireland
Datalogic S.r.l. Sucursal en España
Datalogic S.r.l. Benelux
Datalogic S.r.l. Italian Filial
Datalogic S.r.l. UK
Datalogic S.r.l. Merkezi Italya Istanbul Merkez Subesi
Datalogic do Brasil Comercio de Equipamentos e
Automacao Ltda. (99,99%)
Datalogic USA, Inc. (100%)
Datalogic Hungary Kft.
(100%)
Datalogic Australia Pty Ltd. (100%)
Datasensor Gmbh (30%)
Specialvideo S.r.l. (40%)
Datalogic Automation AB [Sweden]
(20%)
(46,1%)
Datalogic ADC S.r.l. (Incorporated in Bologna Italy)
External Profit Company
Datalogic S.r.l. (Spòlka z ograniczona
odpowiedzialnoscia) oddzial w Polsce
Datalogic Scanning Eastern Europe GmbH
[Germany] (100%)
CAEN RFID S.r.l. (20%)
Datalogic IP Tech S.r.l.
Solution Net Systems Inc. 100%
Datalogic Singapore Asia Pacific Pte. Ltd.
(100%)
ITALY/EMEA
AMERICAS
APAC
REAL ESTATE
OTHER
IP TECH
Datalogic S.r.l. Niederlassung Central Europe
Datalogic Singapore
Asia Pacific Pte. Ltd
(KOREA)
Suzhou Mobilead Electronics Company
Co., Ltd . (25%)
Soredi Touch Systems GmbH
100%.
R4i S.r.l. (20%)

2
COMPOSITION OF CORPORATE BODIES
Board of Directors (1)
Volta Romano Chairman (2) Volta Valentina Director & Chief Executive Officer (2) Aversa Carlo Achille Director Di Stefano Luigi Independent Director Mazzalveri Gaia Independent Director Todescato Pietro Director Volta Filippo Maria Director Statutory Auditors (3) Fiorenza Salvatore Marco Andrea Chairman Santagostino Roberto Statutory Auditor Lancellotti Elena Statutory Auditor Prandi Paolo Alternate Statutory Auditor Fuzzi Mario Alternate Statutory Auditor
Auditing Company
Reconta Ernst & Young S.p.A. (1) The Board of Directors will remain in office until the general meeting that approves the accounts for the financial year ending 31 December 2017. On 23 November 2017, Mr. Pier Paolo Caruso and Mrs. Sonia Magnani resigned from their offices as member of the Datalogic Board of Directors and Alternate Statutory Auditor. (2) Legal representative with respect to third parties. (3) The Statutory Auditors in office until the approval of the accounts for the financial year ending 31 December 2018.

Datalogic Group
Management Report as at 31 December 2017 3
MANAGEMENT REPORT
INTRODUCTION
This annual Financial Report as at 31 December 2017 was drawn up pursuant to Art. 154 of T.U.F.
[Consolidated Law on Finance] and was prepared in compliance with the international accounting standards
(IAS/IFRS) endorsed by the European Union.
The amounts reported in the Management Report are expressed in thousands of Euro. The Explanatory
Notes to the accounts are expressed in millions of Euro.
GROUP PROFILE
Datalogic is the world leader in the markets of automatic data capture and process automation. The Group is
specialised in the manufacture of fixed bar code readers, mobile computers, RFID-Radiofrequency,
identification technology, detection, measurement and security sensors, vision and laser marking systems.
Its pioneering solutions contribute to increase efficiency and quality of processes along the entire value
chain, in the Retail, Manufacturing, Transportation & Logistics and Healthcare sectors.
HIGHLIGHTS FOR THE YEAR AND THE FOURTH QUARTER
The following table summarises the Datalogic Group’s key operating and financial results for 2017 in
comparison with the same period a year earlier:
2017
% on Revenues
2016 % on
Revenues change %
% change at constant Euro/Dollar
exchange rate
Total revenues 606,022 100.0% 576,482 100.0% 29,540 5.1% 6.0%
EBITDA 103,299 17.0% 90,366 15.7% 12,933 14.3% 14.5%
Operating result (EBIT) 82,879 13.7% 70,245 12.2% 12,634 18.0% 18.1%
Group net profit/loss 60,080 9.9% 45,846 8.0% 14,234 31.0%
Net Financial Position (NFP) 30,137 3,503 26,634
The results for the year 2017 highlight a growth of all economic indicators. Thanks to higher revenues from
sales and efficiency on costs of goods sold and reduced operating costs, EBITDA increased by 14.3%, to
around €103.3 million, with the EBITDA margin standing at 17%, EBIT increased by 18%, to €82.9 million
and net profit by 31%, to €60.1 million.
The Net Financial Position, positive by €30.1 million, highlighted an improvement of €26.6 million compared
to 31 December 2016.

Datalogic Group
Management Report as at 31 December 2017 4
The following table summarises the key operating results for the fourth quarter of 2017 in comparison with
the same period a year earlier:
4Q 2017 % on
Revenue 4Q 2016
% on Revenue
change %
% change at constant
Euro/Dollar exchange
rate Total revenues 155,311 100.0% 154,729 100.0% 582 0.4% 3.7%
EBITDA 25,394 16.4% 23,727 15.3% 1,667 7.0% 5.8%
Operating result (EBIT) 20,413 13.1% 17,495 11.3% 2,918 16.7% 13.7%
Group net profit/loss 15,009 9.7% 4,964 3.2% 10,045 202.4%
The performance of the fourth quarter is particularly affected by the negative trend of the Euro/Dollar
exchange rate, which affected the growth of revenues, amounting to €155.3 million, up by 0.4% compared to
the fourth quarter of 2016. At constant exchange rates, the growth recorded compared to the same period of
2016 was 3.7%.
EBITDA recorded in the fourth quarter of 2017, equal to €25.4 million, grew by 7% compared to the fourth
quarter of 2016 and the impact on revenues increased from 15.3% to 16.4%.
The Net Profit (€15 million) showed a clear improvement compared to the fourth quarter of 2016, with an
impact on revenues from 3.2% to 9.7%.
PERFORMANCE INDICATORS
To allow for a better valuation of the Group’s performance, the Management adopted some performance
indicators that are not identified as accounting measures within IFRS (NON-GAAP measures). The
measurement criteria applied by the Group might be not consistent with the ones adopted by other groups
and the indicators might not be comparable with the one determined by the latter. These performance
indicators, determined according to provisions set out by Guidelines on performance indicators, issued by
ESMA/2015/1415 and adopted by CONSOB with communication no. 92543 of 03 December 2015, refer only
to the performance of the accounting period related to this annual Financial Report and the compared
periods.
The performance indicators must be considered as supplementary and do not supersede information given
pursuant to IFRS standards. The description of the main indicators adopted is given hereunder.
EBITDA (Earnings Before Interest, Taxes, Depreciation and Amortisation): this indicator is
defined as Profit/Loss for the period before depreciation and amortisation of tangible and intangible
assets, non-recurring costs/revenues, financial income and expenses and income taxes;
EBIT (Earnings Before Interests and Taxes) or Operating result: operating result, as inferable
from the Income Statement.
Net working capital in the trading segment: this indicator is calculated as the sum of Inventories
and Trade Receivables, less Trade Payables.
Net Working Capital: this indicator is calculated as the sum of Net Working Capital in the trading
segment and Other Assets, as well as of Current Liabilities, including short-term Provisions for risks
and charges.

Datalogic Group
Management Report as at 31 December 2017 5
Net Invested Capital: this indicator is the total of current and non-current Assets, excluding financial
assets, less current and non-current Liabilities, excluding financial liabilities.
PFP (Net Financial Position) or Net Financial Debt: this indicator is calculated based on
provisions set out by Consob Communication no. 15519 of 28 July 2006, also including “Other
financial assets” represented by temporary liquidity investments.
GROUP RECLASSIFIED ECONOMIC RESULTS FOR THE YEAR
The following table shows the main income statement items of the current year, compared with the same
period in the previous year:
2017
% on Revenues
2016 % on
Revenues change %
Total revenues 606,022 100.0% 576,482 100.0% 29,540 5.1%
Cost of goods sold (317,629) -52.4% (311,346) -54.0% (6,283) 2.0%
Gross profit 288,393 47.6% 265,136 46.0% 23,257 8.8%
Other revenues 2,964 0.5% 3,278 0.6% (314) -9.6%
Research and development expenses (55,275) -9.1% (50,421) -8.7% (4,854) 9.6%
Distribution expenses (99,701) -16.5% (97,456) -16.9% (2,245) 2.3%
General and administrative expenses (44,804) -7.4% (41,372) -7.2% (3,432) 8.3%
Other operating costs (2,959) -0.5% (3,027) -0.5% 68 -2.2%
Total Operating costs and other costs (202,739) -33.5% (192,276) -33.4% (10,463) 5.4%
Non-recurring costs and revenues (924) -0.2% (979) -0.2% 55 -5.6%
Depreciation & amortisation due to acquisitions
(4,815) -0.8% (4,914) -0.9% 99 -2.0%
Operating result (EBIT) 82,879 13.7% 70,245 12.2% 12,634 18.0%
Net financial income (expenses) (4,330) -0.7% (3,055) -0.5% (1,275) 41.7%
Profits/(losses) from associates (85) 0.0% (318) -0.1% 233 -73.3%
Foreign exchange gains/(losses) (3,010) -0.5% 20 0.0% (3,030) n.a.
Pre-tax profit/(loss) (EBT) 75,454 12.5% 66,892 11.6% 8,562 12.8%
Taxes (15,374) -2.5% (21,046) -3.7% 5,672 -27.0%
GROUP NET PROFIT/(LOSS) 60,080 9.9% 45,846 8.0% 14,234 31.0%
Non-recurring costs and revenues (924) -0.2% (979) -0.2% 55 -5.6%
Depreciation and write-downs of tangible assets
(10,273) -1.7% (9,363) -1.6% (910) 9.7%
Amortisation and write-downs of intangible assets
(9,223) -1.5% (9,779) -1.7% 556 -5.7%
EBITDA 103,299 17.0% 90,366 15.7% 12,933 14.3%
It should be noted that, since 2017, some costs have been reclassified under various items. Comparative data as at 31 December 2016
have therefore been disclosed accordingly. For details please refer to the Annex 1 to the annual Financial Report.
The Group results for the year 2017 included data related to the third and fourth quarter of the company
Soredi Touch Systems GmbH acquired on 06 July 2017, as better described in the Explanatory Notes in
section Change in the scope of consolidation and Business combination.

Datalogic Group
Management Report as at 31 December 2017 6
Consolidated net revenues amounted to €606 million, up by 5.1% compared to €576.5 million as at 31
December 2016 (+6% at constant Euro/Dollar exchange rate), despite the unfavourable trend of the
Euro/Dollar exchange rate, especially in the second half of the year.
The booking (already acquired orders) achieved €626.6 million, up by 6.9% compared to the same period of
2016 (€586 million in 2016). The impact of the new products on turnover for 2017 was 12.7% (24.3% in
2016) and is attributable primarily to the time deviation between the exit from statistics of new products and
the adoption of statistics related to new products, mainly in the second half of the year.
Gross profit, equal to €288.4 million, increased by 8.8% against €265.1 million reported in the same period
of the previous year (+9.4% at constant Euro/Dollar exchange rate), while its impact on revenues increased
by 1.6%, from 46% in 2016 to 47.6% in 2017. The improvement is attributable mainly to the increase of sales
volumes, the improvement of mix, as well as to efficiencies of the main components of cost of goods sold.
Operating costs, equal to €202.7 million, increased by 5.4% (+6.2% at constant Euro/Dollar exchange rate),
against €192.3 million in 2016, while they are substantially in line, in their impact on sales, compared to the
previous year, from 33.4% to 33.5%. In particular, an increase in R&D costs, from 9.6% to €55.3 million
(+10.5% at constant Euro/Dollar exchange rate), with an impact of 9.1% on revenues (equal to 9.5% in the
core business of the Datalogic Division), compared to 8.7% reported in 2016.
EBITDA grew by 14.3%, from €90.4 million recorded in the previous year, to €103.3 million (+14.5% at
constant Euro/Dollar exchange rate), while the impact on revenues (EBITDA margin) grew to 17% compared
to 15.7% in 2016, primarily thanks to the improvement of the gross profit and the reduction of operating costs
which remain substantially in line, in their impact on turnover.
Operating Result (EBIT) increased by 18%, from €70.2 million in the previous year to €82.9 million (+18.1%
at constant Euro/Dollar exchange rate).
Financial income
2017 2016 Change
Financial income/(expenses) (2,964) (1,637) (1,327)
Foreign exchange differences (3,010) 20 (3,030)
Bank expenses (2,062) (1,828) (234)
Other 696 410 286
Total Net financial income (expenses) (7,340) (3,035) (4,305)
Financial income was negative by €7.3 million, compared to a negative result of €3 million related to the
same period of the previous year, which mainly refers to the trend of foreign exchange differences, negative
by €3 million, due to both a purely accounting translation effect resulting from the derecognition of
intercompany economic items and the effect of depreciation of the US Dollar on Group net balances. The
increase in financial expenses is attributable to the increase in gross indebtedness, while the increase in
bank fees was affected by the release of upfront fees, amounting to €437 thousand, related to the early
redemption of the long-term loan occurred in the first half of the year.
The Group net profit, amounting to €60.1 million, increased by 31% compared to the profit recorded in the
same period of the previous year (€45.8 million).

Datalogic Group
Management Report as at 31 December 2017 7
REVENUES BY GEOGRAPHICAL AREA FOR THE YEAR AND THE FOURTH QUARTER
The following table shows the breakdown by geographical area of Group revenues achieved in 2017
compared with the same period of 2016:
2017 % on
Revenues 2016
% on Revenues
Change %
% change at constant
Euro/Dollar exchange
rate Italy 58,944 9.7% 51,184 8.9% 7,760 15.2%
EMEA (except Italy) 268,562 44.3% 253,362 43.9% 15,200 6.0%
Total EMEA (*) 327,506 54.0% 304,546 52.8% 22,960 7.5% 7.7%
North America 171,414 28.3% 178,269 30.9% (6,855) (3.8%) (2.2%)
Latin America 27,468 4.5% 30,032 5.2% (2,564) (8.5%) (6.7%)
APAC (*)
(incl. China) 79,634 13.1% 63,635 11.0% 15,999 25.1% 26.5%
Total revenues 606,022 100.0% 576,482 100.0% 29,540 5.1% 6.0%
(*) EMEA: Europe, Middle East and Africa; APAC: Asia & Pacific
Since 2017, data related to geographical areas will be disclosed to reflect the actual involvement of each area within the new
commercial organisation of the Group. Comparative data as at 31 December 2016 will be disclosed accordingly.
During the year 2017, EMEA reported 7.5% growth, to €327.5 million and a significant growth was reported
in APAC (€79.6 million, +25.1%), driven by China (+54.8%). The negative trend was recorded in both North
America, down by 3.8% (-2.2% at constant Euro/Dollar exchange rate) due to the negative exchange rate,
and in Latin America.
The following table shows the breakdown by geographical area of Group revenues achieved in the forth
quarter of 2017 compared with the same period of 2016:
4Q 2017 % on
Revenues 4Q 2016
% on Revenues
Change %
% change at constant
Euro/Dollar exchange
rate Italy 17,355 11.2%
11,258
7.3% 6,097 54.2%
EMEA (except Italy) 72,425 46.6% 71,853 46.4% 572 0.8%
Total EMEA 89,780 57.8%
83,111 53.7% 6,669 8.0% 8.7%
North America 37,640 24.2%
46,514 30.1% (8,874) (19.1%) (12.1%)
Latin America 7,363 4.7% 9,516 6.2% (2,153) (22.6%) (17.8%)
APAC (incl. China) 20,528 13.2%
15,588 10.1% 4,940 31.7% 37.4%
Total revenues 155,311 100.0% 154,729 100.0% 582 0.4% 3.7%
A slightly positive trend was recorded in revenues for the fourth quarter (+0.4%), despite the constant
negative Euro/Dollar exchange rate. At constant Euro/Dollar exchange rate, the growth recorded compared
to the same period of 2016 was +3.7%. The growth is due mainly to the excellent performance in China and
EMEA, which also benefits from the recent acquisition of Soredi Touch System, while a reduction in North
and Latin America was recorded.
ANNUAL ECONOMIC RESULTS BY DIVISION
Datalogic Group
Management Report as at 31 December 2017 8
Operating segments are identified based on the management reporting used by senior management to
allocate resources and evaluate results.
In light of the new business operating structure and corporate reorganisation, in 2017 the operating sectors
were redefined accordingly and periodically remeasured by the top management.
For 2017, the operating segments were included in the following divisions:
Datalogic, which represents the core business of the Group and designs and produces bar code
scanners, RFID, mobile computers, detection, measurement and security sensors, and vision and
laser marking systems intended to contribute for higher efficiency and quality of processes in the
areas of large-scale distribution, manufacturing, transport & logistics and health, along the entire
value chain;
Solution Net Systems, specialised in supplying and installing integrated solutions for automated
distribution for the postal segment and distribution centres in the Retail sector;
Informatics, which sells and distributes products and solutions for the management of inventories
and mobile assets tailored to small and medium sized companies.
Intersegment sales transactions are executed at arm's length conditions, based on the Group transfer pricing
policies.
The financial information related to operating segments for the years 2017 and 2016 is as follows
(€/000):
Informatics
Solution Net System
Datalogic Adjustments Total Group
2017 2016 2017 2016 2017 2016 2017 2016 2017 2016
External revenues 20,586 24,351 24,728 20,090 560,707 532,041 0 0 606,022 576,482
Intersegment revenues 9 15 12 103 3,273 2,199 (3,294) (2,317) 0 0
Total Sales 20,595 24,366 24,740 20,193 563,980 534,240 (3,294) (2,317) 606,022 576,482
Operating result (EBIT) (281) (1,599) 2,785 (1,061) 79,917 73,042 458 (137) 82,879 70,245
% of revenues (1.4)% (6.6)% 11.3% (5.3)% 14.2% 13.7% (13.9)% 6.0% 13.7% 12.2%
Non-recurring costs/revenues
0 278 0 0 (924) (1,257) 0 0 (924) (979)
Amortisation, depreciation and write-downs
(427) (345) (69) (41) (19,327) (18,754) 327 (2) (19,496) (19,142)
EBITDA 146 (1,532) 2,854 (1,020) 100,168 93,054 131 (136) 103,299 90,366
% of revenues 0.7% (6.3)% 11.5% (5.1)% 17.8% 17.4% (4.0)% 5.9% 17.0% 15.7%
Financial income (expenses) (104) (219) (127) (20) (7,083) (3,216) (111) 102 (7,425) (3,353)
Fiscal income (expenses) (125) 561 (1,033) (220) (14,171) (21,372) (45) (15) (15,374) (21,046)
R&D expenses (1,394) (1,488) (485) (600) (53,396) (48,327) 0 (6) (55,275) (50,421)
% of revenues (6.8)% (6.1)% (2.0)% (3.0)% (9.5)% (9.0)% 0.0% 0.3% (9.1)% (8.7)%
(*) Data for 2016 have been restated on the basis of the new operational structure
Revenues for the fourth quarter of 2017, compared to the same period of 2016, are as follows:

Datalogic Group
Management Report as at 31 December 2017 9
4Q 2017 % on
Revenues 4Q 2016 (*)
% on Revenues
Change %
% change at constant
Euro/Dollar exchange rate
Datalogic 146,236 94.2% 143,279 92.6% 2,957 2.1% 5.2%
Solution Net Systems (*) 5,433 3.5% 6,412 4.1% (979) (15.3%) (9.3%)
Informatics 4,229 2.7% 5,806 3.8% (1,577) (27.2%) (21.2%)
Adjustments (588) (0.4%) (768) (0.5%) 180
Total revenues 155,311 100.0% 154,729 100.0% 582 0.4% 3.7%
(*) Data for 2016 have been restated on the basis of the new operational structure
Datalogic Division
In the fourth quarter, the Datalogic Division reported a turnover of €146.2 million, up by 2.1% compared to
the same period of 2016 (+5.2% at constant Euro/Dollar exchange rate), with a very positive performance in
EMEA and APAC; especially in China, where a growth of over 90% was recorded.
In 2017, this Division reported a turnover of €564 million, up 5.6% (+6.3% at constant Euro/Dollar exchange
rate), compared to 2016.
EBITDA related to the Division amounted to €100.2 million, up 7.6%, with an impact on sales of 17.8%
(17.4% as at 31 December 2016).
Below is the breakdown of the Datalogic Division’s revenues, divided by business sector:
2017 % on
Revenues 2016
% on Revenues
Change %
% change at constant
Euro/Dollar exchange rate
Retail 278,645 49.4% 283,070 53.0% (4,425) (1.6%) (0.7%)
Manufacturing 150,476 26.7% 136,675 25.6% 13,801 10.1% 10.6%
Transportation & Logistics
65,766 11.7% 58,253 10.9% 7,513 12.9% 14.3%
Healthcare 27,490 4.9% 19,800 3.7% 7,690 38.8% 39.8%
Channel (unallocated) (*) 41,603 7.4% 36,442 6.8% 5,161 14.2% 13.9%
Total revenues 563,980 100.0% 534,240 100.0% 29,740 5.6% 6.3%
(*) The Channel sector (unallocated) includes revenues not directly attributable to the 4 areas identified.
The Retail sector reported 1.6% decrease compared to the previous year (-0.7% at constant Euro/Dollar
exchange rate), mainly related to a slowdown of sales in North America due to the postponement of some
projects with key customers and the launching of important new products for the sector, occurred in the last
half of the year only. EMEA and China confirmed the growth trend.
The Manufacturing sector confirmed its expansion trend, up by 10.1% compared to the previous year
(+10.6% at constant Euro/Dollar exchange rate), mainly driven by the business development in China.
After a non-positive performance for the first months of the year, the Transportation & Logistics sector
recorded a double-digit growth in the following quarters, mainly driven by North America and China. In 2017,
the growth stood at 12.9% compared to 2016 (+14.3% at constant Euro/Dollar exchange rate).

Datalogic Group
Management Report as at 31 December 2017 10
The Healthcare sector continued to have the strongest growth in 2017, in percentage terms, of 38.8% over
last year. The growth is due mainly to North America, despite the negative impact of the Euro/Dollar
exchange rate (+39.8% at constant Euro/Dollar exchange rate).
Very positive performance should be also highlighted in sales through distribution channel, especially to
small and medium-sized customers, not directly attributable to any of the four main sectors, and that reported
14.2% growth compared to 2016, concentrated in EMEA and North America.
Solution Net Systems Division
The Solution Net Systems Division reported 15.3% drop in the fourth quarter of 2017 (down by 9.3% at
constant Euro/Dollar exchange rate), with a turnover of €5.4 million due to the seasonality of products. In
2017, the Division recorded a turnover of €24.7 million, highlighting 22.5% growth compared to 2016 (+25%
at constant Euro/Dollar exchange rate).
EBITDA related to the Division amounted to €2.9 million (negative by 1 million in the same period of 2016),
with an impact on sales of 11.5%.
Informatics Division
In the fourth quarter, the Informatics Division recorded a turnover of €4.2 million, down 27.2% (-21.2% at
constant Euro/Dollar exchange rate) compared to the fourth quarter of 2016.
In 2017, this division reported a turnover of €20.6 million, down by 15.5% (-14.3% at constant Euro/Dollar
exchange rate), compared to 2016.
EBITDA related to the Division amounted to €0.1 million (negative by 1.5 million in the same period of 2016).

Datalogic Group
Management Report as at 31 December 2017 11
ANALYSIS OF FINANCIAL AND CAPITAL DATA
The following table shows the main financial and equity items for the Datalogic Group as at 31 December
2017, compared with 31 December 2016.
31.12.2017 31.12.2016 Change
Intangible assets 41,980 51,997 (10,017)
Goodwill 174,343 188,934 (14,591)
Tangible assets 69,733 72,082 (2,349)
Equity investments in associates 11,757 6,928 4,829
Other non-current assets 50,058 51,807 (1,749)
Non-current capital 347,871 371,748 (23,877)
Trade receivables 83,195 75,477 7,718
Trade payables (107,651) (104,585) (3,066)
Inventories 85,938 82,344 3,594
Net working capital in the trading segment 61,482 53,236 8,246
Other current assets 31,121 34,184 (3,063)
Held-for-sale assets 1,021 0 1,021
Other current liabilities and provisions for short term risks (71,621) (77,625) 6,004
Net Working Capital 22,003 9,795 12,208
Other M/L term liabilities (26,747) (30,836) 4,089
Post-employment benefits (6,633) (6,647) 14
Provisions for risks (13,602) (11,169) (2,433)
Net Invested Capital 322,892 332,891 (9,999)
Shareholders' Equity (353,029) (336,394) (16,635)
Net Financial Position (NFP) 30,137 3,503 26,634
Net Working Capital in the trading segment, as at 31 December 2017, amounted to €61.5 million (10.1% of
revenues) and increased by €8.2 million compared to the amount reported in 31 December 2016, mainly due
to Trade receivables.

Datalogic Group
Management Report as at 31 December 2017 12
As at 31 December 2017, the Net Financial Debt/(Net Financial Position) is broken down as follows:
31.12.2017 31.12.2016 change
A. Cash and bank deposits 256,201 146,930 109,271
B. Other cash and cash equivalents 11 47 (36)
b1. restricted cash deposit 11 47 (36)
C. Securities held for trading 0 0 0
c1. Short-term 0 0 0
c2. Long-term 0 0
D. Cash and cash equivalents (A) + (B) + (C) 256,212 146,977 109,235
E. Current financial receivables 0 0 0
F. Other current financial receivables 0 0 0
f1. hedging transactions 0 0 0
G. Bank overdrafts 92 212 (120)
H. Current portion of non-current debt 48,108 30,180 17,928
I. Other current financial payables 2,913 5,878 (2,965)
i1. hedging transactions 0 37 (37)
i2. payables for leasing 0 248 (248)
i3. current financial payables 2,913 5,593 (2,680)
J. Current Financial Debt, Net/(Current Net Financial Position) (G) + (H) +(I)
51,113 36,270 14,843
K. Current Financial Debt, Net/(Current Net Financial Position) (J) - (D) - (E) - (F)
(205,099) (110,707) (94,392)
L. Non-current bank borrowing 205,656 139,321 66,335
M. Other financial assets 31,444 32,117 (673)
N. Other non-current liabilities 750 0 750
n1. hedging transactions 0 0 0
n2. lease payables 0 0 0
n3. non-current financial payables 750 0 750
O. Non-current Financial Debt (L) - (M) + (N) 174,962 107,204 67,758
P. Net Financial Debt/(Net Financial Position) (K) + (O) (30,137) (3,503) (26,634)
The Net Financial Position as at 31 December 2017 was positive by €30.1 million, an improvement of €26.6
million compared to 31 December 2016 (positive by €3.5 million) thanks to the continuous and strong cash
generation, also after the distribution of the dividend.

Datalogic Group
Management Report as at 31 December 2017 13
Cash flows, which determined the improvement of the Group’s consolidated net financial position in 2017,
are summarised as follows.
31.12.2017
Net Financial Position /(Net Financial Debt) at the beginning of the period 3,503
EBITDA 103,299
Change in the net working capital in the trading segment (6,615)
Net investments (13,880)
Tax payment (17,316)
Cash flows related to the financial management (5,828)
Dividend distribution (17,443)
Acquisition of the equity investment in Soredi Touch Systems GmbH and Trademark (8,000)
Other changes (7,583)
Changes in Net Financial Position)/(Net Financial Debt) 26,634
(Net Financial Position)/Net Financial Debt at year end 30,137
RESEARCH AND DEVELOPMENT EXPENSES
In the market in which the Group operates, the ability to find and implement innovative solutions is one of the
key competitiveness factors.
For this reason, Datalogic continues to keep a high level of investment in R&D activities, equal to around
9.1% in Revenues for 2017 and 9.5% in the core business represented by the Datalogic division.
The innovation process is governed by an annually updated special procedure (“New Product
Development”), based on the “Product Roadmap” guidelines, representing the mandate that is granted by
the CEO to the R&D division.
The disruptive innovation is controlled through the DL LABS, a centralised research team within the
company Datalogic IP Tech.
The main activity of the DL LABS is the development of core technologies used in the products, including
scan engines and decoder libraries, to which the development of Platforms (i.e. hardware and software
components that are reusable and shared by multiple product groups) is added.
The components developed by DL LABS and the team in charge of Platforms are used by Product hubs,
product development teams grouped by technological similarities and in charge of rendering the innovation
available to the market.
The R&D division employs over 400 persons in Datalogic. The results of the innovation processes are
patented.
HUMAN RESOURCES AND INDUSTRIAL RELATIONS
Human Resources are managed at macro-Region level. The Global Chief Human Resources Officer is
supported by three Regional Managers (EMEA, APAC and Americas), who supervise all managerial
processes. The business partners, managers who supervise employees’ operations at local level, report to
the Regional Managers.
The key processes for the management of Human Resources are described hereunder.
Recruiting: an ambitious hiring plan was launched in 2017. It concerned mainly the R&D area, where more
than 80 people are expected to be hired in Italy. To achieve this objective, the Group has implemented
various strategies and initiatives aimed at luring talents and highlighting the numerous opportunities that the

Datalogic Group
Management Report as at 31 December 2017 14
Group offers on the occasion of career days dedicated to the presentation of both the company and the
posts available, as well as aimed at opening the headquarters to students on the occasion of an entire day
dedicated to orientation and meetings with managers.
Training: training is a key process to maintain high competence at all levels. For a better implementation of
actions and to strengthen the efficacy of investments made, a centralisation of the process was started in
2017. The Group had defined process and instruments to detect the training needs, in a global viewpoint,
while preparing a unified catalogue of training opportunities, available to all employees.
Assessment of performance: this is a well-established process within the Group. The entire personnel is
involved in annual performance assessments, with special focus on employees entitled to receive a
corporate and individual target-related variable remuneration.
As regards relations with Trade Unions, the 2016-2018 integrative second-level trade union agreement was
signed at the beginning of 2017, which confirmed the company’s investments as regards employment, above
all in the Research & Development segment. Moreover, the company introduced and improved some
economic elements related to the management of daily life and work hours (e.g. increased travel allowances,
increased leaves for medical visits, etc.). In 2017 the Company made a Welfare platform available to
employees who could elect to take advantage from a range of flexible benefits provided for by law, based on
the use of the converted amount related to performance premiums and of the Welfare amount made
available for them according to the Metalmechanica Labour Contract, in addition to converted variable
premiums for some categories of employees. Various conventions were also made available to all
employees within the same portal, which increased the expense power of some goods and services for
leisure.
Datalogic Group
Management Report as at 31 December 2017 15
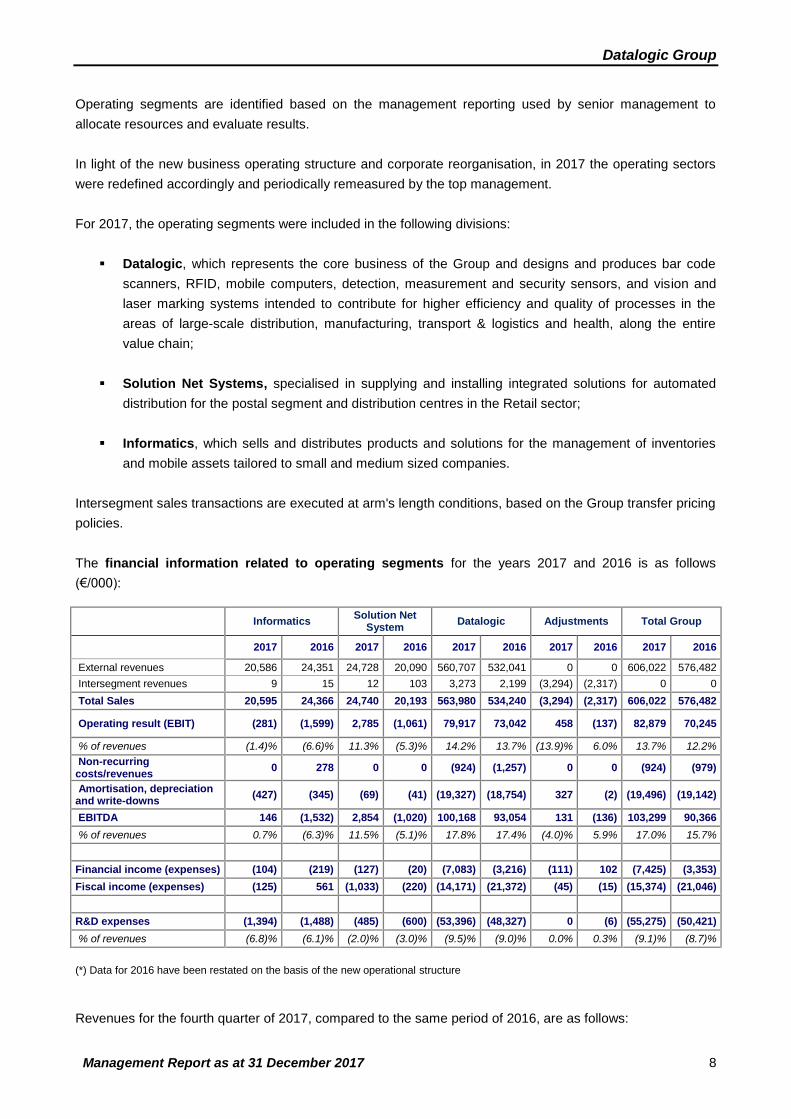
RECONCILIATION STATEMENT BETWEEN THE RESULT FOR THE PERIOD AND THE
SHAREHOLDERS’ EQUITY OF THE GROUP PARENT COMPANY
The Reconciliation Statements between Shareholders’ Equity and Net Profit of Datalogic SpA and the
corresponding consolidated values as at 31 December 2017 and 2016, as envisaged in Consob
Communication no. DEM/6064293 of 28 July 2006, are disclosed here below.
31 December 2017 31 December 2016
Total
equity Period results Total equity
Period results
Parent Company Shareholders’ Equity and profit 291,639 25,592 291,677 52,334
Difference between consolidated companies' shareholders’ equity and their carrying value in the Parent Company's financial statements; effect of equity-based valuation
121,084 62,913 111,061 51,183
Elimination of dividends (30,428) (53,387)
Amortisation of intangible assets “business combination” (5,827) (5,827)
Effect of acquisition under common control (31,733) (31,733)
Elimination of capital gain on sale of business branch (17,067) 183 (18,665)
Effect of elimination on intercompany transactions (12,276) 1,769 (17,700) (4,231)
Elimination of write-downs and capital gains on equity investments
5,517 5,517 (604)
Sale of know-how (7) (7)
Goodwill impairment (1,395) (1,395)
Other (1,342) (137) (1,193) (61)
Deferred taxes 4,436 188 4,659 612
Group Shareholders' Equity 353,029 60,080 336,394 45,846
STOCK MARKET PERFORMANCE
Datalogic S.p.A. has been listed on the Borsa Italiana since 2001 - STAR segment of the MTA, Italy’s
screen-based stock market, which comprises medium-sized companies with market capitalisations of
between €40 million and €1 billion, committed to meeting standards of excellence.
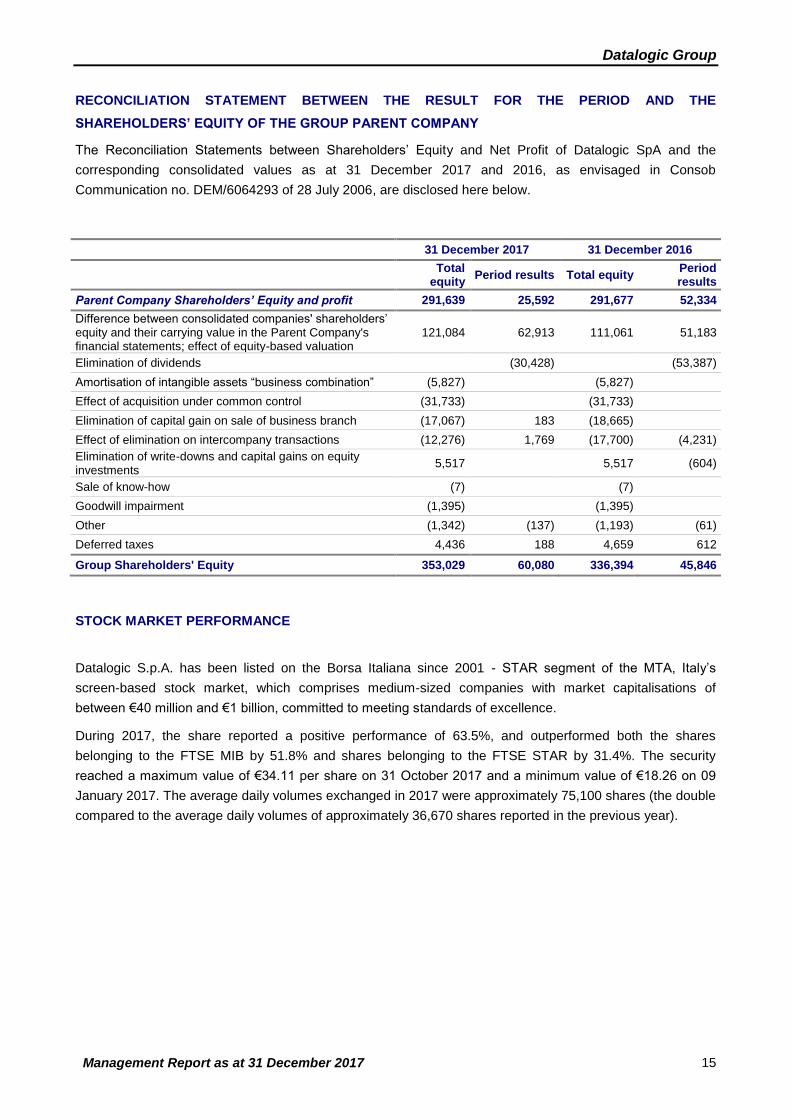
During 2017, the share reported a positive performance of 63.5%, and outperformed both the shares
belonging to the FTSE MIB by 51.8% and shares belonging to the FTSE STAR by 31.4%. The security
reached a maximum value of €34.11 per share on 31 October 2017 and a minimum value of €18.26 on 09
January 2017. The average daily volumes exchanged in 2017 were approximately 75,100 shares (the double
compared to the average daily volumes of approximately 36,670 shares reported in the previous year).

Datalogic Group
Management Report as at 31 December 2017 16
STOCK EXCHANGE 2017
Segment STAR - MTA
Bloomberg Code DAL.IM
Reuters Code DAL.MI
MKT Cap €1,801.3 million as at 31 December 2017
Number of shares 58,446,491 (of which 217,014 treasury shares)
2017 min €18.26 (09 January 2017)
2017 max €34.11 (31 October 2017)
Relations with institutional investors and shareholders
Datalogic actively strives to maintain an ongoing dialogue with shareholders and institutional investors,
periodically arranging meetings with representatives of the Italian and international financial community,
including annual roadshows organised by Borsa Italiana for companies belonging to the STAR segment.
During 2017, the Company met over 250 institutional investors, up by 30% over the prior year, in “one to
one, lunch meeting” and corporate events.
Grafico annuale performance/volumi Datalogic
-
130.0
260.0
390.0
520.0
650.0
780.0
910.0
1,040.0
1,170.0
1,300.0
1,430.0
1,560.0
1,690.0
1,820.0
14.0
15.0
16.0
17.0
18.0
19.0
20.0
21.0
22.0
23.0
24.0
25.0
26.0
27.0
28.0
29.0
30.0
31.0
32.0
33.0
34.0
35.0
36.0
02/01/17 02/02/17 02/03/17 02/04/17 02/05/17 02/06/17 02/07/17 02/08/17 02/09/17 02/10/17 02/11/17 02/12/17
volu
mi
Mig
liaia
pre
zzi
Datalogic Group
Management Report as at 31 December 2017 17
EXPOSURE TO VARIOUS TYPES OF RISK
The Group is exposed to various types of corporate risk in carrying out its business. Financial risks (market
risk, credit risk and liquidity risk) will be discussed more detail in the following paragraph. The key corporate
risks affecting the financial and economic situation of the Group are as follows:
a) Staff skills: the Group’s business is closely related to the technical skills of its employees, especially in
the areas of Research and Development. To limit this risk, the Group carries out actions with a view to
increasing its ability to attract and maintain highly qualified personnel, including implementation of advanced
human resources management tools and a positive work environment.
b) Protection of technology: the Group reference market is characterised by the design and production of
high-tech products, with the resulting risk that the technologies adopted might be copied and used by other
operators in the sector. With regard to this risk, over the last few years the Group has already made
significant investments in intellectual property.
c) Difficult procurement: the Group is exposed to contained procurement risk thanks to a strategy
whereby every component is sourced from several suppliers. In the few cases when components are
sourced from a single supplier, the Group maintains adequate inventories of the critical components, in order
to minimize the risks related to this situation.
d) Competition: the Group operates in a market that is extremely dynamic and potentially attractive for
new operators with financial means greater than those of the company. To mitigate the risk associated with
these events, the company maintains a high level of investment in research & development (around 9.1% of
revenues as at 31 December 2017 and 9.5% in the core business represented by the Datalogic Division) and
a large portfolio of patents, which represents a significant barrier to the entry of new competitors. The
Datalogic Group also has a strong commercial structure (direct presence in the key countries where the
Group operates) and a solid network of commercial partners which makes it possible to ensure a high level
of customer service and thus achieve a high degree of loyalty.
FINANCIAL RISK MANAGEMENT OBJECTIVES AND POLICIES
In carrying out its business, the Group is exposed to various financial risks: market risk, credit risk and
liquidity risk.
The market risk consists in possible oscillations in the exchange rate (exchange rate risk) or in the interest
rate (interest rate risk), which might have a negative impact on the value of assets, liabilities or estimated
cash flows.
The Group manages each of the financial risks mentioned, in order to minimise them, sometimes with
hedging derivatives. The Parent Company manages the market and liquidity risks, whereas credit risks are
managed by the Group’s operating units, under the supervision of the Parent Company. For more
information on financials risks and financial instruments, please refer to the relevant section in the Notes to
the Accounts, which includes disclosure in accordance with IFRS 7.
Datalogic Group
Management Report as at 31 December 2017 18
INFORMATION ON COMPANY OWNERSHIP/ CORPORATE GOVERNANCE REPORT
Pursuant to and by the effects of article 123-bis, paragraph 3, of Legislative Decree 58 of 24 February 1998
(as subsequently amended), the Board of Directors of Datalogic S.p.A. has approved a report on corporate
governance and company ownership for the year ended 31 December 2017, separate from the management
report, containing information pursuant to paragraphs 1 and 2 of article 123-bis above.
This report is available to the public on the Company’s Internet site www.datalogic.com.
OTHER INFORMATION
Datalogic S.p.A. indirectly controls some companies established and governed by non-European Union
countries and that have a relevant importance as per Article 15 of the Consob Regulation 20249/2017
(former Article 36 of the Consob Regulation 16191/2007) on the market regulation (“Market Regulation”).
Also pursuant to the aforesaid regulation, the Company has implemented in-house procedures to monitor the
compliance with provisions set out by the Consob regulations. In particular, the appropriate corporate
management carry out a timing and periodical identification of relevant “extra-EU” countries and, with the
collaboration of the companies involved, the collection of data and information is ensured, as well as the
assessment of issues envisaged in the aforesaid Article 15.
It should be however stated that Datalogic is fully complying with provisions set out in Article 15 of the
above-mentioned Consob Regulation 20249/2017, and that conditions envisaged therein are present.
The Company complied with the opt-out system set forth in Articles 70, paragraph 8, and 71, paragraph 1-
bis, of the Issuer Regulation (implementation regulation of the Italian Consolidated Law on Finance (TUF),
concerning the rules for issuers, adopted by Consob with resolution 11971 of 14 May 1999, as amended
later), by making use of the right to depart from the obligation to publish information documents required on
the occasion of significant mergers, demergers, capital increase by non-cash contributions, acquisitions and
sales.
Pursuant to provisions set out by Article 5, paragraph 3, letter b, of the Legislative Decree 254/2016, the
Group provided separately for the consolidated non financial statement. The 2017 Consolidated Non
Financial Statement, prepared according to the GRI Standards reporting (or based on the GRI G4
Sustainability Reporting Guidelines) is available on the Group internet website.
NUMBER AND VALUE OF TREASURY SHARES
As at 31 December 2017, the total number of ordinary shares was 58,446,491, including 217,014 held as
treasury shares, making the number of shares in circulation at that date 58,229,477. The shares have a
nominal unit value of €0.52 and are fully paid up.
During 2017, the Group sold 85,215 treasury shares in relation to the acquisition of the company SOREDI
Touch Systems GmbH.

Datalogic Group
Management Report as at 31 December 2017 19
RELATED-PARTY TRANSACTIONS
Transactions with related parties, as disclosed in the financial statements, and described in detail in the
related Notes to the Income Statements items, to which reference is made, cannot be quantified as atypical
or unusual, given that they can be included in the normal business of the Group companies, and are
governed at arm’s length.
As regards the Procedure for Transactions with Related Parties, reference is made to the documents
published on the website www.datalogic.com, in the Investor Relations section.
With resolution no. 17221 of 12 March 2010, also pursuant and by the effects of article 2391-bis of the Italian
Civil Code, Consob adopted the Regulation with provisions on transactions with related parties, then
amended with resolution no. 17389 dated 23 June 2010 (“Consob Regulations”).
In accordance with the Consob Regulations, in order to ensure transparency, as well as substantive and
procedural rectitude in transactions carried out by Datalogic with “related parties”, pursuant to the aforesaid
Consob Regulations, on 4 November 2010, the Company approved a specific and structured procedure for
transactions with related parties (last amendment on 24 July 2015), which can be found on the internet site
www.datalogic.com.
Pursuant to Art. 5, par. 8, of the Consob Regulations, it should be noted that, over the period 01/01/2017 -
31/12/2017, the Company's Board of Directors did not approve any relevant transaction, as set out by Art. 3,
par. 1, lett. b) of the Consob Regulations, or any transaction with minority related parties that had a
significant impact on the Group’s equity position or profit/(loss).
TAX CONSOLIDATION
The Parent Company Datalogic S.p.A. and other Italian subsidiaries fall within the scope of the “domestic tax
consolidation” of Hydra S.p.A. This permits the transfer of total net income or the tax loss of individual
participant companies to the Parent Company, which calculates a single taxable income for the Group or a
single tax loss carried forward, as the algebraic sum of the income and/or losses, and therefore files a single
tax liability or credit with the Tax Authorities.
EVENTS IN 2017
On 13 April 2017, Datalogic S.p.A. signed an agreement for a new credit line worth €250 million and
maturing in 2023. The loan granted was partly intended for an early redemption, compared to the original
maturity, of the existing credit line (€126 million), and partly to support the ordinary activities and
development of the Group.
On 4 May 2017, the Extraordinary Shareholders' Meeting approved the amendments, amongst other, to
articles 6 and 9 of the Corporate By-Laws, mainly aimed at introducing the concept of “enhanced voting
rights” for long-term shareholders of the Company, pursuant to Art. 127 quinquies of Legislative Decree
58/1998 (“T.U.F.”), introduced by Art. 20, par. 1bis, of the Law Decree no. 91/2014, converted into Law no.
116/2014 (“Competitiveness Decree”).
On 6 June 2017, a binding agreement was entered, finalised on 6 July, for the acquisition of 100% share
capital of the German company Soredi Touch Systems GmbH, leader in technologies for terminals,

Datalogic Group
Management Report as at 31 December 2017 20
especially forklifts terminals. This transaction envisaged a total maximum financial commitment for Datalogic,
within 2021, of €10 million, of which €8 million cash and €2 million treasury shares.
On 23 November 2017, the Director Pier Paolo Caruso resigned from his office of member of Datalogic’s
Board of Directors. The resigning Director, not independent and not executive, was not a member of any
board committee.
BUSINESS OUTLOOK
The global macroeconomic scenario highlights an unchanged economic recovery that is underway in the
main areas in which the Group operates.
The sector in which the Group operates continues to report a constant growth trend in all reference business
segments, driven by the ever-increasing needs for industrial automation and corporate processes aimed at
improving productivity, achieving higher efficiency and even higher quality control standards in production.
The main growth trends that the Group will be able to seize and meet through its offer, in the next few years,
concern private initiatives and government plans aimed at fostering investments in technology transformation
(Industrial Plan 4.0) and in robotics development in the Manufacturing sector. These initiatives and plans are
also focused on accelerated e-commerce, development of multichannels as well as data collection and
analysis on the habits of end consumers, aimed at improving customer experience in the Retail sector,
constant evolution of regulations in view of higher safety standards in more regulated sectors such as
Healthcare, and airport systems in Transportation & Logistics.
The Group’s growth strategy envisages a continuous increase in R&S, an improvement of service levels
offered to customers, a further improvement of all commercial organisations in the main development areas,
with special focus on North America and the optimisation of production costs, combined with a thorough
control on operating costs and overheads.
In the absence of significant changes in ongoing economic and sectorial trends, the Group expects to
achieve growth targets in revenues and profitability, in 2018 as well, while maintaining its financial position
and cash generation level.
SECONDARY LOCATIONS
The Parent Company has no secondary locations.
The Chairman of the Board of Directors
(Mr. Romano Volta)

ASSETS (Euro/000)Note 31.12.2017 31.12.2016
A) Non-current assets (1+2+3+4+5+6+7) 379.315 403.865
1) Tangible assets 69.733 72.082
land 1 7.719 8.218
buildings 1 29.369 31.014
other assets 1 30.495 30.175
assets in progress and payments on account 1 2.150 2.675
of which from related parties 258
2) Intangible assets 216.323 240.931
goodwill 2 174.343 188.934
development costs 2 3.863 4.302
other 2 34.352 43.534
assets in progress and payments on account 2 3.765 4.161
3) Equity investments in associates 3 2.184 2.214
4) Financial assets 41.017 35.721
equity investments 5 9.573 4.714
securities 5 0 0
other 5 31.444 31.007
5) Loans 5 0 1.110
6) Trade and other receivables 7 2.194 2.394
7) Deferred tax assets 13 47.864 49.413
B) Current assets (8+9+10+11+12+13+14) 456.466 338.982
8) Inventories 85.938 82.344
raw and ancillary materials and consumables 8 33.101 29.954
work in progress and semi-finished products 8 25.417 25.883
finished products and goods 8 27.420 26.507
9) Trade and other receivables 7 102.886 91.526
trade receivables 7 83.195 75.477
trade receivables from third parties 7 82.402 74.490
trade receivables from associates 7 784 979
trade receivables from related parties 7 9 8
other receivables - accrued income and prepaid expenses 7 19.691 16.049
of which from associated parties 587
of which from related parties 76 75
10) Tax receivables 9 11.430 18.135
of which to the parent company 6.771 8.010
11) Financial assets 5 0 0
12) Loans 0 0
13) Financial assets - Derivative instruments 6 0 0
14) Cash and cash equivalents 10 256.212 146.977
C) Held-for-sale assets 1.021
Total assets (A+B+C) 836.802 742.847
CONSOLIDATED STATEMENT OF FINANCIAL POSITION
21

LIABILITIES (Euro/000)Note 31.12.2017 31.12.2016
A) Total shareholders’ equity (1+2+3+4+5) 11 353.029 336.394
1) Share capital 11 148.291 146.291
2) Reserves 11 14.815 42.817
3) Profits (losses) of previous years 11 129.843 101.440
4) Group profit (loss) for the period/year 11 60.080 45.846
5) Minority interests 11 0 0
B) Non-current liabilities (6+7+8+9+10+11+12) 253.388 187.973
6) Financial payables 12 206.406 139.321
7) Financial liabilities - Derivative instruments 6
8) Tax payables 9 43 44
9) Deferred tax liabilities 13 23.138 26.498
10) Post-employment benefits 14 6.633 6.647
11) Provisions for risks and charges 15 13.602 11.169
12) Other liabilities 16 3.566 4.294
C) Current liabilities (13+14+15+16+17) 230.385 218.480
13) Trade and other payables 16 157.924 151.494
trade payables 16 107.651 104.585
trade payables to third parties 16 107.051 104.058
trade payables to parent company 16 0 106
trade payables to associates 16 347 24
trade payables to related parties 16 253 397
other payables - accrued liabilities and deferred income 16 50.273 46.909
14) Tax payables 9 14.191 21.032
of which to the parent company 4.865 15.114
15) Provisions for risks and charges 15 7.157 9.684
16) Financial liabilities - Derivative instruments 6 37
17) Financial payables 12 51.113 36.233
Total liabilities (A+B+C) 836.802 742.847
CONSOLIDATED STATEMENT OF FINANCIAL POSITION
22

(Euro/000) Note 31.12.2017 31.12.2016
1) Total revenues 17 606.022 576.482
Revenues from sale of products 572.736 545.821
Revenues from services 33.286 30.661
of which from related parties and associates 5.680 5.577
2) Cost of goods sold 18 317.949 311.432
of which non-recurring 18 320 86
of which from related parties and associates 1.135 356
Gross profit (1-2) 288.073 265.050
3) Other operating revenues 19 2.964 3.278
of which non-recurring 19 0 0
of which from related parties 7 7
4) R&D expenses 18 55.561 50.542
of which non-recurring 18 183 16
of which amortisation, depreciation and write-downs pertaining
to acquisitions103 105
of which from related parties and associates 18 784 99
5) Distribution expenses 18 99.703 97.789
of which non-recurring 18 2 333
of which from related parties and associates 14 20
6) General and administrative expenses 18 49.935 47.169
of which non-recurring 18 419 988
of which amortisation, depreciation and write-downs pertaining
to acquisitions18 4.712 4.809
of which to the parent company 0
of which from related parties and associates 381 1.382
7) Other operating expenses 18 2.959 2.583
of which non-recurring 0 (444)
of which from related parties and associates 18 414 0
Total operating costs 208.158 198.083
Operating result 82.879 70.245
8) Financial income 20 29.050 19.502
of which from related parties and associates 0 0
9) Financial expenses 20 36.390 22.537
Net financial income (expenses) (8-9) (7.340) (3.035)
10) Profits from associates 3 (85) (318)
Profit (loss) before taxes from the operating assets75.454 66.892
Income tax 21 15.374 21.046
Profit/(loss) for the period 60.080 45.846
Basic earnings/(loss) per share (€) 22 1,03 0,79
Diluted earnings/(loss) per share (€) 22 1,03 0,79
CONSOLIDATED STATEMENT OF INCOME
23

(Euro/000) Note 31.12.2017 31.12.2016
Net profit/(loss) for the period 60.080 45.846
Other components of the statement of comprehensive income:
Other components of the statement of comprehensive income which will
be restated under profit/(loss) for the year:
Profit/(loss) on cash flow hedges 11 (920) 64
of which tax effect (21)
Profit/(loss) due to translation of the accounts of foreign companies 11 (19.497) 3.268
Profit/(loss) on exchange rate adjustments for financial assets available
for sale11 5.205 (19)
of which tax effect (63)
Reserve for exchange rate adjustment 11 (12.790) 3.886
of which tax effect 4.011 (1.337)
Total other components of the statement of comprehensive income
which will be restated under profit/(loss) for the year (28.002) 7.199
Total net profit/(loss) for the period 32.078 53.045
Attributable to:
Parent company shareholders 32.078 53.045
Minority interests 0 0
CONSOLIDATED STATEMENT OF COMPREHENSIVE INCOME
24

(Euro/000)Note 31.12.2017 31.12.2016
Pre-tax profit 75.454 66.892
Depreciation of tangible assets and write-downs 1, 2 10.273 9.363
Amortisation of intangible assets and write-downs 1, 2 9.223 9.779
Capital losses from sale of assets 18 101 5
Capital gains from sale of assets 19 (8) (135)
Change in provisions for risks and charges (*) 15 (388) (2.675)
Effect of change in provisions for risks and charges 1.304 (374)
Change in employee benefits reserve 14 (14) (167)
Bad debt provisions 18 40 762
Net financial expenses including exchange rate differences 20 5.427 3.997
Net financial income including exchange rate differences 20 (1.097) (942)
Foreign exchange differences 20 3.010 (20)
Adjustments to value of financial assets 3 85 318
Cash flow generated (absorbed) from operations before changes in working
capital103.410 86.803
Change in trade receivables (including provision) (*) 7 (6.938) (7.474)
Change in final inventories (*) 8 (2.047) (12.867)
Change in current assets (*) 7 (3.590) (2.469)
Change in other medium-/long-term assets 7 200 (465)
Change in trade payables (*) 16 2.330 2.874
Change in other current liabilities (*) 16 3.273 4.802
Other medium/long-term liabilities 16 (728) 745
Commercial foreign exchange differences 20 3.242 (2.755)
Foreign exchange effect of working capital (1.216) 677
Cash flow generated (absorbed) from operations after changes in working capital 97.936 69.871
Change in tax (17.316) (12.399)
Foreign exchange effect of tax (3.746) 1.208
Interest paid and banking expenses 20 (4.330) (3.055)
Cash flow generated (absorbed) from operations (A) 72.544 55.625
Increase in intangible assets excluding exchange rate effect 2 (4.358) (3.933)
Decrease in intangible assets excluding exchange rate effect 2 245 208
Increase in tangible assets excluding exchange rate effect 1 (11.270) (12.899)
Decrease in tangible assets excluding exchange rate effect 1 978 238
Change in unconsolidated equity investments 5 417 (639)
Acquisition of an equity investment (5.434)
Cash flow generated (absorbed) from investments (B) (19.422) (17.025)
Change in LT/ST financial receivables 5 (401) 115
Change in short-term and medium-/long-term financial debt (*) 12, 6 80.048 (3.982)
Financial foreign exchange differences 20 (6.252) 2.775
Purchase/sale of treasury shares (*) 11 0 (368)
Change in reserves Exchange rate effect of financial assets/liabilities, equity and tangible
and intangible assets (*)11, 1, 2 317 45
Dividend payment 11 (17.443) (14.543)
Cash flow generated (absorbed) by financial activity (C) 56.269 (18.003)
Net increase (decrease) in available cash (A+B+C) (*) 10 109.391 20.597
Net cash and cash equivalents at beginning of period 10 146.718 126.121
Net cash and cash equivalents at end of period 10 256.109 146.718
(*) For 2017, these items are net of the balances from the acquisition of Soredi Touch Systems GmbH, that were reported under
item "Acquisition of an equity investment"
CONSOLIDATED STATEMENT OF CASH FLOW
25

STATEMENT OF SHAREHOLDERS' EQUITY (Note 11)
Description
Share
capital
Treasury
shares
Total share
capital and
capital reserves
Cash-flow
hedge
reserve
Translation
reserve
Reserve for
exchange rate
adjustment
Actuarial
gains/(losses)
reserve
Held-for-sale
financial assets
reserve
Total Reserves of
Statement of
Comprehensive
Income
Earnings
carried
forward
Capital
contribution
reserve
Legal
reserve
IAS
reserve
Total Profit for the
year
Total Group
shareholders’
equity
01.01.2016 30.392 116.267 146.659 (92) 22.168 13.404 (371) 509 35.618 59.878 958 5.917 8.683 75.436 40.547 298.260
Allocation of earnings 0 0 40.386 161 40.547 (40.547) 0
Dividends 0 0 (14.543) (14.543) (14.543)
Translation reserve 0 0 0 0
Change in IAS reserve 0 0 0 0
Sale/purchase of treasury
shares(368) (368) 0 0 (368)
Other changes 0 0 0
Profit/(loss) as at 31.12.2016 0 0 0 45.846 45.846Total other components of the
statement of comprehensive
income
64 3.268 3.886 (19) 7.199 0 7.199
31.12.2016 30.392 115.899 146.291 (28) 25.436 17.290 (371) 490 42.817 85.721 958 6.078 8.683 101.440 45.846 336.394
Description
Share
capital
Treasury
shares
Total share
capital and
capital reserves
Cash-flow
hedge
reserve
Translation
reserve
Reserve for
exchange rate
adjustment
Actuarial
gains/(losses)
reserve
Held-for-sale
financial assets
reserve
Total Reserves of
Statement of
Comprehensive
Income
Earnings
carried
forward
Capital
contribution
reserve
Legal
reserve
IAS
reserve
Total Profit for the
year
Total Group
shareholders’
equity
01.01.2017 30.392 115.899 146.291 (28) 25.436 17.290 (371) 490 42.817 85.721 958 6.078 8.683 101.440 45.846 336.394
Allocation of earnings 0 0 45.846 45.846 (45.846) 0
Dividends 0 (17.443) (17.443) (17.443)
Translation reserve 0 0 0 0
Change in IAS reserve 0 0 0 0
Sale/purchase of treasury
shares2.000 2.000 0 0 2.000
Other changes 0 65 (65) 0 0
Profit/(loss) as at 31.12.2017 0 0 0 60.080 60.080
Total other components of the
statement of comprehensive
income
(920) (19.497) (12.790) 5.205 (28.002) 0 (28.002)
31.12.2017 30.392 117.899 148.291 (948) 5.939 4.500 (371) 5.695 14.815 114.189 958 6.078 8.618 129.843 60.080 353.029
Share capital and capital reserves Reserves of Statement of Comprehensive Income Profits for prior periods
Share capital and capital reserves Reserves of Statement of Comprehensive Income Profits for prior periods
26

Datalogic Group
Consolidated Financial Statements as at 31.12.2017 - Explanatory Notes 27
EXPLANATORY NOTES TO THE CONSOLIDATED FINANCIAL STATEMENTS
INTRODUCTION
Datalogic is the world leader in the markets of automatic data capture and process automation. The Group is
specialised in the manufacture of fixed bar code readers, mobile computers, RFID-Radiofrequency,
identification technology, detection, measurement and security sensors, vision and laser marking systems.
Its pioneering solutions contribute to increase efficiency and quality of processes along the entire value
chain, in the Retail, Transportation & Logistics, Manufacturing and Healthcare sectors.
Datalogic S.p.A. (hereinafter “Datalogic”, the “Parent Company” or the “Company”) is a joint-stock company
listed on the STAR segment of Borsa Italiana, with its registered office in Italy. The address of the registered
office is Via Candini, 2 - Lippo di Calderara (Bologna).
The Company is a subsidiary of Hydra S.p.A., which is also based in Bologna and is controlled by the Volta
family.
These Consolidated Financial Statements as at 31 December 2017 include the figures of the Parent
Company and its subsidiaries (defined hereinafter as the “Group”) and its minority interests in associates.
The publication of the Financial Statements ended 31 December 2017 of the Datalogic Group was
authorised by resolution of the Board of Directors dated 20 March 2018.
PRESENTATION AND CONTENT OF THE CONSOLIDATED FINANCIAL STATEMENTS
Pursuant to the European Regulation 1606/2002, the Company’s financial statements were prepared in
compliance with the international accounting standards (IAS/IFRS) issued by the IASB (International
Accounting Standards Board) and endorsed by the European Union, pursuant to European Regulation
1725/2003 and subsequent amendments, with all the interpretations of the International Financial Reporting
Interpretations Committee (“IFRS-IC”), formerly the Standing Interpretations Committee (“SIC”), endorsed by
the European Commission at the date of approval of the draft financial statements by the Board of Directors
and contained in the related EU Regulations published at this date, and in compliance with the provisions of
CONSOB Regulation 11971 of 14 May 1999 and subsequent amendments.
The Consolidated Financial Statements for the year ended 31 December 2017 consist of Statement of
Financial Position, Income Statement, Statement of Comprehensive Income, Statement of Changes in
Shareholders’ Equity, Cash Flow Statement and Explanatory Notes.
The Consolidated Financial Statements were prepared based on the draft Financial Statements as at 31
December 2017, prepared by the Boards of Directors or, if available, based on the financial statements

Datalogic Group
Consolidated Financial Statements as at 31.12.2017 - Explanatory Notes 28
approved by the Shareholders’ Meetings of the related consolidated companies, duly adjusted, if applicable,
to align them to the classification and accounting criteria adopted by the Group.
The Consolidated Financial Statements were prepared in compliance with the general criterion of a reliable
and true vision of the Group’s financial position, financial performance and cash flows, on an ongoing
concern and on an accrual basis, in compliance with the general principles of consistency of presentation,
relevance and aggregation, no offsetting and comparability of information.
As regards the presentation of the Financial Statements, the Group made the following choices:
- non-current assets, as well as current and non-current liabilities are disclosed separately in the
Statement of Financial Position. Current assets, which include cash and cash equivalents, are those
set to be realised, sold or used during the Group’s normal operational cycle; current liabilities are
those whose extinction is envisaged during the Group’s normal operating cycle or in the 12 months
after the reporting date;
- with regard to the Income Statement, cost and revenue items are disclosed based on grouping by
function, as this classification was deemed more meaningful for comprehension of the Group’s
business result;
- the Statement of Comprehensive Income presents the components that determine gain/(loss) for the
period, taking account of costs and revenues reported directly under Shareholders' Equity;
- the Cash Flow Statement is formed using the indirect method.
The Statement of Changes in Shareholders’ Equity analytically details the changes occurring in the financial
year and in the previous financial year.
In preparing the Consolidated Financial Statements, the historic cost principle has been adopted for all
assets and liabilities except for some tangible assets in the “Land and buildings” category which were
revalued on transition to IFRS, as described later in this document, and some financial assets available for
sale (AFS) for which the fair value principle is applied.
Preparation of IFRS-compliant financial statements requires the use of some estimates. Reference is made
to the section describing the main estimates made in this set of consolidated financial statements.
The Accounting Standards were uniformly applied to all Group companies and for all periods presented.
These Financial Statements are drawn up in thousands of euro, which is the Group’s “functional” and
“presentation” currency as envisaged by IAS 21.

Datalogic Group
Consolidated Financial Statements as at 31.12.2017 - Explanatory Notes 29
CONSOLIDATION STANDARDS AND POLICIES
Subsidiaries
The control is obtained when the Group, as defined in IFRS 10, is exposed, or has rights, to variable returns
from its involvement with the investee and, at the same time, has the ability to affect those returns through its
power over the investee.
Specifically, the Group controls an investee if, and only if, the Group has:
- power over the investee (i.e. the investor has existing rights that give it the ability to direct the
investee’s relevant activities);
- exposure, or rights, to variable returns from its involvement with the investee;
- the ability to use its power over the investee to affect the amount of the investor’s returns.
In general, it is assumed that the majority of votes entails a control. To support this assumption, and when
the Group holds less than the majority of votes (or similar rights), the Group considers all relevant facts and
circumstances in order to define whether it controls the investees, including:
- agreements with holders of other voting rights;
- rights resulting from agreements;
- voting rights and potential voting rights of the Group.
The Group reconsiders whether it has the control on an investee if the facts and circumstances show that
changes occurred in one or more of the three elements used for the definition of control. An investee is
consolidated when the Group obtains its control and the consolidation ends when the Group loses control.
Assets, liabilities, revenues and costs of the investee, which is acquired or sold during the year, are included
in the Consolidated Financial Statements at the date in which the Group obtains the control until the date in
which the Group no longer exercises control on the entity.
In order to ensure consistency with the Group accounting policies, when necessary the financial statements
of the investees are adequately adjusted. All assets and liabilities, Shareholders’ Equity, revenues, costs and
intercompany cash flows related to transactions between Group entities are entirely derecognised when
consolidated.
Changes in equity investments in an investee that do not entail the loss of control are recognised in
Shareholders’ Equity.
If the Group loses control in an investee, all related assets (including goodwill), liabilities, minority interests
and other components in the Shareholders’ Equity must be derecognised, while any possible profit or loss
will be recognised in the Income Statement. The equity interest possibly maintained must be recognised at
fair value.
Reciprocal payables and receivables and cost and revenue transactions between consolidated companies
and the effects of all significant transactions between them have been eliminated.
More specifically, profits not yet realised with third parties, stemming from infragroup transactions and those
included, as of the reporting date, in the measurement of inventories have been eliminated where they exist.

Datalogic Group
Consolidated Financial Statements as at 31.12.2017 - Explanatory Notes 30
Business Combinations
Business combinations are accounted for by using the acquisition method. The cost of an acquisition is
measured as the sum of the consideration transferred, measured at fair value on the acquisition date and the
amount of minority interests in the acquired company. For all business combinations, the Group assesses
whether to measure the minority interests in the acquired company at fair value or as a proportion of the
minority shareholdings in the net identifiable assets of the acquired company. The acquisition costs are
written off in the year and recognised under administrative expenses.
When the Group acquires a business, it classifies or designates the financial assets acquired or the financial
liabilities assumed according to the terms of the contract, the economic terms and conditions in the other
pertinent conditions as at the acquisition date. This includes the verification of whether an incorporated
derivative must be separated from the primary contract.
If the business combination is carried out in more than one step, the equity investment previously held is
recalculated at fair value at the acquisition date and any resulting profit or loss is recognised in the Income
Statement.
Any contingent consideration, to be recognised, is measured by the purchaser at fair value on the acquisition
date. The change in fair value of the potential amount stated as asset or liability, as financial instrument
under the scope of IAS 39 Financial instruments: Recognition and Measurement, must be recognised in the
Income Statement.
Goodwill is initially measured at cost, which is the surplus of the consideration paid, as compared to the net
identifiable assets acquired and the liabilities undertaken by the Group. If the fair value of the acquired net
assets exceeds the aggregate amount paid, the Group assesses whether all assets acquired and liabilities
undertaken have been correctly identified and then reviews the procedures used to determine the amounts
to be recognised at the acquisition date. If the new measurement highlights a fair value of net assets
acquired, which is higher than the amount paid, the difference (profit) is recognised in the Income Statement.
After initial recognition, goodwill is measured at cost, less any cumulative impairment losses. In impairment
testing, goodwill acquired in a business combination is allocated, since the acquisition date, to each Group
CGU, which is expected will benefit from synergies of the business combination, regardless of the fact that
other assets or liabilities related to the acquired entity are allocated to those CGUs.
Associates
Associates are companies in which the Group has significant influence but does not exercise control over
operations. Significant influence is presumed to exist when the Group holds 20 to 50 percent of voting rights.
In the absence of this assumption, the Group assesses specific facts and circumstances to check the
presence of significant influence.
Under the equity method, the equity investment in an associate is initially recognised at cost and the carrying
value is increased or decreased to recognise the portion of the profits or losses of the investee that are
realised after the acquisition. The goodwill concerning the associate is included in the carrying value of the
investment and is not subject to amortisation, nor to an individual impairment test.
The Group’s share of associates’ post-acquisition profits or losses is recognised in the Income Statement,
whereas its post-acquisition share of changes in reserves is recognised in reserves. Cumulative post-
acquisition changes are included in the investment’s carrying value.
Unrealised profits relating to transactions between the Group and its associates are eliminated in proportion
to the Group’s interests in such associates. Unrealised losses are also eliminated unless the loss is
considered to represent impairment of the assets transferred. Accounting standards adopted by associates
have been modified when necessary to ensure consistency with the policies adopted by the Group.

Datalogic Group
Consolidated Financial Statements as at 31.12.2017 - Explanatory Notes 31
Upon losing significant influence over an associate, the Group measures and recognises the residual equity
investments at fair value. Any difference between the carrying value of the equity investments on the date
that significant influence is lost, as well as the fair value of the residual equity investments and the
consideration received must be recognised in the Income Statement.
Translation criteria of items in foreign currency Translation of financial statements of foreign companies
The Financial Statements of the Group companies, included in the consolidated financial statements, are
expressed by using the currency of the primary market in which they operate (functional currency). The
Group Consolidated Financial Statements are presented in euro, the euro being the Parent Company’s
functional currency. At the reporting date for the year, assets and liabilities of subsidiaries, associates and
joint ventures, with a functional currency other than the Euro, are translated in the currency used to draw up
the Group consolidated accounts, at the exchange rate effective at that date. The items in the Income
Statement ware translated at the average exchange rate for the year (as it is deemed representative of the
average of the main exchange rates at the dates of each single translation). The differences resulting from
the adjustment of the initial Shareholders’ Equity at year-end current exchange rates and the differences
resulting from the different method used for the translation of the result for the year are accounted for in a
special item in the Shareholders’ Equity. In the event of subsequent disposal of consolidated foreign
companies, the cumulated value of the related translation differences is recognised in the Income Statement.
The exchange rates recorded by the Italian Foreign Exchange Bureau and used for translation into euro of
the foreign companies’ financial statements are as follows:
Currency (ISO Code) Quantity of currency/1 euro
2017 2017 2016 2016
Final exchange
rate Average
exchange rate Final exchange
rate Average
exchange rate
US Dollar (USD) 1.1993 1.1297 1.0541 1.1069
British Pound Sterling (GBP) 0.8872 0.8767 0.8562 0.8195
Swedish Krona (SEK) 9.8438 9.6351 9.5525 9.4689
Singapore Dollar (SGD) 1.6024 1.5588 1.5234 1.5275
Japanese Yen (JPY) 135.0100 126.7112 123.4000 120.1967
Australian Dollar (AUD) 1.5346 1.4732 1.4596 1.4883
Hong Kong Dollar (HKD) 9.3720 8.8045 8.1751 8.5922
Chinese Renminbi (CNY) 7.8044 7.6290 7.3202 7.3522
Real (BRL) 3.9729 3.6054 3.4305 3.8561
Mexican Pesos (MXN) 23.6612 21.3286 21.7719 20.6673
Hungarian Forint (HUF) 310.3300 309.1933 309.8300 311.4379

Datalogic Group
Consolidated Financial Statements as at 31.12.2017 - Explanatory Notes 32
ACCOUNTING POLICIES AND STANDARDS APPLIED
The accounting criteria used to prepare the Group’s Consolidated Financial Statements for the year ended
31 December 2017 are described below. The accounting standards described have been consistently
applied by all Group entities.
Property, plant and equipment
Owned tangible assets are initially recognised at the cost of contribution, purchase, or in-house construction.
The cost comprises all directly attributable costs necessary to make the asset available for use (including,
when significant and in the presence of effective obligations, the present value of the estimated costs for
decommissioning and removal of the asset and for reinstatement of the location), net of trade discounts and
allowances.
Some tangible assets in the “Land and buildings” categories, in line with IAS 16 provisions, were measured
at fair value (market value) as at 01 January 2004 (IFRS transition date) and this value was used as the
deemed cost. Fair Value was calculated based on evaluation expertises performed by independent external
consultants. Buildings are depreciated net of the residual value estimated as the realisation value obtainable
via disposal at the end of the building’s useful life.
Costs incurred after purchase are recognised in the asset’s carrying value, or are recognised as a separate
asset, only if it is thought likely that the future economic benefits associated with the asset will be enjoyed
and the asset’s cost can be reliably measured. Maintenance and repair costs or replacement costs that do
not have the above characteristics are recognised in the Income Statement in the year in which they are
borne.
Tangible assets are depreciated on a straight-line basis each year - starting from the time when the asset is
available for use, or when it is potentially able to provide the economic benefits associated with it - according
to economic/technical rates determined according to assets’ residual possibility of use and taking into
account the month when they became available for use in the first year of utilisation.
Land is considered to be an asset with an indefinite life and therefore not subject to depreciation.

Datalogic Group
Consolidated Financial Statements as at 31.12.2017 - Explanatory Notes 33
The depreciation rates applied by the Group are as follows:
Asset category Annual depreciation rates
Property: Buildings 2% - 3.3%
Land 0%
Plant and equipment: Automatic operating machines 20% - 14.29%
Furnaces and appurtenances 14%
Generic/specific production plant 20% - 10%
Other assets: Plant pertaining to buildings 8.33% - 10% - 6.67%
Lightweight constructions 6.67% - 4%
Production equipment & electronic instruments 20% - 10%
Moulds 20%
Electronic office machinery 33% - 20% - 10%
Office furniture and fittings 10% - 6.67% - 5%
Cars 25%
Freight vehicles 14%
Trade show & exhibition equipment 11% - 20%
Improvements to third-party assets Contract duration
If, regardless of the depreciation already posted, enduring impairment of value emerges, the asset is written
down; if the reasons for devaluation no longer exist in later years, the original value is reinstated. The
residual value and useful life of assets are renewed at least at each year-end in order to assess any
significant changes in value.
Gains and losses on disposals are calculated by comparing the selling price with net carrying value. The
amount thus determined is recognised in the income statement.
Assets held under finance lease contracts
The fixed assets under financial leases are those fixed assets for which the Group has assumed all the
risks and benefits connected with the ownership of the asset. Such assets are measured at the lower of fair
value and present value of lease instalments at the time of contract signature, net of cumulative depreciation
and write-downs. Financial lease instalments are recorded as described in IAS 17; specifically, each
instalment is divided into principal and interest. The sum of the portions of principal payable at the reporting
date is recorded as a financial liability; the portions of interest are recorded in the income statement each
year until full repayment of the liability.
Intangible assets
Intangible assets are recognised under assets in the Statement of Financial Position when it is likely that use
of the asset will generate future economic benefits and when the asset’s costs can be reliably calculated.
They are initially recognised at the value of contribution or at acquisition or production cost, inclusive of any
ancillary costs.
Gains and losses on disposals are calculated by comparing the selling price with net carrying value. The
amount thus determined is recognised in the Income Statement.
Goodwill

Datalogic Group
Consolidated Financial Statements as at 31.12.2017 - Explanatory Notes 34
Goodwill is initially valued at cost, which is the surplus between the cost of the business combination and the
portion pertaining to the Group in the net identifiable assets acquired and the liabilities undertaken by the
Group, according to the partial goodwill approach. If the consideration is less than the fair value of the net
assets of the acquired subsidiary, the difference is recognised in the Income Statement. It is an intangible
asset with an indefinite life.
After initial recognition, goodwill is measured at cost less any cumulative impairment losses.
Goodwill is allocated to the cash generating units (CGUs) and is tested for impairment annually or more
frequently, if events or changes in circumstances suggest possible loss of value, pursuant to IAS 36 –
“Impairment of Assets”.
If the goodwill has been allocated to a cash generating unit (CGU) and the entity disposes of part of this unit,
the goodwill associated with the sold unit must be included in the carrying value of the asset when the profit
or loss on disposal is determined. The goodwill associated with the disposed asset must be determined on
the basis of the values relating to the disposed asset and the part of the CGU that was maintained. The
same criterion of related values is applied also when the format of the internal reporting is changed and
affects the composition of the Cash Generating Units that received the goodwill, in order to define its new
allocation.
Research and development expenses
As required by IAS 38, research costs are entered in the Income Statement at the time when the costs are
incurred.
Development costs for projects concerning significantly innovative products or processes are capitalised only
if it is possible to demonstrate:
• the technical possibility of completing the intangible asset in such a way as to make it available for use or
sale;
• the intention of completing the intangible assets for use or sale;
• the ability to use or sell the intangible asset;
• the ability to reliably measure the cost attributable to the intangible asset during its development;
• the availability of adequate technical, financial or other resources to complete the intangible asset’s
development and for its use or sale;
• how the intangible asset will generate probable future economic benefits.
In the absence of any one of the above requirements, the costs in question are fully recognised in the
Income Statement at the time when they are borne.
Development costs have a finite useful life and are capitalised and amortised on a straight-line basis from
the start of the product’s commercial production for a period equal to the useful life of the products to which
they relate, generally estimated to be five years.
Other intangible assets
Other intangible assets consist of:
• software acquired under licence, valued at purchase cost;
• specific intangible assets purchased as part of acquisitions that have been identified and recognised at
fair value at acquisition date according to the purchase method of accounting mentioned above.
These assets are considered to be intangible assets of finite duration and are amortised over their
presumable useful life (see the next table).

Datalogic Group
Consolidated Financial Statements as at 31.12.2017 - Explanatory Notes 35
Amortisation
Intangible assets of finite duration are systematically amortised according to their projected future
usefulness, so that the net value at the reporting date corresponds to their residual usefulness or to the
amount recoverable according to corporate business plans. Amortisation starts when the asset is available
for use.
The useful life for each category is detailed below:
DESCRIPTION Useful Life - years
Goodwill Indefinite useful life
Development costs 5
Other intangible assets:
- Software licences (other than SAP licences) 3/5
- Patents (formerly PSC) 20
- Patents (Evolution Robotics Retail Inc.) 10
- “Trade Secret” (Evolution Robotics Retail Inc.) 10
- Patents (former Accu Sort inc) 10
- “Trade Secret” (former Accu Sort inc) 10
- SAP licences 10
- User licences Contract duration
Intangible assets with an indefinite useful life are not amortised but tested to identify any impairment of value
annually, or more frequently when there is evidence that the asset may have suffered impairment. The
residual values, the useful lives and the amortisation of intangible assets are reviewed at each year end and,
when required, corrected prospectively. The useful lives remained unchanged compared to the previous
year.
Impairment
Tangible and intangible assets are tested for impairment in the presence of specific indicators of loss of
value, and at least annually for intangible assets with an indefinite life and goodwill.
The aim of this impairment test is to ensure that tangible and intangible assets are not carried at a value
exceeding their recoverable value, consisting of the higher between their fair value and selling costs and
their value in use.
Value in use is calculated based on the future cash flows that are expected to originate from the asset or
CGU (cash generating unit) to which the asset belongs. Cash flows are discounted to present value using a
discount rate reflecting the market’s current estimate of the time value of money and of the risks specific to
the asset or CGU to which presumable realisation value refers.
If the recoverable value of the asset or CGU, to which it belongs, is less than the net carrying value, the
asset in question is written down to reflect its impairment, with recognition of the latter in the Income
Statement for the period.
Impairment losses relating to CGUs are allocated firstly to goodwill and, for the remaining amount, to the
other assets on a proportional basis.

Datalogic Group
Consolidated Financial Statements as at 31.12.2017 - Explanatory Notes 36
If the reasons causing it cease to exist, impairment is reversed within the limits of the amount of what would
have been the book value, net of amortisation of the historical cost, if no impairment had been recognised.
Any reinstatements of value are recognised in the Income Statement. The value of goodwill, previously
impaired, cannot be recovered, as envisaged by the International Accounting Standards.
Financial assets and liabilities
The Group measures at fair value all financial instruments such as derivatives at each annual reporting date.
Fair value is the price that would be received for the sale of an asset or that would be paid for transfer of a
liability in a normal transaction between market operators at the date of measurement.
A measurement of fair value assumes that the sale of the asset or transfer of the liability takes place:
• in the main market of the asset or liability; or
• when there is no main market, in the market most advantageous for the asset or liability.
The main market or most advantageous market must be accessible for the Group. The fair value of an asset
or liability is measured by adopting the assumptions that the market operators would use in determining the
price of the asset or liability, presuming that they act to meet their economic interest in the best way.
Measurement of the fair value of a non-financial asset considers the capability of a market operator to
generate economic benefits by using the asset in its maximum and best use or by selling it to another market
operator that would use it in its maximum and best use.
The Group uses measurement methods that are appropriate for the situation, and for which data available to
measure fair value are sufficient, while maximising the use of relevant inputs observable and limiting the use
of non-observable inputs. All assets and liabilities measured or recognised at fair value are classified based
on a fair value hierarchy and described hereunder:
Level 1 - listed prices (not adjusted) in active markets for identical assets or liabilities the entity of
which is identifiable at the measurement date;
Level 2 - input data other than listed prices included in Level 1 which can be observed, either directly
or indirectly for the asset or liability to be measured;
Level 3 - the valuation techniques for which input data cannot be observed for the asset or liability to
be measured.
The fair value measurement is classified at the same fair value hierarchy level in which the lowest hierarchy
input used for the measurement is stated.
As regards assets and liabilities that are recognised in the financial statements at fair value on a recurring
basis, the Group determines whether transfers between hierarchy level occurred while revising the
classification (based in lower level inputs, which is significant for the purposes of a thorough fair value
measurement) at each annual reporting date.
Financial instruments
A financial instrument is any contract generating a financial asset for an entity and a financial liability or an
equity instrument for another entity.
Financial assets
The financial assets are initially recognised at their fair value, increasing their ancillary charges. At their first

Datalogic Group
Consolidated Financial Statements as at 31.12.2017 - Explanatory Notes 37
recognition, the financial assets are classified as follows, as the case may be:
Financial assets at fair value with contra entry in the Income Statement: these are financial
assets acquired primarily with the intention of making a profit from short-term price fluctuations and
designated as such from the outset; they are recognised at fair value and any changes during the
period are recognised in the Income Statement.
Loans and receivables: they are financial assets other than derivatives with a fixed or calculable
payment flow and which are not listed in an active market. They are recognised according to the
amortised cost criterion using the effective interest rate method, less impairment. The amortised cost
is calculated by recognising any discounts, premiums on the purchase, fees or costs that form an
integral part of the effective interest rate. The effective interest rate is recognised as financial income
in the Income Statement. Write downs arising from impairment are recognised as financial expenses
in the Income Statement. This category usually includes trade receivables and other receivables. As
regards the financial assets accounted for at amortised cost, the Group has initially assessed
whether there was an impairment on each significant financial asset, and collectively on financial
assets of irrelevant amount. The carrying value of assets is reduced through the accounting of a
provision for write-downs and the amount of the loss is recognised in the Income Statement. The
loans and related provisions for write-downs are reversed when the possibility of a future recovery is
not realistic and guarantees have been put in place or transferred to the Group. If, in a subsequent
year, the amount of estimated impairment increases or decreases due to an event occurred after the
recognition of the impairment, the latter will be increased or reduced through an adjustment of the
provision. They are recognised under Current Assets, except for the portion with a maturity term over
12 months, which is classified under non-current assets.
Available for sale receivables and financial assets: these are financial assets other than
derivatives, which are not classified in other categories; they are valued at fair value and related
changes are entered in an equity reserve. They are classified under non-current assets, unless they
are intended to be sold within 12 months.
Financial assets are derecognised from the financial statements when the right to receive cash no longer
exists, the Group has transferred the right to receive cash flows from the asset or has assumed the
contractual obligation to pay them to a third party in their entirety and without delay and (1) has transferred
essentially all the risks and benefits of ownership of the financial asset or (2) has not transferred or
essentially held all the risks and benefits of the asset, but has transferred control of the asset.
In the cases in which the Group has transferred the rights to receive cash flows from an asset or has signed
an agreement based on which it retains the contractual rights to receive the cash flows of the financial asset,
but takes on a contractual obligation to pay the cash flows to one or more beneficiaries (pass-through), it
assesses whether and to what extent it has retained the risks and benefits pertaining to the ownership.
Equity investments in other companies are measured at fair value. When the fair value cannot be reliably
determined, equity investments are measured at cost, adjusted for impairment.
Financial liabilities
Financial liabilities are classified at the time of initial recognition as financial liabilities at fair value recorded in
the Income Statement, amongst the mortgages and loans or amongst the derivatives designated as hedging
instruments.

Datalogic Group
Consolidated Financial Statements as at 31.12.2017 - Explanatory Notes 38
All financial liabilities are initially recognised at fair value, added to which - as in the case of mortgages, loans
and payables - transaction costs directly attributable to them. The Group’s financial liabilities include trade
payables and other payables, mortgages and loans, including current account overdrafts, guarantees
granted and derivative financial instruments.
Loans and payables (the most significant category for the Group) are measured with the amortised cost
criterion using the effective interest rate method. Profits and losses are booked in the Income Statement
when the liability is settled, as well as through the amortisation process.
The amortised cost is calculated by recognising the rebates or premiums on the purchase and the fees or
costs that are an integral part of the effective interest rate. Amortisation at the actual interest rate is included
amongst financial expenses in the Income Statement.
Financial guarantees given are agreements envisaging a payment to repay the owner of a debt security
against a loss incurred due to a non-payment by the debtor at the contract maturity term. If the financial
guarantees are issued by the Group, they are initially recognised as liabilities at fair value, added by
transaction costs that are directly attributable to the issue of the guarantee itself. The liability is then
measured at the higher between the best estimated disbursement, required to fulfil the guaranteed obligation
at the reporting date, and the initially recognised amount, less accumulated amortisation.
A financial liability is written off when the obligation underlying the liability has been extinguished, annulled or
fulfilled. If an existing financial liability is replaced by another one from the same lender, under conditions that
are essentially different, or if the terms and conditions of an existing liability are essentially amended, this
change or amendment will be treated as a reversal of the original liability or the recognition of a new liability,
with recognition in the Income Statement of any differences involving the carrying values.
Offsetting financial instruments
A financial asset and liability can be offset and the net balance can be shown on the Statement of Financial
Position if there is a current legal right to offset the amounts recognised and there is the intention to settle
the net remainder, or realise the asset and at the same time settle the liability.
Loans, payables and other financial and/or liabilities, with fixed or calculable maturity term, are initially
recognised at their fair value, less debt issuance costs. The measurement criterion after initial recognition is
the amortised cost criterion using the effective interest rate.
Long-term payables, for which an interest rate is not provided, are accounted for through the discounting of
future cash flows at market rate if the increase of payables is due to the elapse of time, with following
recognition of interest in the Income Statement, under item “Net financial income (charges)”. A financial
liability is written off when the obligation underlying the liability has been extinguished, annulled or fulfilled.
Financial derivatives
Derivative instruments, including embedded derivatives, object matter of a separate agreement, are initially
recognised at fair value.
Derivatives are classified as hedging instruments when the relation between derivatives and the object
matter of the hedging is formally documented and the effectiveness of the hedging, which is periodically
checked, is high.
When the hedging derivatives hedge the risk of changes in fair value of the hedged instruments, they are
recognised at fair value, and the effects are charged to the Income Statement. Accordingly, the hedged
instruments are adjusted to reflect the changes in fair value, associated to the hedged risk.
In the event of cash flow hedges, the derivatives are designated as a hedge for exposure to variable of cash
flows attributable to risks that might subsequently affect the Income Statement. These risks are generally
associated with an asset or liability recognised in the Financial Statements (as future payments on variable

Datalogic Group
Consolidated Financial Statements as at 31.12.2017 - Explanatory Notes 39
rate payables).
The effective portion of fair value change, related to the portion of derivative contracts designated as hedge
derivatives pursuant to IAS 39, is recognised as component of the Statement of Comprehensive Income
(Hedging reserve). This reserve is then charged to the profit for the year in the period in which the hedged
transaction affects the Income Statement.
The ineffective portion of fair value change, as well as the entire fair value change in derivatives that have
not been designated as hedge derivatives or that do not have the requirements envisaged in the aforesaid
IAS 39, is instead recognised directly in the Income Statement.
Inventories
Inventories are measured at the lower of cost and net realisable value. Cost is calculated using the weighted
average cost method. Finished product, semi-finished product and raw material costs include the cost of raw
materials, direct labour, and other production costs that are directly and indirectly allocable (in this case on
the basis of normal production capacity). As regards raw and ancillary materials and consumables, the
estimated net realisable value is the replacement cost. As regards finished and semi-finished products, the
estimated net realisable value is the sales price estimated at arm’s length, less the estimated completion and
sales costs.
Obsolete and slow turnover inventories are written-down based on their estimated possible use or future
sale, through their entry in a special provision, adjusted by the value of inventories.
Non-current Assets Held for Sale and Discontinued Operations
The Group classifies discontinued non-current assets as held for sale if their carrying value will be recovered
mainly with a sale, instead than through their continuous use. These discontinued non-current assets,
classified as held for sale, are measured at the lower of its carrying amount or fair value, less sales costs of
sale. Sales costs are any costs directly attributable to the sale, excluding financial charges and taxes.
The condition precedent to classify these assets as held for sale is deemed as fulfilled only when the sale is
highly probable and the activity, or the discontinued group of assets, is available for immediate sale in its
current conditions. The actions required for completing the sale should indicate that it is improbable
thatsignificant changes in the sale might occur or that the sale be cancelled. Management must be engaged
in the sale, whose completion should be planned within one year from the date of classification.
The depreciation of property, plant and machinery and amortisation of the intangible assets ceases when
they are classified as available for sale.
The assets and liabilities classified as held for sale are presented separately under the financial statement
items.
Assets to be discontinued are not included in the result of operational activities and are presented in the
profit/(loss) statement for the year on a single line as Net profit/(loss) coming from assets to be discontinued.
All the other explanatory notes include amounts concerning continuing operations, unless otherwise
specified.
Trade receivables
Trade receivables are amounts due from customers following the sale of products and services.
Receivables are initially recognised at fair value and subsequently at amortised cost – using the effective
interest rate method – net of related impairment losses. Short term payables are not discounted, since the
effect of discounting the cash flows is not significant.

Datalogic Group
Consolidated Financial Statements as at 31.12.2017 - Explanatory Notes 40
The estimated impairment of receivables is recognised when it becomes evident that the past-due receivable
cannot be recovered, due to financial difficulties of the customer that might lead to its bankruptcy or financial
restructuring.
Cash and cash equivalents
Cash and cash equivalents comprise cash on hand, bank and post office deposits, and short-term financial
investments (maturity of three months or less after purchase date) that are highly liquid, readily convertible
into cash and are subject to insignificant risk of changes in value.
Current-account overdrafts and advances on invoices subject to collection are deducted from cash only for
the purposes of the Cash Flow Statement.
Shareholders' Equity
Share capital consists of the ordinary shares outstanding, which are posted at par value.
Costs relating to the issue of new shares or options are classified in Shareholders’ Equity (net of associated
tax benefit relating to them) as a deduction from the proceeds of the issuance of such instruments.
Treasury shares
In the case of buyback of treasury shares, the price paid, inclusive of any directly attributable accessory
costs, is deducted from the Group’s Shareholders’ Equity until such shares are cancelled, re-issued, or sold.
When treasury shares are resold or re-issued, the proceeds, net of any directly attributable accessory costs
and related tax effect, are posted as Group Shareholders’ Equity.
Consequently, no profit or loss is entered in the consolidated Income Statement at the time of purchase, sale
or cancellation of treasury shares.
Liabilities for employee benefits
Post-employment benefits are calculated based on programmes that, depending on their characteristics, are
either “defined-contribution programmes” or “defined-benefit programmes”.
Employee benefits substantially consist of accrued provision for severance indemnities of the Group’s Italian
companies and of retirement provisions.
Defined contribution plans
Defined-contribution plans are formalised programmes of post-employment benefits according to which the
company makes payments to an insurance company or a pension fund and will have no legal or constructive
obligation to pay further contributions if, at maturity date, the fund has not sufficient assets to pay all benefits
for employees, in relation to the work carried out in current and previous years. These contributions, paid
against a work service rendered by employees, are accounted for as cost in the pertaining period.
Defined-benefit plans and other long-term benefits
Defined-benefit plans are programmes of post-employment benefits that represent a future obligation for the
Company. The entity bears actuarial and investment risks related to the scheme.
The Group uses the projected unit credit method to determine the current value of liabilities of the scheme
and the cost of services.

Datalogic Group
Consolidated Financial Statements as at 31.12.2017 - Explanatory Notes 41
This actuarial calculation method requires the use of objective actuarial hypotheses, compatible and based
on demographic variables (mortality rates, personnel turnover) and financial variables (discount rate, future
increases of salaries and wages and benefits). When a defined-benefit plan is entirely or partially financed by
contributions paid to a fund, legally separate from the company, or to an insurance company, the assets in
support of the above scheme are measured at fair value. The amount of the obligation is therefore
accounted for, less the fair value of assets in support of the scheme that the entity would pay to settle the
obligation itself.
The revaluations, including actuarial profits and losses, the changes in the maximum threshold of assets
(excluding net interest) and the yield of assets in support of the scheme (excluding net interests), are
recognised immediately in the Statement of Financial Position, while debiting or crediting retained earnings
through other components in the Statement of Comprehensive Income in the year in which they occur.
Revaluations are not reclassified in the Income Statement in subsequent years. The other long-term benefits
are intended for employees and differ from post-employment benefits. The accounting is similar to defined-
benefit plans.
Provisions for risks and charges
Provisions for risks and charges are set aside to cover liabilities whose amount or due date are uncertain
and that must be recognised in the Statement of Financial Position when the following conditions are
satisfied at the same time:
• the entity has a current obligation (legal or constructive), i.e. under way as at the reporting date, arising
from a past event;
• it is probable that economic resources will have to be used to fulfil the obligation;
• the amount needed to fulfil the obligation can be reliably estimated.
• risks, for which materialisation of a liability is only contingent, are disclosed in the notes to accounts, in
the section commenting on provisions, without provision being made.
In the case of events that are only remote, i.e. events that have very little likelihood of occurrence, no
provision made and no additional or supplementary disclosure is provided.
Provisions are recognised at the value representing the best estimate of the amount the entity would pay to
settle the obligation, or to transfer it to third parties, at the reporting date. If the time value of money is
material, provisions are calculated by discounting expected future cash flows at a pre-tax discount rate
reflecting the market’s current evaluation of the cost of money over time. When discounting to present value
is performed, the increase in the provision due to the passage of time is recognised as finance expense.
The funds are entered at the current value of expected financial resources, to be used in relation to the
obligation. When the Group deems that an allocation to the provisions for risks and charges will be partly or
fully redeemed, e.g in the event of risks covered by insurance policies, the indemnity is recognised
separately in the Assets if, and only if, it is certain. In this case, the cost of any allocation is disclosed in the
Income Statement, less the amount recognised as indemnity. The provisions are periodically updated to
reflect changes in cost estimates, realisation timing and any discounted value. Estimate reviews of
provisions are charged to the same item in the Income Statement that previously included the allocation and
in the Income Statement for the period in which the change occurred.
The Group established restructuring provisions if there exists an implicit restructuring obligation and a formal
plan for the restructuring that created in interested third parties the reasonable expectation that the company
will carry out the restructuring or because it has begun its realisation or because it has already
communicated its main aspects to interested third parties.

Datalogic Group
Consolidated Financial Statements as at 31.12.2017 - Explanatory Notes 42
Income taxes
Income taxes include current and deferred taxes. Income taxes are generally recognised in the income
statement, except when they relate to items entered directly in equity, in which case the tax effect is
recognised directly in equity.
Current income taxes are calculated by applying to taxable income the tax rate in force at the reporting date
and adjustments to taxes related to prior periods.
Deferred taxes are calculated using the liability method applied to temporary differences between the
amount of assets and liabilities in the Consolidated Financial Statements and the corresponding amounts
recognised for tax purposes, except as follows:
• deferred tax liabilities derive from the initial recognition of goodwill or an asset or liability in a transaction
that is not a business combination and, when the transaction itself occurs, does not affect the balance
sheet profits or the profits or losses calculated for tax purposes;
• the reversal of taxable temporary differences associated with equity investments in subsidiaries,
associates or joint ventures, may be controlled and will probably not occur in the foreseeable future.
Deferred tax assets are recognised for all deductible temporary differences and tax credits and losses and
can be brought forward, to the extent that the existence of adequate future taxable profits will exist against
which the usage of the deductible temporary differences and the tax credits and losses brought forward can
be used, except in cases where:
• the deferred tax assets connected to the deductible temporary differences arise from initial recognition of
an asset or liability in a transaction that is not a business combination and, at the time of the transaction
itself, does not affect the balance sheet result or the profit or loss for tax purposes;
• there are taxable temporary differences associated with equity investments in subsidiaries, associates
and joint ventures and deferred tax assets are recognised only to the extent that the deductible
temporary differences will be reversed in the foreseeable future and that there are adequate taxable
profits against which the temporary differences can be used.
Deferred taxes are calculated at the tax rate expected to be in force at the time when the asset is sold or the
liability is redeemed.
Deferred tax assets are recognised only if it is probable that sufficient taxable income will be generated in
subsequent years to realise them. The carrying amount of the deferred tax assets is reviewed every year
end and reduced to the extent it is no longer probable that sufficient taxable income, so as to permit whole or
partial use of this credit, will be available in the future. Deferred tax assets that are not recognised, are
reviewed at every reporting date and are recognised to the extent it becomes probable that the tax receipts
will suffice to consent recovery of these deferred tax assets.
The Parent Company Datalogic S.p.A. and numerous Italian subsidiaries fall within the scope of the
“domestic tax consolidation” of Hydra S.p.A. This permits the transfer of total net income or the tax loss of
individual participant companies to the Parent Company, which calculates a single taxable income for the
Group or a single tax loss carried forward, as the algebraic sum of the income and/or losses, and therefore
files a single tax liability or credit with the Tax Authorities.

Datalogic Group
Consolidated Financial Statements as at 31.12.2017 - Explanatory Notes 43
Trade and other payables
Trade and other payables are measured at cost, which represents their discharge value.
Short-term payables are not discounted, since the effect of discounting the cash flows is not significant.
Revenue recognition
Revenues are measured at fair value of the amount collected or collectable from the sale of goods or
rendering of services within the scope of the Company’s characteristic business activity. Revenues are
disclosed net of VAT, returns, discounts and reductions and after eliminating Group intercompany sales.
Sale of goods
Revenues from the sale of goods are recognised only when all the following conditions are met:
• most of the risks and rewards of ownership of the goods have been transferred to the buyer;
• effective control over the goods sold and continuing managerial involvement to the degree usually
associated with ownership have ceased;
• the amount of revenues can be reliably measured;
• it is probable that the economic benefits associated with the transaction will flow to the entity;
• the costs incurred or to be incurred in respect of the transaction can be reliably measured.
A multi-annual guarantee is given by the Group on repairs, in line with the segment practice. A liability for
possible claims covered by guarantee is recognised when the product is sold.
Rendering of services
Revenue arising from a transaction for the rendering of services is recognised only when the results of the
transaction can be reliably estimated, based on the stage of completion of the transaction at the reporting
date. The results of a transaction can be reliably measured when all the following conditions are met:
• the amount of revenues can be reliably measured;
• it is probable that the economic benefits of the transaction will flow to the entity;
• the stage of completion at the reporting date can be reliably measured;
• the costs incurred, or to be incurred, to complete the transaction can be reliably measured.
Revenue relating to dividends, interest and royalties is respectively recognised as follows:
• dividends, when the right is established to receive dividend payment (with a receivable recognised in the
statement of financial position when distribution is resolved);
• interest, with application of the effective interest rate method (IAS 39);
• royalties, on an accrual basis in accordance with the underlying contractual agreement.
Work in progress
A construction contract, as defined by IAS 11 (“Long-term construction contracts”), is a contract specifically
negotiated for the construction of an asset or a group of strictly linked or interrelated assets as regards their
design, technology and function or their final use. The costs of a construction contract are recognised in the
year in which they are borne. Revenues are recognised in proportion to the stage of completion of this
contract at balance-sheet date, when the result can be estimated reliably.
When the outcome of a contract cannot be estimated reliably, revenues should be recognised only to the
extent that contract costs incurred are expected to be recoverable. When total contract costs are likely to

Datalogic Group
Consolidated Financial Statements as at 31.12.2017 - Explanatory Notes 44
exceed the total contract revenues, the total expected loss should be recognised immediately as an
expense.
The contract revenues are recognised in proportion to the stage of completion of contract activity, based on
the cost-to-cost method, which provides for the proportion between contract costs incurred for the works
performed until the reference date and the total expected contract costs.
Disclosure of contract works in the statement of financial position is as follows:
The amount due from customers for contract works should be shown as an asset, under item trade
receivables and other short-term assets, when incurred costs, added with margins recognised (less
losses), exceed the advance payments received;
The amount due to customers for contract work should be shown as a liability, under item trade payables
and other short-term liabilities when advance payments received exceed costs incurred added with
margins recognised (less losses).
Government grants
Government grants are recognised - regardless of the existence of a formal grant resolution - when there is
reasonable certainty that the company will comply with any conditions attached to the grant and therefore
that the grant will be received.
Government grants receivable as compensation for costs already incurred or to provide immediate financial
support to the recipient company with no future related costs, are recognised as income in the period in
which they become receivable.
Rental and operating lease costs
Lease contracts in which the lessor substantially preserves all the risks and rewards of ownership are
classified as operating leases and related fees are charged to the income statement on a straight-line basis
according to the contract’s duration.
Dividends paid out
Dividends are recognised when shareholders have the right to receive payment. This normally corresponds
to the date of the annual General Shareholders’ Meeting that approves dividend distribution.
The dividends distributable to Group Shareholders are recognised as an equity movement in the year when
they are approved by the shareholders’ meeting.
Earnings per share
Basic
Basic EPS is calculated by dividing the Group's profit by the weighted average number of ordinary shares
outstanding during the year, excluding treasury shares.
Diluted
Diluted EPS is calculated by dividing the Group's profit by the weighted average number of ordinary shares
outstanding during the year, excluding treasury shares. For the purposes of calculation of diluted EPS, the
weighted average number of outstanding shares is determined assuming translation of all potential shares
with a dilutive effect, and the Group's net profit is adjusted for the post-tax effects of translation.

Datalogic Group
Consolidated Financial Statements as at 31.12.2017 - Explanatory Notes 45
Treatment of foreign currency items
Functional presentation currency
The items shown in the financial statements of each Group entity are shown in the currency of the economic
environment in which the entity operates, i.e. in its functional currency. The Consolidated Financial
Statements are presented in euro, the euro being the Parent Company’s functional presentation currency.
Transactions in currencies other than the functional currency
Transactions in currencies other than the functional currency are initially translated in the functional currency
by using the exchange rate at the date of transaction. At the reporting date of the reference period, non
functional-currency monetary assets and liabilities are converted at the exchange rate in force on that date.
The resulting exchange differences are reported in the Income Statement. Non-monetary assets and
liabilities, denominated in a non-functional currency and measured at cost, are translated at the exchange
rate effective on the date of transaction, while transactions measured at fair value are translated at the
exchange rate on the date in which such value is determined.
Segment Reporting
Operating segments are identified based on the internal statements used by senior management in order to
allocate resources and evaluate results (internal reporting for performance analysis) for the reference period.
Based on the definition envisaged in the IFRS 8 Standard, an operating segment is a component of an
entity:
that engages in revenue earning business activities;
whose operating results are regularly reviewed by the top operating decision-makers of the entity for
the adoption of resolutions on resources to be allocated to the segment and the evaluation of results;
for which discrete information is available.
In light of the above definition, the operating segments defined by the Group are represented by Business
Units that report to the corporate top Management and maintains periodic contacts to discuss operating
activities, results, forecasts or plans. To the purposes of disclosures in the financial statements, the Group
has then aggregated the following operating segments:
Datalogic;
Solution Net System;
Informatics.
The segments that are included in each single combination are in fact similar as regards the following
aspects:
a) the nature of products;
b) the nature of production processes;
c) the type of customers;
d) the methods used to distribute products/services;
e) the economic characteristics.
The transfer prices applied to transactions between segments and concerning the exchange of goods and
services rendered are governed at arm’s length.

Datalogic Group
Consolidated Financial Statements as at 31.12.2017 - Explanatory Notes 46
AMENDMENTS, NEW STANDARDS AND INTERPRETATIONS
Accounting standards, amendments and interpretations applied as from 01 January
2017
The accounting standards adopted for preparation of the Consolidated Financial Statements are consistent
with those used for the preparation of the Consolidated Financial Statements as at 31 December 2017. The
Group adopted for the first time some accounting standards and amendments that are applied for annual
reporting periods beginning on or after 01 January 2017. The Group has not yet adopted any standard,
interpretation or amendment that has been published, but is not yet effective.
The nature and impact of any new principle/amendment are specified hereunder. Albeit these new standards
and amendments were applied for the first time in 2017, they had no significant impact on the Group
Consolidated Financial Statements. The nature and impact of any new Standard/amendment are specified
hereunder:
Amendments to IAS 7 - Cash Flow Statement
The amendments envisage that entities shall supply disclosures on changes in liabilities related to financing
activities, including both changes related to cash flows and non-monetary changes (such as, for example,
gains and losses on exchange rates).
Amendments to IAS 12 - Income tax
The amendments clarify that an entity should consider whether tax laws limit the taxable income sources for
which it might have deductions related to the reverse of deductible temporary differences. Moreover, the
amendment supplies guidelines on how an entity should determine future taxable income and clarifies when
the taxable income might include the recovery of some assets, for a higher value than their carrying value.
Amendments to IFRS 12 Disclosure of Interests in Other Entities
The amendments clarify that the disclosures required by IFRS 12, other than information envisaged in
paragraphs B10-B16, apply to equity investments (or a portion of interests in a joint venture or associate) of
an entity in a subsidiary, joint venture or associate, which is classified (or included in a classified disposal
group) as available for sale.
STANDARDS ISSUED WHICH ARE NOT YET IN FORCE
The Group is analysing the following standards by evaluating the impact that they would have on its
Consolidated Financial Statements, without proceeding to an early application of the same. The novelties
introduced are summarised as follows.
IFRS 9 - Financial Instruments
In July 2014, IASB issued the final version of IFRS 9 Financial Instruments, which supersedes IAS 39
"Financial Instruments: Measurement and recognition and all previous versions of IFRS 9. IFRS 9 includes
all the three aspects related to the accounting of financial instruments: classification and measurement,
impairment and hedge accounting. IFRS 9 is applicable to the annual reporting periods beginning on or after
01 January 2018. Earlier application is permitted. Except for hedge accounting, the standard shall be applied
retrospectively, although the supply of comparative information is not mandatory. As regards hedge
accounting, the standard generally applies prospectively, with a few exceptions.

Datalogic Group
Consolidated Financial Statements as at 31.12.2017 - Explanatory Notes 47
No significant impact is expected on the Group Statement of Financial Position and Shareholders’ Equity.
IFRS 15 - Revenue from Contracts with Customers
The IFRS 15 standard was issued in May 2014 and amended in April 2016, and provides a five-step new
model to be applied to all contracts with customers. According to IFRS 15, revenue should be recognised for
an amount corresponding to the right in payment the entity believes to have against the sale of goods or
services to customers.
The new Standard will supersede all current requirements included in IFRS on recognition of revenues. The
Standard is effective for annual reporting periods beginning on or after 01 January 2018, with fully
retrospective or modified application. Early application is permitted.
The Group will apply the new standard on the mandatory effective date. In 2016, the Group started the
preliminary assessment of effects related to IFRS 15, which is still in force. In 2017, this assessment was
completed with a more comprehensive analysis, aimed at determining the quantity impact and the first
adoption modality of the Standard.
a) Sale of goods
No impact on the Group is expected by contracts with customers where the sale of products is the only
obligation. The Group expects that the revenue will be recognised when the ownership of the asset will be
transferred to the customer, generally upon delivery of the goods.
b) Rendering of services
Installation, maintenance, repair and technical support services are rendered by the Group. These services
are rendered both separate, based on contracts signed with customers, and jointly with the sale of the goods
to customers. In compliance with IFRS 15, the Group performed assessments on the allocation of revenues
based on the prices related to each single service. No significant impacts emerged.
c) Presentation and required disclosures
Provisions set out by IFRS 15 concerning presentation and required disclosures are more detailed,
compared to those included in current standards. Provisions concerning the presentation involve a significant
change in practice and a significant increase in volume of information required for Group financial
statements. No significant impacts for the Group emerged from the analysis performed during 2017.
Amendments to IFRS 10 and IAS 28 - Sale or Transfer of Assets between the Parent Company and its Associated Company or Joint Venture
Amendments clarify provisions of IFRS 10 and IAS 28, with reference to the loss in control of an investee,
which is sold or transferred to an associated company or a joint venture. Amendments clarify that profit or
loss resulting from the sale or transfer of assets representing a business, as defined by IFRS 3, between an
investor and its associated company or joint venture, must be entirely recognised. Any profit or loss, resulting
from the sale or transfer of assets, which do not represent a business, is however recognised only within the
limits of the portion held by third-party investors in the associated company or joint venture. IASB postponed
the effective date of these amendments at an indefinite date. Nevertheless, if an entity resolves for an early
application, it should do it prospectively. No impact is expected on the Group Consolidated Financial
Statements.

Datalogic Group
Consolidated Financial Statements as at 31.12.2017 - Explanatory Notes 48
IFRS 2 - Classification and Measurement of Share-based Payment Transactions -
Amendments to IFRS 2
IASB issued the amendments to IFRS 2 Share-based payments concerning three main areas: accounting for
cash-settled share-based payment transactions that include a performance condition; classification of share-
based payments settled net of tax withholdings; accounting for modification of share-based payment
transactions from cash-settled to equity-settled.
Upon adoption, the entities must apply amendments without restating the previous years. Retrospective
application is however permitted if it is applied for the three amendments and other criteria are met. These
amendments are effective for annual reporting periods beginning on or after 01 January 2018. Earlier
application is permitted. No impact is expected on the Group Consolidated Financial Statements.
IFRS 16 Leases
IFRS 16 was published in January 2016 and supersedes IAS 17 - Leases, IFRIC 4 - Determining Whether
an Arrangement Contains a Lease, SIC-15 - Operating Lease - Incentives and SIC-27 - Evaluating the
Substance of Transactions in the Legal Form of a Lease. IFRS 16 defines principles for recognition,
measurement, presentation and disclosure of leases. The standard requires lessees to recognise all leases
in the financial statements according to one single accounting model, similar to the one used to recognise
financial leases, pursuant to IAS 17. The Standard envisages two exceptions in recognition obligations of
lessees: lease contracts with underlying assets of a low value (e.g. personal computers) and short-term
lease contracts (e.g. leases with a lease term of 12 months or less). At the inception of the lease, the lessee
shall measure a liability against lease payments (i.e. lease liabilities) and an asset representing the right of
use of the underlying asset for the duration of the contract (i.e. the right-of-use asset). Lessees shall provide
for a separate recognition of income payables on the lease and accumulated amortisation/depreciation of the
right-of-use asset.
The lease liability is subsequently remeasured to reflect changes upon occurrence of special events (e.g.
changed terms of the lease contract, changes in future lease payments due to changes in an index or a rate
used to calculate those payments). The lessee will generally recognise the amount of the lease liability
remeasurement as an adjustment of the right-of-use asset. Accounting envisaged by IFRS 16 for lessors
remains substantially unchanged compared to the current accounting method as per IAS 17. Lessors shall
continue to classify all leases by using the same classification principle envisaged by IAS 17 and making a
distinction between two types of lease: operating and financial leases. IFRS 16 requires lessees and lessors
to provide for further disclosures compared to IAS 17.
IFRS 16 is effective for annual reporting periods beginning on or after 01 January 2019. Early application is
permitted, but not before the entity has adopted IFRS 15. A lessor can elect to either apply the standard with
full retrospective effect or, alternatively, with a modified retrospective approach. Transitory provisions set out
by the standard allow for some benefits.
In 2018, the Group expects to define the possible effects of IFRS 16 on its Consolidated Financial
Statements.
Amendments to IAS 40 – Transfers of Investment Property
The amendments clarify when an entity should transfer or not transfer a property, including the buildings
under construction or development, under item investment property. The amendment envisages that a
change in use occurs when the property meets, or ceases to meet, the definition of property and there is
evidence of the change in use. A mere change in management’s intentions for the use of the property does
not provide evidence of a change in use. The entities shall apply those amendments prospectively to
changes in use that occur on or after the beginning of the annual reporting period in which the entity first
applies the amendments. At the date of initial application, an entity shall reassess the classification of

Datalogic Group
Consolidated Financial Statements as at 31.12.2017 - Explanatory Notes 49
property held at that date and, if applicable, reclassify property to reflect the conditions that exist at that date.
Pursuant to IAS 8, the retrospective application is permitted only if it is possible without the use of hindsight.
The amendments will be applicable to annual reporting periods beginning on or after 01 January 2018.
Earlier application is permitted, of which disclosure is required. The Group will apply the amendments at their
effective date. Therefore, given that the Group’s accounting treatment is in line with clarifications, the Group
does not expect any effect on its Consolidated Financial Statements.
2014-2016 annual improvements
These improvements include:
IFRS 1 First-time Adoption of International Financial Reporting Standards - Deletion of short-term
exemptions for first-time adopters
Short-term exemptions envisaged in paragraphs E3-E7 of IFRS1 were deleted as they have fulfilled their
task. The amendment is effective as from 01 January 2018. This amendment is not applicable to the Group.
IAS 28 - Investments in Associates and Joint Ventures. Clarification that measuring investees at fair
value through profit or loss is an investment-by-investment choice
The amendments clarify the following:
An entity that is a venture capital organisation, or other eligible entity, may elect (on initial recognition
and for a single investment) to measure equity investments in associates and joint ventures at fair value,
recognised in the Income Statement.
If an entity that is not an investment entity has an equity investment in an associate or a joint venture,
which is an investment entity, while applying the equity method this entity may elect to keep the
measurement at fair value applied by an investment entity (either an associate or a joint venture) in
measuring its equity investments (in the associate or joint venture). This choice is made separately for
each single associate or joint venture that is an investments entity at the latest (in terms of occurrence)
of the following dates: (a) initial recognition of the equity investment in the associate or joint venture that
is an investment entity; (b) when the associate or joint venture becomes an investment entity; and (c)
when the associate or joint venture that is an investment entity becomes the Parent Company for the first
time.
The amendments should be applied retrospectively as from 01 January 2018. Earlier application is
permitted. If an early adoption is applied by an entity, it should give notice accordingly. These amendments
are not applicable to the Group.
Application of IFRS 9 Financial instruments and IFRS 4 Insurance contracts
The amendments concern the problems that arise from the adoption of the new Standard on financial
instruments, IFRS 9, before the adoption of IFRS 17 Insurance Contracts, which supersedes IFRS 4. The
amendments introduce two options for the entities that issue insurance contracts: a temporary exemption in
the application of IFRS 9 and the overlay approach. The first-time application of the temporary exemption
applies to annual reporting periods beginning on or after 01 January 2018. An entity might elect to adopt the
overlay approach upon the first-time application of IFRS 9 and this approach will be applied retrospectively to
financial assets designated upon transition to IFRS 9. The entity will restate the comparative disclosures
reflecting the overlay approach if, and only if, the entity restates the comparative disclosures when it applied
IFRS 9. These amendments are not applicable to the Group.

Datalogic Group
Consolidated Financial Statements as at 31.12.2017 - Explanatory Notes 50
IFRIC Interpretation 22 Foreign Currency Transactions and Advance Consideration
The interpretation clarifies that, for the purpose of determining the spot interest exchange rate to use on
initial recognition of the related asset, expense or income (or part of it) on the derecognition of a non-
monetary asset or non-monetary liability arising from advance consideration, the date of transaction is the
date on which the entity initially recognises the non-monetary asset or non-monetary liability arising from the
payment or receipt of advance consideration. In the event of multiple payments or receipts of advance
consideration, the entity shall determine the date of transaction for each payment or receipt of advance
consideration. The entities may apply the amendments on a full retrospective basis. As an alternative, an
entity might apply the interpretation prospectively to all assets, costs and revenues that are within the scope
of the Standard and have been initially recognised on the following dates, or later:
i) At the beginning of the year in which the entity applies the interpretation for the first time.
ii) At the beginning of the previous year, disclosed for comparison purposes in the Financial
Statements, for the year in which the entity applies the interpretation for the first time.
The interpretation is effective for annual reporting periods beginning on or after 01 January 2018. Earlier
application is permitted, of which disclosure is required. Therefore, given the fact that the current accounting
policy of the Group is aligned with the interpretation, the Group does not expect any effect on its
Consolidated Financial Statements.
IFRIC Interpretation 23 Uncertainty over Income Tax Treatment
The interpretation defines the accounting treatment of income taxes when there is uncertainty over income
tax treatments under IAS 12. This interpretation is not effective for taxes and duties that are not within the
scope of IAS 12 nor it includes specifically requisites related to interest or fines related to uncertain tax
treatment.
The interpretation specifically concerns the following items:
Whether an entity considers uncertain tax treatment separately;
Assumptions for tax authorities’ assessments;
How an entity determines the taxable profit (or tax loss), tax bases, unused tax losses, unused tax
credits and tax rates;
How an entity tackles changes in facts and circumstances.
An entity shall determine whether to consider each uncertain tax treatment separately or collectively,
together with one or more uncertain tax treatments. The approach that allows the best estimate to solve the
uncertainty should be adopted. The interpretation is effective for annual reporting periods beginning on or
after 01 January 2019. Some transitory facilitations are available. The Group will apply the interpretation at
its effective date. Due to the fact that the Group operates in a complex multinational tax context, the
application of the Interpretation might have some effects on the consolidated financial statements and
required disclosures. Moreover, the Group might define processes and procedures to obtain the information
required for the prompt application of the Interpretation.
USE OF ESTIMATES
Preparation of IFRS-compliant consolidated financial statements and of the relevant notes requires directors
to apply accounting principles and methodologies that, in some cases, are based on valuations and
estimates, which in turn refer to historic experience and assumptions based on specific circumstances at any
given time. The application of such estimates and assumptions affects the amounts related to revenues,
costs, assets and liabilities, as well as contingent liabilities disclosed and any relevant information. The
ultimate actual amounts of accounting items, for which these estimates and assumptions have been used,

Datalogic Group
Consolidated Financial Statements as at 31.12.2017 - Explanatory Notes 51
might be different from those reported in the financial statements due to the uncertainty characterising the
assumptions and conditions on which estimates are based.
Following are the assumptions concerning the future, as well as the other main causes of uncertainty related
to estimates which, at the reporting date, show a significant risk to generate remarkable adjustments in the
carrying values of assets and liabilities within the following financial year. The Group has based its
assumptions and estimates on parameters which were available when preparing the consolidated financial
statements. The current circumstances and assumptions on future developments might however change
upon occurrence of market changes or events beyond the Group’s control. Upon their occurrence, these
changes are reflected in the assumptions.
Impairment of non financial assets (Goodwill, Tangible and Intangible Assets)
An impairment occurs when the book value of an asset or CGU exceeds its recoverable value, which is its
fair value, less sales costs, and its value in use, whichever is higher. The fair value, less sales costs, is the
amount that can be obtained from the sale of an asset or a CGU, in a free transaction between aware and
willing parties, less costs for disposal. The value in use is calculated by using a discounted cash-flow model.
Cash flows result from plans. The recoverable value depends much on the discounting rate used in the
discounted cash flow model, as well as on cash flows expected in the future and the growth rate used for
extrapolation. Key assumptions, used to determine the recoverable value for the various Cash Generation
Units, including a sensitivity analysis, are thoroughly described in Note 2.
Taxes
Deferred tax assets are recognised to the extent that it is probable that taxable income will be available
against which the deductible temporary difference can be utilised. Relevant estimates performed by the
Management are required to determine the amount of tax assets that can be recognised based on the level
of future taxable income, the timing of their occurrence and tax planning strategies. Deferred tax liabilities for
taxes on retained earnings of subsidiaries, associates or joint ventures are recognised to the extent that they
are likely to remain undistributed in the foreseeable future. Estimates performed by the Management are
therefore required to determine the amount of tax assets that can be recognised and the amount of tax
liabilities, whose recognition can be omitted, based on the level of future taxable income, the timing of their
occurrence and tax planning strategies. The long-term nature, as well as the complexity of regulations in
force in the various jurisdictions, the differences resulting from actual results and assumptions made, or
future changes in such assumptions might require future adjustments to income taxes and already recorded
costs and benefits.
Fair value of financial instruments
When the fair value of a financial asset or liability, which is recognised in the statement of financial position,
cannot be measured based on deep market quotations, fair value is determined by using various
measurement techniques. Inputs included in this model are recognised by observable markets, whenever
possible, but when it is not possible, a certain level of estimates is required to determine fair values.
Employee benefits
The cost of defined-benefit plans and other post-employment healthcare benefits and the current value of the
defined-benefit obligations are determined based on actuarial measurements. Actuarial measurement
requires the elaboration of various assumptions, which might differ from the effects of future developments.
These assumptions concern the determination of discount rates, future wage increases, the mortality rate
and pension increases.

Datalogic Group
Consolidated Financial Statements as at 31.12.2017 - Explanatory Notes 52
Development costs
The Group capitalised costs related to projects for the development of products. The initial cost capitalisation
is based on the confirmation by the Management of the technical and economical feasibility of the project. In
order to determine the values to be capitalised, Directors will evaluate the expected future cash flows related
to the project, as well as the discount rates to be applied and the timing of the expected benefits to arise.
Other (Provisions for risks and charges, doubtful accounts, inventories write-down, revenue, discounts and returns)
Provisions for risks and charges are based on measurements and estimates relating to historic data and
assumptions, which in turn are deemed reasonable and realistic according to the related circumstances.
The recognition process of Group revenues include estimates related to both the extent of revenues, based
on the criterion of completion percentage, and the determination of discounts and returns granted to
customers, but still unclaimed. Evaluation processes and modalities, as well as the determination of such
estimates are based on assumptions that, for their nature, involve the evaluation of Directors.
FINANCIAL RISK MANAGEMENT
Risk factors
The Group is exposed to various types of financial risks in the course of its business, including:
market risk, specifically:
a) foreign exchange risk, relating to operations in currency areas other than that of the functional
currency;
b) interest rate risk, connected with the Group’s level of exposure to financial instruments,
generating interest and recognised in the Statement of Financial Position;
credit risk, deriving from trade transactions or from financing activities;
liquidity risk, relating to availability of financial resources and access to the credit market.
The Group is not exposed to any price risk, as it is it exposed substantially to risk deriving from the
performance of commodities traded on the financial markets.
Financial risk management is an integral part of management of the Datalogic Group’s business activities.
The management of market risk and liquidity is carried out by the Parent Company through the centralised
treasury, acting directly on the market, possibly also on behalf of subsidiaries and investees.
Credit risk is managed by the Group’s operating units.
Market risk
a) Foreign exchange risk
Datalogic operates in an international environment and is exposed to translation and transaction exchange
risk.
Translation risk relates to the conversion into Euro during consolidation of items in the individual financial
statements of foreign companies whose functional and presentation currency is not the Euro. The key
currencies are the US dollar, the Chinese Renminbi, the Singapore Dollar and the Hungarian Forint.
Transaction risk relates to trade transactions (foreign currency receivables/payables) and financial
transactions (foreign currency borrowings or loans) of Group companies in currencies other than their
functional currency. The key currency is the US dollar.
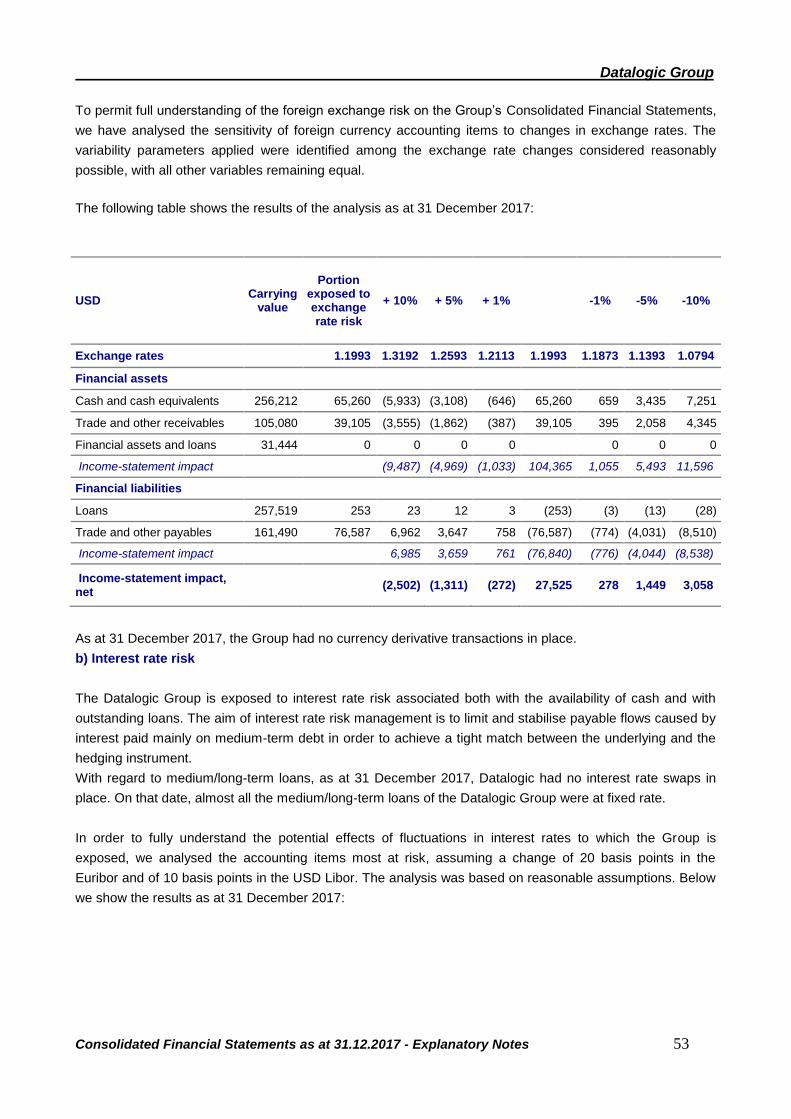
Datalogic Group
Consolidated Financial Statements as at 31.12.2017 - Explanatory Notes 53
To permit full understanding of the foreign exchange risk on the Group’s Consolidated Financial Statements,
we have analysed the sensitivity of foreign currency accounting items to changes in exchange rates. The
variability parameters applied were identified among the exchange rate changes considered reasonably
possible, with all other variables remaining equal.
The following table shows the results of the analysis as at 31 December 2017:
USD Carrying
value
Portion exposed to exchange rate risk
+ 10% + 5% + 1% -1% -5% -10%
Exchange rates 1.1993 1.3192 1.2593 1.2113 1.1993 1.1873 1.1393 1.0794
Financial assets
Cash and cash equivalents 256,212 65,260 (5,933) (3,108) (646) 65,260 659 3,435 7,251
Trade and other receivables 105,080 39,105 (3,555) (1,862) (387) 39,105 395 2,058 4,345
Financial assets and loans 31,444 0 0 0 0 0 0 0
Income-statement impact (9,487) (4,969) (1,033) 104,365 1,055 5,493 11,596
Financial liabilities
Loans 257,519 253 23 12 3 (253) (3) (13) (28)
Trade and other payables 161,490 76,587 6,962 3,647 758 (76,587) (774) (4,031) (8,510)
Income-statement impact 6,985 3,659 761 (76,840) (776) (4,044) (8,538)
Income-statement impact, net
(2,502) (1,311) (272) 27,525 278 1,449 3,058
As at 31 December 2017, the Group had no currency derivative transactions in place.
b) Interest rate risk
The Datalogic Group is exposed to interest rate risk associated both with the availability of cash and with
outstanding loans. The aim of interest rate risk management is to limit and stabilise payable flows caused by
interest paid mainly on medium-term debt in order to achieve a tight match between the underlying and the
hedging instrument.
With regard to medium/long-term loans, as at 31 December 2017, Datalogic had no interest rate swaps in
place. On that date, almost all the medium/long-term loans of the Datalogic Group were at fixed rate.
In order to fully understand the potential effects of fluctuations in interest rates to which the Group is
exposed, we analysed the accounting items most at risk, assuming a change of 20 basis points in the
Euribor and of 10 basis points in the USD Libor. The analysis was based on reasonable assumptions. Below
we show the results as at 31 December 2017:

Datalogic Group
Consolidated Financial Statements as at 31.12.2017 - Explanatory Notes 54
Items exposed to interest rate risk with impact on the Income Statement before taxes
Euribor Carrying
value
of which exposed to
exchange rate risk
20bp -20bp
Financial assets
Profit (loss) Profit (loss)
Cash and cash equivalents 256,212 176,229 352 (352)
Financial assets and loans 31,444 0
Income-statement impact 352 (352)
Financial liabilities
Profit (loss) Profit (loss)
Loans 257,519 1,494 (3) 3
Income-statement impact (3) 3
Total increases (decreases) 349 (349)
USD Libor Carrying
value
of which exposed to
exchange rate risk
10bp -10bp
Financial assets Profit (loss) Profit (loss)
Cash and cash equivalents 256,212 78,266 78 (78)
Financial assets and loans 31,444 0
Income-statement impact
78 (78)
Financial liabilities Profit (loss) Profit (loss)
Loans 257,519 253 0 (0)
Income-statement impact 0 (0)
Total increases (decreases) 78 (78)

Datalogic Group
Consolidated Financial Statements as at 31.12.2017 - Explanatory Notes 55
Credit risk
The Group is exposed to credit risk, combined with commercial transactions. It therefore envisaged
protection measures in order to keep the amounts outstanding to a minimum level, i.e. a specific check on
receivables due, management of client credit-line limits and gathering of financial information on companies
with higher exposure. A large part of Datalogic’s business is conveyed on a network of known
clients/distributors, with whom, statistically, no problems connected with credit recoverability have been
encountered. Customers requesting deferred conditions of payment are subjected to screening procedures
concerning their creditworthiness grade (degree of solvency) and an analysis of the specific deal. If they are
significant, trade receivables are subjected to individual impairment testing if they report potential and
significant impairment indicators.
No significant impact was reported with the adoption, as from 01 January 2018, of the expected credit loss
model envisaged in application of the IFRS 9 standard.
The Group protects itself against credit risk also through the subscription of a factoring contract without
recourse. As at 31 December 2017, factored trade accounts receivables amounted to €33,377 thousand
(compared to €29,193 thousand at the end of 2016).
The maximum exposure to credit risk on the balance sheet date is the carrying amount of each class of
financial asset presented in Note 4.
Liquidity risk
The Datalogic Group’s liquidity risk is minimised by specific central management by the Parent Company.
Bank indebtedness and the management of liquidity are handled centrally via a series of instruments aimed
at optimising the management of financial resources, including cash pooling. The Parent Company manages
and negotiates medium/long-term financing and credit lines to meet the Group’s requirements. Specifically,
Datalogic S.p.A., as Parent Company, has cash credit lines available for future requirements to the benefit of
the Group. Centralised negotiation of credit lines and loans, on the one hand, and centralised management
of the Group’s cash resources, on the other hand, it is functional to the optimisation of net indebtedness
costs.
We also report that, as at 31 December 2017, the Group’s Liquidity Reserve – which includes uncommitted
but undrawn credit lines of €319 million – is considered largely sufficient to meet commitments existing as at
the reporting date.
The following table details the financial liabilities settled on a net basis by the Group, grouping them
according to residual contractual maturity as at the reporting date. The amounts shown are contractual cash
flows not discounted to present value.
The following table shows financial liabilities by maturity:
31 December 2017
0 - 1 year 1 - 5 years > 5 years
Loans 48,108 184,699 20,957
Other 1,250 750
Bank overdrafts 92
Payables to factoring companies 1,663
Trade and other payables 157,924 3,566
TOTAL 209,037 189,015 20,957

Datalogic Group
Consolidated Financial Statements as at 31.12.2017 - Explanatory Notes 56
Changes in liabilities resulting from financial assets
The reconciliation of changes in liabilities resulting from financial assets is shown hereunder.
01.01.2017 Cash
Flows
Change in Business
Combination
Change in exchange
rates
Fair value increases/decreas
es
New contract
s 31.12.2017
Bank loans - current portion 30,180 (30,180) 48,108 48,108
Bank loans - non-current portion 139,321 (139,321)
205,656 205,656
Payables to factoring companies 5,593 (3,680)
(250)
1,663
Lease payables - current portion 248 (248)
0
Liabilities for Derivative Financial Instruments
37 (37)
0
Other Financial Payables - current portion
1,250
1,250
Other Financial Payables - non-current portion
750 750
Bank overdrafts 212 (120)
92
Total liabilities resulting from financial assets
175,591 (173,586) 2,000 (250) 0 253,764 257,519
CAPITAL RISK MANAGEMENT
The Group manages capital with the intention of protecting its own continuity and optimising shareholder
value, maintaining an optimum capital structure while reducing its cost.
In line with sector practice, the Group monitors capital based on the gearing ratio. This indicator is calculated
as a ratio between (Net Financial Position)/Net Indebtedness (see Note 10) and Total Capital.
31.12.2017 31.12.2016
Net indebtedness (A) (30,137) (3,503)
Shareholders’ Equity (B) 353,029 336,394
Total capital [(A)+(B)]=C 322,892 332,891
“Gearing ratio” (A)/(C) -9.33% -1.05%
SEGMENT DISCLOSURE
As shown in the consolidated financial statements as at 31 December 2016, during the year the Group
started a strategic plan, which led to define a new business operating structure with a customer-oriented go
to market model based on four sectors (Retail, Manufacturing, Transportation & Logistics, Healthcare), thus
overcoming the departmental structure (ADC/IA) centred on product diversification. The plans also led to
corporate reorganisation, which reflects this new operating model.
Effective on 01 January 2017, the companies related to the ADC (Automatic Data Capture) Division and IA
(Industrial Automation) Division therefore merged into the various geographical areas where the Group
operates.
In light of the new business operating structure and corporate reorganisation, effective on 01 January 2017,
the operating sectors were redefined accordingly and periodically remeasured by the top management,
according to provisions set out by IFRS 8, as described hereunder:

Datalogic Group
Consolidated Financial Statements as at 31.12.2017 - Explanatory Notes 57
Datalogic, which represents the core business of the Group and designs and produces bar code
scanners, RFID, mobile computers, detection, measurement and security sensors, and vision and
laser marking systems intended to contribute for higher efficiency and quality of processes in the
areas of large-scale distribution, manufacturing, transport & logistics and health, along the entire
value chain;
Solution Net Systems, specialised in supplying and installing integrated solutions for automated
distribution for the postal segment and distribution centres in the Retail sector;
Informatics, which sells and distributes products and solutions for the management of inventories
and mobile assets tailored to small and medium sized companies.
Sales transactions amongst the operating segments indicated hereunder are executed at arm's length
conditions, based on the Group transfer pricing policies.
The financial information related to operating segments as at 31 December 2017 and
31 December 2016 are as follows:
Informatics
Solution Net System
Datalogic Adjustments Total Group
2017 2016 2017 2016 2017 2016 2017 2016 2017 2016
External revenues 20,586 24,351 24,728 20,090 560,707 532,041 0 0 606,022 576,482
Intersegment revenues 9 15 12 103 3,273 2,199 (3,294) (2,317) 0 0
Total Sales 20,595 24,366 24,740 20,193 563,980 534,240 (3,294) (2,317) 606,022 576,482
Operating result (EBIT) (281) (1,599) 2,785 (1,061) 79,917 73,042 458 (137) 82,879 70,245
% of revenues (1.4)% (6.6)% 11.3% (5.3)% 14.2% 13.7% (13.9)% 6.0% 13.7% 12.2%
Non-recurring costs/revenues
0 278 0 0 (924) (1,257) 0 0 (924) (979)
Amortisation, depreciation and write-downs
(427) (345) (69) (41) (19,327) (18,754) 327 (2) (19,496) (19,142)
EBITDA 146 (1,532) 2,854 (1,020) 100,168 93,054 131 (136) 103,299 90,366
% of revenues 0.7% (6.3)% 11.5% (5.1)% 17.8% 17.4% (4.0)% 5.9% 17.0% 15.7%
Financial income (expenses) (104) (219) (127) (20) (7,083) (3,216) (111) 102 (7,425) (3,353)
Fiscal income (expenses) (125) 561 (1,033) (220) (14,171) (21,372) (45) (15) (15,374) (21,046)
R&D expenses (1,394) (1,488) (485) (600) (53,396) (48,327) 0 (6) (55,275) (50,421)
% of revenues (6.8)% (6.1)% (2.0)% (3.0)% (9.5)% (9.0)% 0.0% 0.3% (9.1)% (8.7)%

Datalogic Group
Consolidated Financial Statements as at 31.12.2017 - Explanatory Notes 58
The balance-sheet information relating to operating sectors as at 31 December 2017, as redefined in
compliance with the Group’s new organisational model, compared with the information as at 31 December
2016, is as follows:
Informatics
Solution Net System
Datalogic Adjustments Total Group
2017 2016 2017 2016 2017 2016 2017 2016 2017 2016
Total Assets 20,549 24,639 14,330 11,495 838,903 744,505 (36,980) (37,792) 836,802 742,847
Fixed assets 14,094 16,222 134 222 269,408 294,526 2,420 2,043 286,056 313,013
Tangible 2,322 2,769 133 219 67,277 69,356 1 (262) 69,733 72,082
Intangible 11,772 13,453 1 3 202,131 225,170 2,419 2,305 216,323 240,931
Equity investments in associates 0 0 0 0 35,975 36,689 (33,791) (34,475) 2,184 2,214
Total Liabilities 6,431 8,042 7,492 5,457 475,138 397,843 (5,288) (4,889) 483,773 406,453
Sector information by region as at 31 December 2017 compared to data as at 31 December 2016 is as
follows.
2017 % on
Revenues 2016
% on Revenues
Change %
% change at constant
Euro/Dollar exchange
rate Italy 58,944 9.7% 51,184 8.9% 7,760 15.2%
EMEA (except Italy) 268,562 44.3% 253,362 43.9% 15,200 6.0%
Total EMEA (*) 327,506 54.0% 304,546 52.8% 22,960 7.5% 7.7%
North America 171,414 28.3% 178,269 30.9% (6,855) (3.8%) (2.2%)
Latin America 27,468 4.5% 30,032 5.2% (2,564) (8.5%) (6.7%)
APAC (*)
(incl. China) 79,634 13.1% 63,635 11.0% 15,999 25.1% 26.5%
Total revenues 606,022 100.0% 576,482 100.0% 29,540 5.1% 6.0%
(*) EMEA: Europe, Middle East and Africa; APAC: Asia & Pacific
31.12.2017 31.12.2016
Adjustments
31.12.2017
Adjustments
31.12.2016
Consolidated 31.12.2017
Consolidated 31.12.2016
Change
NON-CURRENT ASSETS
Italy 85,403 91,352 85,403 91,352 -6.5%
Europe 48,807 37,215 48,807 37,215 31.1%
North America 230,937 255,637 230,937 255,637 -9.7%
Rest of the World 12,801 18,168 12,801 18,168 -29.5%
Eliminations and adjustments
1,366 1,493 1,366 1,493 -8.5%
TOTAL 377,949 402,372 1,366 1,493 379,315 403,865 -6.1%

Datalogic Group
Consolidated Financial Statements as at 31.12.2017 - Explanatory Notes 59
GROUP STRUCTURE
The Consolidated Financial Statements include the financial statements of the Parent Company and of the
companies that are directly and/or indirectly controlled by the Parent Company or on which the latter has a
significant influence.
The financial statements of subsidiaries were duly adjusted, as necessary, to render them consistent with the
accounting criteria of the Parent Company.
The companies included in the scope of consolidation as at 31 December 2017, as disclosed hereunder,
were all consolidated on a line-by-line basis.
Name Registered office Share capital
Total Shareholders’ Equity (€/000)
Profit/loss for the period
(€/000)
% Ownership
Datalogic S.p.A. Bologna – Italy Euro 30,392,175 291,639 25,592
Datalogic Real Estate France Sas
Paris – France Euro 2,227,500 3,560 56 100%
Datalogic Real Estate Germany GmbH
Erkenbrechtsweiler-Germany
Euro 1,025,000 1,389 (6) 100%
Datalogic Real Estate UK Ltd
Redbourn - England
GBP 3,500,000 4,390 118 100%
Datalogic IP Tech S.r.l. Bologna – Italy Euro 65,677 10,921 8,520 100%
Informatics Holdings Inc.
Plano Texas - Usa USD 1,568 13,987 (541) 100%
Wasp Barcode Technologies Ltd
Redbourn - England
GBP - 130 32 100%
Datalogic (Shenzhen) Industrial Automation Co. Ltd.
Shenzhen - China CNY 2,136,696 1,334 56 100%
Datalogic Hungary Kft Fonyod-Hungary HUF 3,000,000 2,527 611 100%
Solution Net Systems, Inc.
Quakertown, PA - USA
USD 6,838 1,625 100%
Datalogic S.r.l. Bologna – Italy Euro 10,000,000 159,600 22,584 100%
Datalogic Slovakia S.r.o.
Trnava-Slovakia Euro 66,388 7,623 7,550 100%
Datalogic USA Inc. Eugene OR-Usa USD 100 73,194 4,050 100%
Datalogic ADC do Brazil Ltd.
Sao Paulo - Brazil BRL 206,926 (3,062) (1,438) 100%
Datalogic Scanning de Mexico S.r.l.
Colonia Cuauhtemoc-Mexico
USD - (69) (99) 100%
Datalogic Scanning Eastern Europe GmbH
Darmstadt-Germany
Euro 25,000 3,732 171 100%
Datalogic Australia Pty Ltd
Mount Waverley (Melbourne)-Australia
AUD 3,188,120 574 255 100%
Datalogic Vietnam LLC Vietnam USD 3,000,000 76,142 19,366 100%
Datalogic Singapore Asia Pacific Pte Ltd.
Singapore SGD 3 1,673 432 100%
Datalogic ADC HK Ltd.(*)
Hong-Kong - China HKD 100,000 74 (23) 100%
Datalogic Automation Asia Ltd.(*)
Hong-Kong - China HKD 7,000,000 (73) 362 100%
SOREDI Touch Systems GmbH
Olching (Munich)-Germany
Euro 25,000 1,961 336 100%

Datalogic Group
Consolidated Financial Statements as at 31.12.2017 - Explanatory Notes 60
(*) The companies were put into liquidation during 2017
The following companies were consolidated at cost as at 31 December 2017:
Name Registered
office Share
capital Total
Shareholders’ Equity (€/000)
Profit/loss for the period
(€/000)
% Ownership
Specialvideo S.r.l. (*) Imola - Italy Euro
10,000
481
101
40%
Datasensor Gmbh (*) Otterfing – Germany
Euro
150,000
1
(6)
30%
Suzhou Mobilead Electronic Technology Co, Ltd (*)
China CNY
13,262,410
n.a.
n.a.
25%
CAEN RFID S.r.l. (*) Viareggio LU - Italy
Euro
150,000
1,160
39
20%
R4I S.r.l. (*) Benevento Euro
105,000
298
76
20%
Datalogic Automation AB (**) Malmö, Sweden
KRS
100,000
762
244
20%
(*) data as at 31 December 2016
(**) data as at 30 June 2017
Change in scope of consolidation
On 6 July 2017, Datalogic S.p.A. acquired 100% share capital of the German company Soredi Touch
Systems GmbH, leader in technologies for terminals, especially forklifts terminals, with registered office in
Olching (Munich).
A branch of the company Datalogic Singapore Asia Pacific Pte Ltd. was established in Korea in the second
half of the year.
On 24 October 2017, the agreement was signed for the transfer of shares held in the company Laservall
Asia Co. Ltd. for the amount of €1.4 million. The sale will be carried out in three tranches, ending on 01 April
2018. On 31 December 2017, the equity investment was therefore decreased in relation to the first tranche.
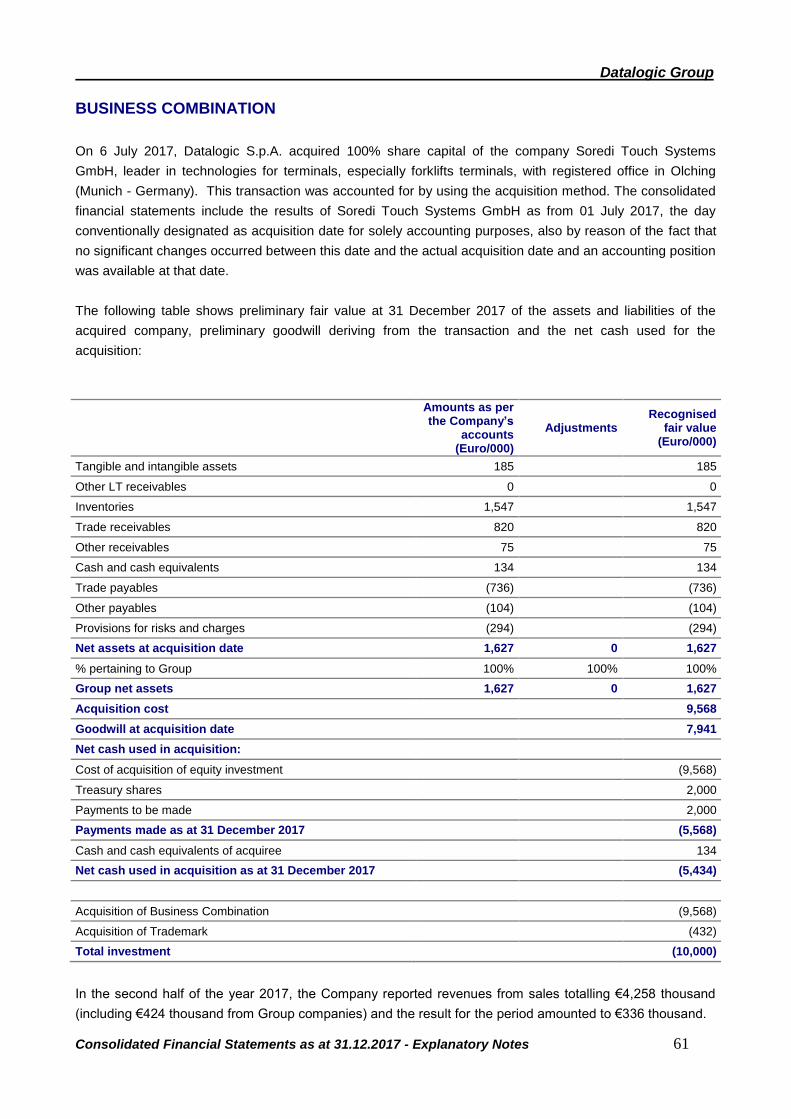
Datalogic Group
Consolidated Financial Statements as at 31.12.2017 - Explanatory Notes 61
BUSINESS COMBINATION
On 6 July 2017, Datalogic S.p.A. acquired 100% share capital of the company Soredi Touch Systems
GmbH, leader in technologies for terminals, especially forklifts terminals, with registered office in Olching
(Munich - Germany). This transaction was accounted for by using the acquisition method. The consolidated
financial statements include the results of Soredi Touch Systems GmbH as from 01 July 2017, the day
conventionally designated as acquisition date for solely accounting purposes, also by reason of the fact that
no significant changes occurred between this date and the actual acquisition date and an accounting position
was available at that date.
The following table shows preliminary fair value at 31 December 2017 of the assets and liabilities of the
acquired company, preliminary goodwill deriving from the transaction and the net cash used for the
acquisition:
Amounts as per the Company’s
accounts (Euro/000)
Adjustments Recognised
fair value (Euro/000)
Tangible and intangible assets 185 185
Other LT receivables 0 0
Inventories 1,547 1,547
Trade receivables 820 820
Other receivables 75 75
Cash and cash equivalents 134 134
Trade payables (736) (736)
Other payables (104) (104)
Provisions for risks and charges (294) (294)
Net assets at acquisition date 1,627 0 1,627
% pertaining to Group 100% 100% 100%
Group net assets 1,627 0 1,627
Acquisition cost 9,568
Goodwill at acquisition date 7,941
Net cash used in acquisition:
Cost of acquisition of equity investment (9,568)
Treasury shares 2,000
Payments to be made 2,000
Payments made as at 31 December 2017 (5,568)
Cash and cash equivalents of acquiree 134
Net cash used in acquisition as at 31 December 2017 (5,434)
Acquisition of Business Combination (9,568)
Acquisition of Trademark (432)
Total investment (10,000)
In the second half of the year 2017, the Company reported revenues from sales totalling €4,258 thousand
(including €424 thousand from Group companies) and the result for the period amounted to €336 thousand.

Datalogic Group
Consolidated Financial Statements as at 31.12.2017 - Explanatory Notes 62
The Group’s total investment for the acquisition of Soredi Touch Systems GmbH, amounted to €10 million
including the acquired Net Financial Position and the best estimate of price adjustments that are
contractually determined. For this transaction, Datalogic wholly acquired the company Soredi Touch Systems
GmbH, as well as the “Soredi” trademark, recognised under item Intangible assets for €0.4 million.
At closing date, Datalogic S.p.A. paid €6 million cash and €2 million treasury shares (equal to 85,215
shares). Datalogic will make the residual payment, equal to €2 million, within 2021.
Since the acquisition is a business combination, the Group has recognised it using the purchase method,
pursuant to the revised IFRS 3.
The ancillary costs borne, although directly attributable to the business combination, pursuant to IFRS 3
revised, were not considered as part of the acquisition cost but fully recognised in the Income Statement.
The preliminary goodwill emerging from this transaction amounted to €7.9 million. It is worth noting that the
initial recognition of the business combination, recorded in the third quarter, was temporarily determined as
the fair values of assets, liabilities or contingent liabilities and the cost of business combinations were
determined in a non-final way. As envisaged by IFRS 3, any possible adjustments will be recognised within
12 months from the acquisition date.

Datalogic Group
Consolidated Financial Statements as at 31.12.2017 - Explanatory Notes 63
INFORMATION ON THE STATEMENT OF FINANCIAL POSITION
ASSETS
Note 1. Tangible assets
Details of movements as at 31 December 2017 and 31 December 2016 are as follows:
31.12.2017 31.12.2016 Change
Land 7,719 8,218 (499)
Buildings 29,369 31,014 (1,645)
Other assets 30,495 30,175 320
Assets in progress and payments on account 2,150 2,675 (525)
Total 69,733 72,082 (2,349)
Details of movements as at 31 December 2016 and 31 December 2017 are as follows:
Land Buildings Other assets
Assets in progress and payments on
account
Total
Historical cost 5,763 37,351 124,223 2,293 169,630
Accumulated depreciation 0 (5,052) (96,194) 0 (101,246)
Net initial value as at 01.01.2016 5,763 32,299 28,029 2,293 68,384
Increases - 31.12.2016
Investments 2,495 1,439 6,441 2,635 13,010
Total 2,495 1,439 6,441 2,635 13,010
Decreases - 31.12.2016
Disposals, historical cost (6,163) (6) (6,169)
Write-downs 0
Disposals, accum. depreciation 5,939 5,939
Write-down 0
Depreciation (621) (8,742) (9,363)
Total 0 (621) (8,966) (6) (9,593)
Reclass. & other changes 31.12.2016
Incoming transfers at historical cost (2,205) 4,794 (2,284) 305
(outgoing transfers, accum. depreciation) 102 (518) (416)
Exchange diff. in historical cost (40) (8) 1,514 37 1,503
Exchange diff. in accum. depreciation 8 (1,119) (1,111)
Total (40) (2,103) 4,671 (2,247) 281
Historical cost 8,218 36,577 130,809 2,675 178,279
Accumulated depreciation 0 (5,563) (100,634) 0 (106,197)
Net value as at 31.12.2016 8,218 31,014 30,175 2,675 72,082

Datalogic Group
Consolidated Financial Statements as at 31.12.2017 - Explanatory Notes 64
Land Buildings Other assets
Assets in progress and payments on
account
Total
Historical cost 8,218 36,577 130,809 2,675 178,279
Accumulated depreciation 0 (5,563) (100,634) 0 (106,197)
Net initial value as at 01.01.2017 8,218 31,014 30,175 2,675 72,082
Increases - 31.12.2017
Investments 6 188 9,801 1,279 11,274
Acquisitions 318 318
Total 6 188 10,119 1,279 11,592
Decreases - 31.12.2017
Disposals, historical cost (131) (1,417) (1,216) (2) (2,766)
Write-down (1,033) (1,033)
Disposals, accum. depreciation 683 1,012 1,695
Write-down 1,048 1,048
Depreciation (580) (9,708) (10,288)
Acquisitions (132) (132)
Total (131) (1,314) (10,029) (2) (11,476)
Reclass. & other changes 31.12.2017
Incoming transfers at historical cost 192 1,355 (1,661) (114)
(outgoing transfers, accum. depreciation) 113 113
Exchange diff. in historical cost (374) (908) (5,074) (141) (6,497)
Exchange diff. in accum. depreciation 197 3,836 4,033
Total (374) (519) 230 (1,802) (2,465)
Historical cost 7,719 34,632 134,960 2,150 179,461
Accumulated depreciation 0 (5,263) (104,465) 0 (109,728)
Net value as at 31.12.2017 7,719 29,369 30,495 2,150 69,733
The decrease in the items “Land” and “Buildings” relates mainly to the sale of the building belonging to
Datalogic Real Estate Germany GmbH (€127 thousand and €734 thousand, respectively), which generated a
loss of €43 thousand recognised in the income statement in the item “Other operating expenses”.
The “Other assets” item as at 31 December 2017 mainly includes the following categories: Industrial
equipment and moulds (€10,340 thousand), Plant and machinery (€8,937 thousand), Office furniture and
machines (€7,719 thousand), Maintenance on third-party assets (€1,034 thousand), General plants related
to buildings (€1,873 thousand), Motor vehicles (€86 thousand) and Commercial equipment and demo room
(€420 thousand).
The increase for this item (€9,801 thousand) is mainly due to the following:
- investments related to purchases of office furniture and machines (€3,671 thousand);
- investments for the building of plants and machinery (€2,431 thousand);
- investments for the building of industrial equipment and moulds (€3,020 thousand).

Datalogic Group
Consolidated Financial Statements as at 31.12.2017 - Explanatory Notes 65
The decrease in the item “Other assets” relates mainly to the depreciation expense for the period, the
impairment of improvements to third-party assets and equipment no longer used and the scrapping of assets
that are entirely depreciated and no longer used.
The balance of “Assets in progress and payments on account”, equal to €2,150 thousand, consists of €449
thousand for investments related to the enlargement of the plant in Hungary and, for the remaining portion,
to down payments for equipment, instruments and moulds for usual production activities.
Note 2. Intangible assets
Details of movements as at 31 December 2017 and 31 December 2016 are as follows:
31.12.2017 31.12.2016 Change
Goodwill 174,343 188,934 (14,591)
Development costs 3,863 4,302 (439)
Other 34,352 43,534 (9,182)
Assets in progress and payments on account 3,765 4,161 (396)
Total 216,323 240,931 (24,608)
Details of movements as at 31 December 2016 and 31 December 2017 are as follows:
Goodwill Development costs
Other
Assets in progress and payments on
account
Total
Historical cost 183,020 16,692 140,192 3,369 343,273
Accumulated amortisation 0 (11,343) (92,363) 0 (103,706)
Net initial value as at 01.01.2016 183,020 5,349 47,829 3,369 239,567
Increases - 31.12.2016
Investments 248 1,383 2,191 3,822
Total 0 248 1,383 2,191 3,822
Decreases - 31.12.2016
Disposals, historical cost 0 (362) (55) (417)
Disposals, accum. amortisation 331 331
Amortisation (2,089) (7,690) (9,779)
Write-downs 0
Total 0 (2,089) (7,721) (55) (9,865)
Reclass. & other changes 31.12.2016
Incoming transfers 696 766 1,462
(Outgoing transfers) (1,351) (1,351)
Exchange diff. in historical cost 5,914 262 3,441 7 9,624
Exchange diff. in accum. amortisation (164) (2,164) (2,328)
Total 5,914 794 2,043 (1,344) 7,407
Historical cost 188,934 17,898 145,420 4,161 356,413
Accumulated amortisation 0 (13,596) (101,886) 0 (115,482)
Net value as at 31.12.2016 188,934 4,302 43,534 4,161 240,931

Datalogic Group
Consolidated Financial Statements as at 31.12.2017 - Explanatory Notes 66
Goodwill Development
costs Other
Assets in progress and payments on
account
Total
Historical cost 188,934 17,898 145,420 4,161 356,413
Accumulated amortisation 0 (13,596) (101,886) 0 (115,482)
Net initial value as at 01.01.2017 188,934 4,302 43,534 4,161 240,931
Increases - 31.12.2017
Investments 7,941 301 2,234 1,823 12,299
Total 7,941 301 2,234 1,823 12,299
Decreases - 31.12.2017
Disposals, historical cost 0 (539) 0 (539)
Disposals, accum. amortisation 294 294
Amortisation (2,182) (7,109) (9,291)
Write-downs 68 68
Total 0 (2,182) (7,286) 0 (9,468)
Reclass. & other changes 31.12.2017
Incoming transfers 1,791 401 2,192
(Outgoing transfers) (2,192) (2,192)
Exchange diff. in historical cost (22,532) (970) (12,659) (27) (36,188)
Exchange diff. in accum. amortisation 621 8,128 8,749
Total (22,532) 1,442 (4,130) (2,219) (27,439)
Historical cost 174,343 19,020 134,925 3,765 332,053
Accumulated amortisation 0 (15,157) (100,573) 0 (115,730)
Net value as at 31.12.2017 174,343 3,863 34,352 3,765 216,323
“Goodwill”, totalling €174,343 thousand, consisted of the following items:
31.12.2017 31.12.2016 Change
CGU Datalogic 161,538 174,750 (13,212)
CGU Informatics 12,805 14,184 (1,379)
Total 174,343 188,934 (14,591)
The change in “Goodwill” by comparison with 31 December 2016 is attributable to:
- negative change, equal to €22,532 thousand, and related to translation differences, as most of the goodwill
is expressed in US Dollars;
- positive change, equal to €7,941 thousand, for the preliminary allocation to goodwill of the portion of price
related to the company Soredi Touch Systems GmbH and not directly attributable to the fair value of assets
and liabilities, but to expectations to obtain a positive contribution in terms of cash flow for an indefinite
period. The initial recognition of this business combination was temporarily determined pursuant to IFRS 3,
that envisages a period of 12 months during which the measured preliminary amounts can be adjusted.
Goodwill has been allocated to the CGUs (Cash Generating Units) corresponding to the individual
companies and/or sub-groups to which they pertain. It should be noted that the format of the CGU related to
Goodwill was reviewed according to the new organisational structure that the Group adopted as from 01

Datalogic Group
Consolidated Financial Statements as at 31.12.2017 - Explanatory Notes 67
January 2017. In particular, according to the corporate reorganisation, assets of ADC (Automatic Data
Capture) and IA (Industrial Automation) Divisions were transferred to one single business organisation, on
which the corporate business plans are based (Datalogic CGU). The redetermination of CGUs led to no
reallocation of Goodwill.
The estimated recoverable value of each CGU, associated with each goodwill item measured, consists of its
corresponding value in use.
Value in use is calculated by discounting the future cash flows generated by the CGU – during production
and at the time of its retirement – to present value using a certain discount rate, based on the Discounted
Cash Flow method.
The cash flows of the individual CGUs have been taken from their respective 2018 Budgets and forward-
looking plans prepared by Management. These plans represent the best estimate of foreseeable operating
performance, based on business strategies and growth indicators in the sector to which the Group belongs
and in its reference markets.
The assumptions used for the purposes of impairment, and the consequent results, were approved by the
Board of Directors and the Audit and Risk Management Committee, Remuneration and Appointments
Committee of Datalogic S.p.A., as well as by the Board of Directors of each company, for the related
Goodwill on 04 February 2018.
Based on use of an Unlevered approach, Unlevered Free Cash Flows from Operations (FCFO) have been
used, through the discounted cash flow method, as detailed below:
= EBIT
- taxes on EBIT
= NOPLAT (Net operating profit after taxes)
+ depreciation and amortisation
- Capital expenditures
+/- Change in provisions
+/- Change in working capital
+/- Change in other assets – liabilities
= Unlevered free cash flows from operations (FCFO)
To expected flows for the period 2018-2022, which are explicitly forecast, the flow relating to Perpetuity –
representing Terminal value – is added.
This is calculated using a long-term growth rate (G) of 1%, which represents the long-term expectations for
the industrial sector to which we belong.
The discount rate, consisting of the weighted average cost of invested capital (WACC), is estimated before
tax and based on the financial structure of the sector to which the Datalogic Group belongs.
The WACC used – ranging from 8.82% to 9.71% depending on the Goodwill measured – reflects the return
opportunity for all capital contributions, for whichever reason they are made.
In the table below we provide the Goodwill defined according to the new structure of the operating sectors,
effective as from 01 January 2017, following the corporate reorganisation described in the Segment

Datalogic Group
Consolidated Financial Statements as at 31.12.2017 - Explanatory Notes 68
Disclosure, and the breakdown of the growth assumptions made in the forecast plans and the discount rates
used:
CGU Datalogic Informatics
Goodwill at acquisition date 161,538 12,805
Weighted average cost of capital (WACC) 9.71% 8.82%
Long-term growth rate (G) 1% 1%
DATALOGIC CGU
Goodwill attributed to CGU Datalogic results from the following acquisitions:
PSC Group, occurred in 2005
EVO Inc. occurred in 2010
IDWARE S.r.l. occurred in 1998
Gruppo Laservall occurred in 2004
INFRA S.r.l., occurred in 2004
PPT Vision Inc., occurred in 2011
Accu-Sort Systems Inc., occurred in 2012
Soredi Touch System GmbH, occurred in 2017
The recoverable value of the Datalogic CGU was determined based on the calculation of the value in use, in
which projected cash flows, resulting from the plan approved by the Board of Directors, have been used.
The discount rate before taxes applied to projected cash flows is 9.71% (2016: 9.88%%) and cash flows over
five years have been inferred based on 1% growth rate (in line with 2016), which is prudentially lower than
the growth rate expected in reference markets.
During testing for impairment, goodwill of Datalogic CGU confirmed its book value.
Informatics CGU
Goodwill attributed to the Informatics CGU results from the acquisition of Informatics Inc. in 2005. The
recoverable value of the Informatics CGU was determined based on the calculation of the value in use, in
which projected cash flows, resulting from the plan approved by the Board of Directors, have been used. The
discount rate before taxes applied to projected cash flows is 8.82% (2016: 9.72%%) and cash flows over five
years have been inferred based on 1% growth rate (in line with 2016), which is prudentially lower than the
growth rate expected in reference markets. During testing for impairment, goodwill of Informatics CGU
confirmed its book value.

Datalogic Group
Consolidated Financial Statements as at 31.12.2017 - Explanatory Notes 69
Sensitivity to changes in assumptions
The calculation of value in use for selected CGUs is related to the following assumptions:
- Gross profit;
- Discount rates;
- Growth rate used to calculate cash flows after the forecast period.
Gross profit – Gross profit is based on the average of amounts obtained in years before the beginning of
the budget period. These values are increased in the budget period, in relation to improvements to efficiency.
A decrease in demand might lead to a reduction in gross profit, and related decrease in value.
Discount rates – Discount rates reflect the market estimate of risks specific to each CGU, taking account of
the time value of money and the risks specific to underlying assets, which are not already included in the
cash flow estimates. The calculation of the discount rate is based on the Group specific circumstance and its
operating sectors, and it results from its weighted average cost of the capital (WACC).
Estimates of growth rates – The rates are based on sector studies published. The Management
acknowledges that the rapidity in technological development and the possible entry of new actors in the
market may have a significant impact on the growth rate.
As regards the measurement of the value in use of the aforementioned CGUs, the management deems that
a change in the previous key assumptions so that a carrying value of the units would be lower than their
recoverable value would not reasonably occur, also by reason of the fact that the differentials between the
recoverable values of CGUs and the corresponding carrying values are highly positive as at 31 December
2017, especially for the Datalogic CGU.
There is no external indicator to justify a loss in value of consolidated assets, either belonging to the CGUs
used for testing impairment or represented by the residual portion of assets, that is the facilities belonging to
Datalogic S.p.A., whose book value is lower than the fair value resulting from current market prices.
“Development costs”, which amount to €3,863 thousand, consist of specific development projects
capitalised when they meet IAS 38 requirements and in compliance with Group policies, which call for the
capitalisation only of projects relating to the development of products featuring significant innovation.
The change in “Development costs” by comparison with 31 December 2016 is attributable to:
⁻ negative change, equal to €2,182 thousand, for amortisation/depreciation for the period,
⁻ negative change, equal to €349 thousand, for translation differences;
⁻ positive change, equal to €2,092 thousand, for the recognition of two projects concluded during 2017
and previously recorded under assets in progress.
The “Other” item, amounting to €34,352 thousand, consists primarily of intangible assets acquired through
business combinations carried out by the Group, which are specifically identified and valued in the context of
purchase accounting. Details are shown in the following table:

Datalogic Group
Consolidated Financial Statements as at 31.12.2017 - Explanatory Notes 70
31.12.2017 31.12.2016 Useful
life
Acquisition of the PSC group (on 30 November 2006) 13,495 17,273
PATENTS 13,495 17,273 20
Acquisition of Evolution Robotics Retail Inc. (on 01 July 2010) 1,460 2,326
PATENTS 243 388 10
TRADE SECRETS 1,217 1,938 10
Acquisition of Accu-Sort Inc. (on 20 January 2012) 9,756 13,675
PATENTS 5,770 8,088 10
TRADE SECRETS 3,986 5,587 10
Licence agreement 3,729 4,796 5-15
Other 5,912 5,464
TOTAL OTHER INTANGIBLE ASSETS 34,352 43,534
The “Other” item mainly consists of software licenses and includes the Soredi trademark (€360 thousand, net
of amortisation).
The “Assets in progress and payments on account” item, equal to €3,765 thousand, is attributable, in the
amount of €3,111 thousand, to the capitalisation of costs relating to the R&D projects with the features
required by IAS 38 and currently still underway, as well as, in the amount of €654 thousand, to software
implementations that are not yet completed.

Datalogic Group
Consolidated Financial Statements as at 31.12.2017 - Explanatory Notes 71
Note 3. Equity investments in associates
Equity investments owned by the Group as at 31 December 2017 were as follows:
31.12.2016 Increases Decreases Diff.
gains/(losses) on
transfers Share of
profit 31.12.2017
Laservall Asia CO. Ltd 1,588 (566) (1,021) (1) 0
CAEN RFID Srl 550 550
Suzhou Mobilead Electronic Technology Co., Ltd.
(112) 1,520 1,408
R4I 150 150
Datalogic Automation AB 2 2
Specialvideo Srl 29 29
Datasensor GMBH 45 45
TOTAL 2,214 150 (566) (112) 499 (1) 2,184
On 24 October 2017, the agreement was signed for the transfer of shares held in the company Laservall
Asia Co. Ltd. for the amount of €1.4 million. The sale will be carried out in three tranches, ending on 01 April
2018. As at 31 December 2017, the equity investments related to the first tranche were decreased and fair
value related to the remaining portion of equity investments was restated under item “Held-for-sale assets”.
The acquisition of 25% of the company Suzhou Mobilead Electronic Technology Co., Ltd. was completed in
the first quarter of the year. This resulted in the transfer to the item in question of the payment made, on 9
November 2016, for the future share capital increase and recorded in “Equity investments in other
companies”, and of the amount recorded, on 31 December 2016, in the item “Loans”.
On 15 November 2017, Datalogic S.p.A. acquired 20% of the company R4I (acronym of Research for
Innovation), an innovative SME in Benevento (Italy), specialised in the development of solutions based on
the RFIS (Radiofrequency Identification) technology.

Datalogic Group
Consolidated Financial Statements as at 31.12.2017 - Explanatory Notes 72
Note 4. Financial instruments by category
The financial statement items coming within the scope of “Financial instruments” as defined by IAS/IFRSs as
at 31 December 2016 and 31 December 2017 are as follows:
Loans and
receivables
Financial assets at fair value charged to the
Income Statement
Available for sale
Total
Non-current financial assets 3,504 31,007 4,714 39,225
Financial assets - Equity investments (5) 4,714 4,714
Financial assets - Securities
0
Financial assets - Loans 1,110
1,110
Financial assets - Other
31,007
31,007
Other receivables (7) 2,394 2,394
Current financial assets 237,441 0 0 237,441
Trade receivables from third parties (7) 74,490 74,490
Other receivables from third parties (7) 15,974 15,974
Financial assets - Other (5) 0 0
Financial assets - Securities (5) 0 0
Cash and cash equivalents (10) 146,977 146,977
TOTAL 240,945 31,007 4,714 276,666
Loans and
receivables
Financial assets at fair value charged to the
Income Statement
Available for sale
Total
Non-current financial assets 2,194 31,444 9,573 43,211
Financial assets - Equity investments (5) 9,573 9,573
Financial assets - Securities
0
Financial assets - Loans
0
Financial assets - Other
31,444
31,444
Other receivables (7) 2,194 2,194
Current financial assets 357,642 0 0 357,642
Trade receivables from third parties (7) 82,402 82,402
Other receivables from third parties (7) 19,028 19,028
Financial assets - Other (5) 0
Financial assets - Securities (5) 0
Cash and cash equivalents (10) 256,212 256,212
TOTAL 359,836 31,444 9,573 400,853
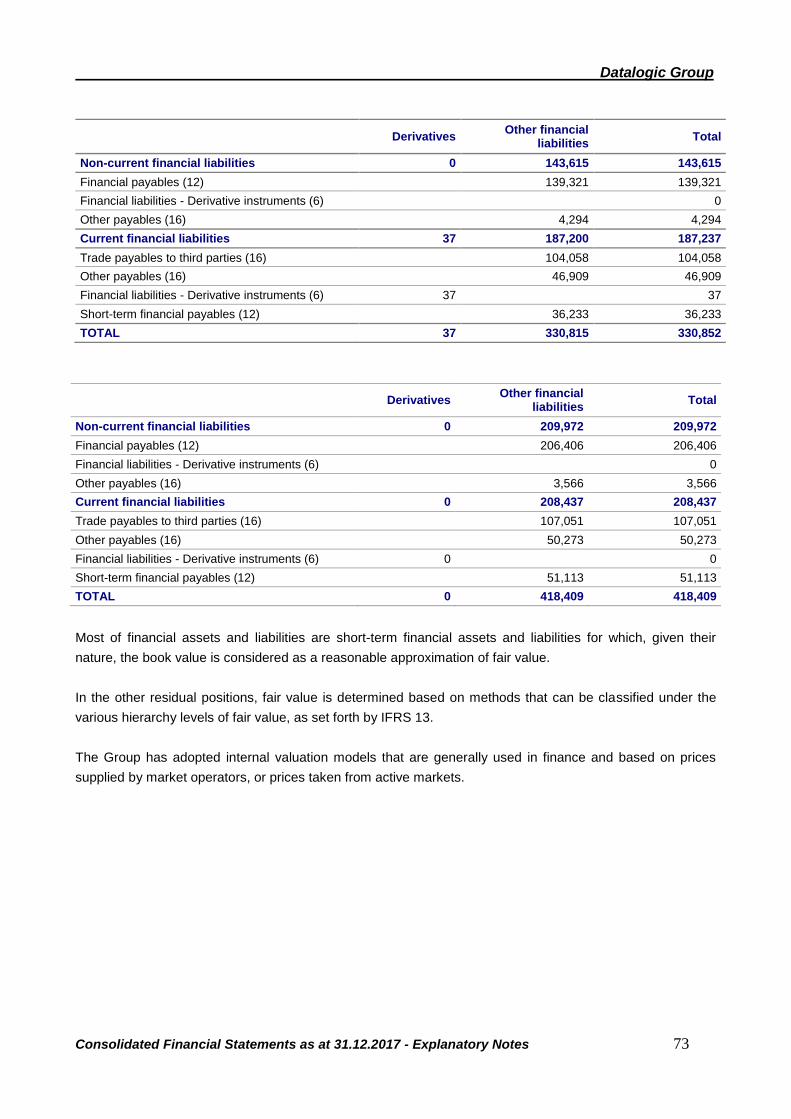
Datalogic Group
Consolidated Financial Statements as at 31.12.2017 - Explanatory Notes 73
Derivatives
Other financial liabilities
Total
Non-current financial liabilities 0 143,615 143,615
Financial payables (12) 139,321 139,321
Financial liabilities - Derivative instruments (6) 0
Other payables (16) 4,294 4,294
Current financial liabilities 37 187,200 187,237
Trade payables to third parties (16) 104,058 104,058
Other payables (16) 46,909 46,909
Financial liabilities - Derivative instruments (6) 37 37
Short-term financial payables (12) 36,233 36,233
TOTAL 37 330,815 330,852
Derivatives Other financial
liabilities Total
Non-current financial liabilities 0 209,972 209,972
Financial payables (12) 206,406 206,406
Financial liabilities - Derivative instruments (6) 0
Other payables (16) 3,566 3,566
Current financial liabilities 0 208,437 208,437
Trade payables to third parties (16) 107,051 107,051
Other payables (16) 50,273 50,273
Financial liabilities - Derivative instruments (6) 0 0
Short-term financial payables (12) 51,113 51,113
TOTAL 0 418,409 418,409
Most of financial assets and liabilities are short-term financial assets and liabilities for which, given their
nature, the book value is considered as a reasonable approximation of fair value.
In the other residual positions, fair value is determined based on methods that can be classified under the
various hierarchy levels of fair value, as set forth by IFRS 13.
The Group has adopted internal valuation models that are generally used in finance and based on prices
supplied by market operators, or prices taken from active markets.

Datalogic Group
Consolidated Financial Statements as at 31.12.2017 - Explanatory Notes 74
Fair value – hierarchy
All the financial instruments measured at fair value are classified in the three categories defined below:
Level 1: market prices;
Level 2: valuation techniques (based on observable market data);
Level 3: valuation techniques (not based on observable market data).
Level 1 Level 2 Level 3 Total
Assets measured at fair value
Financial assets - Equity investments (5) 9,496 77 9,573
Financial assets - LT securities (5) 0 0
Financial assets - Other LTs (5) 9,964 21,480 31,444
Financial assets - Other (5) 0
Financial assets - Loans 0
Financial assets - ST Derivative instruments (6) 0
Total Assets measured at fair value 19,460 21,480 77 41,017
Liabilities measured at fair value 0
Financial liabilities - LT derivative instruments (6)
0
Financial liabilities - ST derivative instruments (6) 0 0
Total Liabilities measured at fair value 0 0 0 0
Note 5. Available-for-sale financial assets and Loans
Available-for-sale financial assets include the following items:
31.12.2017 31.12.2016 Change
Other equity investments 9,573 4,714 4,859
Other financial assets 31,444 31,007 437
Total Other long-term financial assets 41,017 35,721 5,296
Long-term loans 0 1,110 (1,110)
Total Financial assets 41,017 36,831 4,186
The "Other financial assets" item consists of an investment of corporate liquidity in two insurance policies
subscribed in May and July 2014, and a mutual investment fund subscribed in August 2015.
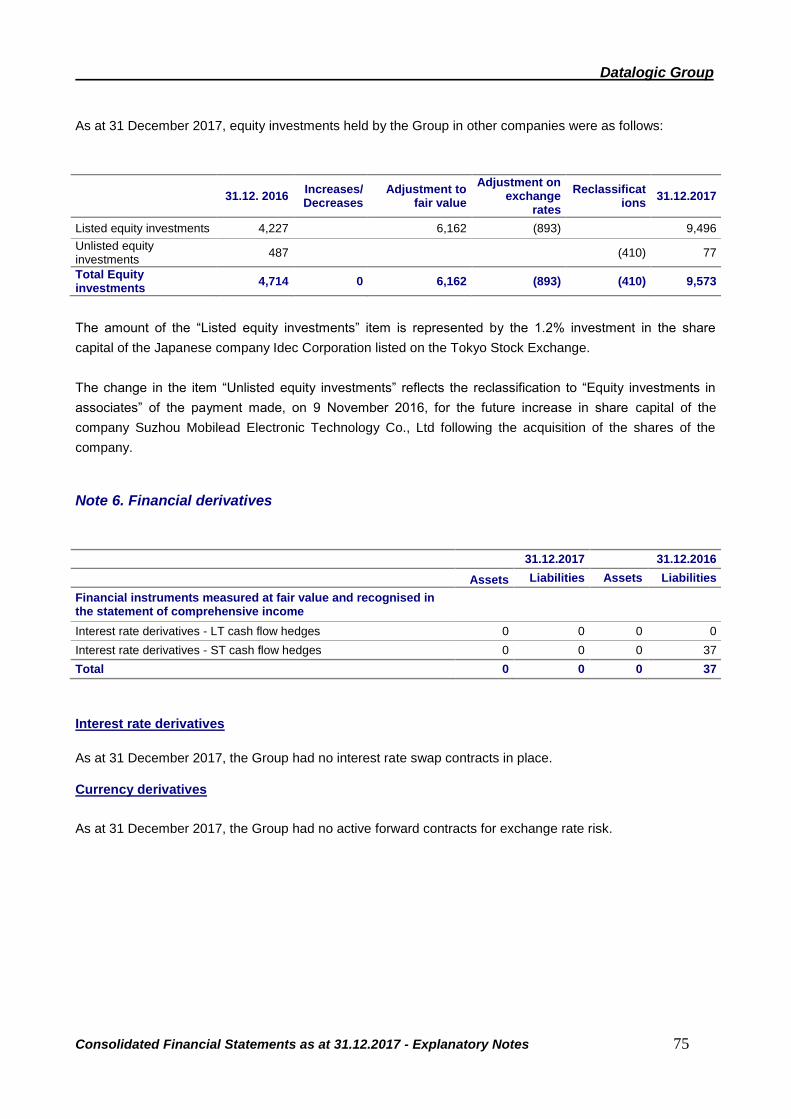
Datalogic Group
Consolidated Financial Statements as at 31.12.2017 - Explanatory Notes 75
As at 31 December 2017, equity investments held by the Group in other companies were as follows:
31.12. 2016 Increases/Decreases
Adjustment to fair value
Adjustment on exchange
rates
Reclassifications
31.12.2017
Listed equity investments 4,227 6,162 (893) 9,496
Unlisted equity investments
487
(410) 77
Total Equity investments
4,714 0 6,162 (893) (410) 9,573
The amount of the “Listed equity investments” item is represented by the 1.2% investment in the share
capital of the Japanese company Idec Corporation listed on the Tokyo Stock Exchange.
The change in the item “Unlisted equity investments” reflects the reclassification to “Equity investments in
associates” of the payment made, on 9 November 2016, for the future increase in share capital of the
company Suzhou Mobilead Electronic Technology Co., Ltd following the acquisition of the shares of the
company.
Note 6. Financial derivatives
31.12.2017 31.12.2016
Assets Liabilities Assets Liabilities
Financial instruments measured at fair value and recognised in the statement of comprehensive income
Interest rate derivatives - LT cash flow hedges 0 0 0 0
Interest rate derivatives - ST cash flow hedges 0 0 0 37
Total 0 0 0 37
Interest rate derivatives
As at 31 December 2017, the Group had no interest rate swap contracts in place.
Currency derivatives
As at 31 December 2017, the Group had no active forward contracts for exchange rate risk.

Datalogic Group
Consolidated Financial Statements as at 31.12.2017 - Explanatory Notes 76
Note 7. Trade and other receivables
Trade and other receivables
31.12.2017 31.12.2016 Change
Third-party trade receivables 83,579 75,914 7,665
Less bad debt provisions 1,177 1,424 (247)
Net third-party trade receivables 82,402 74,490 7,912
Receivables from associates 784 979 (195)
Laservall Asia 3 0 3
Datasensor GMBH 83 54 29
Specialvideo 0 2 (2)
Datalogic Automation AB 698 923 (225)
Trade receivables from related parties 9 8 1
Total Trade receivables 83,195 75,477 7,718
Other receivables - current accrued income and prepaid expenses 19,691 16,049 3,642
Other receivables - non-current accrued income and prepaid expenses 2,194 2,394 (200)
Total Other receivables - accrued income and prepaid expenses 21,885 18,443 3,442
Less non-current portion 2,194 2,394 (200)
Trade and other receivables - current portion 102,886 91,526 11,360
Trade receivables
“Trade receivables”, totalling €83,195 thousand as at 31 December 2017, included €831 thousand resulting
from the first consolidation of the company Soredi Touch Systems GmbH.
As at 31 December 2017, factored Trade accounts receivables amounted to €33,377 thousand (compared to
€29,193 thousand at the end of 2016).
Trade receivables from affiliates arise from commercial transactions carried out at arm’s length conditions.
As at 31 December 2017, the breakdown of the item by maturity terms, compared with the same period of
the previous year, was as follows:
31.12.2017 31.12.2016
Not yet due 73,782 64,909
Past due by 30 days 5,902 7,571
Past due by 31 - 90 days 2,325 1,296
Past due by more than 90 days 393 714
Total 82,402 74,490
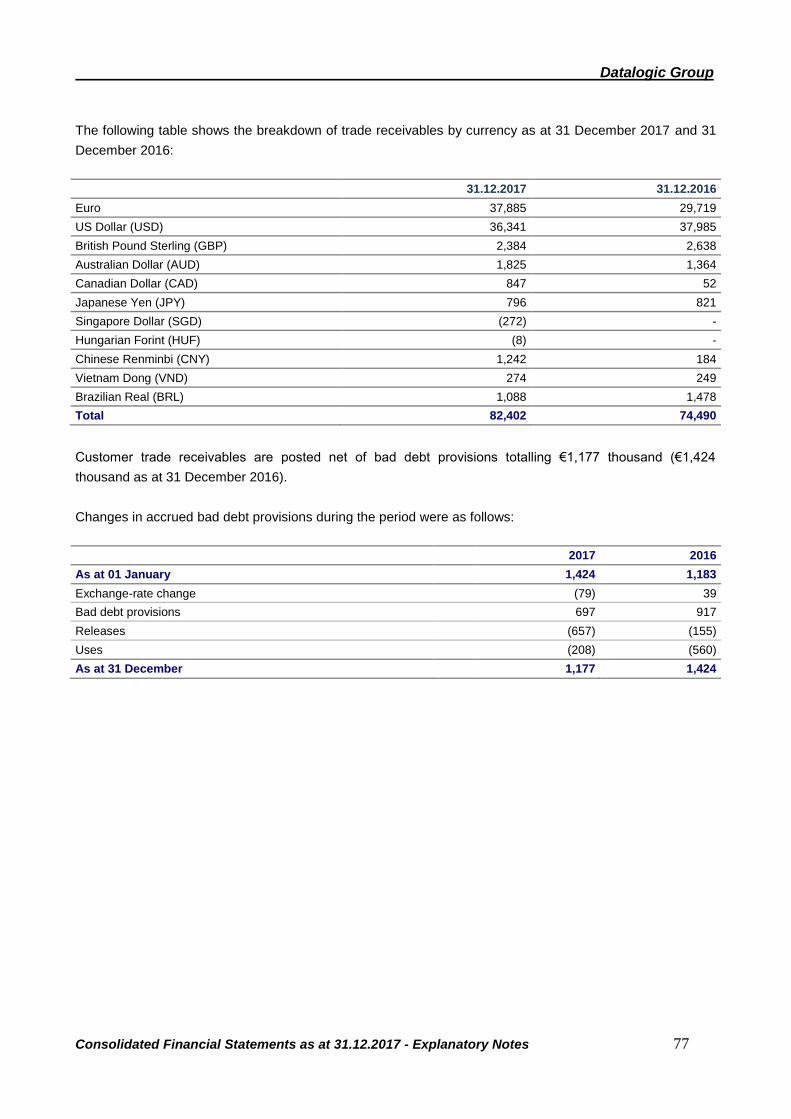
Datalogic Group
Consolidated Financial Statements as at 31.12.2017 - Explanatory Notes 77
The following table shows the breakdown of trade receivables by currency as at 31 December 2017 and 31
December 2016:
31.12.2017 31.12.2016
Euro 37,885 29,719
US Dollar (USD) 36,341 37,985
British Pound Sterling (GBP) 2,384 2,638
Australian Dollar (AUD) 1,825 1,364
Canadian Dollar (CAD) 847 52
Japanese Yen (JPY) 796 821
Singapore Dollar (SGD) (272) -
Hungarian Forint (HUF) (8) -
Chinese Renminbi (CNY) 1,242 184
Vietnam Dong (VND) 274 249
Brazilian Real (BRL) 1,088 1,478
Total 82,402 74,490
Customer trade receivables are posted net of bad debt provisions totalling €1,177 thousand (€1,424
thousand as at 31 December 2016).
Changes in accrued bad debt provisions during the period were as follows:
2017 2016
As at 01 January 1,424 1,183
Exchange-rate change (79) 39
Bad debt provisions 697 917
Releases (657) (155)
Uses (208) (560)
As at 31 December 1,177 1,424

Datalogic Group
Consolidated Financial Statements as at 31.12.2017 - Explanatory Notes 78
Other receivables - accrued income and prepaid expenses
The detail of the item “Other receivables - accrued income and prepaid expenses” is as shown below:
31.12.2017 31.12.2016 Change
Other short-term receivables 1,755 1,778 (23)
Other long-term receivables 2,194 2,394 (200)
VAT receivables 14,870 11,615 3,255
Accrued income and prepaid expenses 3,066 2,656 410
Total 21,885 18,443 3,442
The “Accrued income and prepaid expenses” item is mainly composed of prepaid expenses related to
insurance and Hardware and Software instalments.
Note 8. Inventories
31.12.2017 31.12.2016 Change
Raw and ancillary materials and consumables 33,101 29,954 3,147
Work in progress and semi-finished products 25,417 25,883 (466)
Finished products and goods 27,420 26,507 913
Total 85,938 82,344 3,594
The contribution to “Raw and ancillary materials and consumables”, resulting from the first consolidation of
the company Soredi Touch Systems GmbH, amounted to €1,737 thousand.
Inventories are shown net of an obsolescence provision that, as at 31 December 2017, amounted to €9,605
thousand (€9,325 thousand as at 31 December 2016). The movements of this provision as at 31 December
of each year are shown hereunder:
2017 2016
01 January 9,325 7,167
Exchange-rate change (679) 184
Allocations 4,618 3,225
Release for scrap and other utilisations (3,659) (1,251)
31 December 9,605 9,325

Datalogic Group
Consolidated Financial Statements as at 31.12.2017 - Explanatory Notes 79
Note 9. Tax payables and receivables
As at 31 December 2017, “Tax receivables” amounted to €11,430 thousand, down by €6,705 thousand
(€18,135 thousand as at 31 December 2016). The receivables for IRES tax from the parent company Hydra,
equal to €6,771 thousand (€8,010 thousand as at 31 December 2016) are classified under this item. This
amount is due under tax consolidation.
As at 31 December 2017, “Tax payables” amounted to €14,191 thousand, down by €6,841 thousand
(€21,032 thousand as at 31 December 2016). The amount payable to the parent company Hydra for IRES
tax, due under tax consolidation, is classified in this item and amounted to €4,865 thousand (€15,114
thousand as at 31 December 2016).
Note 10. Cash and cash equivalents
Cash and cash equivalents are broken down as follows:
31.12.2017 31.12.2016 Change
Cash and cash equivalents shown on financial statements 256,212 146,977 109,235
Restricted cash (11) (47) 36
Current account overdrafts (92) (212) 120
Cash and cash equivalents for statement 256,109 146,718 109,391

Datalogic Group
Consolidated Financial Statements as at 31.12.2017 - Explanatory Notes 80
According to the requirements of Consob Communication no. 15519 of 28 July 2006, the Group’s financial
position is reported in the following table:
31.12.2017 31.12.2016 change
A. Cash and bank deposits 256,201 146,930 109,271
B. Other cash and cash equivalents 11 47 (36)
b1. restricted cash deposit 11 47 (36)
C. Securities held for trading 0 0 0
c1. Short-term 0 0 0
c2. Long-term 0 0
D. Cash and cash equivalents (A) + (B) + (C) 256,212 146,977 109,235
E. Current financial receivables 0 0 0
F. Other current financial receivables 0 0 0
f1. hedging transactions 0 0 0
G. Bank overdrafts 92 212 (120)
H. Current portion of non-current debt 48,108 30,180 17,928
I. Other current financial payables 2,913 5,878 (2,965)
i1. hedging transactions 0 37 (37)
i2. payables for leasing 0 248 (248)
i3. current financial payables 2,913 5,593 (2,680)
J. Current Financial Debt, Net/(Current Net Financial Position) (G) + (H) +(I)
51,113 36,270 14,843
K. Current Financial Debt, Net/(Current Net Financial Position) (J) - (D) - (E) - (F)
(205,099) (110,707) (94,392)
L. Non-current bank borrowing 205,656 139,321 66,335
M. Other financial assets (*) 31,444 32,117 (673)
N. Other non-current liabilities 750 0 750
n1. hedging transactions 0 0 0
n2. lease payables 0 0 0
n3. non-current financial payables 750 0 750
O. Non-current Financial Debt (L) - (M) + (N) 174,962 107,204 67,758
P. Net Financial Debt/(Net Financial Position) (K) + (O) (30,137) (3,503) (26,634)
(*) The "Other financial assets" item consists of an investment of corporate liquidity in two insurance policies
and a mutual investment fund that are readily convertible into cash.
Net Financial Position as at 31 December 2017 was positive by €30,137 thousand, an improvement of
€26,634 thousand compared to 31 December 2016 (positive by €3,503 thousand).
The change, compared to 31 December 2016, was mainly due to the payment of dividends, amounting to
€17.4 million, to the acquisition of the company Soredi Touch Systems GmbH, occurred on 6 July 2017,
which involved a decrease in Net Financial Position of around €8 million and to ordinary investments, net of
disinvestments, amounting to €14 million.

Datalogic Group
Consolidated Financial Statements as at 31.12.2017 - Explanatory Notes 81
INFORMATION ON STATEMENT OF FINANCIAL POSITION - SHAREHOLDERS’ EQUITY AND LIABILITIES
Note 11. Shareholders' Equity
The detail of equity accounts is shown below, while changes in equity are reported in the specific statement:
31.12.2017 31.12.2016
Share capital 30,392 30,392
Extraordinary share-cancellation reserve 2,813 2,813
Treasury shares held in portfolio 6,120 4,120
Treasury share reserve 2,026 2,821
Share premium reserve 106,940 106,145
Share capital and capital reserves 148,291 146,291
Cash-flow hedge reserve (948) (28)
Translation reserve 5,939 25,436
Reserve for exchange rate adjustment 4,500 17,290
Actuarial gains/(losses) reserve (371) (371)
Held-for-sale financial assets reserve 5,695 490
Other reserves 14,815 42,817
Retained earnings 129,843 101,440
Earnings carried forward 114,189 85,721
Capital contribution reserve 958 958
Legal reserve 6,078 6,078
IAS reserve 8,618 8,683
Profit for the year 60,080 45,846
Total Group Shareholders’ Equity 353,029 336,394
Share capital
Movements in share capital as at 31 December 2016 and 31 December 2017 are reported below:
Number of shares
Share capital
Extraordinary share-
cancellation reserve
Treasury shares held in portfolio
Treasury share
reserve
Share premium
reserve
Total
01.01.2016 58,171,881 30,392 2,813 4,488 2,453 106,513 146,659
Purchase of treasury shares
(27,619) (367) 368 (368) (367)
Costs for the purchase/sale of treasury shares
(1) 0 (1)
31.12.2016 58,144,262 30,392 2,813 4,120 2,821 106,145 146,291
Number of shares
Share capital
Extraordinary share-
cancellation reserve
Treasury shares held in portfolio
Treasury share
reserve
Share premium
reserve
Total

Datalogic Group
Consolidated Financial Statements as at 31.12.2017 - Explanatory Notes 82
01.01.2017 58,144,262 30,392 2,813 4,120 2,821 106,145 146,291
Purchase of treasury shares 0 0 0 0
Sale of treasury shares 85,215 795 (795) 795 795
Capital gains/(capital losses) from the sale of treasury shares
1,205 1,205
Costs for the purchase/sale of treasury shares
0 0 0
31.12.2017 58,229,477 30,392 2,813 6,120 2,026 106,940 148,291
Extraordinary share-cancellation reserve
The Extraordinary Shareholders' Meeting of Datalogic S.p.A., held on 20 February 2008, approved a
reduction of share capital through the cancellation of 5,409,981 treasury shares (equal to 8.472% of the
share capital), owned by the Company.
When these shares were cancelled, as resolved by the Extraordinary Shareholders' Meeting, an
extraordinary share-cancellation reserve was set aside for the amount of €2,813 thousand, through the use
of the share premium reserve. Therefore, this reserve remained classified under item “Share Capital”.
Ordinary shares
As at 31 December 2017, the total number of ordinary shares was 58,446,491, including 217,014 held as
treasury shares, making the number of shares in circulation at that date 58,229,477. The shares have a
nominal unit value of €0.52 and are fully paid up.
Treasury shares
The item “Treasury shares”, amounting to €6,120 thousand, includes capital gains/(losses) resulting from the
sale of treasury shares, net of purchases and related charges (€8,146 thousand). During 2017, the Group
sold 85,215 thousand treasury shares, with a value of €2 million for the acquisition of the company Soredi
Touch Systems GmbH, with a capital gain of €1,205 thousand.
Other Reserves
Cash-flow hedge reserve
Pursuant to provisions set forth by IAS 39, the change in fair value of derivative contracts, designated as
effective hedging instruments, is recognised in accounts directly with Shareholders’ Equity, in the cash-flow
hedge reserve. These contracts were entered to hedge exposure to the risk of interest rate fluctuations on
variable-rate loans. The reserve, negative by €948 thousand, includes the fair value of the hedging
instrument related to refinancing.

Datalogic Group
Consolidated Financial Statements as at 31.12.2017 - Explanatory Notes 83
Translation reserve
In compliance with IAS 21, translation differences arising from translation of the foreign currency financial
statements of consolidated companies into the Group accounting currency are classified as a separate
equity component.
Reserve for exchange rate adjustment
In compliance with IAS 21.40, this reserve comprises profits/losses generated by monetary elements which
are an integral part of the net investment of foreign managements. In particular, it relates to the effect of
exchange rates measurement at year-end for receivables for loans in US dollars granted to some Group
companies by the Parent Company Datalogic S.p.A. and Datalogic USA Inc. For these loans no regulation
and/or defined reimbursement plan are provided, nor is it deemed probable that they will be reimbursed in
the foreseeable future.
Actuarial gains/(losses) reserve
Pursuant to IAS 19, this reserve includes actuarial gains and losses, which are now recognised under other
components in the Statement of Comprehensive Income and excluded from the Income Statement.
Retained earnings
IAS reserve
This reserve was created upon first-time adoption of international accounting standards as at 01 January
2004 (Consolidated Financial Statements for the year ended 31 December 2003) pursuant to IFRS 1.
Profits/losses of previous years
This item includes equity changes occurring in consolidated companies after acquisition date.
Dividends
On 4 May 2017, the Ordinary Shareholders’ Meeting of Datalogic S.p.A. decided to distribute an ordinary
dividend of €0.30 per share (€0.25 in 2016). The overall dividends began to be paid starting from 10 May
2017 and had been paid in full by 30 September.

Datalogic Group
Consolidated Financial Statements as at 31.12.2017 - Explanatory Notes 84
The reconciliation between the Parent Company’s Shareholders’ Equity and net profit and the corresponding
consolidated amounts is as shown below:
31 December 2017 31 December 2016
Total Equity
Period results Total Equity Period results
Parent Company shareholders’ equity and profit 291,639 25,592 291,677 52,334
Difference between consolidated companies' shareholders’ equity and their carrying value in the Parent Company's financial statements; effect of equity-based valuation
121,084 62,913 111,061 51,183
Elimination of dividends (30,428) (53,387)
Amortisation of intangible assets “business combination” (5,827) (5,827)
Effect of acquisition under common control (31,733) (31,733)
Elimination of capital gain on sale of business branch (17,067) 183 (18,665)
Effect of elimination on intercompany transactions (12,276) 1,769 (17,700) (4,231)
Elimination of write-downs and capital gains on equity investments
5,517 5,517 (604)
Sale of know-how (7) (7)
Goodwill impairment (1,395) (1,395)
Other (1,342) (137) (1,193) (61)
Deferred taxes 4,436 188 4,659 612
Group Shareholders' Equity 353,029 60,080 336,394 45,846
Note 12. Financial payables
The breakdown of the item, divided by short/long-term classification, is shown in the following table:
31.12.2017 31.12.2016 Change
Long-term financial payables 206,406 139,321 67,085
Short-term financial payables 51,113 36,233 14,880
Total financial payables 257,519 175,554 81,965
The breakdown of this item is as detailed below:
31.12.2017 31.12.2016 Change
Bank loans 253,764 169,501 84,263
Other 2,000 0 2,000
Payables to factoring companies 1,663 5,593 (3,930)
Payables for leasing 0 248 (248)
Bank overdrafts (ordinary current accounts) 92 212 (120)
Total financial payables 257,519 175,554 81,965

Datalogic Group
Consolidated Financial Statements as at 31.12.2017 - Explanatory Notes 85
The breakdown of changes in the “Bank loans” item as at 31 December 2017 and 31 December 2016 is
shown below:
31.12.2017 31.12.2016
01 January 169,501 172,612
Increases 249,249 29,840
Repayments (125,581) (20,000)
Decreases for loan repayments (39,405) (12,951)
31 December 253,764 169,501
On 13 April, Datalogic S.p.A. signed an agreement for a new credit line worth €250 million and maturing in
2023. The loan granted to Datalogic was partly intended for an early redemption, compared to the original
maturity, of the existing credit line (€126 million), and partly to support the ordinary activit ies and
development of the Group.
The transaction was concluded at a fixed rate, so as to allow Datalogic S.p.A. to take advantage of the
favourable interest rates currently available on the market and to lock in the cost of the Datalogic Group
funding over the coming years.
The “Others” item includes the financial debt related to the acquisition of the company Soredil Touch
Systems GmbH, which will be paid by 2021.

Datalogic Group
Consolidated Financial Statements as at 31.12.2017 - Explanatory Notes 86
The breakdown of the “Bank loans” item by maturity is as follows:
31.12.2017 31.12.2016
Variable rate 0 138,516
Due < 1 year 0 24,020
Due > 1 year 0 114,496
Fixed rate 253,764 30,985
Due < 1 year 48,108 6,161
Due > 1 year 184,699 24,669
Due > 5 year 20,957 155
Total financial payables 253,764 169,501
The breakdown of the “Bank loans” item by currency is as follows:
Currency 31.12.2017 31.12.2016
Euro 253,764 169,501
Total 253,764 169,501
Covenants
The companies have been asked to respect certain financial covenants for the following loans, on a semi-
annual or annual basis, as summarised in the table below:
Bank Company Currency Outstanding
debt Covenant Frequency
Reference statements
Club Deal 1 Datalogic SpA Eur 229,167,000 PFN /EBITDA
semi-annual
Datalogic Group
I.E.B. 2 Datalogic SpA Eur 24,000,000 EBITDA/OFN PFN /EBITDA
semi-annual
Datalogic Group
Key: PFN = Net Financial Position; OFN= Net Financial Expenses
As at 31 December 2017, all covenants were respected.
Financial leases
31 December 2017 31 December 2016
Minimum payments
Current value of payments
Minimum payments
Current value of payments
Within the year 254 248
After one year but within 5 years
> 5 years
Total minimum payments 0 0 254 248
Less interest expenses (6)
Current value of lease costs 0 0 248 248

Datalogic Group
Consolidated Financial Statements as at 31.12.2017 - Explanatory Notes 87
Note 13. Deferred taxes
Deferred tax assets and liabilities result both from temporary differences connected with positive and
negative items already recognised and subject to deferred taxation under current tax regulations and from
temporary differences between consolidated balance-sheet assets and liabilities and their taxable value.
Deferred tax assets and liabilities were determined by taking account current tax rates for years where it is
reasonably deemed that the related temporary differences would occur.
Deferred tax assets are accounted for based on future recoverability assumptions of temporary differences
that originated them, or based on economic and fiscal strategic plans.
Deferred tax assets were accounted for as at 31 December 2017 in the amount of €47,864 thousand, with a
decrease of €1,549 thousand compared to the previous year. The balance, at year end, includes:
⁻ an amount of €17,570 thousand related to deferred tax assets due to tax losses available and usable
to offset taxable income and taxes paid abroad on income gained there and that can be offset in
subsequent years;
⁻ an amount of €13,719 thousand related to temporary differences in charges accounted for on an
accrual basis, in compliance with International Accounting Standards and deductible in following
years, pursuant to regulations in force, including, but not limited to, allocations for guarantees,
incentives to employees, provision for inventories write-downs, etc.;
⁻ an amount of €9,782 thousand related to deferred tax assets due to unrealised exchange rate
differences.
With reference to deferred tax liabilities, equal to €23,138 thousand, a decrease of €3,360 thousand in the
year-end balance is reported. The main tax differences on the closing balance are related to unrealised
exchange rate differences, amounting to €9,755 thousand and differences in tax liabilities, amounting to
€7,709 thousand, accounted for business combination transactions occurred in previous years.
Below we show the main items forming deferred tax assets and deferred tax liabilities and changes in them
during the year.
Deferred tax assets Losses
and receivabl
es on taxes paid
abroad
Adjustment on
exchange rates
Amortisation/Depr
eciation
Asset
write-down
s
Allocations
Operations deriving
from acquisitio
ns
Other IP redemption
Consolidation
adjustments
Total
As at 01 January 2017 25,937 3,965 31 803 10,866 2,343 277 2,931 2,260 49,413
Provisioned in (released from) Income Statement
(5,565) 893 (48) 126 3,174 (215) 214 (1,580) 129 (2,872)
Provisioned in (released from) Shareholders’ Equity
4,583 4,583
Foreign exchange differences
(2,802) (163) 2 (1,040) (216) (2) (7) (4,228)
Reclassifications 504 376 (3) 719 (734) 113 (7) 968
As at 31 December 2017
17,570 9,782 361 926 13,719 1,178 602 1,351 2,375 47,864

Datalogic Group
Consolidated Financial Statements as at 31.12.2017 - Explanatory Notes 88
Deferred tax liabilities
Reserve for
prevision losses
Adjustment
on exchan
ge rates
Deprec. and
Amort.
Provisions
Operations deriving
from acquisitions
Other IAS Reserve
s
Consolidation
adjustments
Total
As at 01 January 2017
16 8,191 5,614 1,309 9,788 966 315 299 26,498
Provisioned in (released from) Income Statement
413 (2,873) (174) (1,025) 14 18 (3,627)
Provisioned in (released from) Shareholders’ Equity
635 (140) 140 635
Foreign exchange differences
(248) (35) (1,054) (1,337)
Reclassifications 516 295 15 143 969
As at 31 December 2017
16 9,755 2,648 1,115 7,709 1,123 315 457 23,138
Note 14. Post-employment benefits
The breakdown of changes in the “Post-employment benefits” item as at 31 December 2017 and 31
December 2016 is shown below:
2017 2016
01 January 6,647 6,814
Amount allocated in the period 1,735 1,599
Uses (613) (842)
Other movements 24 17
Social security receivables for the employee severance indemnity reserve
(1,161) (941)
31 December 6,633 6,647
Note 15. Provisions for risks and charges
The breakdown of the “Provisions for risks and charges” item was as follows:
31.12.2017 31.12.2016 Change
Short-term provisions for risks and charges 7,157 9,684 (2,527)
Long-term provisions for risks and charges 13,602 11,169 2,433
Total 20,759 20,853 (94)
The contribution to “Short-term provisions for risks and charges”, resulting from the first consolidation of the
company Soredi Touch Systems GmbH, amounted to €224 thousand.
Below we show the detailed breakdown of and changes in this item:

Datalogic Group
Consolidated Financial Statements as at 31.12.2017 - Explanatory Notes 89
31.12.2016 Increases (Uses)
and (Releases
)
Acquisition on transfers
Exchange rate
diff.
31.12.2017
Product warranty provision 11,486 1,154 (228) 114 (908) 11,618
Provision for management incentive scheme
3,322 3,254 (119) (193) 6,264
Stock rotation provision 3,325 37 (1,532) (166) 1,664
Other 2,720 1,010 (2,586) 110 (6) (35) 1,213
Total Provisions for risks and charges
20,853 5,455 (4,465) 224 (6) (1,302) 20,759
The “Product warranty provision” covers the estimated cost of repairing products sold up to 31 December
2017 and covered by periodical warranty. It amounts to €11,618 thousand (of which €6,920 thousand long-
term) and is considered sufficient in relation to the specific risk it covers.
The “Provision for management incentive scheme” is attributable to the long-term incentive plan for
directors and top managers.
The “Other” item mainly comprises:
€371 thousand for agent termination indemnities;
€423 thousand for transactions in progress with employees;
€162 thousand for contingent tax liabilities.
Note 16. Trade and other payables
This table shows the details of trade and other payables:
31.12.2017 31.12.2016 Change
Trade payables due within 12 months 107,051 104,058 2,993
Third-party trade payables 107,051 104,058 2,993
Payables to associates 347 24 323
Laservall Asia 7 14 (7)
R4I 61 0 61
Caen 277 0 277
Datalogic Automation AB 2 10 (8)
Payables to the parent company 0 106 (106)
Hydra 106 (106)
Payables to related parties 253 397 (144)
Total Trade payables 107,651 104,585 3,066
Other payables - current accrued liabilities and deferred income 50,273 46,909 3,364
Other payables - non-current accrued liabilities and deferred income 3,566 4,294 (728)
Total Other payables - accrued liabilities and deferred income 53,839 51,203 2,636
Less non-current portion 3,566 4,294 (728)
Current portion 157,924 151,494 6,430

Datalogic Group
Consolidated Financial Statements as at 31.12.2017 - Explanatory Notes 90
The contribution to “Trade payables”, resulting from the first consolidation of the company Soredi Touch
Systems GmbH, amounted to €810 thousand.
Other payables – accrued liabilities and deferred income
The detailed breakdown of this item is as follows:
31.12.2017 31.12.2016 Change
Other long-term payables 3,566 4,294 (728)
Other short-term payables: 25,849 23,115 2,734
Payables to employees 17,220 15,061 2,159
Payables to pension and social security agencies 6,021 5,005 1,016
Other payables 2,608 3,049 (441)
VAT liabilities 2,982 2,869 113
Accrued liabilities and deferred income 21,442 20,925 517
Total 53,839 51,203 2,636
Amounts payable to employees represent the amount due for salaries and vacations accrued by employees
as at the reporting date.
“Accrued liabilities and deferred income” are mainly composed of deferred income related to multi-annual
maintenance contracts.
The decrease in the item “Other payables” is attributable, in the amount of €505 thousand, to the payment of
debt relating to land purchased in December 2016.

Datalogic Group
91
INFORMATION ON THE INCOME STATEMENT
Note 17. Revenues
2017 2016 Change
Revenues from sale of products 572,736 545,821 26,915
Revenues from services 33,286 30,661 2,625
Total revenues 606,022 576,482 29,540
In 2017, the consolidated net revenues amounted to €606,022 thousand, an increase of 5.1% compared to
€576,482 thousand as at 31 December 2016 (+6% at constant Euro/Dollar exchange rate). Group revenues
include the best estimates related to discounts and returns granted to customers and pertaining to the year,
but not yet claimed, and amounting to €13,045 thousand.
The following table shows the breakdown of revenues per geographical areas:
2017 % 2016 % change %
Italy 58,944 9.7% 51,184 8.9% 7,760 15.2%
EMEA (except Italy) 268,562 44.3% 253,362 43.9% 15,200 6.0%
Total EMEA (*) 327,506 54.0% 304,546 52.8% 22,960 7.5%
North America 171,414 28.3% 178,269 30.9% (6,855) (3.8%)
Latin America 27,468 4.5% 30,032 5.2% (2,564) (8.5%)
Asia & Pacific (including China) 79,634 13.1% 63,635 11.0% 15,999 25.1%
Total revenues 606,022 100.0% 576,482 100.0% 29,540 5.1%
(*) EMEA: Europe, Middle East and Africa
Since 2017, data related to geographical areas will be disclosed to reflect the actual involvement of each
area within the new commercial organisation of the Group. Comparative data for 2016 will be disclosed
accordingly.
Note 18. Cost of goods sold and operating costs
2017 2016
Restated Change
TOTAL COST OF GOODS SOLD (1) 317,949 311,432 6,517
of which non-recurring 320 86 234
TOTAL OPERATING COSTS (2) 208,158 198,083 10,075
Research and Development expenses 55,561 50,542 5,019
of which non-recurring 183 16 167
of which amortisation, depreciation pertaining to acquisitions 103 105 (2)
Distribution expenses 99,703 97,789 1,914
of which non-recurring 2 333 (331)
General and administrative expenses 49,935 47,169 2,766
of which non-recurring 419 988 (569)
of which amortisation, depreciation pertaining to acquisitions 4,712 4,809 (97)
Other operating costs 2,959 2,583 376
of which non-recurring 0 (444) 444
TOTAL (1+2) 526,107 509,515 16,592
of which non-recurring costs 924 979 (55)
of which amortisation, depreciation pertaining to acquisitions 4,815 4,914 (99)
It should be noted that, since 2017, some costs have been reclassified under various items. Comparative data for 2016 have therefore
been disclosed accordingly. For details please refer to the Annex 1 to the annual Financial Report.
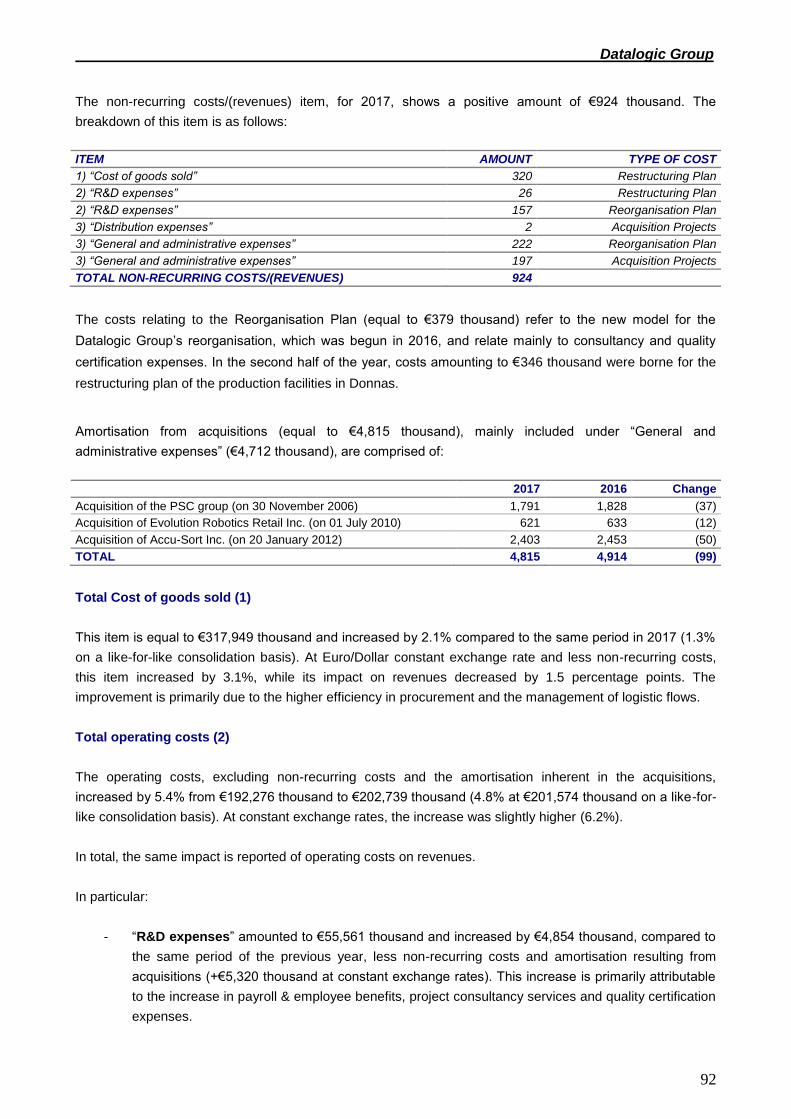
Datalogic Group
92
The non-recurring costs/(revenues) item, for 2017, shows a positive amount of €924 thousand. The
breakdown of this item is as follows:
ITEM AMOUNT TYPE OF COST
1) “Cost of goods sold” 320 Restructuring Plan
2) “R&D expenses” 26 Restructuring Plan
2) “R&D expenses” 157 Reorganisation Plan
3) “Distribution expenses” 2 Acquisition Projects
3) “General and administrative expenses” 222 Reorganisation Plan
3) “General and administrative expenses” 197 Acquisition Projects
TOTAL NON-RECURRING COSTS/(REVENUES) 924
The costs relating to the Reorganisation Plan (equal to €379 thousand) refer to the new model for the
Datalogic Group’s reorganisation, which was begun in 2016, and relate mainly to consultancy and quality
certification expenses. In the second half of the year, costs amounting to €346 thousand were borne for the
restructuring plan of the production facilities in Donnas.
Amortisation from acquisitions (equal to €4,815 thousand), mainly included under “General and
administrative expenses” (€4,712 thousand), are comprised of:
2017 2016 Change
Acquisition of the PSC group (on 30 November 2006) 1,791 1,828 (37)
Acquisition of Evolution Robotics Retail Inc. (on 01 July 2010) 621 633 (12)
Acquisition of Accu-Sort Inc. (on 20 January 2012) 2,403 2,453 (50)
TOTAL 4,815 4,914 (99)
Total Cost of goods sold (1)
This item is equal to €317,949 thousand and increased by 2.1% compared to the same period in 2017 (1.3%
on a like-for-like consolidation basis). At Euro/Dollar constant exchange rate and less non-recurring costs,
this item increased by 3.1%, while its impact on revenues decreased by 1.5 percentage points. The
improvement is primarily due to the higher efficiency in procurement and the management of logistic flows.
Total operating costs (2)
The operating costs, excluding non-recurring costs and the amortisation inherent in the acquisitions,
increased by 5.4% from €192,276 thousand to €202,739 thousand (4.8% at €201,574 thousand on a like-for-
like consolidation basis). At constant exchange rates, the increase was slightly higher (6.2%).
In total, the same impact is reported of operating costs on revenues.
In particular:
- “R&D expenses” amounted to €55,561 thousand and increased by €4,854 thousand, compared to
the same period of the previous year, less non-recurring costs and amortisation resulting from
acquisitions (+€5,320 thousand at constant exchange rates). This increase is primarily attributable
to the increase in payroll & employee benefits, project consultancy services and quality certification
expenses.
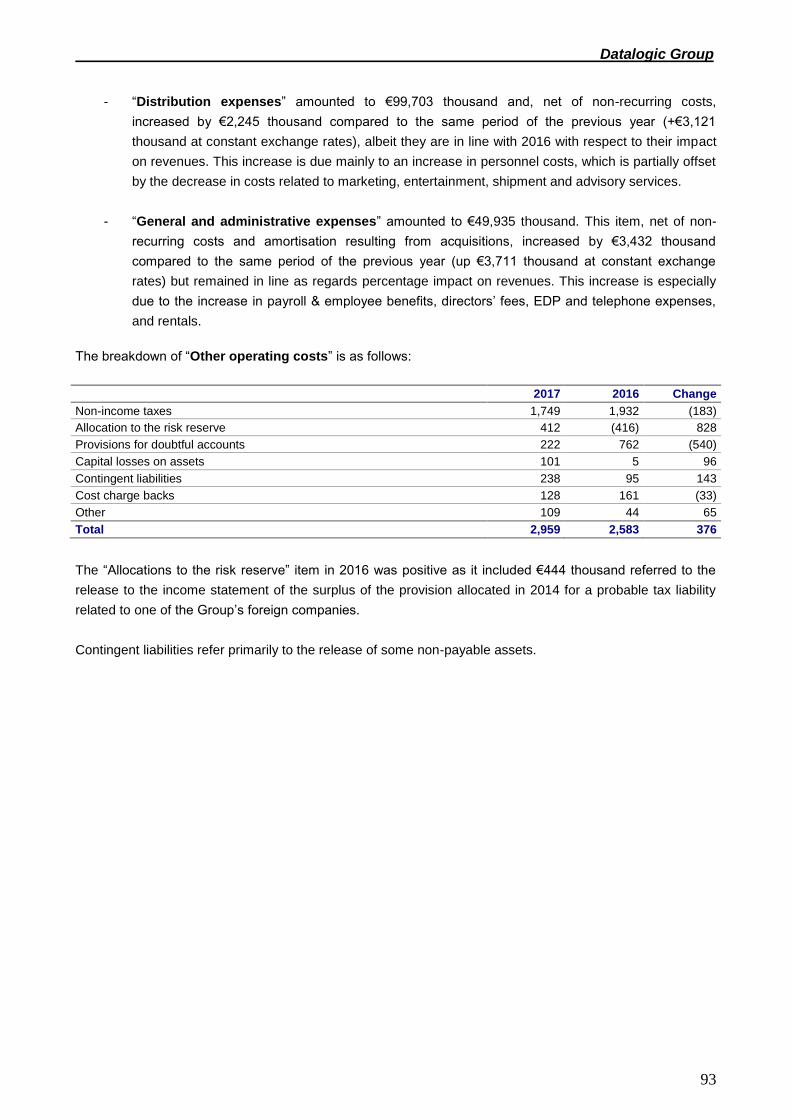
Datalogic Group
93
- “Distribution expenses” amounted to €99,703 thousand and, net of non-recurring costs,
increased by €2,245 thousand compared to the same period of the previous year (+€3,121
thousand at constant exchange rates), albeit they are in line with 2016 with respect to their impact
on revenues. This increase is due mainly to an increase in personnel costs, which is partially offset
by the decrease in costs related to marketing, entertainment, shipment and advisory services.
- “General and administrative expenses” amounted to €49,935 thousand. This item, net of non-
recurring costs and amortisation resulting from acquisitions, increased by €3,432 thousand
compared to the same period of the previous year (up €3,711 thousand at constant exchange
rates) but remained in line as regards percentage impact on revenues. This increase is especially
due to the increase in payroll & employee benefits, directors’ fees, EDP and telephone expenses,
and rentals.
The breakdown of “Other operating costs” is as follows:
2017 2016 Change
Non-income taxes 1,749 1,932 (183)
Allocation to the risk reserve 412 (416) 828
Provisions for doubtful accounts 222 762 (540)
Capital losses on assets 101 5 96
Contingent liabilities 238 95 143
Cost charge backs 128 161 (33)
Other 109 44 65
Total 2,959 2,583 376
The “Allocations to the risk reserve” item in 2016 was positive as it included €444 thousand referred to the
release to the income statement of the surplus of the provision allocated in 2014 for a probable tax liability
related to one of the Group’s foreign companies.
Contingent liabilities refer primarily to the release of some non-payable assets.

Datalogic Group
94
Breakdown of costs by type
The following table provides the details of total costs (cost of goods sold and total operating costs) by type,
for the main items:
2017 2016 Change
Purchases 235,580 235,379 201
Change in inventories (5,311) (12,014) 6,703
Payroll & employee benefits 165,395 157,413 7,982
Amortisation, depreciation and write-downs 19,496 19,142 354
Goods receipt & shipment 16,965 19,397 (2,432)
Technical, legal and tax advisory services 11,302 10,876 426
Travel & accommodation 9,032 9,040 (8)
Marketing expenses 8,183 9,242 (1,059)
Repairs and allocation to the warranty provision 6,709 6,252 457
Building expenses 6,469 6,179 290
Subcontracted work 4,647 3,326 1,321
Material collected from the warehouse 4,416 4,687 (271)
EDP expenses 4,281 3,640 641
Royalties 3,967 4,229 (262)
Consumables and R&D materials 3,071 3,399 (328)
Telephone expenses 2,790 2,456 334
Quality certification expenses 2,486 1,753 733
Directors’ remuneration 2,055 1,411 644
Utilities 2,001 2,021 (20)
Expenses for plant and machinery and other assets 1,928 1,156 772
Sundry service costs 1,927 1,777 150
Commissions 1,769 1,767 2
Meeting expenses 1,217 1,245 (28)
Vehicle expenses 1,194 1,054 140
Financial St. certification costs and other services 1,146 1,057 89
Insurance 911 961 (50)
Entertainment expenses 752 1,417 (665)
Training courses for employees 514 542 (28)
Stationery and printings 279 301 (22)
Other 10,937 10,410 527
Total Cost of goods sold and operating costs 526,107 509,515 16,592
Expenses reported in item “Goods receipt & shipment”, equal to €16,965 thousand, decreased by €2,432
thousand, particularly goods receipt expenses, due to the effect of increased efficiency in the management
of logistical flows.
The item “Marketing expenses”, equal to €8,183 thousand, decreased by €1,059 thousand compared to the
same period of 2016, mainly due to the decrease in advertising costs and generally in a more efficient
management of Marketing expenses.
Costs related to “Subcontracted work” amounted to €4,647 thousand (up by €1,321 thousand compared to
the same period of 2016) and refer primarily to orders in the Solution Net System division.
“Quality certification expenses” amounted to €2,486 thousand and were €733 thousand higher than the
same period of 2016. This increase is attributable to higher expenses borne for the implementation of the
new organisational model and to the inclusion of the company Soredi Touch Systems GmbH in the scope of
consolidation.

Datalogic Group
95
The detailed breakdown of payroll & employee benefits is as follows:
2017 2016 Change
Wages & salaries 126,053 123,212 2,841
Social security charges 23,250 21,312 1,938
Employee severance indemnities 1,847 1,615 232
Retirement and similar benefits 1,371 1,342 29
Medium- to long-term managerial incentive plan 3,138 (368) 3,506
Vehicle expenses for employees 3,081 3,158 (77)
Other costs 5,474 5,031 443
Early retirement incentives 1,181 2,111 (930)
Total 165,395 157,413 7,982
The “Wages and salaries” item, equal to €126,053 thousand, includes Sales commissions and incentives of
€17,138 thousand (€15,479 thousand as at 31 December 2016). This item reported an increase of €2,841
thousand (up €4,080 thousand at constant exchange rates) compared to the same period of the previous
year.
The “Early retirement incentives” item includes costs, totalling €317 thousand, stated under the “Non-
recurring costs and revenues” item, resulting from the re-organisation activities of the plant in Donnas (€252
thousand as at 31 December 2016).
Note 19. Other operating revenues
The detailed breakdown of this item is as follows:
2017 2016 Change
Grants to Research and Development expenses 1,458 1,384 74
Miscellaneous income and revenues 1,363 1,271 92
Rents 116 85 31
Capital gains on asset disposals 8 135 (127)
Contingent assets (13) 355 (368)
Other 32 48 (16)
Total 2,964 3,278 (314)
The “Grants to Research and Development expenses” item amounted to €1,458 thousand (€1,384 thousand
in the same period of 2016) and it is broken down as follows:
the amount of €1,139 thousand is related to the tax credit of companies that perform R&D activities,
as envisaged by Art. 3 of the Law Decree no. 145 of 23 December 2013, converted into Law no. 9 of
21 February 2014, as amended by par. 35 of Art. 1 of Law no. 190 of 23 December 2014 (Stability
Law 2015), Tax credit for R&D activities;
the amount of €316 thousand is related to the grant for a project financed by the Emilia Romagna
Region.
The “Miscellaneous income and revenues” mainly includes revenues for internal building works (€714
thousand).

Datalogic Group
96
Note 20. Net financial income (expenses)
2017 2016 Change
Financial income/(expenses) (2,964) (1,637) (1,327)
Foreign exchange differences (3,010) 20 (3,030)
Bank expenses (2,062) (1,828) (234)
Other 696 410 286
Total Net financial income (expenses) (7,340) (3,035) (4,305)
Financial income was negative by €7,340 thousand, compared to a negative result of €3,035 thousand
related to the same period of the previous year, mainly due to the trend of foreign exchange differences and
the increase in financial expenses.
The performance of “Foreign exchange differences” item is due to both a purely accounting translation effect
resulting from the derecognition of intercompany economic items and the effect of depreciation of the US
Dollar on Group net balances.
The “Financial income/(expenses)” item decreased by €1,327 thousand, mainly by reason of the increased
gross indebtedness, due to the entering of a new loan agreement with a pool of banks for the amount of
€250 million on 13 April 2017 and the redemption, at the same time, of pre-existing loan amounting to €126
million. This transaction permitted to increase the average life of the financial debt and therefore reduce the
exposure to variable interest rates as the new contract is at fixed rate.
The “Bank expenses” item reported an overall increase of €234 thousand, mainly due to the release of a
portion pertaining to the upfront fees (€437 thousand) related to the early redemption of the above-
mentioned long-term loan.
A capital loss was recorded, amounting to €85 thousand, realised following the transfer of the first tranche of
shares held in the company Laservall Asia Co. Ltd., in 2016 a loss of €318 thousand, following the
measurement at equity.
Note 21. Taxes
2017 2016 Change
Pre-tax profit 75,454 66,892 8,562
Income tax 16,129 20,247 (4,118)
Deferred taxes (755) 799 (1,554)
Total 15,374 21,046 (5,672)
Average rate 20.4% 31.5% -11.1%
The average tax rate comes to 20.4% (31.5% as at 31 December 2016).
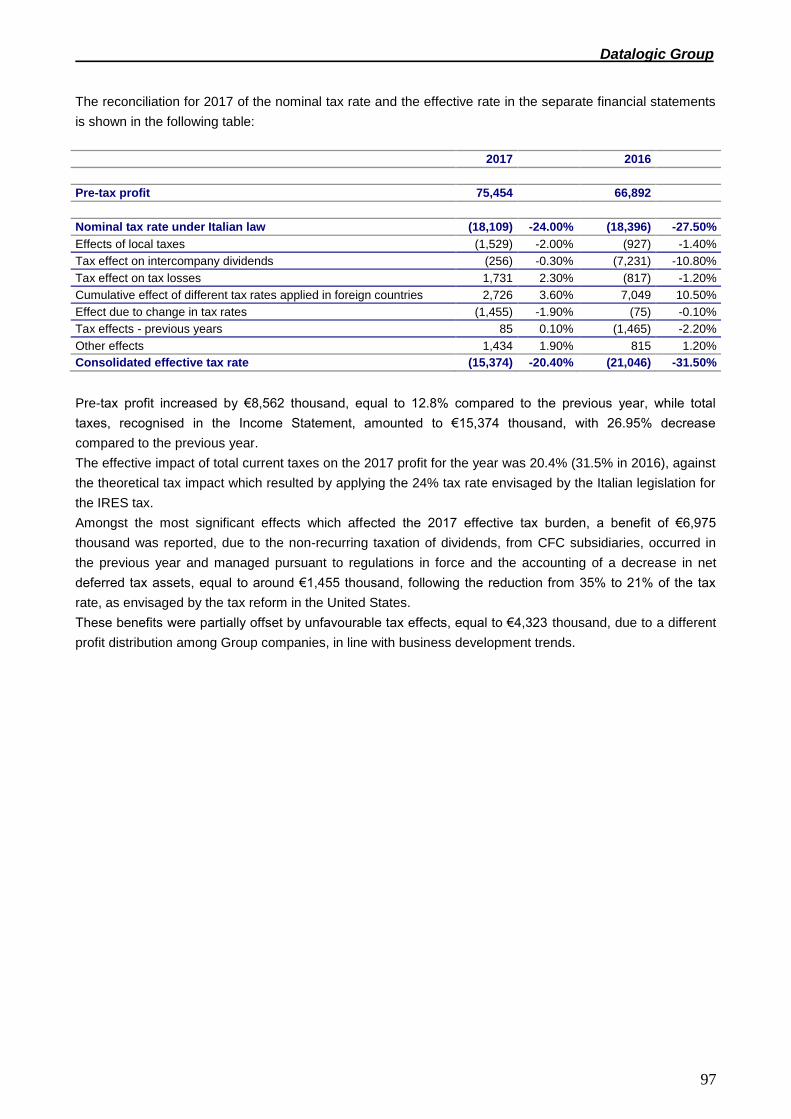
Datalogic Group
97
The reconciliation for 2017 of the nominal tax rate and the effective rate in the separate financial statements
is shown in the following table:
2017 2016
Pre-tax profit 75,454 66,892
Nominal tax rate under Italian law (18,109) -24.00% (18,396) -27.50%
Effects of local taxes (1,529) -2.00% (927) -1.40%
Tax effect on intercompany dividends (256) -0.30% (7,231) -10.80%
Tax effect on tax losses 1,731 2.30% (817) -1.20%
Cumulative effect of different tax rates applied in foreign countries 2,726 3.60% 7,049 10.50%
Effect due to change in tax rates (1,455) -1.90% (75) -0.10%
Tax effects - previous years 85 0.10% (1,465) -2.20%
Other effects 1,434 1.90% 815 1.20%
Consolidated effective tax rate (15,374) -20.40% (21,046) -31.50%
Pre-tax profit increased by €8,562 thousand, equal to 12.8% compared to the previous year, while total
taxes, recognised in the Income Statement, amounted to €15,374 thousand, with 26.95% decrease
compared to the previous year.
The effective impact of total current taxes on the 2017 profit for the year was 20.4% (31.5% in 2016), against
the theoretical tax impact which resulted by applying the 24% tax rate envisaged by the Italian legislation for
the IRES tax.
Amongst the most significant effects which affected the 2017 effective tax burden, a benefit of €6,975
thousand was reported, due to the non-recurring taxation of dividends, from CFC subsidiaries, occurred in
the previous year and managed pursuant to regulations in force and the accounting of a decrease in net
deferred tax assets, equal to around €1,455 thousand, following the reduction from 35% to 21% of the tax
rate, as envisaged by the tax reform in the United States.
These benefits were partially offset by unfavourable tax effects, equal to €4,323 thousand, due to a different
profit distribution among Group companies, in line with business development trends.

Datalogic Group
98
Note 22. Earnings/loss per share
Earnings/loss per share
2017 2016
Group earnings/(loss) for the period 60,080,000 45,846,000
Average number of shares 58,186,870 58,187,992
Earnings/(loss) per share 1.03 0.79
Average number of shares 58,186,870 58,187,992
Diluted effect 0 0
Earnings/(loss) per share 1.03 0.79
EPS as at 31 December 2017 was calculated by dividing Group net profit of €60,080 thousand (Group net
profit of €45,846 thousand as at 31 December 2016) by the average number of ordinary shares outstanding
as at 31 December 2017, equal to 58,186,870 shares (58,187,992 as at 31 December 2016).
NOTICE OF AUDITING FIRM’S FEES
Pursuant to article 149-duodecies of the Issuer Regulation, implementing Legislative Decree 58 of 24
February 1998, the following is the summary schedule of fees pertaining to the year 2017 provided by the
independent auditors.
The following table shows the remuneration for the audit activities.
2017
Fees for services supplied by the Auditing Firm to the Parent Company and to the subsidiaries
Datalogic S.p.A.- auditing 296
Italian subsidiaries - auditing 243
Foreign subsidiaries - auditing 392
Total auditing 930
Non-auditing services 0
Total 930
TRANSACTIONS WITH SUBSIDIARIES THAT ARE NOT FULLY CONSOLIDATED,
ASSOCIATES AND RELATED PARTIES
For the definition of “Related parties”, see both IAS 24, approved by EC Regulation 1725/2003, and the
Procedure for Transactions with Related Parties approved by the Board of Directors on 4 November 2010
(most recently amended on 24 July 2015), available on the Company’s website www.datalogic.com.
The parent company of the Datalogic Group is Hydra S.p.A.
Infragroup transactions are executed as part of the ordinary operations and at arm's length conditions.
Furthermore, there are other relationships with related parties, always carried out as part of the ordinary
operations and at arm’s length conditions, with an irrelevant amount and by the effects of the “OPC
Procedure”, chiefly with Hydra S.p.A. or entities under joint control (with Datalogic S.p.A.), or with individuals
that carry out the coordination and management of Datalogic S.p.A. (including entities controlled by the
same and close relatives).
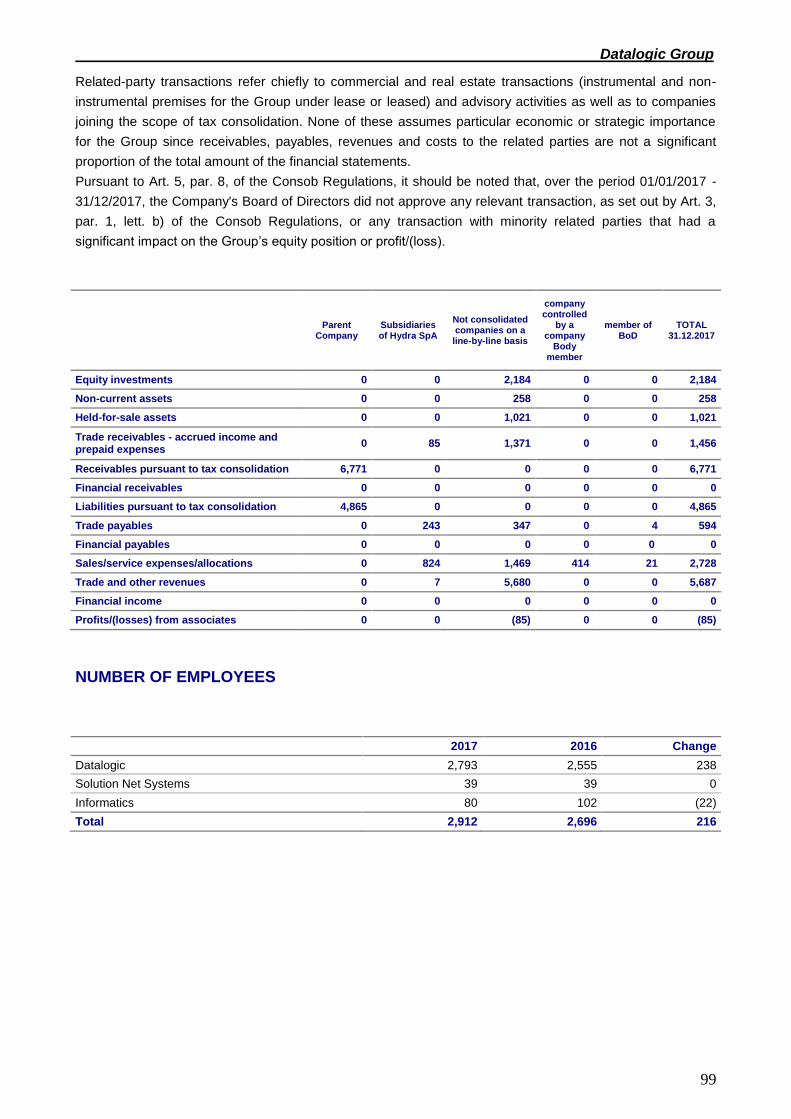
Datalogic Group
99
Related-party transactions refer chiefly to commercial and real estate transactions (instrumental and non-
instrumental premises for the Group under lease or leased) and advisory activities as well as to companies
joining the scope of tax consolidation. None of these assumes particular economic or strategic importance
for the Group since receivables, payables, revenues and costs to the related parties are not a significant
proportion of the total amount of the financial statements.
Pursuant to Art. 5, par. 8, of the Consob Regulations, it should be noted that, over the period 01/01/2017 -
31/12/2017, the Company's Board of Directors did not approve any relevant transaction, as set out by Art. 3,
par. 1, lett. b) of the Consob Regulations, or any transaction with minority related parties that had a
significant impact on the Group’s equity position or profit/(loss).
Parent
Company Subsidiaries of Hydra SpA
Not consolidated companies on a
line-by-line basis
company controlled
by a company
Body member
member of BoD
TOTAL 31.12.2017
Equity investments 0 0 2,184 0 0 2,184
Non-current assets 0 0 258 0 0 258
Held-for-sale assets 0 0 1,021 0 0 1,021
Trade receivables - accrued income and prepaid expenses
0 85 1,371 0 0 1,456
Receivables pursuant to tax consolidation 6,771 0 0 0 0 6,771
Financial receivables 0 0 0 0 0 0
Liabilities pursuant to tax consolidation 4,865 0 0 0 0 4,865
Trade payables 0 243 347 0 4 594
Financial payables 0 0 0 0 0 0
Sales/service expenses/allocations 0 824 1,469 414 21 2,728
Trade and other revenues 0 7 5,680 0 0 5,687
Financial income 0 0 0 0 0 0
Profits/(losses) from associates 0 0 (85) 0 0 (85)
NUMBER OF EMPLOYEES
2017 2016 Change
Datalogic 2,793 2,555 238
Solution Net Systems 39 39 0
Informatics 80 102 (22)
Total 2,912 2,696 216

Datalogic Group
100
EVENTS OCCURRING AFTER YEAR END
No significant events are to be reported.
ALLOCATION OF THE YEAR’S EARNINGS
To our Shareholders,
Since the financial statements of Datalogic S.p.A. show a net operating profit for the year of €25,591,520,
and since the legal reserve has reached one fifth of the Share Capital, pursuant to Art. 2430 of the Italian
Civil Code, the Board of Directors proposes to:
- distribute an ordinary unit dividend to Shareholders, gross of legal withholdings, of 50 cents per
share with coupon detachment on 28 May 2018 (record date 29 May 2018) and payment from 30
May 2018, for a maximum amount of €29,223,245;
The Chairman of the Board of Directors
(Mr. Romano Volta)

DATALOGIC S.p.A.
STATEMENT OF FINANCIAL POSITION
Note 31/12/2017 31/12/2016
A) NON-CURRENT ASSETS (1+2+3+4+5+6+7+8) 260.289.940 236.188.981
1) Tangible assets 1 22.085.545 21.480.033
land 1 2.465.710 2.465.710
buildings 1 15.702.356 15.631.040
other assets 1 3.917.479 3.062.477
assets in progress and payments on account 1 320.806
2) Intangible assets 2 3.809.429 2.771.669
Goodwill
Development costs 2
Other 2 3.809.429 2.771.669
3) Equity investments in affiliates 3 184.866.858 175.148.858
4) Financial assets 5 41.016.403 35.310.016
equity investments 5 9.572.215 4.303.493
securities 5 0
other 5 31.444.188 31.006.523
5) Loans to subsidiaries 9 - -
6) Trade and other receivables 7 181.251 171.973
7) Deferred tax assets 13 8.330.453 1.306.432
B) CURRENT ASSETS (9+10+11+12+13+14+15) 493.207.397 399.090.856
8) Inventories - -
raw and ancillary materials and consumables
work in progress and semi-finished products
finished products and goods
9) Commissioned work in progress - -
10) Trade and other receivables 7 34.950.161 10.500.365
trade receivables 7 28.369.955 9.558.568
within 12 months 7 10.774 22.355
after 12 months
receivables from affiliates
receivables from subsidiaries 7 28.359.181 9.536.213
receivables from the parent company 7
receivables from related parties
other receivables - accrued income and prepaid expenses 7 6.580.206 941.797
of which other receivables from subsidiaries 7 256.598 -
11) Tax receivables 8 1.146.576 1.172.666
of which to the parent company 8
12) Financial assets 5 - -
securities 5
13) Loans to subsidiaries 9 263.358.273 309.195.037
9 263.358.273 309.195.037
14) Financial assets - Derivative instruments 6 - -
15) Cash and cash equivalents 10 193.752.387 78.222.788
TOTAL ASSETS (A+B) 753.497.337 635.279.837
ASSETS
101

DATALOGIC S.p.A.
STATEMENT OF FINANCIAL POSITION
LIABILITIES Note 31/12/2017 31/12/2016
A) TOTAL SHAREHOLDERS' EQUITY (1+2+3+4+5) 11 291.639.169 291.677.840
1) Share capital 11 148.291.261 146.291.261
Share capital 11 30.392.175 30.392.175
Treasury shares 11 6.119.564 4.119.564
Share premium reserve 11 109.754.049 108.958.705
Treasury share reserve 11 2.025.473 2.820.817
2) Reserves 11 4.835.326 549.769
Employee severance indemnity discounting reserves 11 88.146 88.146
Cash-flow hedge reserve 11 (948.066) (28.125)
Valuation reserve for financial assets held for sale 11 5.695.246 489.748
3) Retained earnings/losses 112.921.062 92.502.593
Profits (losses) of previous years 11 73.071.234 37.961.518
Merger surplus reserve of DL Real Estate 203.538 203.538
Capital contribution reserve, not subject to taxation 11 958.347 958.347
Legal reserve 11 6.078.435 6.078.435
Valuation reserve at current value 11
Temporary reserve for exchange rate adjustment 11 8.981.690 23.672.937
Capital contribution reserve 11 15.204.345 15.204.345
IAS transition reserve 11 8.423.473 8.423.473
4) Profit (loss) for the period/year 25.591.520 52.334.217
B) NON-CURRENT LIABILITIES (6+7+8+9+10+11) 12 217.677.370 149.233.544
5) Financial payables 12 205.664.160 138.387.917
of which to related parties
6) Financial liabilities - Derivative instruments (*) 6 - -
7) Tax payables - -
8) Deferred tax liabilities 13 9.766.965 9.457.480
9) Post-employment benefits 14 498.245 484.422
10) Provisions for risks and charges 15 1.748.000 903.725
11) Other liabilities - -
C) CURRENT LIABILITIES (12+13+14+15+16) 244.180.799 194.368.453
12) Trade and other payables 16 10.027.858 8.335.747
trade payables 16 5.896.589 4.570.820
within 12 months 16 5.237.829 4.030.551
after 12 months
payables to subsidiaries 16 644.450 247.437
payables to the parent company 105.884
payables to related parties 16 14.310 186.948
other payables - accrued liabilities and deferred income 16 4.131.269 3.764.927
other payables from subsidiaries 235 298.192
13) Tax payables 17 1.036.760 2.211.291
of which to the parent company 17 252.762 1.558.707
14) Provisions for risks and charges 85.854 82.854
15) Financial liabilities - Derivative instruments 6 - 37.007
16) Short-term financial payables 12 233.030.327 183.701.554
of which to related parties 183.863.251 153.469.193
TOTAL LIABILITIES (A+B+C) 753.497.337 635.279.837
102

DATALOGIC S.p.A.
STATEMENT OF INCOMENote
31/12/2017 31/12/2016
1) TOTAL REVENUES 18 26.599.168 24.035.109
Revenues from sale of products18
- -
Revenues from services18
26.599.168 24.035.109
2) Cost of goods sold 19 1.964.645 1.470.216
GROSS PROFIT (1-2) 24.634.523 22.564.893
3) Other operating revenues 20 620.042 645.544
4) R&D expenses 19 403.808 396.276
5) Distribution expenses 19 901.807 1.848.076
of which non-recurring costs 1.600 9.340
6) General and administrative expenses 19 20.947.309 17.181.973
of which non-recurring costs 392.657 710.943
7) Other operating expenses 19 675.480 -1.057.116
Total operating costs (4+5+6+7) 22.928.404 18.369.209
OPERATING RESULT 2.326.161 4.841.228
8) Financial income 21 34.475.784 53.755.533
9) Financial expenses 21 13.046.558 3.224.197
Net financial income (expenses) (8-9) 21.429.226 50.531.336
PRE-TAX PROFIT/(LOSS) 23.755.387 55.372.564
Taxes 22 (1.836.133) 3.038.347
NET PROFIT/(LOSS) FOR THE PERIOD 25.591.520 52.334.217
103

DATALOGIC S.p.A.
STATEMENT OF COMPREHENSIVE INCOME
Note 2017 2016
NET PROFIT/(LOSS) FOR THE PERIOD 25.591.520 52.334.217
Other components of the statement of comprehensive income:
Profit/(loss) on cash flow hedges 11 (919.941) 63.583
of which tax effect - (20.371)
Adjustment on exchange rates 11 (14.472.470) 3.791.919
of which tax effect 4.570.254 (1.197.448)
Profit/(loss) on exchange rate adjustments for financial assets available
for sale 11 5.205.498 (18.002)
of which tax effect (63.224) 219
Total other components of the statement of comprehensive income
which will be restated under profit/(loss) for the year (10.186.913) 3.837.500
Total other profit/(loss) net of the tax effect (10.186.913) 3.837.500
COMPREHENSIVE NET PROFIT/(LOSS) FOR THE PERIOD 15.404.607 56.171.717
104

DATALOGIC S.p.A.
STATEMENT OF CASH FLOW
Note 2017 2016
Pre-tax profit 23.755.387 55.372.564
Depreciation of tangible assets and amortisation of intangible
assets1 , 2
2.140.546 1.795.407
Capital losses from sale of assets (2.598) (4.929)
Capital gains from sale of assets 1.922 404
Change in provisions for risks and charges 15 847.275 (2.158.973)
Change in employee benefits reserve 14 13.823 (42.701)
Net financial income including exchange rate differences 21 (34.477.451) (53.755.533)
Net financial expenses including exchange rate differences 2113.048.225 3.224.197
Foreign exchange differences 21 (5.730.483) 3.320.614
Adjustments to value of financial assets/liabilities (1.696.553) (229.122)
Cash flow from operations before changes in working capital(2.099.907) 7.521.928
Change in trade receivables 7 (18.811.387) (1.225.352)
Change in other current assets 7 (2.868.409) 10.457
Other medium-/long-term assets 5 (9.278) 99
Change in trade payables 16 1.325.769 1.331.466
Change in other current liabilities 16 366.342 (1.904.147)
Change in tax 13 , 17 , 22 (6.026.844) 885.910
Interest paid and banking expenses 21 1.762.203 3.809.793
Cash flow generated from operations (A) (26.361.511) 10.430.154
(Increase)/Decrease in intangible assets 1 (1.976.124) (994.101)
(Increase)/Decrease in tangible assets 2 (1.806.845) (890.284)
Change in equity investments 5 (150.000) -
Acquisition of equity investment and trademark (5.866.000) -
Changes generated by investment activity (B) (9.798.969) (1.884.385)
Change in LT/ST financial receivables 9 42.629.099 (40.909.009)
Change in short-term and medium/long-term financial payables 12 , 6118.568.009 1.795.062
Purchase of treasury shares 11 - (368.156)
Changes in reserves 11 (14.691.247) 3.837.500
Dividends collected 21 22.627.506 43.400.929
Dividends paid 21, 11 (17.443.288) (14.542.970)
Cash flow generated (absorbed) by financial activity (C) 151.690.080 (6.786.644)
Net increase (decrease) in available cash (A+B+C) 115.529.600 1.759.125
Net cash and cash equivalents at beginning of period 10 78.222.788 76.463.663
Net cash and cash equivalents at end of period 10 193.752.388 78.222.788
105

DATALOGIC S.p.A.
STATEMENT OF SHAREHOLDERS' EQUITY
Description Share capital Treasury shares Total share capital Cash-flow hedge
reserve
Valuation reserve
for financial
assets held for
sale
Severance
indemnity
discounting
reserves
Total other
reserves
Earnings carried
forward
Merger surplus Capital
contribution
reserve
Legal reserve Reserve for
exchange rate
adjustment
IAS reserve Total Profit for the year Total shareholders'
equity
01.01.2016 30.392.175 116.267.243 146.659.418 (91.708) 507.750 88.146 504.188 43.834.858 203.538 958.347 5.916.945 16.442.741 8.423.473 75.779.902 27.473.742 250.417.250
Allocation of earnings - - 23.873.975 161.490 3.438.277 27.473.742 (27.473.742) -
-
Dividends - (14.542.970) (14.542.970) (14.542.970)
- -
Increase in share capital - - - -
- -
Translation reserve - - - -
- -
Change in IAS reserve - - - -
- -
Sale/purchase of treasury shares (368.157) (368.157) - - (368.157)
- -
Cash flow hedge adjustment - 63.583 63.583 - 63.583
- - - -
Severance indemnity provision adjustment - - - -
- - -
Capital contribution reserve - - - -
- - - -
Cancellation of treasury shares - - - -
- - - -
Other movements - (18.002) (18.002) 3.791.919 3.791.919 3.773.917
- - - -
Net profit (Loss) as at 31/12/2016 - - - 52.334.217 52.334.217
-
31.12.2016 30.392.175 115.899.086 146.291.261 (28.125) 489.748 88.146 549.769 53.165.863 203.538 958.347 6.078.435 23.672.937 8.423.473 92.502.593 52.334.217 291.677.840
Description Share capital Treasury shares Total share capital Cash-flow hedge
reserve
Valuation reserve
for financial
assets held for
sale
Severance
indemnity
discounting
reserves
Total other
reserves
Earnings carried
forward
Merger surplus Capital
contribution
reserve
Legal reserve Reserve for
exchange rate
adjustment
IAS reserve Total Profit for the year Total shareholders'
equity
01.01.2017 30.392.175 115.899.086 146.291.261 (28.125) 489.748 88.146 549.769 53.165.863 203.538 958.347 6.078.435 23.672.937 8.423.473 92.502.593 52.334.217 291.677.840
Allocation of earnings - - 52.552.994 (218.777) 52.334.217 (52.334.217) -
-
Dividends - (17.443.278) (17.443.278) (17.443.278)
- -
Increase in share capital - - - -
- -
Translation reserve - - - -
- -
Change in IAS reserve - - - -
- -
Sale/purchase of treasury shares 2.000.000 2.000.000 - - 2.000.000
- -
Cash flow hedge adjustment - (919.941) (919.941) - (919.941)
- - - -
Severance indemnity provision adjustment - - - -
- - -
Capital contribution reserve - - - -
- - - -
Cancellation of treasury shares - - - -
- - - -
Other movements - 5.205.498 5.205.498 (14.472.470) (14.472.470) (9.266.972)
- - - -
Net profit (Loss) as at 31/12/2017 - - - 25.591.520 25.591.520
-
31.12.2017 30.392.175 117.899.086 148.291.261 (948.066) 5.695.246 88.146 4.835.326 88.275.579 203.538 958.347 6.078.435 8.981.690 8.423.473 112.921.062 25.591.520 291.639.169
106
Datalogic S.p.A.
Financial Statements as at 31.12.2017 - Explanatory Notes 107
EXPLANATORY NOTES TO THE FINANCIAL STATEMENTS
FOREWORD
Datalogic S.p.A. (hereinafter “Datalogic” or the “Company”) is a joint-stock company listed on the STAR
segment of Borsa Italiana, with its registered office at via Candini, 2 Lippo di Calderara di Reno (Bo).
The Company is a subsidiary of Hydra S.p.A., which is also based in Bologna and is controlled by the Volta
family.
These financial statements were prepared by the Board of Directors on 20 March 2018.
PRESENTATION AND CONTENT OF THE FINANCIAL STATEMENTS
Pursuant to the European Regulation 1606/2002, the Financial Statements were prepared in compliance
with the international accounting standards (IAS/IFRS) issued by the IASB (International Accounting
Standards Board) and endorsed by the European Union, pursuant to European Regulation 1725/2003 and
subsequent amendments, with all the interpretations of the International Financial Reporting Interpretations
Committee (“IFRS-IC”), formerly the Standing Interpretations Committee (“SIC”), endorsed by the European
Commission at the date of approval of the draft financial statements by the Board of Directors and contained
in the related EU Regulations published at this date, and in compliance with the provisions of CONSOB
Regulation 11971 of 14 May 1999 and subsequent amendments.
The Financial Statements for the year ended 31 December 2017 consist of Statement of Financial Position,
Income Statement, Statement of Comprehensive Income, Statement of Changes in Shareholders’ Equity,
Cash Flow Statement and Explanatory Notes.
The Financial Statements were prepared in compliance with the general criterion of a reliable and true vision
of the financial position, financial performance and cash flows, on an ongoing concern and on an accrual
basis, in compliance with the general principles of consistency of presentation, relevance and aggregation,
no offsetting and comparability of information.
As regards the presentation of the Financial Statements, the Company made the following choices:
non-current assets, as well as current and non-current liabilities are disclosed separately in the
Statement of Financial Position. Current assets, which include cash and cash equivalents, are
those set to be realised, sold or used during the normal operational cycle; current liabilities are
those whose extinction is envisaged during the normal operating cycle or in the 12 months after
the reporting date;
with regard to the Income Statement, cost and revenue items are disclosed based on grouping
by function, as this classification was deemed more meaningful for comprehension of the
business result;
the Statement of Comprehensive Income presents the components that determine gain/(loss) for
the period and the costs and revenues reported directly under shareholders' equity;
the Cash Flow Statement is presented using the indirect method.

Datalogic S.p.A.
Financial Statements as at 31.12.2017 - Explanatory Notes 108
The Statement of Changes in Shareholders’ Equity analytically details the changes occurring in the financial
year and in the previous financial year.
Preparation of IFRS-compliant financial statements requires the use of some estimates. Reference should
be made to the section describing the main estimates made in these financial statements.
These financial statements are drawn up in Euro units, which is the “functional” and “presentation” currency
as envisaged by Art. 2423 of the Italian Civil Code.
ACCOUNTING POLICIES AND STANDARDS APPLIED
Below we indicate the policies adopted for preparation of the Company’s financial statements as at 31
December 2017.
Property, plant and equipment
Owned tangible assets are initially recognised at the cost of contribution, purchase, or in-house construction.
The cost comprises all directly attributable costs necessary to make the asset available for use (including,
when significant and in the presence of effective obligations, the present value of the estimated costs for
decommissioning and removal of the asset and for reinstatement of the location), net of trade discounts and
allowances.
Some tangible assets in the “Land and buildings” categories, in line with IAS 16 provisions, were measured
at fair value (market value) as at 01 January 2004 (IFRS transition date) and this value was used as the
deemed cost. Fair Value was calculated based on evaluation expertises performed by independent external
consultants. The cost of buildings is depreciated net of the residual value estimated as the realisation value
obtainable via disposal at the end of the building’s useful life.
Costs incurred after purchase are recognised in the asset’s carrying value, or are recognised as a separate
asset, only if it is thought likely that the future economic benefits associated with the asset will be enjoyed
and the asset’s cost can be reliably measured. Maintenance and repair costs or replacement costs that do
not have the above characteristics are recognised in the income statement in the year in which they are
borne.
Tangible assets are depreciated on a straight-line basis each year - starting from the time when the asset is
available for use, or when it is potentially able to provide the economic benefits associated with it - according
to economic/technical rates determined according to assets’ residual possibility of use and taking into
account the month when they became available for use in the first year of utilisation.
Land is considered to be an asset with an indefinite life and therefore not subject to depreciation.
The depreciation rates applied by the Company are as follows:
Asset category Annual depreciation rates
Property:
Buildings 2% - 3.3%
Land 0%
Plant and equipment:

Datalogic S.p.A.
Financial Statements as at 31.12.2017 - Explanatory Notes 109
Automatic operating machines 20% - 14.29%
Furnaces and appurtenances 14%
Generic/specific production plant 20% - 10%
Other assets:
Plant pertaining to buildings 8.33% - 10% - 6.67%
Lightweight constructions 6.67% - 4%
Production equipment & electronic instruments 20% - 10%
Moulds 20%
Electronic office machinery 33% - 20% - 10%
Office furniture and fittings 10% - 6.67% - 5%
Cars 25%
Freight vehicles 14%
Trade show & exhibition equipment 11% - 20%
Improvements to third-party assets Contract duration
If, regardless of the depreciation already posted, enduring impairment of value emerges, the asset is written
down; if the reasons for devaluation no longer exist in later years, the original value is reinstated. The
residual value and useful life of assets are renewed at least at each year-end in order to assess any
significant changes in value.
Gains and losses on disposals are calculated by comparing the selling price with net carrying value. The
amount thus determined is recognised in the income statement.
Assets held under finance lease contracts
Assets held under finance lease contracts are those non-current assets for which the Company has
assumed all the risks and benefits connected with ownership of the asset. Such assets are measured at the
lower of fair value and present value of lease instalments at the time of contract signature, net of cumulative
depreciation and write-downs. Financial lease instalments are recorded as described in IAS 17; specifically,
each instalment is divided into principal and interest. The sum of the portions of principal payable at the
reporting date is recorded as a financial liability; the portions of interest are recorded in the income statement
each year until full repayment of the liability.
Intangible assets
Intangible assets are recognised under assets in the Statement of Financial Position when it is likely that use
of the asset will generate future economic benefits and when the asset’s costs can be reliably calculated.
They are initially recognised at the value of contribution or at acquisition or production cost, inclusive of any
ancillary costs.
Gains and losses on disposals are calculated by comparing the selling price with net carrying value. The
amount thus determined is recognised in the Income Statement.
Other intangible assets
Other intangible assets consist of:
• trademark;
• purchased software under license of use;
• license agreement.
Amortisation
Intangible assets of finite duration are systematically amortised according to their projected future
usefulness, so that the net value at the reporting date corresponds to their residual usefulness or to the

Datalogic S.p.A.
Financial Statements as at 31.12.2017 - Explanatory Notes 110
amount recoverable according to corporate business plans. Amortisation starts when the asset is available
for use.
The useful life for each category is detailed below:
DESCRIPTION Useful Life - years
Trademark Indefinite useful life
Other intangible assets:
- Software licences (other than SAP licences) 3/5
- SAP licences 10
- User licences Contract duration
Intangible assets with an indefinite useful life are not amortised but tested to identify any impairment of value
annually, or more frequently when there is evidence that the asset may have suffered impairment. The
residual values, the useful lives and the amortisation of intangible assets are reviewed at each year end and,
when required, corrected prospectively. The useful lives remained unchanged compared to the previous
year.
Impairment
Tangible and intangible assets are tested for impairment in the presence of specific indicators of loss of
value, and at least annually for intangible assets with an indefinite life.
The aim of this impairment test is to ensure that tangible and intangible assets are not carried at a value
exceeding their recoverable value, consisting of the higher between their fair value and selling costs and
their value in use.
Value in use is calculated based on the future cash flows that are expected to originate from the asset or
CGU (cash generating unit) to which the asset belongs. Cash flows are discounted to present value using a
discount rate reflecting the market’s current estimate of the time value of money and of the risks specific to
the asset or CGU to which presumable realisation value refers.
If the recoverable value of the asset or CGU, to which it belongs, is less than the net carrying value, the
asset in question is written down to reflect its impairment, with recognition of the latter in the Income
Statement for the period.
Impairment losses relating to CGUs are allocated firstly to goodwill and, for the remaining amount, to the
other assets on a proportional basis.
If the reasons causing it cease to exist, impairment is reversed within the limits of the amount of what would
have been the book value, net of amortisation of the historical cost, if no impairment had been recognised.
Any reinstatements of value are recognised in the Income Statement.

Datalogic S.p.A.
Financial Statements as at 31.12.2017 - Explanatory Notes 111
Financial assets and liabilities
The Company measures at fair value all financial instruments such as derivatives at each annual reporting
date. Fair value is the price that would be received for the sale of an asset or that would be paid for transfer
of a liability in a normal transaction between market operators at the date of measurement.
A measurement of fair value assumes that the sale of the asset or transfer of the liability takes place:
• in the main market of the asset or liability; or
• when there is no main market, in the market most advantageous for the asset or liability.
The main market or most advantageous market must be accessible for the Company. The fair value of an
asset or liability is measured by adopting the assumptions that the market operators would use in
determining the price of the asset or liability, presuming that they act to meet their economic interest in the
best way. Measurement of the fair value of a non-financial asset considers the capability of a market
operator to generate economic benefits by using the asset in its maximum and best use or by selling it to
another market operator that would use it in its maximum and best use.
The Company uses measurement methods that are appropriate for the situation, and for which data
available to measure fair value are sufficient, while maximising the use of relevant inputs observable and
limiting the use of non-observable inputs. All assets and liabilities measured or recognised at fair value are
classified based on a fair value hierarchy and described hereunder:
Level 1 - listed prices (not adjusted) in active markets for identical assets or liabilities the entity of
which is identifiable at the measurement date;
Level 2 - input data other than listed prices included in Level 1 which can be observed, either directly
or indirectly for the asset or liability to be measured;
Level 3 - the valuation techniques for which input data cannot be observed for the asset or liability to
be measured.
The fair value measurement is classified at the same fair value hierarchy level in which the lowest hierarchy
input used for the measurement is stated.
As regards assets and liabilities that are recognised in the financial statements at fair value on a recurring
basis, the Company determines whether transfers between hierarchy level occurred while revising the
classification (based in lower level inputs, which is significant for the purposes of a thorough fair value
measurement) at each annual reporting date.
Financial instruments
A financial instrument is any contract generating a financial asset for an entity and a financial liability or an
equity instrument for another entity.
Financial assets
The financial assets are initially recognised at their fair value, increasing their ancillary charges. At their first
recognition, the financial assets are classified as follows, as the case may be:
Financial assets at fair value with contra entry in the income statement: these are financial
assets acquired primarily with the intention of making a profit from short-term price fluctuations and
designated as such from the outset; they are recognised at fair value and any changes during the
period are recognised in the Income Statement.

Datalogic S.p.A.
Financial Statements as at 31.12.2017 - Explanatory Notes 112
Loans and receivables: they are financial assets other than derivatives with a fixed or calculable
payment flow and which are not listed in an active market. They are recognised according to the
amortised cost criterion using the effective interest rate method, less impairment. The amortised cost
is calculated by recognising any discounts, premiums on the purchase, fees or costs that form an
integral part of the effective interest rate. The effective interest rate is recognised as financial income
in the Income Statement. Write downs arising from impairment are recognised as financial expenses
in the Income Statement. This category usually includes trade receivables and other receivables. As
regards the financial assets accounted for at amortised cost, the Company has initially assessed
whether there was an impairment on each significant financial asset, and collectively on financial
assets of irrelevant amount. The carrying value of assets is reduced through the accounting of a
provision for write-downs and the amount of the loss is recognised in the Income Statement. The
loans and related provisions for write-downs are reversed when the possibility of a future recovery is
not realistic and guarantees have been put in place or transferred to the Company. If, in a
subsequent year, the amount of estimated impairment increases or decreases due to an event
occurred after the recognition of the impairment, the latter will be increased or reduced through an
adjustment of the provision. They are recognised under “Current assets” item, except for the portion
with a maturity term after 12 months that is stated under Non-current assets.
Available for sale financial assets and receivables: these are financial assets other than
derivatives, which are not classified in other categories; they are valued at fair value and related
changes are entered in an equity reserve. They are classified under non-current assets, unless they
are intended to be sold within 12 months.
Financial assets are derecognised from the financial statements when the right to receive cash no longer
exists, the Company has transferred the right to receive cash flows from the asset or has assumed the
contractual obligation to pay them to a third party in their entirety and without delay and (1) has transferred
essentially all the risks and benefits of ownership of the financial asset or (2) has not transferred or
essentially held all the risks and benefits of the asset, but has transferred control of the asset.
In the cases in which the Company has transferred the rights to receive cash flows from an asset or has
signed an agreement based on which it retains the contractual rights to receive the cash flows of the
financial asset, but takes on a contractual obligation to pay the cash flows to one or more beneficiaries
(pass-through), it assesses whether and to what extent it has retained the risks and benefits pertaining to the
ownership.
Equity investments in other companies are measured at fair value. When the fair value cannot be reliably
determined, equity investments are measured at cost, adjusted for impairment.
Financial liabilities
Financial liabilities are classified at the time of initial recognition as financial liabilities at fair value recorded in
the Income Statement, amongst the mortgages and loans or amongst the derivatives designated as hedging
instruments.
All financial liabilities are initially recognised at fair value, added to which - as in the case of mortgages, loans
and payables - transaction costs directly attributable to them. The Company’s financial liabilities include
trade payables and other payables, mortgages and loans, including current account overdrafts, guarantees
granted and derivative financial instruments.
Loans and payables (the most significant category for the Company) are measured with the amortised cost
criterion using the effective interest rate method. Profits and losses are booked in the Income Statement
Datalogic S.p.A.
Financial Statements as at 31.12.2017 - Explanatory Notes 113
when the liability is settled, as well as through the amortisation process.
The amortised cost is calculated by recognising the rebates or premiums on the purchase and the fees or
costs that are an integral part of the effective interest rate. Amortisation at the actual interest rate is included
amongst financial expenses in the Income Statement.
Financial guarantees given are agreements envisaging a payment to repay the owner of a debt security
against a loss incurred due to a non-payment by the debtor at the contract maturity term. If the financial
guarantees are issued by the Company, they are initially recognised as liabilities at fair value, added by
transaction costs that are directly attributable to the issue of the guarantee itself. The liability is then
measured at the higher between the best estimated disbursement, required to fulfil the guaranteed obligation
at the reporting date, and the initially recognised amount, less accumulated amortisation.
A financial liability is written off when the obligation underlying the liability has been extinguished, annulled or
fulfilled. If an existing financial liability is replaced by another one from the same lender, under conditions that
are essentially different, or if the terms and conditions of an existing liability are essentially amended, this
change or amendment will be treated as a reversal of the original liability or the recognition of a new liability,
with recognition in the Income Statement of any differences involving the carrying values.
Offsetting financial instruments
A financial asset and liability can be offset and the net balance can be shown on the Statement of Financial
Position if there is a current legal right to offset the amounts recognised and there is the intention to settle
the net remainder, or realise the asset and at the same time settle the liability.
Loans, payables and other financial and/or liabilities, with fixed or calculable maturity term, are initially
recognised at their fair value, less debt issuance costs. The measurement criterion after initial recognition is
the amortised cost criterion using the effective interest rate.
Long-term payables, for which an interest rate is not provided, are accounted for through the discounting of
future cash flows at market rate if the increase of payables is due to the elapse of time, with following
recognition of interest in the Income Statement, under item “Net financial income (charges)”. A financial
liability is written off when the obligation underlying the liability has been extinguished, annulled or fulfilled.
Financial derivatives
Derivative instruments, including embedded derivatives, object matter of a separate agreement, are initially
recognised at fair value.
Derivatives are classified as hedging instruments when the relation between derivatives and the object
matter of the hedging is formally documented and the effectiveness of the hedging, which is periodically
checked, is high.
When the hedging derivatives hedge the risk of changes in fair value of the hedged instruments, they are
recognised at fair value, and the effects are charged to the Income Statement. Accordingly, the hedged
instruments are adjusted to reflect the changes in fair value, associated to the hedged risk.
In the event of cash flow hedges, the derivatives are designated as a hedge for exposure to variable of cash
flows attributable to risks that might subsequently affect the Income Statement. These risks are generally
associated with an asset or liability recognised in the Financial Statements (as future payments on variable
rate payables).
The effective portion of fair value change, related to the portion of derivative contracts designated as hedge
derivatives pursuant to IAS 39, is recognised as component of the Statement of Comprehensive Income
(Hedging reserve). This reserve is then charged to the profit for the year in the period in which the hedged
transaction affects the Income Statement.
The ineffective portion of fair value change, as well as the entire fair value change in derivatives that have
not been designated as hedge derivatives or that do not have the requirements envisaged in the aforesaid

Datalogic S.p.A.
Financial Statements as at 31.12.2017 - Explanatory Notes 114
IAS 39, is instead recognised directly in the Income Statement.
Equity investments in affiliates
Equity investments in subsidiaries, included in the financial statements, are disclosed based on IAS 27, by
using the cost method, net of impairments.
Equity investments in associates
Equity investments are classified under non-current assets and are valued at equity, pursuant to IAS 28. The
portion of profits or losses resulting from the application of this method is indicated in a specific item of the
income statement.
Other equity investments
Equity investments in other companies are classified as available-for-sale financial instruments, according to
the definition established in IAS 39, although the Company has not expressed an intention to sell these
investments, and they are valued at fair value on the reporting date.
Trade receivables
Trade receivables are amounts due from customers following the sale of products and services. Receivables
are initially recognised at fair value and subsequently at amortised cost – using the effective interest rate
method – net of related impairment losses. Short term payables are not discounted, since the effect of
discounting the cash flows is not significant.
The estimated impairment of receivables is recognised when it becomes evident that the past-due receivable
cannot be recovered, due to financial difficulties of the customer that might lead to its bankruptcy or financial
restructuring.
Cash and cash equivalents
Cash and cash equivalents comprise cash on hand, bank and post office deposits, and short-term financial
investments (maturity of three months or less after purchase date) that are highly liquid, readily convertible
into cash and are subject to insignificant risk of changes in value.
Current-account overdrafts and advances on invoices subject to collection are deducted from cash only for
the purposes of the cash flow statement.
Shareholders' Equity
Share capital consists of the ordinary shares outstanding, which are posted at par value. Costs relating to
the issue of new shares or options are classified in equity (net of associated tax benefit relating to them) as a
deduction from the proceeds of the issuance of such instruments.
Treasury shares
In the case of buyback of treasury shares, the price paid, inclusive of any directly attributable accessory
costs, is deducted from the Company’s Shareholders’ Equity until such shares are cancelled, re-issued, or
sold. When treasury shares are resold or re-issued, the proceeds, net of any directly attributable accessory
costs and related tax effect, are posted as Shareholders’ Equity.
Consequently, no profit or loss is entered in the Company’s Income Statement at the time of purchase, sale
or cancellation of treasury shares.

Datalogic S.p.A.
Financial Statements as at 31.12.2017 - Explanatory Notes 115
Liabilities for employee benefits
Post-employment benefits are calculated based on programmes that, depending on their characteristics, are
either “defined-contribution programmes” or “defined-benefit programmes”.
Employee benefits substantially consist of accrued provision for severance indemnities of the Company’s
Italian companies and of retirement provisions.
Defined-contribution plans
Defined-contribution plans are formalised programmes of post-employment benefits according to which the
company makes payments to an insurance company or a pension fund and will have no legal or constructive
obligation to pay further contributions if, at maturity date, the fund has not sufficient assets to pay all benefits
for employees, in relation to the work carried out in current and previous years. These contributions, paid
against a work service rendered by employees, are accounted for as cost in the pertaining period.
Defined-benefit plans and other long-term benefits
Defined-benefit plans are programmes of post-employment benefits that represent a future obligation for the
Company. The entity bears actuarial and investment risks related to the scheme.
The Company uses the projected unit credit method to determine the current value of liabilities of the
scheme and the cost of services.
This actuarial calculation method requires the use of objective actuarial hypotheses, compatible and based
on demographic variables (mortality rates, personnel turnover) and financial variables (discount rate, future
increases of salaries and wages and benefits). When a defined-benefit plan is entirely or partially financed by
contributions paid to a fund, legally separate from the company, or to an insurance company, the assets in
support of the above scheme are measured at fair value. The amount of the obligation is therefore
accounted for, less the fair value of assets in support of the scheme that the entity would pay to settle the
obligation itself.
The revaluations, including actuarial profits and losses, the changes in the maximum threshold of assets
(excluding net interest) and the yield of assets in support of the scheme (excluding net interests), are
recognised immediately in the Statement of Financial Position, while debiting or crediting retained earnings
through other components in the Statement of Comprehensive Income in the year in which they occur.
Revaluations are not reclassified in the Income Statement in subsequent years. The other long-term benefits
are intended for employees and differ from post-employment benefits. The accounting is similar to defined-
benefit plans.
Provisions for risks and charges
Provisions for risks and charges are set aside to cover liabilities whose amount or due date are uncertain
and that must be recognised on the statement of financial position when the following conditions are satisfied
at the same time:
• the entity has a present obligation (legal or constructive), i.e. under way as at the reporting date, arising
from a past event;
• it is probable that economic resources will have to be used to fulfil the obligation;
• the amount needed to fulfil the obligation can be reliably estimated;
• risks, for which materialisation of a liability is only contingent, are disclosed in the notes to accounts, in
the section commenting on provisions, without provision being made.
Datalogic S.p.A.
Financial Statements as at 31.12.2017 - Explanatory Notes 116
In the case of events that are only remote, i.e. events that have very little likelihood of occurrence, no
provision made and no additional or supplementary disclosure is provided.
Provisions are recognised at the value representing the best estimate of the amount the entity would pay to
settle the obligation, or to transfer it to third parties, at the reporting date. If the time value of money is
material, provisions are calculated by discounting expected future cash flows at a pre-tax discount rate
reflecting the market’s current evaluation of the cost of money over time. When discounting to present value
is performed, the increase in the provision due to the passage of time is recognised as finance expense.
The funds are entered at the current value of expected financial resources, to be used in relation to the
obligation. When the Company deems that an allocation to the provisions for risks and charges will be partly
or fully redeemed, e.g in the event of risks covered by insurance policies, the indemnity is recognised
separately in the Assets if, and only if, it is certain. In this case, the cost of any allocation is disclosed in the
Income Statement, less the amount recognised as indemnity. The provisions are periodically updated to
reflect changes in cost estimates, realisation timing and any discounted value. Estimate reviews of
provisions are charged to the same item in the Income Statement that previously included the allocation and
in the Income Statement for the period in which the change occurred.
The Company established restructuring provisions if there exists an implicit restructuring obligation and a
formal plan for the restructuring that created in interested third parties the reasonable expectation that the
company will carry out the restructuring or because it has begun its realisation or because it has already
communicated its main aspects to interested third parties.
Income taxes
Income taxes include current and deferred taxes. Income taxes are generally recognised in the income
statement, except when they relate to items entered directly in equity, in which case the tax effect is
recognised directly in equity.
Current income taxes are calculated by applying to taxable income the tax rate in force at the reporting date
and adjustments to taxes related to prior periods.
Deferred taxes are calculated using the liability method applied to temporary differences between the
amount of assets and liabilities in the Company’s Financial Statements and the corresponding amounts
recognised for tax purposes, except as follows:
• deferred tax liabilities derive from the initial recognition of goodwill or an asset or liability in a transaction
that is not a business combination and, when the transaction itself occurs, does not affect the balance
sheet profits or the profits or losses calculated for tax purposes;
• the reversal of taxable temporary differences associated with equity investments in subsidiaries,
associates or joint ventures, may be controlled and will probably not occur in the foreseeable future.
Deferred tax assets are recognised for all deductible temporary differences and tax credits and losses and
can be brought forward, to the extent that the existence of adequate future taxable profits will exist against
which the usage of the deductible temporary differences and the tax credits and losses brought forward can
be used, except in cases where:
• the deferred tax assets connected to the deductible temporary differences arise from initial recognition of
an asset or liability in a transaction that is not a business combination and, at the time of the transaction
itself, does not affect the balance sheet result or the profit or loss for tax purposes;
• there are taxable temporary differences associated with equity investments in subsidiaries, associates
and joint ventures and deferred tax assets are recognised only to the extent that the deductible

Datalogic S.p.A.
Financial Statements as at 31.12.2017 - Explanatory Notes 117
temporary differences will be reversed in the foreseeable future and that there are adequate taxable
profits against which the temporary differences can be used.
Deferred taxes are calculated at the tax rate expected to be in force at the time when the asset is sold or the
liability is redeemed.
Deferred tax assets are recognised only if it is probable that sufficient taxable income will be generated in
subsequent years to realise them. The carrying amount of the deferred tax assets is reviewed every year
end and reduced to the extent it is no longer probable that sufficient taxable income, so as to permit whole or
partial use of this credit, will be available in the future. Deferred tax assets that are not recognised, are
reviewed at every reporting date and are recognised to the extent it becomes probable that the tax receipts
will suffice to consent recovery of these deferred tax assets.
The Parent Company Datalogic S.p.A. and numerous Italian subsidiaries fall within the scope of the
“domestic tax consolidation” of Hydra S.p.A. This permits the transfer of total net income or the tax loss of
individual participant companies to the Parent Company, which calculates a single taxable income for the
Company or a single tax loss carried forward, as the algebraic sum of the income and/or losses, and
therefore files a single tax liability or credit with the Tax Authorities.
Trade and other payables
Trade and other payables are measured at cost, which represents their discharge value.
Short-term payables are not discounted, since the effect of discounting the cash flows is not significant.
Government grants Government grants are recognised - regardless of the existence of a formal grant resolution - when there is
reasonable certainty that the company will comply with any conditions attached to the grant and therefore
that the grant will be received.
Government grants receivable as compensation for costs already incurred or to provide immediate financial
support to the recipient company with no future related costs, are recognised as income in the period in
which they become receivable.
Revenue recognition
Revenues are measured at fair value of the amount collected or collectable from the sale of goods or
rendering of services within the scope of the Company’s characteristic business activity. Revenues are
shown net of VAT, returns, discounts and allowances.
Rendering of services
Revenue arising from a transaction for the rendering of services is recognised only when the results of the
transaction can be reliably estimated, based on the stage of completion of the transaction at the reporting
date. The results of a transaction can be reliably measured when all the following conditions are met:
• the amount of revenues can be reliably measured;
• it is probable that the economic benefits of the transaction will flow to the entity;
• the stage of completion at the reporting date can be reliably measured;
• the costs incurred, or to be incurred, to complete the transaction can be reliably measured.
Revenue relating to dividends, interest and royalties is respectively recognised as follows:
• dividends, when the right is established to receive dividend payment (with a receivable recognised in the
statement of financial position when distribution is resolved);

Datalogic S.p.A.
Financial Statements as at 31.12.2017 - Explanatory Notes 118
• interest, with application of the effective interest rate method (IAS 39);
• royalties, on an accrual basis in accordance with the underlying contractual agreement.
Dividends paid out
Dividends are recognised when shareholders have the right to receive payment. This normally corresponds
to the date of the annual General Shareholders’ Meeting that approves dividend distribution. The dividends
distributable to Company shareholders are recognised as an equity movement in the year when they are
approved by the Shareholders’ Meeting.
Earnings per share Basic
Basic EPS is calculated by dividing the Company's profit by the weighted average number of ordinary shares
outstanding during the year, excluding treasury shares.
Diluted
Diluted EPS is calculated by dividing the Company's profit by the weighted average number of ordinary
shares outstanding during the year, excluding treasury shares. For the purposes of calculating diluted EPS,
the weighted average number of shares is determined assuming translation of all potential shares with a
dilutive effect, and the Company's net profit is adjusted for the post-tax effects of translation.
Rental and operating lease costs Lease contracts in which the lessor substantially preserves all the risks and rewards of ownership are
classified as operating leases and related fees are charged to the income statement on a straight-line basis
according to the contract’s duration.
Treatment of foreign currency items
Transactions and balances
Foreign currency transactions are initially converted to euro at the exchange rate existing on the transaction
date. At the reporting date, foreign-currency monetary assets and liabilities are converted at the exchange
rate in force on that date.
Foreign-currency non-monetary items measured at cost are converted using the exchange rate in force on
the transaction date.
Non-monetary items recognised at fair value are converted using the exchange rate in force when carrying
value is calculated.
Foreign exchange gains and losses arising from the collection of foreign currency receivables or payment of
foreign currency payables are recognised in the income statement.
AMENDMENTS, NEW STANDARDS AND INTERPRETATIONS
Accounting standards, amendments and interpretations applied as at 01 January
2017
The accounting standards adopted for preparation of the financial statements are consistent with those used
for the preparation of the financial statements as at 31 December 2016. The Company adopted for the first
Datalogic S.p.A.
Financial Statements as at 31.12.2017 - Explanatory Notes 119
time some accounting standards and amendments that are applied for annual periods beginning on or after
01 January 2017. The Company has not yet adopted any standard, interpretation or amendment that has
been published, but is not yet effective.
The nature and impact of any new principle/amendment are specified hereunder. Albeit these new standards
and amendments were applied for the first time in 2017, they had no significant impact on the Company
financial statements. The nature and impact of any new principle/amendment are specified hereunder:
Amendments to IAS 7 - Cash Flow Statement
The amendments envisage that entities shall supply disclosures on changes in liabilities related to financing
activities, including both changes related to cash flows and non-monetary changes (such as, for example,
gains and losses on exchange rates).
Amendments to IAS 12 - Income taxes
The amendments clarify that an entity should consider whether tax laws limit the taxable income sources for
which it might have deductions related to the reverse of deductible temporary differences. Moreover, the
amendment supplies guidelines on how an entity should determine future taxable income and clarifies when
the taxable income might include the recovery of some assets, for a higher value than their carrying value.
Amendments to IFRS 12 - Disclosure of Interests in Other Entities
The amendments clarify that the disclosures required by IFRS 12, other than information envisaged in
paragraphs B10-B16, apply to equity investments (or a portion of interests in a joint venture or associate) of
an entity in a subsidiary, joint venture or associate, which is classified (or included in a classified disposal
group) as available for sale.
STANDARDS ISSUED WHICH ARE NOT YET IN FORCE
The Company is analysing the following standards by evaluating the impact that they would have on its
financial statements, without proceeding to an early application of the same. The novelties introduced are
summarised as follows.
IFRS 9 - Financial Instruments
In July 2014, IASB issued the final version of IFRS 9 Financial Instruments, which supersedes IAS 39
"Financial Instruments: Measurement and recognition and all previous versions of IFRS 9. IFRS 9 includes
all the three aspects related to the accounting of financial instruments; classification and measurement,
impairment and hedge accounting. IFRS 9 is effective to annual periods beginning on or after 1 January
2018. Early application is permitted. Except for hedge accounting, the standard shall be applied
retrospectively, although the supply of comparative information is not mandatory. As regards hedge
accounting, the standard generally applies prospectively, with a few exceptions.
No significant impact is expected on the Company Statement of Financial Position and Shareholders’ Equity.
IFRS 15 - Revenue from Contracts with Customers
The IFRS 15 standard was issued in May 2014 and amended in April 2016, and provides a five-step new
model to be applied to all contracts with customers. According to IFRS 15, revenue should be recognised for
an amount corresponding to the right in payment the entity believes to have against the sale of goods or
services to customers.

Datalogic S.p.A.
Financial Statements as at 31.12.2017 - Explanatory Notes 120
The new principle will supersede all current requirements included in IFRS on recognition of revenues. The
standard is effective for annual periods beginning on or after 01 January 2018, with fully retrospective or
modified application. Early application is permitted.
The Company will apply the new standard on the mandatory effective date. In 2016, the Company started
the preliminary assessment of effects related to IFRS 15, which is still in force. In 2017, this assessment was
completed with a more comprehensive analysis, aimed at determining the quantity impact and the first
adoption modality of the Standard.
(a) Rendering of services
Installation, maintenance, repair and technical support services are rendered by the Company. These
services are rendered both separate, based on contracts signed with customers, and jointly with the sale of
the goods to customers. In compliance with IFRS 15, the Company performed assessments on the allocation
of revenues based on the prices related to each single service. No significant impacts emerged.
(b) Presentation and required disclosures
Provisions set out by IFRS 15 concerning presentation and required disclosures are more detailed,
compared to those included in current standards. Provisions concerning the presentation involve a significant
change in practice and a significant increase in volume of information required for Company financial
statements. No significant impacts for the Company emerged from the analysis performed during 2017.
Amendments to IFRS 10 and IAS 28 - Sale or Transfer of Assets between the Parent Company and its Associated Company or Joint Venture
Amendments clarify provisions of IFRS 10 and IAS 28, with reference to the loss in control of an investee,
which is sold or transferred to an associated company or a joint venture. Amendments clarify that profit or
loss resulting from the sale or transfer of assets representing a business, as defined by IFRS 3, between an
investor and its associated company or joint venture, must be entirely recognised. Any profit or loss, resulting
from the sale or transfer of assets, which do not represent a business, is however recognised only within the
limits of the portion held by third-party investors in the associated company or joint venture. IASB postponed
the effective date of these amendments at an indefinite date. Nevertheless, if an entity resolves for an early
application, it should do it prospectively. No impact is expected on the Company’s Financial Statements.
IFRS 2 - Classification and Measurement of Share-based Payment Transactions - Amendments to IFRS 2
IASB issued the amendments to IFRS 2 Share-based payments concerning three main areas: accounting for
cash-settled share-based payment transactions that include a performance condition; classification of share-
based payments settled net of tax withholdings; accounting for modification of share-based payment
transactions from cash-settled to equity-settled.
Upon adoption, the entities must apply amendments without restating the previous years. Retrospective
application is however permitted if it is applied for the three amendments and other criteria are met. These
amendments are effective for annual periods beginning on or after 01 January 2018. Earlier application is
permitted. No impact is expected on the Company’s Financial Statements.
IFRS 16 Leases
IFRS 16 was published in January 2016 and supersedes IAS 17 - Leases, IFRIC 4 - Determining Whether
an Arrangement Contains a Lease, SIC-15 - Operating Lease - Incentives and SIC-27 - Evaluating the

Datalogic S.p.A.
Financial Statements as at 31.12.2017 - Explanatory Notes 121
Substance of Transactions in the Legal Form of a Lease. IFRS 16 defines principles for recognition,
measurement, presentation and disclosure of leases. The standard requires lessees to recognise all leases
in the financial statements according to one single accounting model, similar to the one used to recognise
financial leases, pursuant to IAS 17. The standard envisages two exceptions in recognition obligations of
lessees: lease contracts with underlying assets of a low value (e.g. personal computers) and short-term
lease contracts (e.g. leases with a lease term of 12 months or less). At the inception of the lease, the lessee
shall measure a liability against lease payments (i.e. lease liabilities) and an asset representing the right of
use of the underlying asset for the duration of the contract (i.e. the right-of-use asset). Lessees shall provide
for a separate recognition of income payables on the lease and accumulated amortisation/depreciation of the
right-of-use asset.
The lease liability is subsequently remeasured to reflect changes upon occurrence of special events (e.g.
changed terms of the lease contract, changes in future lease payments due to changes in an index or a rate
used to calculate those payments). The lessee will generally recognise the amount of the lease liability
remeasurement as an adjustment of the right-of-use asset. Accounting envisaged by IFRS 16 for lessors
remains substantially unchanged compared to the current accounting method as per IAS 17. Lessors shall
continue to classify all leases by using the same classification principle envisaged by IAS 17 and making a
distinction between two types of lease: operating and financial leases. IFRS 16 requires lessees and lessors
to provide for further disclosures compared to IAS 17.
IFRS 16 is effective for annual periods beginning on or after 01 January 2019. Early application is permitted,
but not before the entity has adopted IFRS 15. A lessor can elect to either apply the standard with full
retrospective effect or, alternatively, with a modified retrospective approach. Transitory provisions set out by
the standard allow for some benefits.
In 2018, the Company expects to define the possible effects of IFRS 16 on its financial statements.
Amendments to IAS 40 – Transfers of Investment Property
The amendments clarify when an entity should transfer or not transfer a property, including the buildings
under construction or development, under item investment property. The amendment envisages that a
change in use occurs when the property meets, or ceases to meet, the definition of property and there is
evidence of the change in use. A mere change in management’s intentions for the use of the property does
not provide evidence of a change in use. The entities shall apply those amendments prospectively to
changes in use that occur on or after the beginning of the annual reporting period in which the entity first
applies the amendments. At the date of initial application, an entity shall reassess the classification of
property held at that date and, if applicable, reclassify property to reflect the conditions that exist at that date.
Pursuant to IAS 8, the retrospective application is permitted only if it is possible without the use of hindsight.
The amendments will be applicable to annual reporting periods beginning on or after 01 January 2018.
Earlier application is permitted, of which disclosure is required. The Company will apply the amendments at
their effective date. Therefore, given that the Company’s accounting treatment is in line with clarifications,
the Company does not expect any effect on its Financial Statements.
2014-2016 annual improvements
These improvements include:
IFRS 1 First-time Adoption of International Financial Reporting Standards - Deletion of short-term exemptions for first-time adopters

Datalogic S.p.A.
Financial Statements as at 31.12.2017 - Explanatory Notes 122
Short-term exemptions envisaged in paragraphs E3-E7 of IFRS1 were deleted as they have fulfilled their
task. The amendment is effective as from 01 January 2018. This amendment is not applicable to the
Company.
IAS 28 Equity investments in associates and Joint Ventures - Clarification that measuring investees at fair value through profit or loss is an investment-by-investment choice
The amendments clarify the following:
An entity that is a venture capital organisation, or other eligible entity, may elect (on initial recognition
and for a single investment) to measure equity investments in associates and joint ventures at fair value,
recognised in the Income Statement.
If an entity that is not an investment entity has an equity investment in an associate or a joint venture,
which is an investment entity, while applying the equity method this entity may elect to keep the
measurement at fair value applied by an investment entity (either an associate or a joint venture) in
measuring its equity investments (in the associate or joint venture). This choice is made separately for
each single associate or joint venture that is an investments entity at the latest (in terms of occurrence)
of the following dates: (a) initial recognition of the equity investment in the associate or joint venture that
is an investment entity; (b) when the associate or joint venture becomes an investment entity; and (c)
when the associate or joint venture that is an investment entity becomes the Parent Company for the first
time.
The amendments should be applied retrospectively as from 01 January 2018. Earlier application is
permitted. If an early adoption is applied by an entity, it should give notice accordingly. These amendments
are not applicable to the Company.
Application of IFRS 9 Financial instruments and IFRS 4 Insurance contracts
The amendments concern the problems that arise from the adoption of the new Standard on financial
instruments, IFRS 9, before the adoption of IFRS 17 Insurance Contracts, which supersedes IFRS 4. The
amendments introduce two options for the entities that issue insurance contracts: a temporary exemption in
the application of IFRS 9 and the overlay approach. The first-time application of the temporary exemption
applies to annual reporting periods beginning on or after 01 January 2018. An entity might elect to adopt the
overlay approach upon the first-time application of IFRS 9 and this approach will be applied retrospectively to
financial assets designated upon transition to IFRS 9. The entity will restate the comparative disclosures
reflecting the overlay approach if, and only if, the entity restates the comparative disclosures when it applied
IFRS 9. These amendments are not applicable to the Company.
IFRIC Interpretation 22 Foreign Currency Transactions and Advance Consideration
The interpretation clarifies that, for the purpose of determining the spot interest exchange rate to use on
initial recognition of the related asset, expense or income (or part of it) on the derecognition of a non-
monetary asset or non-monetary liability arising from advance consideration, the date of transaction is the
date on which the entity initially recognises the non-monetary asset or non-monetary liability arising from the
payment or receipt of advance consideration. In the event of multiple payments or receipts of advance
consideration, the entity shall determine the date of transaction for each payment or receipt of advance
consideration. The entities may apply the amendments on a full retrospective basis. As an alternative, an

Datalogic S.p.A.
Financial Statements as at 31.12.2017 - Explanatory Notes 123
entity might apply the interpretation prospectively to all assets, costs and revenues that are within the scope
of the Standard and have been initially recognised on the following dates, or later:
i) At the beginning of the year in which the entity applies the interpretation for the first time.
ii) At the beginning of the previous year, disclosed for comparison purposes in the Financial
Statements, for the year in which the entity applies the interpretation for the first time.
The interpretation is effective for annual reporting periods beginning on or after 01 January 2018. Earlier
application is permitted, of which disclosure is required. Therefore, given the fact that the current accounting
policy of the Company is aligned with the interpretation, the Company does not expect any effect on its
Financial Statements.
IFRIC Interpretation 23 Uncertainty over Income Tax Treatment
The interpretation defines the accounting treatment of income taxes when there is uncertainty over income
tax treatments under IAS 12. This interpretation is not effective for taxes and duties that are not within the
scope of IAS 12 nor it includes specifically requisites related to interest or fines related to uncertain tax
treatment.
The interpretation specifically concerns the following items:
Whether an entity considers uncertain tax treatment separately
Assumptions for tax authorities’ assessments
How an entity determines the taxable profit (or tax loss), tax bases, unused tax losses, unused tax
credits and tax rates
How an entity tackles changes in facts and circumstances.
An entity shall determine whether to consider each uncertain tax treatment separately or collectively,
together with one or more uncertain tax treatments. The approach that allows the best estimate to solve the
uncertainty should be adopted. The interpretation is effective for annual reporting periods beginning on or
after 01 January 2019. Some transitory facilitations are available. The Company will apply the interpretation
at its effective date. Due to the fact that the Company operates in a complex multinational tax context, the
application of the Interpretation might have some effects on the financial statements and required
disclosures. Moreover, the Company might define processes and procedures to obtain the information
required for the prompt application of the Interpretation.
USE OF ESTIMATES
Preparation of IFRS-compliant financial statements and of the relevant notes requires directors to apply
accounting principles and methodologies that, in some cases, are based on valuations and estimates, which
in turn refer to historic experience and assumptions based on specific circumstances at any given time. The
application of such estimates and assumptions affects the amounts related to revenues, costs, assets and
liabilities, as well as contingent liabilities disclosed and any relevant information. The ultimate actual amounts
of accounting items, for which these estimates and assumptions have been used, might be different from
those reported in the financial statements due to the uncertainty characterising the assumptions and
conditions on which estimates are based.
Following are the assumptions concerning the future, as well as the other main causes of uncertainty related
to estimates which, at the reporting date, show a significant risk to generate remarkable adjustments in the
carrying values of assets and liabilities within the following financial year. The Company has based its
assumptions and estimates on parameters which were available when preparing the financial statements.
The current circumstances and assumptions on future developments might however change upon
occurrence of market changes or events beyond the Company’s control. Upon their occurrence, these
changes are reflected in the assumptions.

Datalogic S.p.A.
Financial Statements as at 31.12.2017 - Explanatory Notes 124
Impairment of non financial assets (Tangible and Intangible Assets)
An impairment occurs when the book value of an asset or CGU exceeds its recoverable value, which is its
fair value, less sales costs, and its value in use, whichever is higher. The fair value, less sales costs, is the
amount that can be obtained from the sale of an asset or a CGU, in a free transaction between aware and
willing parties, less costs for disposal. The value in use is calculated by using a discounted cash-flow model.
Cash flows result from plans. The recoverable value depends much on the discounting rate used in the
discounted cash flow model, as well as on cash flows expected in the future and the growth rate used for
extrapolation. Key assumptions, used to determine the recoverable value for the various Cash Generation
Units, including a sensitivity analysis, are thoroughly described in Note 2.
Taxes
Deferred tax assets are recognised to the extent that it is probable that taxable income will be available
against which the deductible temporary difference can be utilised. Relevant estimates performed by the
Management are required to determine the amount of tax assets that can be recognised based on the level
of future taxable income, the timing of their occurrence and tax planning strategies. Deferred tax liabilities for
taxes on retained earnings of subsidiaries, associates or joint ventures are recognised to the extent that they
are likely to remain undistributed in the foreseeable future. Estimates performed by the Management are
therefore required to determine the amount of tax assets that can be recognised and the amount of tax
liabilities, whose recognition can be omitted, based on the level of future taxable income, the timing of their
occurrence and tax planning strategies. The long-term nature, as well as the complexity of regulations in
force in the various jurisdictions, the differences resulting from actual results and assumptions made, or
future changes in such assumptions might require future adjustments to income taxes and already recorded
costs and benefits.
Fair value of financial instruments
When the fair value of a financial asset or liability, which is recognised in the statement of financial position,
cannot be measured based on deep market quotations, fair value is determined by using various
measurement techniques. Inputs included in this model are recognised by observable markets, whenever
possible, but when it is not possible, a certain level of estimates is required to determine fair values.
Employee benefits
The cost of defined-benefit plans and other post-employment healthcare benefits and the current value of the
defined-benefit obligations are determined based on actuarial measurements. Actuarial measurement
requires the elaboration of various assumptions, which might differ from the effects of future developments.
These assumptions concern the determination of discount rates, future wage increases, the mortality rate
and pension increases.
Other (Provisions for risks and charges, doubtful accounts)
Provisions for risks and charges are based on measurements and estimates relating to historic data and
assumptions, which in turn are deemed reasonable and realistic according to the related circumstances.
FINANCIAL RISK MANAGEMENT
Risk factors
The Company is exposed to various types of financial risks in the course of its business, including:

Datalogic S.p.A.
Financial Statements as at 31.12.2017 - Explanatory Notes 125
market risk, specifically:
a) foreign exchange risk, relating to operations in currency areas other than that of the functional
currency;
b) interest rate risk, connected with the Company’s level of exposure to financial instruments,
generating interest and recognised in the Statement of Financial Position;
credit risk, deriving from trade transactions or from financing activities;
liquidity risk, relating to availability of financial resources and access to the credit market.
The Company is not exposed to any price risk, as it does not hold significant quantities of listed securities in
its portfolio, nor is it otherwise exposed to the risk deriving from the trend of commodities traded on the
financial markets.
The Company specifically monitors each of the aforementioned financial risks, taking prompt action in order
to minimise such risk. The Company uses derivative contracts relating to underlying financial assets or
liabilities or future transactions. The Central Treasury Department operates directly on the market on behalf
of subsidiary and investee companies. The management of the market and liquidity risks therefore takes
place within the Company and specifically the Central Treasury Department, while credit risks are managed
by the Company’s operating units. The sensitivity analysis is subsequently used to indicate the potential
impact on the final results deriving from hypothetical fluctuations in the reference parameters. As provided
for by IFRS7, the analyses are based on simplified scenarios applied to the final figures and, owing to their
nature, they cannot be considered indicative of the actual effects of future changes.
Market risk
Foreign exchange risk
Datalogic operates internationally and is exposed to the risk associated with a variety of currencies.
Transaction risk mainly relates to financial transactions (foreign currency borrowings or loans) to/from
subsidiaries in currencies other than their functional currency.
The key currency is the US dollar (USD).
To permit full understanding of the foreign exchange risk on the Company’s financial statements, we have
analysed the sensitivity of foreign currency accounting items to changes in exchange rates. The variability
parameters applied were identified among the exchange rate changes considered reasonably possible, with
all other variables remaining equal.
The following tables show the results of this sensitivity analysis (Euro/000):
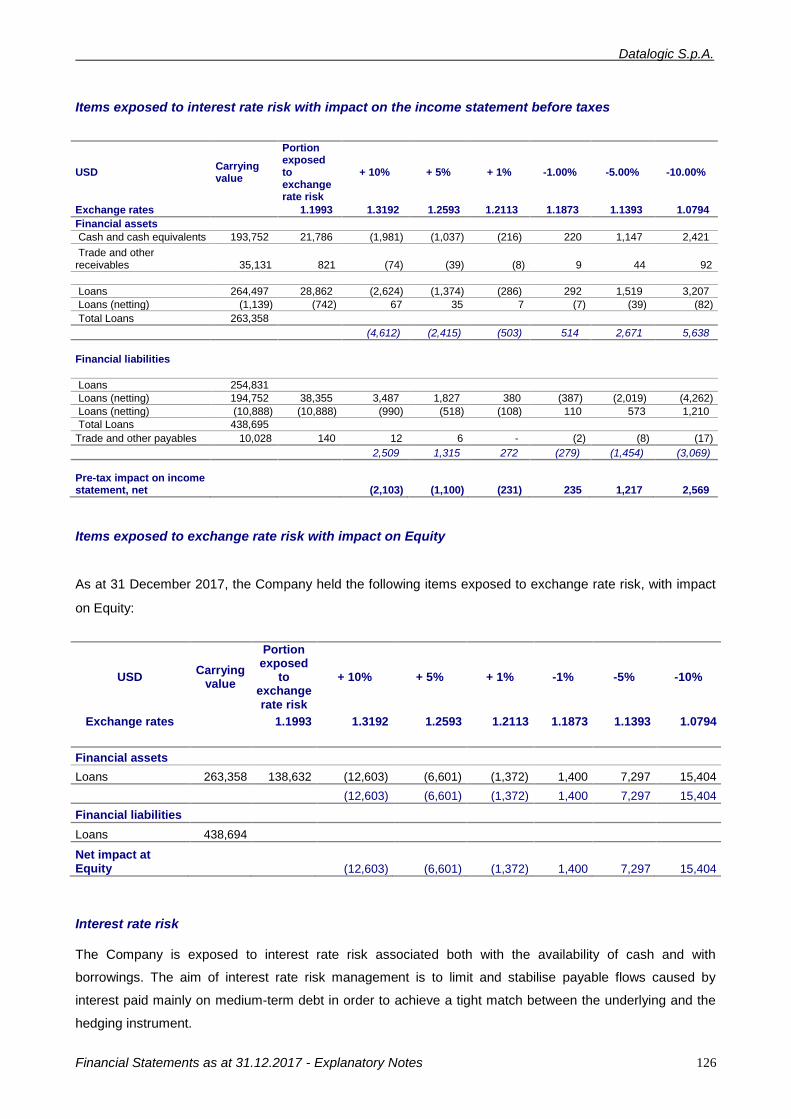
Datalogic S.p.A.
Financial Statements as at 31.12.2017 - Explanatory Notes 126
Items exposed to interest rate risk with impact on the income statement before taxes
USD Carrying value
Portion exposed to exchange rate risk
+ 10% + 5% + 1% -1.00% -5.00% -10.00%
Exchange rates 1.1993 1.3192 1.2593 1.2113 1.1873 1.1393 1.0794
Financial assets Cash and cash equivalents 193,752 21,786 (1,981) (1,037) (216) 220 1,147 2,421
Trade and other receivables 35,131 821 (74) (39) (8) 9 44 92
Loans 264,497 28,862 (2,624) (1,374) (286) 292 1,519 3,207
Loans (netting) (1,139) (742) 67 35 7 (7) (39) (82)
Total Loans 263,358
(4,612) (2,415) (503) 514 2,671 5,638
Financial liabilities
Loans 254,831
Loans (netting) 194,752 38,355 3,487 1,827 380 (387) (2,019) (4,262)
Loans (netting) (10,888) (10,888) (990) (518) (108) 110 573 1,210
Total Loans 438,695
Trade and other payables 10,028 140 12 6 - (2) (8) (17)
2,509 1,315 272 (279) (1,454) (3,069)
Pre-tax impact on income statement, net (2,103) (1,100) (231) 235 1,217 2,569
Items exposed to exchange rate risk with impact on Equity
As at 31 December 2017, the Company held the following items exposed to exchange rate risk, with impact
on Equity:
USD Carrying
value
Portion exposed
to exchange rate risk
+ 10% + 5% + 1% -1% -5% -10%
Exchange rates
1.1993 1.3192 1.2593 1.2113 1.1873 1.1393 1.0794
Financial assets
Loans 263,358 138,632 (12,603) (6,601) (1,372) 1,400 7,297 15,404
(12,603) (6,601) (1,372) 1,400 7,297 15,404
Financial liabilities
Loans 438,694
Net impact at Equity (12,603) (6,601) (1,372) 1,400 7,297 15,404
Interest rate risk The Company is exposed to interest rate risk associated both with the availability of cash and with
borrowings. The aim of interest rate risk management is to limit and stabilise payable flows caused by
interest paid mainly on medium-term debt in order to achieve a tight match between the underlying and the
hedging instrument.

Datalogic S.p.A.
Financial Statements as at 31.12.2017 - Explanatory Notes 127
With regard to medium/long-term loans, as at 31 December 2017, Datalogic had no interest rate swaps in
place. On that date, almost all the medium/long-term loans of the Company were at fixed rate.
Bank borrowings, mortgages and other short-/long-term loans Amount %
Fixed rate 252,831,236 99%
Other 2,000,000 1%
Total 254,831,236 100%
In order to fully understand the potential effects of fluctuations in interest rates to which the Company is
exposed, we analysed the accounting items most at risk, assuming a change 20 basis points in the Euribor
and of 10 basis points in the USD Libor. The analysis was based on reasonable assumptions. Below we
show the results as at 31 December 2017:
Items exposed to interest rate risk with impact on the income statement before taxes
Euribor carrying value of which exposed to exchange rate risk
20bp -20bp
Financial assets
Cash and cash equivalents 193,752 171,960 344 (344)
Loans (netting) 264,497 87,693 175 (175)
Loans (netting) (1,139) (397) (1) 1
Loans 263,358 - 518 (518)
Financial liabilities
Loans 254,831 - - -
Loans (netting) 194,752 155,798 (312) 312
Loans (netting) (10,888) - - -
Loans 438,695 - (312) 312
Total increases (decreases) 206 (206)
USD Libor carrying value of which exposed to exchange rate risk
10bp -10bp
Financial assets
Cash and cash equivalents 193,752 21,786 22 (22)
Loans (netting) 264,497 10,888 11 (11)
Loans (netting) (1,139) (742) (1) 1
Total Loans 263,358 32 (32)
Financial liabilities
Loans 254,831 - - -
Loans (netting) 194,752 38,388 (38) 38
Loans (netting) (10,888) (10,888) 11 (11)
Loans 449,583 - (27) 27
Total increases (decreases) 5 (5)

Datalogic S.p.A.
Financial Statements as at 31.12.2017 - Explanatory Notes 128
Items exposed to interest rate risk with impact on the Equity before taxes
Euribor carrying value of which exposed to exchange rate risk
20bp -20bp
Loans 263,358 9,310 19 (19)
Credit risk Datalogic S.p.A, having no direct relations with customers but only with associates, was not in fact exposed
to this risk.
Liquidity risk The Company’s liquidity risk is minimised by careful management by the Central Treasury Department. Bank
indebtedness and the management of liquidity are handled via a series of instruments used to optimise the
management of financial resources. Firstly, there are automatic mechanisms such as cash pooling
(subsidiaries are in the process of being integrated into existing arrangements) with consequently easier
maintenance of levels of availability. The Central Treasury manages and negotiates medium/long-term
financing and credit lines to meet the Company’s requirements. Specifically, following the company
restructuring described above, each division’s subholding companies have operating lines for short-term
requirements (revolving credit lines and on the receivables book) while Datalogic SpA, as the Parent
Company, has cash credit lines for future requirements in favour of the Company. Centralised negotiation of
credit lines and loans on the one hand and centralised management of the Company’s cash resources on
the other have made it possible to reduce the costs of short-term indebtedness and increase interest income.
The Company mainly operates with major historic banks, including some international institutions, which
have provided important support on foreign investments.
The following table details the financial liabilities and derivative financial liabilities settled on a net basis by
the Company, grouping them according to residual contractual maturity as at the reporting date. The
amounts shown are contractual cash flows not discounted to present value.
The following table analyses liabilities by maturity as at 31 December 2017 and 31 December 2016:
As at 31 December 2017
0 - 1 year 1 - 5 years > 5 years
Bank loans and mortgages 47,917,076 184,080,827 20,833,333
Other 1,250,000 750,000
Trade and other payables 10,027,858 0
Loans by Group Companies 183,863,251 0
Total 243,058,185 184,830,827 20,833,333
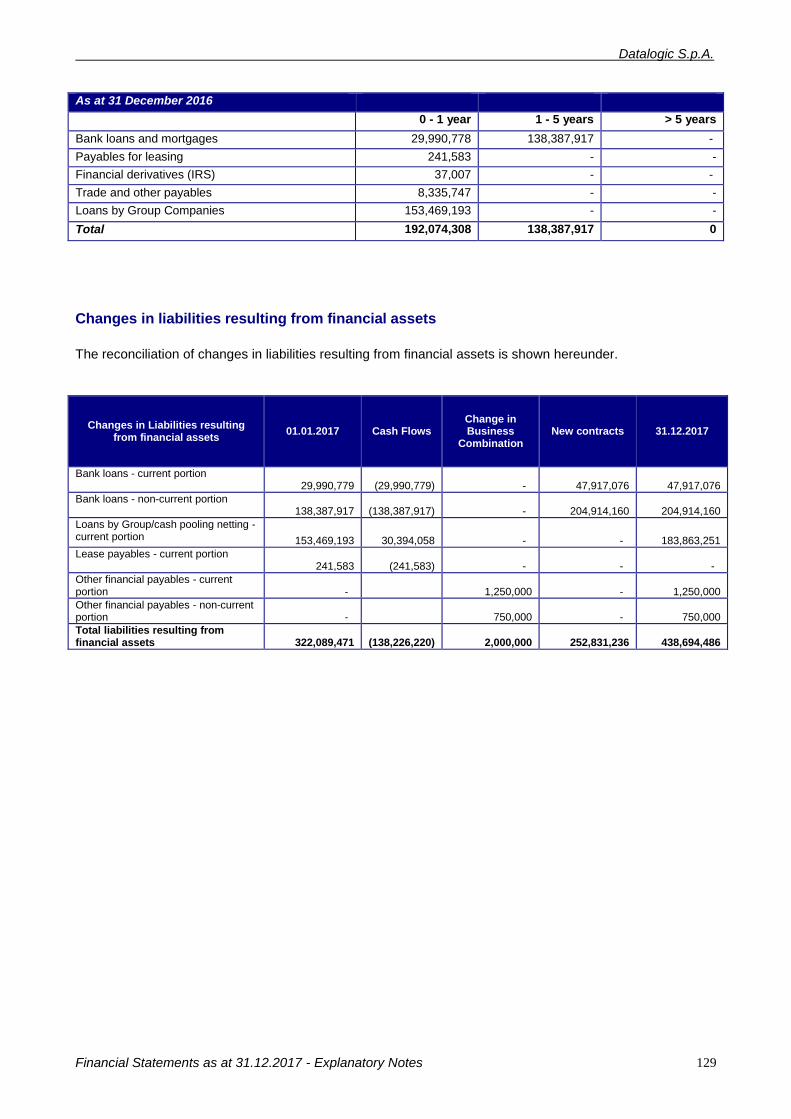
Datalogic S.p.A.
Financial Statements as at 31.12.2017 - Explanatory Notes 129
As at 31 December 2016
0 - 1 year 1 - 5 years > 5 years
Bank loans and mortgages 29,990,778 138,387,917 -
Payables for leasing 241,583 - -
Financial derivatives (IRS) 37,007 - -
Trade and other payables 8,335,747 - -
Loans by Group Companies 153,469,193 - -
Total 192,074,308 138,387,917 0
Changes in liabilities resulting from financial assets
The reconciliation of changes in liabilities resulting from financial assets is shown hereunder.
Changes in Liabilities resulting from financial assets
01.01.2017 Cash Flows Change in Business
Combination New contracts 31.12.2017
Bank loans - current portion 29,990,779
(29,990,779)
- 47,917,076 47,917,076
Bank loans - non-current portion 138,387,917
(138,387,917)
- 204,914,160 204,914,160
Loans by Group/cash pooling netting - current portion 153,469,193 30,394,058
-
- 183,863,251
Lease payables - current portion 241,583
(241,583)
-
-
-
Other financial payables - current portion
- 1,250,000
- 1,250,000
Other financial payables - non-current portion
- 750,000
- 750,000
Total liabilities resulting from financial assets 322,089,471
(138,226,220) 2,000,000 252,831,236 438,694,486

Datalogic S.p.A.
Financial Statements as at 31.12.2017 - Explanatory Notes 130
INFORMATION ON STATEMENT OF FINANCIAL POSITION - ASSETS
Note 1. Tangible assets
Details of movements as at 31 December 2017 and 31 December 2016 are as follows:
31.12.2017 31.12.2016 Change
Land 2,465,710 2,465,710 -
Buildings 15,702,356 15,631,040 71,316
Other assets 3,917,479 3,062,477 855,002
Assets in progress and payments on account - 320,806 (320,806)
Total 22,085,545 21,480,033 605,512
Changes taking place in the period are as follows:
Land Buildings Other assets Assets in progress
and payments
on account
Total
Historical cost 2,465,710 17,780,669 10,370,242 320806 30,937,427
Accumulated depreciation - (2,149,629) (7,307,765) - (9,457,394)
Net initial value at 01.01.2017 2,465,710 15,631,040 3,062,477 320,806 21,480,033
Increases 31.12.2017
Investments - 108,563 1,703,565 - 1,812,128
Reclassifications - - -
Transfers - 192,175 128,631 - 320,806
Depreciation reversal - - 162,378 - 162,378
total - 300,738 1,994,574 - 2,295,312
Decreases 31.12.2017
Disposals - - (166,812) - (166,812)
Reclassifications - - 0 - -
Transfers - - 0 (320,806) (320,806)
Depreciation - (229,422) (972,760) 0 (1,202,182)
total - (229,422) (1,139,572) (320,806) (1,689,800)
Historical cost 2,465,710 18,081,407 12,035,626 0 32,582,743
Accumulated depreciation - (2,379,051) (8,118,147) - (10,497,198)
Net closing value at 31.12.2017
2,465,710 15,702,356 3,917,479 0 22,085,545
The “Buildings” item increased by €108,563 for the completion of building works in the owned property.
The increase for the year of €1,703,565 thousand in the “Other assets” item primarily breaks down as
follows:
€1,484,709 for the purchase of a new hardware and, in particular, €1,019,388 for the new telephone
system;
€155,167 for the purchase of new furniture and fittings;

Datalogic S.p.A.
Financial Statements as at 31.12.2017 - Explanatory Notes 131
€63,689 for new electrical, hydraulic and air-conditioning systems for the new buildings
Note 2. Intangible assets
Details of movements as at 31 December 2017 and 31 December 2016 are as follows:
31.12.2017 31.12.2016 Change
Other 3,809,429 2,771,669 1,037,760
Total 3,809,429 2,771,669 1,037,760
Changes taking place in the period are as follows:
Other Total
Historical cost 10,255,912 10,255,912
(Accumulated amortisation) (7,484,243) (7,484,243)
Opening value as at 01.01.2017 2,771,669 2,771,669
Increases 31.12.2017
Investments 1,992,107 1,992,107
Reclassifications - -
Amortisation reversal 5,328 5,328
Total 1,997,435 1,997,435
Decreases 31.12.2017
Disposals (21,311) (21,311)
Reclassifications - -
Amortisation (938,364) (938,364)
Total (959,675) (959,675)
Historical cost 12,226,708 12,226,708
Accumulated amortisation (8,417,279) (8,417,279)
Net closing value at 31.12.2017 3,809,429 3,809,429
The increase for the year of €1,992,107 the item “Others" relates to:
€1,014,132 for software and primarily:
a. €58,765, software for videoconference system;
b. €201.207, software for customer service solutions;
c. €75,000, software for the management of printers;
d. €99,020 for software for IT infrastructures;
e. €68,823, software for the management of human resources.
€258,821 for implementations of SAP managing software;
€432,000 for the acquisition of a new Trademark;
€287,154 for intangible assets in progress.

Datalogic S.p.A.
Financial Statements as at 31.12.2017 - Explanatory Notes 132
Note 3. Equity investments
Equity investments held by the Company as at 31 December 2017 were as follows:
Balance as at
31.12.2016
Increases Decreases Change Balance as at 31.12.2017
Subsidiaries 174,598,858 9,568,000 - 9,568,000 184,166,858
Associates 550,000 150,000 - - 700,000
Total Associates 175,148,858 9,718,000 0 9,568,000 184,866,858
On 6 July 2017, Datalogic S.p.A. acquired 100% share capital of the company Soredi Touch Systems
GmbH, leader in technologies for terminals, especially forklifts terminals, with registered office in Olching
(Munich - Germany). The maximum total investment of the Group for the acquisition of Soredi Touch
Systems GmbH, amounted to €9.6 million including the acquired net financial position and the best estimate
of earn-outs depending on the achievement of sales and profitability targets to be paid over the next few
years. At closing, Datalogic S.p.A. paid €5.6 million cash and €2 million treasury shares (equal to 85,215
shares). Datalogic will make the residual payment, equal to €2 million, within 2021.
The increase of related equity investments refers to the purchase, occurred on 15 November 2017, of 20%
of the company R4I (acronym of Research for Innovation), an innovative SME in Benevento (Italy),
specialised in the development of solutions based on the RFIS (Radiofrequency Identification) technology.
For a comparison between the carrying value and the corresponding value recognised in the Shareholders’
Equity of investees as at 31 December 2017, reference is made to Annex 1. Negative differentials disclosed
herein are not considered as impairment losses. No adjustment was therefore carried out on the amount
recognised in the Assets.
Note 4. Financial instruments by category
The financial statement items coming within the scope of “financial instruments” as defined by IAS/IFRSs are
as follows:
31.12.2017 Loans and receivables
Financial assets at fair value charged
to the income statement
Available for sale
Total
Non-current financial assets 181,251 31,444,188 9,572,215 41,197,654
Financial assets - Equity investments (5) - - 9,572,215 9,572,215
Financial assets - Other - 31,444,188 - 31,444,188
Other receivables (7) 181,251 - - 181,251
Current financial assets 199,040,265 - - 199,040,265
Trade receivables from third parties (7) 10,774 - - 10,774
Other receivables from third parties (7) 5,277,104 - - 5,277,104
Cash and cash equivalents (10) 193,752,387 - - 193,752,387
TOTAL 199,221,516 31,444,188 9,572,215 240,237,919

Datalogic S.p.A.
Financial Statements as at 31.12.2017 - Explanatory Notes 133
31.12.2017 Other financial liabilities Total
Non-current financial liabilities 205,664,160 205,664,160
Financial payables (12) 205,664,160 205,664,160
Financial liabilities - Derivative instruments (6) - -
Other payables (16) - -
Current financial liabilities 58,084,637 58,084,637
Trade payables to third parties (16) 5,237,829 5,237,829
Other payables (16) 3,679,732 3,679,732
Financial liabilities - Derivative instruments (6) - -
Short-term financial payables (12) 49,167,076 49,167,076
TOTAL 263,748,797 263,748,797
Fair value – hierarchy
All the financial instruments measured at fair value are classified in the three categories defined below:
Level 1: market prices,
Level 2: valuation techniques (based on observable market data),
Level 3: valuation techniques (not based on observable market data).
As at 31 December 2017, the Company held the following financial instruments measured at fair value:
Level 1 Level 2 Level 3 Total
Assets measured at fair value
Financial assets - Equity investments (5) 9,495,486 - 76,729 9,572,215
Financial assets - Other LTs (5) 9,963,913 21,480,275 - 31,444,188
Total Assets measured at fair value 19,459,399 21,480,275 76,729 41,016,403
Total Liabilities measured at fair value - - - -
There are no transferrals among the hierarchical levels of fair-value compared to 31 December 2016 and in
the comparison period. There have also been no changes in the allocation of the financial instruments that
resulted in a differing classification for them.
Note 5. Financial assets
The financial assets include the following items:
31/12/2017 31/12/2016 Change
Other financial assets 31,444,188 31,006,523 437,665
Other financial assets 31,444,188 31,006,523 437,665
Other equity investments 9,572,215 4,303,493 5,268,722
Total 41,016,403 35,310,016 5,706,387

Datalogic S.p.A.
Financial Statements as at 31.12.2017 - Explanatory Notes 134
The "Other financial assets" item consists of an investment of corporate liquidity in two insurance policies
subscribed in May and July 2014, and a mutual investment fund subscribed in August 2015.
Other equity investments
As at 31 December 2017, equity investments held in other companies were as follows:
31.12.2016 Adjustment on exchange rates
Adj. to fair value
31.12.2017
Unlisted equity investments 76,729 - - 76,729
Listed equity investments 4,226,764 (893,376) 6,162,098 9,495,486
Total Equity investments 4,303,493 (893,376) 6,162,098 9,572,215
The amount of the “Listed equity investments” item is represented by the 1.2% investment in the share
capital of the Japanese company Idec Corporation listed on the Tokyo Stock Exchange.
Note 6. Derivatives
31.12.2017 31.12.2016
Interest rate derivatives - €/000 Assets Liabilities Assets Liabilities
Interest rate swaps - (on loans in euro) - - - 37,007
Interest rate swaps - (on loans in USD) - - -
Total - - - 37,007
Interest rate derivatives
As at 31 December 2017, the Company had no interest rate swap contracts in place.
Currency derivatives
As at 31 December 2017, the Company had no active forward contracts for exchange rate risk.
Note 7. Trade and other receivables
Trade and other receivables
31.12.2017 31.12.2016 Change
Trade receivables within 12 months 10,774 22,355 (11,581)
Trade receivables after 12 months - - -
Receivables from subsidiaries 28,359,181 9,536,213 18,822,968
Trade receivables 28,369,955 9,558,568 18,811,387
Other receivables - accrued income and prepaid expenses 6,761,457 1,113,770 5,647,687
Other receivables from subsidiaries - - -
Other receivables - accrued income and prepaid expenses 6,761,457 1,113,770 5,647,687
Trade and other receivables 35,131,412 10,672,338 24,459,074

Datalogic S.p.A.
Financial Statements as at 31.12.2017 - Explanatory Notes 135
“Trade receivables” of €28,359,181 thousand mainly refer to trade receivables relating to royalties for the use
of the trademark and services provided by the Company as stipulated in contracts between the parties. The
change is due to the different invoicing timing for services rendered to subsidiaries.
As at 31 December 2017 the breakdown of the item by due date is as follows:
2017 2016
Not yet due 27,789,215 8,601,840
Past due by 30 days 6,667 (135,136)
Past due by 30 - 60 days 19,209 214,189
Past due by more than 60 days 554,864 877,675
Total 28,369,955 9,558,568
The following table shows the breakdown of trade receivables by currency:
Currency 2017 2016
EURO 27,749,705 8,606,070
US Dollar (USD) 601,103 929,763
British Pound Sterling (GBP) 13,378 13,863
Australian Dollar (AUD) 5,770 8,872
TOTAL 28,369,955 9,558,568
The detail of the item “Other receivables - accrued income and prepaid expenses” is as shown below:
31.12.2017 31.12.2016 Change
Advances paid to suppliers 194,895 273,089 (78,194)
Other social security receivables 12,530 2,630 9,900
Other 35,499 125,059 (89,560)
Guarantee deposits 25,398 16,120 9,278
Accrued income and prepaid expenses 1,046,504 282,281 764,223
VAT tax receivables 5,190,033 414,591 4,775,442
Payables for consolidated VAT (2,716,703) - (2,716,703)
Sundry receivables from subsidiaries 2,973,301 - 2,973,301
Total 6,761,457 1,113,770 5,647,687
The “Accrued income and prepaid expenses” item concerns costs pertaining to 2018, mainly referred to
hardware/software maintenance and assistance
fees and costs for software licenses.
The VAT receivables as at 31 December 2017 increased due to the different periodical invoicing of services
rendered to subsidiaries.
The increase in the “Sundry receivables from subsidiaries” item is due primarily to dividends to be received
from the subsidiary Datalogic Srl.
Note 8. Tax receivables
31/12/2017 31/12/2016 Change
Receivables from parent company - - -
Tax receivables 1,146,576 1,172,666 (26,090)
Short-term tax receivables 1,146,576 1,172,666 (26,090)

Datalogic S.p.A.
Financial Statements as at 31.12.2017 - Explanatory Notes 136
“Tax receivables”, totalling €1,146,576, are broken down as follows:
- €860,807 relate to receivables for withholding taxes abroad;
- €265,390 receivables related to payments on account for IRAP tax;
- €20,380 receivables for withholding tax on bank interest income.
Note 9. Loans to subsidiaries
31/12/2017 31/12/2016 Change
Non-current loans to subsidiaries - - -
Current loans to subsidiaries 263,358,273 309,195,037 (45,836,764)
Total 263,358,273 309,195,037 (45,836,764)
“Loans to subsidiaries” breaks down as follows:
31/12/2017 31/12/2016 Amount in foreign currency
Loans
Datalogic USA Inc 121,747,275 138,517,700 USD 146,011,507
Datalogic Srl 16,884,850 19,210,701 USD 20,250,000
Datalogic Hungary Kft 9,310,000 9,310,000 -
Datalogic Australia Pty - 1,781,310 AUD 2.600.000
Datalogic Singapore Ltd - 948,677 USD 1,000,000
Cash pooling
Datalogic USA Inc 16,945,654 66,373,738
Datalogic Srl 59,590,724 34,174,949
Datalogic IP-Tech Srl 26,327,044 21,115,215
Datalogic Srl - Sweden (branch) 6,019,246 5,832,997
Datalogic Srl - Spain (branch) 2,833,061 4,752,364
Informatics 2,291,333 1,869,693
Datalogic Srl - UK (branch) 1,208,602 2,848,385
Datalogic Srl - France (branch) 200,484 2,459,309
Total 263,358,273 309,195,038
During the year, the subsidiaries Datalogic Australia Pty and Datalogic Singapore Ltd repaid the Company of
the loans granted.
Note 10. Cash and cash equivalents
Cash and cash equivalents are broken down as follows for the purposes of the cash flow statement:
31.12.2017 31.12.2016 Change
Bank and post office deposits and cash pooling 193,748,512 78,219,083 115,529,429
Cash and valuables on hand 3,875 3,705 170
Cash and cash equivalents for statement 193,752,387 78,222,788 115,529,599
According to the requirements of CONSOB Communication no. 15519 of 28 July 2006, the Company’s
financial position is reported in the following table:

Datalogic S.p.A.
Financial Statements as at 31.12.2017 - Explanatory Notes 137
31.12.2017 31.12.2016
(Euro/000)
A. Cash and bank deposits 193,752,387 78,222,788
B. Other cash and cash equivalents - -
C. Securities held for trading - -
c1. Short-term - -
c2. Long-term - -
D. Cash and cash equivalents (A) + (B) + (C) 193,752,387 78,222,788
E. Current financial receivables 263,358,273 309,195,037
F. Other current financial receivables - -
G. Bank overdrafts - -
H. Current portion of non-current debt 233,030,327 183,701,554
I. Other current financial payables - 37,007
I2. Hedging transactions - 37,007
J. Current financial debt (G) + (H) +(I) 233,030,327 183,738,561
K. Current financial debt, net (J) - (D) - (E) - (F) (224,080,333) (203,679,264)
L. Non-current bank borrowing 205,664,160 138,387,917
M. Other financial assets 31,444,188 31,006,523
N. Other non-current liabilities - -
O. Non-current financial debt (L) - (M) + (N) 174,219,972 107,381,394
P. Net financial debt (K) + (O) (49,860,361) (96,297,870)
Net financial position as at 31 December 2017 was €49,860,361, a decrease of €46,437,509 compared to 31
December 2016 (EUR 96,297,870).
Note that the following transactions were carried out in the period:
- payment of dividends of €17,443,278.60;
- acquisition of the company Soredi Touch System Gmbh and the trademark, occurred on 06 July 2017,
which involved a disbursement of €5,866,000;
- new credit line for the value of €250 million, with maturity term in 2023 (for further details, reference is made
to Note 12);
- reimbursement of loans from subsidiaries Datalogic Australia Ltd and Datalogic Singapore Ltd for a total
amount of €1,933,250.
The "Other financial assets" item consists of an investment of corporate liquidity in two insurance policies
and a mutual fund that are readily convertible into cash.

Datalogic S.p.A.
Financial Statements as at 31.12.2017 - Explanatory Notes 138
INFORMATION ON STATEMENT OF FINANCIAL POSITION - SHAREHOLDERS' EQUITY AND LIABILITIES
Note 11. Shareholders' Equity
The detail of equity accounts is shown below, while changes in equity are reported in the specific statement:
31.12.2017 31.12.2016
Share capital 30,392,175 30,392,175
Share premium reserve 106,940,859 106,145,515
Extraordinary share-cancellation reserve 2,813,190 2,813,190
Treasury shares held in portfolio 6,119,564 4,119,564
Treasury share reserve 2,025,473 2,820,817
Share capital 148,291,261 146,291,261
Cash-flow hedge reserve (948,066) (28,125)
Valuation reserve at current value 5,695,246 489,748
Severance indemnity discounting reserve 88,146 88,146
Other reserves 4,835,326 549,769
Retained earnings 112,921,061 92,502,593
Earnings carried forward 73,071,234 37,961,518
Temporary reserve for exchange rate adjustment 8,981,690 23,672,937
Capital contribution reserve 958,347 958,347
Reserve for surplus from cancellation, Datalogic RE Srl 203,538 203,538
Legal reserve 6,078,435 6,078,436
IAS reserve 8,423,473 8,423,473
Capital contribution reserve 15,204,344 15,204,344
Profit for the year 25,591,520 52,334,217
Total Shareholders' Equity 291,639,168 291,677,840
Share capital
The share capital as at 31 December 2016 and 31 December 2017 is reported below (in €/000):
Number of
shares Share capital Extraordinary
share-cancellation
reserve
Share premium reserve
Treasury shares
Treasury share
reserve
Total
01.01.2017 58,144,262 30,392,175 2,813,190 106,145,515 4,119,564 2,820,817 146,291,261
Purchase of treasury shares
0 - - - - - -
Sale of treasury shares
85,215 - - 795,344 795,344 (795,344) 795,344
Capital gain on sale of treasury shares
- - - - 1,204,656 - 1,204,656
31.12.2017 58,229,477 30,392,175 2,813,190 106,940,859 6,119,564 2,025,473 148,291,261

Datalogic S.p.A.
Financial Statements as at 31.12.2017 - Explanatory Notes 139
Ordinary shares
As at 31 December 2017, the total number of ordinary shares was 58,446,491, including 217,014 held as
treasury shares, making the number of shares in circulation at that date 58,229,477. The shares have a
nominal unit value of €0.52 and are fully paid up.
Treasury shares
The “Treasury shares” item, amounting to €6,119,564, includes capital gains/(losses) resulting from the sale
of treasury shares, net of purchases and related charges (€8,145,037). During 2017, the Company sold
85,215 treasury shares, with a value of €2,000,000 for the acquisition of the company SOREDI Touch
Systems GmbH, with a capital gain of €1,204,656.
For these purchases, in accordance with Article 2357 of the Italian Civil Code, the Treasury share reserve, in
the amount of €2,025,473, was made unavailable by using the Share premium reserve.
Other Reserves
Cash-flow hedge reserve
Pursuant to provisions set forth by IAS 39, the change in fair value of derivative contracts, designated as
effective hedging instruments, is recognised in accounts directly with Shareholders’ Equity, in the cash-flow
hedge reserve. These contracts were entered to hedge exposure to the risk of interest rate fluctuations on
variable-rate loans. The reserve, negative by €948,066, includes the fair value of the hedging instrument
related to refinancing.
Capital contribution reserve
This reserve has been created after the recording, under the Company’s assets, of the equity investments in
the company Datalogic IP Tech S.r.l.
Reserve for surplus from cancellation, Datalogic Real Estate S.r.l.
This reserve has been created after the cancellation of the Company’s equity investment in the company
Datalogic Real Estate S.r.l.
Retained earnings
IAS reserve
This reserve was created upon first-time adoption of international accounting standards at 1 January 2006 in
accordance with IFRS 1.

Datalogic S.p.A.
Financial Statements as at 31.12.2017 - Explanatory Notes 140
Dividends
On 4 May 2017, the Ordinary Shareholders’ Meeting of Datalogic S.p.A. decided to distribute an ordinary
dividend of €0.30 per share (€0.25 in 2016). The overall dividends began to be paid starting from 10 May
2017 and had been paid in full by 31 December.
Classification of Shareholders’ equity items
NATURE/DESCRIPTION AMOUNT POSSIBLE
USE AMOUNT
AVAILABLE Summary of uses made in the 3
previous years
For hedging against losses
For other reasons
Share capital 30,392,175
Capital reserves 133,564,485
Share premium reserve 106,940,859 A,B 106,940,859 - -
Extraordinary share-cancellation reserve 2,813,190 A,B,C 2,813,190 - -
Treasury share reserve 2,025,473 - - - 5,282,262
Capital contribution reserve 15,204,345 A,B,C 15,204,345 - -
Merger surplus 203,538 A,B,C 203,538 - -
Revaluation reserves 257,516 A,B - - -
Treasury share reserve 6,119,564 - 6,119,564 - -
Other reserves 4,835,326
Cash-flow hedge reserve (948,066) - - - -
Valuation reserve for financial assets held for sale
5,695,246 - - - -
Severance indemnity discounting reserve
88,146 - - - -
Retained earnings 97,255,662
Earnings carried forward 70,415,921 A,B,C 70,415,921 - 2,776,423
Reserve for deferred tax assets 2,655,313 A,B 2,655,313 - -
Reserve for exchange rate adjustment 8,981,690 A,B 8,981,690 - -
Capital contribution reserve 958,347 B - - -
Legal reserve 6,078,435 B - - -
IAS/IFRS transition reserve 8,165,956 A,B,C - - -
Total 213,334,420
Non-distributable portion 124,697,426
Distributable residual portion 88,636,994
Key: A: for capital increase B: to cover losses C: for payments to shareholders
The Deferred tax reserve is a reserve temporarily non-distributable until the date on which the deferred tax
assets posted on the statement of financial position are realised.
The Temporary reserve for adjustment on exchange rates was created in application to IAS 21.15. This
reserve comprises profit/losses generated by monetary elements, which are an integral part of the net
investment of foreign managements. €8,981,690 are related to the effect of exchange rates measurement at
year-end for receivables for loans in US dollars granted to the subsidiaries Datalogic USA Inc. and Datalogic

Datalogic S.p.A.
Financial Statements as at 31.12.2017 - Explanatory Notes 141
S.r.l.. For these loans no regulation and/or defined reimbursement plan are provided, nor is it deemed
probable that they will be reimbursed in the foreseeable future.
The Actuarial gains and losses reserve comprises the Income Statement profit and losses pursuant to
provisions set out by IAS 19R.
Note 12. Short/long-term borrowings and financial liabilities
The breakdown of this item is as detailed below:
31.12.2017 31.12.2016 Change
Bank loans 252,831,236 168,378,695 84,452,541
Loans by Group Companies/cash pooling - netting 183,863,251 153,469,193 30,394,058
Payables for leasing - 241,583 (241,583)
Other financial liabilities 2,000,000 - 2,000,000
Total Financial payables 438,694,487 322,089,471 116,605,016
Financial payables are represented as follows:
within 12 months
after 12 months
after 5 years Total
Current accounts/cash pooling 183,863,251 - - 183,863,251
Bank loans, mortgages and other financial institutions
47,917,076 184,080,827 20,833,333 252,831,236
Other 1,250,000 750,000 - 2,000,000
Total 233,030,327 184,830,827 20,833,333 438,694,487
The “current accounts/cash pooling” item relates to payables to Group companies owing to cash pooling
agreements for centralised liquidity management.
The “Others” item includes the financial debt related to the acquisition of the company SOREDI Touch
Systems GmbH, which will be paid by 2021.
Bank loans
Following is the breakdown of changes in “bank loans” as at 31 December 2017:
2017 2016
Opening balance 168,378,695 171,330,830
Increases 249,249,304 29,841,000
Repayments (125,580,667) (20,000,000)
Decreases for loan repayments (39,216,096) (12,793,135)
Closing balance 252,831,236 168,378,695
On 13 April, the Company an agreement for a new credit line worth €250 million and maturing in 2023. The
loan granted was partly intended for an early redemption, compared to the original maturity, of the existing
credit line (€126 million), and partly to support the ordinary activities and development of the Group.

Datalogic S.p.A.
Financial Statements as at 31.12.2017 - Explanatory Notes 142
The transaction was concluded at a fixed rate, so as to allow the Company to take advantage of the
favourable interest rates currently available on the market and to lock in the cost of the Datalogic Group
funding over the coming years.
Guarantees given by banks in the Company’s favour total €735,362. Moreover, the Company issued a credit
mandate in the amount of €2,598,055 related to the issue of trade guarantees in the interest of subsidiaries
and a guarantee of €1,973,504 in favour of the Inland Revenue Office, for VAT credit of the company
Datalogic Iptech Srl.
Financial leases
In past years, the Company entered a financial lease agreement for the telepresence system, which expired
this year:
31 December 2017 31 December 2016
EURO/000 Minimum payments
Current value of
payments
Minimum payments
Current value of
payments
Within the year 248 242
Total minimum payments 248 242
Less interest expenses (6)
Current value of lease costs 242 242
Note 13. Deferred taxes
Deferred tax assets and liabilities stem both from positive items already recognised in the income statement
and subject to deferred taxation under current tax regulations and temporary differences between balance-
sheet assets and liabilities and their relevant taxable value.
Below we show the main items forming deferred tax assets and deferred tax liabilities and changes occurring
in them over the year:
Deferred tax liabilities
Adjustment on exchange
rates
Deprec. and Amort.
Provisions Other Round. Total
As at 01 January 2017
8,191,000 1,343,000 (128,000) 51,000 480 9,457,480
Provisioned in (released from) Income Statement
(62,000) (51,313) -
33,240 - (80,073)
Provisioned in (released from) Shareholders’ Equity
76,076 - - - -
76,076
Reclassifications 82,000
100,000
18,962
113,000
(480)
313,482
As at 31 December 2017
8,287,076
1,391,687
(109,038)
(197,240)
-
9,766,965

Datalogic S.p.A.
Financial Statements as at 31.12.2017 - Explanatory Notes 143
Deferred tax assets
Adjustment on
exchange rates
Deprec. and Amort.
Allocations Other Round. Total
As at 01 January 2017 1,075,000
- 228,000 3,000 432 1,306,432
Provisioned in (released from) Income Statement
1,765,000
35,000 271,517
65,000 - 2,136,517
Provisioned in (released from) Shareholders’ Equity 4,583,000 - -
(8,064) - 4,574,936
Reclassifications 82,000
100,000
18,000
113,000 (432) 312,568
As at 31 December 2017 7,505,000 135,000 517,517 172,936 - 8,330,453
Note 14. Post-employment benefits
31.12.2017 31.12.2016
01.01.2017 484,422 527,123
Amount allocated in the period 215,023 224,409
Amount transferred for transfer of employment relationships 8,495 (18,091)
Uses (134,970) (122,322)
Social security receivables for the employee severance indemnity reserve
(74,725) (126,697)
31.12.2017 498,245 484,422
The item Uses is related to €103,387 for resignations and €26,255 for requests of advance payments.
Note 15. Provisions for risks and charges
The breakdown of the “risks and charges” item is as follows:
31.12.2017 31.12.2016 change
Long-term provisions for risks and charges 1,748,000 903,725 844,275
Short-term provisions for risks and charges 85,854 82,854 3,000
Total Provisions for risks and charges 1,833,854 986,579 847,275
Below we show the detailed breakdown of and changes in this item:
31.12.2016 Increases (decreases) 31.12.2016
Provision for management incentive scheme 903,725 844,275 - 1,748,000
Provision for tax liabilities 7,854 - - 7,854
Other funds 75,000 538,446 (535,446) 78,000
Total Provisions for risks and charges 986,579 1,382,721 (535,446) 1,833,854

Datalogic S.p.A.
Financial Statements as at 31.12.2017 - Explanatory Notes 144
The “Provision for management incentive scheme” is attributable to the estimate on the portion pertaining to
the provision for a long-term plan for directors and managers.
The “Other funds” item refers to transactions in place with employees.
Note 16. Trade and other payables
This table shows the details of trade and other payables:
31.12.2017 31.12.2016 Change
Trade payables 5,896,589 4,570,820 1,325,769
Trade payables due within 12 months 5,237,829 4,030,551 1,207,278
Payables to Group companies 658,760 540,269 118,491
Other short-term payables 3,679,967 3,300,020 379,947
Accrued liabilities and deferred income 451,302 464,907 (13,605)
The change in the “Trade payables falling due within 12 months” item is primarily due to a higher number of
projects implemented in 2017 compared to the previous year, following the Group’s organisational changes.
In particular, the change in payables at year end is determined above all by new maintenance fees and
software assistance.
Other payables – accrued liabilities and deferred income
The detailed breakdown of “Other payables” was as follows: 31.12.2017 31.12.2016 Change
Payables to pension and social security agencies 1,055,745 932,485 123,260
Payables to employees 1,821,730 1,494,717 327,013
Directors’ remuneration payable 740,849 479,778 261,071
Deferred income on investment grants 451,302 464,907 (13,605)
Other payables to the Group 235 44,339 (44,104)
Group VAT payables - 254,854 (254,854)
Other payables 61,408 93,847 (32,439)
Total 4,131,269 3,764,927 366,342
Amounts payable to employees represent the amount due for salaries and vacations accrued by employees
as at the reporting date.
The item “Deferred income on investment grants” totalling €451,302 relates to the reclassification of public
capital grants on assets.
These grants were reversed from equity reserves based on the provisions of IAS 20 and reallocated among
deferred income, in order to match them with the actual cost incurred, i.e. with depreciation of the assets to
which they refer.

Datalogic S.p.A.
Financial Statements as at 31.12.2017 - Explanatory Notes 145
Note 17. Tax payables
31.12.2017 31.12.2016 Change
Short-term tax payables 1,036,760 2,211,291 (1,174,531)
Long-term tax payables - - -
Total Tax payables 1,036,760 2,211,291 (1,174,531)
Income tax payables only include liabilities for definite and calculated tax due and it is composed as follows:
€398,547, Irpef withholding taxes related to employees;
€252,762, payables for taxes towards the subsidiary Hydra S.p.a., following the adhesion of the tax
consolidation regime.
€228,838, amount payable for IRAP regional tax
€153,548, amount payable related to a judicial conciliation settlement for tax assessment
€3,065, withholding taxes on remuneration to freelancers.

Datalogic S.p.A.
Financial Statements as at 31.12.2017 - Explanatory Notes 146
INFORMATION ON THE INCOME STATEMENT Note 18. Revenues
31.12.2017 31.12.2016 Change
Royalties for the uses of the trademark 15,684,736 14,657,809 1,026,927
Services rendered to subsidiaries 10,914,432 9,377,300 1,537,132
Total Revenues 26,599,168 24,035,109 2,564,059
Revenues for services rendered to subsidiaries refer mainly, in the amount of €6,234,569 to costs for
Information Technology, in the amount of €1,041,409 to structural costs and in the amount of €809,117 to
payroll services and centralised HR services.
Note 19. Cost of goods sold and operating costs
31.12.2017 31.12.2016 Change
TOTAL COST OF GOODS SOLD (1) 1,964,645 1,470,216 494,429
TOTAL OPERATING COSTS (2) 22,928,404 18,369,209 4,559,195
R&D expenses 403,808 396,276 7,532
of which non-recurring - -
Distribution expenses 901,807 1,848,076 (946,269)
of which non-recurring 1,600 9,340 (7,740)
General and administrative expenses 20,947,309 17,181,973 3,765,336
of which non-recurring 392,657 710,943 (318,286)
Other operating costs 675,480 (1,057,116) 1,732,596
of which non-recurring - -
Total (1+2) 24,893,049 19,839,425 5,053,624
of which non-recurring costs 394,257 720,283 (326,026)
Non-recurring costs refer to the implementation plan for the new organisation of the Company Datalogic and refer primarily to professional advisory services.
Total Cost of goods sold (1)
Expenses related to the “Cost of goods sold” item are broken down as follows:
31.12.2017 31.12.2016 Change
Personnel costs 1,417,536 1,101,780 315,756
Technical, legal and tax advisory services 383,909 216,461 167,448
Travel & accommodation 55,576 79,539 (23,963)
Rental and building maintenance 34,019 16,136 17,883
Utilities and telephone subscriptions 24,221 11,592 12,629
Vehicle leasing and maintenance 18,472 18,898 (426)
Costs for training of employees 16,068 3,058 13,010
Other costs 12,928 22,284 (9,356)
Amortisation/depreciation 2,165 538 1,627
Total Cost of goods sold 1,964,894 1,470,286 494,608

Datalogic S.p.A.
Financial Statements as at 31.12.2017 - Explanatory Notes 147
Total Operating costs (2)
“Research and Development” expenses are made up as follows:
31.12.2017 31.12.2016 Change
Software maintenance and assistance 363,121 280,637 82,484
Amortisation 26,276 25,366 910
Technical, legal and tax advisory services 14,400 0 14,400
Other costs 11 863 (852)
Personnel costs 0 87,587 (87,587)
Vehicle leasing and maintenance 0 1,429 (1,429)
Total Costs for Research and Development 403,808 395,882 7,926
The “distribution” expenses are broken down as follows:
31.12.2017 31.12.2016 Change
Personnel costs 434,422 1,194,781 (760,359)
Advertising and Marketing 252,280 465,106 (212,826)
Software maintenance and assistance 62,911 32,913 29,998
Amortisation 51,342 48,809 2,533
Other costs 35,221 29,704 5,517
Technical, legal and tax advisory services 33,042 24,284 8,758
Travel & accommodation 13,545 28,147 (14,602)
Entertainment expenses 12,203 19,084 (6,881)
Utilities and telephone subscriptions 6,840 5,218 1,622
Total Operating costs 901,806 1,848,046 (946,240)
The change over the year is primarily due to:
“Personnel cost”, amounting to €760,359 for a reduced number of resources in the Marketing area;
“Advertising and marketing”, amounting to €212,826 for the insourcing of the press office activities.
The “General and administrative” expenses are broken down as follows:
31.12.2017 31.12.2016 Change
Personnel costs 9,306,528 7,893,257 1,413,271
Software maintenance and assistance 2,249,062 1,817,391 431,671
Amortisation 2,047,158 1,702,423 344,735
Directors’ remuneration 1,966,235 1,193,862 772,373
Technical, legal and tax advisory services 1,728,382 1,854,926 (126,544)
Utilities and telephone subscriptions 1,124,336 930,626 193,710
Rental and building maintenance 423,958 320,899 103,059
Service costs rendered by subsidiary 412,028 0 412,028
Travel & accommodation 308,369 299,767 8,602
Other costs 282,365 191,902 90,463

Datalogic S.p.A.
Financial Statements as at 31.12.2017 - Explanatory Notes 148
Accounts certification expenses 240,562 177,669 62,893
Membership fees 181,968 176,181 5,787
Stock exchange costs 168,480 133,947 34,533
Entertainment expenses 137,838 107,551 30,287
Board of Statutory Auditors’ remuneration 84,283 59,580 24,703
Advertising and Marketing 78,205 89,118 (10,913)
Vehicle leasing and maintenance 73,534 74,061 (527)
Costs for training of employees 58,553 96,464 (37,911)
Insurance costs 42,915 45,763 (2,848)
Patent costs 32,550 16,588 15,962
Total Administrative and general costs 20,947,309 17,181,975 3,765,334
The change over the year is primarily due to:
“Personnel costs”, amounting to €1,413,271, due to allocations to the Provision for management
incentive scheme and to the hiring of new managers;
“Software maintenance and assistance”, amounting to €431,671 for new licences;
“Service costs rendered by subsidiaries”, amounting to €412,028, referring to costs charged to
Datalogic Srl, which centrally manages invoicing of expenses borne by one or more companies for
administrative, commercial activities or activities of some subsidiaries and the parent company.
The detail of the “Other operating costs” item is as follows:
31.12.2017 31.12.2016 Change
Allocation to provisions for risks 414,142 - 414,142
Capital losses on assets 2,598 4,929 (2,331)
Contingent and unsubstantiated liabilities 34,651 11,938 22,713
Non-income taxes 165,737 339,562 (173,825)
Release of Provision for management incentive scheme (1,413,545) 1,413,545
Other 58,352 - 58,352
Total Other operating costs 675,480 (1,057,116) 1,732,596
The “Release of Provision for management incentive scheme” item refers to last year’s release of the
provision for management incentive scheme due to redundancies.
Breakdown of costs by type
The following table provides the details of total costs (cost of goods sold + total operating costs) by type, for
the main items:

Datalogic S.p.A.
Financial Statements as at 31.12.2017 - Explanatory Notes 149
31.12.2017 31.12.2016 Change
Personnel costs 11,158,486 10,268,404 890,082
Software maintenance and assistance 2,675,244 2,130,941 544,303
Technical, legal and tax advisory services 2,159,733 2,095,673 64,060
Amortisation 2,126,941 1,777,136 349,805
Directors’ remuneration 1,966,235 1,193,862 772,373
Utilities and telephone subscriptions 1,155,397 947,968 207,429
Other costs 1,117,339 354,505 762,834
Rental and building maintenance 462,769 344,644 118,125
Service costs rendered by subsidiary 412,028 0 412,028
Travel & accommodation 377,490 407,534 -30,044
Stock exchange costs and membership fees 351,643 320,932 30,711
Advertising and Marketing 334,332 563,224 -228,892
Accounts certification expenses 240,562 177,669 62,893
Entertainment expenses 141,616 116,763 24,853
Vehicle leasing and maintenance 96,401 101,002 -4,601
Board of Statutory Auditors’ remuneration 84,283 59,580 24,703
Patents 32,550 16,588 15,962
Release of Provision for management incentive scheme 0 -1,037,000 1,037,000
Total (1+2) 24,893,049 19,839,425 5,053,624
Costs related to “Software maintenance and assistance” increased by €544,303 due to new licenses.
Cost related to “Directors’ remuneration” increased following the resolution of the Shareholders’ Meeting held
on 04 May 2017.
The “Release of Provision for management incentive scheme” item refers to last year’s release of the
provision for management incentive scheme due to redundancies.
The amount of €412,028 in item “Service costs rendered by subsidiary” refers to expenses charged by
subsidiaries for costs pertaining to the Parent Company.
The detailed breakdown of Personnel costs is as follows:
31.12.2017 31.12.2016 Change
Wages & salaries 7,159,623 6,822,156 337,467
Social security charges 1,849,543 1,772,580 76,963
Employee severance indemnities 234,679 234,925 (245)
Retirement and similar benefits 240,867 229,720 11,147
Medium- to long-term managerial incentive plan 844,275 0 844,275
Reimbursements for seconded personnel 0 (9,267) 9,267
Other costs 829,498 1,218,290 (388,792)
Total 11,158,486 10,268,404 890,082
The “Other costs” item includes €258,794 of Early retirement incentives and €358,602 of costs for the hiring of staff.

Datalogic S.p.A.
Financial Statements as at 31.12.2017 - Explanatory Notes 150
Note 20. Other operating revenues
The detailed breakdown of this item is as follows:
31.12.2017 31.12.2016 Change
Incidental income and cost cancellation 16,021 34,000 (17,979)
Rents 510,382 509,188 1,194
Ordinary capital gains 1,922 404 1,518
Other 91,717 101,957 (10,240)
Total Other revenues 620,042 645,549 (25,507)
21. Net financial income
2017 2016 Change
Financial income/(expenses) 1,754,077 3,464,023 (1,709,946)
Bank expenses (593,205) (267,797) (325,409)
Foreign exchange loss (8,886,175) (539,766) (8,346,409)
Foreign exchange gains 3,155,692 3,860,380 (704,688)
Dividends 25,397,506 43,400,928 (18,003,422)
Other 601,331 613,567 (12,236)
Total Net financial income (expenses) 21,429,226 50,531,336 (29,102,110)
Total Financial expenses
The “Foreign exchange losses” item equals €8,886,175 and is detailed as follows:
- €8,376,130 for alignment with the end-of-period exchange rate;
- €400,902 in foreign exchange losses relating to loans and current accounts in foreign currency;
- €109,143 in foreign exchange losses relating to commercial transactions;
The item “Bank expenses” of €593,205 relates to:
- €590,939 in ordinary banking commissions relating to the movements of current accounts and the
taking out of medium-/long-term loans;
- €2,266 for fees on sureties.
Total Financial income
The item “Foreign exchange gains” of €3,155,692 relates to:
- €3,055,482 for alignment with the end-of-period exchange rate;
- €58,312 in foreign exchange gains relating to loans and current accounts in foreign currency;
- €41,898 in foreign exchange gains relating to commercial transactions.

Datalogic S.p.A.
Financial Statements as at 31.12.2017 - Explanatory Notes 151
The “Dividends” item, amounting to €25,397,506, relates to earnings distributed during 2017 as follows:
- Subsidiary Datalogic Srl for €25,268,987;
- Company Idec Corporation €128,519.
Note 22. Taxes
31.12.2017 31.12.2016
Income tax 380,254 2,725,792
Deferred taxes (2,216,387) 312,555
Total (1,836,133) 3,038,347
Deferred taxes were calculated according to global allocation criteria, considering the cumulative amount of
all interim differences, based on the average rates expected to be in force at the time these temporary
differences had an effect.
The reconciliation for 2017 of the nominal tax rate and the effective rate in the financial statements is shown
in the following table:
2017
Pre-tax profit 23,755,387
Nominal tax rate under Italian law (5,701,293) -24.00%
Effects of local taxes (152,000) -0.60%
Tax effect on dividends 5,857,040 24.70%
Tax effects - previous years 654,630 2.80%
Other effects 1,177,756 4.96%
Consolidated effective tax rate 1,836,133 7.73%
NOTICE OF INDEPENDENT AUDTORS’ FEES
Pursuant to article 149-duodecies of the Issuer Regulation, implementing Legislative Decree 58 of 24
February 1998, the following is the summary schedule of fees pertaining to the year 2016 provided by the
independent auditors and divided in auditing and other services.
Fees for auditing services Other remuneration
Datalogic Spa 296,000 -

Datalogic S.p.A.
Financial Statements as at 31.12.2017 - Explanatory Notes 152
Related-party transactions
Euro
RELATED PARTIES Hydra Spa Hydra Immobiliare
S.n.c.
Group company DL SRL
Group company Real
Estate
Receivables
Trade receivables - - 30,661,646 18,667
Receivables pursuant to tax consolidation - - - -
other receivables/prepaid expenses - - - -
Receivables for cash pooling - - - -
Financial receivables - - 234,739,897 -
Payables
Liabilities pursuant to tax consolidation 252,762 - - -
Trade payables - 8,060 635,101 9,804
Other payables - - -
Financial payables - - 180,126,245 3,737,005
Costs
Sales/service expenses - 113,018 592,692 -
Financial costs - - 311,256 3,531
Revenues
Commercial revenues - - 28,097,614 80,560
Financial income - - 5,137,218 -
Euro
RELATED PARTIES Informatics Datalogic Ip
Tech Srl
CAEN RFID TOTAL
31.12.2017
Receivables
Trade receivables 58,939 589,177 - 31,328,428
Receivables pursuant to tax consolidation - - - -
other receivables/prepaid expenses - - -
Receivables for cash pooling - - -
Financial receivables 2,291,333 26,327,044 - 263,358,273
Payables
Liabilities pursuant to tax consolidation - 2,716,703 - 2,969,465
Trade payables - 687 - 653,652
Other payables - - -
Financial payables - - - 3,917,132
Costs
Sales/service expenses - 4,445 13,719 723,874
Financial costs - - - 314,787
Revenues
Commercial revenues 61,449 549,473 - 28,789,096
Financial income 49,403 56,021 - 5,242,642

Datalogic S.p.A.
Financial Statements as at 31.12.2017 - Explanatory Notes 153
Transactions with companies controlled by shareholders
Transactions with Hydra Immobiliare, a company controlled by the reference shareholders of the Company,
refer to the rental of property by the Company (€133,018).
Company transactions with the parent company (Hydra Spa) mainly relate to the IRES payable of €252,762;
the Company has joined the tax consolidation scheme, as a consolidated company (Hydra is the
consolidator).
Remuneration paid to Directors and Statutory Auditors
For this information, please refer to the report on remuneration which will be published pursuant to article
123-ter of the T.U.F. [Consolidated Law on Finance] and will be published on the website
www.datalogic.com.
The Chairman of the Board of Directors
(Mr. Romano Volta)

Annex 1
LIST OF EQUITY INVESTMENTS IN SUBSIDIARIES AND AFFILIATES AS AT 31 December 2017 (ART. 2427 no. 5 of the Italian Civil Code)
Company Registered office CurShare capital in
local currency
SHAREHOLDE
RS' EQUITY in
Euro/000
NET PROFIT
(LOSS) FOR
THE YEAR in
Euro/000
Ownership
Carrying value incl.
provision for future
charges Euro/000
DIFFERENCES
Total
amount
Pro-rata
amount (A)
Total
amount
Pro-rata
amount(B) (B)-(A)
Informatics Holdings Inc. Plano (Texas) - USA USD 9.996.000 13.987 13.987 (541) (541) 100% 11.011 (2.976)
Datalogic S.r.l. Bologna - Italy EUR 10.000.000 159.600 159.600 22.584 22.584 100% 139.113 (20.487)
Datalogic Real Estate France Sas Paris – France EUR 2.227.500 3.560 3.560 56 56 100% 3.919 359
Datalogic Real Estate UK Ltd, Redbourn - UK GBP 3.500.000 4.390 4.390 118 118 100% 3.668 (722)
Datalogic Real Estate
GermanyGMBHErkenbrechtsweiler - DE EUR 1.025.000 1.389 1.389 (6) (6) 100% 1.806 417
Datalogic IP Tech s.r.l. Bologna - Italy EUR 65.677 10.921 10.921 8.520 8.520 100% 15.082 4.161
SOREDI Touch Systems Gmbh Olching (Munich)-Germany EUR 25.000 1.961 1.961 336 336 100% 9.568 7.607
Total subsidiaries 195.808 193.847 31.067 31.067 184.167 (11.641)
CAEN RFID Srl Viareggio (Lu)-Italy EUR 150.000 1.160 232 39 8 20% 550 318 as at 31/12/2016
R4I S.r.l. Benevento - Italy EUR 105.000 298 60 76 15 20% 150 90 as at 31/12/2016
Total associates 1.458 292 115 23 700 408
Mandarin Capital Partners EUR 1.779.186 1.975 12 (166) (1) 1% 7 (5) as at 31/12/2016
Nomisma SpA Bologna - Italy EUR 6.963.500 7.444 6 267 0 0% 7 1 as at 31/12/2016
Conai 0 n.a.
Caaf Ind. Emilia Romagna Bologna - Italy EUR 377.884 667 6 3 0 1% 4 (3) as at 31/08/2017
T3 LAB Consortium 7 n.a.
Crit srl Bologna - Italy EUR 413.800 612 0 22 0 0% 52 52 as at 31/12/2016
IDEC Corporation Osaka - Japan YEN 10.056.605.173 240.178 0 0 0 1% 9.495 n.a. as at 31/03/2017
Total other companies 250.876 24 126 0 9.572 45

(Euro/000) Note 31.12.2016 Reclassificat
ions
31.12.2016
Restated
1) Total revenues 17 576.482 576.482
Revenues from sale of products 545.821 545.821
Revenues from services 30.661 30.661
of which non-recurring
of which from related parties 5.577 5.577
2) Cost of goods sold 18 311.278 154 311.432
of which non-recurring 18 86 86
of which from related parties 356 356
Gross profit (1-2) 265.204 (154) 265.050
3) Other operating revenues 19 3.278 3.278
of which non-recurring 19 0 0
of which from related parties 7 7
4) R&D expenses 18 50.542 50.542
of which non-recurring 18 16 16
of which amortisation, depreciation and write-downs
pertaining to acquisitions105 105
of which from related parties 18 99 99
5) Distribution expenses 18 101.541 (3.752) 97.789
of which non-recurring 18 333 333
of which from related parties 200 (180) 20
6) General and administrative expenses 18 43.571 3.598 47.169
of which non-recurring 18 0
of which amortisation, depreciation and write-downs
pertaining to acquisitions18 988 988
of which to the parent company 4.809 4.809
of which from related parties 1.202 180 1.382
7) Other operating expenses 18 2.583 2.583
of which non-recurring 18 (444) (444)
of which from related parties 0 0
Total operating costs 198.237 (154) 198.083
Operating result 70.245 0 70.245
8) Financial income 20 19.502 19.502
of which from related parties 0 0
9) Financial expenses 20 22.537 22.537
Net financial income (expenses) (8-9) (3.035) 0 (3.035)
10) Profits from associates3 (318) (318)
Profit (loss) before taxes from the operating assets 66.892 0 66.892
Income tax 21 21.046 21.046
Profit/(loss) for the period 45.846 0 45.846
Basic earnings/(loss) per share (€) 22 0,79 0,79
Diluted earnings/(loss) per share (€) 22 0,79 0,79
Note: It should be noted that, since 2017, some costs have been reclassified under various items.
Comparative data as at 31 December 2016 have therefore been disclosed accordingly.
Annex 2
RESTATED CONSOLIDATED STATEMENT OF INCOME - 2016

Recommended