AMERICAN PUBLIC TRANSPORTATION ASSOCIATION
FACT BOOK PUBLIC TRANSPORTATION
2017

2017 PUBLIC TRANSPORTATION
FACT BOOK
68th Edition
March 2018
APTA’s Vision Statement
Be the leading force in advancing public transportation.
APTA’s Mission Statement
APTA serves and leads its diverse membership through advocacy,
innovation, and information sharing to strengthen and expand public transportation.
Primary Author:
MacPherson Hughes-Cromwick, Policy Analyst (202) 496-4812
Data and Analysis:
Matthew Dickens, Senior Policy Analyst (202) 496-4817
American Public Transportation Association
Paul P. Skoutelas, President and CEO
APTA Policy Department
Darnell C. Grisby, Director-Policy Development & Research
Arthur L. Guzzetti, Vice President-Policy
American Public Transportation Association
1300 I Street, NW, Suite 1200 East Washington, DC 20005
TELEPHONE: (202) 496-4800 E-MAIL: [email protected]
www.apta.com


4 | P a g e
Contents Overview of Public Transit Systems ....................................................................................................5
Total Number of Systems, Number of Modes Operated, 2015 Rail Openings
Passenger Travel ................................................................................................................................7
Unlinked Passenger Trips by Mode, Unlinked Passenger Miles by Mode, Average Trip Length by Mode, VMT vs. Passenger Mile Growth, Population vs. Ridership Growth, ACS Transit Commuting Statistics
Service Provided .............................................................................................................................. 12
Vehicle Revenue Miles Operated, Vehicle Revenue Hours Operated, Modal Shares of Service
Vehicles ........................................................................................................................................... 13
Vehicles Available for Maximum Service, Vehicle Age by Mode, Vehicle Accessibility, Bus Passenger Equipment, Bus Fuel Type, Total Mechanical Failures, Revenue Vehicle Maintenance
Infrastructure .................................................................................................................................. 16
Rail Directional Route Miles by Mode, Average Station Spacing, Passenger Station Amenities, Transit Station Accessibility, Percentage of Systems with Smart Cards
Employment .................................................................................................................................... 18
Total Employees, Employees by Function, Employees by Mode, Transit Employee Compensation, Average Employee Compensation
Energy and Environment .................................................................................................................. 19
Fossil Fuel Consumption, Bus Fuel Consumption, Demand Response Fuel Consumption, Rail Vehicle Miles Operated per Kilowatt Hour
Safety .............................................................................................................................................. 21
Total Transit Related Fatalities Capital and Operating Expenses ....................................................................................................... 21
Capital Expenses, Rolling Stock Expenditures, Capital Facility Expenditures, Operating Expenses, Comparative Operating Costs Among Modes
Capital and Operating Funding ......................................................................................................... 24
Total Transit Funding, Passenger Fare Revenue, Average Base Fare, Capital Funding by Source, Operating Funding by Source
Transit Spending and Contracting in the Private Sector ..................................................................... 26
Estimated Expenditures in the Private Sector, Revenue Hours Contracted
Canadian Summary Data ………………………………………………………………………………………………………………… 28
Passenger Boardings, Total Vehicle Miles, Revenue Vehicles, Total Employees
Amtrak …………………………………………………………………………………………………………………………………………… 29
Top 10 Routes by Ridership, Top 15 Busiest Stations
Modal Rankings. .............................................................................................................................. 30
National Totals for Selected Modes, 50 Largest Agencies, 50 Metros with Most Transit Travel, Listing of Largest Agencies by
Mode, Listing of Largest Rural Agencies by Mode
APTA and the Fact Book ................................................................................................................... 44

OVERVIEW OF PUBLIC TRANSIT SYSTEMS
5 | P a g e
Overview of Public Transit Systems
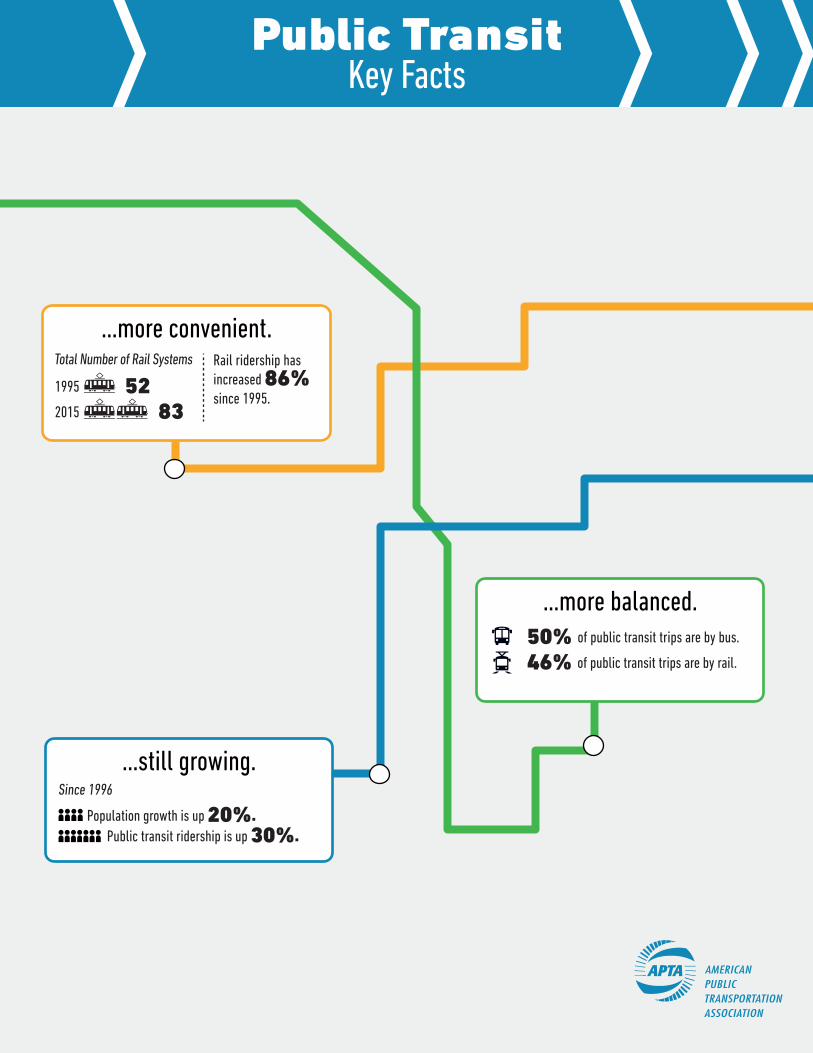
In 2015, more than 6,700 organizations provided public transportation in a variety of modes. Non-profit providers make up many of these systems, and typically operate demand-response services targeted at older Americans and persons with disabilities.1
Of the 83 rail systems now operated by transit agencies, only nine rail systems have been operating since the 19th Century. The number of rail systems continued to grow with the opening of two new systems in 2015 (the Dallas streetcar and the Charlotte streetcar). Compared to 1995, there are 17 additional commuter/hybrid rail systems and 13 additional light rail/streetcar systems.
1 Urbanized areas are defined as areas with over 50,000 in population.
33
15
35
0
10
20
30
40
50
60
70
80
90
19
85
19
86
19
87
19
88
19
89
19
90
19
91
19
92
19
93
19
94
19
95
19
96
19
97
19
98
19
99
20
00
20
01
20
02
20
03
20
04
20
05
20
06
20
07
20
08
20
09
20
10
20
11
20
12
20
13
20
14
20
15
Total Number of Rail Systems
Commuter Rail Heavy Rail Light Rail
841
1303
4586
Number of Systems
Urbanized Areas Rural Non-Profit Providers
6340
1168
226
Number of Modes Operated
Demand Response Total Bus and Trolleybus Other

PASSENGER TRAVEL
6 | P a g e
The number of demand response systems recorded has fallen slightly while the number of ferryboat systems has remained at 41, up 9 from 2010. The number of bus systems (including commuter and bus rapid transit) has declined for a third straight year. Bus Rapid Transit (BRT) systems continue to gain in popularity as lower cost options to providing high capacity and efficient transportation. The Federal Transit Administration defines BRT as a fixed route system operating at least 50 percent of the service on a fixed guideway. Twelve BRT systems were operating in 2015, which is double that of 2010. Cities like Los Angeles and Portland continue to add new lines to their rail networks, making high-quality transit available to more people. Other cities like Seattle, Salt Lake City, Phoenix, and Denver have recently built new rail systems from the ground up, dramatically increasing their ridership. From 2000 to the end of 2015, 43 new systems and 103 extensions (both rail and busway) have opened, resulting in 548 and 595 new segment miles, respectively. The table below lists all of the openings and extensions that took place in 2015.
2015 Rail Openings
7,300 7,200
6,700 6,741 6,600 6,5116,270 6,370 6,340
5,000
5,500
6,000
6,500
7,000
7,500
8,000
8,500
9,000
9,500
10,000
2007 2008 2009 2010 2011 2012 2013 2014 2015
Number of Demand Response Systems
1,2001,086 1,088
1,206 1,175
1,3651,268 1,223
1,163
0
200
400
600
800
1,000
1,200
1,400
1,600
2007 2008 2009 2010 2011 2012 2013 2014 2015
Number of Bus Systems (total)
Chicago, IL Chicago Transit Authority HR Green Line --- 1 2/8/2015 Added Station
Dallas, TX Dallas Area Rapid Transit SC Dallas Streetcar, Oak Cliff Phase 1 1.6 4 4/13/2015 New System
Houston, TX Metropolitan Transportation Authority of Harris County LR Green East End Line 3.3 3 5/23/2015 Extension
Houston, TX Metropolitan Transportation Authority of Harris County LR Purple Southeast Line 6.6 10 5/23/2015 Extension
Charlotte, NC Charlotte Area Transit System SC CityLYNX Gold Line 1.5 6 7/14/2015 New System
Cleveland, OH Greater Cleveland Regional Transit Authority HR Red Line --- 1 8/11/2015 Added Station
Phoenix, AZ Valley Metro LR Valley Metro Rail, Mesa Extension 3.1 4 8/22/2015 Extension
Sacramento, CA Sacramento Regional Transit District LR Blue Line 4.3 3 8/24/2015 Extension
Portland, OR Tri-County Metropolitan Transportation District of Oregon LR MAX Orange Line 7.3 10 9/12/2015 Extension
New York, NY MTA New York City Transit HR No. 7 Line 1.5 1 9/13/2015 Extension
Washington, DC Virginia Railway Express CR Fredericksburg Line 6.0 1 11/16/2015 Extension
Philadelphia. PA Southeastern Pennsylvania Transportation Authority CR Lansdale Station --- 1 11/16/2015 Added Station
New System/
Extension/Added Station
Date
Opened
Urbanized Area
(First City Name
Only)
Organization Name Mode Segment Line or Route Name
Line
Segment
Miles
Number of Added
Stations

PASSENGER TRAVEL
7 | P a g e
Passenger Travel
Public transportation provided 10.59 billion unlinked passenger trips in 2015, falling 1.4 percent from its recent high of 10.75 billion in 2014. Since the early 1970s, public transportation has shown long-term growth in ridership with over 44 percent more trips in 2015.
When dissecting by mode, bus ridership declined by 1.4 percent from 2014-2015, and is down 8 percent from 2000. Heavy rail ridership declined by 1.7 percent from 2014-2015 but remains 46 percent above 2000 levels. Light rail and streetcar ridership declined by less than a percent from 2014-2015 but is up 65 percent from 2000. Commuter rail ridership increased by 1 percent from 2014-2015, and is up 22 percent from 2000. Finally, while demand response ridership is down 4 percent from 2014-2015, it is more than double its 2000 ridership.
8.575
8.501
8.217
7.949
7.763
7.948
8.374
8.750
9.168
9.363
9.653
9.623
9.434
9.575
9.815
10.017
10.247
10.521
10.381
10.218
10.319
10.584
10.650
10.750
10.599
0
1
2
3
4
5
6
7
8
9
10
11
12
Bill
ion
s
Total Unlinked Passenger Trips
Bus, BRT, Trolleybus49%
Commuter Bus1%Demand Response
2%
Commuter and Hybrid Rail
5%
Heavy Rail36%
Light Rail and Streetcar
5%
Other2%
Unlinked Passenger Trips by Mode (2015)

PASSENGER TRAVEL
8 | P a g e
While roadway modes continue to make up a majority of the unlinked passenger trips taken, fixed-guideway modes (primarily heavy and light rail modes) are making up an increasing percentage of trips, and may soon overtake roadway modes.
5,199
3,860
502529509
0
2,000
4,000
6,000
8,000
10,000
12,000
2000 2001 2002 2003 2004 2005 2006 2007 2008 2009 2010 2011 2012 2013 2014 2015
Mill
ion
s o
f Tr
ips
Transit Ridership by Mode
Bus Modes Heavy Rail Commuter AND hybrid Rail Light Rail and Streetcar Other
52.6%47.4%
0.0%
10.0%
20.0%
30.0%
40.0%
50.0%
60.0%
70.0%
80.0%
90.0%
100.0%
1925 1930 1935 1940 1945 1950 1955 1960 1965 1970 1975 1980 1985 1990 1995 2000 2005 2010 2015
Percentage of Unlinked Passenger Trips
Total Roadway Modes Total Fixed-Guideway Modes

PASSENGER TRAVEL
9 | P a g e
Mirroring ridership, the amount of transit passenger miles traveled declined to 58.6 billion miles in 2015, a loss of about 1 billion compared to 2014. Rail modes make up a majority of the total unlinked passenger miles taken (55 percent).
58.6
0
10
20
30
40
50
60
70
1995 1996 1997 1998 1999 2000 2001 2002 2003 2004 2005 2006 2007 2008 2009 2010 2011 2012 2013 2014 2015
Mile
s (B
illio
ns)
Total Passenger Miles Traveled, 1995-2015
3.8 2.8
25.4
1.6
9.2
35.8
4.0
23.9
12.7
4.7 5.12.1
6.2 5.5
0.05.0
10.015.020.025.030.035.040.0
Mile
s
Average Trip Length by Mode
Bus, BRT, Trolleybus
33%
Commuter Bus4%
Demand Response
4%
Commuter and Hybrid Rail
20%
Heavy Rail31%
Light Rail and Streetcar
4%
Other4%
Unlinked Passenger Miles by Mode 2015

PASSENGER TRAVEL
10 | P a g e
Over the past two decades, the growth of transit passenger miles has eclipsed that of vehicle miles traveled (38 percent to 27 percent). Public transit ridership growth also remains above population growth (31 percent to 20 percent).
Source: Federal Highway Administration Travel Volume Trends
Source: United States Census Bureau
0%
10%
20%
30%
40%
50%
1997 1998 1999 2000 2001 2002 2003 2004 2005 2006 2007 2008 2009 2010 2011 2012 2013 2014 2015 2016
Vehicle Miles Traveled vs Transit Passenger Miles Growth Since 1996
Vehicle Miles Traveled Transit Passenger Miles
0%
5%
10%
15%
20%
25%
30%
35%
40%
1997 1998 1999 2000 2001 2002 2003 2004 2005 2006 2007 2008 2009 2010 2011 2012 2013 2014 2015 2016
Population vs Ridership Growth Since 1996
Population Growth Ridership Growth

PASSENGER TRAVEL
11 | P a g e
Source: 2016 American Community Survey
According to the APTA report, Who Rides Public Transportation2, roughly one-half of transit trips are to or from work. Another 38 percent of trips involve shopping and recreational spending in the local economy. The importance of public transit as a means of travel to work has increased substantially over the past decade, even though the percentage of workers commuting by transit fell to 5.1 percent in 2016. Increased automobile owenership, reduced gasoline prices, mobile ride-hailing, and flexible teleworking schedules are all likely contributors to the recent reversal in transit commuting growth. It should be noted that metropolitan statistical areas (MSAs) are comprised of entire counties and often include significant amounts of rural land, which means the actual transit usage within each urban area is higher than the ACS number.
2 https://www.apta.com/resources/reportsandpublications/Documents/APTA-Who-Rides-Public-Transportation-2017.pdf
4.66%
4.83%
4.88%5.01%
4.99%
4.94%
5.03%
5.01%
5.17%
5.21%
5.23%
5.09%
4.5%
4.6%
4.7%
4.8%
4.9%
5.0%
5.1%
5.2%
5.3%
5.4%
5.5%
Percentage of Workers Commuting By Public Transit
31.50%
16.46%13.62% 12.81% 11.92%
9.69% 9.14% 8.65% 7.53% 6.38%
0%
5%
10%
15%
20%
25%
30%
35%
% of Transit Commuters- Top 10 Metros
6.2
6.76.8
7.26.9
6.87.0
7.17.4
7.67.8
7.6
5.0
5.5
6.0
6.5
7.0
7.5
8.0
Total Number of Workers Commuting By PublicTransit
(Millions)

SERVICE PROVIDED
12 | P a g e
Service Provided
In 2015, public transportation in the United States provided 4.89 billion vehicle revenue miles of service; equating to 360.2 million hours of revenue service, both increases over 2014. The fastest service was provided by transit vanpool and commuter rail service, both of which carry passengers on long trips, at 39.6 and 32.0 miles per hour, respectively. Heavy rail, because of a right-of-way separate from other traffic, offers fast service in higher density urban areas (operating at an average speed of 20.2 miles per hour). Modes operating entirely in traffic on city streets are slower. Bus service, which operates in suburbs as well as central cities, averages 12.1 miles per hour. Other modes operate at lower speeds when they are in denser areas with more frequent stop services. The adjacent figure compares the percentages of all public transportation service provided and consumed by modal grouping. More than one-half of vehicle revenue hours operated are provided by buses, which carry just over one-half of all passengers. Since bus passengers take shorter trips and buses operate at lower speeds compared to other modes, they carry fewer than two-fifths of all passenger miles traveled. Comparatively, rail vehicles provide only 16 percent of vehicle revenue hours of service but due to longer and higher speed trips carry 56 percent of all passenger miles traveled on transit.
0.0
50.0
100.0
150.0
200.0
250.0
300.0
350.0
400.0
0
1,000
2,000
3,000
4,000
5,000
6,000
Ho
urs
(M
illio
ns)
Mile
s (M
illio
ns)
Vehicle Revenue Miles and Hours Operated
VRM Operated VRH Operated
50%
37%43%
52%
2%
4%
28%
29%
46%
56%
23%
16%
2% 3% 5% 2%
0%
10%
20%
30%
40%
50%
60%
70%
80%
90%
100%
UnlinkedTrips
PassengerMiles
VehicleRevenue
Miles
VehicleRevenue
Hours
Modal Shares of Service Provided and Consumed, 2015
Bus Demand Response Rail Other

TRANSIT VEHICLES
13 | P a g e
Vehicles
U.S. public transportation systems operated 147,186 railcars, buses, and vans in a typical peak period during 2015, out of a total of 183,601 vehicles available for service. Demand response service and bus fleets make up most vehicles available, 71,299 and 65,416 respectively. The heavy rail fleet of 10,737 vehicles is the largest in terms of rail vehicles.
The Federal Transit Administration establishes a minimum useful life that a vehicle must exceed before federal financial assistance can be used to replace the vehicle. Many vehicles are rehabilitated, which extends their useful lives and reduces their maintenance costs.
(a) Federal requirement for "Minimum Useful Life" in FTA C 9300.1B Capital Investment Program Guidance and Application Instruction, at www.fta.dot.gov.
0
20,000
40,000
60,000
80,000
100,000
120,000
140,000
160,000
180,000
200,000
Vehilces Available for Maximum Service
0.0
5.0
10.0
15.0
20.0
25.0
30.0
Bus Commuterand Hybird
Rail Cars
CommuterRail
Locomotives
DemandResponse
Heavy Rail Light Rail andStreetcar
Trolleybus Ferryboat
Vehicle Age by Mode
2015 Average Age FTA Minimum Useful Life

TRANSIT VEHICLES
14 | P a g e
As shown above, the public transit vehicle fleet has reached near total accessibility for persons using wheelchairs and those with other travel disabilities. From 1993 to 2016, the percentage of buses that are accessible increased from 60 percent to 99.7 percent. Over the same period, the accessible portion of the commuter rail fleet increased from 32 percent to 88 percent, the light rail fleet from 41 percent to 94 percent, the heavy rail fleet from 83 percent to 100 percent, and the trolleybus fleet from 47 percent to 100 percent. The accessible portion of the demand response fleet, where specific vehicles can be assigned to trips to meet a passenger's individual needs, increased from 85 percent to 88 percent.
99.7%
88.0% 87.9%
100.0%94.2%
100.0%
0%
10%
20%
30%
40%
50%
60%
70%
80%
90%
100%
Bus Commuter andHybrid Rail
Demand Response Heavy Rail Light Rail andStreetcar
Trolleybus
Increase of Public Transit Vehicle Accessibility, 1993-2015
1993 2016
AutomatedStop
Announcement
Security orCCTV
Type Camera
ExteriorBicycle Rack
AutomaticVehicle
Locator orGPS
Traffic LightPreemption
Wi-FIElectricalOutlets
2008 45.3% 47.5% 70.8% 59.1% 2.1% 0.5% 1.6%
2016 72.7% 75.5% 79.9% 92.6% 14.9% 7.3% 1.2%
0%
10%
20%
30%
40%
50%
60%
70%
80%
90%
100%
Growth in Percentage of Buses with Passenger Equipment, 2008-2016

TRANSIT VEHICLES
15 | P a g e
The increase in the percentage of buses with technological equipment shows a sustained effort by the public transit industry to make travel safer, easier, and more efficient for riders. A focus on security is demonstrated by the increase in buses equipped with closed circuit security cameras, which went from 47 percent to 75 percent between 2008 and 2016. Enhanced passenger amenities such as automated stop announcements and exterior bus bicycle racks increased their presence from 45 percent to 73 percent, and 71 percent to 80 percent, respectively. The growth of automatic vehicle location systems, which improve the operation of bus fleets as well as the availability of information on bus arrival times, has made public transit systems more efficient and data more accessible. Further use of technology like traffic light preemption can help better deploy transit vehicles, manage congestion, and increase system performance.
The fuel distribution of the bus fleet has evolved dramatically in the past two decades. More than 95 percent of buses were diesel powered as recently as 1995 but that percentage has declined as more environmentally friendly natural gas and hybrid buses have been introduced into the transit fleet. In 2015, almost half (50.8%) of all buses were diesel powered. Electric hybrid buses saw their market share increase from 1 percent in 2005 to over 17 percent in 2015. Vehicle maintenance performance improved in 2015 with the total number of mechanical failures down 4.6 percent to 518,161, while the number of vehicles operated in maximum service (VOMS) increased by 3.4 percent.
50.8%
23.1%
17.3%
0.0%
10.0%
20.0%
30.0%
40.0%
50.0%
60.0%
70.0%
80.0%
90.0%
100.0%
1996 1997 1998 1999 2000 2001 2002 2003 2004 2005 2006 2007 2008 2009 2010 2011 2013 2014 2015
Percentage of Buses by Fuel Type
Diesel CNG, LNG, and Blends Electric and Other (Hybrid) Gasoline Biodiesel Other

TRANSIT VEHICLES
16 | P a g e
Infrastructure Rail transit systems own track and rights-of-way, stations, administrative buildings, and maintenance facilities. Bus systems have passenger stations and stops, maintenance facilities, parking lots, administrative buildings, and dedicated roadways. Directional route miles are a National Transit Database metric that counts all the right-of-way rail vehicles operate over. If they operate in one direction, the right-of way is counted as one mile for each physical mile; if vehicles operate in both directions, the right-of-way is counted as 2 miles. Neither number of "routes" operated along a direction nor the number of tracks affect the count of directional route miles. Commuter and hybrid railroads have the most route mileage (over 8,907), while heavy rail and light rail/streetcar have nearly the same route mileage (1,643). Both light rail/streetcar and commuter/hybrid rail have seen impressive gains compared to 2002 (the inner ring on the chart), when they had 960 and 6,920 directional rail miles respectively.
0
50,000
100,000
150,000
200,000
250,000
1000 &Over
500-999 250-499 100-249 50-99 25-49
Vehicles Operated in Maximum Servie
Total Mechanical Failures
2014 2015
73.0%16.6%
10.1%
72.8%
13.4%
13.4%
Percentage of Directional Route Miles by Mode, 2002 vs. 2015
Commuter Rail Heavy Rail Light Rail and Streetcar
-
100,000
200,000
300,000
400,000
500,000
600,000
VOMS MajorMechanical
Failures
OtherMechanical
Failures
TotalMechanical
Failures
Revenue Vehicle Maintenance Performance, 2014 and 2015
2014 2015
0
2,000
4,000
6,000
8,000
10,000
12,000
14,000
Mile
s
Rail Directional Route Miles
Commuter Rail Heavy Rail Light Rail and Streetcar Other

TRANSIT VEHICLES
17 | P a g e
Buses (including BRT and Commuter) operate on over more than 233,000 miles of streets and roads throughout the United States. Although most bus service is operated in mixed service, it is also operated over nearly 5,000 miles of exclusive and controlled right-of-way directional route miles. Rail makes up 62 percent of the 5,245 passenger stations in urbanized areas. The industry has been witnessing an increased prevalence of electronic devices in rail stations, resulting in better passenger information and improved passenger safety. Between 2000 and 2015, the portion of rail stations with public address systems grew from 47 percent to 64 percent, the portion of rail stations with vehicle status displays grew from 3 percent to 59 percent, and the portion of rail stations with informational video displays grew from 12 percent to 48 percent. 58 percent of rail stations now have security cameras compared to 24 percent in 2000.
Dependability is a basic characteristic of quality public transit service. In 2015, 1,777 maintenance facilities were recorded, which is about 300 more than in 2005.
3.44
0.78
2.27
0.87
0 1 2 3 4
Commuter Rail
Heavy Rail
Hybrid Rail
Light Rail
Miles
Average Station Spacing
0%
20%
40%
60%
80%
100%
Commuterand Hybrid
Rail
Ferryboat Heavy Rail Light Rail andStreetcar
Increase of Public Transit Station Accessibility, 2002-2015
2002 2015
0.00%
20.00%
40.00%
60.00%
80.00%
PublicAddressSystems
VehicleArrival Time
Displays
SecurityCameras
ADAAccessibility
Growth in Percentage of Rail Passenger Station Amenities
2000-2016
2000 2016
0.0%
5.0%
10.0%
15.0%
20.0%
25.0%
30.0%
35.0%
40.0%
2007 2008 2009 2010 2011 2013 2014 2015 2016
Percentage of Transit Systems With Smart Cards

EMPLOYMENT
18 | P a g e
Employment
Out of the 433,000 total employees in public transit, more than 97 percent are operating employees and less than 3 percent are capital employees. Operating employees include workers in the vehicle operations, vehicle maintenance, non-vehicle maintenance, and general administration functions. Transit agency capital employees perform specialized activities for agencies and do not include employees of vehicle manufacturers, engineering firms, building contractors, or other companies with capital investment contracts from public transit agencies. Direct transit employees were paid a total of $15.4 billion and received benefits of $11.7 billion, for a total compensation of $27.9 billion. Average employee compensation fell to $64,458.
432,912
0
100,000
200,000
300,000
400,000
500,000
2000 2001 2002 2003 2004 2005 2006 2007 2008 2009 2010 2011 2012 2013 2014 2015
Total Number of Public Transportation Employees
48%
27%
7%
13%
3% 2%
Number of Employees by Transit Mode
Total Bus Demand Response Regional Rail
Heavy Rail Surface Rail Other
63%10%
3%
24%
Number of Employees by Function
Vehicle Operations General Administration
Capital Vehicle Maintenance

EMPLOYMENT
19 | P a g e
Energy and Environment
Public transit vehicles used a total of 6.69 billion kilowatt hours of electricity for propulsion power in 2015 and 1,015 million gallons of fossil fuels. While diesel remains the predominant fossil fuel, its market share has been declining as cleaner fuels such as liquefied natural gas (LNG), compressed natural gas (CNG), and biodiesel have gained in popularity. Total fossil fuel consumption fell by over 28 million gallons from 2014 to 2015 amongst increases in vehicle revenue miles and vehicle revenue hours, indicating improvements in efficiency.
711.6 714.3660.6 632.2 649.9 630.7 625.7 603.3 602.2
279.9 308.4368.7 342.3 367.9 380.2 405.0
440.3 413.3
0
100
200
300
400
500
600
700
800
2007 2008 2009 2010 2011 2012 2013 2014 2015
Gal
lon
s (M
illio
ns)
Transit Fossil Fuel Consumption
Diesel Non-Diesel
$0
$10,000
$20,000
$30,000
$40,000
$50,000
$60,000
$70,000
$80,000
1988 1991 1994 1997 2000 2003 2006 2009 2012 2015
Average Employee Compensation (In 2015 Dollars)
0
2
4
6
8
10
12
14
16
18
1988 1991 1994 1997 2000 2003 2006 2009 2012 2015
Bill
ion
s
Transit Employee Compensation, 1988-2015 (In 2015 Dollars)
Salaries and Wages Fringe Benefits

EMPLOYMENT
20 | P a g e
Advancements in transit technology and operations can also reduce transit energy use. The figure below shows the long-term trend in increasing efficiency of electrically powered transit rail cars. The number of vehicle miles operated for light rail vehicles and streetcars per kilowatt hour of electricity used rose 22 percent and the number of vehicle miles per kilowatt hour of electricity used for heavy rail vehicles increased 17 percent, from 1986 to 2015.
0.0
100.0
200.0
300.0
400.0
500.0
600.0
700.0
800.0
2007 2008 2009 2010 2011 2012 2013 2014 2015
Breakdown of Bus Fuel Consumption (Millions of
Gallons)
Diesel Fuel Biodiesel
CNG and LNG Gasoline and Other
0.155
0.182
0.098
0.120
0
0.02
0.04
0.06
0.08
0.1
0.12
0.14
0.16
0.18
0.2
19
86
19
87
19
88
19
89
19
90
19
91
19
92
19
93
19
94
19
95
19
96
19
97
19
98
19
99
20
00
20
01
20
02
20
03
20
04
20
05
20
06
20
07
20
08
20
09
20
10
20
11
20
12
20
13
20
14
20
15
Rail Vehicle Miles Operated per Killowatt Hour
Heavy Rail Light Rail and Streetcar
Linear (Heavy Rail) Linear (Light Rail and Streetcar)
0.0
50.0
100.0
150.0
200.0
250.0
300.0
2007 2008 2009 2010 2011 2012 2013 2014 2015
Breakdown of Demand Response Fuel Consumption (Millions of
Gallons)
Diesel Fuel Gasoline Other

CAPITAL AND OPERATING EXPENSES
21 | P a g e
Safety
In 2015 there were a total of 254 transit related fatalities. Rail fatalities increased slightly with 16 more fatalities than in 2014. This is likely due to the expansion of light rail across the country in the last decade. Still, public transit remains one of the safest mobility options, as there were nearly 70 times (17,604) more highway passenger car and motorcycle fatalities than transit fatalities in 2015. APTA’s 2016, The Hidden Traffic Safety Solution: Public Transportation3, discusses the many benefits that transit offers for public safety.
Capital and Operating Expenses
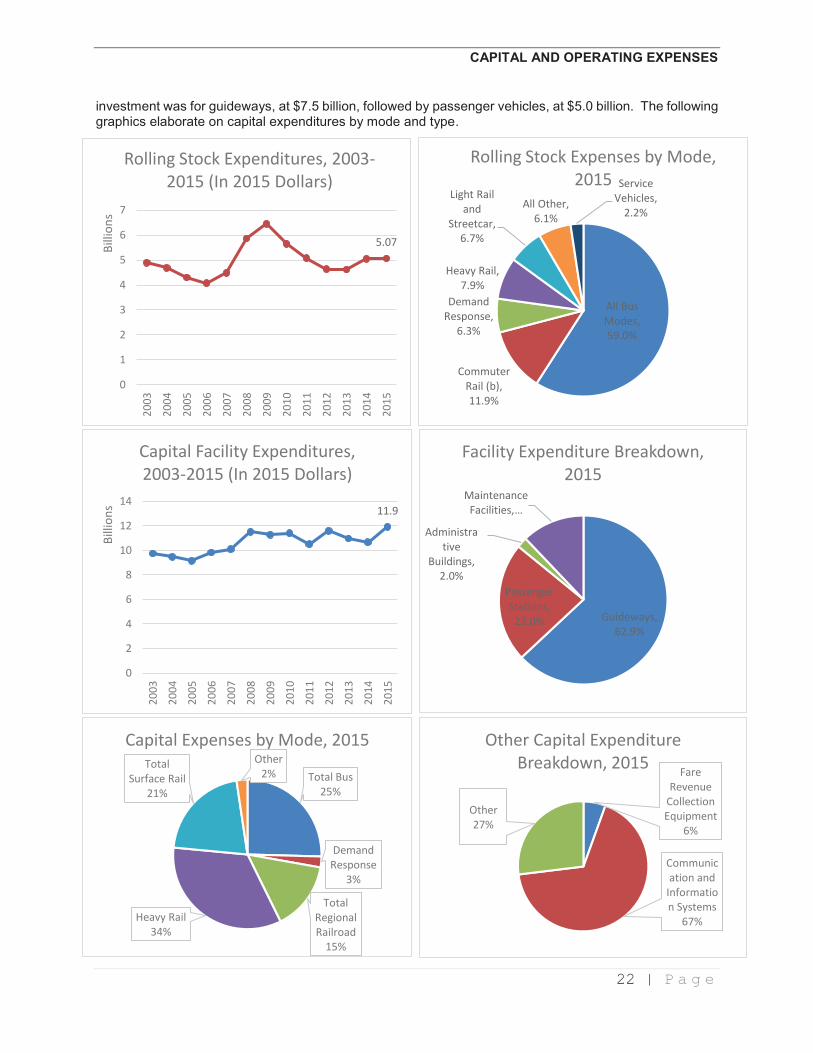
In 2015, total public transportation expenditures were $65.05 billion, with $45.3 billion spent on operations and $19.7 billion spent on capital investments. Heavy rail investments are the largest modal capital expenditures, at $6.6 billion, followed by bus capital investments, at $5.0 billion. The largest type of capital
3 https://www.apta.com/resources/reportsandpublications/Documents/APTA-Hidden-Traffic-Safety-Solution-Public-Transportation.pdf
103
151
0
50
100
150
200
250
Total Transit Related Fatalities
Non-Rail Rail
0.0%
10.0%
20.0%
30.0%
40.0%
50.0%
60.0%
70.0%
Breakdown of Capital Expenses, 1992-2015
Rolling Stock Facilities Other
CAPITAL AND OPERATING EXPENSES
22 | P a g e
investment was for guideways, at $7.5 billion, followed by passenger vehicles, at $5.0 billion. The following graphics elaborate on capital expenditures by mode and type.
5.07
0
1
2
3
4
5
6
7
20
03
20
04
20
05
20
06
20
07
20
08
20
09
20
10
20
11
20
12
20
13
20
14
20
15
Bill
ion
s
Rolling Stock Expenditures, 2003-2015 (In 2015 Dollars)
All Bus Modes, 59.0%
Commuter Rail (b), 11.9%
Demand Response,
6.3%
Heavy Rail, 7.9%
Light Rail and
Streetcar, 6.7%
All Other, 6.1%
Service Vehicles,
2.2%
Rolling Stock Expenses by Mode, 2015
11.9
0
2
4
6
8
10
12
14
20
03
20
04
20
05
20
06
20
07
20
08
20
09
20
10
20
11
20
12
20
13
20
14
20
15
Bill
ion
s
Capital Facility Expenditures, 2003-2015 (In 2015 Dollars)
Guideways, 62.9%
Passenger Stations,
23.0%
Administrative
Buildings, 2.0%
Maintenance Facilities, …
Facility Expenditure Breakdown, 2015
Fare Revenue
Collection Equipment
6%
Communication and
Information Systems
67%
Other27%
Other Capital Expenditure Breakdown, 2015
Total Bus25%
Demand Response
3%
Total Regional Railroad
15%
Heavy Rail34%
Total Surface Rail
21%
Other2%
Capital Expenses by Mode, 2015

CAPITAL AND OPERATING EXPENSES
23 | P a g e
Operating expenses are measured by function (the type of activity performed) and by object (labor expenses and the type of goods or services purchased). Among the five functions operating funds are applied to, operations accounts for almost half of expenses, followed by vehicle maintenance, general administration, purchased transportation, and non-vehicle maintenance. Salaries, wages and fringe benefits for employees of public transit agencies account for almost two-thirds of operating expenses. Operating expenses by function and object class by mode are shown below.
45.35
0
5
10
15
20
25
30
35
40
45
50
19
88
19
89
19
90
19
91
19
92
19
93
19
94
19
95
19
96
19
97
19
98
19
99
20
00
20
01
20
02
20
03
20
04
20
05
20
06
20
07
20
08
20
09
20
10
20
11
20
12
20
13
20
14
20
15
Bill
ion
s
Transit Operating Expenses, 1988-2015 (In 2015 Dollars)
Salaries and Wages
35%
Fringe Benefits
27%
Services7%
Materials and
Supplies10%
Utilities3%
Casualty and
Liability2%
Purchased Transpor-
tation14%
Other2%
Breakdown of Operating Expenses (function), 2015
Total Bus48%
Demand Response
12%
Total Regional Railroad
13%
Heavy Rail20%
Total Surface
Rail4%
Other3%
Operating Expenses by Mode, 2015
0.0%
5.0%
10.0%
15.0%
20.0%
25.0%
30.0%
35.0%
40.0%
45.0%
50.0%
19
92
19
93
19
94
19
95
19
96
19
97
19
98
19
99
20
00
20
01
20
02
20
03
20
04
20
05
20
06
20
07
20
08
20
09
20
10
20
11
20
12
20
13
20
14
20
15
Breakdown of Operating Expenses (class), 1992-2015
Vehicle Operations Vehicle Maintenance
Non-Vehicle Maintenance General Administration
Purchased Transportation

CAPITAL AND OPERATING EXPENSES
24 | P a g e
The figure above shows the variability when comparing operating costs based on different metrics. When measured by cost per vehicle mile, commuter rail and light rail service are the most expensive because they are large, high capacity vehicles, much larger than buses or demand response vehicles. When measured by cost per unlinked passenger trip, heavy rail is the least expensive because of the large capacity of the vehicles. Demand response trips are more expensive per trip because their vehicles carry fewer passengers.
Capital and Operating Funding
Public transportation operations are funded by passenger fares, public transit agency earnings, and financial assistance from state, local and federal governments. Capital investment is reported only as government funds in the National Transit Database.
$0.00
$5.00
$10.00
$15.00
$20.00
$25.00
$30.00
All Bus Modes Commuter andHybrid Rail
Demand Response Heavy Rail Light Rail andStreetcar
Do
llars
Comparative Operating Cost Among Modes, 2015
Cost per Vehicle Revenue Mile Cost per Unlinked Passenger Trip
68.3499
0
10
20
30
40
50
60
70
80
19
88
19
89
19
90
19
91
19
92
19
93
19
94
19
95
19
96
19
97
19
98
19
99
20
00
20
01
20
02
20
03
20
04
20
05
20
06
20
07
20
08
20
09
20
10
20
11
20
12
20
13
20
14
20
15
Bill
ion
s
Total Transit Funding (In 2015 dollars)

CAPITAL AND OPERATING FUNDING
25 | P a g e
Revenue generated from passenger fares varies across transit modes. The highest level of average revenue per unlinked passenger trip is generated by commuter rail, the mode that represents the longest trip length for passengers. Fare policies vary across agencies, but in general, passenger fares are lower for bus trips and relatively similar for light rail and heavy rail. In 2015, passenger fare revenue was 3.7 percent above 2014 revenues. The figures below report the change in funding sources for capital and operations since 1988. Federal capital funds increased by 40 percent over the last 15 years while state capital funding has doubled. Directly generated and local capital assistance has increased by 51 percent since 2000.
8.3763
2.9143
8.6919
0
2
4
6
8
10
19
88
19
89
19
90
19
91
19
92
19
93
19
94
19
95
19
96
19
97
19
98
19
99
20
00
20
01
20
02
20
03
20
04
20
05
20
06
20
07
20
08
20
09
20
10
20
11
20
12
20
13
20
14
20
15
Bill
ion
s
Capital Funding by Source, 1988-2015 (In 2015 dollars)
Local Plus Directly Generated Assistance State Assistance (c) Federal Assistance (d)
15.86
0
2
4
6
8
10
12
14
16
18
1988 1991 1994 1997 2000 2003 2006 2009 2012 2015
Bill
ion
s
Passenger Fare Revenue, 1988-2015 (In 2015 Dollars)
1.03
5.53
2.18
3.60
6.12
1.391.05
2.73
1.49
0
1
2
3
4
5
6
7
Do
llars
Passenger Fare Revenue per Unlinked Passenger Trip, 2015
$- $1.00 $2.00 $3.00 $4.00 $5.00
Average Base Fare Comparison, 2006 and 2016 (In 2016 Dollars)
2006 2016

CAPITAL AND OPERATING FUNDING/ TRANSIT SPENDING IN THE PRIVATE SECTOR
26 | P a g e
Operating funding from all sources increased from 2000 through 2015. The majority of revenue for operations is derived from passenger fares, along with state and local financial assistance. Passenger fares and other agency earnings account for 37 percent of operating revenues. Directly generated government funds (where the transit agency functions like a local government) and local and state government assistance combine for 54 percent of all operating funding. The federal role is more significant for the capital program, providing 43 percent of capital funds compared to only 8 percent of operating funds. State and federal assistance were 14.6 and 43.5 percent of capital funding respectively. Local assistance was around 21 percent of capital funding in 2015.
Transit Spending and Contracting in the Private Sector
18.1051
15.0542
11.1975
4.0107
0
2468
10
1214
161820
19
88
19
89
19
90
19
91
19
92
19
93
19
94
19
95
19
96
19
97
19
98
19
99
20
00
20
01
20
02
20
03
20
04
20
05
20
06
20
07
20
08
20
09
20
10
20
11
20
12
20
13
20
14
20
15
Bill
ion
sOperating Funding by Source, 1988-2015 (In 2015 dollars)
Passenger Fares and Other Local Plus Directly Generated Assitance
State Assistance Federal Assistance
0.0%
10.0%
20.0%
30.0%
40.0%
50.0%
60.0%
70.0%
19
92
19
93
19
94
19
95
19
96
19
97
19
98
19
99
20
00
20
01
20
02
20
03
20
04
20
05
20
06
20
07
20
08
20
09
20
10
20
11
20
12
20
13
20
14
20
15
Estimated Private Sector Expenditures as a Percentage of Total
Expenditures
0
5
10
15
20
25
30
35
40
19
92
19
93
19
94
19
95
19
96
19
97
19
98
19
99
20
00
20
01
20
02
20
03
20
04
20
05
20
06
20
07
20
08
20
09
20
10
20
11
20
12
20
13
20
14
20
15
Bill
ion
s
Estimated Transit Expenditures in the Private Sector, 1992-2015
(In 2015 dollars)

MODAL DATA
27 | P a g e
Nearly all transit service is provided by or contracted for by public agencies. A large portion of the funds expended by those public agencies, however, is spent in the private sector of the economy. In 2015, expenditures in the private sector were estimated to be $35.8 billion (55 percent of all transit expenditures), an increase from the $34.5 billion in 2014. All capital expenditures are estimated to be for goods and services provided by the private sector, as well as operating expenditures for services, materials and supplies including motor fuel, utilities including propulsion power for electrically powered transit vehicles, a portion of casualty and liability costs, and a portion of purchased transportation costs.
A significant amount of public transit service is contracted for operation, approximately 28 percent in FY 2015. The percentage of service provided by contractors for different modes is shown in the figure above. Roughly, 75 percent of demand response service, measured by vehicle revenue hours, is provided by contractors, 46 percent of vanpool service, 30 percent of commuter bus service, 17 percent of bus service, 13 percent of bus rapid transit service, and 5 percent of rail service. Most of the vehicles operated by contractors, however, are provided by the public transit agency, approximately 93 percent of all types of bus service operated by contractors is with vehicles owned by the transit agency and about 80 percent of the vehicles used by contractors in demand response service are owned by the transit agencies. The percentage of service which is contracted for operation has increased over the past 10 years, demand response from 71 percent to 75 percent, vanpool from 30 percent to 46 percent, and all types of bus service from 14 percent to 17 percent.
54.0%
87.0%
69.3%
82.7%
25.1%
94.6%
0% 10% 20% 30% 40% 50% 60% 70% 80% 90% 100%
Vanpool
Bus Rapid Transit
Commuter Bus
Bus
Demand Response
Rail
Percent of Revenue Hours Contracted by Mode, RY 2015
Directly Operated Purchased Transportation (Contracted)
13.93%17.67%
71.50% 74.93%
30.54%
46.05%
0%
10%
20%
30%
40%
50%
60%
70%
80%
90%
2005 2006 2007 2008 2009 2010 2011 2012 2013 2014 2015
Trend of Percent of Revenue Hours Contracted, 2005-2015
All Bus Demand Response (Paratransit) Vanpool

MODAL DATA
28 | P a g e
Canadian Summary Data Source: Canadian Urban Transit Association
With 105 systems reporting, Canadian ridership in 2015 fell by 0.3 percent to 3.04 billion trips. Accompanying this was a 0.8 percent drop in total vehicle miles (compared to a 0.8 increase in the U.S.). Bus vehicles made up the majority of boardings (62%), with heavy rail and light rail following (23.8 and 8.4 percent, respectively).
Out of a total of 57,627 employees, 53 percent were vehicle operators, 15 percent worked in vehicle maintenance, 13 percent worked in general administration, 10 percent worked in non-vehicle maintenance, and 9 percent worked in transportation operations. The average standard bus age increased from 8.0 years to 8.4 years and bus fleet accessibility rose by one percentage point to 98.5 percent in 2015.
2.52 2.57 2.67 2.74 2.75 2.862.96 3.01 2.96 3.05 3.04
0
1
1
2
2
3
3
4
2005 2006 2007 2008 2009 2010 2011 2012 2013 2014 2015
Bill
ion
s
Canadian Passenger Boardings
586.3 607.9 617.1665.4 680.0
705.4740.2 726.2 734.2 736.7 730.9
0
100
200
300
400
500
600
700
800
2005 2006 2007 2008 2009 2010 2011 2012 2013 2014 2015
Canadian Total Vehicle Miles
19,394
0
5,000
10,000
15,000
20,000
25,000
19
90
19
91
19
92
19
93
19
94
19
95
19
96
19
97
19
98
19
99
20
00
20
01
20
02
20
03
20
04
20
05
20
06
20
07
20
08
20
09
20
10
20
11
20
12
20
13
20
14
20
15
Canadian Transit Revenue Vehicles, 1990-2015
57,627
0
10,000
20,000
30,000
40,000
50,000
60,000
70,000
20
00
20
01
20
02
20
03
20
04
20
05
20
06
20
07
20
08
20
09
20
10
20
11
20
12
20
13
20
14
20
15
Canadian Transit Employees

MODAL DATA
29 | P a g e
Amtrak Summary
Sources: Management Discussion and Analysis of Financial Condition and Results of Operations and Consolidated Financial Statements with Report of Independent Auditors - Fiscal Year 2016, FY2016 National Fact Sheet, Amtrak FY2016 Ridership and Revenue
(https://media.amtrak.com/wp-content/uploads/2015/10/Amtrak-FY16-Ridership-and-Revenue-Fact-Sheet-4_17_17-mm-edits.pdf)
Intercity passenger rail remains a critical resource for local economies and a valuable part of the transportation network. Amtrak operates over 21,300 route miles and has more than 500 stations. Amtrak’s 2016 fiscal year ridership increased by 1.3 percent over FY2015 ridership to 31.3 million. This resulted in nearly $30 million in increased revenues. It also managed to reduce operating expenses by $71.3 million to $4.26 billion, due in part to reduced fuel and power costs, better contract program management, and reduced postretirement plan expenses. In FY2016, Amtrak received $1.4 billion in federal appropriations, $300 million in state capital payments, $93.2 million from the American Recovery and Reinvestment Act of 2009 High Speed Intercity Passenger Rail Program to total $1.8 billion in total cash inflows. Amtrak has more than 20,000 employees. Ridership on the Northeast Corridor increased by 1.7 percent to 11.91 million trips, ridership on state supported routes increased by 0.2 percent to 14.71 million trips, and ridership on long distance routes increased by 3.7 percent to 4.65 million trips. There are 29 state-supported routes, and 15 long-distance routes. Amtrak’s current investments include new trainsets for the Acela line, implementing Positive Train Control (PTC), and station improvements at Washington, D.C. and New York City, and many others across the nation.
-
1,000,000
2,000,000
3,000,000
4,000,000
5,000,000
6,000,000
7,000,000
8,000,000
9,000,000
Top 10 Amtrak Routes by Ridership
0
2,000,000
4,000,000
6,000,000
8,000,000
10,000,000
12,000,000
Rid
ersh
ip
Top 15 Busiest Amtrak Stations, FY 2016

MODAL DATA
30 | P a g e
Tabular Data and Modal Rankings, Report Year 2015
For complete size ranking lists of all transit agencies and urbanized areas reported in the Federal Transit Administration 2015 National Transit Database see the 2017 Public Transportation Fact Book, Appendix B: Operating Statistics and Rankings at www.apta.com. These rankings only include transit agencies that report in the Federal Transit Administration FY 2015 National Transit Database.
Table 1: National Totals for Selected Modes (a)
Statistical Category Bus Demand
Response Transit
Vanpool Commuter
Rail Heavy Rail
Light Rail Ferry-boat
Total All Transit (b)
Systems, Number of 1,107 6,340 101 28 15 22 41 6,752
Trips, Unlinked Passenger (Millions) 5,042.1 222.7 38.0 495.3 3,860.1 478.7 83.7 10,598.7
Miles, Passenger (Millions) 18,952.5 2,056.3 1,360.4 11,812.7 18,283.0 2,427.4 522.6 58,646.0
Trip Length, Average (Miles) 3.8 9.2 35.8 23.9 4.7 5.1 6.2 5.5
Miles, Vehicle Total (Millions) 2,224.9 1,617.0 232.0 373.7 695.5 107.7 4.4 5,509.5
Miles, Vehicle Revenue (Millions) 1,928.7 1,393.3 232.0 346.1 675.9 105.6 4.3 4,889.6
Hours, Vehicle Total (Millions) 175.6 109.2 5.9 12.0 35.7 6.9 0.5 360.2
Hours, Vehicle Revenue (Millions) 159.6 94.1 5.9 10.8 33.5 6.7 0.5 323.1
Speed, Vehicle in Revenue Service, Average (mph)
12.1 14.8 39.6 32.0 20.2 15.8 8.5 15.1
Fares Collected, Passengers (Millions) 5,208.5 486.7 136.8 3,030.7 5,399.7 511.7 228.3 15,866.4
Revenue per Unlinked Trip, Average 1.0 2.2 3.6 6.1 1.4 1.1 2.7 1.5
Expense, Operating Total (Millions) 20,528.3 5,368.4 167.5 5,828.1 8,950.2 1,832.5 740.1 45,353.4
Operating Expense by Object Class:
Salaries and Wages (Millions) 7,829.3 1,051.1 22.8 1,773.0 3,676.4 665.4 264.7 15,912.5
Fringe Benefits (Millions) 5,741.3 582.9 11.8 1,378.2 3,280.2 453.6 106.4 11,992.4
Services (Millions) 1,370.4 294.5 15.7 634.9 478.5 293.1 68.3 3,316.1
Materials and Supplies (Millions) 2,420.0 355.3 26.0 645.7 501.0 152.7 152.9 4,455.9
Utilities (Millions) 244.0 41.6 2.0 305.4 591.3 130.6 8.6 1,357.5
Casualty and Liability (Millions) 484.7 122.6 10.5 157.9 203.6 41.2 24.7 1,103.0
Purchased Transportation (Millions) 2,136.5 2,859.7 71.9 798.6 54.8 68.7 86.4 6,427.4
Other (Millions) 302.0 60.8 6.6 134.5 164.4 27.3 28.2 788.5
Operating Expense by Function Class:
Vehicle Operations (Millions) 10,641.6 1,366.6 29.3 1,980.2 3,468.3 673.8 389.8 19,388.4
Vehicle Maintenance (Millions) 3,596.8 331.4 12.1 1,212.7 1,387.4 374.3 107.2 7,324.4
Non-vehicle Maintenance (Millions) 911.4 71.5 2.0 949.2 2,462.8 331.4 40.8 4,912.9
General Administration (Millions) 3,242.0 739.3 52.2 887.5 1,576.9 384.3 115.9 7,300.3
Purchased Transportation (Millions) 2,136.5 2,859.7 71.9 798.6 54.8 68.7 86.4 6,427.4
Expense, Capital Total (Millions) 4,590.1 469.6 26.8 2,931.8 6,663.9 3,868.6 291.7 19,696.2
Facilities, Guideway, Stations, Admin. Buildings (Millions)
1,230.7 74.2 0.4 1,831.2 4,952.6 3,318.4 119.2 11,909.9
Rolling Stock (Millions) 2,813.1 319.1 25.5 612.3 445.4 312.4 169.3 5,068.7
Other (Millions) 546.3 76.3 0.9 488.3 1,265.8 237.8 3.2 2,717.7
Revenue Vehicles Available for Maximum Service
65,416 71,299 15,637 7,216 10,737 2,083 201 183,601
Revenue Vehicles Operated at Maximum Service
51,961 56,979 13,487 6,372 9,428 1,530 168 147,186
Employees, Operating 190,491 115,923 650 29,554 53,165 11,384 4,786 421,336
Employees, Vehicle Operations 132,076 91,983 100 10,953 20,387 5,242 3,487 274,071
Employees, Vehicle Maintenance 32,989 8,729 66 8,751 9,570 2,339 573 65,998
Employees, Non-Vehicle Maintenance 7,064 2,484 21 7,059 17,559 2,484 174 37,813
Employees, General Administration 18,361 12,727 463 2,791 5,648 1,318 551 43,454
Employees, Capital 2,530 216 4 2,064 5,301 1,135 101 11,576
Diesel Fuel Consumed (Gallons, Millions) 373.6 44.4 - 97.4 - - 43.7 602.2
Other Fossil Fuel Consumed (Gallons, Millions)
227.9 162.4 14.6 1.1 - - 0.8 413.3
Electricity Consumed (kWh, Millions) 3.5 - 0.1 1,791.9 3,815.6 897.6 - 6,690.4
(a) Data for all public transportation service, urbanized area and rural. (b) Total includes more modes than included in this table

MODAL DATA
31 | P a g e
Table 2: The 50 Largest Transit Agencies (Ranked by Unlinked Passenger Trips)
Transit Agency Urbanized Area
(First City and State Names Only)
Unlinked Passenger Trips (Thousands)
Passenger Miles (Thousands)
2014 2015 2014 2015
MTA New York City Transit (NYCT) Chicago Transit Authority (CTA) Los Angeles County Metro. Transp. Auth. (LACMTA) Washington Metro. Area Transit Auth. (WMATA) Massachusetts Bay Transp. Auth. (MBTA) Southeastern Pennsylvania Transp. Auth. (SEPTA) New Jersey Transit Corp. (NJ TRANSIT) San Francisco Municipal Railway (MUNI) Metro. Atlanta Rapid Transit Auth. (MARTA) San Francisco Bay Area Rapid Transit District (BART) King County DOT (King County Metro) MTA Bus Company (MTABUS) Maryland Transit Administration (MTA) Miami-Dade Transit (MDT) Denver Regional Transp. District (RTD) Tri-County Metro. Transp. District of Oregon (TriMet) MTA Long Island Rail Road (MTA LIRR) San Diego Metro. Transit System (MTS) Port Authority Trans-Hudson Corp. (PATH) Metro-North Commuter Railroad Comp. (MTA-MNCR) Metro. Transit Auth. of Harris County (Metro) Metro Transit Northeast Illinois Reg. Commuter Rail Corp. (Metra) City and County of Honolulu DOT Services (DTS) Dallas Area Rapid Transit (DART) Reg. Transp. Comm. of Southern Nevada (RTC) Port Authority of Allegheny County Alameda-Contra Costa Transit District (AC Transit) Orange County Transportation Auth. (OCTA) The Greater Cleveland Reg. Transit Auth. (GCRTA) Utah Transit Authority (UTA) Bi-State Development Agency (METRO) Santa Clara Valley Transp. Auth. (VTA) Milwaukee County Transit System (MCTS) VIA Metropolitan Transit (VIA) City of Phoenix Public Transit Dept. (Valley Metro) Broward County Transit Division (BCT) Capital Metropolitan Transp. Auth. (CMTA) Central Puget Sound Reg. Transit Auth. (ST) Pace - Suburban Bus Division (PACE) Westchester County Bee-Line System Central Florida Reg. Transp. Auth. (LYNX) Long Beach Transit (LBT) Nassau Inter County Express (NICE) Charlotte Area Transit System (CATS) Niagara Frontier Transp. Auth. (NFT Metro) Ride-On Montgomery County Transit Puerto Rico Highway and Transp. Auth. (PRHTA) Sacramento Regional Transit District City of Detroit DOT (DDOT)
New York, NY Chicago, IL Los Angeles, CA Washington, DC Boston, MA Philadelphia, PA Newark, NJ San Francisco, CA Atlanta, GA Oakland, CA Seattle, WA New York, NY Baltimore, MD Miami, FL Denver, CO Portland, OR Jamaica, NY San Diego, CA Jersey City, NJ New York, NY Houston, TX Minneapolis, MN Chicago, IL Honolulu, HI Dallas, TX Las Vegas, NV Pittsburgh, PA Oakland, CA Orange, CA Cleveland, OH Salt Lake City, UT St. Louis, MO San Jose, CA Milwaukee, WI San Antonio, TX Phoenix, AZ Plantation, FL Austin, TX Seattle, WA Arlington Heights, IL Mount Vernon, NY Orlando, FL Long Beach, CA Garden City, NY Charlotte, NC Buffalo, NY Rockville, MD San Juan, PR Sacramento, CA Detroit, MI
3,545,170.6 514,216.8 479,654.3 411,323.8 409,248.4 347,177.5 270,958.0 228,748.5 129,123.3 125,784.2 125,340.4 125,581.2 113,995.7 110,771.0 104,291.4 99,493.6 97,869.6 91,869.9 84,168.2 84,976.5 85,369.6 84,535.5 74,382.1 67,449.2 70,863.3 60,964.7 63,650.3 56,765.0 51,783.4 49,245.9 46,279.4 48,133.4 44,539.3 41,493.4 44,012.7 40,850.1 38,785.7 34,178.5 32,942.6 34,793.9 31,683.0 30,141.2 28,532.6 28,744.2 29,438.4 26,402.9 26,391.6 27,881.9 26,376.0 25,405.1
3,445,544.7 515,964.8 457,356.0 406,647.7 405,950.9 344,297.3 276,498.4 220,119.3 136,029.2 135,240.6 126,268.5 125,399.5 116,219.9 106,257.0 102,250.7 101,381.0 98,699.5 94,920.0 86,652.2 86,299.5 86,089.2 85,832.2 72,631.2 70,501.8 69,844.8 66,856.9 65,202.5 56,020.7 50,023.2 47,021.5 46,721.6 46,640.8 45,102.7 39,756.0 39,570.1 38,684.6 37,809.2 34,700.3 34,668.3 33,116.8 30,177.4 29,377.1 28,117.3 27,535.5 27,165.9 26,301.3 25,972.3 25,796.4 25,768.5 24,183.9
12,994,407.2 2,130,681.1 2,339,176.8 1,968,724.5 1,847,714.9 1,546,679.2 3,432,327.0
488,371.7 685,469.2
1,655,369.3 611,738.5 349,659.7 794,420.4 640,050.0 597,776.7 516,666.0
1,917,248.1 423,809.9 352,950.5
2,588,848.4 606,140.3 374,842.3
1,668,440.9 374,196.1 483,808.0 231,188.9 285,039.9 221,383.4 250,759.5 223,146.2 375,286.1 311,089.2 244,745.7 145,312.9 208,722.5 149,374.8 176,490.4 167,669.1 424,593.5 258,667.8 156,551.8 178,129.6 89,548.1
137,589.5 157,661.6 96,934.7 99,302.5
110,546.7 127,732.7 117,571.2
12,679,232.3 2,147,039.8 2,253,459.7 2,032,392.6 1,775,931.1 1,530,275.1 3,401,950.3
464,626.5 738,032.0
1,793,223.8 618,636.7 370,989.5 849,061.4 629,554.8 585,200.8 508,129.9
2,220,654.6 436,511.1 363,965.2
2,340,179.8 573,489.8 368,643.9
1,623,729.3 355,158.2 464,093.3 257,393.1 271,752.7 222,447.9 235,698.3 218,526.4 389,557.0 290,081.9 244,553.7 137,197.3 196,255.6 143,289.8 173,667.9 183,570.7 447,734.7 251,194.2 149,353.1 169,531.6 89,350.6
154,080.1 148,900.3 91,195.2 99,160.7
101,942.1 120,190.6 98,630.4

MODAL DATA
32 | P a g e
Table 3: The 50 Metros with the Most Transit Travel (Ranked by Unlinked Passenger Trips)
Urbanized Area Population
(2010 Census)
Unlinked Passenger Trips (Thousands)
Passenger Miles (Thousands)
2014 2015 2014 2015
New York-Newark, NY-NJ-CT Los Angeles-Long Beach-Anaheim, CA Chicago, IL-IN Washington, DC-VA-MD San Francisco-Oakland, CA Boston, MA-NH-RI Philadelphia, PA-NJ-DE-MD Seattle, WA Miami, FL Atlanta, GA Baltimore, MD Portland, OR-WA San Diego, CA Denver-Aurora, CO Minneapolis-St. Paul, MN-WI Houston, TX Dallas-Fort Worth-Arlington, TX Phoenix-Mesa, AZ Las Vegas-Henderson, NV Urban Honolulu, HI Pittsburgh, PA San Juan, PR St. Louis, MO-IL Cleveland, OH Salt Lake City-West Valley City, UT San Jose, CA Milwaukee, WI San Antonio, TX Detroit, MI Austin, TX Tampa-St. Petersburg, FL Sacramento, CA Orlando, FL Charlotte, NC-SC Buffalo, NY Riverside-San Bernardino, CA New Orleans, LA Tucson, AZ Cincinnati, OH-KY-IN Providence, RI-MA Columbus, OH Hartford, CT Rochester, NY Albany-Schenectady, NY Virginia Beach, VA Kansas City, MO-KS Durham, NC Louisville/Jefferson County, KY-IN Madison, WI Ann Arbor, MI
18,351,295 12,150,996 8,608,208 4,586,770 3,281,212 4,181,019 5,441,567 3,059,393 5,502,379 4,515,419 2,203,663 1,849,898 2,956,746 2,374,203 2,650,890 4,944,332 5,121,892 3,629,114 1,886,011
802,459 1,733,853 2,148,346 2,150,706 1,780,673 1,021,243 1,664,496 1,376,476 1,758,210 3,734,090 1,362,416 2,441,770 1,723,634 1,510,516 1,249,442
935,906 1,932,666
899,703 843,168
1,624,827 1,190,956 1,368,035
924,859 720,572 594,962
1,439,666 1,519,417
347,602 972,546 401,661 306,022
4,358,276.9 682,209.4 632,405.4 470,392.2 456,958.5 417,946.7 369,864.9 207,367.4 170,607.7 137,477.5 115,882.2 112,416.2 109,684.9 104,489.1 97,602.9 85,931.7 80,360.1 75,590.2 65,513.0 67,449.2 65,973.5 54,690.5 51,032.3 50,071.4 46,279.4 44,539.3 43,069.2 44,125.9 38,702.2 34,193.1 31,223.1 31,288.3 30,311.2 29,691.3 26,402.9 25,598.2 23,938.3 20,397.2 20,949.4 21,644.2 19,483.2 18,501.8 17,373.8 16,420.3 17,499.4 17,406.7 15,739.5 15,276.4 15,522.4 14,034.7
4,265,917.0 656,459.1 630,852.3 469,800.5 458,299.9 415,184.1 366,649.0 210,016.4 164,265.0 144,218.0 117,977.3 114,375.6 111,461.4 102,479.1 98,689.6 86,665.4 79,262.2 72,825.7 71,939.0 70,501.8 67,553.7 49,558.9 49,514.9 47,841.8 46,721.6 45,102.7 41,270.6 39,681.3 37,662.9 34,716.9 31,461.7 30,557.4 30,336.2 27,691.6 26,301.3 24,452.4 22,686.7 21,407.9 20,516.2 19,644.0 19,360.1 18,083.5 17,292.5 16,881.8 16,568.3 16,495.7 15,193.7 14,908.7 14,662.2 13,946.6
23,367,608.4 3,549,682.3 4,205,942.5 2,452,060.1 2,966,172.7 1,920,409.5 1,815,270.3 1,407,502.5 1,052,359.4
824,825.4 804,861.5 562,623.7 650,125.1 606,025.9 495,570.3 613,040.1 537,876.3 365,187.4 240,040.1 374,196.1 314,341.4 248,369.3 337,099.2 232,043.6 375,286.1 244,745.7 159,789.4 209,949.4 249,829.5 167,669.1 161,189.5 172,618.0 180,741.5 157,661.6 96,934.7
151,308.9 62,615.8 87,923.6
117,031.3 105,300.2 80,667.3
121,806.4 48,621.7 65,074.3 90,047.3 72,565.5 67,618.3 68,839.3 54,584.0 45,027.7
22,139,855.4 3,411,498.3 4,173,254.9 2,536,188.2 3,176,239.6 1,857,065.9 1,820,530.8 1,439,038.1 1,034,105.3
864,632.4 859,708.2 552,924.2 655,819.9 592,350.9 473,326.4 580,206.5 514,704.8 349,667.8 267,357.9 355,158.2 302,672.0 224,157.9 313,232.6 227,075.8 389,557.0 244,553.7 151,115.0 197,788.9 222,616.4 183,570.7 165,288.6 158,532.8 183,589.7 148,900.3 91,195.2
143,283.3 61,518.4 95,753.9
125,023.3 94,842.0 79,390.1
103,754.8 51,026.0 66,376.8 78,084.3 71,568.5 65,758.4 67,539.0 51,597.6 44,832.6
(a) Total amounts reported by each agency are included in the urbanized area in which that agency is headquartered regardless of the number of urbanized areas in which the agency operates transit service.

MODAL DATA
33 | P a g e
Ridership per capita (unlinked passenger trips divided by metro area population) gives a representation for how many transit trips a person takes yearly in that area.
Table 4: 50 Metros with the Most Transit Travel (Ranked by Ridership Per Capita)
Urbanized Area Population
(2010 Census)
2015 Unlinked Passenger
Trips (Thousands)
Ridership Per Capita
New York-Newark, NY-NJ-CT San Francisco-Oakland, CA Washington, DC-VA-MD Boston, MA-NH-RI Urban Honolulu, HI Chicago, IL-IN Seattle, WA Philadelphia, PA-NJ-DE-MD Portland, OR-WA Los Angeles-Long Beach-Anaheim, CA Baltimore, MD Salt Lake City-West Valley City, UT Ann Arbor, MI Durham, NC Denver-Aurora, CO Pittsburgh, PA Las Vegas-Henderson, NV San Diego, CA Minneapolis-St. Paul, MN-WI Madison, WI Atlanta, GA Milwaukee, WI Miami, FL Albany-Schenectady, NY Buffalo, NY San Jose, CA Cleveland, OH Austin, TX Tucson, AZ New Orleans, LA Rochester, NY San Juan, PR St. Louis, MO-IL San Antonio, TX Charlotte, NC-SC Orlando, FL Phoenix-Mesa, AZ Hartford, CT Sacramento, CA Houston, TX Providence, RI-MA Dallas-Fort Worth-Arlington, TX Louisville/Jefferson County, KY-IN Columbus, OH Tampa-St. Petersburg, FL Riverside-San Bernardino, CA Cincinnati, OH-KY-IN Virginia Beach, VA Kansas City, MO-KS Detroit, MI
18,351,295 3,281,212 4,586,770 4,181,019
802,459 8,608,208 3,059,393 5,441,567 1,849,898
12,150,996 2,203,663 1,021,243
306,022 347,602
2,374,203 1,733,853 1,886,011 2,956,746 2,650,890
401,661 4,515,419 1,376,476 5,502,379
594,962 935,906
1,664,496 1,780,673 1,362,416
843,168 899,703 720,572
2,148,346 2,150,706 1,758,210 1,249,442 1,510,516 3,629,114
924,859 1,723,634 4,944,332 1,190,956 5,121,892
972,546 1,368,035 2,441,770 1,932,666 1,624,827 1,439,666 1,519,417 3,734,090
4,265,917.0 458,299.9 469,800.5 415,184.1 70,501.8
630,852.3 210,016.4 366,649.0 114,375.6 656,459.1 117,977.3 46,721.6 13,946.6 15,193.7
102,479.1 67,553.7 71,939.0
111,461.4 98,689.6 14,662.2
144,218.0 41,270.6
164,265.0 16,881.8 26,301.3 45,102.7 47,841.8 34,716.9 21,407.9 22,686.7 17,292.5 49,558.9 49,514.9 39,681.3 27,691.6 30,336.2 72,825.7 18,083.5 30,557.4 86,665.4 19,644.0 79,262.2 14,908.7 19,360.1 31,461.7 24,452.4 20,516.2 16,568.3 16,495.7 37,662.9
232.5 139.7 102.4 99.3 87.9 73.3 68.6 67.4 61.8 54.0 53.5 45.7 45.6 43.7 43.2 39.0 38.1 37.7 37.2 36.5 31.9 30.0 29.9 28.4 28.1 27.1 26.9 25.5 25.4 25.2 24.0 23.1 23.0 22.6 22.2 20.1 20.1 19.6 17.7 17.5 16.5 15.5 15.3 14.2 12.9 12.7 12.6 11.5 10.9 10.1
(a) Total amounts reported by each agency are included in the urbanized area in which that agency is headquartered regardless of the number of urbanized areas in which the agency operates transit service.

MODAL DATA
34 | P a g e
Table 5: The 50 Largest Bus Agencies (Ranked by Unlinked Passenger Trips)
Transit Agency Urbanized Area
(First City and State Names Only)
Unlinked Passenger Trips
(Thousands)
Passenger Miles (Thousands)
2014 2015 2014 2015
MTA New York City Transit (NYCT) New York, NY 762,582.6 743,763.8 1,588,569.5 1,559,582.6 Los Angeles County Metro. Transp. Auth. (LACMTA) Los Angeles, CA 352,589.2 334,381.4 1,437,718.6 1,389,212.3
Chicago Transit Authority (CTA) Chicago, IL 276,116.8 274,288.8 684,139.0 669,641.7 Southeastern Pennsylvania Transp. Auth. (SEPTA) Philadelphia, PA 177,399.5 171,287.6 525,155.0 502,619.3
New Jersey Transit Corporation (NJ TRANSIT) Newark, NJ 161,229.3 162,454.7 1,121,877.6 1,071,341.7 Washington Metro. Area Transit Auth. (WMATA) Washington, DC 139,668.3 134,250.2 431,959.3 423,567.7
MTA Bus Company (MTABUS) New York, NY 125,581.2 125,399.5 349,659.7 370,989.5
Massachusetts Bay Transportation Authority (MBTA) Boston, MA 108,771.1 122,480.0 292,384.0 316,228.5 King County DOT - Metro Transit Seattle, WA 100,644.6 102,303.0 497,561.0 500,209.0 San Francisco Municipal Railway (MUNI) San Francisco, CA 98,365.6 95,005.3 225,050.4 209,848.7
Maryland Transit Administration (MTA) Baltimore, MD 75,780.2 78,865.9 262,577.7 264,748.0
Denver Regional Transportation District (RTD) Denver, CO 76,657.9 75,502.8 387,701.8 392,843.2 Miami-Dade Transit (MDT) Miami, FL 77,356.9 72,386.5 451,411.3 415,189.0 City and County of Honolulu DOT Services (DTS) Honolulu, HI 66,285.4 69,327.2 362,046.7 342,924.1
Metropolitan Atlanta Rapid Transit Auth. (MARTA) Atlanta, GA 59,777.7 62,868.8 232,782.1 257,024.8
Tri-County Metro. Transp. District of Oregon (TriMet) Portland, OR 59,749.8 62,114.0 286,304.9 287,006.0 Metro Transit Minneapolis, MN 67,814.3 62,106.1 283,941.2 252,878.8 Regional Transp. Comm. of Southern Nevada (RTC) Las Vegas, NV 55,597.7 61,397.3 201,263.5 226,507.2
Metro. Transit Auth. of Harris County, Texas (Metro) Houston, TX 59,993.2 58,009.7 331,877.8 298,024.8
Port Authority of Allegheny County (Port Authority) Pittsburgh, PA 53,401.9 54,843.6 238,589.1 228,634.3 San Diego Metropolitan Transit System (MTS) San Diego, CA 51,327.5 53,939.7 182,816.4 199,464.1 Alameda-Contra Costa Transit District (AC Transit) Oakland, CA 53,512.9 52,899.7 181,094.7 181,142.3
Orange County Transportation Authority (OCTA) Los Angeles, CA 48,561.2 46,696.9 183,484.6 166,820.4
Milwaukee County Transit System (MCTS) Milwaukee, WI 41,014.3 39,313.1 142,120.8 134,205.9 City of Phoenix Public Transit Dept. (Valley Metro) Phoenix, AZ 40,502.8 38,328.6 145,984.8 139,851.4 VIA Metropolitan Transit (VIA) San Antonio, TX 42,537.5 38,067.1 177,989.1 163,841.0
Broward County Transit Division (BCT) Miami, FL 38,118.5 37,166.8 168,960.1 166,581.1
Dallas Area Rapid Transit (DART) Dallas, TX 37,383.0 36,366.3 152,224.7 143,825.5 Santa Clara Valley Transportation Authority (VTA) San Jose, CA 32,858.6 33,040.9 174,990.1 176,478.6 The Greater Cleveland Reg. Transit Auth. (GCRTA) Cleveland, OH 34,426.8 32,810.5 144,877.3 143,016.1
Capital Metropolitan Transportation Auth. (CMTA) Austin, TX 31,976.5 32,261.3 135,348.0 144,788.2
Pace - Suburban Bus Division(PACE) Chicago, IL 31,685.6 30,118.2 205,684.5 202,674.3 Westchester County Bee-Line System New York,NY 31,413.9 29,879.9 153,667.5 146,163.5 Bi-State Development Agency (METRO) St. Louis, MO 30,086.5 29,426.2 158,401.3 146,830.8
Long Beach Transit (LBT) Los Angeles, CA 28,480.6 28,060.2 89,324.1 89,123.8
Nassau Inter County Express (NICE) New York, NY 28,383.9 27,180.3 134,875.6 151,337.5 Central Florida Regional Transp. Auth. (LYNX) Orlando, FL 27,987.5 27,099.6 155,989.1 150,715.3 Ride-On Montgomery County Transit Washington, DC 26,391.6 25,972.3 99,302.5 99,160.7
City of Detroit DOT (DDOT) Detroit, MI 25,116.3 23,899.5 115,433.7 96,434.6
City of Los Angeles DOT (LADOT) Los Angeles, CA 23,406.4 22,044.7 31,200.0 33,775.8 Niagara Frontier Transportation Auth. (NFT Metro) Buffalo, NY 21,602.4 21,714.2 82,975.3 77,126.1
Charlotte Area Transit System (CATS) Charlotte, NC 22,844.8 20,574.2 102,525.9 93,576.5 Utah Transit Authority (UTA) Salt Lake City, UT 19,520.9 19,957.0 89,606.6 90,991.9
City of Tucson (COT) Tucson, AZ 19,713.4 19,657.9 79,832.7 85,473.8 Central Ohio Transit Authority (COTA) Columbus, OH 19,041.4 18,920.0 72,745.0 71,677.6
Santa Monica's Big Blue Bus Los Angeles, CA 18,817.5 18,748.9 73,894.0 76,058.7 Rhode Island Public Transit Authority (RIPTA) Providence, RI 19,780.0 18,074.1 86,383.7 80,364.5
Regional Public Transportation Authority (RPTA) Phoenix, AZ 17,832.4 17,168.4 81,186.3 79,241.4 Regional Transit Service and Lift Line (R-GRTA) Rochester, NY 17,194.9 17,107.0 47,083.1 49,479.0
Capital District Transportation Authority (CDTA) Albany, NY 15,906.6 16,389.8 56,309.4 58,098.6
(a) Excludes Bus Rapid Transit and Commuter Bus Service Reported Separately

MODAL DATA
35 | P a g e
Table 6: Bus Rapid Transit Agencies (Ranked by Unlinked Passenger Trips)
Transit Agency Urbanized Area (First City and
State Names Only)
Unlinked Passenger Trips
(Thousands)
Passenger Miles (Thousands)
2014 2015 2014 2015
MTA New York City Transit (NYCT) New York-, NY 19,953.3 20,090.0 37,727.7 36,658.7 Massachusetts Bay Transportation Authority (MBTA) Boston, MA 9,080.9 9,979.9 15,170.4 15,479.2 Los Angeles County Metropolitan Transp. Auth. (LACMTA) Los Angeles, CA 9,012.0 8,597.7 56,807.0 55,529.2 The Greater Cleveland Regional Transit Authority (GCRTA) Cleveland, OH 5,084.5 4,461.4 13,277.3 10,538.3 Regional Transp. Commission of Southern Nevada (RTC) Las Vegas, NV 4,132.4 4,229.2 16,942.7 18,167.2 Lane Transit District (LTD) Eugene, OR 2,806.8 2,762.1 7,835.7 7,881.5 Kansas City Area Transportation Authority (KCATA) Kansas City, MO 1,545.4 1,435.7 4,163.4 3,826.8 Central Florida Regional Transportation Authority (LYNX) Orlando, FL 1,043.3 1,398.0 976.6 1,538.8 Transfort Fort Collins, CO 568.4 991.2 1,471.5 2,527.5 Interurban Transit Partnership (The Rapid) Grand Rapids, MI 74.6 689.9 300.7 2,345.7 Connecticut Department of Transportation (CTTransit) Hartford, CT --- 261.2 --- 1,600.9
(a) Includes only agencies reporting their operations to the National Transit Database as Bus Rapid Transit.
Table 7: The 30 Largest Commuter Bus Agencies (Ranked by Unlinked Passenger Trips)
Transit Agency Urbanized Area
(First City and State Names Only)
Unlinked Passenger Trips
(Thousands)
Passenger Miles (Thousands)
2014 2015 2014 2015
Central Puget Sound Regional Transit Authority (ST) Seattle, WA 17,669.8 18,312.6 262,725.6 267,400.2
MTA New York City Transit (NYCT) New York, NY 13,182.1 12,627.9 159,266.0 155,069.4 Metro. Transit Auth. of Harris County, Texas (Metro) Houston, TX 8,370.8 8,480.9 150,802.0 142,016.7 Hudson Transit Lines, Inc.(Short Line) New York, NY 4,577.3 4,361.0 242,941.4 --- Maryland Transit Administration (MTA) Baltimore, MD 4,017.1 4,034.2 115,451.1 167,920.4 Academy Lines, Inc. New York, NY 3,873.8 3,777.8 271,628.0 --- Snohomish County PTBA Corp. (Community Transit) Seattle, WA 2,820.9 2,832.1 51,157.3 50,855.4 Suburban Transit Corp. (Coach USA) New York, NY 2,793.3 2,747.9 68,552.5 --- Rockland Coaches, Inc. New York, NY 2,614.2 2,446.2 62,376.8 55,161.6 Alameda-Contra Costa Transit District (AC Transit) San Francisco, CA 2,545.7 2,393.3 32,987.9 33,838.7 DeCamp Bus Lines New York, NY 1,873.9 1,834.1 40,897.3 --- Potomac and Rappahannock Transp. Comm. (PRTC) Washington, DC 1,723.8 1,659.2 43,216.4 41,596.4 Georgia Regional Transportation Authority (GRTA) Atlanta, GA 1,692.5 1,646.5 42,458.9 41,108.1 Lakeland Bus Lines, Inc. New York, NY 1,569.2 1,584.5 43,937.9 --- City of Los Angeles Dept. of Transportation(LADOT) Los Angeles, CA 1,870.8 1,546.1 30,130.8 23,597.5 Trans-Bridge Lines, Inc. New York, NY 1,223.8 1,177.4 105,203.1 --- Loudoun County Commuter Bus Service (LC Transit) Washington, DC 1,402.2 1,144.9 46,708.6 38,137.1 Charlotte Area Transit System (CATS) Charlotte, NC 1,042.4 1,080.3 14,293.9 15,516.8 Hampton Jitney, Inc. New York, NY 836.2 825.1 83,408.3 77,554.3 Ventura Intercity Service Transit Authority (VISTA) Oxnard, CA 823.0 782.4 9,517.3 9,080.4 Clark County PTBA Authority (C-Tran) Portland, OR 731.1 742.3 8,407.4 8,465.4 Jalbert Leasing, Inc. dba C&J Portsmouth, NH 660.4 694.5 --- --- Solano County Transit (SolTrans) Vallejo, CA 672.3 688.1 8,455.7 8,465.4 The Woodlands Township The Woodlands, TX --- 636.5 --- 21,976.7 Monsey New Square Trails Corporation New York, NY 638.6 627.7 25,608.1 25,172.5 Adirondack Transit Lines, Inc, (Adirondack Trailways) New York, NY 601.5 605.2 50,782.4 49,647.2 Utah Transit Authority (UTA) Salt Lake City, UT 644.3 603.0 14,781.2 13,825.0 Boston Express Bus, Inc. (BX) Boston, MA 583.5 590.1 --- --- Capital Metropolitan Transportation Authority (CMTA) Austin, TX 571.2 585.3 8,920.0 9,596.5 Gwinnett County Board of Commissioners (GCT) Atlanta, GA 632.2 582.1 17,498.4 16,114.5
(a) Includes only agencies reporting their operations to the National Transit Database as Commuter Bus.
MODAL DATA
36 | P a g e
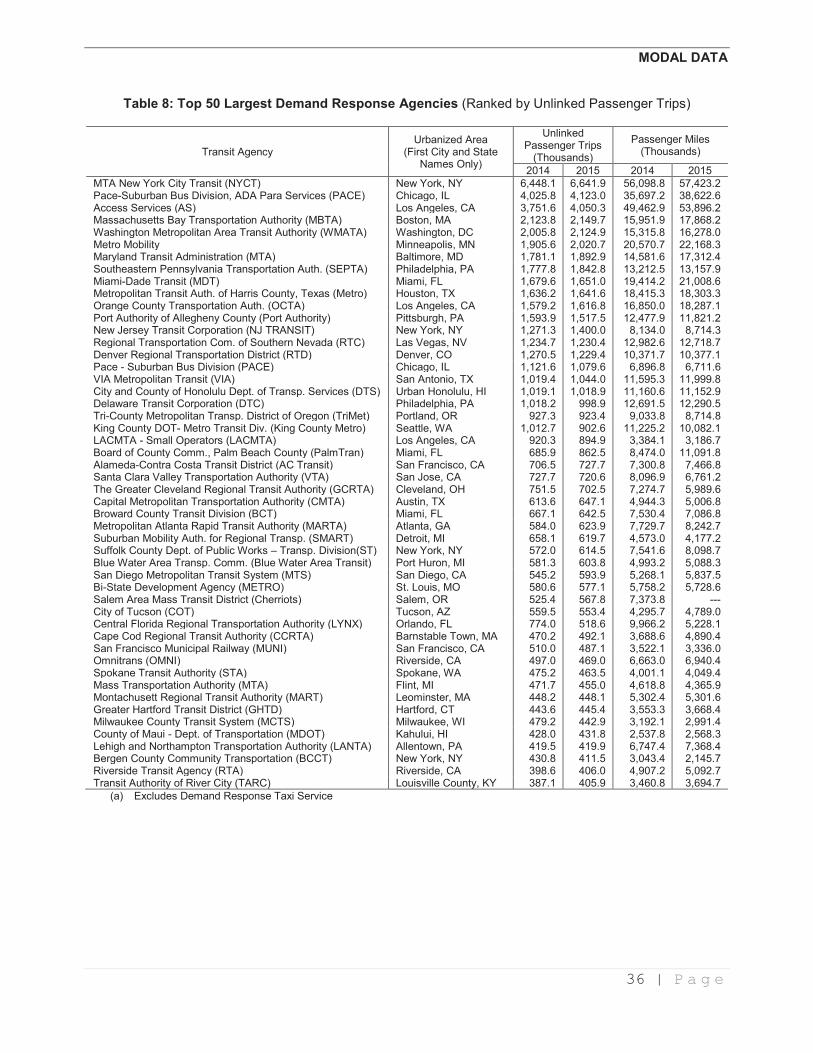
Table 8: Top 50 Largest Demand Response Agencies (Ranked by Unlinked Passenger Trips)
Transit Agency Urbanized Area
(First City and State Names Only)
Unlinked Passenger Trips
(Thousands)
Passenger Miles (Thousands)
2014 2015 2014 2015
MTA New York City Transit (NYCT) New York, NY 6,448.1 6,641.9 56,098.8 57,423.2 Pace-Suburban Bus Division, ADA Para Services (PACE) Chicago, IL 4,025.8 4,123.0 35,697.2 38,622.6 Access Services (AS) Los Angeles, CA 3,751.6 4,050.3 49,462.9 53,896.2 Massachusetts Bay Transportation Authority (MBTA) Boston, MA 2,123.8 2,149.7 15,951.9 17,868.2 Washington Metropolitan Area Transit Authority (WMATA) Washington, DC 2,005.8 2,124.9 15,315.8 16,278.0 Metro Mobility Minneapolis, MN 1,905.6 2,020.7 20,570.7 22,168.3 Maryland Transit Administration (MTA) Baltimore, MD 1,781.1 1,892.9 14,581.6 17,312.4 Southeastern Pennsylvania Transportation Auth. (SEPTA) Philadelphia, PA 1,777.8 1,842.8 13,212.5 13,157.9 Miami-Dade Transit (MDT) Miami, FL 1,679.6 1,651.0 19,414.2 21,008.6 Metropolitan Transit Auth. of Harris County, Texas (Metro) Houston, TX 1,636.2 1,641.6 18,415.3 18,303.3 Orange County Transportation Auth. (OCTA) Los Angeles, CA 1,579.2 1,616.8 16,850.0 18,287.1 Port Authority of Allegheny County (Port Authority) Pittsburgh, PA 1,593.9 1,517.5 12,477.9 11,821.2 New Jersey Transit Corporation (NJ TRANSIT) New York, NY 1,271.3 1,400.0 8,134.0 8,714.3 Regional Transportation Com. of Southern Nevada (RTC) Las Vegas, NV 1,234.7 1,230.4 12,982.6 12,718.7 Denver Regional Transportation District (RTD) Denver, CO 1,270.5 1,229.4 10,371.7 10,377.1 Pace - Suburban Bus Division (PACE) Chicago, IL 1,121.6 1,079.6 6,896.8 6,711.6 VIA Metropolitan Transit (VIA) San Antonio, TX 1,019.4 1,044.0 11,595.3 11,999.8 City and County of Honolulu Dept. of Transp. Services (DTS) Urban Honolulu, HI 1,019.1 1,018.9 11,160.6 11,152.9 Delaware Transit Corporation (DTC) Philadelphia, PA 1,018.2 998.9 12,691.5 12,290.5 Tri-County Metropolitan Transp. District of Oregon (TriMet) Portland, OR 927.3 923.4 9,033.8 8,714.8 King County DOT- Metro Transit Div. (King County Metro) Seattle, WA 1,012.7 902.6 11,225.2 10,082.1 LACMTA - Small Operators (LACMTA) Los Angeles, CA 920.3 894.9 3,384.1 3,186.7 Board of County Comm., Palm Beach County (PalmTran) Miami, FL 685.9 862.5 8,474.0 11,091.8 Alameda-Contra Costa Transit District (AC Transit) San Francisco, CA 706.5 727.7 7,300.8 7,466.8 Santa Clara Valley Transportation Authority (VTA) San Jose, CA 727.7 720.6 8,096.9 6,761.2 The Greater Cleveland Regional Transit Authority (GCRTA) Cleveland, OH 751.5 702.5 7,274.7 5,989.6 Capital Metropolitan Transportation Authority (CMTA) Austin, TX 613.6 647.1 4,944.3 5,006.8 Broward County Transit Division (BCT) Miami, FL 667.1 642.5 7,530.4 7,086.8 Metropolitan Atlanta Rapid Transit Authority (MARTA) Atlanta, GA 584.0 623.9 7,729.7 8,242.7 Suburban Mobility Auth. for Regional Transp. (SMART) Detroit, MI 658.1 619.7 4,573.0 4,177.2 Suffolk County Dept. of Public Works – Transp. Division(ST) New York, NY 572.0 614.5 7,541.6 8,098.7 Blue Water Area Transp. Comm. (Blue Water Area Transit) Port Huron, MI 581.3 603.8 4,993.2 5,088.3 San Diego Metropolitan Transit System (MTS) San Diego, CA 545.2 593.9 5,268.1 5,837.5 Bi-State Development Agency (METRO) St. Louis, MO 580.6 577.1 5,758.2 5,728.6 Salem Area Mass Transit District (Cherriots) Salem, OR 525.4 567.8 7,373.8 --- City of Tucson (COT) Tucson, AZ 559.5 553.4 4,295.7 4,789.0 Central Florida Regional Transportation Authority (LYNX) Orlando, FL 774.0 518.6 9,966.2 5,228.1 Cape Cod Regional Transit Authority (CCRTA) Barnstable Town, MA 470.2 492.1 3,688.6 4,890.4 San Francisco Municipal Railway (MUNI) San Francisco, CA 510.0 487.1 3,522.1 3,336.0 Omnitrans (OMNI) Riverside, CA 497.0 469.0 6,663.0 6,940.4 Spokane Transit Authority (STA) Spokane, WA 475.2 463.5 4,001.1 4,049.4 Mass Transportation Authority (MTA) Flint, MI 471.7 455.0 4,618.8 4,365.9 Montachusett Regional Transit Authority (MART) Leominster, MA 448.2 448.1 5,302.4 5,301.6 Greater Hartford Transit District (GHTD) Hartford, CT 443.6 445.4 3,553.3 3,668.4 Milwaukee County Transit System (MCTS) Milwaukee, WI 479.2 442.9 3,192.1 2,991.4 County of Maui - Dept. of Transportation (MDOT) Kahului, HI 428.0 431.8 2,537.8 2,568.3 Lehigh and Northampton Transportation Authority (LANTA) Allentown, PA 419.5 419.9 6,747.4 7,368.4 Bergen County Community Transportation (BCCT) New York, NY 430.8 411.5 3,043.4 2,145.7 Riverside Transit Agency (RTA) Riverside, CA 398.6 406.0 4,907.2 5,092.7 Transit Authority of River City (TARC) Louisville County, KY 387.1 405.9 3,460.8 3,694.7
(a) Excludes Demand Response Taxi Service

MODAL DATA
37 | P a g e
Table 9: Top 30 Largest Transit Vanpool Agencies (Ranked by Unlinked Passenger Trips)
Transit Agency Urbanized Area (First City and
State Names Only)
Unlinked Passenger Trips
(Thousands)
Passenger Miles (Thousands)
2014 2015 2014 2015
Los Angeles County Metropolitan Transp. Auth. (LACMTA) Los Angeles, CA 3,983.6 4,095.1 177,435.2 185,794.7 King County Department of Transp. (King County Metro) Seattle, WA 3,414.8 3,561.4 66,111.7 72,727.0 Metropolitan Transit Auth. of Harris County, Texas (Metro) Houston, TX 2,436.9 2,445.2 69,573.4 71,491.9 San Diego Association of Governments (SANDAG) San Diego, CA 2,145.4 2,160.3 102,390.5 101,406.7 California Vanpool Authority (CalVans) Hanford, CA 1,844.1 2,154.1 80,230.4 94,156.4 Pace - Suburban Bus Division (PACE) Chicago, IL 1,923.2 1,851.0 45,684.7 41,382.3 Utah Transit Authority (UTA) Salt Lake City, UT 1,404.3 1,423.7 51,601.6 51,997.9 Orange County Transportation Authority (OCTA) Los Angeles, CA 1,224.5 1,287.2 42,638.7 43,927.1 VRide, Inc. – Michigan Detroit, MI 1,240.3 1,238.4 52,263.2 42,802.3 vRide, Inc. - Valley Metro Phoenix, AZ 1,068.1 1,177.7 29,865.0 32,461.7 Potomac and Rappahannock Transp. Commission (PRTC) Washington, DC 383.2 1,030.7 18,499.0 47,196.4 Snohomish County PTBA (Community Transit) Seattle, WA 924.9 912.6 24,029.3 23,126.7 Pierce County Transp. Benefit Area Auth. (Pierce Transit) Seattle, WA 906.7 849.2 24,802.3 23,385.2 Ben Franklin Transit (BFT) Kennewick, WA 828.2 794.6 27,035.6 25,387.2 vRide, Inc. – Atlanta Atlanta, GA 719.1 767.8 25,795.4 23,193.9 New Jersey Transit Corporation (NJ TRANSIT) New York, NY 770.0 763.7 27,211.1 29,926.2 Intercity Transit (I.T.) Olympia, WA 743.9 685.1 26,550.1 24,567.1 Miami Lakes - vRide, Inc. Miami, FL 583.0 592.3 15,915.6 20,056.4 Dallas Area Rapid Transit (DART) Dallas, TX 893.0 576.8 34,420.4 21,517.6 Victor Valley Transit Authority (VVTA) Victorville, CA 413.7 527.7 19,792.1 24,270.5 VIA Metropolitan Transit (VIA) San Antonio, TX 455.8 459.1 19,138.1 20,414.8 Greater Richmond Transit Company (GRTC Transit System) Richmond, VA 430.0 432.3 31,445.0 31,503.6 Dallas - vRide, Inc. Dallas, TX 514.3 384.9 22,505.8 18,532.3 Central Florida Regional Transportation Authority (LYNX) Orlando, FL 333.4 349.1 11,137.0 11,563.8 Capital Metropolitan Transportation Authority (CMTA) Austin, TX 233.9 344.7 6,321.2 10,508.9 Research Triangle Regional Public Transportation Authority Durham, NC 325.7 310.4 10,037.2 9,156.3 Centre Area Transportation Authority (CATA) State College, PA 210.3 249.8 5,445.6 10,421.0 Piedmont Authority for Regional Transportation (PART) Greensboro, NC 264.1 246.2 11,017.7 10,428.8 Southwestern Pennsylvania Commission (SPC) Pittsburgh, PA 269.1 245.2 7,766.2 7,131.9 Charlotte Area Transit System (CATS) Charlotte, NC 255.2 240.3 12,240.9 11,604.3
Table 10: Trolleybus Agencies (Ranked by Unlinked Passenger Trips)
Transit Agency Urbanized Area (First City and
State Names Only)
Unlinked Passenger Trips
(Thousands)
Passenger Miles (Thousands)
2014 2015 2014 2015
San Francisco Municipal Railway (MUNI) San Francisco, CA 65,328.4 60,553.9 99,004.8 90,484.0 King County Department of Transp. (King County Metro) Seattle, WA 19,464.4 18,769.3 35,310.7 33,642.7 Southeastern Pennsylvania Transp. Authority (SEPTA) Philadelphia, PA 6,562.6 6,696.0 12,854.4 12,795.2 Greater Dayton Regional Transit Authority (GDRTA) Dayton, OH 2,406.6 2,315.5 6,710.3 6,355.0 Massachusetts Bay Transportation Authority (MBTA) Boston, MA 1,763.6 1,347.7 3,851.3 2,940.9
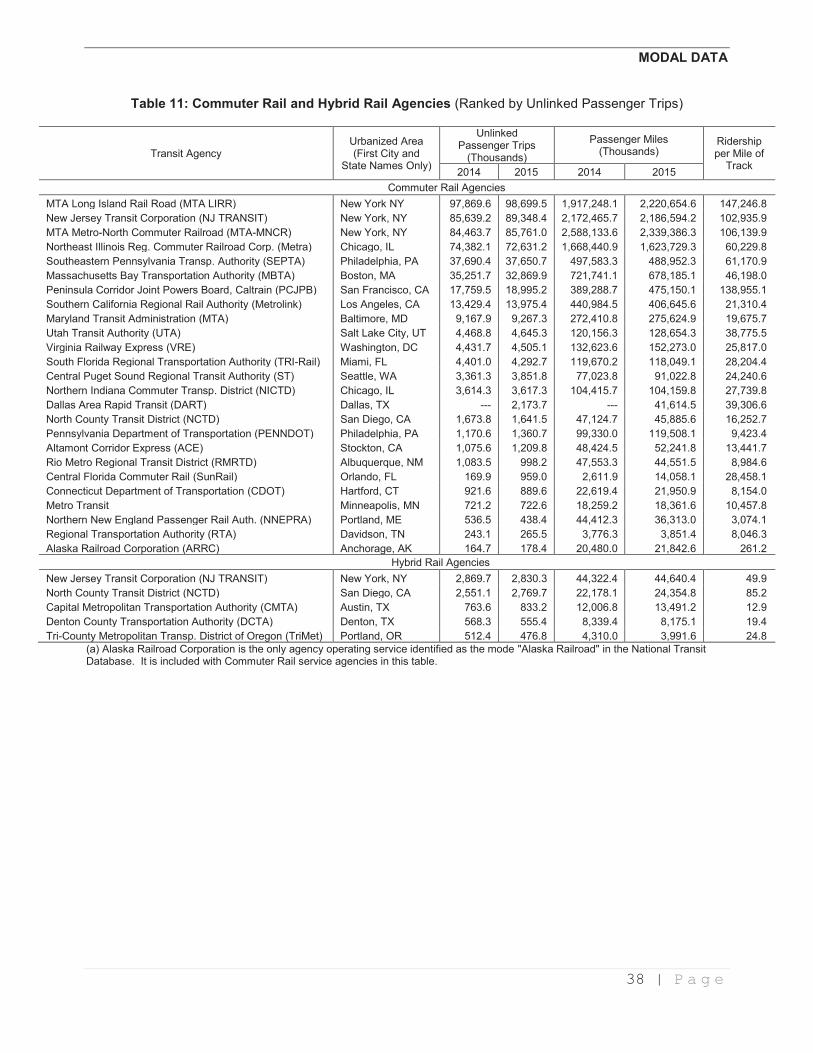
MODAL DATA
38 | P a g e
Table 11: Commuter Rail and Hybrid Rail Agencies (Ranked by Unlinked Passenger Trips)
Transit Agency Urbanized Area (First City and
State Names Only)
Unlinked Passenger Trips
(Thousands)
Passenger Miles (Thousands)
Ridership per Mile of
Track 2014 2015 2014 2015
Commuter Rail Agencies
MTA Long Island Rail Road (MTA LIRR) New York NY 97,869.6 98,699.5 1,917,248.1 2,220,654.6 147,246.8
New Jersey Transit Corporation (NJ TRANSIT) New York, NY 85,639.2 89,348.4 2,172,465.7 2,186,594.2 102,935.9
MTA Metro-North Commuter Railroad (MTA-MNCR) New York, NY 84,463.7 85,761.0 2,588,133.6 2,339,386.3 106,139.9
Northeast Illinois Reg. Commuter Railroad Corp. (Metra) Chicago, IL 74,382.1 72,631.2 1,668,440.9 1,623,729.3 60,229.8
Southeastern Pennsylvania Transp. Authority (SEPTA) Philadelphia, PA 37,690.4 37,650.7 497,583.3 488,952.3 61,170.9
Massachusetts Bay Transportation Authority (MBTA) Boston, MA 35,251.7 32,869.9 721,741.1 678,185.1 46,198.0
Peninsula Corridor Joint Powers Board, Caltrain (PCJPB) San Francisco, CA 17,759.5 18,995.2 389,288.7 475,150.1 138,955.1
Southern California Regional Rail Authority (Metrolink) Los Angeles, CA 13,429.4 13,975.4 440,984.5 406,645.6 21,310.4
Maryland Transit Administration (MTA) Baltimore, MD 9,167.9 9,267.3 272,410.8 275,624.9 19,675.7
Utah Transit Authority (UTA) Salt Lake City, UT 4,468.8 4,645.3 120,156.3 128,654.3 38,775.5
Virginia Railway Express (VRE) Washington, DC 4,431.7 4,505.1 132,623.6 152,273.0 25,817.0
South Florida Regional Transportation Authority (TRI-Rail) Miami, FL 4,401.0 4,292.7 119,670.2 118,049.1 28,204.4
Central Puget Sound Regional Transit Authority (ST) Seattle, WA 3,361.3 3,851.8 77,023.8 91,022.8 24,240.6
Northern Indiana Commuter Transp. District (NICTD) Chicago, IL 3,614.3 3,617.3 104,415.7 104,159.8 27,739.8
Dallas Area Rapid Transit (DART) Dallas, TX --- 2,173.7 --- 41,614.5 39,306.6
North County Transit District (NCTD) San Diego, CA 1,673.8 1,641.5 47,124.7 45,885.6 16,252.7
Pennsylvania Department of Transportation (PENNDOT) Philadelphia, PA 1,170.6 1,360.7 99,330.0 119,508.1 9,423.4
Altamont Corridor Express (ACE) Stockton, CA 1,075.6 1,209.8 48,424.5 52,241.8 13,441.7
Rio Metro Regional Transit District (RMRTD) Albuquerque, NM 1,083.5 998.2 47,553.3 44,551.5 8,984.6
Central Florida Commuter Rail (SunRail) Orlando, FL 169.9 959.0 2,611.9 14,058.1 28,458.1
Connecticut Department of Transportation (CDOT) Hartford, CT 921.6 889.6 22,619.4 21,950.9 8,154.0
Metro Transit Minneapolis, MN 721.2 722.6 18,259.2 18,361.6 10,457.8
Northern New England Passenger Rail Auth. (NNEPRA) Portland, ME 536.5 438.4 44,412.3 36,313.0 3,074.1
Regional Transportation Authority (RTA) Davidson, TN 243.1 265.5 3,776.3 3,851.4 8,046.3
Alaska Railroad Corporation (ARRC) Anchorage, AK 164.7 178.4 20,480.0 21,842.6 261.2
Hybrid Rail Agencies
New Jersey Transit Corporation (NJ TRANSIT) New York, NY 2,869.7 2,830.3 44,322.4 44,640.4 49.9
North County Transit District (NCTD) San Diego, CA 2,551.1 2,769.7 22,178.1 24,354.8 85.2
Capital Metropolitan Transportation Authority (CMTA) Austin, TX 763.6 833.2 12,006.8 13,491.2 12.9
Denton County Transportation Authority (DCTA) Denton, TX 568.3 555.4 8,339.4 8,175.1 19.4
Tri-County Metropolitan Transp. District of Oregon (TriMet) Portland, OR 512.4 476.8 4,310.0 3,991.6 24.8
(a) Alaska Railroad Corporation is the only agency operating service identified as the mode "Alaska Railroad" in the National Transit Database. It is included with Commuter Rail service agencies in this table.

MODAL DATA
39 | P a g e
Table 12: Heavy Rail Agencies (Ranked by Unlinked Passenger Trips)
Transit Agency Urbanized Area
(First City and State Names Only)
Unlinked Passenger Trips
(Thousands) Passenger Miles (Thousands) Ridership per
Mile of Track 2014 2015 2014 2015
MTA New York City Transit (NYCT) New York, NY 2,743,004.5 2,662,421.2 11,152,745.3 10,870,498.4 3,198,103.6
Washington Metro. Area Transit Auth. (WMATA) Washington, DC 269,529.0 270,162.1 1,519,705.3 1,590,762.8 924,263.2
Chicago Transit Authority (CTA) Chicago, IL 238,100.1 241,676.1 1,446,542.1 1,477,398.1 839,736.2
Massachusetts Bay Transportation Auth. (MBTA) Boston, MA 178,462.4 174,943.6 606,830.0 578,656.5 1,619,848.6
San Francisco Bay Area Rapid Transit District (BART) San Francisco, CA 125,784.2 134,660.1 1,655,369.3 1,791,366.2 503,214.0
Southeastern Pennsylvania Transp. Auth. (SEPTA) Philadelphia, PA 99,288.8 100,747.8 439,437.8 443,501.7 1,009,496.6
Port Authority Trans-Hudson Corporation (PATH) New York, NY 83,070.4 85,521.8 349,934.6 360,882.1 1,984,263.9
Metropolitan Atlanta Rapid Transit Authority (MARTA) Atlanta, GA 68,761.6 72,536.5 444,957.3 472,764.5 699,484.2
Los Angeles County Metro. Transp. Auth. (LACMTA) Los Angeles, CA 50,364.8 47,506.7 254,439.7 236,022.6 1,393,158.7
Miami-Dade Transit (MDT) Miami, FL 21,751.4 21,910.6 159,954.1 161,987.1 375,825.2
Maryland Transit Administration (MTA) Baltimore, MD 14,632.4 13,900.8 75,330.8 67,159.4 408,847.4
Port Authority Transit Corporation (PATCO) Philadelphia, PA 10,007.3 10,169.5 88,526.8 90,717.0 264,830.4
Alternativa de Transporte Integrado -ATI (PRHTA) San Juan, PR 10,877.3 8,958.2 51,975.1 43,795.7 351,303.8
Staten Island Rapid Transit Operating Auth. (SIRTOA) New York, NY 8,301.8 8,557.0 52,033.9 53,632.9 269,937.2
The Greater Cleveland Reg. Transit Auth. (GCRTA) Cleveland, OH 6,203.8 6,438.3 41,266.6 43,869.2 153,657.6
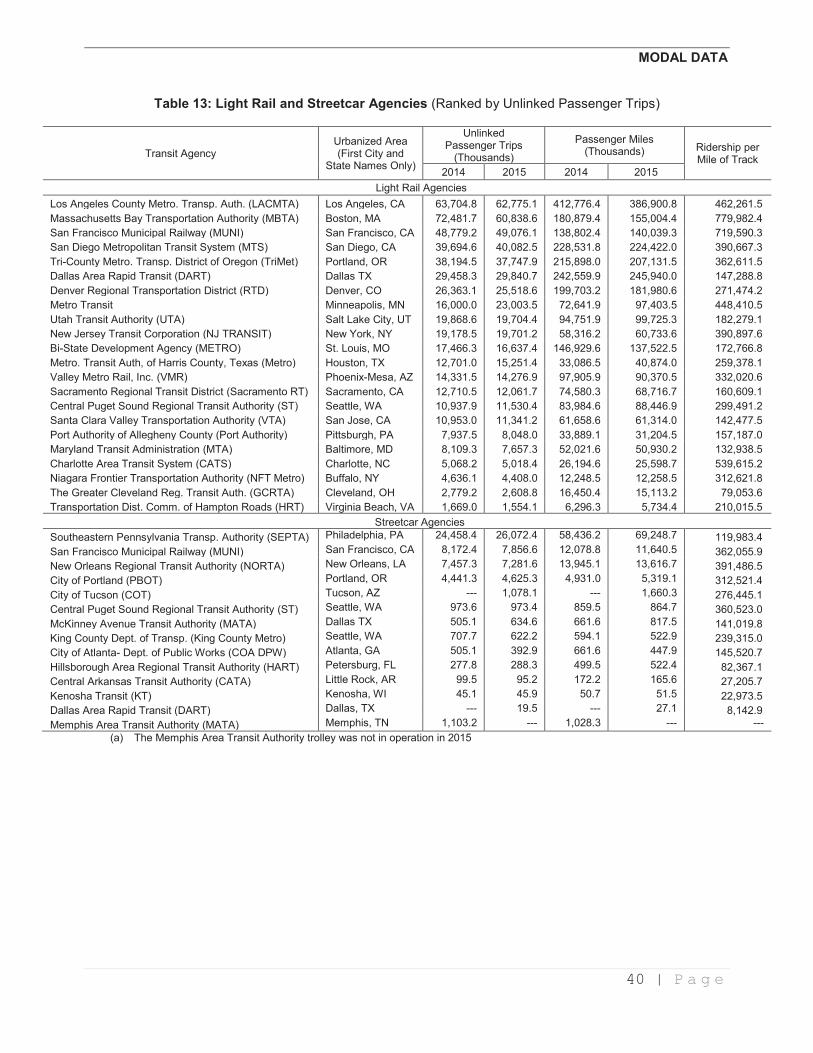
MODAL DATA
40 | P a g e
Table 13: Light Rail and Streetcar Agencies (Ranked by Unlinked Passenger Trips)
Transit Agency Urbanized Area (First City and
State Names Only)
Unlinked Passenger Trips
(Thousands)
Passenger Miles (Thousands) Ridership per
Mile of Track
2014 2015 2014 2015
Light Rail Agencies
Los Angeles County Metro. Transp. Auth. (LACMTA) Los Angeles, CA 63,704.8 62,775.1 412,776.4 386,900.8 462,261.5
Massachusetts Bay Transportation Authority (MBTA) Boston, MA 72,481.7 60,838.6 180,879.4 155,004.4 779,982.4
San Francisco Municipal Railway (MUNI) San Francisco, CA 48,779.2 49,076.1 138,802.4 140,039.3 719,590.3
San Diego Metropolitan Transit System (MTS) San Diego, CA 39,694.6 40,082.5 228,531.8 224,422.0 390,667.3
Tri-County Metro. Transp. District of Oregon (TriMet) Portland, OR 38,194.5 37,747.9 215,898.0 207,131.5 362,611.5
Dallas Area Rapid Transit (DART) Dallas TX 29,458.3 29,840.7 242,559.9 245,940.0 147,288.8
Denver Regional Transportation District (RTD) Denver, CO 26,363.1 25,518.6 199,703.2 181,980.6 271,474.2
Metro Transit Minneapolis, MN 16,000.0 23,003.5 72,641.9 97,403.5 448,410.5
Utah Transit Authority (UTA) Salt Lake City, UT 19,868.6 19,704.4 94,751.9 99,725.3 182,279.1
New Jersey Transit Corporation (NJ TRANSIT) New York, NY 19,178.5 19,701.2 58,316.2 60,733.6 390,897.6
Bi-State Development Agency (METRO) St. Louis, MO 17,466.3 16,637.4 146,929.6 137,522.5 172,766.8
Metro. Transit Auth, of Harris County, Texas (Metro) Houston, TX 12,701.0 15,251.4 33,086.5 40,874.0 259,378.1
Valley Metro Rail, Inc. (VMR) Phoenix-Mesa, AZ 14,331.5 14,276.9 97,905.9 90,370.5 332,020.6
Sacramento Regional Transit District (Sacramento RT) Sacramento, CA 12,710.5 12,061.7 74,580.3 68,716.7 160,609.1
Central Puget Sound Regional Transit Authority (ST) Seattle, WA 10,937.9 11,530.4 83,984.6 88,446.9 299,491.2
Santa Clara Valley Transportation Authority (VTA) San Jose, CA 10,953.0 11,341.2 61,658.6 61,314.0 142,477.5
Port Authority of Allegheny County (Port Authority) Pittsburgh, PA 7,937.5 8,048.0 33,889.1 31,204.5 157,187.0
Maryland Transit Administration (MTA) Baltimore, MD 8,109.3 7,657.3 52,021.6 50,930.2 132,938.5
Charlotte Area Transit System (CATS) Charlotte, NC 5,068.2 5,018.4 26,194.6 25,598.7 539,615.2
Niagara Frontier Transportation Authority (NFT Metro) Buffalo, NY 4,636.1 4,408.0 12,248.5 12,258.5 312,621.8
The Greater Cleveland Reg. Transit Auth. (GCRTA) Cleveland, OH 2,779.2 2,608.8 16,450.4 15,113.2 79,053.6
Transportation Dist. Comm. of Hampton Roads (HRT) Virginia Beach, VA 1,669.0 1,554.1 6,296.3 5,734.4 210,015.5
Streetcar Agencies
Southeastern Pennsylvania Transp. Authority (SEPTA) Philadelphia, PA 24,458.4 26,072.4 58,436.2 69,248.7 119,983.4
San Francisco Municipal Railway (MUNI) San Francisco, CA 8,172.4 7,856.6 12,078.8 11,640.5 362,055.9
New Orleans Regional Transit Authority (NORTA) New Orleans, LA 7,457.3 7,281.6 13,945.1 13,616.7 391,486.5
City of Portland (PBOT) Portland, OR 4,441.3 4,625.3 4,931.0 5,319.1 312,521.4
City of Tucson (COT) Tucson, AZ --- 1,078.1 --- 1,660.3 276,445.1
Central Puget Sound Regional Transit Authority (ST) Seattle, WA 973.6 973.4 859.5 864.7 360,523.0
McKinney Avenue Transit Authority (MATA) Dallas TX 505.1 634.6 661.6 817.5 141,019.8
King County Dept. of Transp. (King County Metro) Seattle, WA 707.7 622.2 594.1 522.9 239,315.0
City of Atlanta- Dept. of Public Works (COA DPW) Atlanta, GA 505.1 392.9 661.6 447.9 145,520.7
Hillsborough Area Regional Transit Authority (HART) Petersburg, FL 277.8 288.3 499.5 522.4 82,367.1
Central Arkansas Transit Authority (CATA) Little Rock, AR 99.5 95.2 172.2 165.6 27,205.7
Kenosha Transit (KT) Kenosha, WI 45.1 45.9 50.7 51.5 22,973.5
Dallas Area Rapid Transit (DART) Dallas, TX --- 19.5 --- 27.1 8,142.9
Memphis Area Transit Authority (MATA) Memphis, TN 1,103.2 --- 1,028.3 --- ---
(a) The Memphis Area Transit Authority trolley was not in operation in 2015
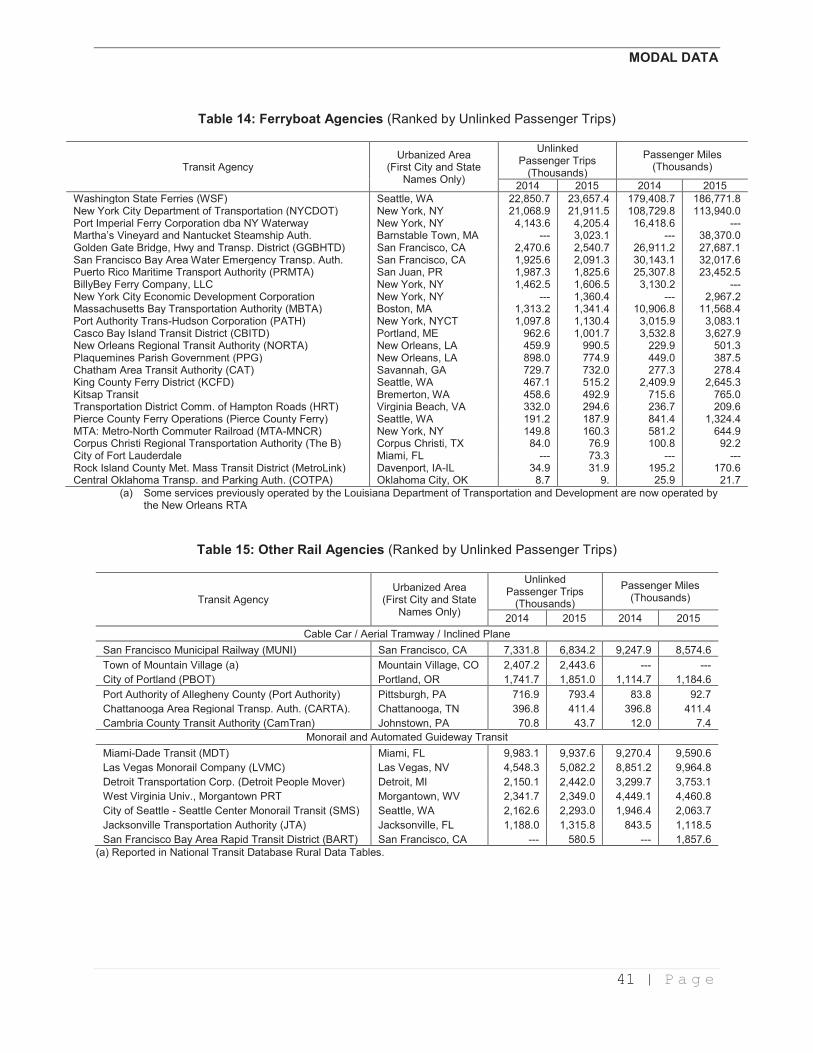
MODAL DATA
41 | P a g e
Table 14: Ferryboat Agencies (Ranked by Unlinked Passenger Trips)
Transit Agency Urbanized Area
(First City and State Names Only)
Unlinked Passenger Trips
(Thousands)
Passenger Miles (Thousands)
2014 2015 2014 2015
Washington State Ferries (WSF) Seattle, WA 22,850.7 23,657.4 179,408.7 186,771.8 New York City Department of Transportation (NYCDOT) New York, NY 21,068.9 21,911.5 108,729.8 113,940.0 Port Imperial Ferry Corporation dba NY Waterway New York, NY 4,143.6 4,205.4 16,418.6 --- Martha’s Vineyard and Nantucket Steamship Auth. Barnstable Town, MA --- 3,023.1 --- 38,370.0 Golden Gate Bridge, Hwy and Transp. District (GGBHTD) San Francisco, CA 2,470.6 2,540.7 26,911.2 27,687.1 San Francisco Bay Area Water Emergency Transp. Auth. San Francisco, CA 1,925.6 2,091.3 30,143.1 32,017.6 Puerto Rico Maritime Transport Authority (PRMTA) San Juan, PR 1,987.3 1,825.6 25,307.8 23,452.5 BillyBey Ferry Company, LLC New York, NY 1,462.5 1,606.5 3,130.2 --- New York City Economic Development Corporation New York, NY --- 1,360.4 --- 2,967.2 Massachusetts Bay Transportation Authority (MBTA) Boston, MA 1,313.2 1,341.4 10,906.8 11,568.4 Port Authority Trans-Hudson Corporation (PATH) New York, NYCT 1,097.8 1,130.4 3,015.9 3,083.1 Casco Bay Island Transit District (CBITD) Portland, ME 962.6 1,001.7 3,532.8 3,627.9 New Orleans Regional Transit Authority (NORTA) New Orleans, LA 459.9 990.5 229.9 501.3 Plaquemines Parish Government (PPG) New Orleans, LA 898.0 774.9 449.0 387.5 Chatham Area Transit Authority (CAT) Savannah, GA 729.7 732.0 277.3 278.4 King County Ferry District (KCFD) Seattle, WA 467.1 515.2 2,409.9 2,645.3 Kitsap Transit Bremerton, WA 458.6 492.9 715.6 765.0 Transportation District Comm. of Hampton Roads (HRT) Virginia Beach, VA 332.0 294.6 236.7 209.6 Pierce County Ferry Operations (Pierce County Ferry) Seattle, WA 191.2 187.9 841.4 1,324.4 MTA: Metro-North Commuter Railroad (MTA-MNCR) New York, NY 149.8 160.3 581.2 644.9 Corpus Christi Regional Transportation Authority (The B) Corpus Christi, TX 84.0 76.9 100.8 92.2 City of Fort Lauderdale Miami, FL --- 73.3 --- --- Rock Island County Met. Mass Transit District (MetroLink) Davenport, IA-IL 34.9 31.9 195.2 170.6 Central Oklahoma Transp. and Parking Auth. (COTPA) Oklahoma City, OK 8.7 9. 25.9 21.7
(a) Some services previously operated by the Louisiana Department of Transportation and Development are now operated by the New Orleans RTA
Table 15: Other Rail Agencies (Ranked by Unlinked Passenger Trips)
Transit Agency Urbanized Area
(First City and State Names Only)
Unlinked Passenger Trips
(Thousands)
Passenger Miles (Thousands)
2014 2015 2014 2015
Cable Car / Aerial Tramway / Inclined Plane
San Francisco Municipal Railway (MUNI) San Francisco, CA 7,331.8 6,834.2 9,247.9 8,574.6
Town of Mountain Village (a) Mountain Village, CO 2,407.2 2,443.6 --- ---
City of Portland (PBOT) Portland, OR 1,741.7 1,851.0 1,114.7 1,184.6
Port Authority of Allegheny County (Port Authority) Pittsburgh, PA 716.9 793.4 83.8 92.7
Chattanooga Area Regional Transp. Auth. (CARTA). Chattanooga, TN 396.8 411.4 396.8 411.4
Cambria County Transit Authority (CamTran) Johnstown, PA 70.8 43.7 12.0 7.4
Monorail and Automated Guideway Transit
Miami-Dade Transit (MDT) Miami, FL 9,983.1 9,937.6 9,270.4 9,590.6
Las Vegas Monorail Company (LVMC) Las Vegas, NV 4,548.3 5,082.2 8,851.2 9,964.8
Detroit Transportation Corp. (Detroit People Mover) Detroit, MI 2,150.1 2,442.0 3,299.7 3,753.1
West Virginia Univ., Morgantown PRT Morgantown, WV 2,341.7 2,349.0 4,449.1 4,460.8
City of Seattle - Seattle Center Monorail Transit (SMS) Seattle, WA 2,162.6 2,293.0 1,946.4 2,063.7
Jacksonville Transportation Authority (JTA) Jacksonville, FL 1,188.0 1,315.8 843.5 1,118.5
San Francisco Bay Area Rapid Transit District (BART) San Francisco, CA --- 580.5 --- 1,857.6
(a) Reported in National Transit Database Rural Data Tables.

MODAL DATA
42 | P a g e
The National Transit Database publishes a separate and less detailed database for rural transit agencies which provide service outside of urbanized areas. Tables 15 and 16 include only agencies reporting to the Federal Transit Administration RY 2015 National Transit Database for Rural Areas.
Table 16: 35 Largest Rural Bus and 12 Largest Rural Commuter Bus Agencies (Ranked by Unlinked Passenger Trips)
State Transit Agency Name
Unlinked Passenger Trips (a)
2014 2015
Rural Bus Agencies
MD Mayor and City Council Town of Ocean City 2,727,724 2,579,958
TN Pigeon Forge Fun Time Trolleys 866,756 2,287,113
CO Roaring Fork Transportation Authority 1,983,742 2,018,873
CO Summit County 1,845,666 1,893,823
UT Park City Municipal Corporation 1,818,869 1,848,596
NC AppalCart 1,725,371 1,801,015
IL City of Macomb 1,919,723 1,741,769
WA Pullman Transit 1,389,761 1,357,906
MA Martha's Vineyard Transit Authority 1,224,587 1,292,233
MS City of Oxford --- 1,226,151
AK City and Borough of Juneau 1,171,850 1,121,020
CO Steamboat Springs, City of 1,124,061 1,036,942
WY Southern Teton Area Rapid Transit 26,066 950,756
CA Eastern Sierra Transit Authority 910,459 910,708
CO Eagle County Regional Transportation Authority 889,876 894,783
TN City of Gatlinburg 900,394 893,606
VT Advance Transit, Inc. NH 868,082 828,273
HI County of Kaua'i - Transportation Agency 819,950 795,923
WA Clallam Transit System 796,498 754,103
CO Town of Breckenridge 660,369 748,806
NY City of Oneonta 711,128 734,024
MS SMART Starkville-MSU Area Rapid Transit --- 709,064
WA Island Transit 977,348 706,598
WY University of Wyoming 664,237 673,179
OK OSU-Stillwater Community Transit 719,111 664,771
WA Grays Harbor Transit 647,943 662,598
NV Tahoe Transportation District 717,082 579,270
TX City of South Padre Island 626,330 546,814
ME Downeast Transportation, Inc. 433,588 513,925
NM Incorporated County of Los Alamos 446,361 499,240
CA Kern Regional Transit --- 489,329
VT Marble Valley Regional Transit District 469,419 482,442
CT Mashantucket Pequot Tribal Nation --- 480,931
CO Town of Snowmass Village 504,556 473,653
CO City of Durango 577,540 466,464
Rural Commuter Bus Agencies
CO Roaring Fork Transportation Authority 1,759,612 1,723,933
HI County of Hawaii Mass Transit Agency 920,280 944,738
CA Humboldt Transit Authority 608,927 612,927
AZ Navajo Nation 250,842 213,221
TX El Paso County 197,465 193,322
OR Yamhill County 169,812 171,117
VT Marble Valley Regional Transit District 133,444 130,484
PA New Castle Area Transit Authority 130,082 127,492
OR City of Sandy 153,514 118,510
SC Lowcountry Regional Transportation Authority 103,863 117,852
AK Valley Mover 80,401 84,772
OR Columbia County 66,554 83,983
(a) Sum of "regular trips" and "coordinated trips."
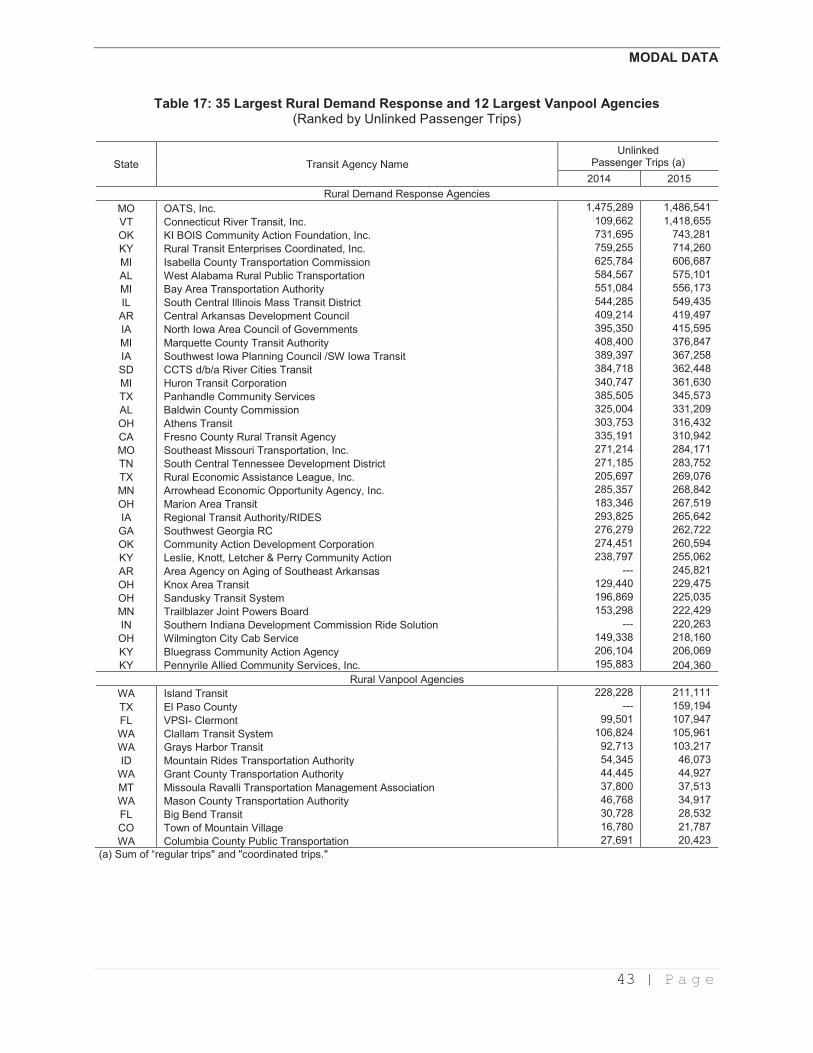
MODAL DATA
43 | P a g e
Table 17: 35 Largest Rural Demand Response and 12 Largest Vanpool Agencies (Ranked by Unlinked Passenger Trips)
State Transit Agency Name
Unlinked Passenger Trips (a)
2014 2015
Rural Demand Response Agencies
MO OATS, Inc. 1,475,289 1,486,541
VT Connecticut River Transit, Inc. 109,662 1,418,655
OK KI BOIS Community Action Foundation, Inc. 731,695 743,281
KY Rural Transit Enterprises Coordinated, Inc. 759,255 714,260
MI Isabella County Transportation Commission 625,784 606,687
AL West Alabama Rural Public Transportation 584,567 575,101
MI Bay Area Transportation Authority 551,084 556,173
IL South Central Illinois Mass Transit District 544,285 549,435
AR Central Arkansas Development Council 409,214 419,497
IA North Iowa Area Council of Governments 395,350 415,595
MI Marquette County Transit Authority 408,400 376,847
IA Southwest Iowa Planning Council /SW Iowa Transit 389,397 367,258
SD CCTS d/b/a River Cities Transit 384,718 362,448
MI Huron Transit Corporation 340,747 361,630
TX Panhandle Community Services 385,505 345,573
AL Baldwin County Commission 325,004 331,209
OH Athens Transit 303,753 316,432
CA Fresno County Rural Transit Agency 335,191 310,942
MO Southeast Missouri Transportation, Inc. 271,214 284,171
TN South Central Tennessee Development District 271,185 283,752
TX Rural Economic Assistance League, Inc. 205,697 269,076
MN Arrowhead Economic Opportunity Agency, Inc. 285,357 268,842
OH Marion Area Transit 183,346 267,519
IA Regional Transit Authority/RIDES 293,825 265,642
GA Southwest Georgia RC 276,279 262,722
OK Community Action Development Corporation 274,451 260,594
KY Leslie, Knott, Letcher & Perry Community Action 238,797 255,062
AR Area Agency on Aging of Southeast Arkansas --- 245,821
OH Knox Area Transit 129,440 229,475
OH Sandusky Transit System 196,869 225,035
MN Trailblazer Joint Powers Board 153,298 222,429
IN Southern Indiana Development Commission Ride Solution --- 220,263
OH Wilmington City Cab Service 149,338 218,160
KY Bluegrass Community Action Agency 206,104 206,069
KY Pennyrile Allied Community Services, Inc. 195,883 204,360
Rural Vanpool Agencies
WA Island Transit 228,228 211,111
TX El Paso County --- 159,194
FL VPSI- Clermont 99,501 107,947
WA Clallam Transit System 106,824 105,961
WA Grays Harbor Transit 92,713 103,217
ID Mountain Rides Transportation Authority 54,345 46,073
WA Grant County Transportation Authority 44,445 44,927
MT Missoula Ravalli Transportation Management Association 37,800 37,513
WA Mason County Transportation Authority 46,768 34,917
FL Big Bend Transit 30,728 28,532
CO Town of Mountain Village 16,780 21,787
WA Columbia County Public Transportation 27,691 20,423
(a) Sum of “regular trips" and "coordinated trips."

Fact Book Methodology The procedure for estimating total data in the 2017 Public Transportation Fact Book, and prior issues of the Fact Book, is to expand available data by standard statistical methods to estimate U.S. national totals. It includes only public transportation data and excludes taxicab, unregulated jitney, school bus, sightseeing service, intercity bus, charter bus, military transportation, and services not available to the general public or segments of the general public (e.g., governmental and corporate shuttles), and special application systems (e.g., amusement parks, airports, and the following types of ferry service: international, rural, rural interstate, and urban park). The Fact Book can be indirectly traced to the Bureau of Census Report on Transportation in the United States at the Eleventh Census: 1890, Part II - Street Railway Transportation, published in Washington, DC, by the Government Printing Office in 1895. That volume listed data for individual street railways and aggregate data for the entire street railway industry. The Census was conducted again in 1902, 1907, and 1912, but a report with data for individual railways was not published during World War I. The Census of Electrical Industries: 1917, Electric Railways, published by the Government Printing Office in 1920, provided summary data only; no data for individual electric railways were included. Summary data were published by the Census every five years through 1937. The census of transit operations was not published for 1942. In response, the APTA predecessor American Transit Association (ATA) published The Transit Industry of the United States: Basic Data and Trends, 1942 Edition in March 1943. The following year the summary of transit data, titled the Transit Fact Book 1944, was published and dated for the year in which it was published, which has been continued as the Fact Book dating policy since then. All data in the Fact Book calculated by APTA and its predecessors are statistical expansions of sample data designed to represent the total activity of all public transit agencies. Base data are taken from the Federal Transit Administration's National Transit Database (NTD). These data are supplemented by sample data from other sources including APTA’s 2015 Public Transportation Vehicle Database and 2016 Infrastructure database (These are based off of surveys of APTA transit system members). Data are expanded by mode in stratified categories of similar systems based on population and other characteristics. All procedures are adapted to minimize the maximum possible error, a standard statistical procedure. Because NTD data are collected for "report years," Fact Book data are also calculated for report years. A report year is each transit agency's fiscal year that ends during a calendar year.
All data in the Fact Book are reported for "modes of service." A mode of service is not always identical with a vehicle type of the same name. For example, fixed-route bus service may in specific circumstances be provided by larger van type vehicles and variable origin and destination demand response service may in specific circumstances be provided by bus vehicles.
APTA The American Public Transportation Association (APTA) is a nonprofit international association of more than 1,500 public and private sector organizations, engaged in the areas of bus, paratransit, light rail, commuter rail, subways, waterborne services, and intercity and high-speed passenger rail. This includes: public transit systems; planning, design, construction, and finance firms; product and service providers; academic institutions; transit associations and state departments of transportation. APTA is the only association in North America that represents all modes of public transportation. APTA members serve the public interest by providing safe, efficient and economical transit services and products. More than 90 percent of the people using public transportation in the United States and Canada ride APTA member systems. This is the 68th edition of the Public Transportation Fact Book (formerly the Transit Fact Book), which was first published in 1943. Available data are expanded by standard statistical methods to estimate U.S. national totals. All data are for the U.S. only, except for the section on Canada. Data for Canada are provided by the Canadian Urban Transit Association (CUTA). A Glossary of Terms, a description of Fact Book Appendices and other APTA statistical publications, and a discussion of the methodology used to estimate Fact Book data may be found online. The 67 previous editions of the Fact Book are available on-line at http://www.apta.com/ resources/statistics/Pages/transitstats.aspx It is APTA policy to continually seek to improve the quality of data reported in the Fact Book. Data are sought from all available sources and statistical procedures used to verify that the data presented in the Fact Book are improved to be as accurate as possible.

Public Transportation Appendices Published on APTA Web Page
Appendix A: Historical Tables
Appendix A presents select data items for the entire time period they have been reported in the Fact Book and other statistical reports prepared by APTA and its predecessor organizations. Many data items are reported for every year beginning in the 1920s, and ridership is reported from 1907. http://www.apta.com/ resources/statistics/Pages/transitstats.aspx
• 2017 Fact Book Appendix A: Historical Tables
• 2017 Appendix A tables in Excel format
Appendix B: Transit Agency and Urbanized Area Operating Statistics
Appendix B presents six operating statistics for 2015 for each transit agency in urbanized areas in size order, totaled for all service modes operated by the agency and in size order for each individual mode. Data are also summed and ranked for urbanized areas, both all modes totaled and for individual modes. These lists allow a simple method to determine comparably sized transit agencies. Agencies operating in rural areas are ranked for four operating statistics for agency totals and by mode for each agency and for state-wide totals.
Data for Appendix B are taken from the Federal Transit Administration's National Transit Database (NTD) and include only agencies reporting to the NTD.
• 2017 Appendix B tables in Excel format
Appendix C: Urbanized Area Population, Land Area, and Density 1950-2010
The population, land area, and density of each urbanized area is traced from the 1950 Census, when they were first delimited, through the 2010 Census. When UZAs were created, which other UZAs they merged with or were broken off from, and all of the name changes are identified. Population growth from year to year and separate annual tables listing urbanized areas alphabetically and by size are also included.
● Appendix C tables in Excel format
Visit http://www.apta.com/resources/statistics/Pages/transitstats.aspx for the following
resources:
• APTA Association History
• Milestones in Public Transportation and High-Speed Rail
• Public Transportation Glossary
Material from the 2017 Public Transportation Fact Book may be quoted or reproduced without
obtaining the permission of the American Public Transportation Association.
Suggested Identification: American Public Transportation Association: 2017 Public Transportation Fact Book, Washington, D.C., March, 2017.

APTA Chief Executive Officers
Paul P. Skoutelas, President and CEO 2018 – Current
Richard A. White, Acting President and CEO 2016 - 2017
Michael P. Melaniphy, President and CEO 2011- 2016
William Millar, President 1996-2011
Jack R. Gilstrap, Executive Vice President 1980 - 1996
B. R. Stokes, Executive Director 1974 - 1977, Executive Vice President 1977 - 1980
APTA Lifetime Achievement Award Recipients APTA's Lifetime Achievement Award recognizes persons who have made outstanding contributions that have changed the relationship of public transportation to its local communities and American society. Each recipient has provided leadership to dramatically improve the ability of public transportation to meet the needs of all Americans.
Rosa Parks, 1997 Mortimer Downey, 2000 Norman Y. Mineta, 2006

AMERICAN PUBLIC TRANSPORTATION ASSOCIATION
1300 I STREET NW • SUITE 1200 EAST • WASHINGTON, DC 20005
Recommended