LIFE SAVING VICTORIA
DROWNING REPORT 20
17/1
8

CEO’s Report 3
Drowning Statistics 4
Our Performance 6
Snapshot: 20 Years of Play it Safe by the Water 8
Who is Drowning? 10
When, Where, What 12
Snapshot: Drowning Deaths at Public Swimming Pools 16
Risk Factors 17
Coronial Recommendations 18
Snapshot: Murray River Drowning 2007/08 To 2017/18 20
Drowning Profiles by Victorian Statistical Areas, 2007/08 to 2016/17 22
Victorian Water Safety Industry 28
References 28
Methods 29
Acknowledgements and Citation 30
CO
NTE
NTS
Life Saving Victoria Victorian Drowning Report 2017/18 / 2

CEO
’S R
EPO
RT
This year 40 people drowned in Victoria. That means that 40 families have had to experience the unbearable grief of losing someone they love, to a fate that should have been preventable.
Preventing more families from having to experience this life-long heartache is what motivates us to continue our vital drowning prevention work. Monitoring and analysis of the trends plays an important role in providing the evidence-base for the directions of our drowning prevention efforts.
Our work continues with the results for the 2017/18 financial year, which reveal a number of concerning trends, including:
A total of 107 drowning incidents in Victoria (including 40 fatal and 67 non-fatal).
The highest summer drowning toll in Victoria in 20 years, with 23 reported drowning deaths from 1 December 2017 to 28 February 2018.
A 28% increase in coastal drowning compared to the ten-year average (2007/08 to 2016/17).
Alcohol is a persistent factor in drowning statistics, with nine drowning deaths in which alcohol and/or illicit drugs were reportedly consumed by the individual prior to drowning. This represents 23% of the total number of drowning incidents in 2017/18.
35% of drowning deaths were people from CALD (Culturally and Linguistically Diverse) communities.
Males are still overrepresented in drowning statistics, being three times more likely to drown than females.
Increases were observed in the drowning rate per head of population for those aged 45-64 (35%) and 25-44 (15%).
Among these trends, there is some good news, including a 46% decrease in the fatal drowning rate in Victoria since the start of the Play it Safe by the Water (PISBTW) campaign in 1998. The campaign, in its 20th year, continues to engage the community, aquatic industry and government in drowning prevention. This year the campaign targeted supervision of children aged 0–4 years, safety of older adults, CALD communities and the increased frequency of coastal drowning.
Progress has also been made in public pool safety, with the development of the Safer Public Pools - Code of Practice, which supports public swimming pool owners and operators to provide the highest level of safety at their facilities. The code has been developed by LSV, in consultation with key stakeholders from government and the aquatic industry.
Another key achievement as the result of a coordinated industry approach to government is the recent passing of legislation to make the registration of swimming pools and spas mandatory in Victoria. This will be accompanied by a new compliance regime (including a mandatory register of pools and spas and regular pool and spa inspections) and will come into effect on 1 December 2019. This is a further positive step towards minimising the risk of young children drowning in home pools and spas.
I invite you to review this report as a summary of the current issues and as a focus point for conversations in working to address new and continuing risks. Please peruse this report knowing that every drowning death is one too many.
Dr Nigel Taylor ESM CEO
TOTAL DROWNING INCIDENTS (FATAL AND NON-FATAL).107
Life Saving Victoria Victorian Drowning Report 2017/18 / 3
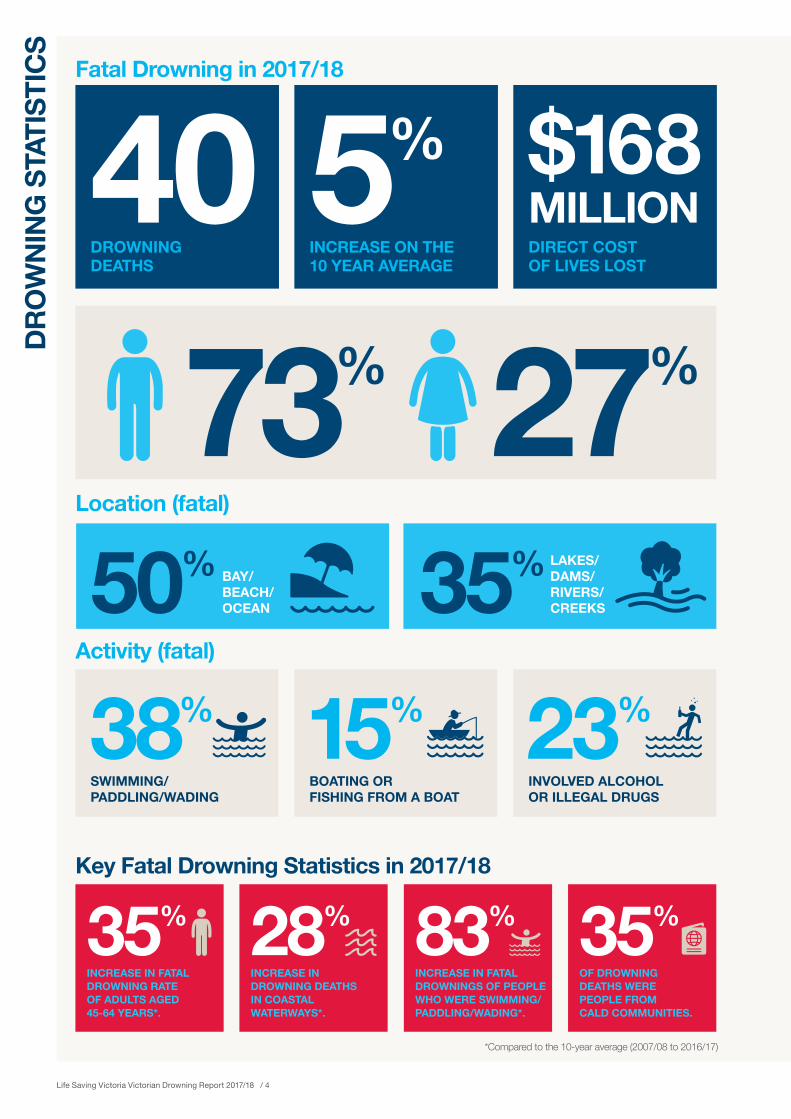
Fatal Drowning in 2017/18
Activity (fatal)
Key Fatal Drowning Statistics in 2017/18
Location (fatal)
40DROWNING DEATHS
73% 27%
5%INCREASE ON THE 10 YEAR AVERAGE
$168 MILLIONDIRECT COST OF LIVES LOST
INCREASE IN FATAL DROWNING RATE OF ADULTS AGED 45-64 YEARS*.
INCREASE IN DROWNING DEATHS IN COASTAL WATERWAYS*.
INCREASE IN FATAL DROWNINGS OF PEOPLE WHO WERE SWIMMING/PADDLING/WADING*.
OF DROWNING DEATHS WERE PEOPLE FROM CALD COMMUNITIES.
SWIMMING/PADDLING/WADING
BOATING OR FISHING FROM A BOAT
INVOLVED ALCOHOL OR ILLEGAL DRUGS
DRO
WN
ING
STA
TIST
ICS
LAKES/ DAMS/ RIVERS/ CREEKS35%
38% 15% 23%
35% 28% 83% 35%
BAY/ BEACH/OCEAN50%
*Compared to the 10-year average (2007/08 to 2016/17)
Life Saving Victoria Victorian Drowning Report 2017/18 / 4

Non-fatal Drowning in 2017/18
Activity (non-fatal)
Key Fatal Drowning Statistics Over the Past Decade
Location (non-fatal)
67NON-FATAL DROWNING INCIDENTS ATTENDED BY PARAMEDICS
66% 34%
1.05CRUDE NON-FATAL DROWNING RATE PER 100,000 PERSONS IN VICTORIA IN 2017/18
SWIMMING/PADDLING/WADING BATHING
OF DROWNING DEATHS IN PUBLIC POOLS WERE MALE.
OF PEOPLE THAT DROWNED IN BOATING INCIDENTS WERE NOT WEARING A LIFEJACKET, WORE AN INCORRECTLY FITTED LIFEJACKET OR ONE THAT WAS INCORRECT FOR THE CONDITIONS.
84%88%
BAY/ BEACH/OCEAN39% POOLS
(15% RESIDENTIAL POOLS; 13% PUBLIC POOLS)28%
54% 10%
Life Saving Victoria Victorian Drowning Report 2017/18 / 5

PROGRESSThe following table outlines Victoria’s progress against the Victorian Water Safety Strategy 2016-2020 and Australian Water Safety Strategy 2016-2020 with respect to fatal drowning incidents. Whilst the overall drowning rate has decreased by 17% from baseline, this is well short of the target of a 50% reduction in drowning by 2020.
KEY LIFE STAGES
BASELINE 3 YEAR AVERAGE (2004/05-2006/07)
FOLLOW-UP 3 YEAR AVERAGE (2015/16-2017/18)
PROGRESS
Reduce drowning in children aged 0-4 years 3 3 High
concernReduce drowning in children aged 5-14 years 4 1 On track
Reduce drowning in young people aged 15-24 years 5 4 Some
concernReduce drowning in people aged 65+ 8 10 High
concern
Reduce DrowningReduce the Victorian drowning rate
Services Expand to meet public need/ sustainability/ membership development, growth and support
40 Drowning deaths in Victoria in 2017/18. This is two more than the 10-year average 2007/08 to 2016/17.
659 Rescues by lifesavers and lifeguards on patrolled beaches on average per year from 2007/08 to 2016/17.
0.63 Crude fatal drowning rate per 100,000 persons in Victoria in 2017/18; a 6% decrease compared to the 10-year average (2007/08 to 2016/17).
25.59 Rescues per 100,000 beachgoers on average per year from 2007/08 to 2016/17.
67Non-fatal drowning incidents attended by paramedics in Victoria in 2017/18. A crude non-fatal drowning rate of 1.05 per 100,000 persons in Victoria in 2017/18.
1,806First aid assistance by lifesavers and lifeguards on patrolled beaches on average per year from 2007/08 to 2016/17.
46% Decrease in the fatal drowning rate in Victoria since the start of the Play it Safe by the Water (PISBTW) campaign in 1998 (baseline is the three-year average 1996/7 to 1998/9 compared to the follow-up 2015/16 to 2017/18 average).
34,111Volunteer members, patrolling our beaches and providing education and training in lifesaving activities, to ensure the safety of Victoria’s waterway users.
$168M Direct cost to society of lives lost (where the value of a statistical life is estimated at $4.2 million; Office of Best Practice Regulation, 2014).
$235M Total value of coastal services in Victoria estimated at per year (PWC, 2011).
Every day, visitors to Victoria’s 811 kilometres of ocean beaches, 259 kilometres of bay beaches, 85,000 kilometres of rivers, 13,000 natural wetlands and 450 public and commercial swimming pools, engage in a wide variety of recreational aquatic activities (Short, 1996; DSE, 2011; VAIC, 2001). Our prevention efforts span this setting.
OU
R PE
RFO
RMAN
CE
Life Saving Victoria Victorian Drowning Report 2017/18 / 6
HIGH RISK LOCATIONS
BASELINE 3 YEAR AVERAGE (2004/05-2006/07)
FOLLOW-UP 3 YEAR AVERAGE (2015/16-2017/18)
PROGRESS
Reduce drowning in inland waterways 16 15 Some
concernReduce drowning in coastal waters 14 19 High
concern
Reduce drowning by strengthening the aquatic industry*
0 0 On track
KEY DROWNING CHALLENGES
BASELINE 3 YEAR AVERAGE (2004/05-2006/07)
FOLLOW-UP 3 YEAR AVERAGE (2015/16-2017/18)
PROGRESS
Reduce alcohol and drug related drowning 11 11 Some
concern
Reduce boating, watercraft and recreational activity related drowning**
9 12 High concern
Reduce drowning in high-risk populations*** 7 9 High
concern
* Includes drowning deaths at public swimming pools.**Includes boats and watercraft, rock fishing, other fishing and diving.
*** Includes Aboriginal and Torres Strait Islanders, people from culturally and linguistically diverse (CALD) backgrounds, international tourists and international students.
Reduce DrowningReduce the Victorian drowning rate
Services Expand to meet public need/ sustainability/ membership development, growth and support
40 Drowning deaths in Victoria in 2017/18. This is two more than the 10-year average 2007/08 to 2016/17.
659 Rescues by lifesavers and lifeguards on patrolled beaches on average per year from 2007/08 to 2016/17.
0.63 Crude fatal drowning rate per 100,000 persons in Victoria in 2017/18; a 6% decrease compared to the 10-year average (2007/08 to 2016/17).
25.59 Rescues per 100,000 beachgoers on average per year from 2007/08 to 2016/17.
67Non-fatal drowning incidents attended by paramedics in Victoria in 2017/18. A crude non-fatal drowning rate of 1.05 per 100,000 persons in Victoria in 2017/18.
1,806First aid assistance by lifesavers and lifeguards on patrolled beaches on average per year from 2007/08 to 2016/17.
46% Decrease in the fatal drowning rate in Victoria since the start of the Play it Safe by the Water (PISBTW) campaign in 1998 (baseline is the three-year average 1996/7 to 1998/9 compared to the follow-up 2015/16 to 2017/18 average).
34,111Volunteer members, patrolling our beaches and providing education and training in lifesaving activities, to ensure the safety of Victoria’s waterway users.
$168M Direct cost to society of lives lost (where the value of a statistical life is estimated at $4.2 million; Office of Best Practice Regulation, 2014).
$235M Total value of coastal services in Victoria estimated at per year (PWC, 2011).
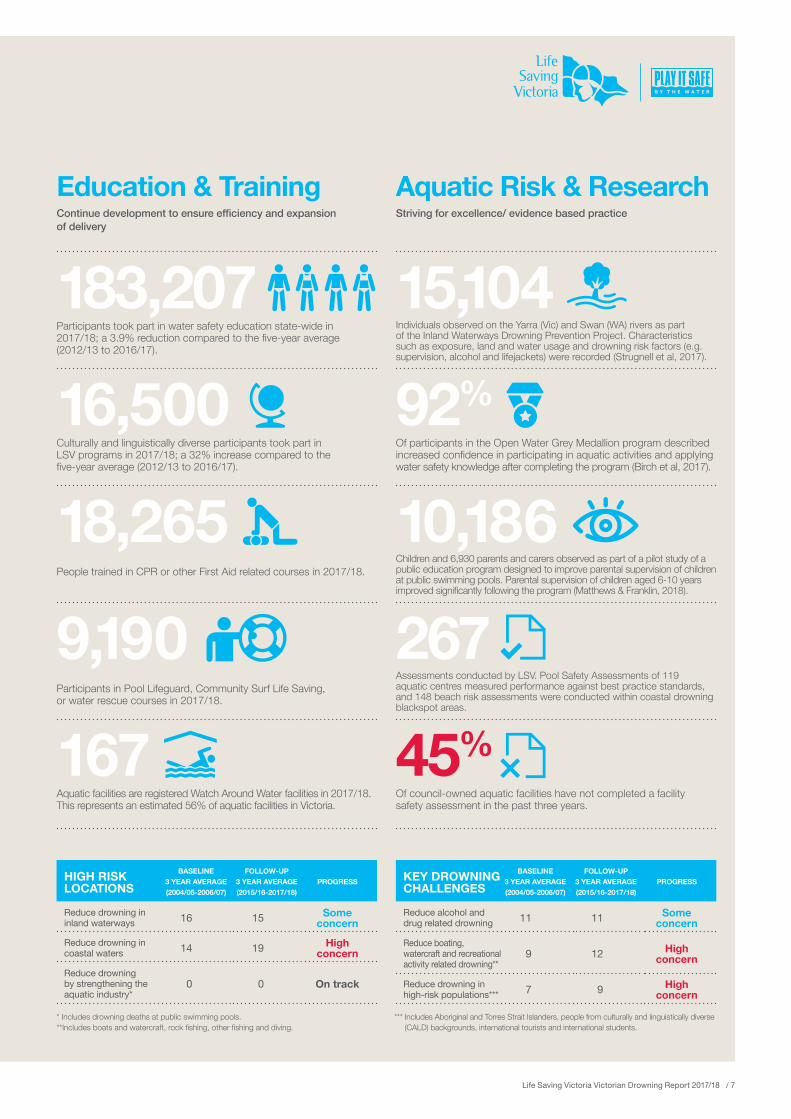
Education & TrainingContinue development to ensure efficiency and expansion of delivery
Aquatic Risk & Research Striving for excellence/ evidence based practice
183,207 Participants took part in water safety education state-wide in 2017/18; a 3.9% reduction compared to the five-year average (2012/13 to 2016/17).
15,104Individuals observed on the Yarra (Vic) and Swan (WA) rivers as part of the Inland Waterways Drowning Prevention Project. Characteristics such as exposure, land and water usage and drowning risk factors (e.g. supervision, alcohol and lifejackets) were recorded (Strugnell et al, 2017).
16,500Culturally and linguistically diverse participants took part in LSV programs in 2017/18; a 32% increase compared to the five-year average (2012/13 to 2016/17).
92% Of participants in the Open Water Grey Medallion program described increased confidence in participating in aquatic activities and applying water safety knowledge after completing the program (Birch et al, 2017).
18,265People trained in CPR or other First Aid related courses in 2017/18.
10,186 Children and 6,930 parents and carers observed as part of a pilot study of a public education program designed to improve parental supervision of children at public swimming pools. Parental supervision of children aged 6-10 years improved significantly following the program (Matthews & Franklin, 2018).
9,190Participants in Pool Lifeguard, Community Surf Life Saving, or water rescue courses in 2017/18.
267 Assessments conducted by LSV. Pool Safety Assessments of 119 aquatic centres measured performance against best practice standards, and 148 beach risk assessments were conducted within coastal drowning blackspot areas.
167Aquatic facilities are registered Watch Around Water facilities in 2017/18. This represents an estimated 56% of aquatic facilities in Victoria.
45% Of council-owned aquatic facilities have not completed a facility safety assessment in the past three years.
Life Saving Victoria Victorian Drowning Report 2017/18 / 7

SNAP
SHO
T
1.60
1.40
1.20
1.00
0.80
0.60
0.40
0.20
0.00
70
60
50
40
30
20
10
0
1997
/98
1998
/99
199/
00
2000
/01
2001
/02
2002
/03
2003
/04
2004
/05
2005
/06
2006
/07
2007
/08
2008
/09
2009
/10
2010
/11
2011
/12
2012
/13
2013
/14
2014
/15
2015
/16
2016
/17
2017
/18
64
4955 53
42
48 51 48
4135 35 34
3732
37 3745
3743 45
40
Number of deaths/ yearNumber of deaths/ 100,000 population
DROWNING DEATHS AND DROWNING RATE SINCE PISBTW CAMPAIGN START IN 1998
20YEARS OF PLAY IT SAFE BY THE WATER.
Life Saving Victoria Victorian Drowning Report 2017/18 / 8
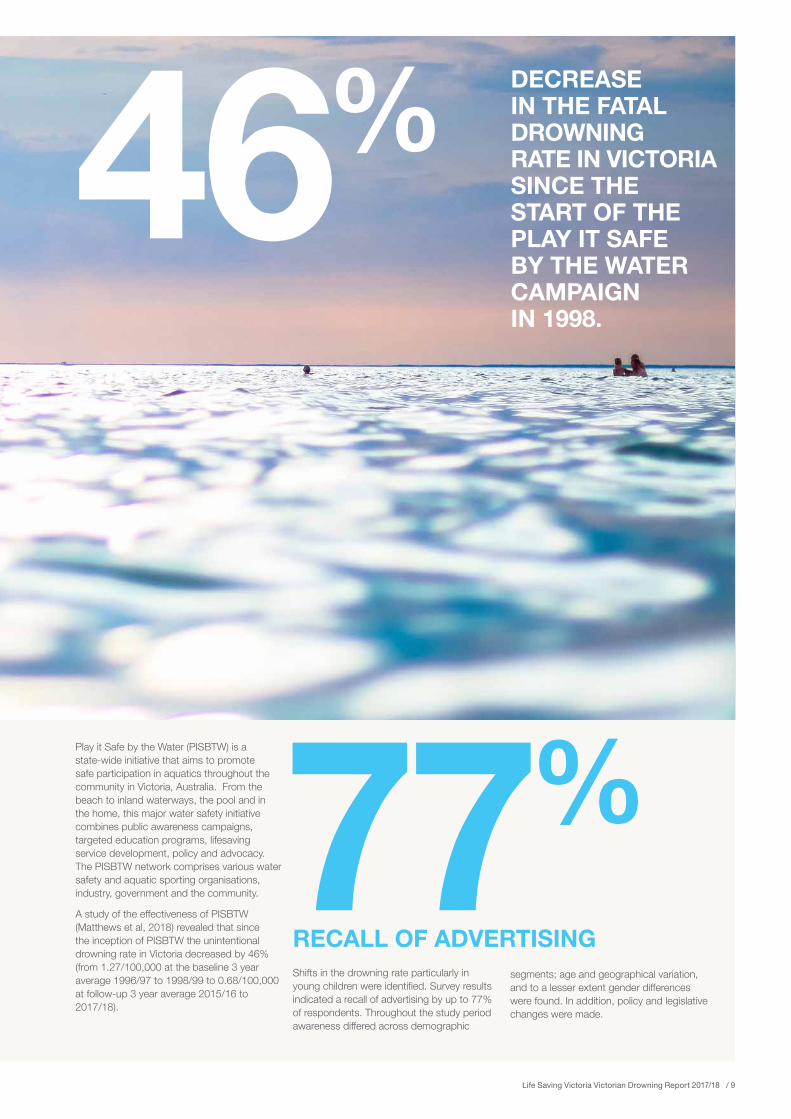
46% DECREASE IN THE FATAL DROWNING RATE IN VICTORIA SINCE THE START OF THE PLAY IT SAFE BY THE WATER CAMPAIGN IN 1998.
Play it Safe by the Water (PISBTW) is a state-wide initiative that aims to promote safe participation in aquatics throughout the community in Victoria, Australia. From the beach to inland waterways, the pool and in the home, this major water safety initiative combines public awareness campaigns, targeted education programs, lifesaving service development, policy and advocacy. The PISBTW network comprises various water safety and aquatic sporting organisations, industry, government and the community.
A study of the effectiveness of PISBTW (Matthews et al, 2018) revealed that since the inception of PISBTW the unintentional drowning rate in Victoria decreased by 46% (from 1.27/100,000 at the baseline 3 year average 1996/97 to 1998/99 to 0.68/100,000 at follow-up 3 year average 2015/16 to 2017/18).
Shifts in the drowning rate particularly in young children were identified. Survey results indicated a recall of advertising by up to 77% of respondents. Throughout the study period awareness differed across demographic
segments; age and geographical variation, and to a lesser extent gender differences were found. In addition, policy and legislative changes were made.
77%RECALL OF ADVERTISING
Life Saving Victoria Victorian Drowning Report 2017/18 / 9

WH
O IS
DRO
WN
ING
?
There were a total of 107 drowning incidents in Victoria in 2017/18, comprising 40 drowning deaths and 67 non-fatal incidents attended by paramedics. Children aged 0-4 years have the greatest overall risk of drowning with the highest age-specific combined rate of fatal and non-fatal drowning. However, people aged 45-64 had the highest age-specific fatal drowning rate in 2017/18.
DEATHSThe 40 drowning deaths in 2017/18 represents a 4.7% increase (two deaths) compared to the 10-year average from 2007/08 to 2016/17. The crude fatal drowning rate was 0.63 per 100,000 persons in 2017/18, which is a 6% decrease compared to the 10-year average (0.66 per 100,000 persons from 2007/08 to 2016/17).
Of the 40 drowning deaths in Victoria in 2017/18, 29 (73%) were male. Males are consistently overrepresented in drowning statistics. Overall, they are three times more likely to drown than females.
Fourteen adults aged 45-64 years died as a result of drowning in 2017/18, with a drowning rate of 0.92 per 100,000 population. This is a 35% increase compared with the 10-year average (2007/08 to 2016/17). There was also a 15% increase in the drowning rate of adults aged 25-44 years. There was a decrease in the fatal drowning rate of children aged 0-4 years, 5-14 years and older adults aged 65+ years.
NON-FATAL INCIDENTSThere were 67 non-fatal drowning incidents attended by paramedics in 2017/18. This represents a crude non-fatal drowning rate of 1.05 per 100,000 persons in 2017/18.
Admissions, 2007/08 to 2016/17
Over the previous decade there were 926 hospital admissions, an average of 93 hospital admissions for non-fatal drowning per year. The annual crude hospital admissions rate was 1.61 per 100,000 persons per year (2007/08 to 2016/17). The rate of admissions remained largely similar over the 10-year period from 2007/08 to 2016/17.
A total of 666 males were admitted to hospital for non-fatal drowning, an average of 67 (72%) hospital admissions per year. Overall, the rates of admission decreased with increasing age.
Children aged 0-4 years had the highest rates of admission, with 5.94 per 100,000 population annually followed by those aged 15-24 years (1.93 per 100,000 population) and those in the 5-14 years age group (1.67 per 100,000 population). Those aged 65 years and above presented the lowest rate of admission at 0.96 per 100,000 population.
Emergency Department (ED) Presentations, 2007/08 to 2016/17
There were 811 ED presentations in the 10-year period from 2007/08 to 2016/17, an average of 81 ED presentations for non-fatal drowning annually. The average annual rate of ED presentations was 1.40 per 100,000 persons per year. Children aged 0-4 years had by far the highest rate of ED presentations, with 9.63 per 100,000 population annually. This was followed by those aged 5-14 years (1.83 per 100,000 population) and those in the 15-24 years age group (1.21 per 100,000 population).
The majority of the 811 ED presentations were males (528, 65%). Similar to hospital
admissions, ED presentations decreased with increasing age.
INCREASE IN THE DROWNING RATE OF ADULTS AGED 45-64 YEARS.35% FATAL DROWNING RATE PER 100,000 PERSONS IN VICTORIA BY AGE 2007/08 to 2017/18
1.00
0.75
0.50
0.25
0.00
0-4
5-14
15-2
4
25-4
4
45-6
4
65+
2017/182007/08-2016/17
FREQUENCY OF FATAL DROWNING IN VICTORIA BY SEX, 2007/08 TO 2017/18
50
40
30
20
10
0
2007
/08
2008
/09
2009
/10
2010
/11
2011
/12
2012
/13
2013
/14
2014
/15
2015
/16
2016
/17
2017
/18
MalesFemales
HOSPITAL ADMISSIONS AND EMERGENCY DEPARTMENT (ED) PRESENTATIONS RATE PER 100,000 PERSONS IN VICTORIA, 2007/08 TO 2016/17
2.1
1.8
1.5
1.2
0.9
0.6
0.3
0.0
2007
/08
2008
/09
2009
/10
2010
/11
2011
/12
2012
/13
2013
/14
2014
/15
2015
/16
2016
/17
Hospital admissionsED presentations
Life Saving Victoria Victorian Drowning Report 2017/18 / 10

CULTURAL AND LINGUISTIC DIVERSITYThis year 14 (35%) individuals that drowned were reported as being from culturally and linguistically diverse (CALD) communities. This is a 73% increase when compared to the 10-year average (8 per year from 2007/08 to 2016/17).
Of those individuals where country of birth was recorded 27 drowning victims (20%) also had the number of years they had been living in Australia reported. Of those 27 individuals the median length of time living in Australia was six years.
In the past decade 21% of drowning deaths were of individuals known to have been from CALD communities. Of those, the majority were males (84%), and aged 25-44 years (46%) followed by 15-24 years (25%). Incidents typically occurred in open waterways; with 44% at beaches and 20% in rivers/creeks/streams. The most common activity prior to the drowning incident was swimming/wading (45%), including attempting a rescue of a family member or friend. The other common activity was fishing (18%), which included rock fishing, fishing from a boat or diving for abalone. Another common activity was walking/recreating near water (14%).
A recent study of overseas born drowning deaths in Australia (Pidgeon, Barnsley & Mahony, 2018), found that in the 10-year period from 2005/06 to 2014/15, 762 people drowned in Australia who were born in another country. This represented 27% of total drowning deaths during this period and a crude rate of 1.15 per 100,000 overseas born population.
Individuals from a CALD background are recognised as those who identify as ‘having a specific cultural or linguistic affiliation by virtue of their place of birth, ancestry, ethnic origin, religion, preferred language, language(s) spoken at home, or because of their parents’ identification on a similar basis’ (Department of Human Services Multicultural Strategy Unit, 2002).
* Country of birth was known in 36% of fatal drowning cases.
Key findings of the national report included:
86% of people who drowned were living in Australia at the time of death.
81% of cases were male, though more females drowned from the age of 45 years.
Where circumstances of residency were known, 29% had been residents for ten years or more, 23% were overseas tourists and 19% had been residents for five years or less.
The populations found to be at highest risk of drowning (crude drowning rate per 100,000 population in Australia) were from Taiwan, South Korea and Ireland.
Drowning deaths most commonly occurred in New South Wales (37%), followed by Queensland (28%) and Western Australia (18%). They most frequently occurred within a major city (46%).
Key risk factors included having a pre-existing medical condition (38%), alcohol (25%), and drugs (medical and illegal substances – 25%) and being a weak or non-swimmer.
40%
30%
20%
10%
0%
2007
/08
2008
/09
2009
/10
2010
/11
2011
/12
2012
/13
2013
/14
2014
/15
2015
/16
2016
/17
2017
/18
PERCENTAGE OF FATAL DROWNING BY OVERSEAS COUNTRY OF BIRTH* 2007/08 – 2017/18
35%OF DROWNING DEATHS IN 2017/18 WERE OF PEOPLE FROM CALD COMMUNITIES.
Life Saving Victoria Victorian Drowning Report 2017/18 / 11
WH
EN, W
HER
E, W
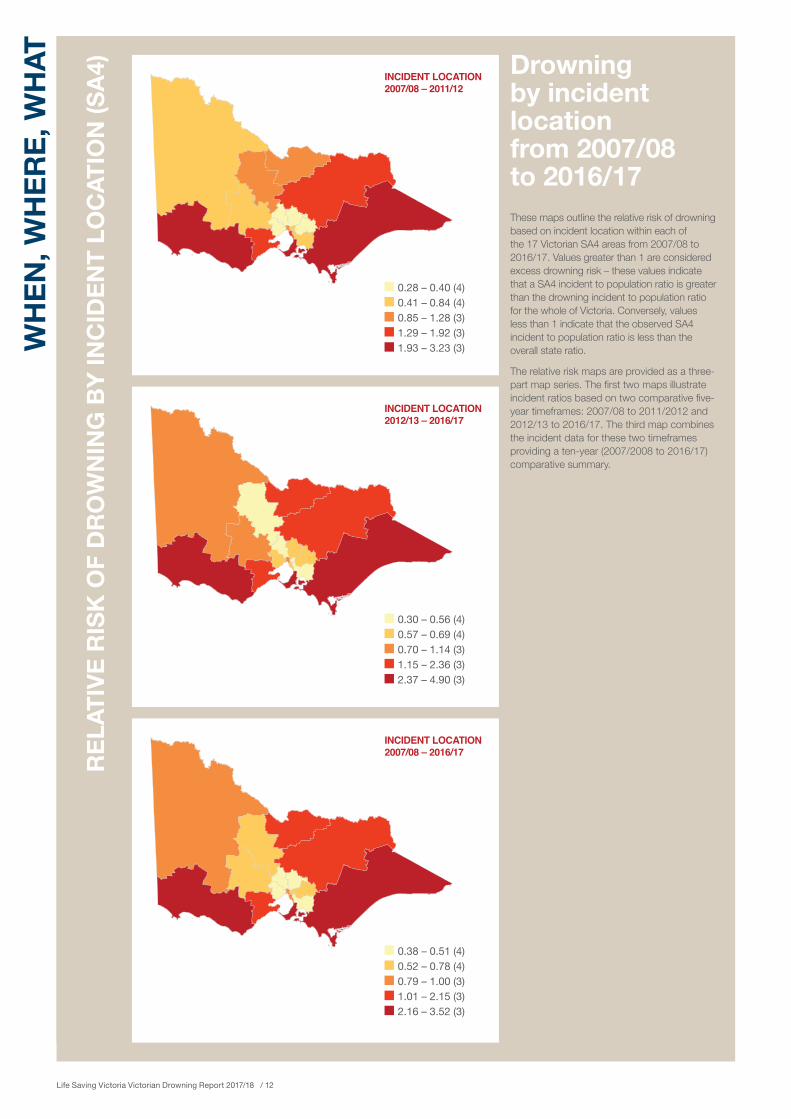
HAT Drowning
by incident location from 2007/08 to 2016/17These maps outline the relative risk of drowning based on incident location within each of the 17 Victorian SA4 areas from 2007/08 to 2016/17. Values greater than 1 are considered excess drowning risk – these values indicate that a SA4 incident to population ratio is greater than the drowning incident to population ratio for the whole of Victoria. Conversely, values less than 1 indicate that the observed SA4 incident to population ratio is less than the overall state ratio.
The relative risk maps are provided as a three-part map series. The first two maps illustrate incident ratios based on two comparative five-year timeframes: 2007/08 to 2011/2012 and 2012/13 to 2016/17. The third map combines the incident data for these two timeframes providing a ten-year (2007/2008 to 2016/17) comparative summary.
REL
ATIV
E R
ISK
OF
DR
OW
NIN
G B
Y IN
CID
ENT
LOC
ATIO
N (S
A4)
0.28 – 0.40 (4)0.41 – 0.84 (4)0.85 – 1.28 (3)1.29 – 1.92 (3)1.93 – 3.23 (3)
INCIDENT LOCATION2007/08 – 2011/12
0.30 – 0.56 (4)0.57 – 0.69 (4)0.70 – 1.14 (3)1.15 – 2.36 (3)2.37 – 4.90 (3)
INCIDENT LOCATION2012/13 – 2016/17
INCIDENT LOCATION2007/08 – 2016/17
0.38 – 0.51 (4)0.52 – 0.78 (4)0.79 – 1.00 (3)1.01 – 2.15 (3)2.16 – 3.52 (3)
Life Saving Victoria Victorian Drowning Report 2017/18 / 12

Drowning by place of residence from 2007/08 to 2016/17These relative risk maps are similar to the incident location maps except they are based on the person’s place of residence. They outline the relative risk of drowning within each of the 17 Victorian SA4 areas from 2007/08 to 2016/17 based on residence. Values greater than 1 are considered excess risk – these values indicate that a SA4 resident location to population ratio is greater than the drowning resident to population ratio for the whole of Victoria. Conversely, values less than 1 indicate that the observed SA4 resident to population ratio is less than the overall state ratio.
The relative risk maps are provided as a three-part map series. The first two maps illustrate resident ratios based on two comparative five-year timeframes: 2007/08 to 2011/2012 and 2012/13 to 2016/17. The third map combines the resident data for these two timeframes providing a ten-year (2007/2008 to 2016/17) comparative summary.
REL
ATIV
E R
ISK
OF
DR
OW
NIN
G B
Y PL
ACE
OF
RES
IDEN
CE
(SA4
)RESIDENT LOCATION2007/08 – 2011/12
0.42 – 0.57 (4)0.58 – 0.96 (4)0.97 – 1.22 (3)1.23 – 1.34 (3)1.35 – 1.58 (3)
RESIDENT LOCATION2012/13 – 2016/17
0.19 – 0.55 (4)0.56 – 0.87 (4)0.88 – 1.13 (3)1.14 – 1.68 (3)1.69 – 3.27 (3)
RESIDENT LOCATION2007/08 – 2016/17
0.30 – 0.69 (4)0.70 – 0.86 (4)0.87 – 1.00 (3)1.01 – 1.51 (3)1.52 – 2.43 (3)
Life Saving Victoria Victorian Drowning Report 2017/18 / 13

WH
EN, W
HER
E, W
HAT WHEN DID THEY DROWN?
Month and Season
Over half (58%, 23) of drowning deaths occurred in the summer months in 2017/18. This is a 64% increase compared to the five-year average (2012/13 to 2016/17) and is the highest crude number recorded in over twenty years, since 1997/98. Spring represented the second largest number of drowning deaths, with 22% (8). Aside from summer, there was a decrease in drowning deaths in all seasons.
In the previous decade (2007/08 to 2016/17) the majority of drowning deaths occurred in summer (34%), followed by spring (24%), autumn (22%), and winter (20%). There were significant increases in drowning deaths in January and December in 2017/18 when compared with the ten-year average from 2007/08 to 2016/17. In fact, one-third (33%, 13) of drowning deaths occurred in January.
Similar to fatal drowning, non-fatal drowning incidents were far more common in summer (64%, 43). This was followed by spring and autumn (13%, 9), and winter (9%, 6).
WHERE DID THEY DROWN?
Region
In the last financial year, 53% (21) of drowning incidents occurred in major cities in Victoria, this is a 10.5% increase when compared with the ten-year average from 2007/08 to 2016/17.
When accounting for the differences in the distribution of the population, the drowning rate decreased for those residing in both metropolitan Melbourne and regional areas in Victoria. There was a 37% decrease in the drowning rate of those residing in regional areas of Victoria this year (0.57 per 100,000 population in 2017/18) compared with the ten-year average (0.90 per 100,000 population from 2007/08 to 2016/17). Unlike in 2016/17, where those residing in regional areas were almost twice as likely to drown compared to those in metropolitan Melbourne, in 2017/18 the fatal drowning rates were very similar (0.53 per 100,000 population in metropolitan Melbourne).
Waterways
In 2017/18 half of all drowning deaths occurred in bay/beach/ocean environments (50%, 20). This represents a 28% increase in drowning deaths in coastal waterways compared with the average over the previous decade (16 from 2007/08 to 2016/17). The 15 drowning deaths occurring in inland waterways (rivers/creeks/streams and lakes/dams) is a 10% increase on the 10-year average from 2007/08 to 2016/17.
Over one-third of non-fatal drowning incidents in 2017/18 occurred in bay/beach/ocean environments, (39%, 26). Three other common waterways for non-fatal incidents were private/home pools (15%), public swimming pools (13%) and rivers/creeks/streams (13%).
28% INCREASE IN DROWNING DEATHS IN COASTAL WATERWAYS.
PERCENTAGE OF FATAL DROWNING BY REMOTENESS AREA OF INCIDENT IN VICTORIA, 2007/08 – 2017/18
FREQUENCY OF FATAL DROWNING PER YEAR BY BODY OF WATER 2007/08 – 2017/18
60
50
40
30
20
10
0
Maj
orC
ities
of
Aust
ralia
Inne
rRe
gion
alAu
stra
lia
Out
erRe
gion
alAu
stra
lia
Rem
ote
2007/08-2011/12 2012/13-2016/17 2017/18 2017/182007/08-2016/17
50%
40%
30%
20%
10%
0%
Bath
/Sp
a Ba
th
Priv
ate/
Hom
e Po
ol
Publ
icSw
imm
ing
Pool
Bay/
Beac
h/O
cean
Rive
r/Cre
ek/
Stre
am
Lake
/Dam
Oth
er
PERCENTAGE OF FATAL DROWNING BY MONTH 2007/08 – 2017/18
40%
30%
20%
10%
0%
July
Augu
st
Sept
embe
r
Oct
ober
Nov
embe
r
Dece
mbe
r
Janu
ary
Febr
uary
Mar
ch
April
May
June
2017/182007/08-2016/17
Life Saving Victoria Victorian Drowning Report 2017/18 / 14

WHAT WERE THEY DOING?
Activity
The most common activity immediately prior to a fatal drowning in 2017/18 was swimming/paddling/wading (38%, 15), followed by boating/fishing from a boat (15%, 6).
There was an 83% increase in those that fatally drowned whilst swimming/paddling/wading in 2017/18 compared to the 10-year average from 2007/08 to 2016/17 (8, 21%). Similar to fatal drowning, the greatest proportion of non-fatal drowning incidents involved those swimming/paddling/wading (54%, 36). These figures again highlight the importance of the Victorian government initiative making swimming and water safety mandatory in the primary school curriculum.
Unintentional water entry (slips/trips/falls) accounted for 23% (9) of fatal drowning incidents last year. This is a 29% decrease compared to the past decade with an average of 13 (33%) per year from 2007/08 to 2016/17.
FREQUENCY OF FATAL DROWNING PER YEAR BY ACTIVITY 2007/08 – 2017/18
16
12
8
4
0
Boat
ing/
Fish
ing
from
a bo
at
Rock
Fis
hing
Oth
er F
ishi
ng
Divi
ng/
Skin
Div
ing
Cra
ft Ri
ding
Wal
king
/Pl
ayin
gN
ear W
ater
Atte
mpt
ing
a Re
scue
Swim
min
g,Pa
ddlin
gor
Wad
ing
Bath
ing/
Hav
ing
aSp
a Ba
th
Tran
spor
t(fo
r wor
k/fo
r rec
reat
ion)
Oth
er/
Unk
now
n
2007/08-2011/12 2012/13-2016/17 2017/18
83% INCREASE IN THOSE SWIMMING OR WADING IN WATER PRIOR TO THE DROWNING INCIDENT.
Life Saving Victoria Victorian Drowning Report 2017/18 / 15

SNAP
SHO
T
DROWNING DEATHS AT PUBLIC SWIMMING POOLS There were 20 drowning deaths at public swimming pools in Victoria in the past 20 years or an average of 1 death per year. Drowning deaths in public swimming pools represented 2% of the total unintentional drowning deaths in Victoria over the last 20 years. In addition, there were on average 19 non-fatal drowning incidents in public swimming pools attended by paramedics in the five-year period from 2013/14 to 2016/17.
Of the 20 drowning deaths in public swimming pools, 75% (15) occurred at a council-owned aquatic and leisure facility, the other 25% (5) occurred at non-council owned pools (typically privately-owned health and fitness centres, or hotels/resorts).
The majority (85%, 17) of the deceased were male and the median age was 29 years. Just over a third of cases occurred in the two-year period from 1998-1999 (35%, 7) and 2014-2015 (35%, 7).
Key factors that contributed to drowning deaths at public swimming pools were a lack of supervision and pre-existing medical conditions.
A recent report (Mahony et al, 2018) highlighted that between 2005/06 and 2014/15, there were 36 fatal and 257 non-fatal drowning incidents in public and commercial swimming pools in Australia. Victoria had the third-highest number of drowning deaths (7, 19%), after Queensland (11, 31%) and New South Wales (9, 25%). Nationally, males accounted for 81% of deaths and 58% of non-fatal incidents. People born overseas accounted for 28% of deaths. The leading age group for drowning was children aged 5-9 years (19%), followed by adults aged 45-54 years (17%). The absence of parental or carer supervision was noted in 78% of fatalities for children aged 0-14 years.
The majority (94%) of those who drowned were not visitors to the location where the incident took place. National risk factors for drowning included pre-existing medical conditions (61%), alcohol consumption (8%) and drug use (39%), namely prescription medication.
FREQUENCY OF FATAL DROWNING IN PUBLIC SWIMMING POOLS, 1998 TO 2017
4
3
2
1
0
1998
1999
2000
2001
2002
2003
2004
2005
2006
2007
2008
2009
2010
2011
2012
2013
2014
2015
2016
2017
Non council ownedCouncil owned
85% OF THE DROWNING DEATHS IN PUBLIC SWIMMING POOLS OVER THE LAST 20 YEARS WERE MALE WITH A MEDIAN AGE OF 29 YEARS.
Life Saving Victoria Victorian Drowning Report 2017/18 / 16

LIFEJACKET WEAR WHEN BOATING 2007/08 – 2016/17
Not worn correctly/inappropriate type for the conditionsWorn correctly
30 (70%)
6 (14%)
7 (16%)
Not worn
OF LIVES LOST IN 2017/18 INVOLVED ALCOHOL OR ILLEGAL DRUG USE PRIOR TO DROWNING.
RISK
FAC
TORS
OF PEOPLE THAT DROWNED IN BOATING INCIDENTS WERE NOT WEARING A LIFEJACKET, WORE AN INCORRECTLY FITTED LIFEJACKET OR ONE THAT WAS INCORRECT FOR THE CONDITIONS.
84%
23%
LACK OF LIFEJACKET USEThe lack of a lifejacket has potentially claimed many lives in Victoria. Of the 52 boating related drowning deaths over the past decade (2007/08 to 2016/17), lifejacket usage was known in 43 cases. Of these 43, in 30 (70%) incidents the deceased was not wearing a lifejacket at the time. A further 6 (14%) had an incorrectly fitted lifejacket or wore the incorrect type recommended for the conditions.
Wearing a lifejacket when rock fishing could also have saved another 6 lives over the past decade (2007/08 to 2016/17) with all those individuals that drowned while rock fishing not wearing a lifejacket.
ALCOHOL AND DRUGSThere were 9 drowning deaths in 2017/18 in which alcohol and/or illegal drugs were reportedly consumed by the individual prior to drowning, representing 23% of the total number of drowning incidents. This compares to 11 drowning deaths on average per year over the past decade (2007/08 to 2016/17), representing 27% of the total drowning deaths.
The consumption of alcohol and/or illegal drugs prior to recreating in, on or around water increases the risk of drowning because they can impair judgement, reduce coordination, slow reaction times, heighten the chance of hypothermia and promote risk taking behaviour. Prescription medications can also increase the risk of drowning as they can increase the risk of falls.
Life Saving Victoria Victorian Drowning Report 2017/18 / 17

The role of the coroner in Victoria is to investigate reportable deaths, which include drowning, in order to determine the identity of the person who died, the cause of the death and, in some situations, the circumstances surrounding the death. As part of this process the coroner may recommend ways to help prevent similar deaths in the future.
There were four coronial findings in 2017/18 where recommendations/ comments were made relating to drowning deaths. The following is a summary of the incidents and the recommendations/ comments made by the coroner as contained in the coronial findings. Note, they are not exact replications from the findings; these should be accessed from the Coroners Court of Victoria website:
http://www.coronerscourt.vic.gov.au/home/coroners+written+findings/
CO
RON
IAL
REC
OM
MEN
DAT
ION
S
Life Saving Victoria Victorian Drowning Report 2017/18 / 18
2014Ze Cheng (Tony) Guan, aged 54 years, died as a result of drowning at a public swimming pool in Ascot Vale, he had motor neurone disease. Mr Guan was seen floating face-down in the hydrotherapy (warm water) pool. Emergency treatment was performed by lifeguards until emergency services arrived. He was then taken by ambulance to hospital. A test for brain function yielded a negative result and he was removed from life support.
Recommendations
1. That ... the YMCA review its training and procedures to ensure that the duties of life savers are clear when conducting supervisory and non-supervisory tasks.
2. That the YMCA review its Pool Operations Manual (if that manual in some form is still being used) to clarify the role and duties of lifeguards.
3. That the YMCA review its training and procedures and continue to engage with Life Saving Victoria current guidelines and recommendations to ensure both that staff are trained sufficiently in the need to identify and adequately supervise pool patrons in need of closer supervision, and that staff are in practice doing this.
4. That the YMCA review its procedures to ensure that safety equipment for lifeguards, and in particular bum bags, is ready and available to life savers before a shift is commenced.
2016James Lin was 27 years old when he died from drowning at Gunnamatta Beach on the Mornington Peninsula. Mr Lin lived in Box Hill and travelled to Gunnamatta Beach with friends for a swim. They parked at the First Carpark, approximately 200 metres from the Gunnamatta Surf Life Saving Club and the patrolled part of the beach. They were swimming approximately 300 metres away from the Club and patrolled part of the beach. They were dragged down the beach and off a sandbar. Mr Lin, described as the weakest swimmer of the three was unable to make his way back to shore. His friends alerted lifeguards who commenced a search and found Mr Lin unconscious in the water; they commenced CPR. Emergency services arrived and continued CPR, but Mr Lin could not be revived.
Recommendations
1. That Victoria Police liaise with Life Saving Victoria, local lifesaving clubs, and other stakeholders, for the purpose of establishing a Mornington Peninsula surf safety working group.
2. That the surf safety working group give specific consideration to the changes suggested by the President of the Gunnamatta Surf Life Saving Club.
2016Mark Jordan-Hill, aged 46 years, drowned whilst out paddling his ocean ski, approximately 500 metres off Whites Beach, Torquay. He wore a lifejacket, used a leg rope attached to the ski (though this was not designed to be used on an ocean ski) and carried a mobile telephone and an emergency distress flare. The weather conditions were overcast with strong winds, offshore waves were 3-4 metres with large breaking waves across the area, which meant the paddlers would have been challenged in avoiding the breaking waves.
Recommendation
That the Department of Economic Development, Jobs, Transport and Resources consider reviewing current regulatory safety requirements for operators of human-powered recreational vessels by requiring operators to carry and/or fix Emergency Position Indicating Radio Beacons and/or Personal Locator Beacons (preferably those with GPS capability) onto their Personal Flotation Devices (with no limitations as to distance from the coast). This has the potential to significantly increase the timeliness of notifications to emergency services, and any subsequent search and rescue operation.
2017Jeffrey Coote, aged 83 years, died as a result of drowning whilst out paddling his surf ski, he had ischaemic heart disease and was not wearing a lifejacket/ Personal Flotation Device (PFD). Despite his medical history, he was generally of good health and was very active for his age. He typically rode his surf ski within Port Phillip Bay, but did not wear a lifejacket.
Comments
1. This investigation highlights the importance of wearing a PFD when engaged in recreational activities on our waterway, whether boating or on human-powered vessels. Use of a PFD is particularly important during solo activities, or in remote locations, when self-rescue may be difficult and assistance not readily available.
2. Unfortunately, the failure to use PFDs has been a feature of a number of coronial investigations, including recent cases...where the additional safety benefits of the Personal Locator Beacon (PLB) or Emergency Position Indicating Radio Beacon (EPIRB) to timely notification of rescue services was identified in the event of a medical situation, distress or other emergency.
Life Saving Victoria Victorian Drowning Report 2017/18 / 19

MURRAY RIVER DROWNING 2007/08 TO 2017/18
The Murray River has been identified as the number one river drowning blackspot in Australia (Peden & Queiroga, 2014). At 2,508 km, The Murray River is Australia’s longest
river. It forms a majority of the border length between Victoria and New South Wales and stretches down into South Australia. Due to state government legislation, drowning
incidents that occur in the Murray River are under New South Wales jurisdiction and are therefore reported in New South Wales drowning statistics. However, many of the drowning victims resided in Victoria. Therefore the key trends of Victorians drowning
in the Murray River are a focus for this report.
It is positive to note that no Victorians drowned in the Murray River in 2017/18. However, 20 Victorians drowned in the Murray River over the previous decade (2007/08 to 2016/17), an average of 2 per year. Of the 20, the majority, 16 (80%) were males, the
average age of the deceased was 38 years, and 4 (20%) were reported as being from CALD communities.
The majority of incidents occurred on a weekday (13, 65%), and in summer (11, 55%). The most common activity just prior to drowning was swimming (8, 40%) Other
activities included boating, kayaking, water-skiing, driving or recreating on a houseboat. The mechanism of injury in over a third (7, 35%) of incidents was falling/jumping/
stumbling into water. In 40% (8) of the drowning deaths the person had reportedly consumed alcohol prior to the incident.
SNAP
SHO
T
20VICTORIANS DROWNED IN THE MURRAY RIVER FROM 2007/08 TO 2017/18.
Life Saving Victoria Victorian Drowning Report 2017/18 / 20

OF VICTORIANS THAT DROWNED IN THE MURRAY RIVER HAD REPORTEDLY CONSUMED ALCOHOL PRIOR TO THE INCIDENT.
40%
Life Saving Victoria Victorian Drowning Report 2017/18 / 21

DR
OW
NIN
G P
RO
FILE
S By
Vict
orian
Sta
tistic
al Ar
eas
2007
/08
to 2
016/
17
40%
30%
20%
10%
0%0-4
Ballarat SA4 Population Ballarat SA4 Drowning
5-14 15-24 25-44 45-64 65+
Warrnambooland South West
North West
Bendigo
Shepparton
Hume
Latrobe-GippslandBallarat
Geelong
MelbourneWest
MelbourneNorth West
MelbourneInner
MelbourneInner South
MorningtonPeninsula
MelbourneNorth East
MelbourneSouth East
MelbourneOuter East
MelbourneInner East
Ballarat Statistical Area 4 – Drowning Statistics 2007/08 – 2016/17
DEMOGRAPHICS
BallaratDrowning Deaths
20 Ballarat SA4 residents hospitalised due to non-fatal drowning
20 Emergency Department presentations of Ballarat SA4 residents for non-fatal drowning
Ballarat SA4 Residents Drowned in Victoria
55% Likelihood of one or more drowning deaths occurring in Ballarat SA4 in any given year
45% Likelihood of one or more residents of Ballarat SA4 drowning in any given year
LOCATION AND ACTIVITY
Males were 1.7 times more likely to drown than females.
Proportion of drowning deaths and population by age group (years)
86
Lakes
Other inland (Dams, rivers/creeks/streams)
Bathtubs/spa baths
Bathing
Walking/recreating near water
Transport (for work/recreation)
Life Saving Victoria Victorian Drowning Report 2017/18 / 22

40%
30%
20%
10%
0%0-4 5-14 15-24 25-44 45-64 65+
Geelong SA4 Population Geelong SA4 Drowning
30%
20%
10%
0%0-4 5-14 15-24 25-44 45-64 65+
Bendigo SA4 Population Bendigo SA4 Drowning
Geelong Statistical Area 4 – Drowning Statistics 2007/08 – 2016/17
Bendigo Statistical Area 4 – Drowning Statistics 2007/08 –2016/17
DEMOGRAPHICS
DEMOGRAPHICS
LOCATION AND ACTIVITY
LOCATION AND ACTIVITY
Males were 2.2 times more likely to drown than females.
Males were 7.0 times more likely to drown than females.
Bendigo
Proportion of drowning deaths and population by age group (years)
Proportion of drowning deaths and population by age group (years)
Drowning Deaths
30 Bendigo SA4 residents hospitalised due to non-fatal drowning
15 Emergency Department presentations of Bendigo SA4 residents for non-fatal drowning
Bendigo SA4 Residents Drowned in Victoria
50% Likelihood of one or more drowning deaths occurring in Bendigo SA4 in any given year
26% Likelihood of one or more residents of Bendigo SA4 drowning in any given year
73
Dams
Lakes, rivers/ creeks/streams
Home swimming pools
Walking/recreating near water
Boating/fishing
Transport (for work/recreation)
Beaches
Ocean
Dams, rivers/creeks/streams
Swimming/attempting a rescue
Walking/recreating near water
Diving (SCUBA/snorkelling)
Drowning Deaths
67 Geelong SA4 residents hospitalised due to non-fatal drowning
44 Emergency Department presentations of Geelong SA4 residents for non-fatal drowning
Geelong SA4 Residents Drowned in Victoria
94% Likelihood of one or more drowning deaths occurring in Geelong SA4 in any given year
88% Likelihood of one or more residents of Geelong SA4 drowning in any given year
2921
Geelong
Life Saving Victoria Victorian Drowning Report 2017/18 / 23

40%
30%
20%
10%
0%0-4 5-14 15-24 25-44 45-64 65+
Latrobe-Gippsland SA4 Population Latrobe-Gippsland SA4 Drowning
40%
30%
20%
10%
0%0-4 5-14 15-24 25-44 45-64 65+
Hume SA4 Population Hume SA4 Drowning
Latrobe-Gippsland Statistical Area 4 – Drowning Statistics 2007/08 – 2016/17
Hume Statistical Area 4 – Drowning Statistics 2007/08 – 2016/17
Proportion of drowning deaths and population by age group (years)
Proportion of drowning deaths and population by age group (years)
DEMOGRAPHICS
DEMOGRAPHICS
LOCATION AND ACTIVITY
LOCATION AND ACTIVITY
Males were 4.8 times more likely to drown than females.
Males were 3.0 times more likely to drown than females.
Hume
Latrobe-Gippsland
DR
OW
NIN
G P
RO
FILE
S By
Vict
orian
Sta
tistic
al Ar
eas
2007
/08
to 2
016/
17
Rivers/creeks/streams
Lakes/dams
Home swimming pools
Swimming/ paddling/wading
Boating
Fishing
Drowning Deaths
22 Hume SA4 residents hospitalised due to non-fatal drowning
23 Emergency Department presentations of Hume SA4 residents for non-fatal drowning
Hume SA4 Residents Drowned in Victoria
91% Likelihood of one or more drowning deaths occurring in Hume SA4 in any given year
82% Likelihood of one or more residents of Hume SA4 drowning in any given year
2417
Drowning Deaths
68 Latrobe-Gippsland SA4 residents hospitalised due to non-fatal drowning
53 Emergency Department presentations of Latrobe- Gippsland SA4 residents for non-fatal drowning
Latrobe-Gippsland SA4 Residents Drowned in Victoria
99% Likelihood of one or more drowning deaths occurring in Latrobe-Gippsland SA4 in any given year
93% Likelihood of one or more residents of Latrobe-Gippsland SA4 drowning in any given year
5827
Beaches
Ocean
Rivers/creeks/streams
Swimming/ attempting a rescue
Boating/fishing
Walking near water/ rock walking
Life Saving Victoria Victorian Drowning Report 2017/18 / 24

4.0
3.0
2.0
1.0
0.0Inner Inner
EastInnerSouth
NorthEast
NorthWest
OuterEast
SouthEast
West
Male : Female Drowning Ratio in Melbourne SA4s
DEMOGRAPHICS LOCATION AND ACTIVITY
Melbourne Inner, Inner East, Inner South, North East, North West, Outer East, South East, West Statistical Area 4 – Drowning Statistics 2007/08 –2016/17
PROPORTION OF DROWNING DEATHS AND POPULATION BY AGE GROUP (YEARS)
0-4 5-14 15-24 25-44 45-64 65+
Statistical Area 4 Population Drowning Population Drowning Population Drowning Population Drowning Population Drowning Population Drowning
Melbourne – Inner 5% 3% 7% 0% 16% 14% 42% 43% 20% 30% 11% 11%
Melbourne – Inner East 5% 0% 12% 17% 15% 8% 27% 17% 25% 8% 17% 50%
Melbourne – Inner South 6% 8% 12% 8% 12% 8% 27% 36% 26% 12% 16% 28%
Melbourne – North East 7% 21% 12% 7% 13% 36% 30% 14% 24% 7% 14% 14%
Melbourne – North West 8% 30% 13% 10% 13% 0% 30% 10% 23% 30% 13% 20%
Melbourne – Outer East 6% 11% 12% 11% 13% 22% 27% 28% 26% 11% 16% 17%
Melbourne – South East 7% 22% 13% 6% 15% 0% 30% 11% 22% 50% 13% 11%
Melbourne – West 8% 17% 13% 0% 13% 9% 33% 4% 22% 35% 10% 35%
DROWNING STATISTICS FOR ALL MELBOURNE SA4S
Statistical Area 4Drowning deaths
in SA4
Drowning deaths of residents in
SA4Residents in SA4
hospitalised
Emergency Department
Presentations of residents in SA4
Likelihood of one or more drowning deaths within SA4 in any given year
Likelihood of one or more residents drowning in any
given year
Melbourne – Inner 37 34 75 66 98% 97%
Melbourne – Inner East 12 21 55 47 70% 88%
Melbourne – Inner South 25 21 65 46 92% 88%
Melbourne – North East 14 24 37 42 75% 91%
Melbourne – North West 10 16 41 42 63% 80%
Melbourne – Outer East 18 33 66 58 83% 96%
Melbourne – South East 18 41 102 68 83% 98%
Melbourne – West 23 36 78 91 90% 97%
MelbourneNorth West
MelbourneSouth East
MelbourneNorth East
MelbourneWest
MelbourneInner
MelbourneInner South
MelbourneOuter East
MelbourneInner East
Rivers/creeks/streams
Beaches/ocean
Bathtubs/spa baths
Swimming pools
Walking/recreating near water
Swimming/ paddling/wading
Bathing
Life Saving Victoria Victorian Drowning Report 2017/18 / 25

40%
30%
20%
10%
0%0-4 5-14 15-24 25-44 45-64 65+
North West SA4 Population North West SA4 Drowning
North West Statistical Area 4 – Drowning Statistics 2007/08 – 2016/17
Mornington Peninsula Statistical Area 4 – Drowning Statistics 2007/08 – 2016/17
DEMOGRAPHICS
DEMOGRAPHICS
LOCATION AND ACTIVITY
LOCATION AND ACTIVITY
Males were 8.0 times more likely to drown than females.
Males were 5.3 times more likely to drown than females.
Mornington Peninsula
North West
50%
40%
30%
20%
10%
0%0-4 5-14 15-24 25-44 45-64 65+
Mornington Peninsula SA4 Population Mornington Peninsula SA4 Drowning
Proportion of drowning deaths and population by age group (years)
Proportion of drowning deaths and population by age group (years)
DR
OW
NIN
G P
RO
FILE
S By
Vict
orian
Sta
tistic
al Ar
eas
2007
/08
to 2
016/
17
Drowning Deaths
77 Mornington Peninsula SA4 residents hospitalised due to non-fatal drowning
79 Emergency Department presentations of Mornington Peninsula SA4 residents for non-fatal drowning
Mornington Peninsula SA4 Residents Drowned in Victoria
99% Likelihood of one or more drowning deaths occurring in Mornington Peninsula SA4 in any given year
93% Likelihood of one or more residents of Mornington Peninsula SA4 drowning in any given year
5026
Drowning Deaths
24 North West SA4 residents hospitalised due to non-fatal drowning
30 Emergency Department presentations of North West SA4 residents for non-fatal drowning
North West SA4 Residents Drowned in Victoria
55% Likelihood of one or more drowning deaths occurring in North West SA4 in any given year
50% Likelihood of one or more residents of North West SA4 drowning in any given year
87
Beaches
Ocean
Rocky outcrops
Swimming/ paddling/wading
Diving (SCUBA/snorkelling)
Boating/fishing
Lakes/dams/ irrigation channels
Rivers/creeks/streams
Home swimming pools
Swimming/ attempting a rescue
Boating
Transport (for work/recreation)
Life Saving Victoria Victorian Drowning Report 2017/18 / 26

40%
30%
20%
10%
0%0-4 5-14 15-24 25-44 45-64 65+
Shepparton SA4 Population Shepparton SA4 Drowning
40%
30%
20%
10%
0%0-4 5-14 15-24 25-44 45-64 65+
Warrnambool & South West SA4 Population
Warrnambool & South West SA4 Drowning
Warrnambool and South West
Shepparton Statistical Area 4 – Drowning Statistics 2007/08 – 2016/17
DEMOGRAPHICS
DEMOGRAPHICS
LOCATION AND ACTIVITY
LOCATION AND ACTIVITY
Males were 13.5 times more likely to drown than females.
Males were 5.0 times more likely to drown than females.
Shepparton
Warrnambool and South West
Proportion of drowning deaths and population by age group (years)
Proportion of drowning deaths and population by age group (years)
Statistical Area 4 – Drowning Statistics 2007/08 – 2016/17
Drowning Deaths
32 Shepparton SA4 residents hospitalised due to non-fatal drowning
31 Emergency Department presentations of Shepparton SA4 residents for non-fatal drowning
Shepparton SA4 Residents Drowned in Victoria
70% Likelihood of one or more drowning deaths occurring in Shepparton SA4 in any given year
74% Likelihood of one or more residents of Shepparton SA4 drowning in any given year
1214
Bathtubs/spa baths
Lakes/dams/irrigation channels
Rivers/creeks/streams
Walking/recreating near water
Bathing
Boating
Drowning Deaths
18Warrnambool and South West SA4 residents hospitalised due to non-fatal drowning
16Emergency Department presentations of Warrnambool and South West SA4 residents for non-fatal drowning
Warrnambool and South West SA4 Residents Drowned in Victoria
94% Likelihood of one or more drowning deaths occurring in Warrnambool and South West SA4 in any given year
86% Likelihood of one or more residents of Warrnambool and South West SA4 drowning in any given year
2920
Ocean
Beaches
Rivers/creeks/streams
Boating
Walking/recreating near water
Diving (SCUBA/snorkelling)
Life Saving Victoria Victorian Drowning Report 2017/18 / 27

AGENCIESLife Saving VictoriaAquatics & Recreation VictoriaAustralian SailingAustralian Volunteer Coast GuardAUSTSWIMBelgravia LeisureBoating Industry AssociationCoroners Prevention UnitDragon Boating VictoriaKidsafe VictoriaKiteboarding AustraliaLandscaping VictoriaOutdoors VictoriaPaddle VictoriaSurfing VictoriaSwimming Pool and Spa Association of VictoriaSwimming VictoriaTriathlon VictoriaVictorian Municipal Building Surveyors GroupVictorian Recreational FishingVR FishYMCA Victoria
GOVERNMENT ENTITIESAmbulance VictoriaCountry Fire AuthorityDepartment of Education and TrainingDepartment of Environment, Land, Water & PlanningDepartment of Justice and RegulationEmergency Management VictoriaEmergency Services Telecommunications AuthorityMunicipal Association of VictoriaParks VictoriaRoyal Children’s Hospital Safety CentreState Emergency ServiceTransport Safety VictoriaTourism VictoriaVictoria PoliceVictorian Building AuthorityVictorian Coastal CouncilVictorian Fisheries AuthorityVictorian Multicultural Commission
LOCAL GOVERNMENT AREAS AND LAND MANAGERS
Financial contributors to the Victorian Paid Lifeguard Service.Barwon Coast Committee of Management INCBass Coast Shire CouncilColac Otway Shire CouncilEast Gippsland Shire CouncilGlenelg Shire CouncilGreat Ocean Road Coast CommitteeGreater Geelong City CouncilGreater Geelong City Council – WaterfrontMornington Peninsula Shire CouncilMoyne Shire CouncilParks Victoria Wilsons Promontory National ParkBorough of QueenscliffeSouth Gippsland Shire CouncilSurf Coast Shire CouncilWarrnambool City CouncilWellington Shire Council
REFERENCESAustralian Bureau of Statistics. (2016a). Australian Demographic Statistics Table 52, Jun 2016. Cat. No. 3101.0, Australian Bureau of Statistics: Canberra.Australian Bureau of Statistics. (2016b). Census DataPacks. https://datapacks.censusdata.abs.gov.au/datapacks/ (downloaded Oct 2018). Australian Bureau of Statistics: Canberra.Australian Bureau of Statistics. (2016c). Australian Statistical Geography Standard (ASGS): Volume 1 – Main Structure and Greater Capital City Statistical Areas, July 2016 (cat. no. 1270.0.55.001). Australian Bureau of Statistics: Canberra.Australian Water Safety Council. (2016). Australian Water Safety Strategy 2016-20. Australian Water Safety Council: Sydney.Birch, R., Strugnell, G., and Matthews, B. (2017, September). Evaluation of the Open Water Grey Medallion program: A beach safety education program for older adults. Paper presented at the Australasian Injury Prevention and Safety Promotion Conference: Ballarat, Victoria.Department of Human Services Multicultural Strategy Unit. (2002). Cited in Department of Human Services (2004), Cultural and Linguistic Diversity Strategy: Planning and Delivering Culturally Appropriate Supports for People with a Disability, Their Families and Carers. Department of Human Services: Melbourne.Department of Sustainability and Environment. (2011). My Victorian Waterway: Personal Connections with Rivers, Estuaries and Wetlands in Victoria. Victorian Department of Sustainability and Environment: Melbourne.Mahony, A., Peden, A.E., Roberts, C., and Barnsley, P. (2018). A 10 year analysis of drowning in Aquatic Facilities: Exploring risk at Communal, Public and Commercial swimming pools. Royal Life Saving Society – Australia: Sydney.Matthews, B.L., and Franklin, R.C. (2018) Examination of a pilot intervention program to change parent supervision behaviour at Australian public swimming pools. Health Promotion Journal of Australia. 29:153–159. doi.org/10.1002/hpja.37.Office of Best Practice Regulation. (2014). Best Practice Regulation Guidance Note Value of statistical life. Department of the Prime Minister and Cabinet: Canberra.Peden, A., and Queiroga, A.C. (2014). Drowning deaths in Australian rivers, creeks and streams: A 10 year analysis. Royal Life Saving Society – Australia: Sydney.Pidgeon, S., Barnsley, P., and Mahony, A. (2018). A ten year national study of overseas born drowning deaths 2005/06 to 2014/15. Royal Life Saving Society – Australia: Sydney.Matthews, B.L., Arch, J., and Shannon, P. (2018, November). Impact of a multi-sectoral injury prevention initiative: Play it Safe by the Water 1997-2007. Paper presented at the Safety 2018 World Conference: Bangkok, Thailand.PricewaterhouseCoopers. (2011). What is the Economic Contribution of Surf Life Saving in Australia. PricewaterhouseCoopers International Limited: Australia.Short, A. (1996). Beaches of the Victorian Coast & Port Phillip Bay; A guide to their nature, characteristics, surf and safety. University of NSW: Sydney.Strugnell, G., Birch, R., Morgan, D., Nimmo, L., and Matthews, B. (2017, September). Inland Waterways Drowning Prevention Project: A study of urban waterway users in two Australian states. Paper presented at the Australasian Injury Prevention and Safety Promotion Conference: Ballarat, Victoria.Victorian Aquatic Industry Council. (2001). Victorian Aquatic Industry Basic Facts: Strategic Advice 2001, Sport and Recreation Victoria. Victorian Aquatic Industry Council: Melbourne.Victorian Water Safety Assembly. (2016). Victorian Water Safety Strategy 2016-2020. Victorian Water Safety Assembly: Melbourne.
VIC
TORI
AN W
ATER
SAF
ETY
IND
UST
RY
Life Saving Victoria Victorian Drowning Report 2017/18 / 28

This report includes unintentional fatal and non-fatal drowning incidents reported in Victoria, Australia. An overview of fatal drowning for 1 July 2017 to 30 June 2018 is provided and compared with non-fatal drowning incidents for the same period. Comparisons between the latest financial year and 5 or 10-year averages were calculated from fatal and non-fatal drowning data in Victoria from 1 July 2007 to 30 June 2018.
FATAL INCIDENTSInformation on fatal drowning incidents was collected from the Coroners Court of Victoria, and the National Coroners Information System (NCIS). Deaths due to natural causes, suicide, or homicide are excluded from this report.
Coronial information relates to both open and closed cases. While all care is taken to ensure that the results are as accurate as possible, these figures are provisional only as coronial investigations and findings relating to open cases may alter the reported drowning figures. At the time of compilation 95% of suspected unintentional drowning cases in 2017/18 remained open on the NCIS.
NON-FATAL INCIDENTSInformation on non-fatal drowning in 2017/18 was provided by Ambulance Victoria (AV). Cases of non-fatal and immersion related injuries attended by AV paramedics were extracted from the VACIS® clinical information system. Potential drowning data for this report were identified via a database search for all drowning related dispatch codes identified at the emergency call-taker level, as well as cases in which paramedics reported a final assessment of ‘post immersion’. Only patients reported as suffering respiratory compromise or vomiting as a result of immersion were included in analyses.
Information on non-fatal drowning from 2007/08 to 2016/17 was provided by the Victorian Injury Surveillance Unit (VISU). Data included non-fatal and immersion related injuries extracted from the Victorian Emergency Minimum Dataset (VEMD) and Victorian Admitted Episodes Dataset (VAED) for the period 1 July 2007 to 30 June 2017.
The VEMD is a dataset containing records of emergency department presentations in Victorian hospitals with 24-hour emergency services. 100% state wide coverage of these hospitals applies from 2004. Data was selected if the cause of injury was ‘drowning/near drowning’ or the terms ‘drown’, ‘submerged’, ‘immersion’ and their variations were included in the “Description” variable. Further all injuries with an injury coded to drowning or immersion were also selected. Finally, any injury coded to a drowning or non-fatal drowning cause code with the mention of ‘decompression illness’ in the description was also chosen. These cases were then manually screened to ensure that they were submersion or non-fatal drowning cases. Cases were retained if the “Human
Intent” was coded to “Non-intentional harm”. Cases were limited to incidence (excludes return visits and pre-arranged admissions).
The VAED is a record of all hospital admissions in the state of Victoria. VAED data is coded to the International Statistical Classification of Diseases and Related Health Problems, Tenth Revision, Australian Modifications (ICD-10-AM). VAED records were initially extracted if the principal diagnosis was a community injury (S00-T75 or T79 ICD 10 AM code). Cases were then extracted if there was a drowning injury diagnosis (ICD 10 AM code of T75.1 “Drowning and non-fatal submersion”) anywhere in the 40 diagnosis codes or the external cause code was in the range W65-W71 (accidental drowning and submersion) or V90 (accident to water craft causing drowning and submersion) or V92 (water-transport-related drowning and submersion without accident to watercraft). Admissions as a result of transfer from another hospital or due to a statistical separation from the same hospital were excluded. Readmissions for day-treatments within 30 days of initial admission were excluded.
Drowning deaths from either AV or VISU data were excluded to avoid an overlap with Life Saving Victoria (LSV) fatal drowning data.
INCIDENCE CALCULATIONSIncidence calculations were performed using population figures published by the Australian Bureau of Statistics, 2016 (Australian Bureau of Statistics [ABS], 2016a).
RELATIVE RISK MAPSRelative risk maps were created to illustrate the degree to which observed drowning risk is greater than or less than the expected drowning risk at that location. Relative risk ratios were calculated using grouped event counts (incident and residence) and population counts within each postcode. This method was applied across multiple timeframes for time-based comparative analysis.
The maps illustrate relative risk for each of the 17 Victorian SA4’s. These were computed using incident and place of residence postcodes relative to each SA4. As the analysis included time-based comparisons, the events were portioned into two equal 5-year timeframes (2007/08 to 2011/12 and 2012/13 to 2016/17) along with an overall 10-year analysis (2007/08 to 2016/17).
The underlying population counts were taken from two censuses; 2011 and 2016. The following counts were used for the aggregate event timeframes:
2011 census for events from 2007/08 to 2011/12 (ABS, 2016b)
2016 census for events from 2012/13 to 2016/17 (ABS, 2016b)
For the overall 2007/08 to 2016/17 aggregated 10-year relative risk calculation, an average of the two censuses was used. This approach was used to reflect changing population counts within the different SA4’s over the 10-year study timeframe.
PROBABILITY MAPSProbability maps for Victorian Statistical Area Level 4 (SA4) regions were created demonstrating the likelihood of at least one drowning event occurring within each of the 17 Victorian regions. Probabilities were calculated based on 10-year means (from 2007/08 to 2016/17) in each of the SA4 regions. Using annualised means provides the ability to calculate the probability of one or more drowning events in each SA4 for any given year.
Probabilities are provided for both drowning incident location and place of residence. These locations were calculated based on the postcode of the incident and the residence at the time of each drowning event. By using the postcodes, spatial overlays were used to count the number of cases relative to each of the SA4’s over the 10-year study timeframe.
GEOGRAPHICAL CLASSIFICATIONGeographical classification of fatal and non-fatal drowning variables utilised the Australian Statistical Geography Standard (ASGS; ABS, 2016c). The ASGS is the Australian Bureau of Statistics’ geographical framework. Data was categorised into Remoteness Areas and Statistical Areas. Data was extracted from the Census DataPack applicable to each census period. These can be accessed from the Australian Bureau of Statistics website:
http://www.abs.gov.au/websitedbs/D3310114.nsf/home/ABS+Geography+Publications
MURRAY RIVER FATAL DROWNING ANALYSISThis year’s report includes analysis of Victorians who drowned in the Murray River from 2007/08 to 2017/18.
Information on incidents was collected from the Royal Life Saving National Fatal Drowning Database and the NCIS. Methods for reporting these incidents is as per all Victorian fatal drowning incidents as reported above.
MET
HO
DS
Life Saving Victoria Victorian Drowning Report 2017/18 / 29

ACKN
OW
LED
GEM
ENTS
AN
D C
ITAT
ION
ACKNOWLEDGEMENTSLife Saving Victoria gratefully acknowledges the assistance of the following organisations in the production of the Victorian Drowning Report:
Ambulance Victoria
Coroners Prevention Unit, Coroners Court of Victoria
Emergency Management Victoria, Department of Justice
National Coroners Information System
Royal Life Saving Society – Australia
Surf Life Saving Australia
Victorian Injury Surveillance Unit
SUGGESTED CITATIONLife Saving Victoria. (2018). Victorian Drowning Report 2017/18. Life Saving Victoria: Melbourne.
COMPILED BY:Dr Bernadette Matthews, Rhiannon Birch, Robert Andronaco and Grace Strugnell – Life Saving Victoria.
Dr Bernadette Matthews is Principal Research Associate for Life Saving Victoria. Bernadette has over 10 years experience in aquatic injury research including the epidemiology of fatal and non-fatal drowning, swimming competency in children and adults, aquatic safety signage recognition and recall, eye-tracking research, through to monitoring and evaluation of multicultural programs, education, training and aquatic sport. In 2017, Bernadette was awarded the International Life Saving Federation Medal for her contribution to international lifesaving.
Rhiannon Birch is the Project Coordinator – Risk and Research for Life Saving Victoria. Rhiannon assists in the planning and coordination of LSV’s research on injury prevention and water safety issues, including inland waterways drowning prevention, water competency among children and older adults in Victoria, coastal risk assessment, public pool safety, multicultural campaigns and international drowning prevention research. Rhiannon holds a Bachelor of Environmental Science and Graduate Diploma in Education.
Robert Andronaco is the Risk and Spatial Analysis Specialist at Life Saving Victoria. In his role he focuses on quantifying drowning risk and assisting land managers in mitigating assessed risks specific to recreational drowning and injury. Robert uses both traditional statistical approaches and spatial statistical analysis approaches in quantify drowning risks. Robert holds a Masters in Sport and Recreation Management and a Post Graduate Diploma in Risk Management. He is a current PhD candidate at RMIT in the School of Mathematics and Geospatial Science.
Grace Strugnell is the Project Officer – Risk and Research at Life Saving Victoria. Grace assists with research studies and assessments, conducted through extensive data collection, literature examination, monitoring, evaluation, reporting and ethical storage, for a range of water safety and drowning prevention initiatives. This encompasses a vast range of environments and demographics, including controlled and open waterways, metropolitan, regional and remote communities, and vulnerable groups to drowning. Grace is nearing completion of her Bachelor of Public Health and Health Promotion at Deakin University, Melbourne.
Life Saving Victoria Victorian Drowning Report 2017/18 / 30

“ THIS YEAR 40 PEOPLE DROWNED IN VICTORIA. THAT MEANS THAT 40 FAMILIES HAVE HAD TO EXPERIENCE THE UNBEARABLE GRIEF OF LOSING SOMEONE THEY LOVE, TO A FATE THAT SHOULD HAVE BEEN PREVENTABLE.” Dr Nigel Taylor ESM Chief Executive Officer, Life Saving Victoria
Life Saving Victoria Victorian Drowning Report 2017/18 / 31

Life Saving Victoria
200 The Boulevard Port Melbourne VIC 3207PO Box 353 South Melbourne DC VIC 3205
Tel (03) 9676 6900Fax (03) 9681 [email protected]
Recommended