EAGE Best Papers
Paper 49
In “Proceedings of Exploration 17: Sixth Decennial International Conference on Mineral Exploration” edited by V. Tschirhart and M.D. Thomas, 2017,
p. 691–699
3D Seismic Data Are an Asset for Exploration and Mine Planning: Kevitsa
Ni-Cu-PGE Deposit, Northern Finland
Malehmir, A. [1]
, Tryggvason, A. [1]
, Wijns, C. [2]
, Lindqvist, T. [3]
, Skyttä, P. [3]
, Koivisto, E. [4]
, Montonen, M. [5]
_________________________
1. Uppsala University, Uppsala, Sweden
2. First Quantum Minerals Ltd., Perth, Australia
3. University of Helsinki, Helsinki, Finland
4. University of Turku, Turku, Finland
5. Boliden FinnEx Oy, Kevitsa, Finland
ABSTRACT
Kevitsa is a disseminated Ni-Cu-PGE (platinum group elements) ore body in northern Finland, hosted by an extremely high-velocity
(6500–8500 m/s) ultramafic intrusion. It is currently being mined at a depth of approximately 100 m using open-pit mining method. The life
of mine is expected to be nearly 20 years, with the final pit depth reaching around 550–600 m. Based on a series of 2D seismic surveys and
given the expected life of mine, a high-resolution 3D seismic survey was justified and acquired in winter 2010 prior to the start of the
mining operation. Various researchers and teams have exploited these data since the acquisition because of the unique nature of the host
rock and the data being challenging to interpret however rich in reflectivity. Here, we first present the earlier 3D reflection data
processing results and then complement them by 3D first arrival traveltime tomography that was recently conducted. The combined results
help to provide constraints on the nature of some of the reflectors within the intrusion. It for example shows how the tomography results
can be correlated with rock quality data and for further planning of the pit. In particular, we observe a major fracture system, resolved by
the tomography results and running in the northern parts of the planned pit, with the reflection data providing better information on its
depth extent, estimated to be at least 600 m with a lateral extent of 1000 m. The fracture system appears to spatially limit the lateral extent
of the economic mineralzsation and partitioned mainly within the intrusion. It can be related to the paleostress regime forming similar
features in the study area and will likely be important for mining at deeper levels. Using the Kevitsa 3D seismic data set, we argue that 3D
seismic data should routinely be acquired prior to the start of mining activities to not only maximize exploration efficiency at depth, but
also to optimize mining as it continues towards depth. 3D seismic data are valuable and can be revisited for various purposes but difficult
to impossible to be acquired with high quality when mining commences.
INTRODUCTION
The Kevitsa 3D seismic survey (~ 9 km2; winter 2010, Figure 1)
was motivated by four 2D seismic profiles acquired in 2007 as a
part of the HIgh REsolution reflection seismics for ore
exploration (HIRE) national seismic program of the Geological
Survey of Finland (Kukkonen et al., 2009; Koivisto et al., 2012,
2015) with the primary goal of being used for open-pit mine
planning and deep exploration of massive sulphide occurrences
within the resource area (Malehmir et al., 2012a; Malehmir et
al., 2014). Disseminated Ni-Cu-PGE (platinum group element)
mineralization is hosted in olivine pyroxenite, the Kevitsa
intrusion, and surrounded by volcano-sedimentary rocks. These
various rock units exhibit velocities ranging from 4000 to 8000
m/s in more than 11 deep (> 800 m) boreholes logged using full-
waveform sonic and vertical seismic profile (VSP)
measurements (Malehmir et al., 2012a). During the processing
of the 3D data set, it became obvious from the refraction static
model that the bedrock required high velocities on the order of
7500 m/s within the planned open-pit. Although the data were
high seismic fold, respective receiver and shot line spacing of 70
and 80 m, and receiver and shot point spacing of 15 and 45 m,
the high velocity background resulted in poor reflectivity
signatures in the first couple of hundred metres of the migrated
reflection volume (Malehmir et al., 2012a). Pronounced
reflectors within the planned open-pit and greater Kevitsa
intrusion were observed starting from 150–200 m depth and
were related to either magmatic layering within the Kevitsa
intrusion or faults and fracture systems both of which had
implications for the design of the pit and future exploration at
the site. A tomography test was conducted to cover the near-
surface reflectivity gap and if possible to be used for rock
quality studies and mining at the site. No tie with surface
geology has been possible until the recent advance of mining to
almost 100 m depth in certain locations, allowing improved
interpretation of the reflection and tomography results, which
will be the focus of this paper.
The main objectives of this study are to (1) review the 3D
reflection data and discuss overall cause of the reflectivity in the
study area, (2) carry out 3D diving-wave traveltime tomography
on first breaks to examine its potential over ray- and layered-
based refraction method in resolving weakness zones, and (3)
compare the velocity model with the existing rock quality data
derived from several boreholes in the study area and examine if
the velocity models can be further used for rock blasting and
block selections for detailed mining and crushing (mixing
competent and incompetent rocks) purposes. The tomography
results have been interpreted and combined with deeper
information obtained from the reflection volume and surface
observations from the open-pit.

692 EAGE Best Papers
GEOLOGY OF KEVITSA
The Kevitsa ore body, 160 Mt proven and probable, is hosted by
a mainly ultramafic intrusion in northern Finland (Figure 1) and
surrounded by volcano-sedimentary rocks; it is a low-grade,
disseminated Ni-Cu sulphide ore (0.3% Ni and 0.41% Cu), with
also significant PGE and Au content (Gregory et al., 2011).
Mining commenced in 2012 using an open-pit mining method
by First Quantum Minerals Ltd. and as of summer 2016 by
Boliden. The current open-pit depth is about 100 m and the pit
will extend to 550 m depth within 20 years (mine’s life). The
Kevitsa deposit was discovered in 1987 and since then the
surrounding area has been a target of numerous geological and
geophysical investigations. For example, the Sakatti super-rich
Ni-Cu-PGE deposit was recently discovered (Coppard, 2014;
Brownscombe et al., 2015) just 10 km south-southwest from the
Kevitsa mine; it sits likely within the same geological setting as
the Kevitsa ore. Two boreholes led to the discovery of the
Sakatti deposit intersected two massive sulphide lenses with ~40
m at 3.40 wt% Cu, 3.54 wt% Ni, 1.81 g/t Pt, 2.09 g/t Pd, and
0.45 g/t Au (Brownscombe et al., 2015).
Important types of mineralization in the area include contact-
related and possibly remobilized types (usually massive to semi-
massive, occurring at or below the contact with the intrusion),
false types (usually disseminated, dominated by pyrrhotite, and
occurring at the margins of the intrusion), and normal types
(which are rich in Ni and occur within the intrusion where a
magmatic stratigraphy is present). Figure 2 shows a schematic
geologic cross section through the Kevitsa intrusion, not
strongly constrained by borehole data, illustrating the different
types of mineralization proven to exist in the region. These
deposits, particularly the massive ones, are the targets of several
new exploration works in the study area.
Figure 2: Schematic cross section constrained by deep
magnetotelluric (MT) and borehole data, showing the main
Kevitsa intrusion (hosting the main mineralization-regular ore)
and proven massive sulphide mineralization occurring as false
and contact mineralization in the study area.
KEVITSA 3D SEISMIC DATA
Data Acquisition
Kevitsa 3D seismic data (Figure 3) were acquired during winter
2010 primarily for open-pit mine planning and for deep
exploration of massive sulphide occurrences within the resource
area (Malehmir et al., 2012a; Malehmir et al., 2014). Prior to the
Figure 1: Geological map of Kevitsa showing the location of the planned open-pit (stage 4), 3D seismic survey area, and 2D seismic
profiles E2-E5 in the inset map. The 3D seismic data and derived tomography results are the focus here.

Malehmir, A., et al. 3D Seismic Data Are an Asset for Exploration and Mine Planning: Kevitsa 693
3D survey, four seismic profiles (Figure 1) crossing the Kevitsa
intrusive complex were acquired in 2007 as a part of the HIRE
national seismic program of the Geological Survey of Finland
(Kukkonen et al., 2009). These profiles contributed to the
imaging and understanding the geometry of the intrusion and
large-scale structures associated with the Kevitsa deposit
(Koivisto et al., 2012, 2015). Details of the 3D data acquisition
can be found in Malehmir et al. (2012a) and the 2D data in
Koivisto et al. (2012). Nearly 3300 shots were recorded in nine
receiver lines each comprising of 96 receivers. The survey area
was covered using nine overlapping patches (50% both shot and
receiver lines) and this led to an average fold of 75 using a 10 by
10 m common depth point (CDP) bins (Figure 3b). VibsistTM
(Cosma and Enescu, 2001) was used as the main source
although approximately 300 explosive shots (0.5 kg at about 3 m
depth) were also recorded in areas inaccessible with VibsistTM.
The acquisition took place in winter 2010 with temperature
changing from -35° in the beginning of the survey to +5° at the
end of the survey in April, from nearly 1 m of snow to almost no
snow. This obviously led to different ground conditions and
receiver coupling. Additionally, a mixture of instruments was
used for the data acquisition, namely Sercel 408TM and
SeistronixTM each with different capabilities.
Reflection Seismic Data Processing
During the processing of the 3D data, it became obvious from
the refraction static model that the bedrock required high
velocities, on the order of 7500 m/s, within the planned open-pit.
The processing work followed a conventional prestack dip-
moveout (DMO) and poststack migration approach (Malehmir et
al., 2012b and references therein), with careful focus on
refraction static (high-quality first break picking using manual
quality control and corrections where needed), velocity analysis
and prestack and poststack noise attenuations using various
filtering and deconvolution approaches. Poststack migration was
performed taking into account the high-velocity background.
This however likely introduced image distortion because some
shallow reflections became weaker or totally disappeared after
this step.
Although the data were of relatively high seismic fold,
respective receiver and shot line spacing of 70 and 80 m, and
receiver and shot point spacing of 15 and 45 m, the high-
velocity background resulted in poor reflectivity signatures in
the first couple of hundred metres of the migrated reflection
volume (Malehmir et al., 2012a). Pronounced reflectors within
the planned open-pit and greater Kevitsa intrusion were
observed starting from 150–200 m depth.
Previous Reflection Imaging Results
Figure 4 shows a series of depth slices from the 3D reflection
cube, showing the overall structures around the Kevitsa
intrusion and a clear northwest-southeast striking reflector
(labeled R8 to be consistent with Koivisto et al., 2015) that dips
towards the southwest just at the edge of the planned open-pit
starting at 10 m below sea level. It is possible to track the R8
reflector to at least ~390 m below sea level after which it
becomes diffuse. Average surface elevation in Kevitsa is 235 m
above sea level. Given that this reflector appeared at the edge of
the planned pit it was unclear if it was significant for the open-
pit mine planning or if it had any role in the distribution of
economic mineralization within the open-pit area. This reflector
is the main focus of this study as it will be recalled when the
tomography results are presented.
Figure 3: (a) The Kevitsa 3D seismic data were acquired using nine overlapping (50%) patches. For example, patch 1A (green and blue
boxes) shared 50% of its source and receiver lines (repeated) into a neighboring patch. (b) CDP fold coverage calculated from a CDP bin
size of 10 by 10 m.

694 EAGE Best Papers
The 3D reflection seismic data supported by MT models also
provided a target at the southwestern contact of the intrusion
(high seismic amplitude and conductive) at about 390 m below
sea level (labelled B in Figure 5a). It was drilled and downhole
logged, and it became clear it was related to a disseminated,
layered-type mineralization (interpreted to be related to
magmatic pulses within the intrusion), not to a massive sulphide
mineralization (Malehmir et al., 2012a). Within and at the
bottom of the intrusion false and basal massive sulphides are
highly prospective some of which were intersected in a few
boreholes but none were of major size. These types of targets are
today highly prospective within the Kevitsa intrusion and similar
ones in the area (e.g., Sakatti). The base of the Kevitsa intrusion
was modelled using the seismic data and existing boreholes in
addition to the reflections either observed directly in the data or
structures speculated based on discontinuity observed in the
reflections from one inline to another (Figure 5b). It shows the
Kevitsa intrusion is open towards the southwest implying that
the root of the Kevitsa can be further in the southwest. This also
suggests neighbouring regions there can also highly be
prospective.
Figure 4: A series of depth slices at (a) 50 m, (b) -10 m, (c) -50 m, and (d) -110 m, relative to sea level, shown with the planned
open-pit shell (stage 4 or the final pit model). Volcano-sedimentary rocks surrounding the Kevitsa intrusion and how they dip
inwards (or mainly to the south and east) are evident from the 3D reflection volume. R8 is the only major reflector that cuts the
planned open-pit at its western margin. Note that the average surface elevation is 235 m above sea level in the study area.

Malehmir, A., et al. 3D Seismic Data Are an Asset for Exploration and Mine Planning: Kevitsa 695
Figure 5: (a) 3D visualization of the seismic reflection data with
the planned open-pit mine and (b) the picked near-vertical faults
and the base of the Kevitsa intrusion. KV322 is a borehole that
intersects areas of sulphide mineralization and shows good
correlation with reflections observed in the seismic volume (see
events marked as B and M). R8 reflector is also evident in this
depth slice (approximately 600 m depth).
3D FIRST-BREAK TOMOGRAPHY
Turning-ray 3D traveltime tomography (Tryggvason et al.,
2002) was carried out using approximately 2.5 millions of first
breaks (Figure 6) after testing various parameters and tuning the
inversion parameters, and excluding bad quality picks. Tests
were carried out using various cell sizes and various upper and
lower velocity bounds. Finally, an inversion cell size of 10 x 10
m horizontally and 5 m vertically for the top of the model were
selected. Below 50 m depth, cells of 10 x 10 x 10 m were used.
The smaller cells on the top of the model were used to better
account for the variable bedrock depth and to avoid velocity
artefacts in deeper cells due to a large velocity contrast at the
bedrock interface. In this case, a large velocity contrast between
the glacial sediments and the bedrock was expected. In the end,
the inversion was done in several steps, using a subset of the
data to derive a coarse model that was later resampled to the
final cell sizes. The final seven iterations with all the data were
then done using this model as a starting model. This procedure
was time consuming, but resulted in better data fit and a more
reasonable model than if all the data were inverted in one step
starting for example from a 1D starting model. The final 3D
tomography model shows a maximum depth penetration of
about 200 m with some gaps in the model (no ray coverage)
around this depth range.
RESULTS AND INTERPRETATION
Figure 7 shows a series of depth slices from the tomography
volume. The Kevitsa intrusion stands out in all these slices as a
high velocity (6500–8000 m/s) region with sedimentary rocks
juxtaposing it as regions with velocities between 4000–5000
m/s. There is even an indication of the inward dip of the Kevitsa
intrusion when these depth slices are carefully compared. Within
the planned open-pit, a low velocity zone (also labeled R8 in
Figures 7a and 7b) is evident but it quickly becomes unclear at
depth. Two regions of extreme high-velocity materials are also
observed in the southwest corner of the depth slices but it is not
evident what causes these. There are also indications of low- and
high-velocity regions within the intrusion that may indicate
variations in rock competency, probably due to the degree of
talc alteration and fracturing. Gabbroic and dunitic rocks in the
southwestern parts of the study area are highly altered (to even
talc) and this may explain their low velocities comparable to the
volcano-sedimentary rocks of the northern parts.
The bedrock surface was surveyed after the removal of the
overburden using an accurate DGPS (differential global
positioning system). The exposed bedrock, 3D photometry of
the exposed bedrock and drillhole fracture data then allowed a
careful studying of brittle fracture and fault systems in the study
area (Lindqvist, 2014; Lindqvist et al., 2017). These suggest a
Figure 6: (a) Picked first arrivals versus offset used for the 3D velocity tomography and (b) offset versus azimuth showing a good
illumination of the structures almost in all directions. Bad quality data in (a) were automatically rejected during the iterative processes
of tomography inversion.

696 EAGE Best Papers
gently to moderately west-northwest dipping (35°–45°) fracture
system associated with the low-velocity zone and the reflector
R8. Lindqvist (2014) carefully mapped the fracture systems and
modelled them in 3D. The fractures modelled by Lindqvist
(2014) then were visualized in 3D with the tomography results
and the reflection data.
Figure 8 shows a series of 3D views from the reflection seismic
volume, bedrock surface as surveyed after the removal of
overburden and prior to the start of mining, rock quality
designation (RQD) and tomography velocity models. Several
bedrock lineaments are notable particularly one running nearly
in the north-south direction (R8). The Kevitsa intrusion is
clearly notable in the tomography model as a region of high
velocity. Nevertheless, a major low-velocity zone in the same
direction as R8 and crossing the planned open-pit can be seen in
the depth slice of the tomographic model (Figure 8d). There are
also indications of low and high velocity regions within the
intrusion that may indicate variations in rock competency,
probably due to the degree of talc alteration and fracturing. The
low-velocity zone loses its definition towards greater depths in
the tomography volume. However the reflection volume
suggests a pronounced reflector (R8 at about -110 m elevation in
Figure 8a) with similar orientation as the low-velocity zone
suggesting the same structures. The exposed bedrock (Figure
8b) and drillhole fracture data indicate a brittle fracture and fault
system (Lindqvist, 2014) that moderately (about 35°) dips
towards the northwest. Based on drillhole data and 3D
photometry studies, it is estimated to be 5–20 m wide. The R8
structure appears to also provide a boundary to the reflectivity
pattern within the intrusion and thus may be important in
controlling mineralization and its lateral extent in Kevitsa
(Koivisto et al., 2015).
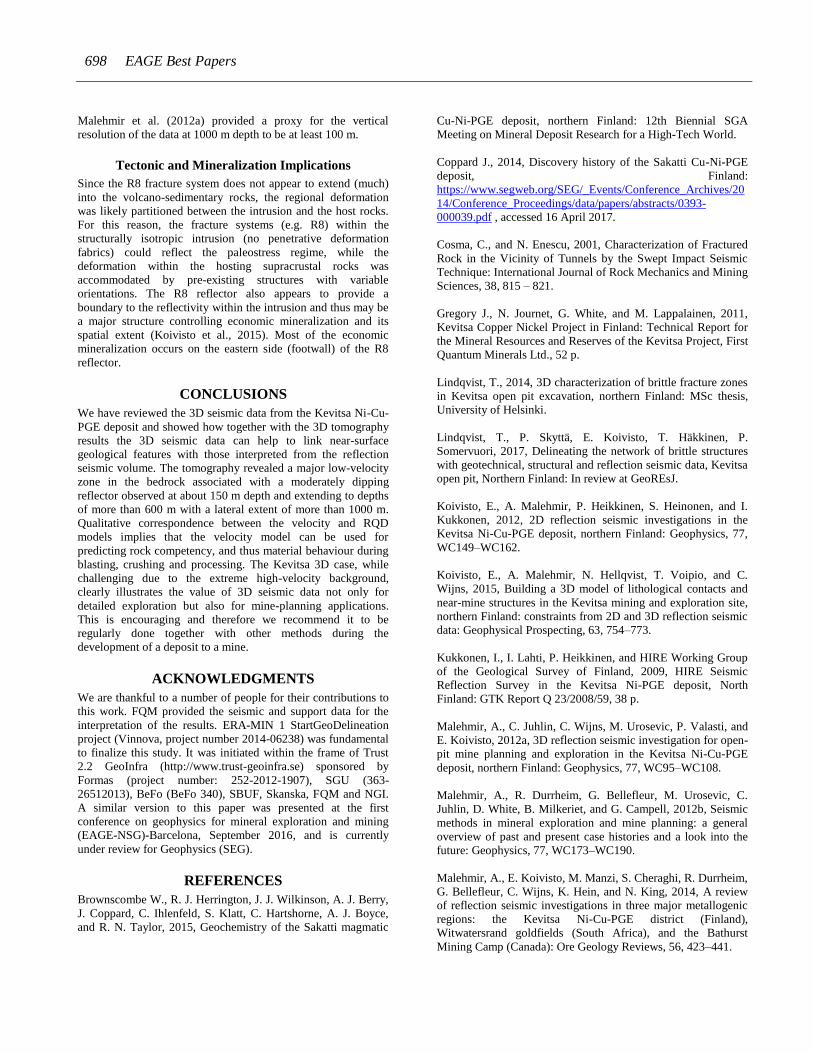
Figure 7: A series of depth slices from the tomographic velocity volume at (a) 205 m, (b) 190 m, (c) 140 m, and (d) 90 m above sea level
clearly showing the high velocity (6500–8000 m/s) rocks of the Kevitsa intrusion and the low velocity (4000–5000 m/s) volcano-
sedimentary and highly altered gabbroic and dunitic rocks, as well as a clear low-velocity lineament (R8) running in the middle of the
planned open-pit (a and b). The low-velocity zone loses its definition at deeper levels.
Malehmir, A., et al. 3D Seismic Data Are an Asset for Exploration and Mine Planning: Kevitsa 697
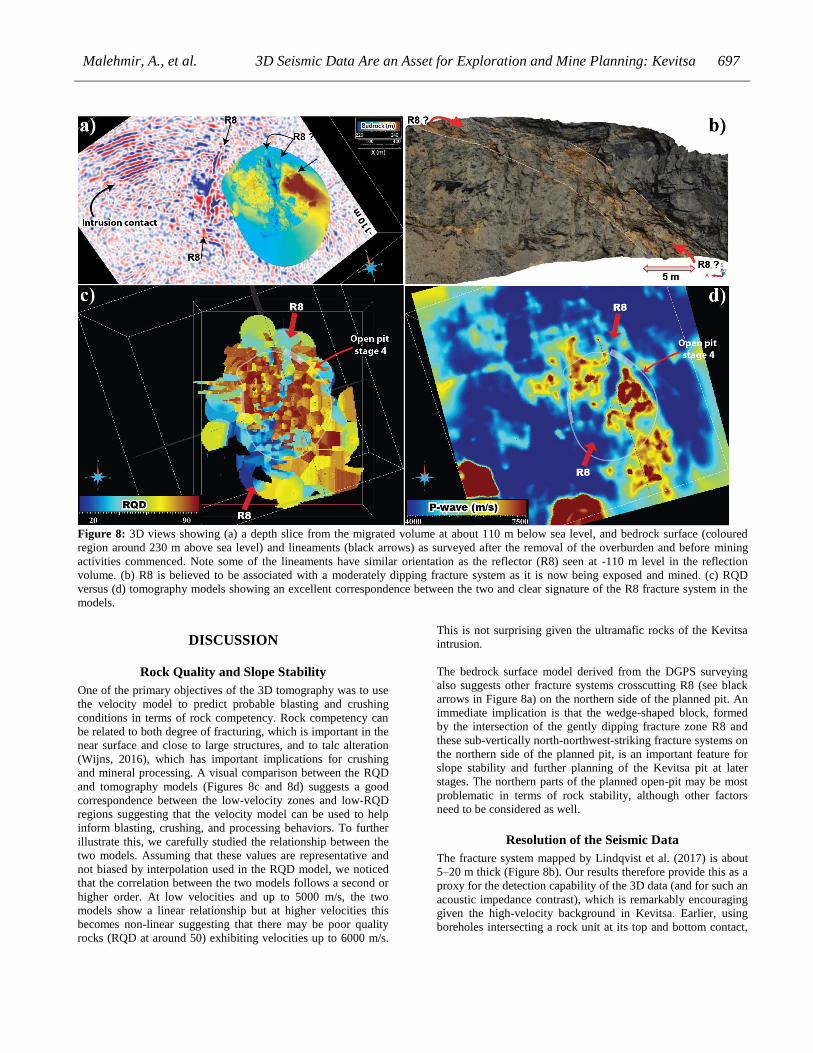
Figure 8: 3D views showing (a) a depth slice from the migrated volume at about 110 m below sea level, and bedrock surface (coloured
region around 230 m above sea level) and lineaments (black arrows) as surveyed after the removal of the overburden and before mining
activities commenced. Note some of the lineaments have similar orientation as the reflector (R8) seen at -110 m level in the reflection
volume. (b) R8 is believed to be associated with a moderately dipping fracture system as it is now being exposed and mined. (c) RQD
versus (d) tomography models showing an excellent correspondence between the two and clear signature of the R8 fracture system in the
models.
DISCUSSION
Rock Quality and Slope Stability
One of the primary objectives of the 3D tomography was to use
the velocity model to predict probable blasting and crushing
conditions in terms of rock competency. Rock competency can
be related to both degree of fracturing, which is important in the
near surface and close to large structures, and to talc alteration
(Wijns, 2016), which has important implications for crushing
and mineral processing. A visual comparison between the RQD
and tomography models (Figures 8c and 8d) suggests a good
correspondence between the low-velocity zones and low-RQD
regions suggesting that the velocity model can be used to help
inform blasting, crushing, and processing behaviors. To further
illustrate this, we carefully studied the relationship between the
two models. Assuming that these values are representative and
not biased by interpolation used in the RQD model, we noticed
that the correlation between the two models follows a second or
higher order. At low velocities and up to 5000 m/s, the two
models show a linear relationship but at higher velocities this
becomes non-linear suggesting that there may be poor quality
rocks (RQD at around 50) exhibiting velocities up to 6000 m/s.
This is not surprising given the ultramafic rocks of the Kevitsa
intrusion.
The bedrock surface model derived from the DGPS surveying
also suggests other fracture systems crosscutting R8 (see black
arrows in Figure 8a) on the northern side of the planned pit. An
immediate implication is that the wedge-shaped block, formed
by the intersection of the gently dipping fracture zone R8 and
these sub-vertically north-northwest-striking fracture systems on
the northern side of the planned pit, is an important feature for
slope stability and further planning of the Kevitsa pit at later
stages. The northern parts of the planned open-pit may be most
problematic in terms of rock stability, although other factors
need to be considered as well.
Resolution of the Seismic Data
The fracture system mapped by Lindqvist et al. (2017) is about
5–20 m thick (Figure 8b). Our results therefore provide this as a
proxy for the detection capability of the 3D data (and for such an
acoustic impedance contrast), which is remarkably encouraging
given the high-velocity background in Kevitsa. Earlier, using
boreholes intersecting a rock unit at its top and bottom contact,
698 EAGE Best Papers
Malehmir et al. (2012a) provided a proxy for the vertical
resolution of the data at 1000 m depth to be at least 100 m.
Tectonic and Mineralization Implications
Since the R8 fracture system does not appear to extend (much)
into the volcano-sedimentary rocks, the regional deformation
was likely partitioned between the intrusion and the host rocks.
For this reason, the fracture systems (e.g. R8) within the
structurally isotropic intrusion (no penetrative deformation
fabrics) could reflect the paleostress regime, while the
deformation within the hosting supracrustal rocks was
accommodated by pre-existing structures with variable
orientations. The R8 reflector also appears to provide a
boundary to the reflectivity within the intrusion and thus may be
a major structure controlling economic mineralization and its
spatial extent (Koivisto et al., 2015). Most of the economic
mineralization occurs on the eastern side (footwall) of the R8
reflector.
CONCLUSIONS
We have reviewed the 3D seismic data from the Kevitsa Ni-Cu-
PGE deposit and showed how together with the 3D tomography
results the 3D seismic data can help to link near-surface
geological features with those interpreted from the reflection
seismic volume. The tomography revealed a major low-velocity
zone in the bedrock associated with a moderately dipping
reflector observed at about 150 m depth and extending to depths
of more than 600 m with a lateral extent of more than 1000 m.
Qualitative correspondence between the velocity and RQD
models implies that the velocity model can be used for
predicting rock competency, and thus material behaviour during
blasting, crushing and processing. The Kevitsa 3D case, while
challenging due to the extreme high-velocity background,
clearly illustrates the value of 3D seismic data not only for
detailed exploration but also for mine-planning applications.
This is encouraging and therefore we recommend it to be
regularly done together with other methods during the
development of a deposit to a mine.
ACKNOWLEDGMENTS
We are thankful to a number of people for their contributions to
this work. FQM provided the seismic and support data for the
interpretation of the results. ERA-MIN 1 StartGeoDelineation
project (Vinnova, project number 2014-06238) was fundamental
to finalize this study. It was initiated within the frame of Trust
2.2 GeoInfra (http://www.trust-geoinfra.se) sponsored by
Formas (project number: 252-2012-1907), SGU (363-
26512013), BeFo (BeFo 340), SBUF, Skanska, FQM and NGI.
A similar version to this paper was presented at the first
conference on geophysics for mineral exploration and mining
(EAGE-NSG)-Barcelona, September 2016, and is currently
under review for Geophysics (SEG).
REFERENCES
Brownscombe W., R. J. Herrington, J. J. Wilkinson, A. J. Berry,
J. Coppard, C. Ihlenfeld, S. Klatt, C. Hartshorne, A. J. Boyce,
and R. N. Taylor, 2015, Geochemistry of the Sakatti magmatic
Cu-Ni-PGE deposit, northern Finland: 12th Biennial SGA
Meeting on Mineral Deposit Research for a High-Tech World.
Coppard J., 2014, Discovery history of the Sakatti Cu-Ni-PGE
deposit, Finland:
https://www.segweb.org/SEG/_Events/Conference_Archives/20
14/Conference_Proceedings/data/papers/abstracts/0393-
000039.pdf , accessed 16 April 2017.
Cosma, C., and N. Enescu, 2001, Characterization of Fractured
Rock in the Vicinity of Tunnels by the Swept Impact Seismic
Technique: International Journal of Rock Mechanics and Mining
Sciences, 38, 815 – 821.
Gregory J., N. Journet, G. White, and M. Lappalainen, 2011,
Kevitsa Copper Nickel Project in Finland: Technical Report for
the Mineral Resources and Reserves of the Kevitsa Project, First
Quantum Minerals Ltd., 52 p.
Lindqvist, T., 2014, 3D characterization of brittle fracture zones
in Kevitsa open pit excavation, northern Finland: MSc thesis,
University of Helsinki.
Lindqvist, T., P. Skyttä, E. Koivisto, T. Häkkinen, P.
Somervuori, 2017, Delineating the network of brittle structures
with geotechnical, structural and reflection seismic data, Kevitsa
open pit, Northern Finland: In review at GeoREsJ.
Koivisto, E., A. Malehmir, P. Heikkinen, S. Heinonen, and I.
Kukkonen, 2012, 2D reflection seismic investigations in the
Kevitsa Ni-Cu-PGE deposit, northern Finland: Geophysics, 77,
WC149–WC162.
Koivisto, E., A. Malehmir, N. Hellqvist, T. Voipio, and C.
Wijns, 2015, Building a 3D model of lithological contacts and
near-mine structures in the Kevitsa mining and exploration site,
northern Finland: constraints from 2D and 3D reflection seismic
data: Geophysical Prospecting, 63, 754–773.
Kukkonen, I., I. Lahti, P. Heikkinen, and HIRE Working Group
of the Geological Survey of Finland, 2009, HIRE Seismic
Reflection Survey in the Kevitsa Ni-PGE deposit, North
Finland: GTK Report Q 23/2008/59, 38 p.
Malehmir, A., C. Juhlin, C. Wijns, M. Urosevic, P. Valasti, and
E. Koivisto, 2012a, 3D reflection seismic investigation for open-
pit mine planning and exploration in the Kevitsa Ni-Cu-PGE
deposit, northern Finland: Geophysics, 77, WC95–WC108.
Malehmir, A., R. Durrheim, G. Bellefleur, M. Urosevic, C.
Juhlin, D. White, B. Milkeriet, and G. Campell, 2012b, Seismic
methods in mineral exploration and mine planning: a general
overview of past and present case histories and a look into the
future: Geophysics, 77, WC173–WC190.
Malehmir, A., E. Koivisto, M. Manzi, S. Cheraghi, R. Durrheim,
G. Bellefleur, C. Wijns, K. Hein, and N. King, 2014, A review
of reflection seismic investigations in three major metallogenic
regions: the Kevitsa Ni-Cu-PGE district (Finland),
Witwatersrand goldfields (South Africa), and the Bathurst
Mining Camp (Canada): Ore Geology Reviews, 56, 423–441.

Malehmir, A., et al. 3D Seismic Data Are an Asset for Exploration and Mine Planning: Kevitsa 699
Tryggvason A., S.T. Rögnvaldsson, and Ó.G. Flovenz, 2002,
Three dimensional imaging of P- and S-wave velocity structure
and earthquake locations beneath southwest Iceland:
Geophysical Journal International, 151, 848–866.
Wijns, C., 2016, Airborne EM for mine infrastructure planning:
Exploration Geophysics, 47, 279–284.
Recommended