Investor Relations / BRSA Bank-only Earnings Presentation 9M16 Investor Relations / BRSA Bank-only Earnings Presentation 9M16
September 30, 2016 BRSA Bank-only Financials
Earnings Presentation
Investor Relations / BRSA Bank-only Earnings Presentation 9M16 Investor Relations / BRSA Bank-only Earnings Presentation 9M16
2
9M15 9M16
Net Income (TL million)
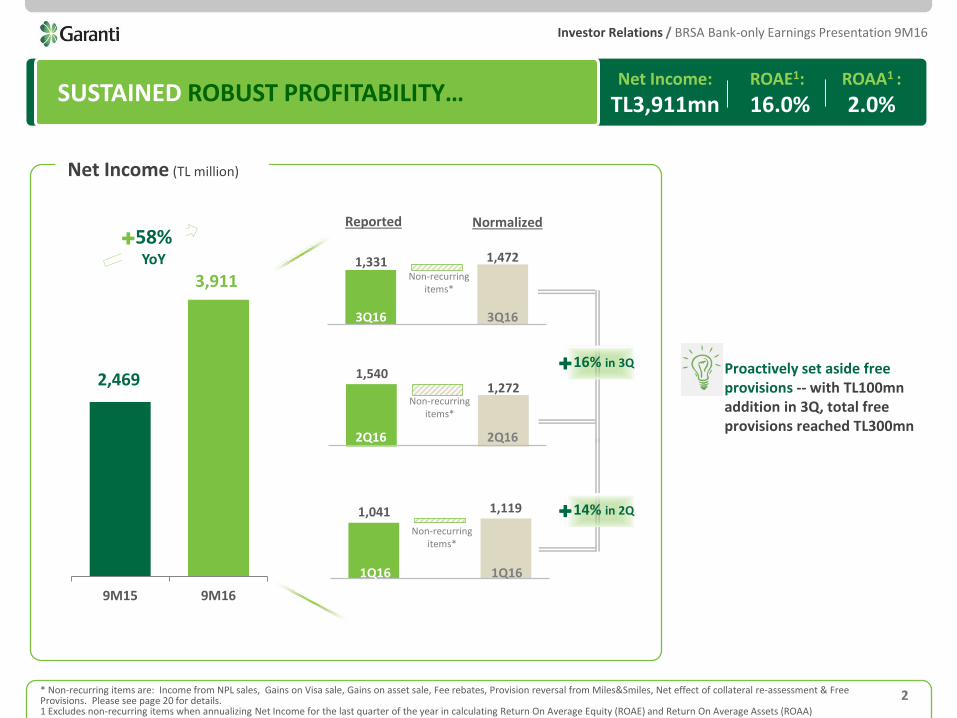
SUSTAINED ROBUST PROFITABILITY… Net Income:
TL3,911mn ROAE1:
16.0% ROAA1 :
2.0%
3,911
2,469
58% YoY
* Non-recurring items are: Income from NPL sales, Gains on Visa sale, Gains on asset sale, Fee rebates, Provision reversal from Miles&Smiles, Net effect of collateral re-assessment & Free Provisions. Please see page 20 for details. 1 Excludes non-recurring items when annualizing Net Income for the last quarter of the year in calculating Return On Average Equity (ROAE) and Return On Average Assets (ROAA)
1,041 1,119
1,540 1,272
1,331 1,472
1Q16 Net Income
1Q16 Normalized Net Income
Non-recurring items*
2Q16 Net Income
2Q16 Normalized Net Income
Non-recurring items*
Non-recurring items*
3Q16 Net Income
3Q16 Normalized Net Income
14% in 2Q
16% in 3Q
Proactively set aside free provisions -- with TL100mn addition in 3Q, total free provisions reached TL300mn
Reported Normalized
1,331 1,472
Non-recurring items*
3Q16 3Q16
1,540 1,272
Non-recurring items*
2Q16 2Q16
1,041 1,119
Non-recurring items*
1Q16 1Q16
16% in 3Q
14% in 2Q
Investor Relations / BRSA Bank-only Earnings Presentation 9M16 Investor Relations / BRSA Bank-only Earnings Presentation 9M16
3 1 Excludes non-recurring items when annualizing Net Income for the last quarter of the year in calculating Return On Average Equity (ROAE) and Return On Average Assets (ROAA)
33%
SUSTAINED ROBUST PROFITABILITY… Net Income:
TL3,911mn ROAE1:
16.0% ROAA1 :
2.0%
Robust Profitability marked by core operating income
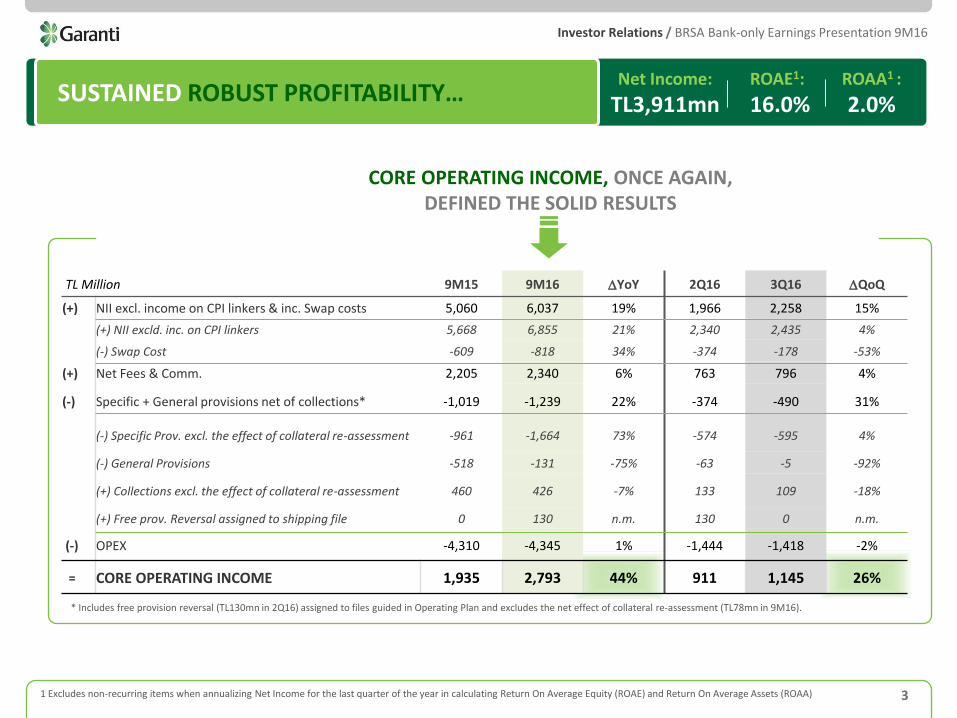
* Includes free provision reversal (TL130mn in 2Q16) assigned to files guided in Operating Plan and excludes the net effect of collateral re-assessment (TL78mn in 9M16).
Only TL130mn of the total TL330mn free provisions were reversed ytd against shıppıng related provisions TL330mn as bottom-line impact Ytd were offset with other one-off income. TL
200mn of free provision still remains to be reversed in this year
Only TL130mn free provision was reversed YtD against the ~TL327mn provision required for the files guided in OP. TL200mn of free provision still remains.
CORE OPERATING INCOME, ONCE AGAIN, DEFINED THE SOLID RESULTS
TL Million 9M15 9M16 DYoY 2Q16 3Q16 DQoQ
(+) NII excl. income on CPI linkers & inc. Swap costs 5,060 6,037 19% 1,966 2,258 15%
(+) NII excld. inc. on CPI linkers 5,668 6,855 21% 2,340 2,435 4%
(-) Swap Cost -609 -818 34% -374 -178 -53%
(+) Net Fees & Comm. 2,205 2,340 6% 763 796 4%
(-) Specific + General provisions net of collections* -1,019 -1,239 22% -374 -490 31%
(-) Specific Prov. excl. the effect of collateral re-assessment -961 -1,664 73% -574 -595 4%
(-) General Provisions -518 -131 -75% -63 -5 -92%
(+) Collections excl. the effect of collateral re-assessment 460 426 -7% 133 109 -18%
(+) Free prov. Reversal assigned to shipping file 0 130 n.m. 130 0 n.m.
(-) OPEX -4,310 -4,345 1% -1,444 -1,418 -2%
= CORE OPERATING INCOME 1,935 2,793 44% 911 1,145 26%

Investor Relations / BRSA Bank-only Earnings Presentation 9M16 Investor Relations / BRSA Bank-only Earnings Presentation 9M16
4
1
WHAT LIES BENEATH… Net Income:
TL3,911mn ROAE1 :
16.0% ROAA1 :
2.0%
5.0% 4.5% 5.2%
+35bps +29bps +16bps
4.9%
+52bps
Outstanding NIM performance, highest among peers
2 NPL ratio consistently below sector & comfortable provisioning preserved
NPL Ratio
3.0% 80.2% 145% Garanti
3.3% 77%
Total Cash Coverage
Cumulative Net Total Cost of Risk (Comparable)2 Coverage
98bps
90-115bps
15.6% 10.6% Garanti
+17bps -27bps
(2Q16)
TL Loan Yields
TL Deposit Costs
1 Excludes non-recurring items when annualizing Net Income for the last quarter of the year in calculating Return On Average Equity (ROAE) and Return On Average Assets (ROAA) 2 Excludes the effect of collateral re-assessment (TL78mn in 9M16) and several files booked as NPL in 3Q (TL146mn) which are not included in the Operating Plan.
Quarterly NIM Qtr. NIM inc. Swap Costs Cum. NIM Cum. NIM inc.
Swap Costs

Investor Relations / BRSA Bank-only Earnings Presentation 9M16 Investor Relations / BRSA Bank-only Earnings Presentation 9M16
5
WHAT LIES BENEATH… Net Income:
TL3,911mn ROAE1 :
16.0% ROAA1 :
2.0%
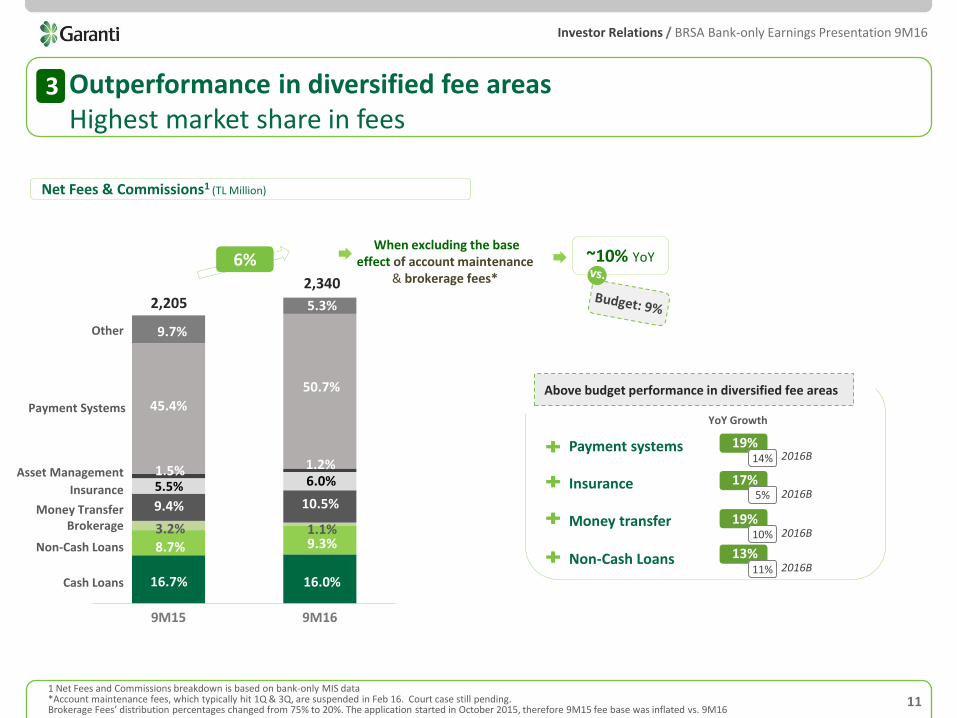
Net Fees & Commissions Growth
+6% YoY
3 Outperformance in diversified fee areas -- highest market share in fees
When excluding the base effect due to account
maintenance & brokerage fees
9% YoY
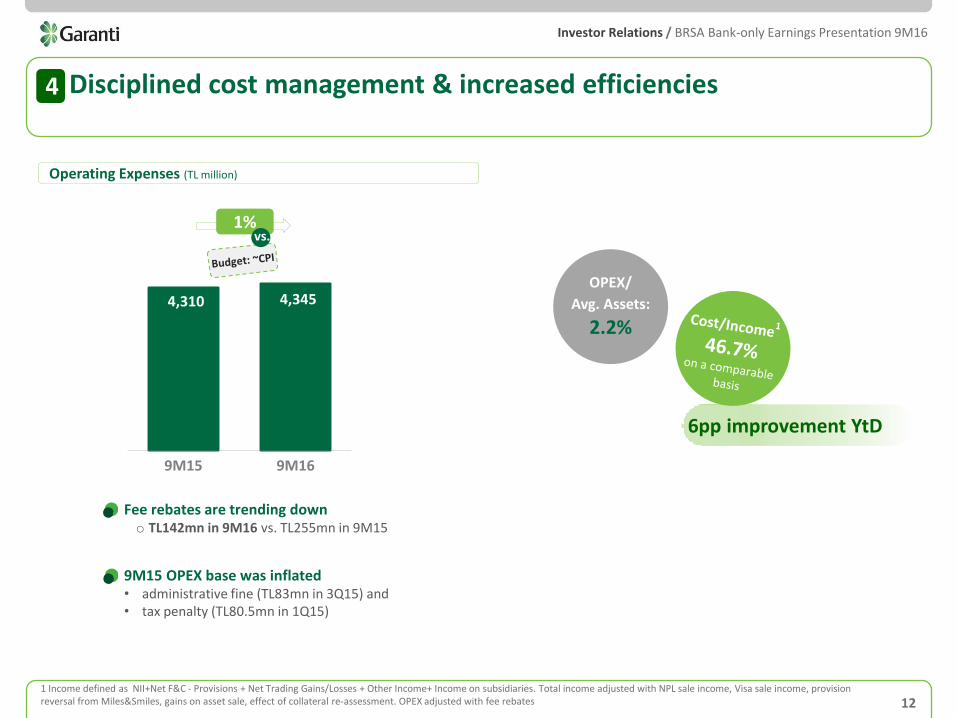
4 Disciplined cost management & increased efficiencies
OPEX Growth Cost/ Income Improvement2
6pp YtD +1% YoY
~CPI YoY
Garanti 16.4% +136bps CAR
15.4%
CET-I
5 Further strengthened capital -- highest CET-I in the sector
+124bps
1 Excludes non-recurring items when annualizing Net Income for the last quarter of the year in calculating Return On Average Equity (ROAE) and Return On Average Assets (ROAA) 2 On a comparable basis. Income defined as NII+Net F&C - Provisions + Net Trading Gains/Losses + Other Income+ Income on subsidiaries. Total income adjusted with NPL sale income, Visa sale income, provision reversal from Miles&Smiles, gain from asset sale, effect of collateral re-assessment. OPEX adjusted with fee rebates
9M15 brokerage bazını %20’ye getirerek hesaplayınca 3pp etki; Account maint. 200 milyon alacaktık 9M16’da diyip, gerçekleşen eksi +200 yapınca 5pp çıkıyor
~10% YoY
Investor Relations / BRSA Bank-only Earnings Presentation 9M16 Investor Relations / BRSA Bank-only Earnings Presentation 9M16
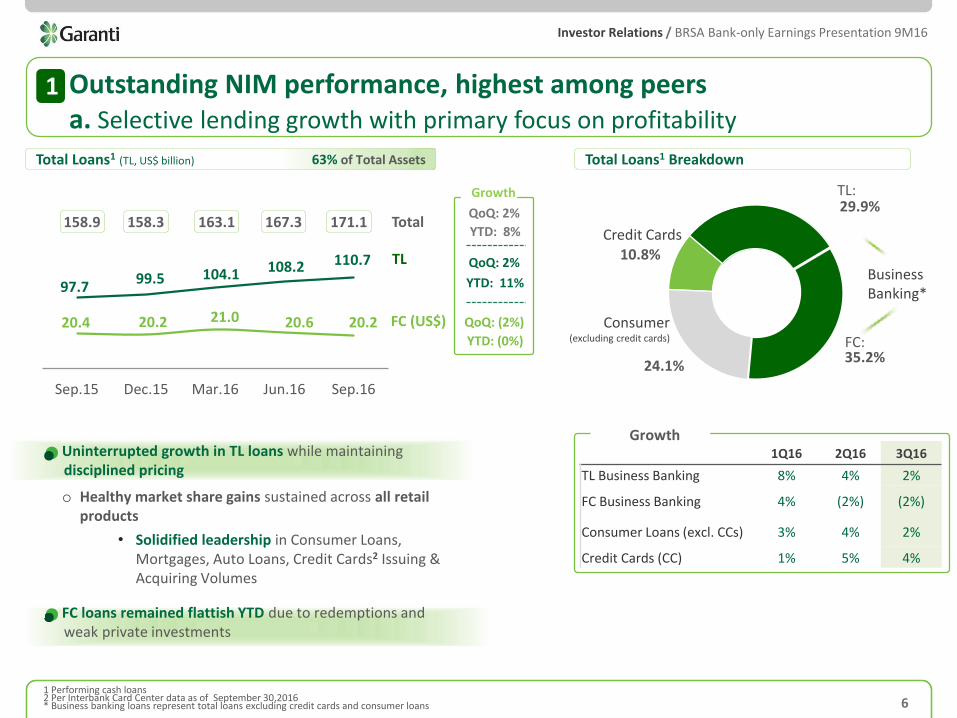
o Healthy market share gains sustained across all retail products
• Solidified leadership in Consumer Loans, Mortgages, Auto Loans, Credit Cards2 Issuing & Acquiring Volumes
97.7 99.5 104.1 108.2 110.7
20.4 20.2 21.0 20.6 20.2
15.017.019.021.023.025.027.029.0
50.060.070.080.090.0
100.0110.0
Sep.15 Dec.15 Mar.16 Jun.16 Sep.16
63% of Total Assets
10.8%
29.9%
35.2% 24.1%
TL (% in total) 64% 62% 63% 64% 65%
FC (% in total) 36% 38% 37% 36% 35%
US$/TL 2.655 3.005 2.908 2.812 2.871
19.9 20.4 20.2 21.0 20.6
1H15 3Q15 2015 1Q16 1H16
3%
6 1 Performing cash loans 2 Per Interbank Card Center data as of September 30,2016 * Business banking loans represent total loans excluding credit cards and consumer loans
2% 4%
(1%)
95.4 97.7 99.5 104.1 108.2
1H15 3Q15 2015 1Q16 1H16
13%
2%
5% 2%
4%
(2%)
9%
TL Loans (TL billion)
FC Loans (USD billion)
Outstanding NIM performance, highest among peers a. Selective lending growth with primary focus on profitability
1
+
FC (US$)
TL
Uninterrupted growth in TL loans while maintaining disciplined pricing
YTD: 11%
QoQ: 2%
YTD: (0%)
QoQ: (2%)
158.9 158.3 163.1 167.3 YTD: 8%
QoQ: 2% Total
Growth
Credit Cards
Consumer (excluding credit cards)
Business Banking*
Total Loans1 Breakdown
FC:
TL:
Total Loans1 (TL, US$ billion)
1Q16 2Q16 3Q16
TL Business Banking 8% 4% 2%
FC Business Banking 4% (2%) (2%)
Consumer Loans (excl. CCs) 3% 4% 2%
Credit Cards (CC) 1% 5% 4%
Growth
171.1
FC loans remained flattish YTD due to redemptions and weak private investments
shrinkage due to muted investments
Investor Relations / BRSA Bank-only Earnings Presentation 9M16 Investor Relations / BRSA Bank-only Earnings Presentation 9M16
7
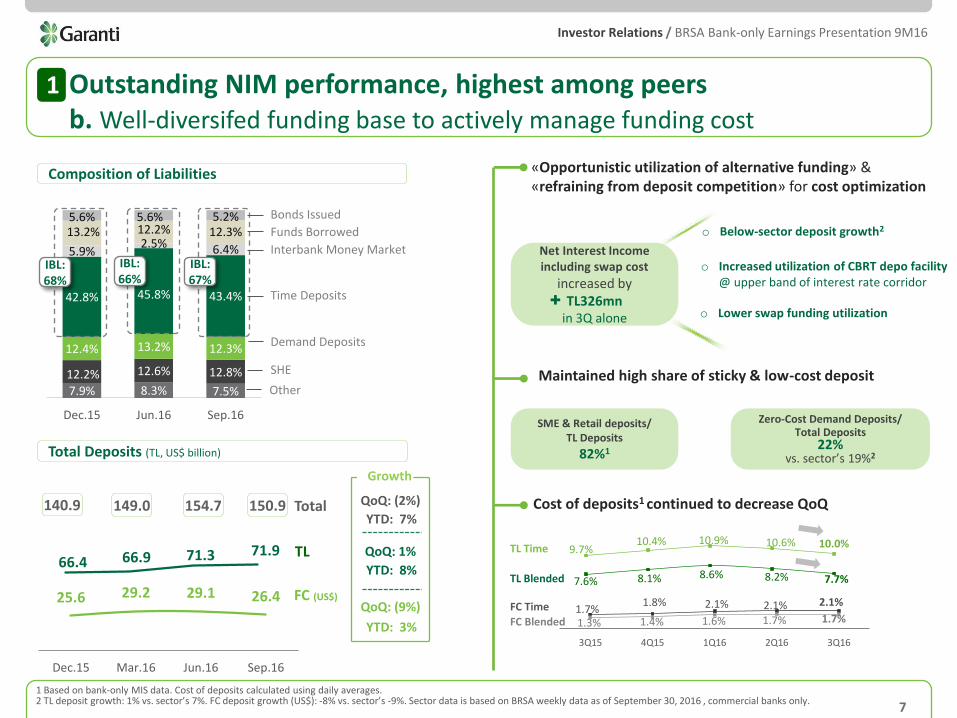
Outstanding NIM performance, highest among peers b. Well-diversifed funding base to actively manage funding cost
1
Composition of Liabilities
Total Deposits (TL, US$ billion)
TL Time down by ~60bps TL Blended down by ~50bps
FC Time: Flattish FC Blended flattish
66.4 66.9 71.3 71.9
149.0 154.7
FC (US$)
TL
Total
YTD: 3%
QoQ: (9%)
YTD: 8%
QoQ: 1%
YTD: 7%
QoQ: (2%)
Growth
150.9
25.6 29.2 29.1 26.4
Dec.15 Mar.16 Jun.16 Sep.16
1
140.9
7.9% 8.3% 7.5%
12.2% 12.6% 12.8%
12.4% 13.2% 12.3%
42.8% 45.8% 43.4%
5.9% 2.5% 6.4%
13.2% 12.2% 12.3% 5.6% 5.6% 5.2%
Dec.15 Jun.16 Sep.16
Funds Borrowed
Interbank Money Market
Other
SHE
Demand Deposits
Bonds Issued
Time Deposits
IBL: 67%
IBL: 68%
IBL: 66%
o Below sector deposit growth in 3Q: TL deposits: 1% QoQ vs. sector’s 7%
FC deposits: (9%) QoQ vs. sector’s (8%)
9.7% 10.4% 10.9% 10.6% 10.0%
7.6% 8.1% 8.6% 8.2% 7.7%
1.7% 1.8% 2.1% 2.1% 2.1%
1.3% 1.4% 1.6% 1.7% 1.7%
3Q15 4Q15 1Q16 2Q16 3Q16
«Opportunistic utilization of alternative funding» & «refraining from deposit competition» for cost optimization
Maintained high share of sticky & low-cost deposit
SME & Retail deposits/ TL Deposits
82%1
Zero-Cost Demand Deposits/ Total Deposits
22% vs. sector’s 19%2
Cost of deposits1 continued to decrease QoQ
TL Time
TL Blended
FC Time
FC Blended
o Below-sector deposit growth2
Net Interest Income including swap cost
increased by TL326mn
in 3Q alone
o Increased utilization of CBRT depo facility @ upper band of interest rate corridor
o Lower swap funding utilization
1 Based on bank-only MIS data. Cost of deposits calculated using daily averages. 2 TL deposit growth: 1% vs. sector’s 7%. FC deposit growth (US$): -8% vs. sector’s -9%. Sector data is based on BRSA weekly data as of September 30, 2016 , commercial banks only.
Investor Relations / BRSA Bank-only Earnings Presentation 9M16 Investor Relations / BRSA Bank-only Earnings Presentation 9M16
52bps
Quarterly NIM
503 518 Loans
Securities Deposits Repos
2Q 16
NIM 3Q 16
NIM
Other Interest Income Items
+25 +3 +2 +2 -13
Funds Borrowed
& Bond issuance
Other Interest
Exp. Items
0 -4
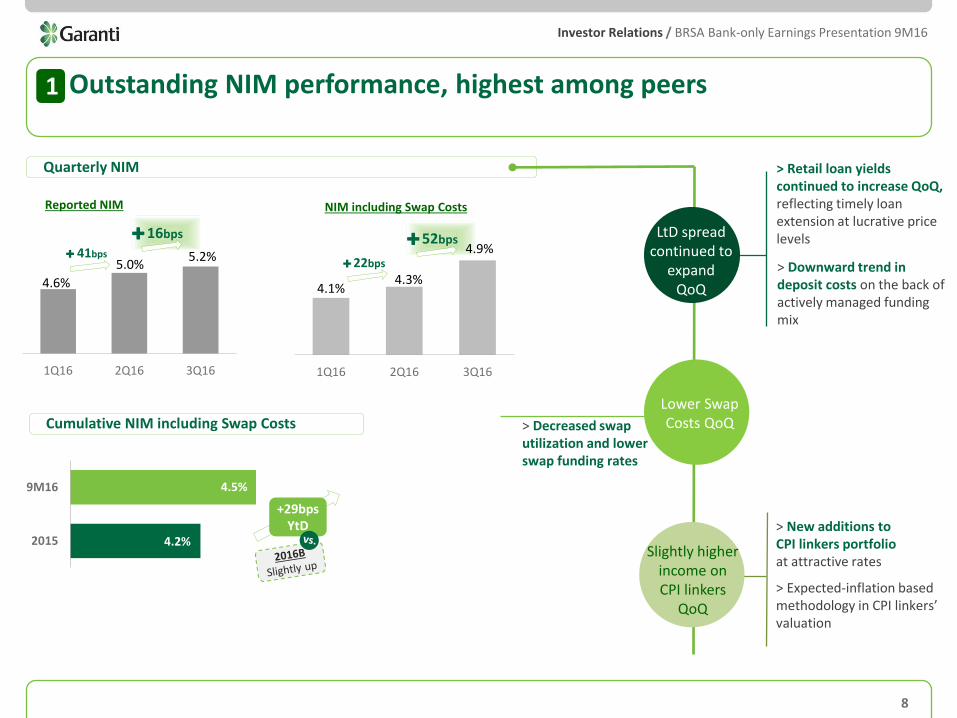
Outstanding NIM performance, highest among peers
8
4.6%
5.0% 5.2%
1Q16 2Q16 3Q16
2Q16 vs. 1Q16 Margin Evolution (in bps)
Reported NIM
1
Cumulative NIM including Swap Costs
4.2%
4.5%
2015
9M16
+29bps YtD
22bps
NIM including Swap Costs
Upward trend in LtD spread continued
• Retail loan yields continue to increase QoQ reflecting timely loan extension at lucrative price levels
• Downward trend in deposit costs continued on the back of actively managed funding mix
Lower swap costs
• Decreased swap utilization and lower rates led to a decline in swap costs QoQ
Flattish yield on CPI
linkers
• CPI linkers’ income will be flat vs. 3Q due to expected-inflation based valuation methodology
Maintained upward
trend in LtD spread
Lower Swap Cost
Slightly higher income on CPI linkers
> Retail loan yields continue to increase QoQ, reflecting timely loan extension at lucrative price levels
> Downward trend in deposit costs continued on the back of actively managed funding mix
> Decreased swap utilization and lower rates led to a decline in swap costs QoQ
> New additions to CPI linkers’ portfolio at attractive rates resulted in increase in quarterly income
> Expected-inflation based methodology in CPI linkers’ valuations
16bps
41bps
4.1% 4.3%
4.9%
1Q16 2Q16 3Q16
LtD spread continued to
expand QoQ
Lower Swap Costs QoQ
Slightly higher income on CPI linkers
QoQ
> Retail loan yields continued to increase QoQ, reflecting timely loan extension at lucrative price levels
> Downward trend in deposit costs on the back of actively managed funding mix
> Decreased swap utilization and lower swap funding rates
> New additions to CPI linkers portfolio at attractive rates
> Expected-inflation based methodology in CPI linkers’ valuation
Investor Relations / BRSA Bank-only Earnings Presentation 9M16 Investor Relations / BRSA Bank-only Earnings Presentation 9M16
9
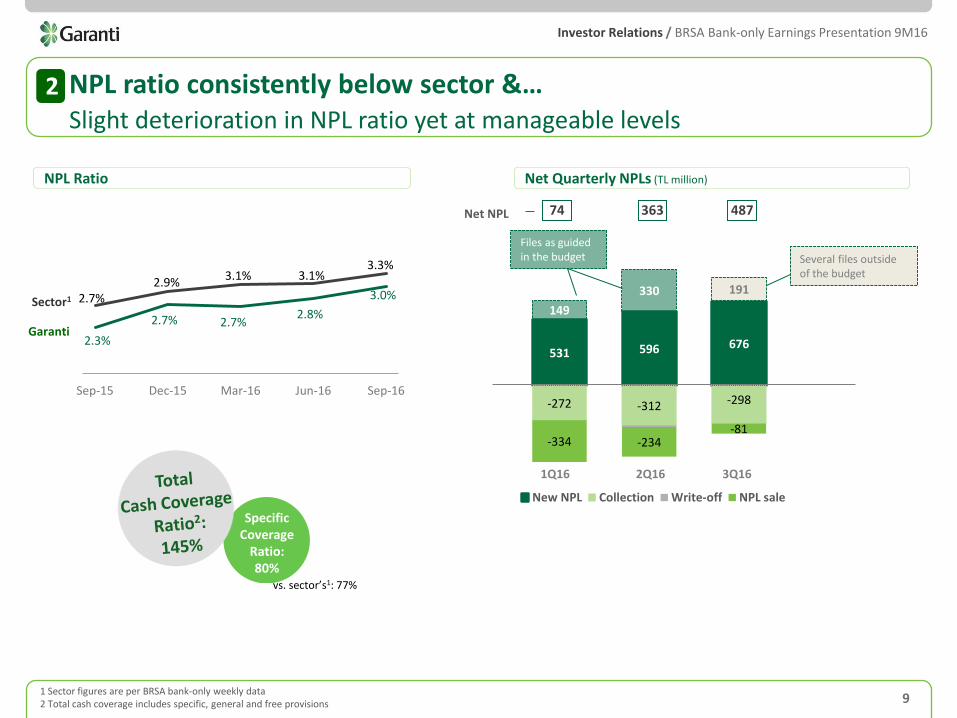
Sector NPL ratios in retail banking & credit cards veiled by heavy NPL sales
Sector1
Garanti
2.7% 2.9%
3.1% 3.1% 3.3%
2.3%
2.7% 2.7% 2.8%
3.0%
Sep-15 Dec-15 Mar-16 Jun-16 Sep-16
NPL Ratio Net Quarterly NPLs (TL million)
Specific Coverage
Ratio: 80%
vs. sector’s1: 77%
469 518
904
531
926
149
0
-220 -306 -306*
-272 -267 0
-234
New NPL Collection Write-off NPL sale
1H15 3Q15 4Q15 1Q16 1H16
249 94 648 74 Net NPL 363
1 Sector figures are per BRSA bank-only weekly data 2 Total cash coverage includes specific, general and free provisions
Files as guided in the Operating Plan
531 596 676
149
330 191
-272 -312 -298
-334 -234 -81
New NPL Collection Write-off NPL sale
74
Files as guided in the budget
363
NPL ratio consistently below sector &… Slight deterioration in NPL ratio yet at manageable levels
2
487
Several files outside of the budget
1Q16 2Q16 3Q16
Net NPL
Investor Relations / BRSA Bank-only Earnings Presentation 9M16 Investor Relations / BRSA Bank-only Earnings Presentation 9M16
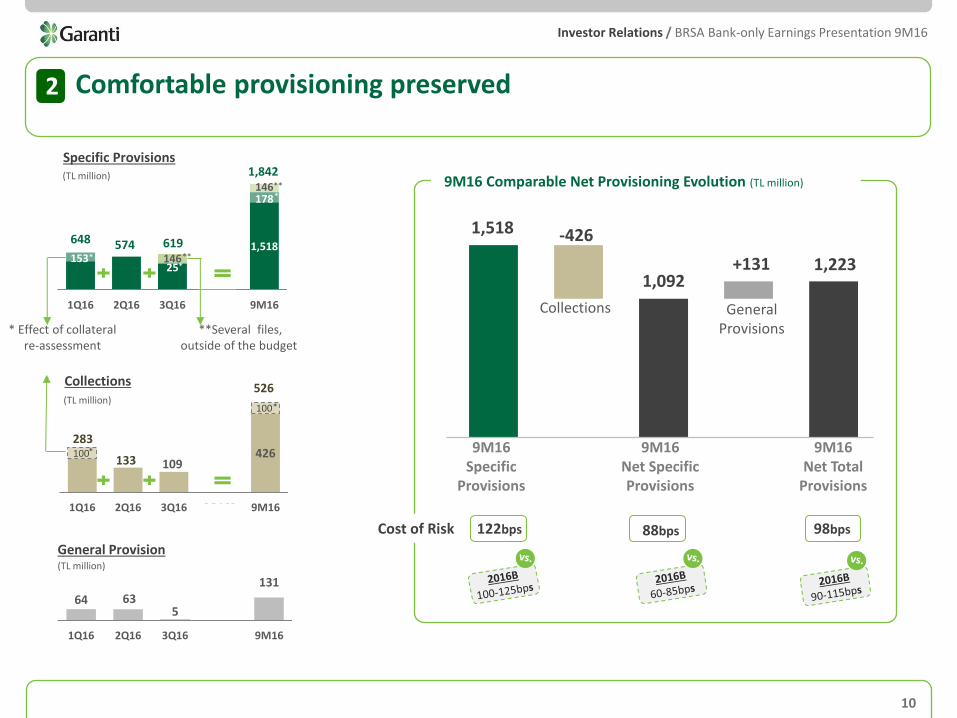
**Several files, outside of the budget
10
86bps: MtM Gains 167bps: Currency Effect 29bps: Dividend Payment
1,518 153
25
178
146
146
1Q16 2Q16 3Q16 4Q16 9M16
Specific Provisions
648
* Effect of collateral re-assessment
General Provision
64 63 5
131
1Q16 2Q16 3Q16 4Q16 9M16
1,518
1,092 1,223
-426
+131
9M16 Specific
Provisions
Collections
9M16 Net Specific Provisions
9M16 Net Total
Provisions
General Provisions
122bps 88bps 98bps Cost of Risk
574
1,842
Comfortable provisioning preserved 2
(TL million)
(TL million)
619
Collections
109 426
1Q16 2Q16 3Q16 3Q162 9M16
283 100 *
100 *
133
526 (TL million)
* ** *
TL Million 1Q16 2Q16 3Q16 9M16
Specific Provisions 648 574 619 1,842
(-) Effect of collateral re-assessment 153 0 25 178
(-) Provision for several commercial files, outside of the OP 0 0 146 146
Comparable Specific Provisions 495 574 449 1,518
Collections 283 133 109 526
(-) Effect of collateral re-assessment 100 0 0 100
Comparable Collections 183 133 109 426
General Provisions 64 63 5 131
** *
b.Pressure on cost of risk was limited despite inflows outside of the budget
TL100mn of additional free provision has been set aside in 3Q16 in a prudent manner. Total free provision reached TL300mn
9M16 Comparable Net Provisioning Evolution (TL million)
Investor Relations / BRSA Bank-only Earnings Presentation 9M16 Investor Relations / BRSA Bank-only Earnings Presentation 9M16
9M15 9M16
10.5%
1.1%
16.7%
8.7% 3.2%
9.4%
5.5% 1.5%
45.4%
9.7%
16.0%
9.3%
6.0% 1.2%
50.7%
5.3%
11
Net Fees & Commissions1 (TL Million) Digital channels taking a more prominent role
In non-cash Financial Transactions, Online Banking share: XX% Mobile Banking share: XX% ATM share: XX%
Banking Service fees driven via digital channels make up ~XX% & is on an increasing trend
4.4 million digital customers with 24% YoY increase
2,205 2,340
Higher than expected growth performance in fees veiled by the base effects
o Brokerage Fees’ distribution percentages changed from 75% to 20%. The application started in October 2015, therefore 9M15 fee base was inflated vs. 9M16
3 million mobile banking customers with 56% YoY increase
1 Net Fees and Commissions breakdown is based on bank-only MIS data *Account maintenance fees, which typically hit 1Q & 3Q, are suspended in Feb 16. Court case still pending. Brokerage Fees’ distribution percentages changed from 75% to 20%. The application started in October 2015, therefore 9M15 fee base was inflated vs. 9M16
o Account maintenance fees, which typically hit 1Q &
3Q, are suspended in Feb 16. Court case still pending.
Outperformance in diversified fee areas Highest market share in fees 3
Non-Cash Loans
Payment systems
YoY Growth
Money transfer
Insurance
Above budget performance in diversified fee areas
Cash Loans
Non-Cash Loans
Brokerage Money Transfer
Insurance
Asset Management
Payment Systems
Other
2016B
2016B 14%
2016B 19%
10%
13%
2016B 17%
5%
11%
19%
~10% YoY When excluding the base
effect of account maintenance & brokerage fees*
6%
o Brokerage Fees’ distribution percentages changed from 75% to 20%. The application started in October 2015, therefore 9M15 fee base was inflated vs. 9M16
o Account maintenance fees, which typically hit 1Q &
3Q, are suspended in Feb 16. Court case still pending.
Etkiyi 14% buluyorum, hesaplama updated Net F&C da en alt satırda
var. Ama çok yüksek olduğu ve upside risk var imajı çizmemek için >10 yazdım, hatta o yüzden her iki kalemin etkisini gösteren önceki
sunumlardaki gösterimi kaldırdım. Eğer bu şekilde ok ise baş tarafta
değişecek!!!
Investor Relations / BRSA Bank-only Earnings Presentation 9M16 Investor Relations / BRSA Bank-only Earnings Presentation 9M16
Non-HR costs continue to be pressured by;
Comparable growth:
17%
HR costs increased due to;
Operating Expenses (TL million)
Impairment losses due to revaluation of fixed assets
12 1 Income defined as NII+Net F&C - Provisions + Net Trading Gains/Losses + Other Income+ Income on subsidiaries. Total income adjusted with NPL sale income, Visa sale income, provision reversal from Miles&Smiles, gains on asset sale, effect of collateral re-assessment. OPEX adjusted with fee rebates
OPEX/
Avg. Assets:
2.2%
Cost/Income ratio improved by
6.5% on reported basis
> Faring below budget
Fee rebates are trending down o TL142mn in 9M16 vs. TL255mn in 9M15
9M15 OPEX base was inflated • administrative fine (TL83mn in 3Q15) and • tax penalty (TL80.5mn in 1Q15)
Disciplined cost management contributing to increased efficiencies
Disciplined cost management & increased efficiencies 4
6pp improvement YtD
1% vs.
4,310 4,345
9M15 9M16

Investor Relations / BRSA Bank-only Earnings Presentation 9M16 Investor Relations / BRSA Bank-only Earnings Presentation 9M16
15.0% 16.3% 16.4%
14.1% 15.2% 15.4%
14.1% 15.2% 15.3%
Dec.15 Jun.16 Sep.16
CAR Common Equity Tier-I Total Tier-I
13
Capital Adequacy Ratios
CET-1 capital share in total:
94%
Dividend Payment: 26 bps YtD
Regulation Impact1: 44 bps YtD
Currency Impact: 16 bps YtD
MtM Difference: 13 bps YtD
Highest CET-I ratio3:
among peers
Further strengthened capital -- highest CET-I in the sector Capital generative growth strategy absorbing adverse effects on capital 5
CAR: 9.1%
Required Capital Levels4
CET-I: 5.6%
1 New capital regulations on free reserves, FC RR, unsecured loan and mortgage risk weightings, effective as of March 31, 2016. Impact calculated as of March 31 2016. 2 BRSA monthly data as of Aug2016, for commercial banks only 3 Among peers as of June 30, 2016 4 Required CAR (9.13%) = 8.0% + SIFI Buffer for Group 3 (0.5%) + Capital Conservation Buffer (0.625%) + Counter Cyclical Buffer (0.008%) Required CET-I (5.63%) = 4.5% + SIFI Buffer for Group 3 (0.5%) + Capital Conservation Buffer (0.625%) + Counter Cyclical Buffer (0.008%)
19 bps 20 bps 20 bps
vs.
• CAR up by 136bps YtD • CET1 up by 124bps YtD
Capital generative growth absorbing adverse effects
on capital
Investor Relations / BRSA Bank-only Earnings Presentation 9M16 Investor Relations / BRSA Bank-only Earnings Presentation 9M16
Appendix
14
Pg. 16 Composition of Assets and Liabilities
Pg. 15 Summary Balance Sheet
Pg. 17 Securities portfolio
Pg. 21 Summary P&L
Pg. 18 Retail Loans
Pg. 22 Key Financial Ratios
Pg. 19 External Debt Pg. 20 Normalized Net Income
Investor Relations / BRSA Bank-only Earnings Presentation 9M16 Investor Relations / BRSA Bank-only Earnings Presentation 9M16
15
Income on subsidiaries
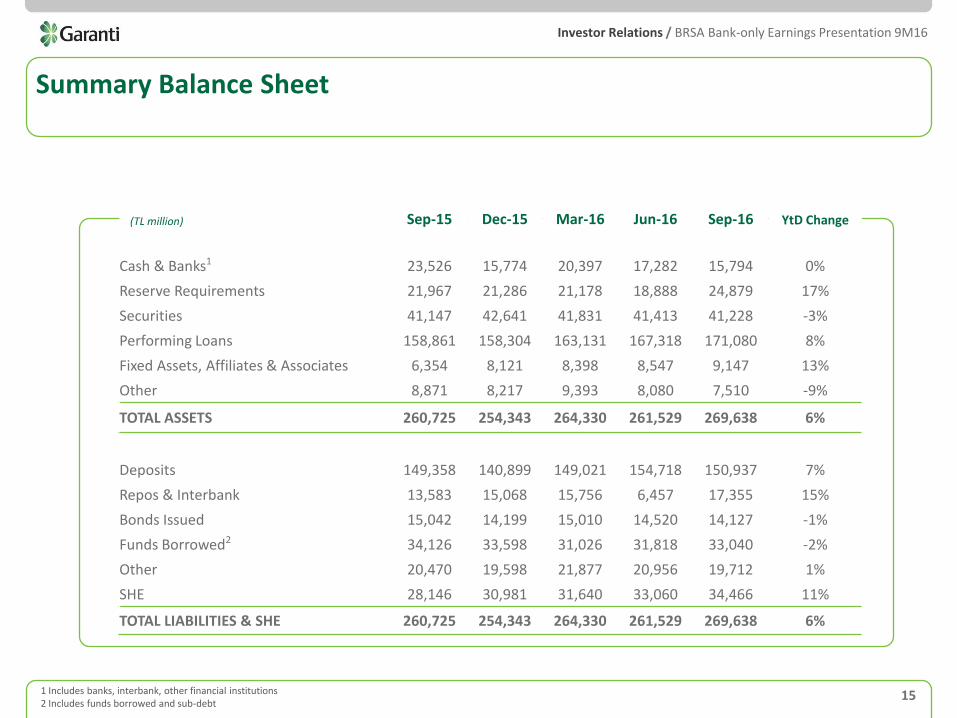
Summary Balance Sheet
1 Includes banks, interbank, other financial institutions 2 Includes funds borrowed and sub-debt
(TL million) Sep-15 Dec-15 Mar-16 Jun-16 Sep-16 YtD Change
Cash & Banks1 23,526 15,774 20,397 17,282 15,794 0%
Reserve Requirements 21,967 21,286 21,178 18,888 24,879 17%
Securities 41,147 42,641 41,831 41,413 41,228 -3%
Performing Loans 158,861 158,304 163,131 167,318 171,080 8%
Fixed Assets, Affiliates & Associates 6,354 8,121 8,398 8,547 9,147 13%
Other 8,871 8,217 9,393 8,080 7,510 -9%
TOTAL ASSETS 260,725 254,343 264,330 261,529 269,638 6%
Deposits 149,358 140,899 149,021 154,718 150,937 7%
Repos & Interbank 13,583 15,068 15,756 6,457 17,355 15%
Bonds Issued 15,042 14,199 15,010 14,520 14,127 -1%
Funds Borrowed2 34,126 33,598 31,026 31,818 33,040 -2%
Other 20,470 19,598 21,877 20,956 19,712 1%
SHE 28,146 30,981 31,640 33,060 34,466 11%
TOTAL LIABILITIES & SHE 260,725 254,343 264,330 261,529 269,638 6%
Investor Relations / BRSA Bank-only Earnings Presentation 9M16 Investor Relations / BRSA Bank-only Earnings Presentation 9M16
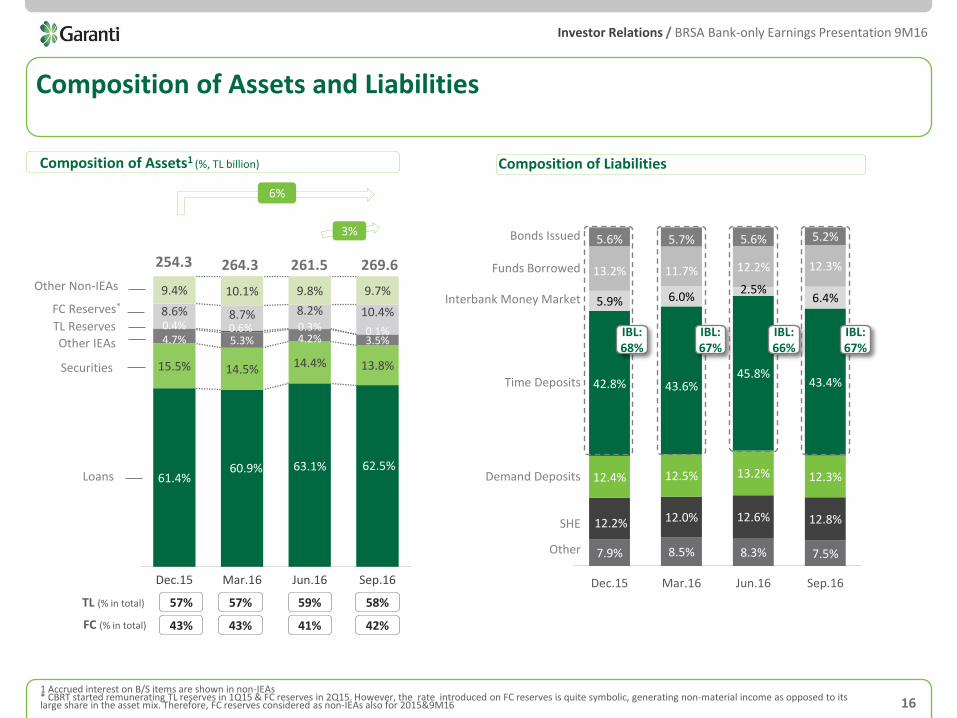
7.9% 8.5% 8.3% 7.5%
12.2% 12.0% 12.6% 12.8%
12.4% 12.5% 13.2% 12.3%
42.8% 43.6% 45.8%
43.4%
5.9% 6.0% 2.5%
6.4%
13.2% 11.7% 12.2% 12.3%
5.6% 5.7% 5.6% 5.2%
Dec.15 Mar.16 Jun.16 Sep.16
FC (% in total)
Composition of Assets and Liabilities
16
61.4% 60.9% 63.1% 62.5%
15.5% 14.5% 14.4% 13.8%
4.7% 5.3% 4.2% 3.5% 0.4% 0.6% 0.3% 0.1%
8.6% 8.7% 8.2% 10.4%
9.4% 10.1% 9.8% 9.7%
Dec.15 Mar.16 Jun.16 Sep.16
Composition of Assets1 (%, TL billion)
Other Non-IEAs
FC Reserves*
TL Reserves
Securities
Loans
254.3
6%
3%
1 Accrued interest on B/S items are shown in non-IEAs * CBRT started remunerating TL reserves in 1Q15 & FC reserves in 2Q15. However, the rate introduced on FC reserves is quite symbolic, generating non-material income as opposed to its large share in the asset mix. Therefore, FC reserves considered as non-IEAs also for 2015&9M16
Other IEAs
TL (% in total)
43%
264.3 261.5 Funds Borrowed
Interbank Money Market
Time Deposits
Other
SHE
Demand Deposits
Bonds Issued
Composition of Liabilities
IBL: 68%
269.6
57%
43%
57%
41%
59%
42%
58%
IBL: 67%
IBL: 66%
IBL: 67%

Investor Relations / BRSA Bank-only Earnings Presentation 9M16 Investor Relations / BRSA Bank-only Earnings Presentation 9M16
Sep.15 Dec.15 Mar.16 Jun.16 Sep.16
74%
27% 26%
Sep.15 Dec.15 Mar.16 Jun.16 Sep.16
TL FC
73% Trading 0.3%
AFS 46.9%
HTM 52.8%
Sep.15 Dec.15 Mar.16 Jun.16 Sep.16
Total Securities (TL billion)
CPI: 47%
Other FRNs: 28%
TL Securities (TL billion)
FRNs: 8%
FRNs: 8%
FC Securities (US$ billion)
Securities portfolio remains as hedge against volatility
3.8 3.6
5%
CPI: 47%
Other FRNs: 28%
FRNs: 5%
Unrealized MtM loss (pre-tax) ~TL 249mn loss as of September-end vs. ~TL 175mn loss as of June-end, ~TL355mn loss in March-end, ~TL 545mn loss in YE15.
1 Excluding accruals Note: Fixed / Floating breakdown of securities portfolio is based on bank-only MIS data.
74%
Fixed: 95%
Fixed: 92%
Fixed: 93%
Fixed: 25%
Fixed: 25%
26%
17
CPI: 49%
Other FRNs: 29%
Fixed: 22%
FRNs: 8%
Fixed: 92%
30.2
41.1
31.6
4%
42.6
26%
74%
4%
31.2
(1%)
3.8
(1%)
41.8
(2%)
Securities1/Assets:
14% hovering at its
lowest level
(1%)
41.4
(2%)
30.6
CPI: 49%
Other FRNs: 30%
Fixed: 21%
FRNs: 7%
Fixed: 93%
75%
25%
3.8
(1%)
Securities Composition
41.2
0%
30.4
(1%)
CPI: 56%
Other FRNs: 23%
Fixed: 20%
3.6
(4%)
Investor Relations / BRSA Bank-only Earnings Presentation 9M16 Investor Relations / BRSA Bank-only Earnings Presentation 9M16
17.5 17.2 17.7 18.1 18.3
10.3 10.5 11.5 11.7 11.8
Sep.15 Dec.15 Mar.16 Jun.16 Sep.16
5%
51.8 52.6 53.6 55.8 57.2
15.4 15.9 17.0 17.6 17.9
Sep.15 Dec.15 Mar.16 Jun.16 Sep.16
1.4 1.6 1.6 1.8 1.9
2.5 2.6 2.6 2.7 2.7
Sep.15 Dec.15 Mar.16 Jun.16 Sep.16
2.8
Consumer Loans
65.2 67.2
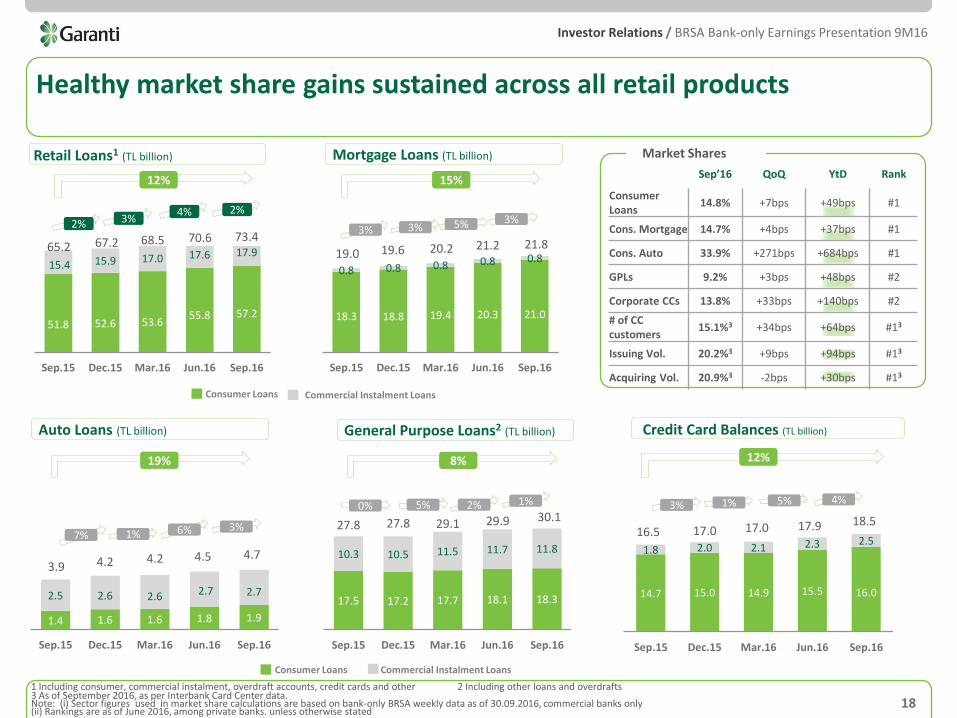
Retail Loans1 (TL billion)
4.2
Auto Loans (TL billion)
4.5
27.8
General Purpose Loans2 (TL billion)
Healthy market share gains sustained across all retail products
18.3 18.8 19.4 20.3 21.0
0.8 0.8 0.8 0.8 0.8
Sep.15 Dec.15 Mar.16 Jun.16 Sep.16
Mortgage Loans (TL billion)
19.6
4%
12%
7%
19% 8%
20.2
6%
3.9
19.0
4.2
15%
27.8
Commercial Instalment Loans
Consumer Loans Commercial Instalment Loans
12%
14.7 15.0 14.9 15.5 16.0
1.8 2.0 2.1 2.3 2.5
Sep.15 Dec.15 Mar.16 Jun.16 Sep.16
17.0 17.0 16.5 17.9
Credit Card Balances (TL billion)
2% 3%
0%
1 Including consumer, commercial instalment, overdraft accounts, credit cards and other 2 Including other loans and overdrafts 3 As of September 2016, as per Interbank Card Center data. Note: (i) Sector figures used in market share calculations are based on bank-only BRSA weekly data as of 30.09.2016, commercial banks only (ii) Rankings are as of June 2016, among private banks. unless otherwise stated
3% 3% 5%
18
68.5
3%
70.6 21.2
29.1 1%
1% 2% 5%
29.9
Sep’16 QoQ YtD Rank
Consumer Loans 14.8% +7bps +49bps #1
Cons. Mortgage 14.7% +4bps +37bps #1
Cons. Auto 33.9% +271bps +684bps #1
GPLs 9.2% +3bps +48bps #2
Corporate CCs 13.8% +33bps +140bps #2
# of CC customers
15.1%3 +34bps +64bps #13
Issuing Vol. 20.2%3 +9bps +94bps #13
Acquiring Vol. 20.9%3 -2bps +30bps #13
Market Shares
73.4
2% 3%
21.8
4.7
3%
1%
30.1 18.5
4%
Investor Relations / BRSA Bank-only Earnings Presentation 9M16 Investor Relations / BRSA Bank-only Earnings Presentation 9M16
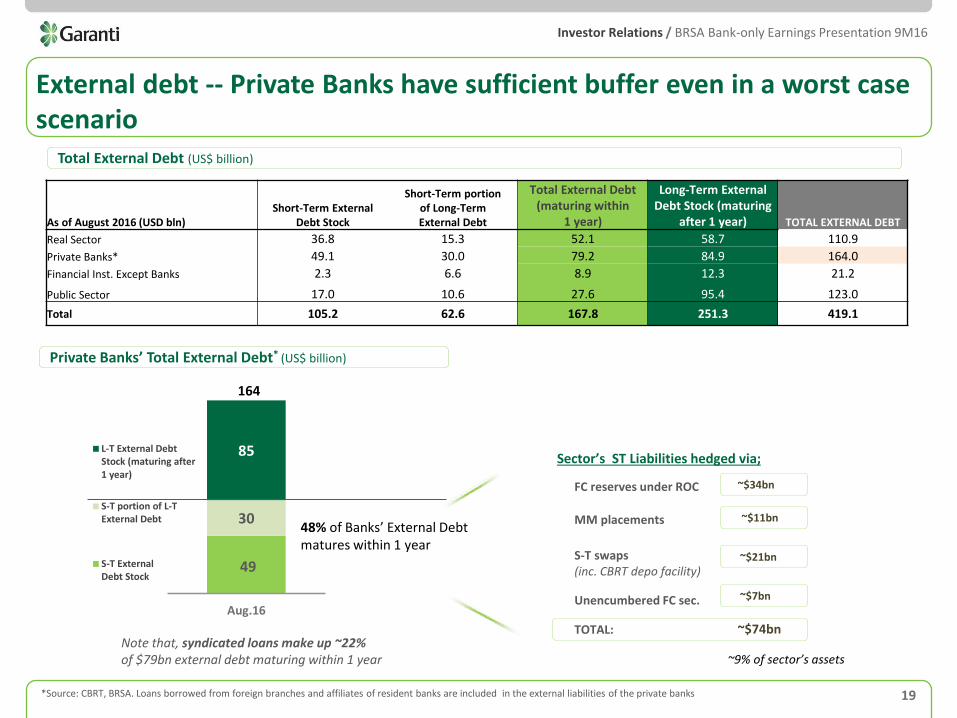
External debt -- Private Banks have sufficient buffer even in a worst case scenario
19 *Source: CBRT, BRSA. Loans borrowed from foreign branches and affiliates of resident banks are included in the external liabilities of the private banks
Private Banks’ Total External Debt* (US$ billion)
Sector’s ST Liabilities hedged via;
FC reserves under ROC ~$34bn
MM placements ~$11bn
S-T swaps (inc. CBRT depo facility)
~$21bn
~$74bn TOTAL:
~9% of sector’s assets
As of August 2016 (USD bln) Short-Term External
Debt Stock
Short-Term portion of Long-Term External Debt
Total External Debt (maturing within
1 year)
Long-Term External Debt Stock (maturing
after 1 year) TOTAL EXTERNAL DEBT
Real Sector 36.8 15.3 52.1 58.7 110.9
Private Banks* 49.1 30.0 79.2 84.9 164.0
Financial Inst. Except Banks 2.3 6.6 8.9 12.3 21.2
Public Sector 17.0 10.6 27.6 95.4 123.0
Total 105.2 62.6 167.8 251.3 419.1
Total External Debt (US$ billion)
Unencumbered FC sec. ~$7bn
49
30
85
Aug.16
L-T External DebtStock (maturing after1 year)
S-T portion of L-TExternal Debt
S-T ExternalDebt Stock
48% of Banks’ External Debt matures within 1 year
164
Note that, syndicated loans make up ~22% of $79bn external debt maturing within 1 year

Investor Relations / BRSA Bank-only Earnings Presentation 9M16 Investor Relations / BRSA Bank-only Earnings Presentation 9M16
20
Income on subsidiaries
Normalized Net Income
TL Million 1Q16 2Q16 3Q16 9M16
Net Income 1,041 1,540 1,331 3,911
Provision reversal due to collateral re-assessment -80 0 0 80
Extra provisions related to collateral re-assessment 122 0 20 -142
Visa sale gain 0 -238 0 238
Income from NPL sale -24 -16 -8 49
Gains from asset sale 0 -14 0 14
Provision reversal from Miles&Smiles 0 -51 0 51
Free provision 0 0 100 -100
Fee rebates 60 52 30 -142
Normalized Net Income 1,119 1,272 1,472 3,863
Investor Relations / BRSA Bank-only Earnings Presentation 9M16 Investor Relations / BRSA Bank-only Earnings Presentation 9M16
21
Income on subsidiaries
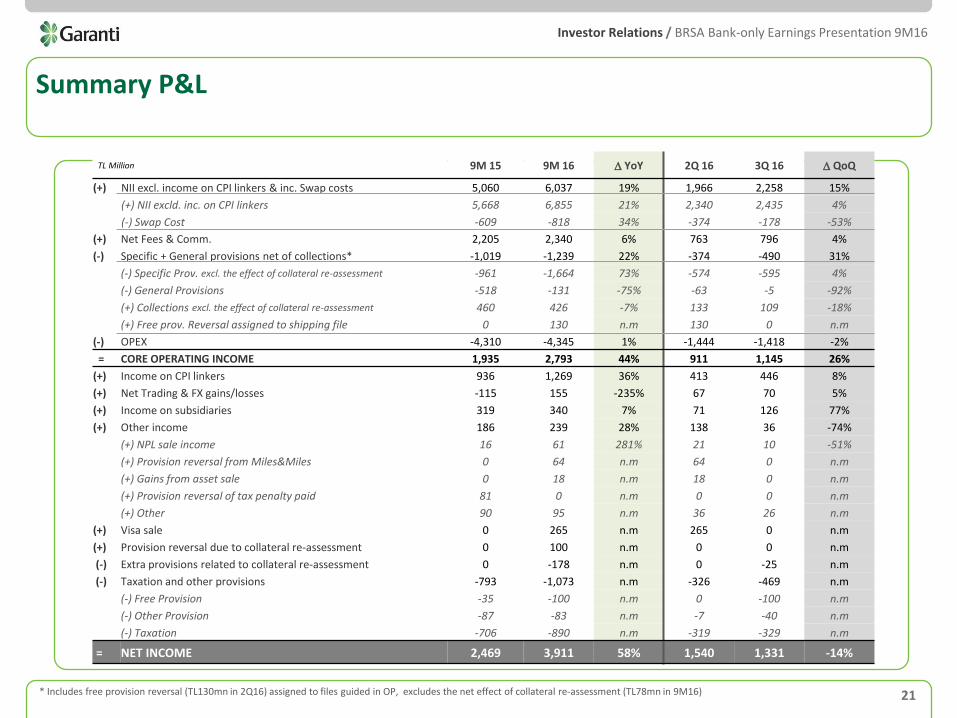
Summary P&L
TL Million 9M 15 9M 16 D YoY 2Q 16 3Q 16 D QoQ
(+) NII excl. income on CPI linkers & inc. Swap costs 5,060 6,037 19% 1,966 2,258 15%
(+) NII excld. inc. on CPI linkers 5,668 6,855 21% 2,340 2,435 4%
(-) Swap Cost -609 -818 34% -374 -178 -53%
(+) Net Fees & Comm. 2,205 2,340 6% 763 796 4%
(-) Specific + General provisions net of collections* -1,019 -1,239 22% -374 -490 31%
(-) Specific Prov. excl. the effect of collateral re-assessment -961 -1,664 73% -574 -595 4%
(-) General Provisions -518 -131 -75% -63 -5 -92%
(+) Collections excl. the effect of collateral re-assessment 460 426 -7% 133 109 -18%
(+) Free prov. Reversal assigned to shipping file 0 130 n.m 130 0 n.m
(-) OPEX -4,310 -4,345 1% -1,444 -1,418 -2%
= CORE OPERATING INCOME 1,935 2,793 44% 911 1,145 26%
(+) Income on CPI linkers 936 1,269 36% 413 446 8%
(+) Net Trading & FX gains/losses -115 155 -235% 67 70 5%
(+) Income on subsidiaries 319 340 7% 71 126 77%
(+) Other income 186 239 28% 138 36 -74%
(+) NPL sale income 16 61 281% 21 10 -51%
(+) Provision reversal from Miles&Miles 0 64 n.m 64 0 n.m
(+) Gains from asset sale 0 18 n.m 18 0 n.m
(+) Provision reversal of tax penalty paid 81 0 n.m 0 0 n.m
(+) Other 90 95 n.m 36 26 n.m
(+) Visa sale 0 265 n.m 265 0 n.m
(+) Provision reversal due to collateral re-assessment 0 100 n.m 0 0 n.m
(-) Extra provisions related to collateral re-assessment 0 -178 n.m 0 -25 n.m
(-) Taxation and other provisions -793 -1,073 n.m -326 -469 n.m
(-) Free Provision -35 -100 n.m 0 -100 n.m
(-) Other Provision -87 -83 n.m -7 -40 n.m
(-) Taxation -706 -890 n.m -319 -329 n.m
= NET INCOME 2,469 3,911 58% 1,540 1,331 -14%
* Includes free provision reversal (TL130mn in 2Q16) assigned to files guided in OP, excludes the net effect of collateral re-assessment (TL78mn in 9M16)
Investor Relations / BRSA Bank-only Earnings Presentation 9M16 Investor Relations / BRSA Bank-only Earnings Presentation 9M16
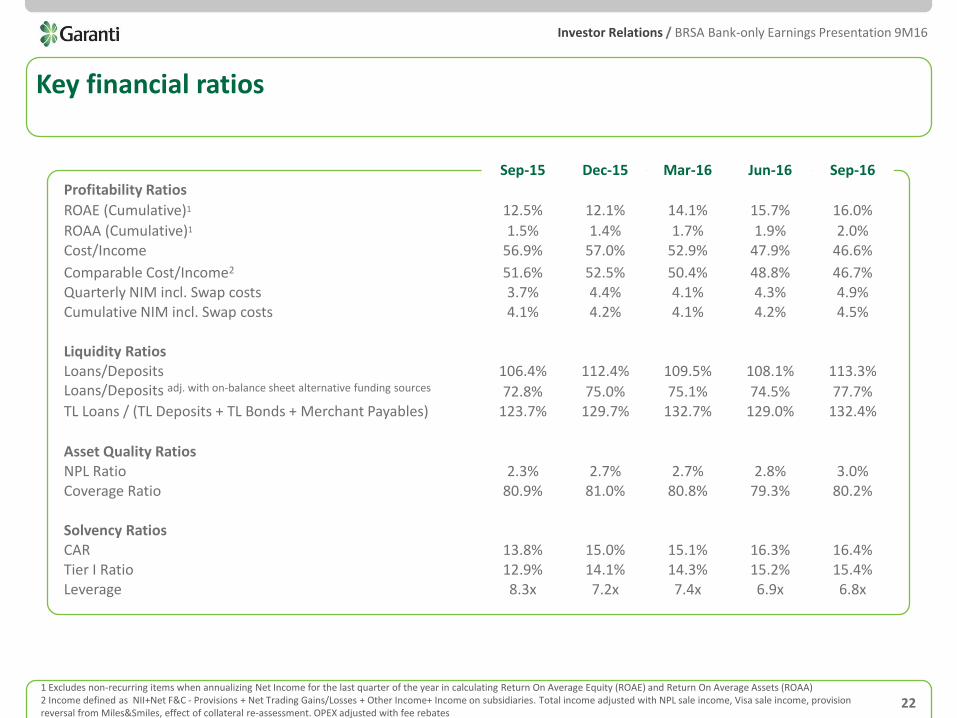
Key financial ratios
22 1 Excludes non-recurring items when annualizing Net Income for the last quarter of the year in calculating Return On Average Equity (ROAE) and Return On Average Assets (ROAA) 2 Income defined as NII+Net F&C - Provisions + Net Trading Gains/Losses + Other Income+ Income on subsidiaries. Total income adjusted with NPL sale income, Visa sale income, provision reversal from Miles&Smiles, effect of collateral re-assessment. OPEX adjusted with fee rebates
Sep-15 Dec-15 Mar-16 Jun-16 Sep-16 Profitability Ratios
ROAE (Cumulative)1 12.5% 12.1% 14.1% 15.7% 16.0%
ROAA (Cumulative)1 1.5% 1.4% 1.7% 1.9% 2.0% Cost/Income 56.9% 57.0% 52.9% 47.9% 46.6%
Comparable Cost/Income2 51.6% 52.5% 50.4% 48.8% 46.7% Quarterly NIM incl. Swap costs 3.7% 4.4% 4.1% 4.3% 4.9% Cumulative NIM incl. Swap costs 4.1% 4.2% 4.1% 4.2% 4.5%
Liquidity Ratios Loans/Deposits 106.4% 112.4% 109.5% 108.1% 113.3% Loans/Deposits adj. with on-balance sheet alternative funding sources 72.8% 75.0% 75.1% 74.5% 77.7% TL Loans / (TL Deposits + TL Bonds + Merchant Payables) 123.7% 129.7% 132.7% 129.0% 132.4%
Asset Quality Ratios NPL Ratio 2.3% 2.7% 2.7% 2.8% 3.0% Coverage Ratio 80.9% 81.0% 80.8% 79.3% 80.2%
Solvency Ratios CAR 13.8% 15.0% 15.1% 16.3% 16.4% Tier I Ratio 12.9% 14.1% 14.3% 15.2% 15.4% Leverage 8.3x 7.2x 7.4x 6.9x 6.8x
Investor Relations / BRSA Bank-only Earnings Presentation 9M16 Investor Relations / BRSA Bank-only Earnings Presentation 9M16
23
Disclaimer Statement
Türkiye Garanti Bankasi A.Ş. (the “TGB”) has prepared this presentation document (the “Document”) thereto for the sole purposes of providing information which include forward looking projections and statements relating to the TGB (the “Information”). No representation or warranty is made by TGB for the accuracy or completeness of the Information contained herein. The Information is subject to change without any notice. Neither the Document nor the Information can construe any investment advise, or an offer to buy or sell TGB shares. This Document and/or the Information cannot be copied, disclosed or distributed to any person other than the person to whom the Document and/or Information delivered or sent by TGB or who required a copy of the same from the TGB. TGB expressly disclaims any and all liability for any statements including any forward looking projections and statements, expressed, implied, contained herein, or for any omissions from Information or any other written or oral communication transmitted or made available.
/garantibankasi
Investor Relations Levent Nispetiye Mah. Aytar Cad. No:2 Beşiktaş 34340 Istanbul – Turkey Email: [email protected] Tel: +90 (212) 318 2352 Fax: +90 (212) 216 5902 Internet: www.garantiinvestorrelations.com
Recommended