Dr. Surya B. ParajuliMBBS(KU), MD(BPKIHS), MARD(TU)
Principles and practice of Epidemiology course (Christian medical college, Vellore)
Health Advocate, Dengue researcher, Snake bite Instructor
11/24/2016
Teaching Learning Method: Lecture
1/24/2016 2
ContentBackground/objective of study
What is Health
Indicator
Characteristics of Indicator
Quality & quantitative indicator Vs Development of Country
Spectrum of Health
Tools of measurements
Types of indicators
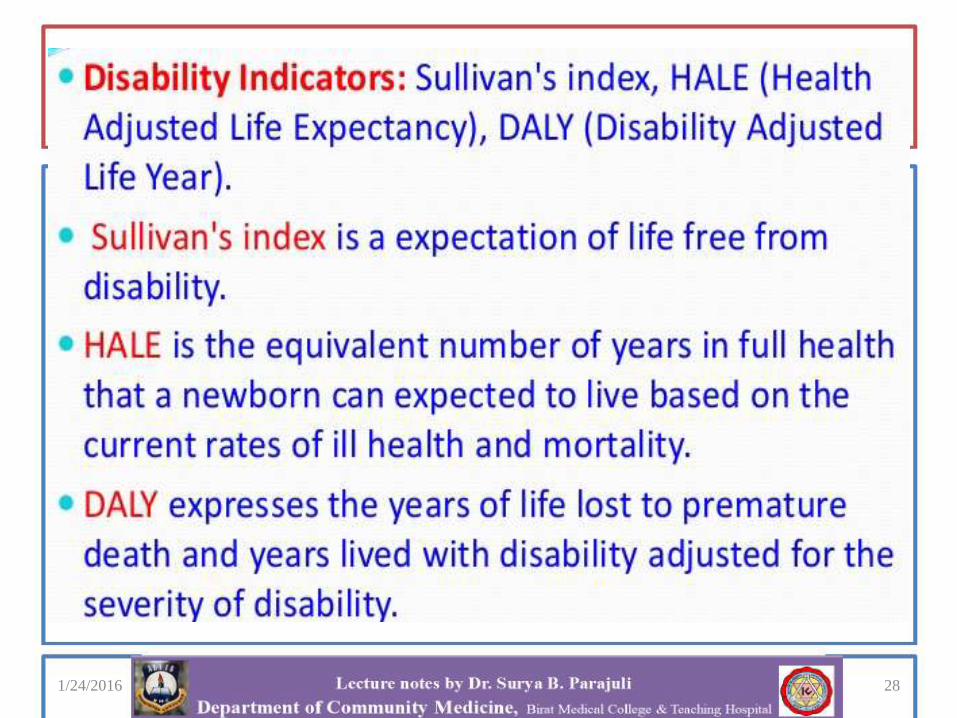
Sullivan’s index
DALY
HFA
UN/ILO
MDG
SDG
Recent trends of indicators
References
Topic: Health Indicator

1/24/2016 3
Background/Objectives of study
Understand the variety of health indicators,
their data sources, their key attributes, context
and use
Describe health indicators
Common health indicators and data sources
How are health indicators used and compiled?Examples of reports and on-line tools

1/24/2016 4
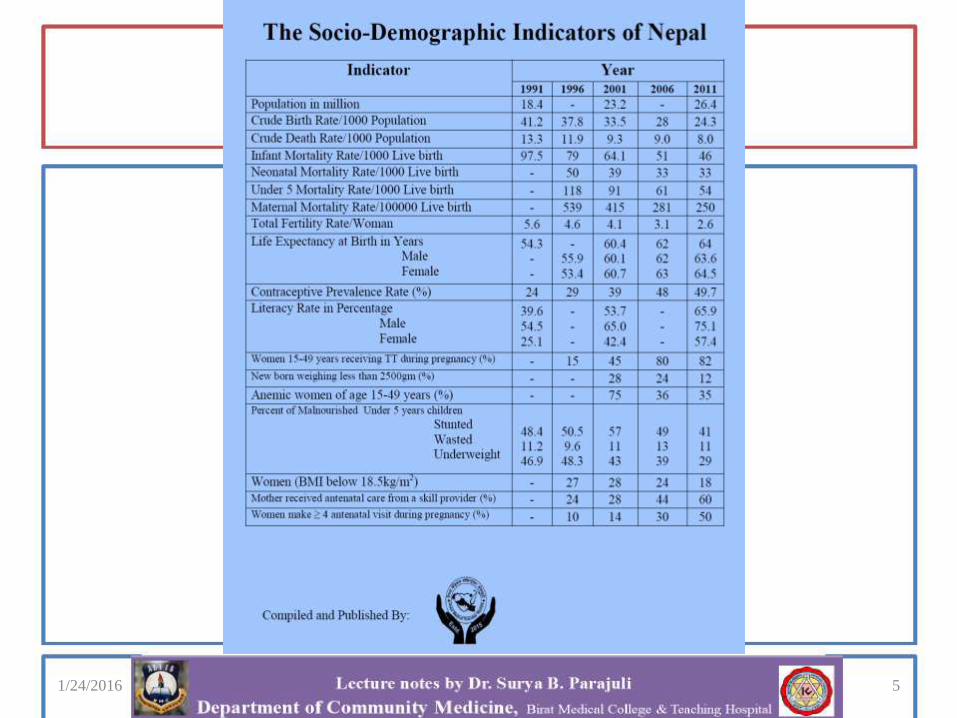
1/24/2016 5

What is Health?
By far, the most accepted definition is that of the World Health Organization:
“[Health is] the state of complete physical, mental and socialwell-being and not merely the absence of disease or infirmity”(WHO, 1948) and the “extent to which an individual or groupis able to realize aspirations and satisfy needs, and to changeor cope with the environment. Health is a resource foreveryday life, not the objective of living; it is a positiveconcept, emphasizing social and personal resources as well as
physical capabilities” (WHO, 1984).
1/24/2016 6
What are Health Indicators? (1)
With the goal of good health in mind, think of
an indicator as
“…a measure that helps quantify the
achievement of a goal.”
-Mark Friedman
1/24/2016 7

What are Health Indicators? (2)
Power of indicators is comparisons
- over time (trends)
- geographic areas
- groups of people
and the focus on the most essential domains of
health.
1/24/2016 8
Terminology concept
Indicator also known as Variable
Amalgamation of health indicators= Health
Index
1/24/2016 9
Characteristics of Indicators
1/24/2016 10
1.Valid
2.Reliable
3.Sensitive
4.Specific
5.Feasible
6.Relevant

1/24/2016 11

1/24/2016 12

Comprehensive Indicator Systems
• Focus on overall Quality of Life with
health being one of many components
(e.g., economy, health, education)
• ExampleSullivan's Index
DALY
1/24/2016 13

Spectrum of Health
1/24/2016 14
Positive Health
Better Health
Freedom from sickness
Unrecognized sickness
Mild sickness
Severe sickness
Death
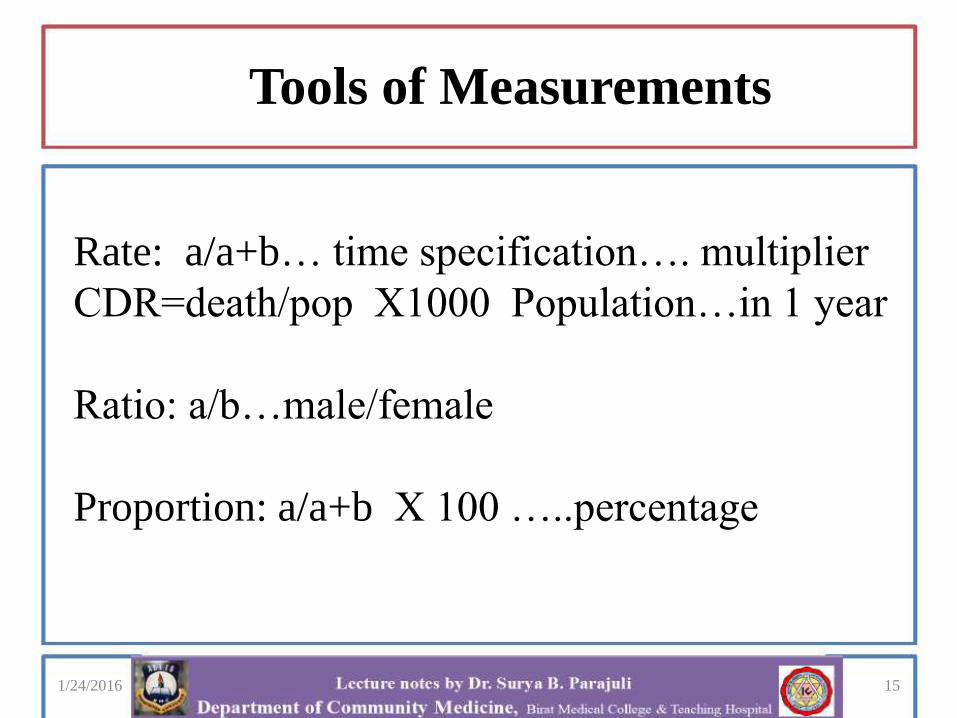
Rate: a/a+b… time specification…. multiplier
CDR=death/pop X1000 Population…in 1 year
Ratio: a/b…male/female
Proportion: a/a+b X 100 …..percentage
1/24/2016 15
Tools of Measurements

Framework for Health Indicators
1/24/2016 16

What makes a good indicator?
• Data Power – high quality, available data
• Proxy Power – central importance to health
• Communication Power – that the meaning is
transparent.
1/24/2016 17

What are the bases for health indicators?
Health indicators are based upon conceptual models for whatinfluences health status, based upon scientific research.
Models have evolved over time, as have definitions of health, but
trace historical improvements in health, e.g., increases in lifeexpectancy, declines in mortality due to infectious diseases.
Context is important: For example, in 1900 the leading causes of
death were Pneumonia, Tuberculosis, and Diarrhea and Enteritis ascompared to Heart Disease, Cancer, and Stroke in 2006.
Source: MMWR. July 30, 1999 / 48(29);621-629
http://www.cdc.gov/nchs/data/nvsr/nvsr57/nvsr57_14.pdf
1/24/2016 18

Current Conceptual Frameworks
Today’s context:•Rate of healthcare spending is unsustainable, and, levels of
spending not consistent with level of health. Ripe opportunities forincreasing the return on investments in health through prevention.
•Burden of chronic diseases (e.g., premature mortality, costs) and
•Complex public health problems (e.g., violence, obesity, HIV), andhealth-related behaviors (e.g., smoking, diet, substance use)
•The influence of social and environmental conditions ondetermining health outcomes, either directly or indirectly
•Deep, persistent disparities in health
1/24/2016 19
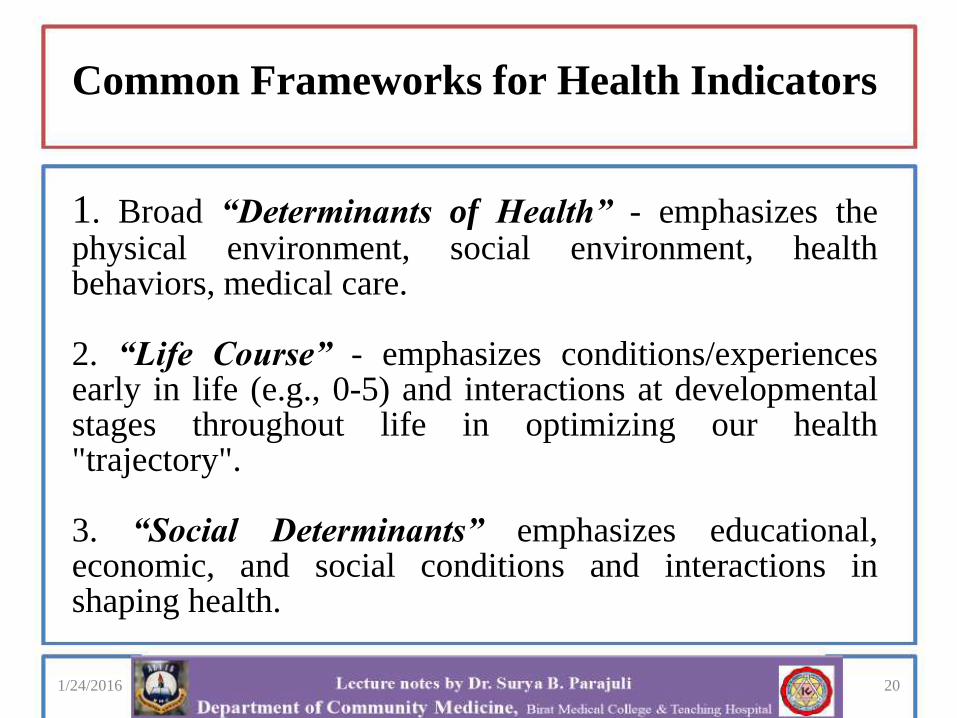
Common Frameworks for Health Indicators
1. Broad “Determinants of Health” - emphasizes thephysical environment, social environment, healthbehaviors, medical care.
2. “Life Course” - emphasizes conditions/experiencesearly in life (e.g., 0-5) and interactions at developmentalstages throughout life in optimizing our health"trajectory".
3. “Social Determinants” emphasizes educational,economic, and social conditions and interactions inshaping health.
1/24/2016 20

How are health indicators used?
Indicators are powerful tools for monitoring and communicating
critical information about population health.
Indicators are used to support planning (identify priorities, develop
and target resources, identify benchmarks) and track progress toward
broad community objectives.
Engagement of partners into civic and collaborative action (build
awareness of problems and trends, generate interventions).
Inform policy and policy makers, and can be used to promote
accountability among governmental and non-governmental agencies.
1/24/2016 21
Who compiles health indicators?
•Reports are compiled at local level
•Regional level - Health departments, businesses,
educational, law enforcement, human services
providers, and other civic leaders, faith
organizations, universities, media.
• National– Government/private partnerships.
• International – WHO, UNICEF
1/24/2016 22
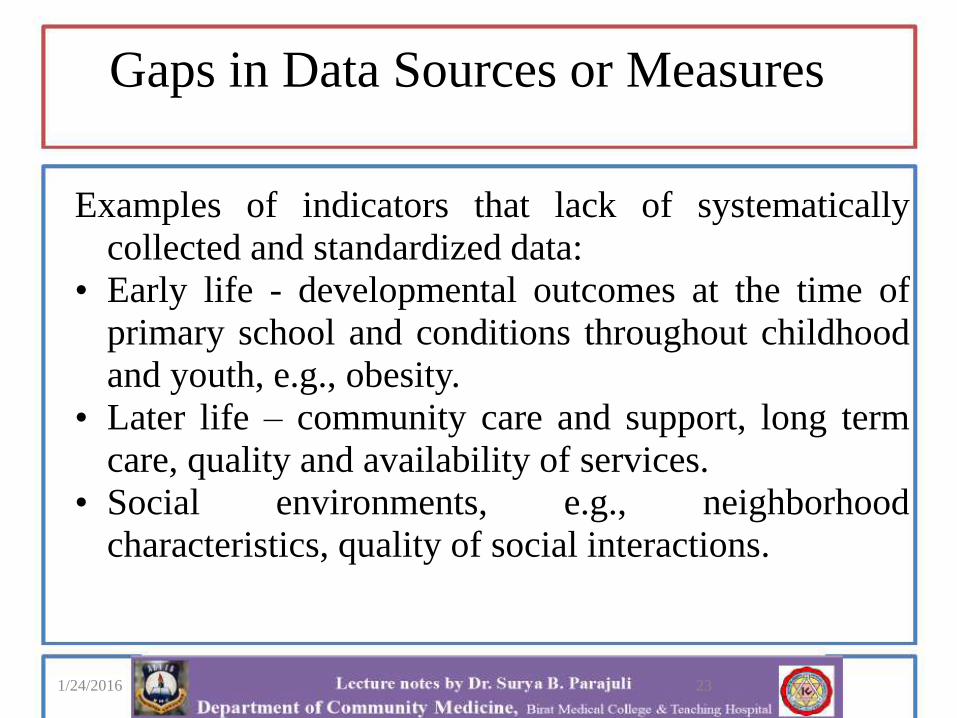
Gaps in Data Sources or Measures
Examples of indicators that lack of systematically
collected and standardized data:
• Early life - developmental outcomes at the time of
primary school and conditions throughout childhood
and youth, e.g., obesity.
• Later life – community care and support, long term
care, quality and availability of services.
• Social environments, e.g., neighborhood
characteristics, quality of social interactions.
1/24/2016 23
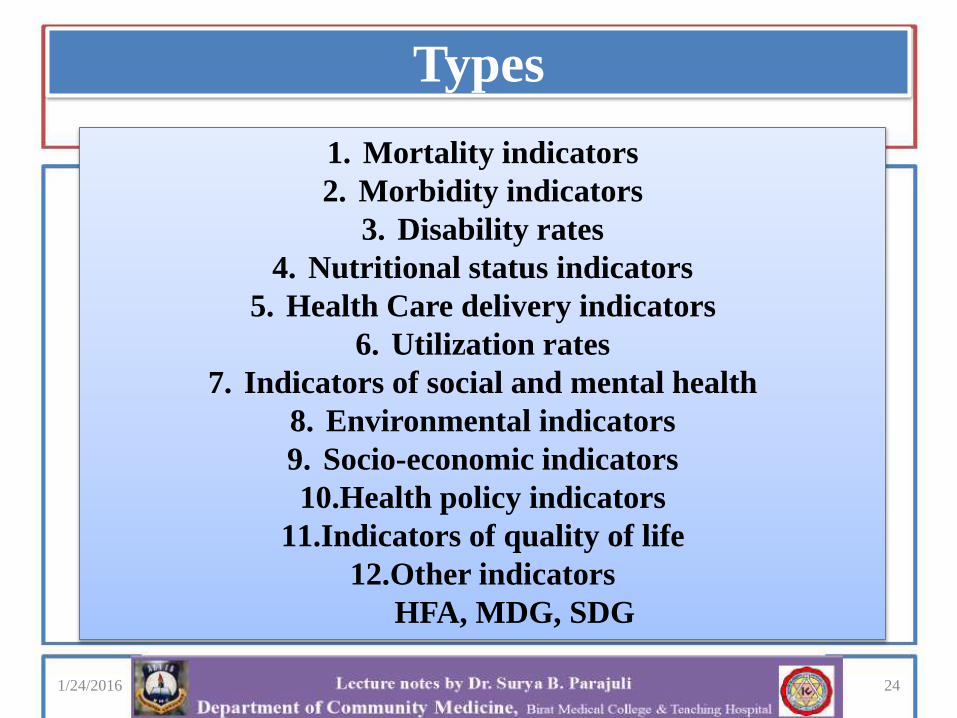
Types
1/24/2016 24
1. Mortality indicators
2. Morbidity indicators
3. Disability rates
4. Nutritional status indicators
5. Health Care delivery indicators
6. Utilization rates
7. Indicators of social and mental health
8. Environmental indicators
9. Socio-economic indicators
10.Health policy indicators
11.Indicators of quality of life
12.Other indicators
HFA, MDG, SDG
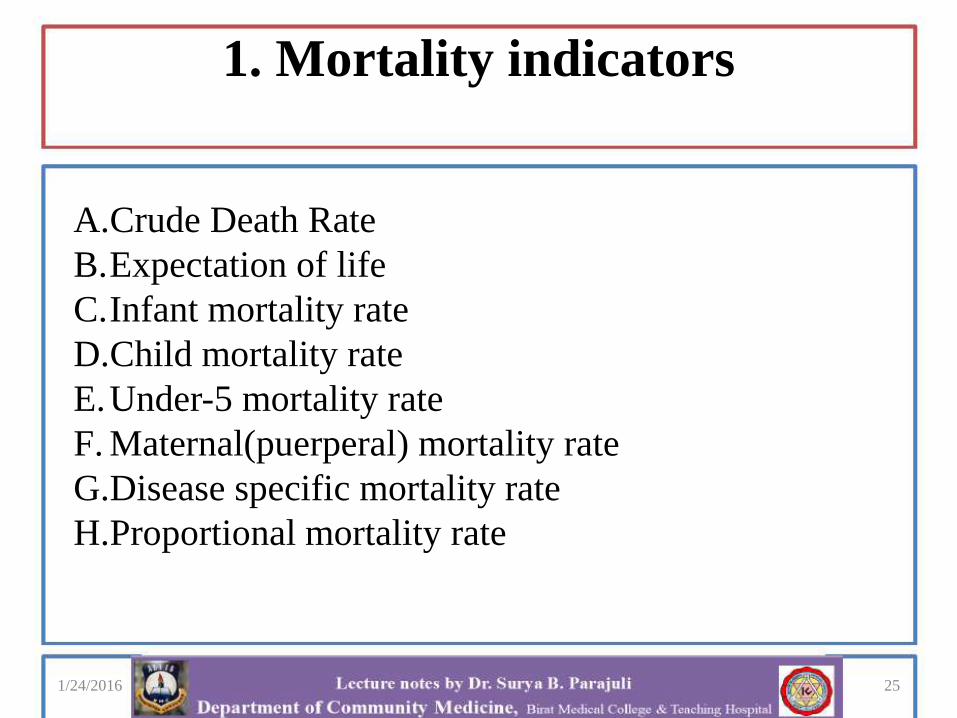
1. Mortality indicators
1/24/2016 25
A.Crude Death Rate
B.Expectation of life
C.Infant mortality rate
D.Child mortality rate
E.Under-5 mortality rate
F. Maternal(puerperal) mortality rate
G.Disease specific mortality rate
H.Proportional mortality rate
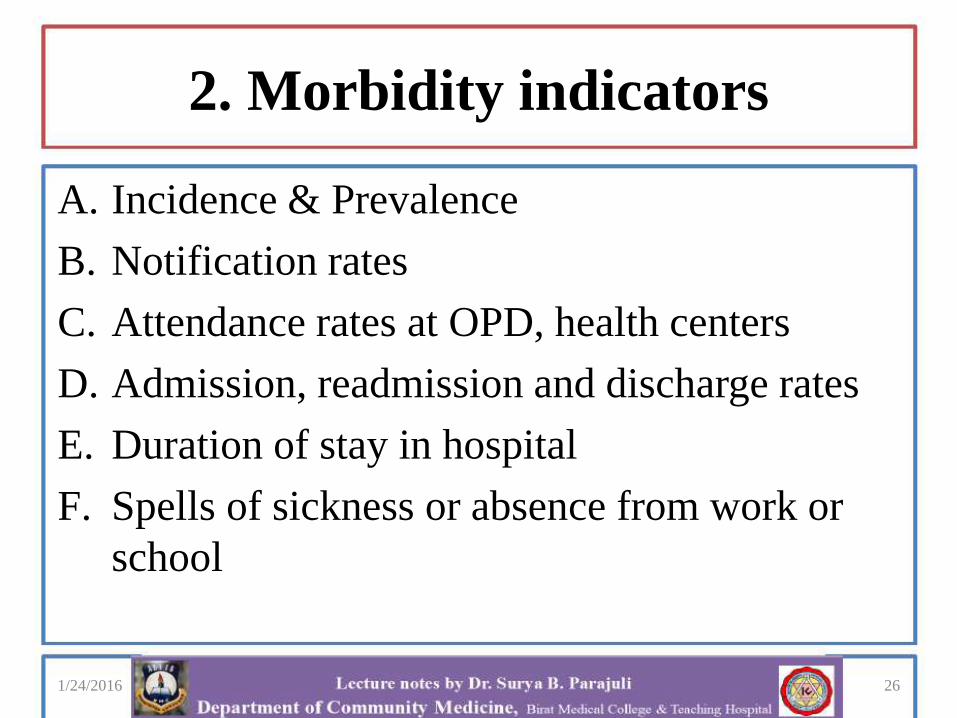
2. Morbidity indicators
A. Incidence & Prevalence
B. Notification rates
C. Attendance rates at OPD, health centers
D. Admission, readmission and discharge rates
E. Duration of stay in hospital
F. Spells of sickness or absence from work or
school
1/24/2016 26

3. Disability Rate
I. Event-type indicators
i. Number of days of restricted activity
ii. Bed disability days
iii. Work loss days (or school loss days) within a specified period
II. Person-type indicators
i. Limitation of mobility
ii. Limitation of activity
1/24/2016 27
1/24/2016 28
Sullivan’s index
• Expectation of life free of disability
• Considered one of the most advanced indicators
• E.g. the expectation of life at birth for all persons
in the USA in 1965 was 70.2 years, and the
approximate expectation of life free of disability
worked out to be 64.9 years.
1/24/2016 29
HALE
• Health-Adjusted Life Expectancy
• DALE to HALE
1/24/2016 30
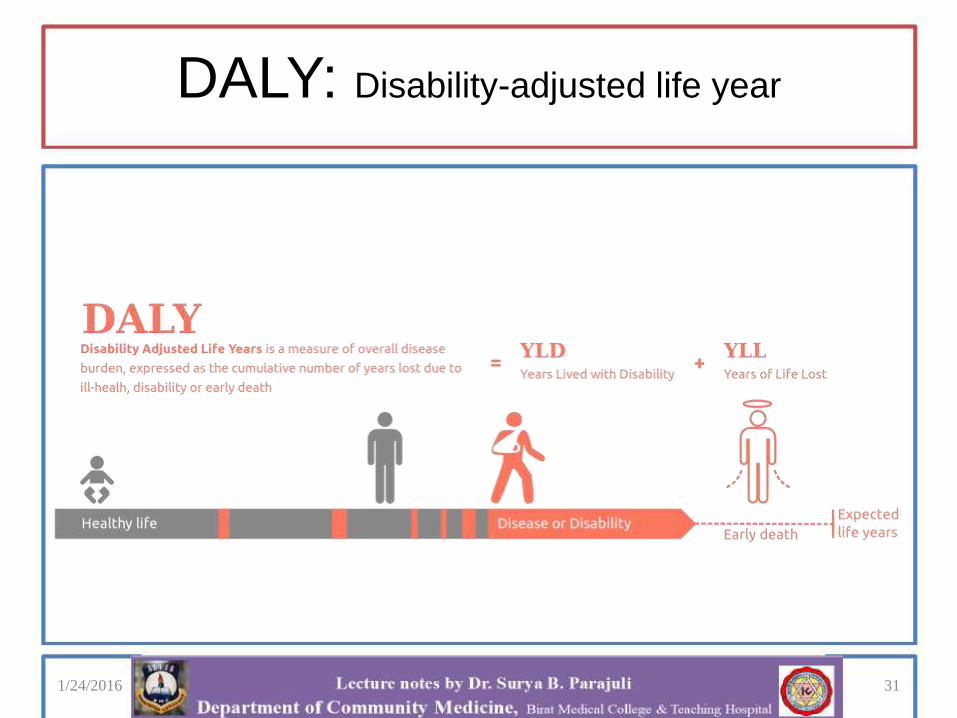
DALY: Disability-adjusted life year
1/24/2016 31
4. Nutritional status indicators
A. Anthropometric measurements of preschool
children, eg weight and Height, MUAC
B. Heights of children at school entry
C. Prevalence of low birth weight
1/24/2016 32
5. Health care delivery indicators
A. Doctor-population ratio
B. Doctor –nurse ratio
C. Population-bed ratio
D. Population per health/subcentre
E. Population per traditional birth attendant
1/24/2016 33
6. Utilization rates
• Proportion of infants who are fully immunized against EPI disease
• Proportion of pregnant women who receive ANC, or have their deliveries supervised by a Trained birth attendance
• Percentage of the population using the various methods of family planning
• Bed-occupancy rate
• Average length of stay
• Bed turn over ratio
1/24/2016 34

7. Indicators of social and mental
health
• Suicide rate
• Homicide rate
• RTA
• Alcohol and drug abuse
• Smoking
• Consumption of tranquilizers
• Obesity
1/24/2016 35

8. Environmental indicators
• Pollution of air and water
• Radiation
• Solid waste
• Noise exposure
• Exposure to toxic substance in food or drink
• Proportion of population having access to safe water
• Sanitation facility
1/24/2016 36
9. Socio-economic indicators
• Rate of population increase
• Per capita GNP
• Level of unemployment
• Dependency ratio
• Literacy rates
• Family size
• Housing
• Per capita calorie availability
1/24/2016 37
10. Health policy indicators
• Proportion of GNP spent on health services
• Proportion of GNP spent on health related
activities (including water supply and
sanitation, housing and nutrition, community
development)
• Proportion of total health
1/24/2016 38
Health System Performance Indicators
• Access (additional)– Trends in health insurance enrollment, range of benefits, exclusions, premiums
– Rural health provider supply, linguistic or cultural barriers to getting care
• Cost– Total health expenditures
– Health as share of Gross Domestic Product (GDP)
– Prescription drug costs
– Payments to hospitals, facilities
– Comparisons of resources used per patient between hospitals/areas
• Quality of care– Effective care – receipt of recommended screenings, treatment, readmission
rates.
– Patient Safety – medical error
1/24/2016 39

11. Indicators of quality of Life
• PQLI (Physical quality of Life Index) Infant mortality rate + life expectancy at age 1+
literacy
1/24/2016 40
12. Others
A. Social indicators:– Given by United nation statistical office 12in number
B. Basic needs indicators: – ILO
– Calorie consumption, access to water, life expectancy, deaths
due to diseases, literacy, doctors and nurses per population,
rooms per person, GNP per capita
1/24/2016 41
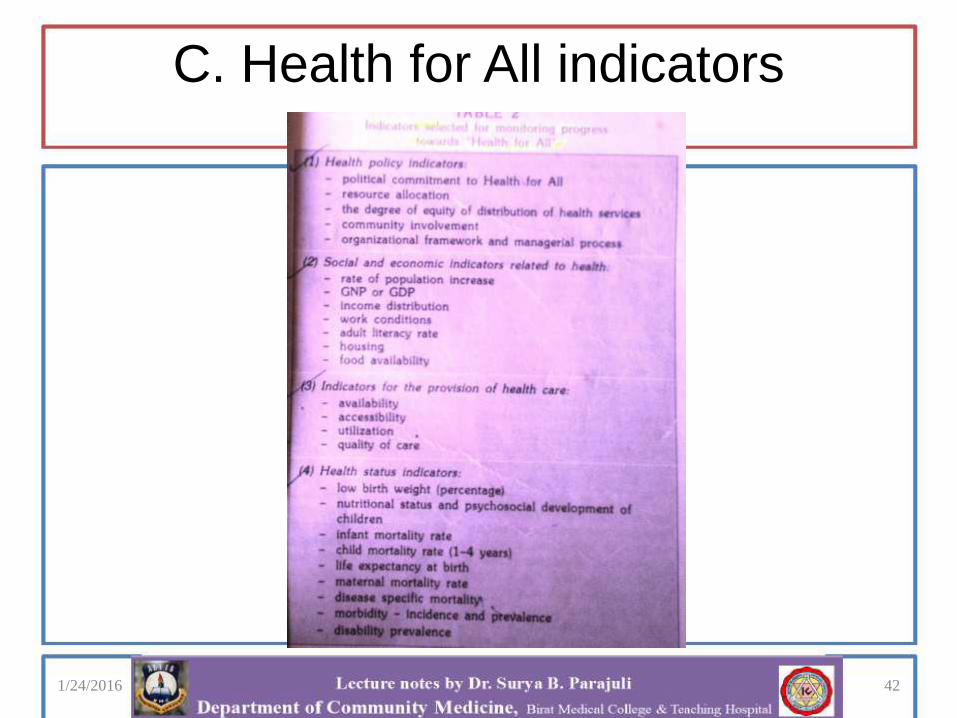
C. Health for All indicators
1/24/2016 42
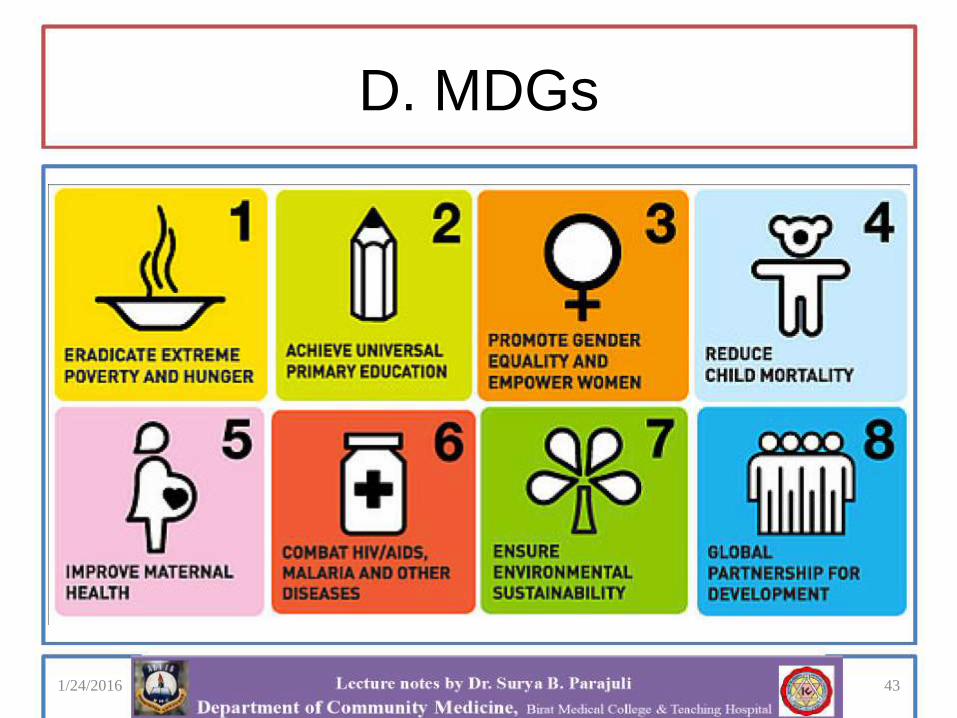
D. MDGs
1/24/2016 43

44
17 goals and 169 targets
1/24/2016
SDG
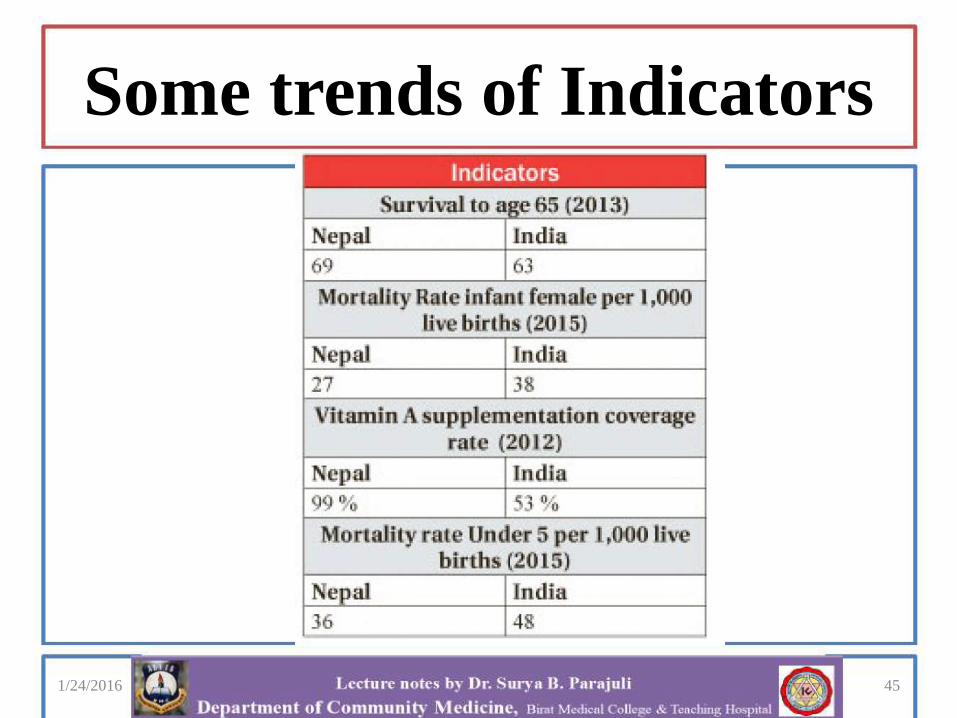
Some trends of Indicators
1/24/2016 45

1/24/2016 46
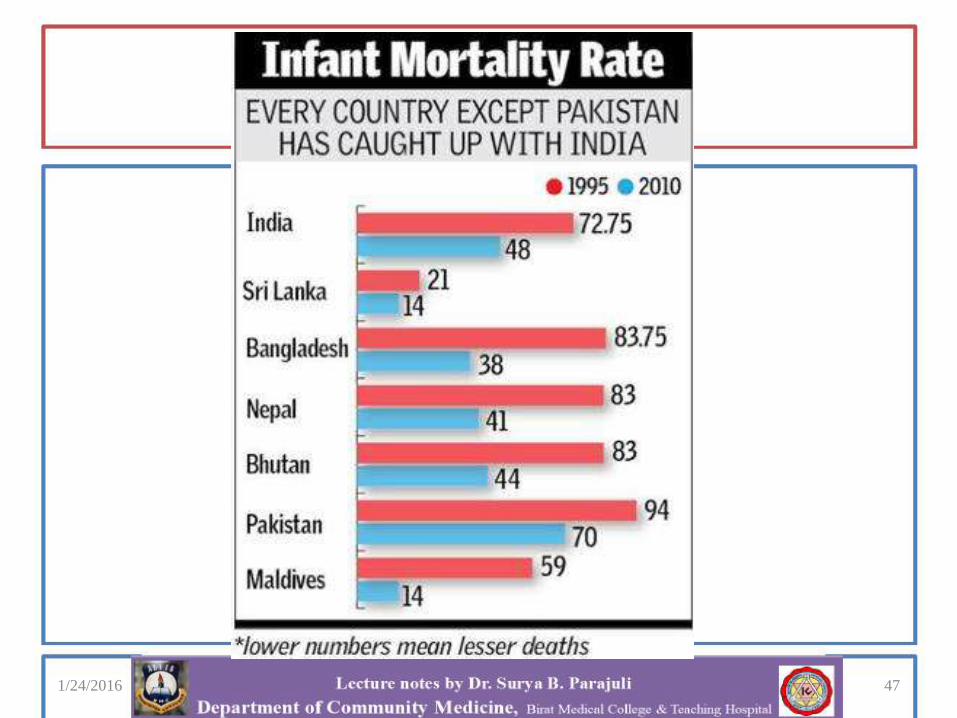
1/24/2016 47

1/24/2016 48

1/24/2016 49
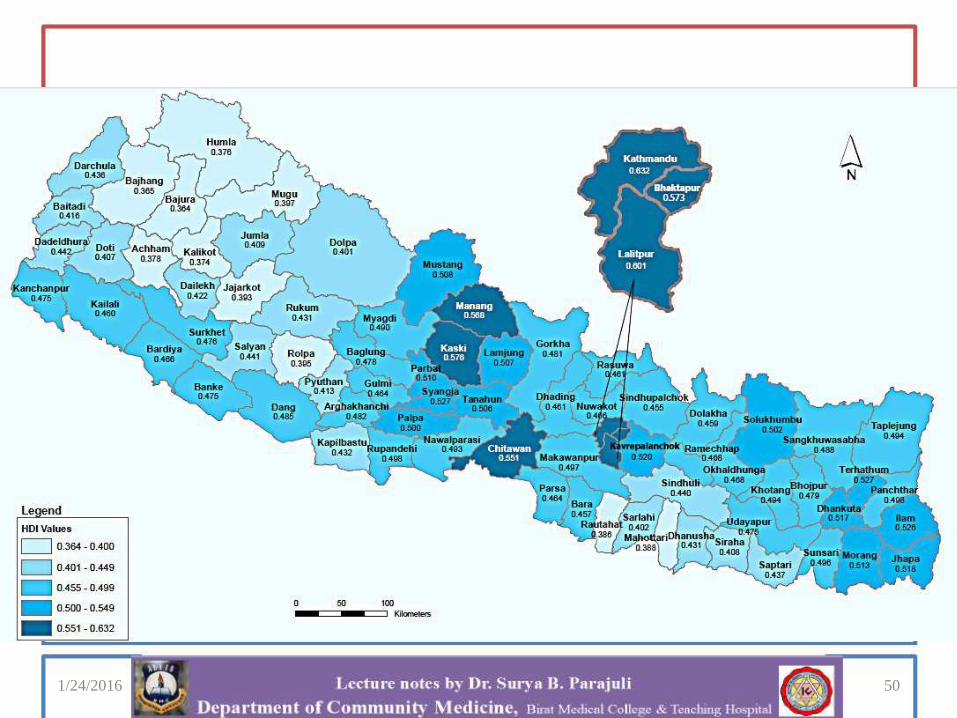
1/24/2016 50
• K. Park “Park’s textbook of preventive and social medicine,” 23rd Edition 2016
• Annual report of DoHS, MoHP, Nepal
• NDHS 2011
• NPHS 2011
• WHO report
References/Acknowledgement
1/24/2016 51

1/24/2016 52

Student Questions
Sir,…………………………..………….
1/24/2016 53

1/24/2016 54
www.drsathi.blogspot.com
Recommended