4Q13 and
2013 Results
Investor Relations
2
Index
Opening Remarks and Estrategic Planning: Leonardo Nogueira Diniz | CEO
Operational Results: Rodrigo Martins | Commercial Officer
Financial Results: Rodrigo Medeiros | CFO and Investor Relations Officer
3
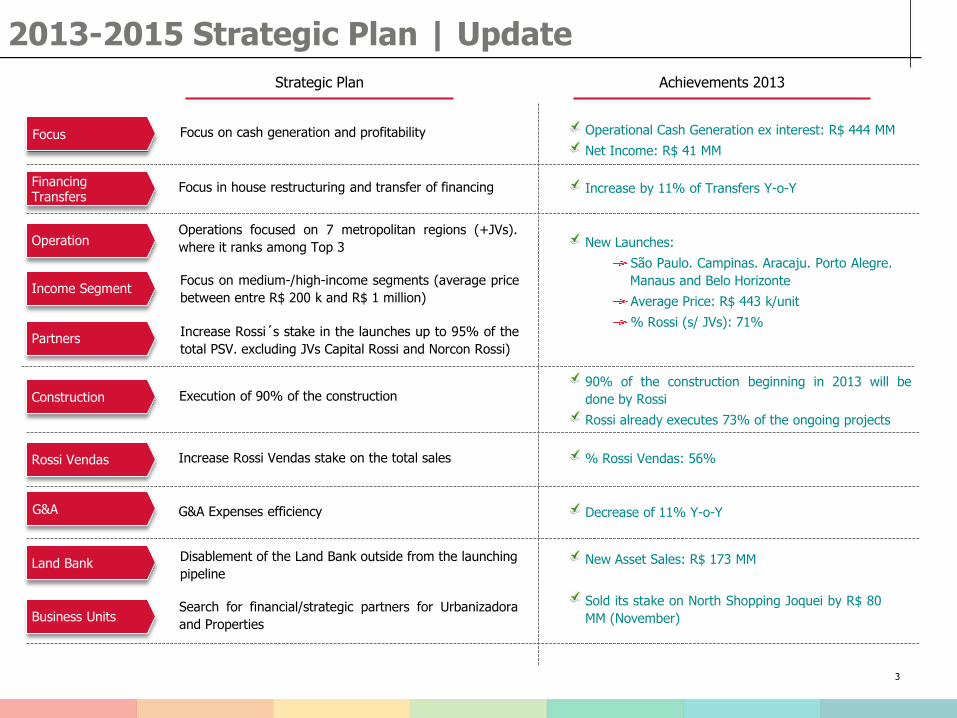
2013-2015 Strategic Plan | Update
Strategic Plan Achievements 2013
Focus
G&A G&A Expenses efficiency
Rossi Vendas Increase Rossi Vendas stake on the total sales
Financing Transfers
Focus in house restructuring and transfer of financing
Construction Execution of 90% of the construction
Partners
Operation
Income Segment
Increase Rossi´s stake in the launches up to 95% of the
total PSV. excluding JVs Capital Rossi and Norcon Rossi)
Operations focused on 7 metropolitan regions (+JVs).
where it ranks among Top 3
Focus on medium-/high-income segments (average price
between entre R$ 200 k and R$ 1 million)
Land Bank Disablement of the Land Bank outside from the launching
pipeline
Business Units Search for financial/strategic partners for Urbanizadora
and Properties
Operational Cash Generation ex interest: R$ 444 MM
Net Income: R$ 41 MM
Decrease of 11% Y-o-Y
% Rossi Vendas: 56%
Increase by 11% of Transfers Y-o-Y
90% of the construction beginning in 2013 will be
done by Rossi
Rossi already executes 73% of the ongoing projects
New Asset Sales: R$ 173 MM
Sold its stake on North Shopping Joquei by R$ 80
MM (November)
New Launches:
São Paulo. Campinas. Aracaju. Porto Alegre.
Manaus and Belo Horizonte
Average Price: R$ 443 k/unit
% Rossi (s/ JVs): 71%
Focus on cash generation and profitability
4
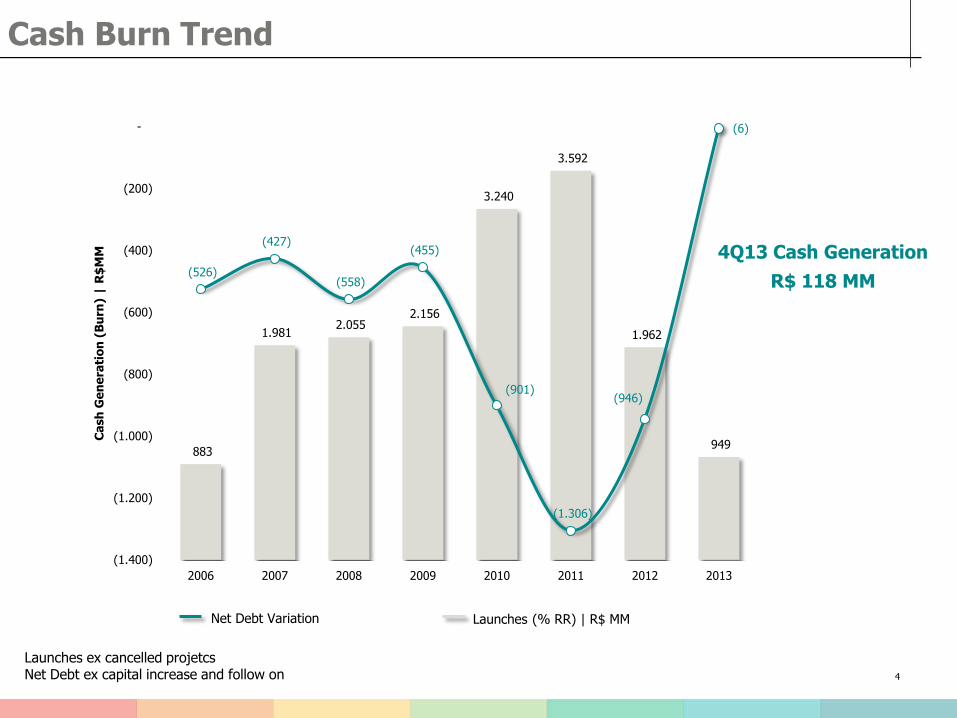
Cash Burn Trend
883
1.981 2.055
2.156
3.240
3.592
1.962
949
(526)
(427)
(558)
(455)
(901)
(1.306)
(946)
(6)
(1.400)
(1.200)
(1.000)
(800)
(600)
(400)
(200)
-
2006 2007 2008 2009 2010 2011 2012 2013
Ca
sh
Ge
ne
rati
on
(B
urn
) |
R$
MM
Launches (% RR) | R$ MM Net Debt Variation
Launches ex cancelled projetcs Net Debt ex capital increase and follow on
4Q13 Cash Generation
R$ 118 MM
5
Operational Perfomance
6
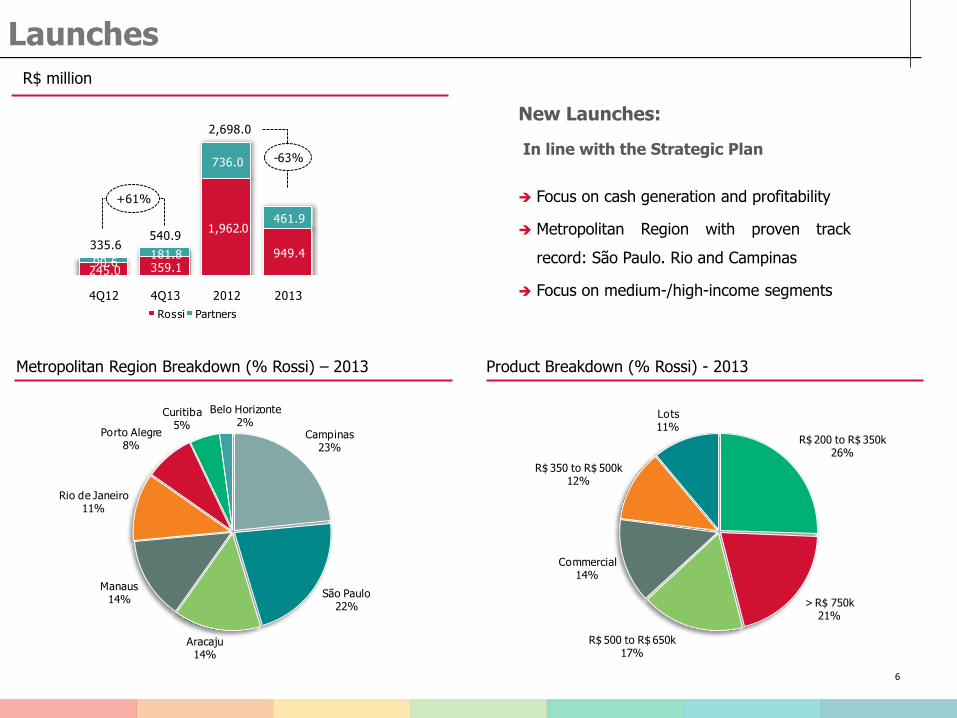
Launches R$ million
Product Breakdown (% Rossi) - 2013 Metropolitan Region Breakdown (% Rossi) – 2013
New Launches:
In line with the Strategic Plan
Focus on cash generation and profitability
Metropolitan Region with proven track
record: São Paulo. Rio and Campinas
Focus on medium-/high-income segments
Campinas23%
São Paulo22%
Aracaju14%
Manaus14%
Rio de Janeiro11%
Porto Alegre8%
Curitiba5%
Belo Horizonte2%
Launches (% Rossi) 2013 | Metropolitan Region
R$ 200 to R$ 350k26%
> R$ 750k21%
R$ 500 to R$ 650k17%
Commercial14%
R$ 350 to R$ 500k12%
Lots11%
Launches (% Rossi) 2013 | Product
245.0 359.1
1,962.0
949.4 90.6
181.8
736.0
461.9
4Q12 4Q13 2012 2013
Launches |R$ MM
Rossi Partners
335.6
+61%
540.9
2,698.0
-63%
7
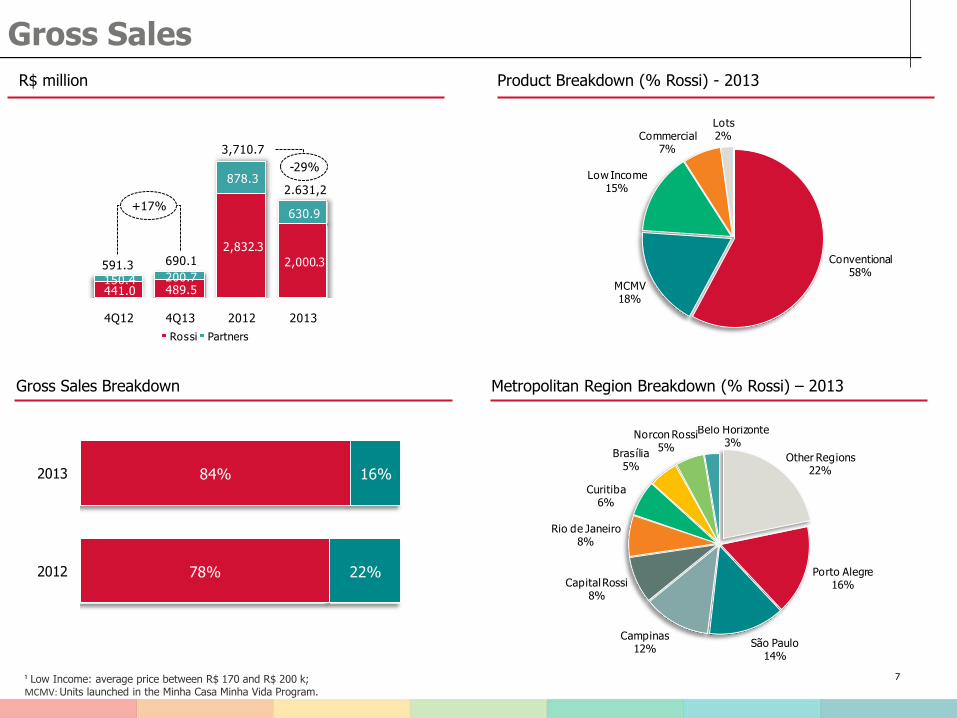
Gross Sales
R$ million Product Breakdown (% Rossi) - 2013
Metropolitan Region Breakdown (% Rossi) – 2013 Gross Sales Breakdown
¹ Low Income: average price between R$ 170 and R$ 200 k; MCMV: Units launched in the Minha Casa Minha Vida Program.
Other Regions22%
Porto Alegre16%
São Paulo14%
Campinas12%
Capital Rossi8%
Rio de Janeiro8%
Curitiba6%
Brasília5%
Norcon Rossi5%
Belo Horizonte3%
Gross Sales (%) Rossi 2013 | Metropolitan Region
Conventional58%
MCMV18%
Low Income15%
Commercial7%
Lots2%
Gross Sales (% Rossi) 2013 | Product
78%
84%
22%
16%
2012
2013
Composição das Vendas Brutas (% Rossi)
Inventory Launches
441.0 489.5
2,832.3
2,000.3
150.4 200.7
878.3
630.9
4Q12 4Q13 2012 2013
Gross Sales|R$ MM
Rossi Partners
591.3
+17%
690.1
3,710.7
-29%
2.631,2
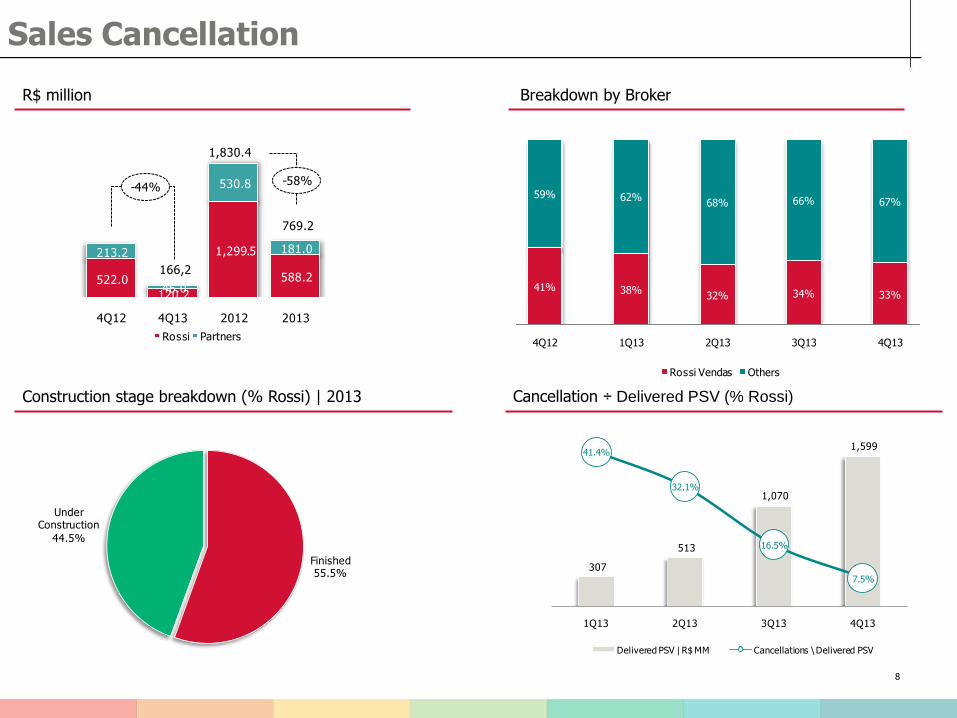
41% 38%32% 34% 33%
59% 62%68% 66% 67%
4Q12 1Q13 2Q13 3Q13 4Q13
Sales Cancellations by Broker
Rossi Vendas Others
8
Sales Cancellation
R$ million
Construction stage breakdown (% Rossi) | 2013
Breakdown by Broker
Cancellation ÷ Delivered PSV (% Rossi)
522.0
120.2
1,299.5
588.2
213.2
46.0
530.8
181.0
4Q12 4Q13 2012 2013
Rescission |R$ MM
Rossi Partners
-44%
166,2
1,830.4
769.2
-58%
307
513
1,070
1,599 41.4%
32.1%
16.5%
7.5%
1Q13 2Q13 3Q13 4Q13
Cancellations \ Delivered PSV| % Rossi
Delivered PSV | R$ MM Cancellations \ Delivered PSV
Finished55.5%
Under Construction
44.5%

9
Land Bank
Residential Developments:
Rossi´s PSV of R$ 7.7 billion. equivalent to approximately 3 years of launches
Only land that passed the new feasibility tests as per the company’s new standards was retained
Decrease n land disablement in line with the strategic plan
Land Bank Breakdown
Product Breakdown (% Rossi) Metropolitan Region Breakdown (% Rossi)
R$ MM PSV 100% Rossi PSV # of Units
Rossi Residencial 9.225.3 7.690.9 22.240
Disablement 1.966.6 1.365.9 11.169
Total 11.191.9 9.056.7 33.409
Aracaju 25%
Porto Alegre20%
Campinas17%
São Paulo13%
Rio de Janeiro11%
Belo Horizonte5%
Manaus5%
Brasília 3%
R$ 350 to R$ 500k
29%
R$ 200 to R$ 350k
22%
> R$ 750k19%
R$ 650 to R$ 750k
18%
R$ 500 to R$ 650k
11%
Commercial1%
10
Financial Performance
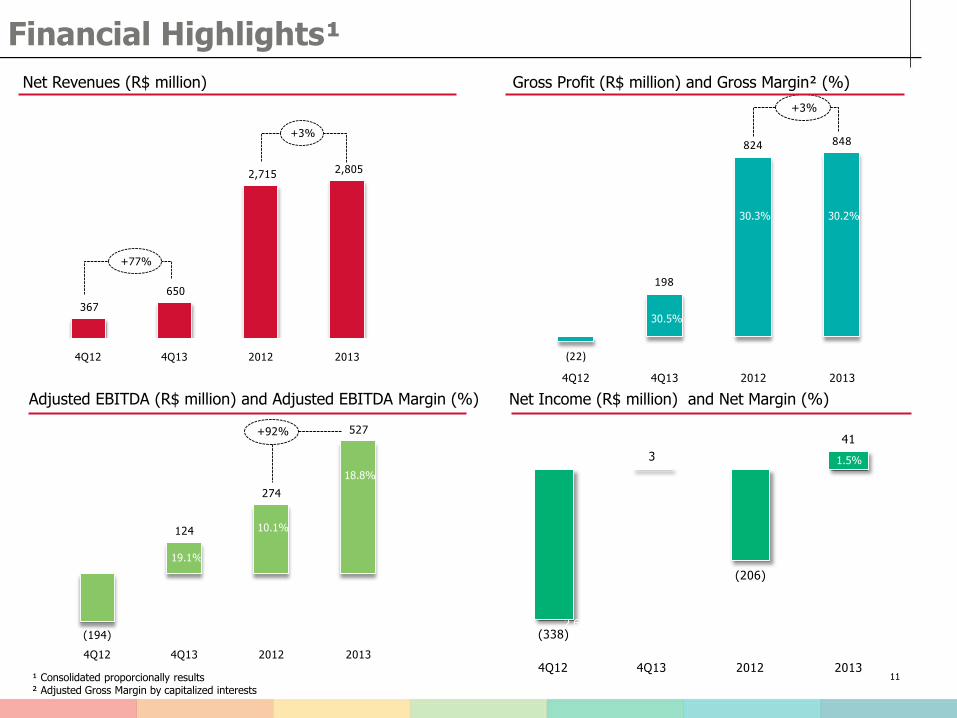
(338)
3
(206)
41
4Q12 4Q13 2012 2013
(194)
124
274
527
4Q12 4Q13 2012 2013
+92%
(22)
198
824 848
4Q12 4Q13 2012 2013
+3%
367
650
2,715 2,805
4Q12 4Q13 2012 2013
+77%
+3%
11
Financial Highlights¹
Net Revenues (R$ million) Gross Profit (R$ million) and Gross Margin² (%)
Net Income (R$ million) and Net Margin (%) Adjusted EBITDA (R$ million) and Adjusted EBITDA Margin (%)
30.3% 30.2%
18.5%
18.8%
2.6%
1.5%
¹ Consolidated proporcionally results ² Adjusted Gross Margin by capitalized interests
30.5%
19.1%
10.1%
12
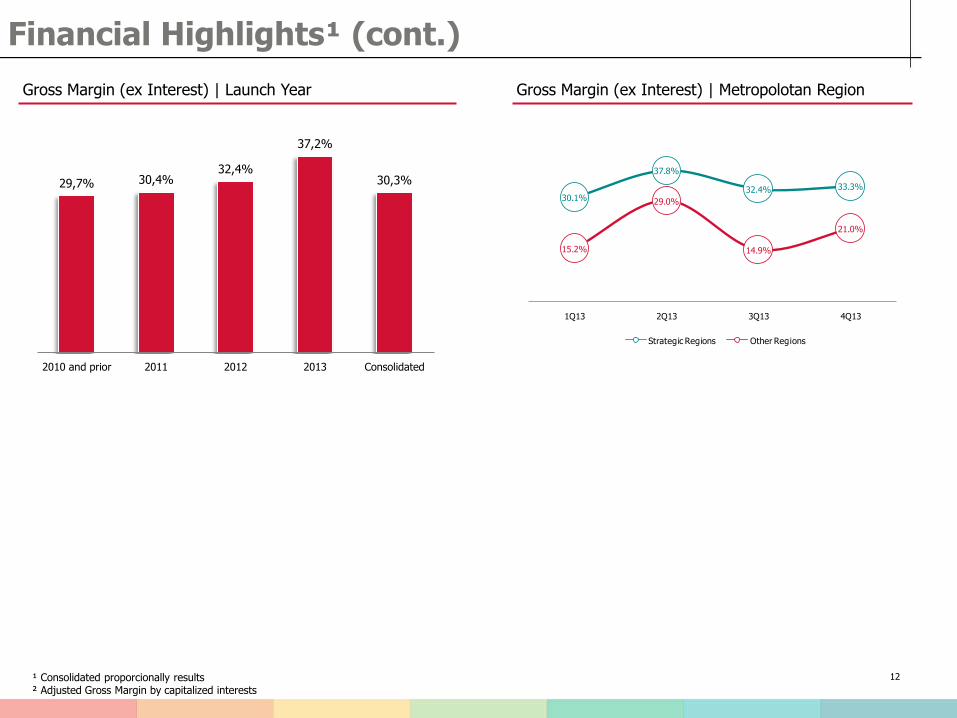
Financial Highlights¹ (cont.)
¹ Consolidated proporcionally results ² Adjusted Gross Margin by capitalized interests
Gross Margin (ex Interest) | Launch Year Gross Margin (ex Interest) | Metropolotan Region
30.1%
37.8%
32.4% 33.3%
15.2%
29.0%
14.9%
21.0%
1Q13 2Q13 3Q13 4Q13
Gross Margin (ex interest) | Metropolitan Region
Strategic Regions Other Regions
29,7% 30,4% 32,4%
37,2%
30,3%
2010 and prior 2011 2012 2013 Consolidated
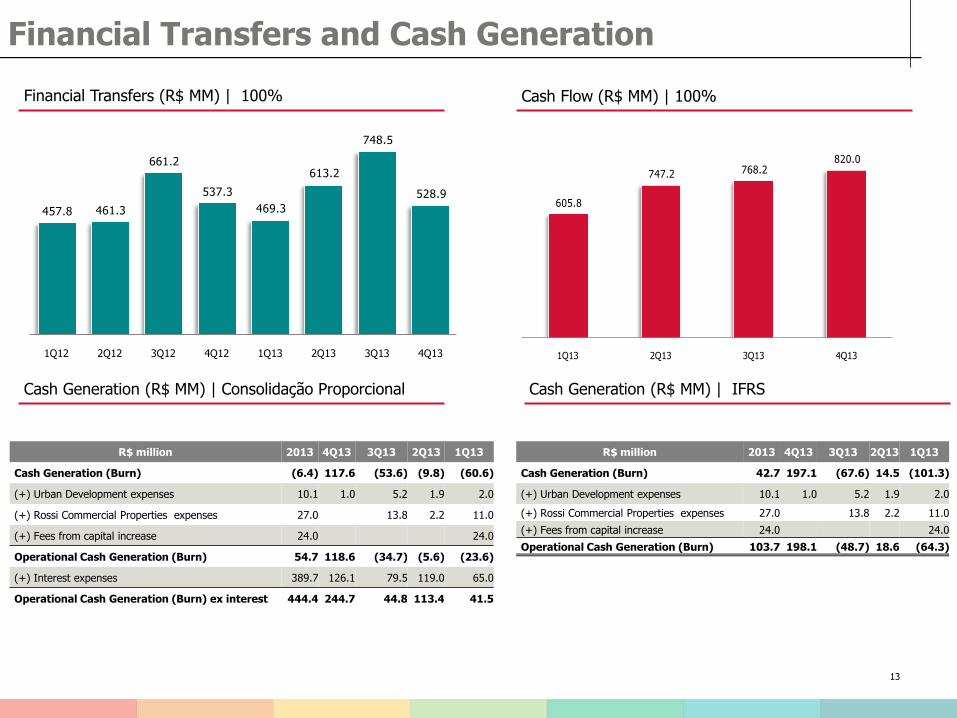
Financial Transfers and Cash Generation
Financial Transfers (R$ MM) | 100% Cash Flow (R$ MM) | 100%
13
457.8 461.3
661.2
537.3
469.3
613.2
748.5
528.9
1Q12 2Q12 3Q12 4Q12 1Q13 2Q13 3Q13 4Q13
Financial Transfers (R$ MM) | 100%
605.8
747.2 768.2 820.0
1Q13 2Q13 3Q13 4Q13
Cash Inflow from Financial Transfers (R$ MM) | 100%
Cash Generation (R$ MM) | Consolidação Proporcional Cash Generation (R$ MM) | IFRS
R$ million 2013 4Q13 3Q13 2Q13 1Q13
Cash Generation (Burn) (6.4) 117.6 (53.6) (9.8) (60.6)
(+) Urban Development expenses 10.1 1.0 5.2 1.9 2.0
(+) Rossi Commercial Properties expenses 27.0 13.8 2.2 11.0
(+) Fees from capital increase 24.0 24.0
Operational Cash Generation (Burn) 54.7 118.6 (34.7) (5.6) (23.6)
(+) Interest expenses 389.7 126.1 79.5 119.0 65.0
Operational Cash Generation (Burn) ex interest 444.4 244.7 44.8 113.4 41.5
R$ million 2013 4Q13 3Q13 2Q13 1Q13
Cash Generation (Burn) 42.7 197.1 (67.6) 14.5 (101.3)
(+) Urban Development expenses 10.1 1.0 5.2 1.9 2.0
(+) Rossi Commercial Properties expenses 27.0 13.8 2.2 11.0
(+) Fees from capital increase 24.0 24.0
Operational Cash Generation (Burn) 103.7 198.1 (48.7) 18.6 (64.3)
14
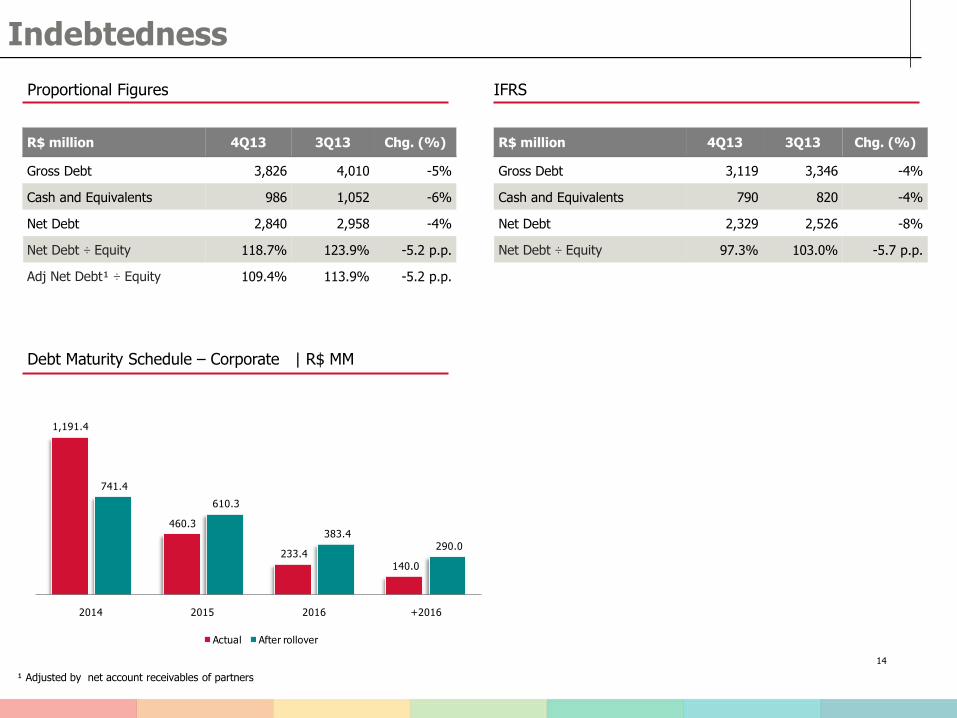
Indebtedness
Proportional Figures
R$ million 4Q13 3Q13 Chg. (%)
Gross Debt 3,826 4,010 -5%
Cash and Equivalents 986 1,052 -6%
Net Debt 2,840 2,958 -4%
Net Debt ÷ Equity 118.7% 123.9% -5.2 p.p.
Adj Net Debt¹ ÷ Equity 109.4% 113.9% -5.2 p.p.
R$ million 4Q13 3Q13 Chg. (%)
Gross Debt 3,119 3,346 -4%
Cash and Equivalents 790 820 -4%
Net Debt 2,329 2,526 -8%
Net Debt ÷ Equity 97.3% 103.0% -5.7 p.p.
IFRS
Debt Maturity Schedule – Corporate | R$ MM
1,191.4
460.3
233.4
140.0
741.4
610.3
383.4
290.0
2014 2015 2016 +2016
Actual After rollover
¹ Adjusted by net account receivables of partners
Equipe de RI
Obrigado! IR Team Phone: +55 (11) 4058-2502 [email protected] www.rossiresidencial.com.br/ri
IR Contacts
15
Recommended