Materials and Methods
71 | P a g e
5. MATERIALS AND METHODS
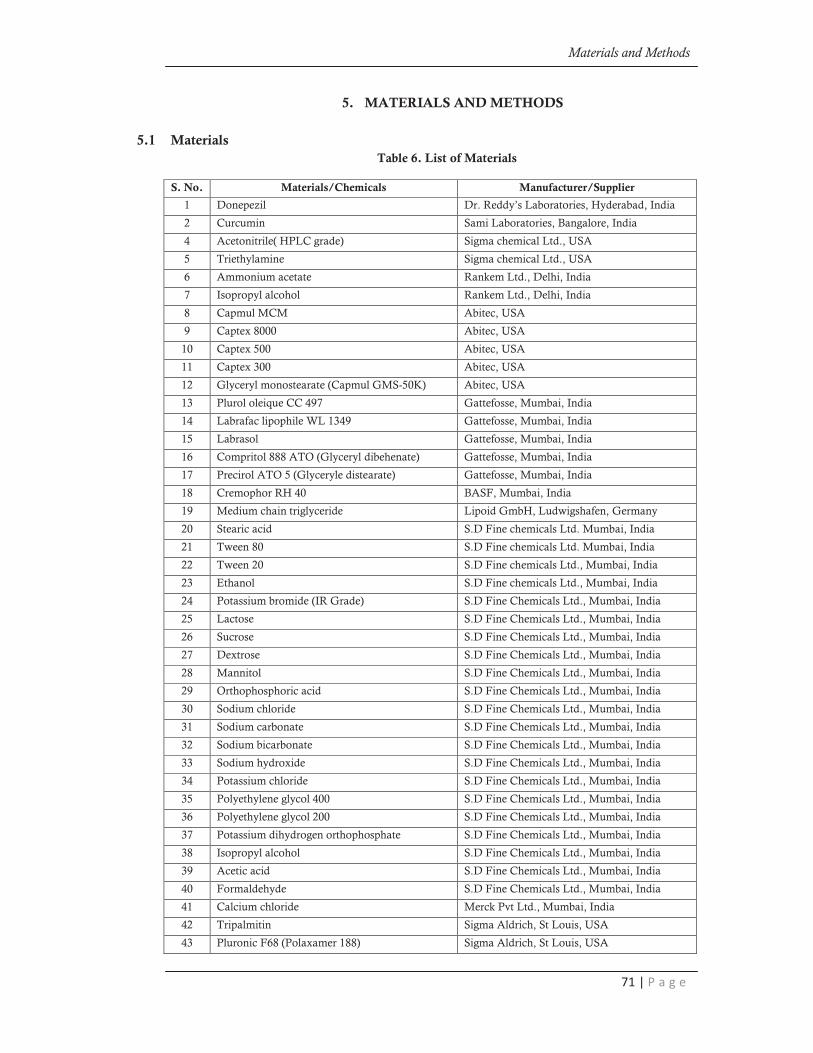
5.1 Materials
Table 6. List of Materials
S. No. Materials/Chemicals Manufacturer/Supplier
1 Donepezil Dr. Reddy’s Laboratories, Hyderabad, India
2 Curcumin Sami Laboratories, Bangalore, India
4 Acetonitrile( HPLC grade) Sigma chemical Ltd., USA
5 Triethylamine Sigma chemical Ltd., USA
6 Ammonium acetate Rankem Ltd., Delhi, India
7 Isopropyl alcohol Rankem Ltd., Delhi, India
8 Capmul MCM Abitec, USA
9 Captex 8000 Abitec, USA
10 Captex 500 Abitec, USA
11 Captex 300 Abitec, USA
12 Glyceryl monostearate (Capmul GMS-50K) Abitec, USA
13 Plurol oleique CC 497 Gattefosse, Mumbai, India
14 Labrafac lipophile WL 1349 Gattefosse, Mumbai, India
15 Labrasol Gattefosse, Mumbai, India
16 Compritol 888 ATO (Glyceryl dibehenate) Gattefosse, Mumbai, India
17 Precirol ATO 5 (Glyceryle distearate) Gattefosse, Mumbai, India
18 Cremophor RH 40 BASF, Mumbai, India
19 Medium chain triglyceride Lipoid GmbH, Ludwigshafen, Germany
20 Stearic acid S.D Fine chemicals Ltd. Mumbai, India
21 Tween 80 S.D Fine chemicals Ltd. Mumbai, India
22 Tween 20 S.D Fine chemicals Ltd., Mumbai, India
23 Ethanol S.D Fine chemicals Ltd., Mumbai, India
24 Potassium bromide (IR Grade) S.D Fine Chemicals Ltd., Mumbai, India
25 Lactose S.D Fine Chemicals Ltd., Mumbai, India
26 Sucrose S.D Fine Chemicals Ltd., Mumbai, India
27 Dextrose S.D Fine Chemicals Ltd., Mumbai, India
28 Mannitol S.D Fine Chemicals Ltd., Mumbai, India
29 Orthophosphoric acid S.D Fine Chemicals Ltd., Mumbai, India
30 Sodium chloride S.D Fine Chemicals Ltd., Mumbai, India
31 Sodium carbonate S.D Fine Chemicals Ltd., Mumbai, India
32 Sodium bicarbonate S.D Fine Chemicals Ltd., Mumbai, India
33 Sodium hydroxide S.D Fine Chemicals Ltd., Mumbai, India
34 Potassium chloride S.D Fine Chemicals Ltd., Mumbai, India
35 Polyethylene glycol 400 S.D Fine Chemicals Ltd., Mumbai, India
36 Polyethylene glycol 200 S.D Fine Chemicals Ltd., Mumbai, India
37 Potassium dihydrogen orthophosphate S.D Fine Chemicals Ltd., Mumbai, India
38 Isopropyl alcohol S.D Fine Chemicals Ltd., Mumbai, India
39 Acetic acid S.D Fine Chemicals Ltd., Mumbai, India
40 Formaldehyde S.D Fine Chemicals Ltd., Mumbai, India
41 Calcium chloride Merck Pvt Ltd., Mumbai, India
42 Tripalmitin Sigma Aldrich, St Louis, USA
43 Pluronic F68 (Polaxamer 188) Sigma Aldrich, St Louis, USA

Materials and Methods
72 | P a g e
S. No. Materials/Chemicals Manufacturer/Supplier
44 Pluronic F127 Sigma Aldrich, St Louis, USA
45 Triton X 100 Sigma Aldrich, St Louis, USA
46 Cremophor EL Sigma Aldrich, St Louis, USA
47 Acetylthiocholine Sigma Aldrich, St Louis, USA
48 5,5ɂ-dithiobis(2-nitrobenzoic acid) Sigma Aldrich, St Louis, USA
49 Chitosan Sigma Aldrich, St Louis, USA
50 Dialysis bag (MWCO-12,000-14,000 g/mL) Himedia labs, Mumbai, India
51 Hydrochloric acid Fischer Chemicals Ltd., Mumbai, India
52 Dimethyl sulfoxide Qualigens, Fine Chemicals, Mumbai, India
53 Hydrogen peroxide Loba Chemie Pvt Ltd., Mumbai, India
54 Thiobarbituric acid Loba Chemie Pvt Ltd., Mumbai, India
55 Sodium dodecyl sulfate Loba Chemie Pvt Ltd., Mumbai, India
56 Ethylene diamine tetraacetic acid Loba Chemie Pvt Ltd., Mumbai, India
57 Sodium lauryl sulphate Loba Chemie Pvt Ltd., Mumbai, India
58 Monosodium phosphate anhydrous Loba Chemie Pvt Ltd., Mumbai, India
59 Disodium phosphate anhydrous Loba Chemie Pvt Ltd., Mumbai, India
60 Magnesium chloride Loba Chemie Pvt Ltd., Mumbai, India
61 Diethyl ether Rankem, Delhi, India

Materials and Methods
73 | P a g e
5.2 Equipments
Table 7. List of Equipments
S. No. Equipment Manufacturer/Supplier
1 UV/Visible spectrophotometer UV-1700 series, Shimadzu, Japan
2 High performance liquid chromatography Shimadzu LC 2010A HT, Japan
3 Fourier transform infrared spectrophotometer Shimadzu, Japan
4 Differential Scanning Calorimeter DSC Q 200 TA Instruments, USA
5 Powder X-Ray Diffractometer Bruker AXS D8, USA
6 Zetasizer Malvern ZS 90, UK
7 Transmission electron microscope Topcon 002B, USA
8 Scanning electron microscope FEI Quanta 200F SEM/EDAX, UK
9 Franz diffusion cells Kovai Glass Works, Coimbatore, India
10 Dissolution apparatus Labindia, Mumbai, India
11 Deep freezer Labline Instruments, Kochi, India
12 Freeze dryer Christ alpha 2-4 LD plus, Germany
13 Brookfield DV II Ultra+Viscometer Brookfield Engineering Laboratories, Inc., USA
14 Electroconductometer (Conductivity meter 305)
Systronic, Mumbai
15 Centrifuge Remi Instruments, Mumbai, India
16 Digital pH meter Eutech Instruments, Mumbai, India
17 Digital electronic balance Sartorius, Bangalore, India
18 Magnetic stirrer Remi Equipments, Mumbai
19 Blade stirrer with speed regulator Remi Instruments, Mumbai, India
20 Vortex mixer Yorco Instruments, Delhi, India
21 Sonicator Bandelin RK 100 H, Germany
22 Isothermal shaker IKA® KS 400I, Germany
23 Dissolution apparatus Electro lab, Mumbai
24 Water bath Scientec, Mumbai
25 Abbe’s Refractometer Bausch and Lomb Optical Company, NY, USA
26 Stereotaxic apparatus Stoelting Co., IL, USA
27 Light microscope Motic, USA
Materials and Methods
74 | P a g e
5.3 Drug Profile
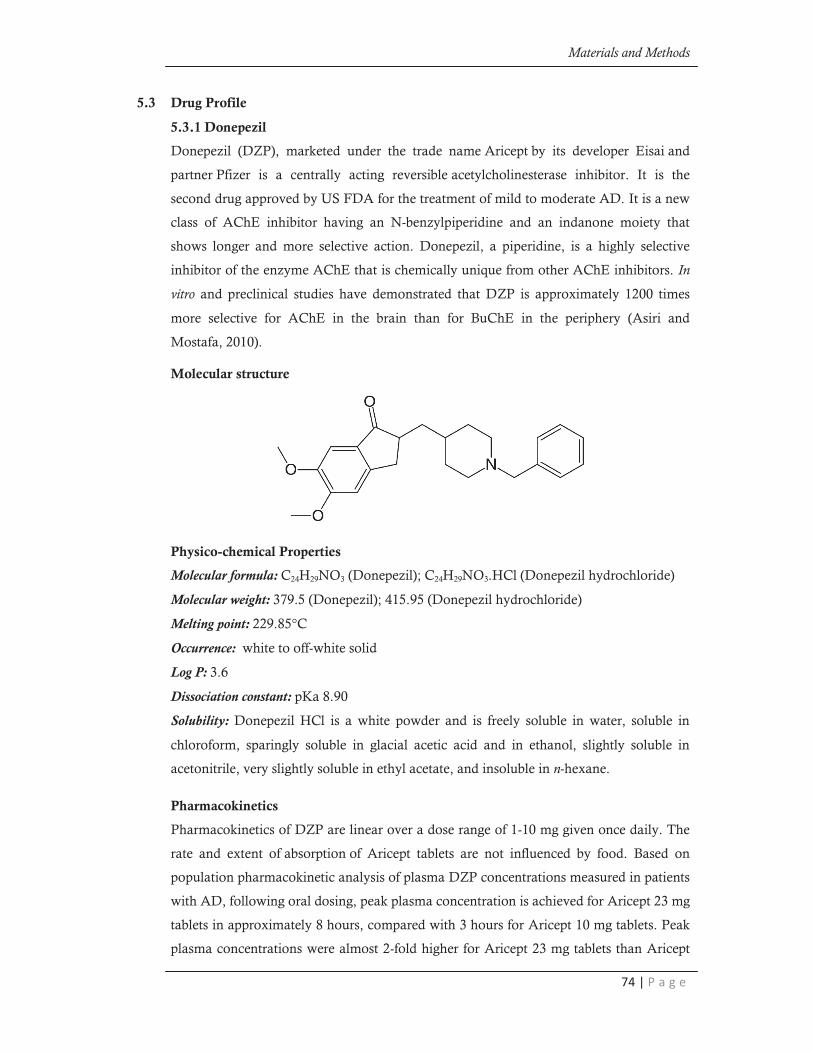
5.3.1 Donepezil
Donepezil (DZP), marketed under the trade name Aricept by its developer Eisai and
partner Pfizer is a centrally acting reversible acetylcholinesterase inhibitor. It is the
second drug approved by US FDA for the treatment of mild to moderate AD. It is a new
class of AChE inhibitor having an N-benzylpiperidine and an indanone moiety that
shows longer and more selective action. Donepezil, a piperidine, is a highly selective
inhibitor of the enzyme AChE that is chemically unique from other AChE inhibitors. In
vitro and preclinical studies have demonstrated that DZP is approximately 1200 times
more selective for AChE in the brain than for BuChE in the periphery (Asiri and
Mostafa, 2010).
Molecular structure
Physico-chemical Properties
Molecular formula: C24H29NO3 (Donepezil); C24H29NO3.HCl (Donepezil hydrochloride)
Molecular weight: 379.5 (Donepezil); 415.95 (Donepezil hydrochloride)
Melting point: 229.85°C
Occurrence: white to off-white solid
Log P: 3.6
Dissociation constant: pKa 8.90
Solubility: Donepezil HCl is a white powder and is freely soluble in water, soluble in
chloroform, sparingly soluble in glacial acetic acid and in ethanol, slightly soluble in
acetonitrile, very slightly soluble in ethyl acetate, and insoluble in n-hexane.
Pharmacokinetics
Pharmacokinetics of DZP are linear over a dose range of 1-10 mg given once daily. The
rate and extent of absorption of Aricept tablets are not influenced by food. Based on
population pharmacokinetic analysis of plasma DZP concentrations measured in patients
with AD, following oral dosing, peak plasma concentration is achieved for Aricept 23 mg
tablets in approximately 8 hours, compared with 3 hours for Aricept 10 mg tablets. Peak
plasma concentrations were almost 2-fold higher for Aricept 23 mg tablets than Aricept
Materials and Methods
75 | P a g e
10 mg tablets. Aricept ODT 5 mg and 10 mg are bioequivalent to Aricept 5 mg and 10
mg tablets, respectively. A food effect study has not been conducted with Aricept oral
dispersible tablet (ODT); however, the effect of food with Aricept ODT is expected to be
minimal. Aricept ODT can be taken without regard to meals.
Following multiple dose administration, DZP accumulates in plasma by 4-7 fold,
and steady state is reached within 15 days. The steady state volume of distribution is 12 -
16 L/kg. DZP is approximately 96% bound to human plasma proteins, mainly to
albumins (about 75%) and alpha1-acid glycoprotein (about 21%) over the concentration
range of 2-1000 ng/mL. DZP is both excreted in the urine intact and extensively
metabolized to four major metabolites, two of which are known to be active, and a
number of minor metabolites, not all of which have been identified. DZP is metabolized
by CYP 450 isoenzymes 2D6 and 3A4 and undergoes glucuronidation.
Half life: 70h
Protein binding: 96%
Bioavailability: l00%
Toxicity: In an acute dose neurotoxicity study in female rats, oral administration of
donepezil and memantine in combination resulted in increased incidence, severity, and
distribution of neurodegeneration compared with memantine alone. The no-effect levels
of the combination were associated with clinically relevant plasma donepezil and
memantine levels. The relevance of this finding to humans is unknown.
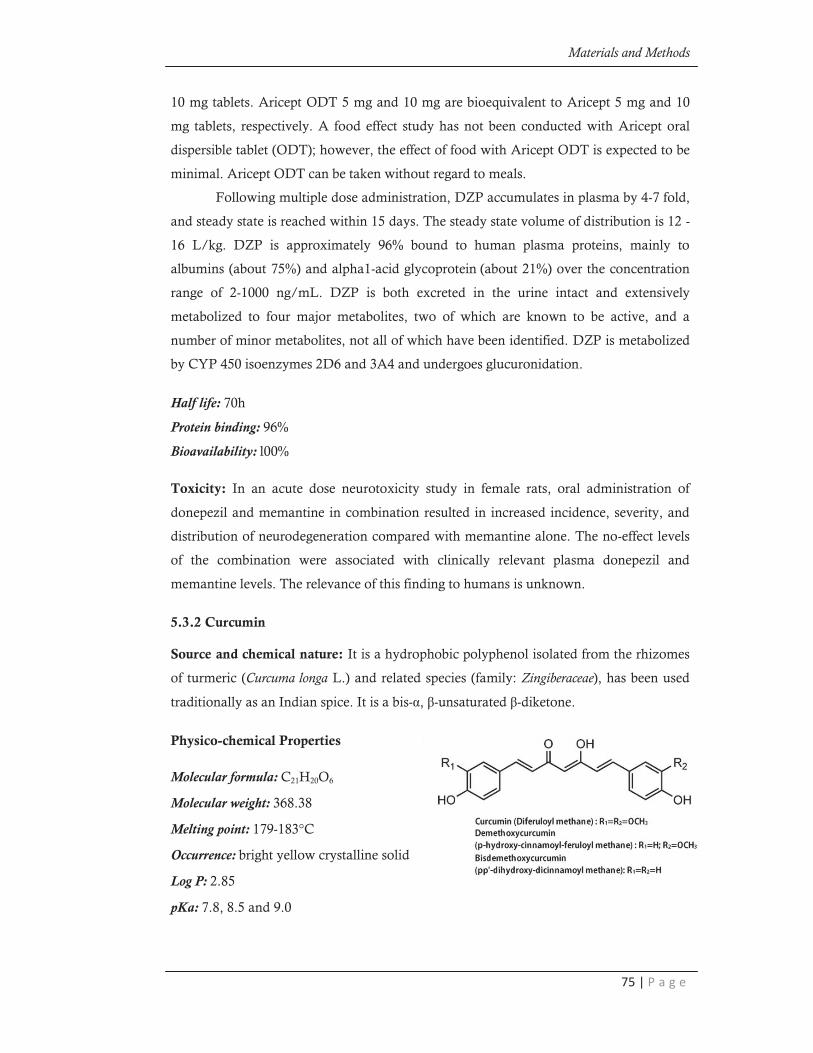
5.3.2 Curcumin
Source and chemical nature: It is a hydrophobic polyphenol isolated from the rhizomes
of turmeric (Curcuma longa L.) and related species (family: Zingiberaceae), has been used
traditionally as an Indian spice. It is a bis-α, β-unsaturated β-diketone.
Physico-chemical Properties
Molecular formula: C21H20O6
Molecular weight: 368.38
Melting point: 179-183°C
Occurrence: bright yellow crystalline solid
Log P: 2.85
pKa: 7.8, 8.5 and 9.0
Materials and Methods
76 | P a g e
Solubility: Sparingly soluble in water and ether; readily soluble in dimethylsulfoxide,
dimethyl formamide, glacial acetic acid, ethanol or acetone. The solubility of drug in
these solvents is ~1mg/ml, and in acetone it is ~20mg/ml.
Pharmacokinetics: CUR shows low systemic bioavailability after oral dosing, probably
due to rapid first-pass metabolism and some degree of intestinal pre-metabolism. Its
metabolism on the one hand involves, successive reductions, which transform CUR to
hexahydrocurcuminol and hexahydrocurcumin (probably through the intermediates
dihydrocurcumin and tetrahydrocurcumin), and, on the other hand, rapid molecular
modification by conjugation, mostly in the liver, to glucuronide, sulfate and glucuronide-
sulfate forms. Moreover, when given orally, 40% of the drug is excreted unchanged in the
feces. It also undergoes extensive enterohepatic recirculation, resulting in its rapid
elimination in bile and urine.
Half life: 1.39h
Protein binding: 60%
Bioavailability: low oral bioavailability (<0.1%)
Pharmacological properties: A large number of in vitro and in vivo studies in both
animals and humans have indicated that CUR exhibits promising pharmacological
activities including anti-oxidant, anti-inflammatory, anti-angiogenic, anti-spasmodic,
anti-microbial and anti-plasmodial activities.
Toxicity: Even at 8g/day, no toxicity is reported from humans and animals.
Stability: Under physiological conditions, CUR can exist in both an enol and a bis-keto
form, which coexist in equilibrium. In acidic and neutral solutions as well as in the solid
state, the keto form predominates, and CUR acts as a potent donor of H-atoms. In
contrast, under alkaline conditions (≥pH 8), the enolic form predominates, and the
phenolic part of the molecule plays the principal role as an electron donor. In solution, it
has been demonstrated that 90% of CUR degrades to trans-6-(4’-hydroxy-3’-
methoxyphenyl)-2,4-dioxo-5-hexanal,vanillin, feruloylmethane, and ferulic acid within
30min. CUR is similarly unstable at basic pH. Yellow CUR changes to dark red colour at
alkaline pH and under physiological conditions the λ max for CUR is observed at 420nm.
Aqueous solution of CUR should not be stored for more than 12h. It should be kept in a
tightly closed container, protected from light and stored in a cool place.
Materials and Methods
77 | P a g e
5.4 Analytical Method Development
Analytical methods were developed for estimation of DZP and CUR using RP-HPLC.
5.4.1 Selection of detection wavelength
100µg/mL of DZP and CUR solutions were prepared separately in acetonitrile (ACN).
The solutions were scanned in the UV-Visible region of 200-800nm and the spectrum was
recorded using photodiode array (PDA).
5.4.2 Preparation of standard stock solutions
10mg of DZP and CUR working standards were accurately weighed and transferred into
a 10mL volumetric flask separately and dissolved in ACN and made up to the volume
with the same solvent to produce a 1mg/mL (1,000µg/mL) of DZP and CUR stock
solutions respectively. The stock solutions were further diluted to 100µg/mL by taking
10 mL of respective drug solution (1mg/mL) and diluting upto 100mL in volumetric
flask with ACN. These solutions were then stored in the refrigerator at 5oC ± 3oC until
analysis.
5.4.3 Linearity and range of DZP
Linearity and range were analyzed by preparing calibration curves using different
concentrations of the standard solution. The calibration curve was plotted using mean
peak area (x) versus the respective concentration (y) of the standard drug solutions.
Linearity for DZP was established over the range of 1-100µg/mL using the weighted
least square regression analysis. From the stock solution (100µg/mL), aliquots of 0.1,
1.0, 2.0, 4.0, 6.0, 8.0 and 10 mL were pipetted out in 10mL volumetric flasks and made
up to the volume with ACN to obtain the concentration of 1-100µg/mL and analyzed at
230nm by RP-HPLC. Calibration curve data was subjected to linear regression analysis
to obtain intercept, slope and regression equation. All measurements were made in
triplicate and mean±S.D. was recorded.
5.4.4 Linearity and range of CUR
Linearity and range were analyzed by preparing calibration curves using different
concentrations of the standard solution. The calibration curve was plotted using mean peak
area (x) versus the respective concentration (y) of the standard drug solutions. Linearity for
CUR was established over the range of 1-100 µg/mL using the weighted least square
regression analysis. From the stock solution (100µg/mL), aliquots of 0.1, 1.0, 2.0, 4.0, 6.0,
8.0 and 10 mL were pipetted out in 10mL volumetric flasks and made up to the volume
with ACN to obtain the concentration of 1-100µg/mL and analyzed at 425nm by RP-
HPLC. Calibration curve data was subjected to linear regression analysis to obtain
Materials and Methods
78 | P a g e
intercept, slope and regression equation. All measurements were made in triplicate and
mean±S.D. was recorded.
5.4.5 Mobile phase preparation
A weighed quantity (1.7 gm) of potassium dihydrogen orthophosphate was dissolved in
500mL of milli Q water and the pH was adjusted to 4.5 with ortho-phosphoric acid and
triethylamine. The resultant buffer solution was filtered through 0.45μm nylon
membrane filter and degassed. The mobile phase used was ACN and 25mM potassium
dihydrogen orthophosphate buffer (pH 4.5) in the ratio of 75:25 v/v.
5.4.6 Optimized Chromatographic Conditions
Stationary phase Hibar C18 (250 x 4.6mm i.d., 5m)
Mobile Phase ACN: Potassium dihydrogen orthophosphate
Mobile phase ratio 75:25
Flow rate 1.0mL/min
Sample volume 20ml using Rheodyne 7725i injector
Detection λ 230nm (DZP) and 425nm (CUR)
pH 4.5
Buffer strength 25mM
Data station LC-20AD (PDA)
Retention time of DZP 2.51±0.1min
Retention time of CUR 4.49±0.1min
Run time for DZP 4.0 min
Run time for CUR 6.0 min
5.4.7 Analytical method validation
The RP-HPLC method was validated according to the ICH guidelines, Q2 (R1) (ICH,
2005). Validation of optimized HPLC method was done with respect to following
parameters:
Specificity
Specificity is the ability of a method to discriminate between the intended analyte and
other components in the sample. A method is said to be specific when it produces a
response only for a single analyte in the presence of other interferences. The specificity of
the method is to analyze unequivocally the analyte in the presence of other endogenous
compounds (degradants, excipients, impurities). It was carried out by comparing the
standard retention time spectra and the sample retention time spectra.

Materials and Methods
79 | P a g e
Accuracy
Accuracy is expressed as the closeness of agreement of trueness. It was determined by
standard addition method. For this purpose, known quantities of DZP and CUR were
supplemented to the sample solution previously analyzed. The results of this solution
were compared with the true results. This experiment was carried out by analyzing
replicates (n=6) at three quality control (QC) levels. The mean, standard deviation (S.D.)
and percentage relative standard deviation (% R.S.D.) was calculated. Accuracy was
calculated by comparing the averaged measured concentration to the actual
concentration, and was expressed in percentage nominal.
%Nominal = (Measured concentration /Actual concentration) x 100
Precision
Precision was measured by inter-day (day to day precision, on 3 different days) and intra-
day (repeatability on the same day) variations by analyzing six replicates over three
different concentration of DZP (40, 50, 60 µg/mL) and CUR (40, 50, 60 µg/mL) at same
optimized chromatographic conditions. Precision was evaluated by calculating the
R.S.D. of measured concentrations at each sample based on linearity plots. In all
situations, R.S.D. values were less than 5%, which was considered to be acceptable.
%R.S.D. = (Standard Deviation /Mean) x 100
Limit of detection and quantitation
Limit of detection (LOD) and quantitation (LOQ) of the method were estimated by
injecting a series of dilute solutions with known concentration by visual observation and
signal-to-noise ratio.
LOD = 3.3 σ/s; LOQ = 10 σ/s
where, σ is the standard deviation of response and s is slope of calibration curve
Robustness
Robustness of the method was studied by injecting the standard solutions with slight
variations in the optimized conditions ±4% in the ratio of ACN in mobile phase, ±0.1
mL of the flow rate and ±0.1 in the pH value.
5.5 Bioanalytical Method Development
Bioanalytical methods were developed for estimation of DZP and CUR in rat plasma by
RP-HPLC.

Materials and Methods
80 | P a g e
5.5.1 Preparation of standard stock solutions
10mg of DZP and CUR working standards were accurately weighed and transferred into
a 10mL volumetric flask separately and dissolved in ACN and made up to the volume
with the same solvent to produce a 1mg/mL (1,000µg/mL) of DZP and CUR stock
solutions respectively. The stock solutions were further diluted to 100µg/mL by taking
10 mL of respective drug solution (1mg/mL) and diluting upto 100mL in volumetric
flask with ACN. These solutions were then stored in the refrigerator at -200C ± 20C until
analysis.
5.5.2 Linearity and range for DZP
Eight point calibration curve was prepared by serial dilution of DZP stock solution
(100µg/mL) in the range of 50-2000ng/mL. The concentrations were corrected for
potency and amount weighed. Calibration standards were prepared daily by spiking
0.2mL of blank plasma with 200µL of the appropriate working solution resulting in
concentrations of 50, 100, 200, 250, 500, 1000 and 2000 ng of DZP per mL plasma.
200µL of CUR was added as an internal standard (IS) at concentration of 2µg/mL. To
the resulting solution 200µL of precipitating agent (10% perchloric acid) was added. The
mixture was vortexed for 5 min and centrifuged at 4000 rpm for 10 min. The supernatant
layer was separated and analyzed. A plot with the resulting peak area ratios of DZP to IS
(response factor) was obtained against the concentrations. QC samples (low quality
control (LQC), 50ng/mL; medium quality control (MQC), 500ng/mL; high quality
control (HQC), 750ng/mL; were prepared by spiking 200µL aliquot of blank plasma with
200µL of spiking solution of drug as well as the IS. All solutions were stored in the
refrigerator at 5.0±3.0 oC. The bulk spiked calibration and QC samples were stored at -20
oC.
5.5.3 Linearity and range of CUR
Eight point calibration curve was prepared by serial dilution of CUR stock solution
(100µg/mL) in the range of 50-2000ng/mL. The concentrations were corrected for
potency and amount weighed. Calibration standards were prepared daily by spiking
0.2mL of blank plasma with 200µL of the appropriate working solution resulting in
concentrations of 50, 100, 200, 250, 500, 1000 and 2000 ng of CUR per mL plasma.
200µL of DZP was added as an internal standard (IS) at concentration of 1µg/mL. To
the resulting solution 200µL of precipitating agent (10% perchloric acid) was added. The
mixture was vortexed for 5 min and centrifuged at 4000 rpm for 10 min. A plot with the
resulting peak area ratios of CUR to IS (response factor) was obtained against the
concentrations. Quality control (QC) samples (low quality control (LQC), 50ng/mL;
medium quality control (MQC), 500ng/mL; high quality control (HQC), 750ng/mL;
Materials and Methods
81 | P a g e
were prepared by spiking 200µL aliquot of blank plasma with 200µL of spiking solution
of drug as well as the IS. All solutions were stored in the refrigerator at 5.0±3.0 oC. The
bulk spiked calibration and QC samples were stored at -20 oC.
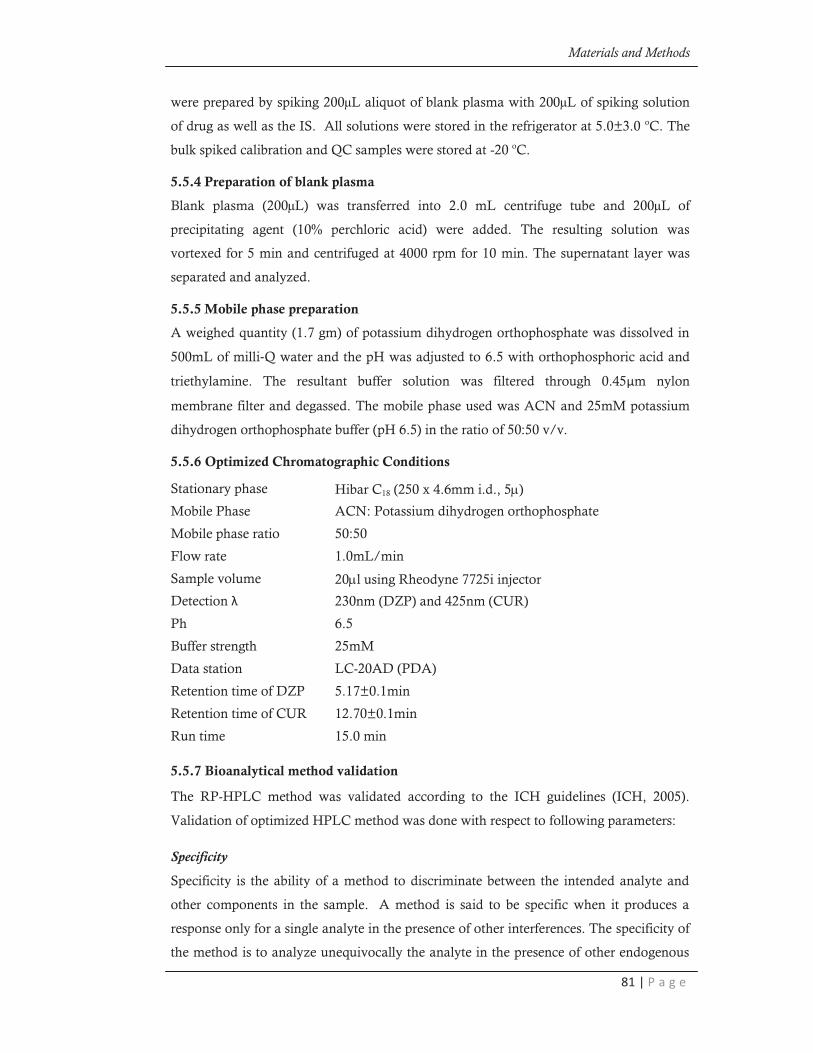
5.5.4 Preparation of blank plasma
Blank plasma (200µL) was transferred into 2.0 mL centrifuge tube and 200µL of
precipitating agent (10% perchloric acid) were added. The resulting solution was
vortexed for 5 min and centrifuged at 4000 rpm for 10 min. The supernatant layer was
separated and analyzed.
5.5.5 Mobile phase preparation
A weighed quantity (1.7 gm) of potassium dihydrogen orthophosphate was dissolved in
500mL of milli Q water and the pH was adjusted to 6.5 with orthophosphoric acid and
triethylamine. The resultant buffer solution was filtered through 0.45μm nylon
membrane filter and degassed. The mobile phase used was ACN and 25mM potassium
dihydrogen orthophosphate buffer (pH 6.5) in the ratio of 50:50 v/v.
5.5.6 Optimized Chromatographic Conditions
Stationary phase Hibar C18 (250 x 4.6mm i.d., 5m)
Mobile Phase ACN: Potassium dihydrogen orthophosphate
Mobile phase ratio 50:50
Flow rate 1.0mL/min
Sample volume 20ml using Rheodyne 7725i injector
Detection λ 230nm (DZP) and 425nm (CUR)
Ph 6.5
Buffer strength 25mM
Data station LC-20AD (PDA)
Retention time of DZP 5.17±0.1min
Retention time of CUR 12.70±0.1min
Run time 15.0 min
5.5.7 Bioanalytical method validation
The RP-HPLC method was validated according to the ICH guidelines (ICH, 2005).
Validation of optimized HPLC method was done with respect to following parameters:
Specificity
Specificity is the ability of a method to discriminate between the intended analyte and
other components in the sample. A method is said to be specific when it produces a
response only for a single analyte in the presence of other interferences. The specificity of
the method is to analyze unequivocally the analyte in the presence of other endogenous
Materials and Methods
82 | P a g e
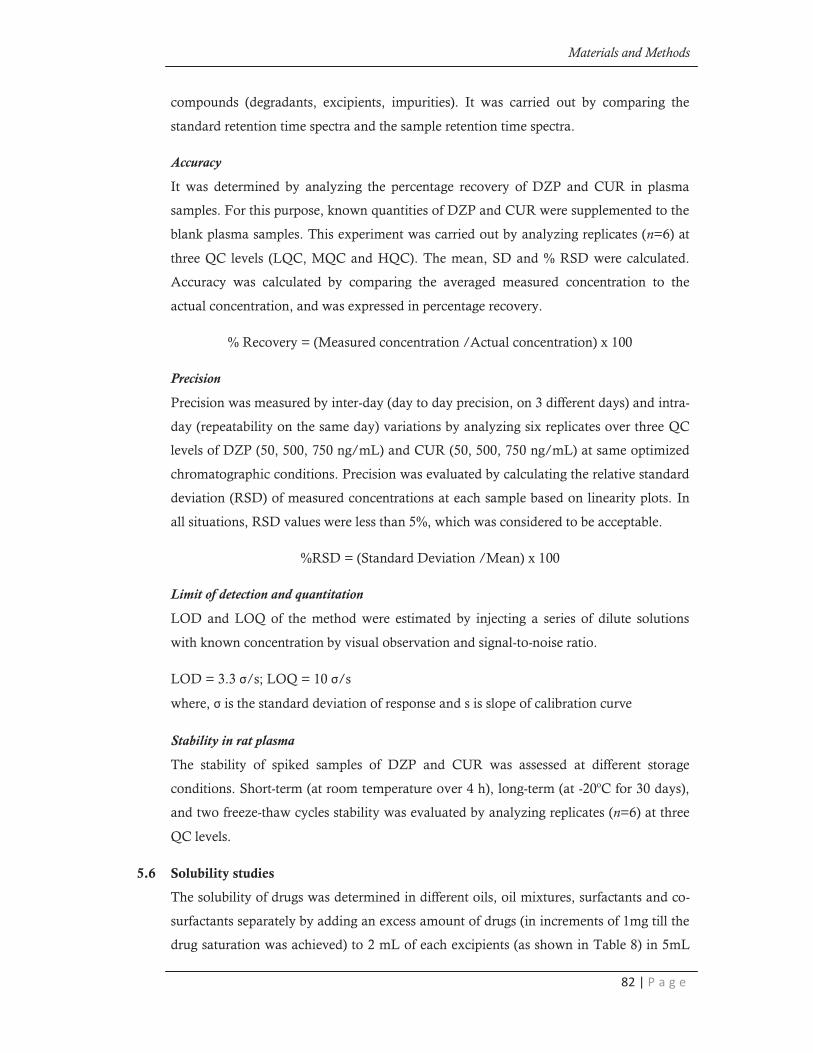
compounds (degradants, excipients, impurities). It was carried out by comparing the
standard retention time spectra and the sample retention time spectra.
Accuracy
It was determined by analyzing the percentage recovery of DZP and CUR in plasma
samples. For this purpose, known quantities of DZP and CUR were supplemented to the
blank plasma samples. This experiment was carried out by analyzing replicates (n=6) at
three QC levels (LQC, MQC and HQC). The mean, SD and % RSD were calculated.
Accuracy was calculated by comparing the averaged measured concentration to the
actual concentration, and was expressed in percentage recovery.
% Recovery = (Measured concentration /Actual concentration) x 100
Precision
Precision was measured by inter-day (day to day precision, on 3 different days) and intra-
day (repeatability on the same day) variations by analyzing six replicates over three QC
levels of DZP (50, 500, 750 ng/mL) and CUR (50, 500, 750 ng/mL) at same optimized
chromatographic conditions. Precision was evaluated by calculating the relative standard
deviation (RSD) of measured concentrations at each sample based on linearity plots. In
all situations, RSD values were less than 5%, which was considered to be acceptable.
%RSD = (Standard Deviation /Mean) x 100
Limit of detection and quantitation
LOD and LOQ of the method were estimated by injecting a series of dilute solutions
with known concentration by visual observation and signal-to-noise ratio.
LOD = 3.3 σ/s; LOQ = 10 σ/s
where, σ is the standard deviation of response and s is slope of calibration curve
Stability in rat plasma
The stability of spiked samples of DZP and CUR was assessed at different storage
conditions. Short-term (at room temperature over 4 h), long-term (at -20oC for 30 days),
and two freeze-thaw cycles stability was evaluated by analyzing replicates (n=6) at three
QC levels.
5.6 Solubility studies
The solubility of drugs was determined in different oils, oil mixtures, surfactants and co-
surfactants separately by adding an excess amount of drugs (in increments of 1mg till the
drug saturation was achieved) to 2 mL of each excipients (as shown in Table 8) in 5mL
Materials and Methods
83 | P a g e
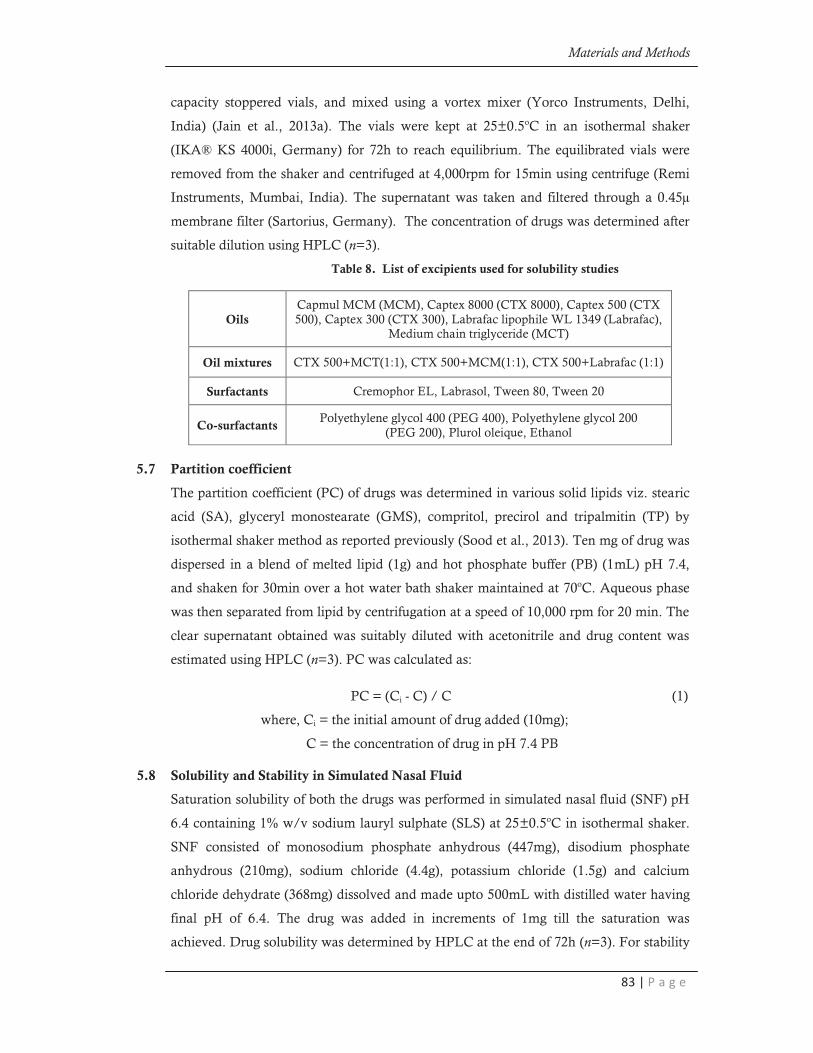
capacity stoppered vials, and mixed using a vortex mixer (Yorco Instruments, Delhi,
India) (Jain et al., 2013a). The vials were kept at 25±0.5oC in an isothermal shaker
(IKA® KS 4000i, Germany) for 72h to reach equilibrium. The equilibrated vials were
removed from the shaker and centrifuged at 4,000rpm for 15min using centrifuge (Remi
Instruments, Mumbai, India). The supernatant was taken and filtered through a 0.45µ
membrane filter (Sartorius, Germany). The concentration of drugs was determined after
suitable dilution using HPLC (n=3).
Table 8. List of excipients used for solubility studies
Oils
Capmul MCM (MCM), Captex 8000 (CTX 8000), Captex 500 (CTX
500), Captex 300 (CTX 300), Labrafac lipophile WL 1349 (Labrafac), Medium chain triglyceride (MCT)
Oil mixtures CTX 500+MCT(1:1), CTX 500+MCM(1:1), CTX 500+Labrafac (1:1)
Surfactants Cremophor EL, Labrasol, Tween 80, Tween 20
Co-surfactants Polyethylene glycol 400 (PEG 400), Polyethylene glycol 200
(PEG 200), Plurol oleique, Ethanol
5.7 Partition coefficient
The partition coefficient (PC) of drugs was determined in various solid lipids viz. stearic
acid (SA), glyceryl monostearate (GMS), compritol, precirol and tripalmitin (TP) by
isothermal shaker method as reported previously (Sood et al., 2013). Ten mg of drug was
dispersed in a blend of melted lipid (1g) and hot phosphate buffer (PB) (1mL) pH 7.4,
and shaken for 30min over a hot water bath shaker maintained at 70oC. Aqueous phase
was then separated from lipid by centrifugation at a speed of 10,000 rpm for 20 min. The
clear supernatant obtained was suitably diluted with acetonitrile and drug content was
estimated using HPLC (n=3). PC was calculated as:
PC = (Ci - C) / C (1)
where, Ci = the initial amount of drug added (10mg);
C = the concentration of drug in pH 7.4 PB
5.8 Solubility and Stability in Simulated Nasal Fluid
Saturation solubility of both the drugs was performed in simulated nasal fluid (SNF) pH
6.4 containing 1% w/v sodium lauryl sulphate (SLS) at 25±0.5oC in isothermal shaker.
SNF consisted of monosodium phosphate anhydrous (447mg), disodium phosphate
anhydrous (210mg), sodium chloride (4.4g), potassium chloride (1.5g) and calcium
chloride dehydrate (368mg) dissolved and made upto 500mL with distilled water having
final pH of 6.4. The drug was added in increments of 1mg till the saturation was
achieved. Drug solubility was determined by HPLC at the end of 72h (n=3). For stability

Materials and Methods
84 | P a g e
studies, standard solutions of drug (5-25µg/mL) were prepared in SNF pH 6.4 containing
1% w/v SLS and stored at 37±0.5oC for 72h. The samples were assayed for drug content
using HPLC method at 0, 24, 48 and 72h (n=3).
5.9 Compatibility studies
Compatibility of drug and lipid was studied using Fourier transform infrared
spectroscopy (FTIR) and differential scanning calorimetry (DSC).
5.9.1 Procedure for FTIR
A physical mixture of drug and lipid (either alone or in combination) was prepared and
mixed with anhydrous potassium bromide (KBr) in 1:4 ratio. About 100mg of this
mixture was ground into fine powder using mortar and pestle followed by compression to
form a transparent KBr pellet using a Beckmann hydraulic press (Beckman Instruments
Inc., Fullerton, USA) set at 15 tons pressure. Each KBr pellet was scanned at 4mm/s at a
resolution of 2cm over a wave number region from 4000 to 400 cm-1 in a FTIR
spectrophotometer (Shimadzu, Japan). The IR spectrum of the physical mixture (1:1)
was compared with those of pure drug and lipid and IR peak matching was done to
detect any appearance or disappearance of peaks. FTIR was also carried out for
optimized batch of lyophilized drug loaded NLC formulations.
5.9.2 Procedure for DSC
DSC analysis was performed using DSC Q200 (TA Instruments, USA). The instrument
was calibrated for temperature and heat flow using high purity indium standard. Briefly,
about 5mg of samples were accurately weighed in non-hermetically sealed aluminum
pans and crimped. The DSC thermograms covered the range from 20-250oC and 20-
200oC for DZP and CUR respectively, at a heating rate of 10oC/min under constant
purging of nitrogen at a flow rate of 50mL/min. An empty pan, sealed in the same way
as that of the sample, was used as a reference. DSC thermograms were analysed for pure
drug, lipid and its physical mixture (1:1) using TA Universal Analysis software.
5.10 Purity of drugs
Purity of DZP and CUR was determined using DSC as per procedure described in
section 5.8.2. The thermograms of the drugs were subjected to purity analysis using Vant
Hoff’s equation (Eq.2) that measures the fraction melted as a function of temperature.
(2)
where, Ts = Sample temperature
To = Theoretical melting point for 100% pure crystalline compound
R = Gas constant
X = Total mole fraction impurity
F = Fraction melted at Ts
F
1 )
H
T X R( - T T
2o
os
fD=

Materials and Methods
85 | P a g e
5.11 Formulation of nanoemulsion
5.11.1 Pseudoternary phase diagrams
The nanoemulsions were prepared using spontaneous nanoemulsification method
(Fig. 12) and phase behavior was studied using pseudoternary phase diagrams
(Shafiq et al., 2007).
Fig.12. Formulation of nanoemulsion by spontaneous nanoemulsification method and
photographs of donepezil and curcumin nanoemulsions (NE)
Pseudoternary phase diagrams were constructed using aqueous titration of oil, surfactant
and co-surfactant mixture. The oil phase was heated gently at 45-50 oC for 5 min.
Surfactant and co-surfactant (smix) were mixed together in different volume ratios (1:0,
1:1, 1:2, 1:3, 2:1, 3:1) and heated at same temperature. These smix ratios were chosen to
reflect the increasing concentration of co-surfactant with respect to surfactant and
increasing concentration of surfactant with respect to co-surfactant for the detailed study
of the phase diagrams for the formulation of NE. Oil and smix were mixed in different
volume ratios (1:9, 2:8, 3:7, 4:6, 5:5, 6:4, 7:3, 8:2 and 9:1) to form homogenous isotropic
mixtures and were slowly titrated with aqueous phase. The amount of aqueous phase
added was at interval of 5% v/v. After each addition of aqueous phase, visual
observations were made as clear nanoemulsions, nanoemulsion gels, emulsions or
emulsion gels. Oil, surfactants and cosurfactants were grouped in three different
combinations for phase studies (Table 9).

Materials and Methods
86 | P a g e
Table 9. Oil, surfactants and cosurfactants grouped in different combinations
Group Oil Surfactant Co-surfactant
I CTX 500+ Capmul MCM Tween 80 PEG 400
II CTX 500+ Capmul MCM Tween 80 + Cremophor EL PEG 400
III CTX 500+ Capmul MCM Tween 80 + Cremophor EL PEG 400 + Transcutol
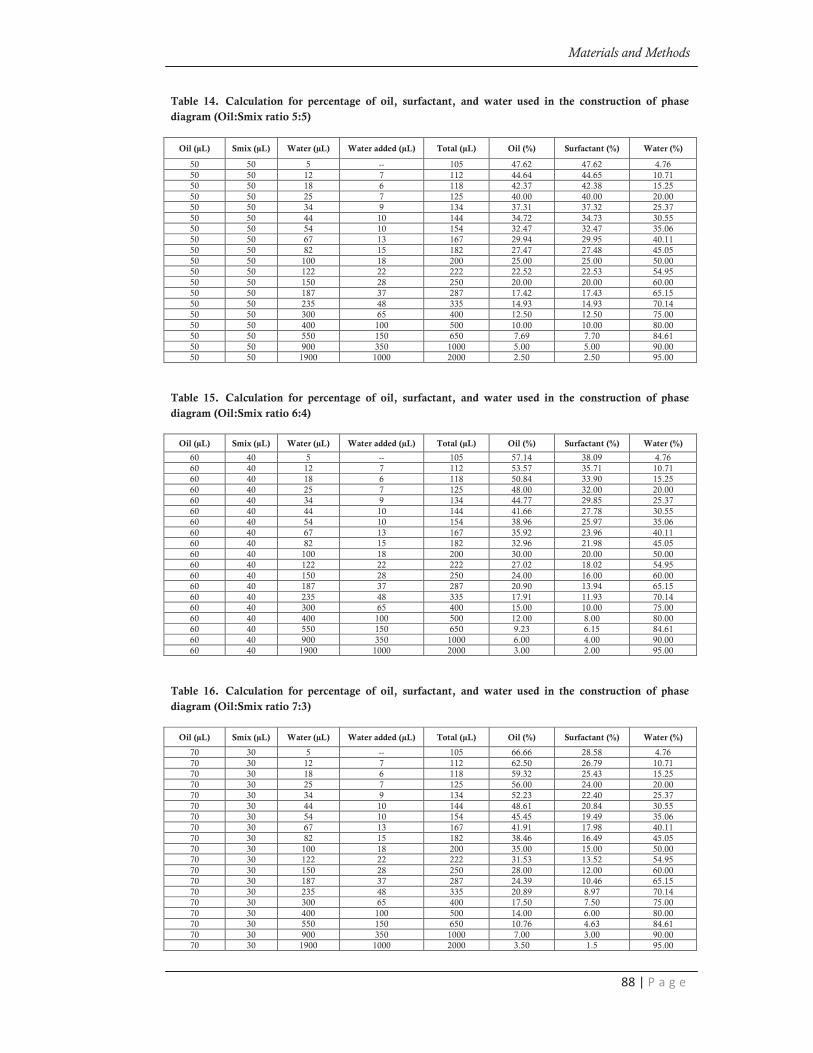
Pseudoternary phase diagrams were constructed using Chemix Software Ver.3.50 (MN,
USA). The calculation for the addition of aqueous phase was done by calculating the
percentage of each component of the nanoemulsion at each addition. The calculation of
percentage of components for construction of phase diagrams is shown in Table 10-18.
The physical state was plotted on a pseudo-three-component phase diagram with one
axis representing the aqueous phase, the second representing the oil phase, and third
representing a mixture of surfactant and cosurfactant (smix) at a fixed volume ratio. For
each smix ratio, a separate phase diagram was constructed. In the phase diagrams, only
NE points were plotted (shaded area), so that there is no overcrowding of the phases in
the diagram, as for formulation development only the nanoemulsion area is of interest.
Table 10. Calculation for percentage of oil, surfactant, and water used in the construction of phase
diagram (Oil:Smix ratio 1:9)
Oil (µL) Smix (µL) Water (µL) Water added (µL) Total (µL) Oil (%) Surfactant (%) Water (%)
10 90 5 -- 105 9.52 85.72 4.76
10 90 12 7 112 8.92 80.37 10.71
10 90 18 6 118 8.47 76.28 15.25
10 90 25 7 125 8.00 72.00 20.00
10 90 34 9 134 7.46 67.17 25.37
10 90 44 10 144 6.94 62.51 30.55
10 90 54 10 154 6.49 58.45 35.06
10 90 67 13 167 5.98 53.91 40.11
10 90 82 15 182 5.49 49.46 45.05
10 90 100 18 200 5.00 45.00 50.00
10 90 122 22 222 4.50 40.55 54.95
10 90 150 28 250 4.00 36.00 60.00
10 90 187 37 287 3.48 31.37 65.15
10 90 235 48 335 2.98 26.88 70.14
10 90 300 65 400 2.50 22.50 75.00
10 90 400 100 500 2.00 18.00 80.00
10 90 550 150 650 1.53 13.86 84.61
10 90 900 350 1000 1.00 9.00 90.00
10 90 1900 1000 2000 0.50 4.50 95.00

Materials and Methods
87 | P a g e
Table 11. Calculation for percentage of oil, surfactant, and water used in the construction of phase
diagram (Oil:Smix ratio 2:8)
Oil (µL) Smix (µL) Water (µL) Water added (µL) Total (µL) Oil (%) Surfactant (%) Water (%)
20 80 5 -- 105 19.04 76.20 4.76
20 80 12 7 112 17.85 71.44 10.71
20 80 18 6 118 16.94 67.81 15.25
20 80 25 7 125 16.00 64.00 20.00
20 80 34 9 134 14.92 59.71 25.37
20 80 44 10 144 13.88 55.57 30.55
20 80 54 10 154 12.98 51.96 35.06
20 80 67 13 167 11.97 47.92 40.11
20 80 82 15 182 10.98 43.97 45.05
20 80 100 18 200 10.00 40.00 50.00
20 80 122 22 222 9.00 36.05 54.95
20 80 150 28 250 8.00 32.00 60.00
20 80 187 37 287 6.96 27.89 65.15
20 80 235 48 335 5.97 23.89 70.14
20 80 300 65 400 5.00 20.00 75.00
20 80 400 100 500 4.00 16.00 80.00
20 80 550 150 650 3.07 12.32 84.61
20 80 900 350 1000 2.00 8.00 90.00
20 80 1900 1000 2000 1.00 4.00 95.00
Table 12. Calculation for percentage of oil, surfactant, and water used in the construction of phase
diagram (Oil:Smix ratio 3:7)
Oil (µL) Smix (µL) Water (µL) Water added (µL) Total (µL) Oil (%) Surfactant (%) Water (%)
30 70 5 -- 105 28.57 66.66 4.76
30 70 12 7 112 26.78 62.50 10.71
30 70 18 6 118 25.42 59.32 15.25
30 70 25 7 125 24.00 56.00 20.00
30 70 34 9 134 22.38 52.24 25.37
30 70 44 10 144 20.83 48.61 30.55
30 70 54 10 154 19.48 45.45 35.06
30 70 67 13 167 17.96 41.92 40.11
30 70 82 15 182 16.48 38.46 45.05
30 70 100 18 200 15.00 35.00 50.00
30 70 122 22 222 13.51 31.53 54.95
30 70 150 28 250 12.00 28.00 60.00
30 70 187 37 287 10.45 24.39 65.15
30 70 235 48 335 8.95 20.89 70.14
30 70 300 65 400 7.50 17.50 75.00
30 70 400 100 500 6.00 14.00 80.00
30 70 550 150 650 4.61 10.77 84.61
30 70 900 350 1000 3.00 7.00 90.00
30 70 1900 1000 2000 1.50 3.50 95.00
Table 13. Calculation for percentage of oil, surfactant, and water used in the construction of phase
diagram (Oil:Smix ratio 4:6)
Oil (µL) Smix (µL) Water (µL) Water added (µL) Total (µL) Oil (%) Surfactant (%) Water (%)
40 60 5 -- 105 38.09 57.14 4.76
40 60 12 7 112 35.71 53.57 10.71
40 60 18 6 118 33.89 50.85 15.25
40 60 25 7 125 32.00 48.00 20.00
40 60 34 9 134 29.85 44.77 25.37
40 60 44 10 144 27.77 41.67 30.55
40 60 54 10 154 25.97 38.96 35.06
40 60 67 13 167 23.95 35.93 40.11
40 60 82 15 182 21.97 32.97 45.05
40 60 100 18 200 20.00 30.00 50.00
40 60 122 22 222 18.01 27.03 54.95
40 60 150 28 250 16.00 24.00 60.00
40 60 187 37 287 13.93 20.91 65.15
40 60 235 48 335 11.94 17.90 70.14
40 60 300 65 400 10.00 15.00 75.00
40 60 400 100 500 8.00 12.00 80.00
40 60 550 150 650 6.15 9.23 84.61
40 60 900 350 1000 4.00 6.00 90.00
40 60 1900 1000 2000 2.00 3.00 95.00
Materials and Methods
88 | P a g e
Table 14. Calculation for percentage of oil, surfactant, and water used in the construction of phase
diagram (Oil:Smix ratio 5:5)
Oil (µL) Smix (µL) Water (µL) Water added (µL) Total (µL) Oil (%) Surfactant (%) Water (%)
50 50 5 -- 105 47.62 47.62 4.76
50 50 12 7 112 44.64 44.65 10.71
50 50 18 6 118 42.37 42.38 15.25
50 50 25 7 125 40.00 40.00 20.00
50 50 34 9 134 37.31 37.32 25.37
50 50 44 10 144 34.72 34.73 30.55
50 50 54 10 154 32.47 32.47 35.06
50 50 67 13 167 29.94 29.95 40.11
50 50 82 15 182 27.47 27.48 45.05
50 50 100 18 200 25.00 25.00 50.00
50 50 122 22 222 22.52 22.53 54.95
50 50 150 28 250 20.00 20.00 60.00
50 50 187 37 287 17.42 17.43 65.15
50 50 235 48 335 14.93 14.93 70.14
50 50 300 65 400 12.50 12.50 75.00
50 50 400 100 500 10.00 10.00 80.00
50 50 550 150 650 7.69 7.70 84.61
50 50 900 350 1000 5.00 5.00 90.00
50 50 1900 1000 2000 2.50 2.50 95.00
Table 15. Calculation for percentage of oil, surfactant, and water used in the construction of phase
diagram (Oil:Smix ratio 6:4)
Oil (µL) Smix (µL) Water (µL) Water added (µL) Total (µL) Oil (%) Surfactant (%) Water (%)
60 40 5 -- 105 57.14 38.09 4.76
60 40 12 7 112 53.57 35.71 10.71
60 40 18 6 118 50.84 33.90 15.25
60 40 25 7 125 48.00 32.00 20.00
60 40 34 9 134 44.77 29.85 25.37
60 40 44 10 144 41.66 27.78 30.55
60 40 54 10 154 38.96 25.97 35.06
60 40 67 13 167 35.92 23.96 40.11
60 40 82 15 182 32.96 21.98 45.05
60 40 100 18 200 30.00 20.00 50.00
60 40 122 22 222 27.02 18.02 54.95
60 40 150 28 250 24.00 16.00 60.00
60 40 187 37 287 20.90 13.94 65.15
60 40 235 48 335 17.91 11.93 70.14
60 40 300 65 400 15.00 10.00 75.00
60 40 400 100 500 12.00 8.00 80.00
60 40 550 150 650 9.23 6.15 84.61
60 40 900 350 1000 6.00 4.00 90.00
60 40 1900 1000 2000 3.00 2.00 95.00
Table 16. Calculation for percentage of oil, surfactant, and water used in the construction of phase
diagram (Oil:Smix ratio 7:3)
Oil (µL) Smix (µL) Water (µL) Water added (µL) Total (µL) Oil (%) Surfactant (%) Water (%)
70 30 5 -- 105 66.66 28.58 4.76
70 30 12 7 112 62.50 26.79 10.71
70 30 18 6 118 59.32 25.43 15.25
70 30 25 7 125 56.00 24.00 20.00
70 30 34 9 134 52.23 22.40 25.37
70 30 44 10 144 48.61 20.84 30.55
70 30 54 10 154 45.45 19.49 35.06
70 30 67 13 167 41.91 17.98 40.11
70 30 82 15 182 38.46 16.49 45.05
70 30 100 18 200 35.00 15.00 50.00
70 30 122 22 222 31.53 13.52 54.95
70 30 150 28 250 28.00 12.00 60.00
70 30 187 37 287 24.39 10.46 65.15
70 30 235 48 335 20.89 8.97 70.14
70 30 300 65 400 17.50 7.50 75.00
70 30 400 100 500 14.00 6.00 80.00
70 30 550 150 650 10.76 4.63 84.61
70 30 900 350 1000 7.00 3.00 90.00
70 30 1900 1000 2000 3.50 1.5 95.00
Materials and Methods
89 | P a g e
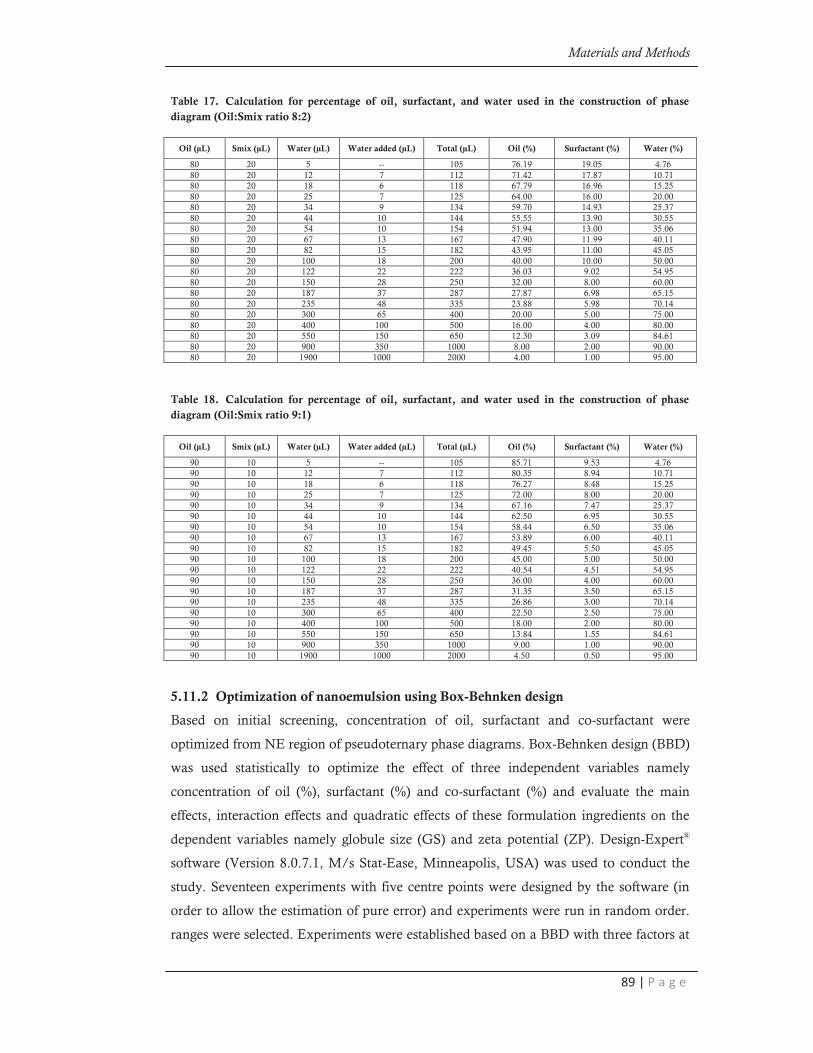
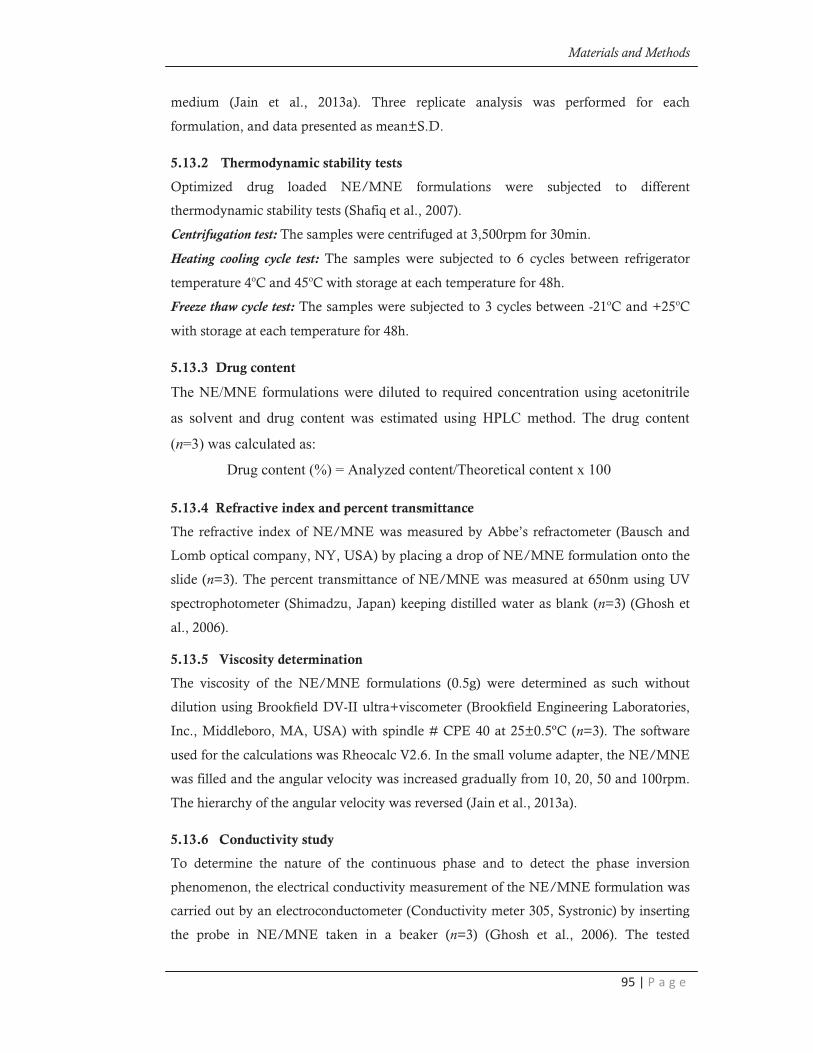
Table 17. Calculation for percentage of oil, surfactant, and water used in the construction of phase
diagram (Oil:Smix ratio 8:2)
Oil (µL) Smix (µL) Water (µL) Water added (µL) Total (µL) Oil (%) Surfactant (%) Water (%)
80 20 5 -- 105 76.19 19.05 4.76
80 20 12 7 112 71.42 17.87 10.71
80 20 18 6 118 67.79 16.96 15.25
80 20 25 7 125 64.00 16.00 20.00
80 20 34 9 134 59.70 14.93 25.37
80 20 44 10 144 55.55 13.90 30.55
80 20 54 10 154 51.94 13.00 35.06
80 20 67 13 167 47.90 11.99 40.11
80 20 82 15 182 43.95 11.00 45.05
80 20 100 18 200 40.00 10.00 50.00
80 20 122 22 222 36.03 9.02 54.95
80 20 150 28 250 32.00 8.00 60.00
80 20 187 37 287 27.87 6.98 65.15
80 20 235 48 335 23.88 5.98 70.14
80 20 300 65 400 20.00 5.00 75.00
80 20 400 100 500 16.00 4.00 80.00
80 20 550 150 650 12.30 3.09 84.61
80 20 900 350 1000 8.00 2.00 90.00
80 20 1900 1000 2000 4.00 1.00 95.00
Table 18. Calculation for percentage of oil, surfactant, and water used in the construction of phase
diagram (Oil:Smix ratio 9:1)
Oil (µL) Smix (µL) Water (µL) Water added (µL) Total (µL) Oil (%) Surfactant (%) Water (%)
90 10 5 -- 105 85.71 9.53 4.76
90 10 12 7 112 80.35 8.94 10.71
90 10 18 6 118 76.27 8.48 15.25
90 10 25 7 125 72.00 8.00 20.00
90 10 34 9 134 67.16 7.47 25.37
90 10 44 10 144 62.50 6.95 30.55
90 10 54 10 154 58.44 6.50 35.06
90 10 67 13 167 53.89 6.00 40.11
90 10 82 15 182 49.45 5.50 45.05
90 10 100 18 200 45.00 5.00 50.00
90 10 122 22 222 40.54 4.51 54.95
90 10 150 28 250 36.00 4.00 60.00
90 10 187 37 287 31.35 3.50 65.15
90 10 235 48 335 26.86 3.00 70.14
90 10 300 65 400 22.50 2.50 75.00
90 10 400 100 500 18.00 2.00 80.00
90 10 550 150 650 13.84 1.55 84.61
90 10 900 350 1000 9.00 1.00 90.00
90 10 1900 1000 2000 4.50 0.50 95.00
5.11.2 Optimization of nanoemulsion using Box-Behnken design
Based on initial screening, concentration of oil, surfactant and co-surfactant were
optimized from NE region of pseudoternary phase diagrams. Box-Behnken design (BBD)
was used statistically to optimize the effect of three independent variables namely
concentration of oil (%), surfactant (%) and co-surfactant (%) and evaluate the main
effects, interaction effects and quadratic effects of these formulation ingredients on the
dependent variables namely globule size (GS) and zeta potential (ZP). Design-Expert®
software (Version 8.0.7.1, M/s Stat-Ease, Minneapolis, USA) was used to conduct the
study. Seventeen experiments with five centre points were designed by the software (in
order to allow the estimation of pure error) and experiments were run in random order.
ranges were selected. Experiments were established based on a BBD with three factors at

Materials and Methods
90 | P a g e
three levels and each independent variable were coded at three levels between −1, 0 and
+1 as shown in Table 19.
Table 19. Factor level for Box-Behnken design for optimization of nanoemulsion
Independent factors Design level
Uncoded Coded Uncoded level Coded level
Concentration of Oil (%) A
10.00 -1
14.00 0
18.00 +1
Concentration of Surfactant (%) B
25.00 -1
30.00 0
35.00 +1
Concentration of Co-surfactant (%) C
10.00 -1
15.00 0
20.00 +1
5.11.3 Optimization of mucoadhesive nanoemulsion using full factorial design
Further to study the effect of chitosan on GS and ZP, a 24
factorial design was studied
using concentration of oil (10-14%), surfactant (30-35%), co-surfactant (15-20%) and
chitosan (0.10-0.25%) as independent factors. A total of 16 experiments were by the
software and experiments were run in random order. Table 20 shows the coded and
uncoded independent variables.
Table 20. Factor level for 24 design for optimization of mucoadhesive nanoemulsions
Independent factors Design level
Uncoded Coded Uncoded level Coded level
Concentration of Oil (%) A 10.00 -1
14.00 +1
Concentration of Surfactant (%) B 30.00 -1
35.00 +1
Concentration of Co-surfactant (%) C 15.00 -1
20.00 +1
Concentration of Chitosan (%) D 0.10 -1
0.25 +1
Mucoadhesive nanoemulsions (MNEs) were prepared by initially preparing
nanoemulsion of drug using minimum volume of external phase and then adding

Materials and Methods
91 | P a g e
chitosan solution (1%, w/v) so that final concentration of chitosan in nanoemulsion was
achieved (Kumar et al., 2009).
5.12 Formulation of nanostructured lipid carriers
Drug-loaded DZP and CUR nanostructured lipid carriers (NLCs) were prepared by a
microemulsion method as reported earlier (Sood et al., 2013). The chosen solid lipid and
liquid lipid were melted at 75oC, to which drug was added under continuous stirring for
5min. Twenty milliliter of hydrophilic surfactant solution heated to same temperature
was added to the melted lipid as a continuous phase, with mechanical stirring for 15min.
A clear warm oil-in-water (o/w) microemulsion was formed under stirring at a
temperature above the melting point of the lipid used. The warm o/w microemulsion
constitutes the internal phase. NLC dispersions were obtained by dispersing the warm
o/w microemulsion dropwise into ice cold distilled water (external phase) maintained at
(3-4oC) in a beaker under continuous stirring using triple blade stirrer. The dispersion was
centrifuged at 10,000rpm for 20min and supernatant was discarded. The resulting NLC
pellet was redispersed using millipore water and centrifuged again. The procedure was
repeated twice to remove both free surfactant and free drug molecules and the resultant
dispersion was finally lyophilized. In a similar manner, blank NLC formulation was also
prepared without incorporating the drug to lipid matrix.
Fig. 13. Representation of preparation of nanostructured lipid carriers using microemulsion
technique

Materials and Methods
92 | P a g e
5.12.1 Study on the effect of formulation/process variables
The effect of formulation/process variables such as stirring time, stirring speed, lipid
concentration, type and concentration of surfactant on the particle size was studied. To
investigate the effect of formulation/process variables, each time one parameter was
varied, keeping the others as constant. From the results obtained, optimum level of
variables was selected and kept constant in the subsequent evaluations.
Effect of stirring time
Four different batches of lipid nanoparticles were prepared corresponding to 1, 2, 3 and
4h stirring time, keeping the following parameters as constant,
Lipid concentration : 1% w/v
Stirring speed : 2000rpm
Surfactant concentration (Pluronic F 68) : 2% w/v
Internal:External phase ratio : 1:10
Effect of stirring speed
Four different batches of lipid nanoparticles were prepared corresponding to 1000, 1500,
2000 and 2500rpm stirring speed, keeping the following parameters as constant,
Lipid concentration : 1% w/v
Stirring time : 2h
Surfactant concentration (Pluronic F 68) : 2% w/v
Internal:External phase ratio : 1:10
Effect of lipid concentration
Four different batches of lipid nanoparticles were prepared corresponding to 0.5%, 1%,
1.5% and 2% w/v lipid concentration, keeping the following parameters as constant,
Stirring speed : 2000rpm
Stirring time : 2h
Surfactant concentration (Pluronic F 68) : 2% w/v
Internal:External phase ratio : 1:10
Effect of surfactant type
Five different batches of lipid nanoparticles were prepared using different type of
surfactants viz. Tween 20, Tween 80, Cremophor EL, Pluronic F68 and Pluronic F127,
keeping the following parameters as constant,
Stirring time : 3h
Stirring speed : 1500rpm
Lipid concentration : 1.5 % w/v
Surfactant concentration : 2% w/v
Internal:External phase ratio : 1:10

Materials and Methods
93 | P a g e
Effect of surfactant concentration
Five different batches of lipid nanoparticles were prepared corresponding to 1, 1.5, 2.0,
2.5 and 3% w/v surfactant concentration, keeping the following parameters as constant,
Stirring speed : 2000rpm
Stirring time : 2h
Lipid concentration : 1.5 % w/v
Internal:External phase ratio : 1:10
Effect of ratio of internal phase to external aqueous phase
Four different batches of lipid nanoparticles were prepared and corresponding to different
ratios of internal to external aqueous phase (1:1, 1:5, 1:10, 1:20), keeping the following
parameters as constant,
Stirring speed : 2000rpm
Stirring time : 2h
Lipid concentration : 1.5 % w/v
Surfactant concentration : 2.5 % w/v
5.12.2 Optimization of nanostructured lipid carriers using Box-Behnken design
Based on number of factors and their level, Box-Behnken design (BBD) was used for
formulation optimization of donepezil NLC (D-NLC) and curcumin (C-NLC). The
coded and uncoded independent variables for both D-NLC and C-NLC are given in
Table 21. A total of 29 experiments were carried out using Design expert® software.
Table 21. Factor level for Box-Behnken design for optimization of donepezil and curcumin
nanostructured lipid carriers
Independent factors Design level
Uncoded Coded Uncoded level Coded level
Lipid concentration (% w/v) A
0.25 -1
0.88 0
1.50 +1
Liquid lipid to total lipid ratio B
0.05 -1
0.17 0
0.30 +1
Drug to lipid ratio C
0.10 -1
0.15 0
0.20 +1
Surfactant concentration (% w/v) D
1.00 -1
1.75 0
2.50 +1

Materials and Methods
94 | P a g e
The effect of four independent variables viz. concentration of lipid (0.25-1.50% w/v),
liquid lipid to total lipid ratio (0.05-0.30), drug to lipid ratio (0.10-0.20) and surfactant
concentration (1.0-2.5% w/v) on dependent variables viz. particle size (PS), drug loading
(DL) and entrapment efficiency (EE) were studied at three different levels, coded as –1, 0
and 1. BBD is an independent, rotatable quadratic design with no embedded factorial or
fractional factorial points where the variable combinations are at the midpoints of the
edges of variable space and at the center.
5.12.3 Optimization of cryoprotectant concentration
Lyophilization of the NLC dispersion was carried out by using 1%, 2% and 5% (w/v) of
mannitol, sucrose, lactose and dextrose as cryoprotectants. The NLC dispersions were
frozen in aqueous cryoprotectant solution at -20oC for about 24h and then the samples
were transferred to the freeze-dryer (Christ, Alpha 2-4 LD plus, Germany) operated at -
40oC and pressure of 0.001bar for 72h to obtained the NLC powders for further
experiments. Freeze dried NLC were characterized for PS, PDI and redispersibility. The
Sf/Si ratio of freeze dried NLC was calculated where Sf and Si indicates particle size
after and before freeze drying respectively. To assess the redispersibility of lyophilized
NLCs, 50mg of product was redispersed in 1 mL of millipore water and visually assessed
using following grading system:
Grade A: Readily redispersible (<15 sec, clear solution)
Grade B: Moderately redispersible (>15 sec, clear to translucent solution)
Grade C: Poorly redispersible ( does not redisperse, presence of large particles)
5.13 Evaluation
5.13.1 Particle /globule size and zeta potential analysis
The mean particle/globule size and ZP of NLC and NE/MNE were determined using a
zetasizer ZS 90 (Malvern Instruments, UK). The mean particle/globule size was
measured based on photon correlation spectroscopy technique that analyzes the
fluctuations in dynamic light scattering due to brownian motion of the particles. The
mean diameter was obtained at an angle of 90° in 10 mm diameter cells at 25°C. The ZP,
reflecting the electric charge on the particle surface, is a very useful way of evaluating the
physical stability of any colloidal system. It was determined based on an electrophoretic
light scattering technique (Jain et al., 2013b). All size and ZP measurements were carried
out at 25oC using disposable polystyrene cells and disposable plain folded capillary zeta
cells, respectively, after appropriate dilution of all samples with original dispersion
Materials and Methods
95 | P a g e
medium (Jain et al., 2013a). Three replicate analysis was performed for each
formulation, and data presented as mean±S.D.
5.13.2 Thermodynamic stability tests
Optimized drug loaded NE/MNE formulations were subjected to different
thermodynamic stability tests (Shafiq et al., 2007).
Centrifugation test: The samples were centrifuged at 3,500rpm for 30min.
Heating cooling cycle test: The samples were subjected to 6 cycles between refrigerator
temperature 4oC and 45oC with storage at each temperature for 48h.
Freeze thaw cycle test: The samples were subjected to 3 cycles between -21oC and +25oC
with storage at each temperature for 48h.
5.13.3 Drug content
The NE/MNE formulations were diluted to required concentration using acetonitrile
as solvent and drug content was estimated using HPLC method. The drug content
(n=3) was calculated as:
Drug content (%) = Analyzed content/Theoretical content x 100
5.13.4 Refractive index and percent transmittance
The refractive index of NE/MNE was measured by Abbe’s refractometer (Bausch and
Lomb optical company, NY, USA) by placing a drop of NE/MNE formulation onto the
slide (n=3). The percent transmittance of NE/MNE was measured at 650nm using UV
spectrophotometer (Shimadzu, Japan) keeping distilled water as blank (n=3) (Ghosh et
al., 2006).
5.13.5 Viscosity determination
The viscosity of the NE/MNE formulations (0.5g) were determined as such without
dilution using Brookfield DV-II ultra+viscometer (Brookfield Engineering Laboratories,
Inc., Middleboro, MA, USA) with spindle # CPE 40 at 25±0.5ºC (n=3). The software
used for the calculations was Rheocalc V2.6. In the small volume adapter, the NE/MNE
was filled and the angular velocity was increased gradually from 10, 20, 50 and 100rpm.
The hierarchy of the angular velocity was reversed (Jain et al., 2013a).
5.13.6 Conductivity study
To determine the nature of the continuous phase and to detect the phase inversion
phenomenon, the electrical conductivity measurement of the NE/MNE formulation was
carried out by an electroconductometer (Conductivity meter 305, Systronic) by inserting
the probe in NE/MNE taken in a beaker (n=3) (Ghosh et al., 2006). The tested
Materials and Methods
96 | P a g e
NE/MNE was prepared with a 0.01N aqueous solution of sodium chloride (NaCl)
instead of distilled water.
5.13.7 Determination of pH
The pH of the NE/MNE formulations was measured using digital pH meter (n=3)
(Eutech instruments, Mumbai).
5.13.8 Determination of entrapment efficiency and drug loading percentage
Entrapment efficiency (EE) and drug loading (DL) percentage of lyophilized NLCs were
determined according to the procedure described earlier (Sood et al., 2013). Weighed
quantity of lyophilized drug loaded NLC (10mg) were suspended in hydroalcholic
solution (ethanol and water in 50:50) under water bath 75-80oC for 30min. This ensures
melting of NLC and release of entrapped drug in media. The solution is allowed to cool
at room temperature to preferentially precipitate the lipid. The amount of drug in the
supernatant after centrifugation (10,000rpm for 30min) was determined by HPLC (n=3).
Entrapment efficiency (%) = Wdrug/ Wtotal x 100 (3)
Drug loading (%) = Wdrug/ Wlipid x 100 (4)
Wdrug; analyzed amount of drug in the supernatant,
Wtotal; total amount of drug used in formulation,
Wlipid; weight of lyophilized NLC formulation.
5.13.9 Scanning electron microscopy (SEM)
External surface morphology of lyophilized drug loaded NLC was recorded using SEM
(FEI QUANTA 200 SEM/EDAX, UK) at 20kV as an accelerating voltage (Sood et al.,
2013). Weighed amount of samples (5-7mg) were mounted on an aluminium stub with
double sided adhesive tape. The tape was firmly attached to the stub and lyophilized
sample was scattered carefully over its surface. The stub with the sample was then sputter
coated with a thin layer of gold to make the sample conductive. Processed sample was
subjected to SEM analysis. The images were captured under magnification of 10,000-
15,000x and recorded.
5.13.10 Transmission electron microscopy (TEM)
The shape and morphology of drug loaded NLC dispersion and drug loaded NE were
analyzed using TEM (TOPCON 002B, USA) at an accelerating voltage of 200kV (Jain et
al., 2013a). Prior to the analysis, the samples were diluted 100 times with double distilled
water and a drop (5-10µL) was placed onto carbon-coated 200-mesh copper grids to
create a thin film. Before the film dried on the grid, the samples were negatively stained
with 2% w/v phosphotungstic acid by adding a drop of the staining solution to the film
Materials and Methods
97 | P a g e
for 30s; any excess droplets were drained off with a filter paper. The grid was allowed to
air-dry under room temperature. Digital micrograph and soft imaging viewer software
were used to capture the image of samples.
5.13.11 Differential Scanning Calorimetry (DSC)
The crystalline behavior of both drug and lipid was studied by DSC. Thermograms were
recorded for pure drug, lipid and lyophilized drug loaded NLC. DSC was carried out as
per the procedure described earlier. Degree of crystallinity of lyophilized drug loaded
NLC was calculated by comparing the enthalpy of NLC with enthalpy of bulk lipid
(Freitas and Müller, 1999). The melting enthalpy of bulk lipid was used as a reference
(100%) to calculate the percentage of crystallinity of NLC.
(5)
where, ∆H NLC indicates enthalpy of freeze dried NLC
∆Hbulk indicates enthalpy of bulk lipid.
5.13.12 Powder X-Ray Diffraction (PXRD)
PXRD patterns were recorded for pure drug, lipid, physical mixture (drug and lipid in
1:1) and lyophilized drug loaded NLC. PXRD pattern of samples were collected using a
Bruker AXS D8 Advance powder diffractometer, USA. The samples were exposed to Cu
Kα radiation generated at 40kV, 35mA and scanned from 3o to 80o, 2θ at a step size of
0.020o and step time of 31.2s.
5.13.13 In vitro Release Studies
The release of drug from developed formulations (NLC and NE/MNE) and solution was
performed in SNF pH 6.4 containing 1% SLS using the dialysis bag method (Sood et al.,
2013). For both the drugs, solution was prepared by dissolving 80 mg of DZP and 120
mg of CUR in a mixture of 1mL ethanol and 2mL propylene glycol and finally volume
was made to 10mL with distilled water separately to produce concentration of 8mg/mL
for DZP and 12mg/mL for CUR. Dialysis membrane having pore size of 2.4nm and
molecular weight cut off 12,000-14,000 (Dialysis membrane-150, HiMedia, Mumbai,
India) was used. The bags were soaked in distilled water for 24h before use. Drug
solution, lyophilized drug loaded NLC and drug loaded NE/MNE were placed in
dialysis bags separately and sealed at both the ends. The bags were placed in baskets
(USP Dissolution apparatus Type I, LabIndia, Mumbai) and immersed in 500mL of
dissolution medium maintained at 37±0.5oC and stirred at 100rpm. Aliquots of the

Materials and Methods
98 | P a g e
samples were withdrawn from dissolution medium at regular time intervals and same
volume of fresh dissolution medium was replaced to maintain a constant volume. The
samples were analyzed for drug content by HPLC (n=3). The drug release profile was
constructed by plotting the cumulative percent drug release versus time (h). The kinetic
analysis of the release data were fitted to various kinetic models such as zero order, first
order and Higuchi’s equation (Costa and Lobo, 2001).
5.13.14 Ex vivo Permeation Studies
To investigate the permeation efficacy of drug from NLC, NE/MNE and solution across
the freshly excised sheep nasal mucosa, ex vivo permeation studies were performed using
the Franz diffusion cell with surface area of 1.79cm2 and volume of 25mL (Kovai Glass
Works, Coimbatore, India) (Seju et al., 2011). The freshly excised sheep nasal mucosa
was collected from the slaughter house in PBS, pH 6.4. Excised superior nasal membrane
was cut to an appropriate size and thickness (0.2mm), made free from adhered tissues
and mounted between the donor and receptor compartment of the Franz diffusion cell,
with mucosal side facing the donor compartment. The mounted tissue was allowed to
stabilize and stirred under SNF pH 6.4 containing 1% SLS (diffusion medium) for 15min
on a magnetic stirrer. The diffusion cell was thermostated at 37±0.5oC. Solution from
both the compartments was removed after 15min, and the receptor compartment was
freshly filled with diffusion medium. The mounting of nasal membrane was done on the
rim of the receptor compartment; the donor compartment of diffusion cell was placed
over it and secured with a clamp to avoid the leakage of diffusion media. Permeation
studies of pure drug solution, lyophilized drug loaded NLC reconstituted with SNF and
drug loaded NE/MNE were carried out by placing 1mL onto stabilized sheep nasal
membrane on donor compartment and continuously magnetic stirred at 600rpm. Aliquot
(0.5mL) of media were withdrawn from the receptor compartment at predetermined time
intervals, filtered through 0.45µm nylon filter paper and analyzed for drug content using
HPLC. Each removed sample was replaced immediately by an equal volume of fresh
diffusion media maintained at 37±0.5oC to maintain the constant volume at each time
interval. Each study was carried out for a period of 6h, during which the amount of drug
permeated across the sheep nasal mucosal membrane was determined at each sampling
point using HPLC (n=3). The permeation profile was constructed by plotting the amount
of drug permeated per unit skin surface area (µg/cm2) versus time (h). The steady state
flux (Jss, µg /cm2.h) was calculated from slope of the plot using linear regression analysis.
The kinetic analysis of the release data were fitted to various kinetic models such as zero
order, first order and Higuchi’s equation (Costa and Lobo, 2001).
Materials and Methods
99 | P a g e
5.14 Toxicity assessment
The toxicological assessment of the developed lipid based nano formulations (NE and
NLC) were carried out using in vitro cytotoxicity assay on SK-N-SH cell line, in vitro
hemolytic toxicity on rat erythrocytes and nasal ciliotoxicity study on sheep nasal
mucosa stained with H and E stain to assess the safety of the developed formulations to
brain cells, blood and for nasal epithelium respectively.
5.14.1 In vitro cytotoxicity assay
The toxicity studies of the blank and drug loaded formulations (NE/MNE and NLC)
were carried out in SK-N-SH cells, a human neuroblastoma cell line. The cells were
maintained in minimum essential medium (MEM), supplemented with 10% v/v FBS,
penicillin (100 IU/mL), streptomycin (100μg/mL) and amphotericin B (5μg/mL) in a
humidified atmosphere of 5% CO2 at 37°C until confluent. The cells were then seeded in
multiwall culture plates for experimental procedure. The cytotoxicity assay was carried
out using cell suspension, containing 5,000 cells seeded in each well of a 96 well
microtiter plate (Nunc and Tarsons, Kolkata, India) and incubated for 24h at 37°C. Cells
were treated with 250-2,000μg/mL concentration of nanoformulations. Control cells
were incubated without the test compound and with MEM. The microtiter plates were
incubated at 37°C in a humidified incubator with 5% CO2 for a period of 72h.
Morphological changes in the cells were inspected daily and observed for microscopically
detectable alterations, i.e., loss of monolayer, granulation and vaculation in the
cytoplasm. The cytopathic effect was observed. A plot of % growth inhibition versus
concentration was plotted to determine the IC50 value (Concentration of the drug that
produces 50% inhibition of the cells) by SRB (Sulphorhodamine B) assay (Skehan et al.,
1990).
5.14.2 In vitro hemolytic toxicity
The hemolytic activity has been suggested as a toxicity screen in vitro and it also serves
as a simple and reliable measure for estimating the membrane damage caused by
formulation in vivo. The in vitro hemolytic potential of the formulations was studied by
using the method proposed by Jumaa et al. (Jumaa et al., 1999). The Fresh blood from
rats was collected in a vial containing ethylene diamine tetraacetic acid (EDTA) as an
anticoagulant. Blood was centrifuged at 3000rpm for 20min to remove white blood cells
(WBC) debris and suspended RBCs were taken out. The RBCs were washed 3 times with
isotonic saline solution (0.15M NaCl and pH 7.4) before diluting with buffer to prepare
erythrocyte stock dispersion. The RBC cell suspension was adjusted to 50% hematocrit.
Hemolysis experiments were carried out for both blank and drug loaded formulations of
NE and NLC at a concentration of 0, 5, 10, 25, 50, 100, 250 and 500μg/mL. Incubation
Materials and Methods
100 | P a g e
was carried at 37oC for a period of 1h. After incubation under shaking, debris and intact
RBCs was removed by centrifugation and 100µL of resulting supernatant was dissolved
in 2mL of an ethanol/hydrochloric acid (HCl) mixture (39:1, 99% ethanol and HCl,
w/v). This mixture dissolves all components and avoids the precipitation of hemoglobin.
The absorbance of the mixture was determined at 398nm by spectrophotometer
monitoring against a blank sample. Control sample of 0% lysis (in buffer) and 100% lysis
(in Triton X 100) was employed in the experiment. The % hemolysis caused by the test
sample (n=3) was calculated by following equation:
% Hemolysis = Absorbance of Test - Absorbance at 0% x 100 (6)
Absorbance at 100% lysis - Absorbance at 0%
5.14.3 Nasal ciliotoxicity studies on sheep nasal mucosa
Nasal ciliotoxicity studies were carried out using the freshly isolated sheep nasal mucosa
collected from a slaughter house in a phosphate buffered saline (PBS) pH 6.4 (Seju et al.,
2011). Each piece was treated with drug solution in PBS pH 6.4, blank NLC, lyophilized
drug loaded NLC, blank NE, drug loaded NE/MNE, PBS pH 6.4 (as negative control)
and isopropyl alcohol (IPA) (nasal mucociliary toxicity agent used as a positive control),
respectively. After treatment for 2h, all the samples were washed properly with distilled
water and were preserved with 10% formalin until further analysis. Each sample was
sectioned and stained with H and E. The mucosa was then dissected out, and the
mucocilia was examined on an optical microscope by a pathologist.
5.15 Stability studies
The optimized batch of lyophilized drug loaded NLC and drug loaded NE/MNE were
evaluated for long term stability for 6 months at 4±1oC and 25±1oC (n=3). Samples were
transferred in amber colored glass vials, sealed and were stored upright. NE/MNE
formulations samples were withdrawn at specified time intervals (0, 1, 3 and 6 months of
storage) and assessed for any change in GS, ZP, refractive index, drug content, viscosity
and pH in addition to physical appearance (clarity and phase separation). The clarity and
phase separation of the NE/MNE formulations were determined by visual examination
under light alternatively against white and black backgrounds. NLC formulations were
rehydrated with ultrapure water and evaluated for any change in PS, ZP, DL and EE at
specified time intervals (0, 1, 3 and 6 months of storage). Further, polymorphic transition
of lipid in NLC formulations upon storage at 25±1oC was assessed using DSC and
thermograms were recorded at 0 and 6 months.

Materials and Methods
101 | P a g e
5.16 Pharmacokinetic and brain uptake studies
The animal experiments were carried out with approval from institutional animal ethical
committee (IAEC), J.S.S College of Pharmacy, Udhagamandalam, India (Proposal no.
JSSCP/IAEC/Ph.D/Ph.Ceutics/01/2013-14). Pharmacokinetic and brain uptake
studies were carried out using male wistar rats for CUR and DZP loaded NLC
formulations (reconstituted with 1 mL of saline), NE, MNE and drug solution (Haque et
al., 2012).
Table 22. Grouping of animals for pharmacokinetic studies
Group Formulations Dose
I Curcumin solution, CS (IV)
1mg/kg
II Curcumin solution, CS (IN)
III Curcumin NLC, CNLC (IN)
IV Curcumin NE, CNE (IN)
V Curcumin mucoadhesive nanoemulsion, CMNE (IN)
Group Formulations Dose
I Donepezil solution, DS (IV)
0.3mg/kg
II Donepezil solution, DS (IV)
III Donepezil NLC, DNLC (IN)
IV Donepezil NE, DNE (IN)
V Donepezil mucoadhesive nanoemulsion, DMNE (IN)
Rats were housed in cages and had free access to standard laboratory diet (Lipton feed,
Mumbai, India) and water ad libitum. Animals were maintained at 22±1oC and 65±5%
relative humidity. The efficacy of IN route was compared with that of IV route. Before
nasal administration, the rats were lightly anesthetized by exhaling diethyl ether.
Intranasal administration was carried out with help of micropipette attached to low
density polyethylene tube having 0.1mm internal diameter. Animals (n=3) were
sacrificed by cervical dislocation and blood samples of approximately 0.25mL were
collected by cardiac puncture at the following time points: 0.25, 0.5, 0.75, 1, 2, 4 and 6h.
Blood samples were placed into tubes containing 0.3mL of anticoagulant solution and
centrifuged at 3,000rpm for 15min. After centrifugation, the plasma obtained was stored
at -20oC until analysis. The brain samples were collected by cutting open the skull, rinsed
with saline solution and blotted with filter paper to remove the blood taint and blood
vessels. Brain samples were homogenized in PBS (pH 7.4) to determine the amount of

Materials and Methods
102 | P a g e
drug in the brain tissue. The homogenate was centrifuged at 6,000rpm for 15min at 4oC;
supernatant was collected and frozen at -20oC until further analysis by HPLC.
Pharmacokinetic parameters like elimination rate constant (Ke), half life (t1/2) and area
under curve (AUC). Cmax (peak plasma concentration) and Tmax (time of peak plasma
concentration) were obtained directly from the plasma concentration-time profile and
brain concentration-time profile. All data were expressed as the mean ± S.E.M. (standard
error mean).
Further, drug targeting efficiency (DTE%) that represents time average partitioning ratio
was calculated as follows:
Drug targeting efficiency (DTE%)= (AUCbrain/AUCblood) IN × 100 (7)
(AUCbrain/AUCblood) IV
Nose to brain direct transport percentage (DTP%) was calculated as follows:
Direct transport percentage (DTP%)= BIN – Bx × 100 (8)
BIN
where Bx = (BIV/PIV) x PIN,
Bx is the brain AUC fraction contributed by systemic circulation through the BBB
following intranasal administration;
BIV is the AUC0-6 (brain) following intravenous administration;
PIV is the AUC0-6 (blood) following intravenous administration;
BIN is the AUC0-6 (brain) following intranasal administration;
PIN is the AUC0-6 (blood) following intranasal administration
Pharmacokinetic data was analyzed by one way ANOVA followed by Bonferroni post
test. Values are said to be significant when p < 0.05.
5.17 Pharmacodynamic studies
5.17.1 Animals
Three-month old male Wistar rats weighing 250-300g were obtained from the central
animal facility of JSS College of Pharmacy, Udhagamandalam, Tamilnadu, India. The
animals were acclimatized to laboratory conditions ten days prior to the commencement
of the experiment in order to adapt to the environmental conditions of light-dark cycle
(12:12 h), relative humidity (55-65%) and temperature (21±10oC). The animals were
housed in polypropylene cages with sterilized paddy husk bedding. Food and water were
available ad libitum throughout the experimental period. All the experiments were
carried out with prior approval of the institutional animal ethical committee (IAEC),
Materials and Methods
103 | P a g e
J.S.S. College of Pharmacy, Udhagamandalam, India (Proposal no. JSSCP/IAEC/
Ph.D/Ph.Ceutics/03/2012-13).
5.17.2 Experimental induction of AD
Animals were anesthetized using ketamine hydrochloride (70 mg/kg, IP) and secured in
a stereotactic frame. A midline sagittal incision on the scalp was made and burr holes
were drilled on the both sides of the skull with coordinates at 0.8 mm posterior to bregma
and 1.5 mm lateral to the sagittal suture. Forty eight animals were injected with 20 µL of
sSTZ dissolved in artificial cerebrospinal fluid (aCSF) at a dose of 3 mg/kg (Ishrat et al.,
2009; Sharma and Gupta, 2001) bilaterally into the lateral ventricles by placing the
Hamilton syringe needle 3.6 mm beneath the surface of the brain. The procedure was
repeated 48 h later. The sham operated group consisting of 8 animals were treated
following a similar procedure but were administered aCSF (aCSF:147mM NaCl; 2.9mM
KCl; 1.6mM MgCl2; 1.7mM CaCl2 and 2.2mM dextrose). Animals were then sutured, an
antiseptic (Betadiene ointment and Neosporin) was applied to the wound and they were
injected with saline (1 mL, subcutaneously) to prevent dehydration. Animals were
transferred to a thermo-regulated chamber to maintain normal body temperature until
recovery and then transferred to their home cages. Animals were divided into 7 groups
consisting 8 in each and assigned as shown in Table 23.
Table 23. Grouping of animals for pharmacodynamic studies
5.17.3 Behavioural studies
5.17.3.1 Radial arm maze (RAM) task
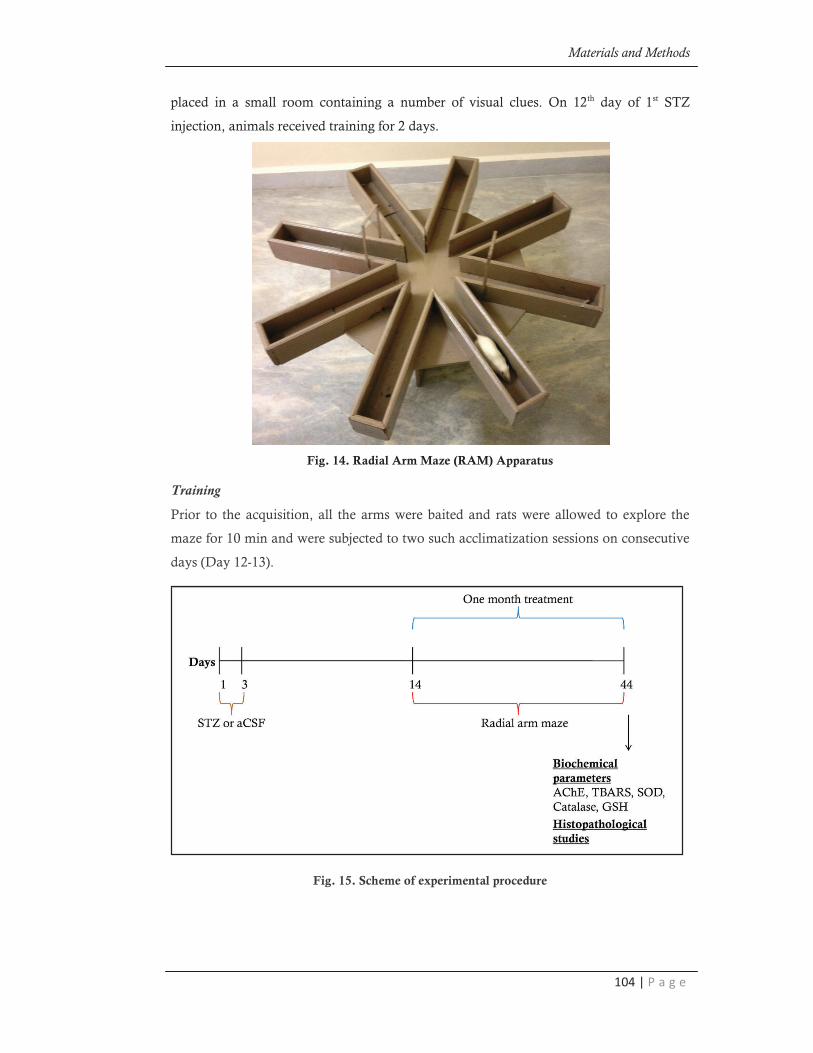
RAM is used to assess reference and working memory in animals (Bhagya et al., 2011).
The RAM apparatus consists of eight identical arms radiating from the centre of the
platform (Fig.14). The apparatus was elevated to a height of 28 cm from the ground and
Group Treatment Dose
1 Sham ---
2 Negative control (NC) ---
3 DZP Oral 3mg/kg
4 CUR Oral 50mg/kg
5 DMNE IN 0.3mg/kg
6 CMNE IN 1mg/kg
7 D+CMNE IN 0.3mg/kg+1mg/kg
Materials and Methods
104 | P a g e
placed in a small room containing a number of visual clues. On 12th day of 1st STZ
injection, animals received training for 2 days.
Fig. 14. Radial Arm Maze (RAM) Apparatus
Training
Prior to the acquisition, all the arms were baited and rats were allowed to explore the
maze for 10 min and were subjected to two such acclimatization sessions on consecutive
days (Day 12-13).
Fig. 15. Scheme of experimental procedure
Materials and Methods
105 | P a g e
Acquisition
Rats were given two trials a day for 30 days (Day 14-43). At the beginning of each trial,
the maze was thoroughly cleaned with 70% ethanol and four of the arms (2, 3, 6, and 8)
were baited with food reinforcement (Kellogg’s Planets and Stars™, Kellogg India Ltd.,
Mumbai, India). The rat was placed in the center of the octagon and was allowed a free
choice. An arm choice was recorded when a rat ate a bait or reached the end of an arm.
The maze arms were not rebaited, so only the first entry into the baited arm was recorded
as a correct choice. The trial continued until the rat entered all the four baited arms or 5
min had elapsed. At the end of the trial, the rat was returned to the home cage and was
given the second trial after an intertrial interval of 1 h. Training was continued until the
rats attained the criteria of 80% correct choice (at least 4 correct entries out of 5 entries).
The scheme of experimental procedure is given in Fig. 15.
5.17.3.2 Statistical analysis
Behavioural parameters were analysed by two-way ANOVA followed by Tukey post-
test. Values are said to be significant when p < 0.05.
5.17.4 Biochemical parameters
5.17.4.1 Drugs and Chemicals
20% Acetic acid solution (pH 3.5)
20mL of acetic acid (99%) dissolved in 80 mL of water and the pH was adjusted to 3.5
with 0.1 N NaOH solution.
Acetylthiocholine
216.7 mg of Acetylthiocholine dissolved in 10 mL of distilled water.
DTNB (5,5ɂ-dithiobis(2-nitrobenzoic acid) (Ellman’s reagent)
39.6 mg of DTNB dissolved in 10 mL of phosphate buffer pH 7.0 containing 15mg
sodium bicarbonate.
Ethylene diamine tetraacetic acid (EDTA)
37.22 mg of EDTA was dissolved in 100 mL of water.
Hydrogen peroxide solution (7.5mM)
21µL of commercial H2O2 solution was made upto 100mL with distilled water.
Potassium phosphate buffer (65mM pH 7.8)
2.2g of potassium dihydrogen phosphate and 11.23g of dipotassium hydrogen phosphate
were dissolved in 250mL and 1L of water respectively and then mixed together. The pH
was adjusted to 7.8 with potassium dihydrogen phosphate solution.

Materials and Methods
106 | P a g e
Sodium carbonate buffer (0.05mM pH 10.2)
5.3g of sodium carbonate and 4.2g of sodium bicarbonate were dissolved separately in 1
L of distilled water which served as stock solution. Buffer was prepared by mixing 64mL
of sodium carbonate and 70mL sodium bicarbonate solutions. The pH of the buffer was
adjusted to 10.2 using above stock solutions.
8% Sodium dodecyl sulfate (SDS)
8g of SDS was dissolved in 100 mL of water.
Sucrose solution
10.95g of sucrose was dissolved in 100mL of distilled water.
10% Trichloroacetic acid solution
10g of trichloroacetic acid was dissolved in 100mL of distilled water.
Thiobarbituric acid(0.9%)
0.9g of thiobarbituric acid was dissolved in 100mL of distilled water. The ph was
adjusted to 7.4 with 0.1 N NaOH/0.1N HCl solutions.
5.17.4.2 Tissue preparation
At the end of 30 days treatment following behavioural studies, animals were
anaesthetized with ether. The animals were decapitated, brains extracted and cleaned
with chilled ice cold saline. The cerebral hemispheres were separated and the left
hemisphere was fixed in neutral buffered paraformaldehyde (10% v/v) for histological
examination. The hippocampus and frontal cortex were dissected from the right
hemisphere and weighed. A 10% (w/v) homogenate of brain samples (0.03 M sodium
phosphate buffer, pH-7.4) was prepared by using teflon glass homogenizer. The
homogenate was centrifuged at 1000 rpm 4oC for 3 min and the supernatant divided into
two portions, one of which was used for measurement thiobarbituric acid reactive
substance (TBAR). The remaining supernatant was again centrifuged at 12,000 rpm at
4oC for 15 min and used for the measurement of AChE, superoxide dismutase (SOD),
catalase (CAT), and glutathione (GSH). Protein and homogenized used for estimation of
biochemical parameters like AChE activity, lipid peroxidation, glutathione, superoxide
dismutase and catalase.
5.17.4.3 Estimation of AChE
Cholinergic dysfunction was assessed in terms of acetylcholinesterase (AChE) activity.
The quantitative measurement of AChE levels in brain were performed according to the
method of (Ellman and Courtney, 1961). The assay mixture contained 0.05 mL of
Materials and Methods
107 | P a g e
supernatant, 3mL of 0.01M sodium phosphate buffer (pH 8), and 0.10 mL DTNB and
absorbance was measured at 412nm until absorbance stopped increasing and finally set to
zero. About 0.10 mL of acetylthiocholine iodide was added and the change in
absorbance was measured at 412 nm for 5 min. The enzyme activity was expressed as
micromoles/min/mg of protein. Results were calculated using molar extinction
coefficient of chromophore (1.36 x 10⁻⁴M-1cm-1) and expressed as percentage of control.
The equation describing absorbance is A = ε*c*l (also known as Beer-Lambert law),
where:
A – absorbance measured in OD (Optical Density units)
ε – epsilon, the molar extinction coefficient
c – concentration measured in molarity
l – light path length measured in centimeters
5.17.4.4 Estimation of TBARS
The extent of lipid peroxidation in the brain was determined quantitatively by the
method by (Wills, 1966). The incubation mixture consists of 0.5mL of supernatant,
0.2mL sodium dodecyl sulphate (8%), 1.5mL acetic acid solution (20%, pH 3.5), 1.5mL
of thiobarbituric acid (0.9%, pH 7.4). The incubation mixture was made upto 5 mL with
double distilled water and then heated in boiling water bath for 30 min. After cooling, the
red chromogen was extracted into 5 mL mixture of n-butanol and pyridine (15:1 v/v)
centrifuged at 4000 rpm for 10 min, the organic layer was separated and its absorbance
measured at 532nm. The values were calculated using the molar extinction coefficient of
chromophore (1.56 x 10⁻⁵M-1cm-1).
5.17.4.5 Estimation of SOD
Superoxide dismutase measurement was carried out by the ability of SOD to inhibit
spontaneous oxidation of adrenaline to adrenochrome (Saggu et al., 1989). A mixture of
2.80 mL of sodium carbonate (0.05mM) buffer (pH 10.2), 100µL of EDTA (1.0mM) and
20µL of brain homogenate or sucrose (blank) were incubated at 30oC for 45 min.
Thereafter, reaction was initiated by adding 100µL of adrenaline solution (9.0mM). The
change in the absorbance was recorded at 480nm for 8-12 min. Similarly, SOD
calibration curve was prepared by taking 10units/mL of standard solution. One unit of
SOD produced approximately 50% inhibition of auto-oxidation of adrenaline. The
results are expressed as SOD µmol/min/mg of protein.
Materials and Methods
108 | P a g e
5.17.4.6 Estimation of CAT
Catalase measurement was carried out by the ability of CAT to oxidize hydrogen
peroxide (H2O2). 2.25 mL of potassium phosphate buffer (65mM, pH 7.8) and 100µL of
the brain homogenate were incubated at 25oC for 30 min. A 650µL H2O2 (7.5mM) was
added to the brain homogenate to initiate the reaction. The change in absorption was
measured at 240nm for 2–3 min and the results were expressed as CAT µmol/min/mg of
protein (Beer and Seizer, 1952).
5.17.4.7 Estimation of GSH
Glutathione was measured according to the method of Ellman (Ellman, 1959). The equal
quantity of brain homogenate was mixed with 10% trichloroacetic acid and centrifuged
to separate the proteins. To 0.1 mL of this supernatant, 2mL of phosphate buffer (pH
8.4), 0.5 mL of DTNB and 0.4 mL of double distilled water were added. The mixture
was vortexed and absorbance read at 412nm within 15 min. The concentration of
reduced glutathione was expressed as nmol/mg of protein.
5.17.4.8 Statistical analysis
Biochemical parameters were analysed using one-way ANOVA followed by Tukey
multiple comparison tests. Values are said to be significant when p < 0.05.
5.17.5 Histology and neuronal count
Hippocampus and frontal cortex was dissected from the left hemisphere of the animals
and fixed in neutral buffered formaldehyde (10% v/v). The hippocampus and frontal
cortex was sectioned at 3 mm thickness and 5-10 mm slices, using a Leica RM 2135
microtome and stained with H and E. Another batch of samples were stained with cresyl
violet (CV) acetate (MP Biomedicals, Mumbai, India) and CV positive neurons were
counted using Motic microscope fitted with camera according to a procedure described
earlier (Park et al., 2012). The number of cresyl violet positive neurons in all groups was
counted in a 250×250 μm square, applied approximately at the medial, center and lateral
parts of the CA1 region in the stratum pyramidale. Cell counts were obtained by
averaging the counts from the sections taken from each animal. The number of CV
positive neurons was compared to those in the each sham group.
Recommended