5.4 Phase diagrams of binary systems
Φmin=1, Fmax=3
C=2, F=2-Φ+2=4-Φ
Predict by phase law:
Three dimentional diagram
T, P, x
Intercepting plane graph---two dimentional diagrams
T, P, x ----- (T, x)p , (P, x)T or (T, P)x

Contents
Liquid-liquid
Miscible
Partly-miscible
Immiscible
Liquid-solid
Water-salt
Solid-solid

5.4.1 Phase diagram of miscible binary systems
A
*
AA xpp
B
*
BB xpp
BA ppp
5.4.1.1 Ideal mixed systems:
Two components both follow Raoult’s Law.
( )T, P-x, A+B
)1(*
BA
*
A Axpxp
A
*
B
*
A
*
B )( xppp
AA
py
p
AB 1 yy
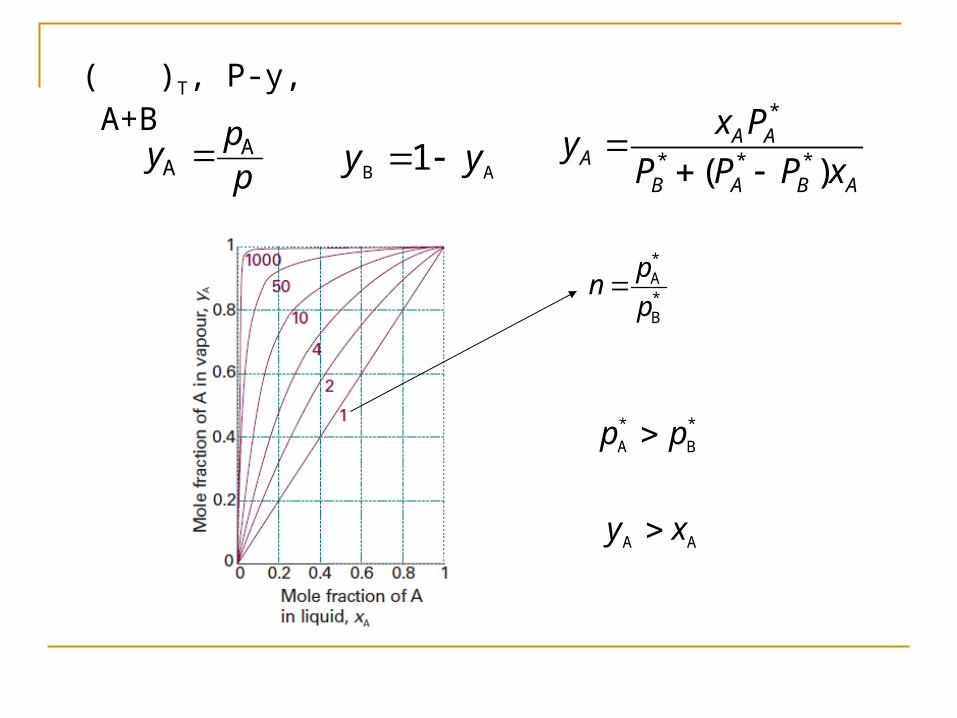
( )T, P-y, A+B
*A*B
pn
p
*
* * *( )A A
AB A B A
x Py
P P P x
*
B
*
A pp
AA xy

( )T, P-x-y
*
B
*
A pp
AA xy A Ay x
* *A BP P
*AP
*BP
xA
Liquid
P
Vapour
Φ=2
F=2-2+1=1(P)
liquid
Liquid/Vapour
A is more volatile than B B is more volatile than A

( )P T-x
pp xTb bTp ,*

xx11
d Td T33 d’ d’
xx22
TA*
xx33xx44
T c Tc T22 c’c’
a a’ a a’
b Tb T11 b’ b’
A B TB*
xx 11
TT 11
xx 22
TT 22
xx 33
TT 33
xx22 xx33 xx44
A
The composition variation in the distillation process
How would it be in an closed system?

P-x, liquid(upper line)- gas(lower line)
Getting T-x phase diagram from P-x
Relating P-x and T-x phase diagram
T-x, gas(upper line)-liquid(lower line)

5.4.1.2 The Lever rule
C, total amount of the systems
DE ( tie line ) isothermal
l gCD CEn n
l gCD CEm m

Phase equilibrium variation at constant temperature
---the level rule

5.4.1.3 The principle of distillation
Simple distillation T T1
T T2Separate a volatile liquid from a non-volatile solute or solid

Theoretical plates: the number of effective vaporization and condensation steps that are required to achieve a condensate of given composition from a given distillate
Fractional distillation


5.4.1.4 Non-ideal solutions

P-x and T-x phase diagrams of non-ideal miscible binary systems

Azeotropes
Low-boiling azeotrope

351.28K , 95.57
2 2 5 3 6 6H O-C H OH, CH OH-C H ,
OHHC-OH 522
6652 HC-OHHC
Low-boiling azeotrope

The maximum azeotropic point
High boiling azeotropes
HCl-OH,HNO-OH 232
HCl-OH 2
381.65 K
HCl 20.24


Homework Y: P161 17, 18 A: P215 8.5(a), 8.6(a)
Preview: Y: 5.5,5.6, 5.7 A:8.5, 8.6
Recommended