A Comparison of High-speed Photography Accelerometer Data-reduction Techniques
and
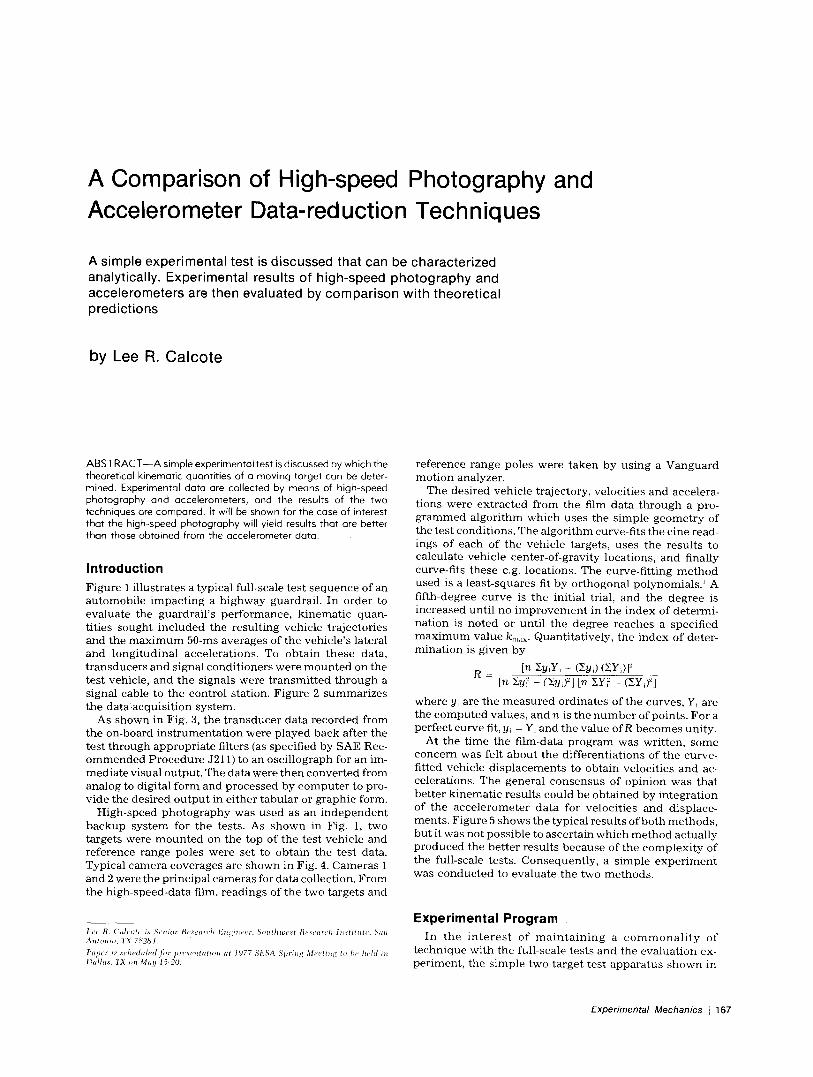
A simple experimental test is discussed that can be characterized analytically. Experimental results of high-speed photography and accelerometers are then evaluated by comparison with theoretical predictions
by Lee R. Calcote
ABSTRACT--A simple experimental test is discussed by which the theoretical kinematic quantities of a moving target can be deter- mined. Experimental data are collected by means of high-speed photography and accelerometers, and the results of the two techniques are compared. It will be shown for the case of interest that the high-speed photography will yield results that are better than those obtained from the accelerometer data.
Introduction F i g u r e 1 i l lus t ra tes a typ ica l full-scale t e s t s e q u e n c e of an a u t o m o b i l e i m p a c t i n g a h i g h w a y guardra i l . In o rde r to eva lua te the gua rd ra i l ' s p e r f o r m a n c e , k i n e m a t i c quan- t i t ies sough t i n c l u d e d t he r e su l t i ng veh ic le t r a jec to r ies a n d the m a x i m u m 50-ms ave rages of t he veh ic le ' s la teral a n d l o n g i t u d i n a l acce l e ra t ions . To o b t a i n t h e s e data , t r a n s d u c e r s a n d s ignal c o n d i t i o n e r s we re m o u n t e d on the t e s t vehicle , a n d t he s igna ls were t r a n s m i t t e d t h r o u g h a s ignal cable to the con t ro l s tat ion. F i g u r e 2 s u m m a r i z e s t he da ta=acquis i t ion sys tem.
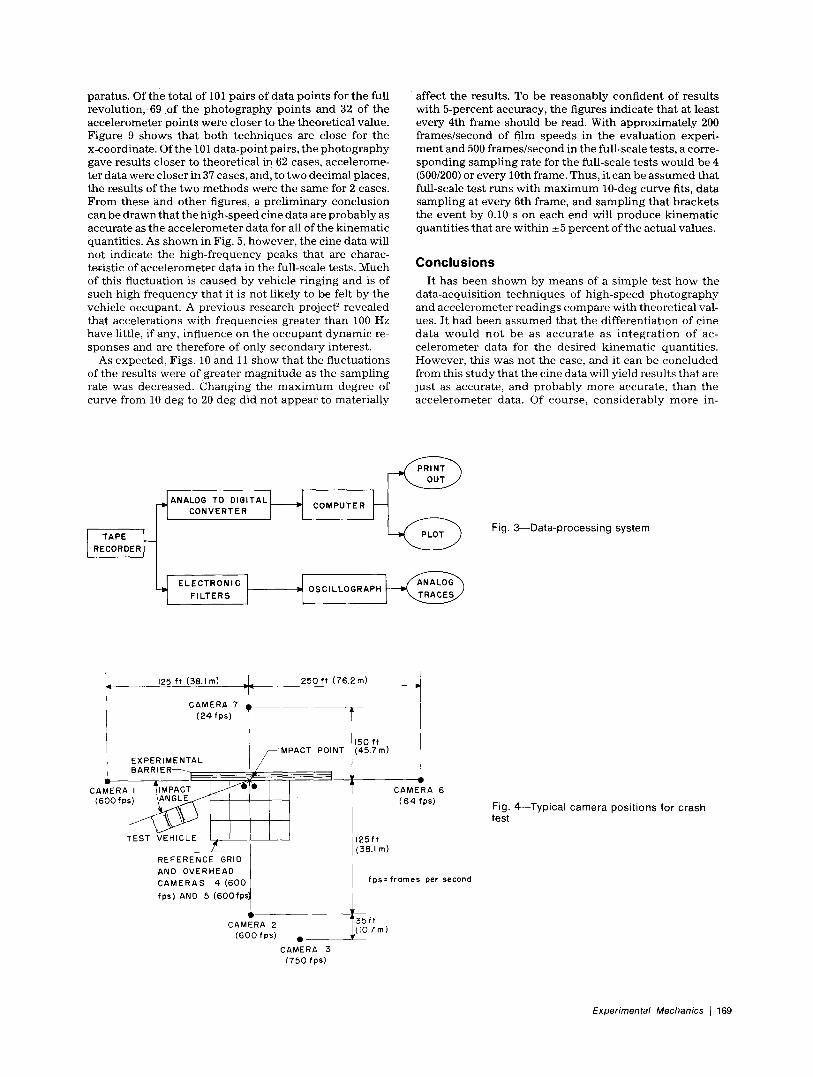
As s h o w n in Fig. 3, t he t r a n s d u c e r da ta r e c o r d e d f rom the on -boa rd i n s t r u m e n t a t i o n were p l a y e d b a c k af te r the tes t t h r o u g h a p p r o p r i a t e fi l ters (as speci f ied by SAE Rec- o m m e n d e d P r o c e d u r e J211) to an osc i l l og raph for an im- m e d i a t e v i sua l ou tpu t . T he da ta were t h e n c o n v e r t e d f rom ana log to digi ta l f o rm and p r o c e s s e d by c o m p u t e r to pro- v ide the des i r ed o u t p u t in e i t he r t a b u l a r or g r aph i c form.
High- speed p h o t o g r a p h y was u s e d as an i n d e p e n d e n t b a c k u p s y s t e m for the tests . As s h o w n in Fig. 1, two t a rge t s were m o u n t e d on t he top of t he tes t veh ic le and re fe rence r ange poles were set to o b t a i n t he t e s t data. Typ ica l c a m e r a coverages are s h o w n in Fig. 4. C a m e r a s 1 and 2 were t he p r i n c i p a l c a m e r a s for da ta col lect ion. F r o m the h i g h - s p e e d - d a t a film, r ead ings of t he two t a rge t s and
Lee R, Calcotc i~ Se~illr ICe,earth l':n~meer, Southwest Real'atoll l~stitutc, S~tll A~ltlmio, TX 7~2bJ4.
Paper i.~' sched~ded ~br pr~'~e~tatio~ at 1977 StiSA S p r i ~ Mectil~ t , hc held in Dallas. TX on Mar./ 15~:20.
r e fe rence r a n g e poles were t a k e n by u s i n g a V a n g u a r d m o t i o n analyzer .
The des i r ed veh ic le t ra jec tory , ve loc i t i es a n d accelera- t ions were e x t r a c t e d f rom the film da ta t h r o u g h a pro- g r a m m e d a l g o r i t h m w h i c h u se s the s i m p l e g e o m e t r y of the t e s t cond i t ions . The a l g o r i t h m curve-f i ts t he c ine read- ings of e ach of t he veh ic l e targets , u ses the r e su l t s to ca lcu la te veh ic l e cen te r -of -grav i ty loca t ions , a n d finally curve-f i ts t he se c.g. loca t ions . The curve- f i t t ing m e t h o d used is a l ea s t - squa res fit by o r t h o g o n a l po lynomia l s . 1 A f i f th-degree c u r v e is t he in i t ia l trial, a n d t he deg ree is i nc r ea sed un t i l no i m p r o v e m e n t in t he i n d e x of de t e rmi - n a t i o n is n o t e d or un t i l t h e deg ree r eaches a spec i f ied m a x i m u m va lue k ...... Quan t i t a t ive ly , the i n d e x of deter - m i n a t i o n is g iven b y
R - [n ~ Y i Y i - (ZYJ) (ZYi)] ~ [n 5.y~ - (Y.y~)~] I n Z Y ~ - (ZY~) ~]
w h e r e y~ are t he m e a s u r e d o rd ina t e s of t he curves , Y~ are the c o m p u t e d values , a n d n is t he n u m b e r of po in t s . F o r a pe r f ec t cu rve fit, y~ - Y~ a n d t h e va lue of R b e c o m e s uni ty .
At the t i m e the f i lm-data p r o g r a m was wr i t t en , s o m e c o n c e r n was fel t a b o u t t he d i f f e r en t i a t i ons of t he curve- f i t ted veh ic le d i s p l a c e m e n t s to o b t a i n ve loc i t i es a n d ac- ce lera t ions . The genera l c o n s e n s u s of o p i n i o n was t h a t b e t t e r k i n e m a t i c resu l t s cou ld be o b t a i n e d by i n t e g r a t i o n of t he a c c e l e r o m e t e r da t a for ve loc i t i e s a n d d i sp lace - men t s . F igure 5 shows th e typ ica l r e su l t s of b o t h m e t h o d s , bu t i t was no t poss ib l e to a sce r t a in w h i c h m e t h o d ac tua l ly p r o d u c e d the b e t t e r r e su l t s b e c a u s e of t he c o m p l e x i t y of the full-scale tests . C o n s e q u e n t l y , a s imp le e x p e r i m e n t was c o n d u c t e d to eva lua te t he two m e t h o d s .
Experimental Program I n t h e i n t e r e s t of m a i n t a i n i n g a c o m m o n a l i t y of
t e c h n i q u e w i t h the ful l-scale tes t s a n d the e v a l u a t i o n ex- p e r i m e n t , t he s i m p l e two- t a rge t t es t a p p a r a t u s s h o w n in
Experimental Mechanics I 167
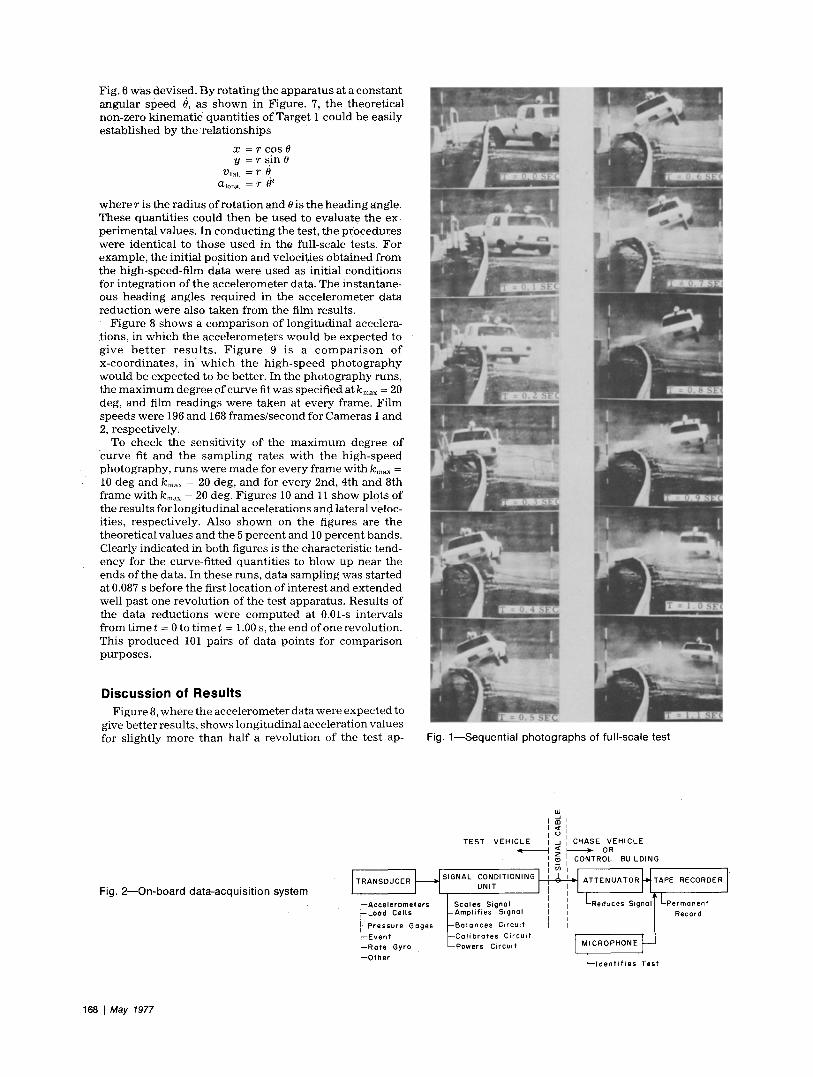
Fig. 6 was devised . B y r o t a t i n g t he a p p a r a t u s at a c o n s t a n t a n g u l a r s p e e d 0, as s h o w n in Figure . 7, t he theo re t i ca l non -ze ro k i n e m a t i c q u a n t i t i e s of Ta rge t 1 cou ld be eas i ly e s t a b l i s h e d b y t h e r e l a t i o n s h i p s
x = r cos 0 y = r s in 0
V l a t . : r a l o n g . = r
w h e r e r is t he r ad ius of r o t a t i o n a n d 0 is t he h e a d i n g angle. T h e s e q u a n t i t i e s cou ld t h e n be u s e d to eva lua t e t h e ex- p e r i m e n t a l va lues . In c o n d u c t i n g t he test , t h e p r o c e d u r e s were iden t i ca l to t h o s e u s e d in t he ful l-scale tests . Fo r e x a m p l e , the in i t ia l pos i t i on a n d ve loc i t ies o b t a i n e d f rom the h igh - speed - f i lm da ta we re u sed as in i t ia l c o n d i t i o n s for i n t e g r a t i o n of t h e a c c e l e r o m e t e r data. The i n s t a n t a n e - ous h e a d i n g ang les r e q u i r e d in t he a c c e l e r o m e t e r da ta r e d u c t i o n we re also t a k e n f r o m the film resul ts .
F i g u r e 8 s h o w s a c o m p a r i s o n of l o n g i t u d i n a l accelera- t ions , in w h i c h t he a c c e l e r o m e t e r s w o u l d be e x p e c t e d to g i v e b e t t e r r e s u l t s . F i g u r e 9 is a c o m p a r i s o n of x - c o o r d i n a t e s , in w h i c h t h e h i g h - s p e e d p h o t o g r a p h y w o u l d be e x p e c t e d to be be t ter . In t he p h o t o g r a p h y runs , the m a x i m u m degree of c u r v e fit was speci f ied at kmax = 20 deg, a n d film r e a d i n g s we re t a k e n at eve ry f rame. F i l m speeds were 196 a n d 168 f r a m e s / s e c o n d for C a m e r a s 1 a n d 2, respec t ive ly .
To c h e c k t he sens i t i v i ty of the m a x i m u m d e g r e e of Curve fit a n d t h e s a m p l i n g ra t e s w i t h t h e h i g h - s p e e d p h o t o g r a p h y , r u n s were m a d e for eve ry f r ame wi th kmax = 10 deg a n d kmax = 20 deg, a n d for eve ry 2nd, 4 th a n d 8th f r ame wi th k ..... = 20 deg. F igu re s 10 a n d 11 s h o w plo ts of the r e su l t s for l o n g i t u d i n a l a c c e l e r a t i o n s a n d l a t e ra lve loc - i t ies, r e spec t i ve ly . Also s h o w n on t h e f igures are t h e t heo re t i ca l va lues a n d t he 5 p e r c e n t a n d 10 p e r c e n t b a n d s . Clearly ind ica ted in b o t h f igures is the charac te r i s t ic t end- ency for the curve- f i t t ed q u a n t i t i e s to b low u p n e a r the e n d s of t he data. In t h e s e runs , da ta s a m p l i n g was s t a r t ed at 0.087 s be fore t he first l oca t ion of i n t e r e s t a n d e x t e n d e d wel l pas t one r e v o l u t i o n of t h e tes t appa ra tus . Resu l t s of the da ta r e d u c t i o n s were c o m p u t e d at 0.01-s i n t e rva l s f rom t i m e t = 0 to t i m e t = 1.00 s, t he e n d of one revo lu t ion . Th i s p r o d u c e d 101 pa i r s of da ta po in t s for c o m p a r i s o n pu rposes .
Discussion of Results F i g u r e 8, w h e r e t h e a c c e l e r o m e t e r da ta were e x p e c t e d to
give b e t t e r resul ts , shows l o n g i t u d i n a l acce le ra t ion va lues for s l ight ly m o r e t h a n ha l f a r e v o l u t i o n of the t e s t ap- Fig. 1--Sequential photographs of full-scale test
Fig. 2--On-board data-acquisition system
TEST VEHICLE . j CHASE VEHICLE �9 I I z ~ �9 OR
I c9 CONTROL BUILDING
~ SIGNAL CONDITIONING I I TRANSDUCER UNIT ATTENU TAPE RECORDER
' ~Accelerometers ~-Scoles Signol i i LRsd . . . . s,~.al~' Lp . . . . . . . t t--LOOd C e l l s ~-Amplifies Signal I I | Record
I t t-Pressure Gages [--Ba, . . . . . Circuit I I / ~-Event J--Calibrates Circuit ~mJ ~-Rate Gyro L--Powers Circuit I MICROPHONE
L--Other L l d e n t i f i e s Test
168 I May 1977
para tus . Of t he to ta l of 101 pa i r s of da ta p o i n t s for t he full r evo lu t ion , 69 of t h e p h o t o g r a p h y p o i n t s a n d 32 of t he a c c e l e r o m e t e r p o i n t s were c loser to t h e t heo re t i ca l value. F igu re 9 shows t h a t b o t h t e c h n i q u e s are close for t he x-coord ina te . Of t h e 101 da ta -po in t pairs , t h e p h o t o g r a p h y gave resu l t s c loser to theo re t i ca l in 62 cases, acce le rome- te r da ta were c loser in 37 cases, and, to two d e c i m a l places , t he resu l t s of t he t w o m e t h o d s were t h e s ame for 2 cases. F r o m these a n d o t h e r f igures, a p r e l i m i n a r y c o n c l u s i o n can be d r a w n t h a t t he h i g h - s p e e d c ine da t a are p r o b a b l y as accu ra t e as t he a c c e l e r o m e t e r da ta for all of t he k i n e m a t i c quant i t i es . As s h o w n in Fig. 5, howeve r , t he c ine da ta will no t i nd i ca t e t he h i g h - f r e q u e n c y p e a k s t h a t are charac- ter is t ic of a c c e l e r o m e t e r da ta in the ful l-scale tests . M u c h of th is f luc tua t ion is c a u s e d by veh ic le r i ng i ng a n d is of s u c h h i g h f r e q u e n c y t h a t it is no t l ike ly to be felt b y t he veh ic le occupan t . A p r e v i o u s r e s e a r c h p ro j ec t ~ r evea led t ha t acce l e ra t ions w i t h f r equenc i e s g rea t e r t h a n 100 Hz h a v e little, if any, i n f luence on the o c c u p a n t d y n a m i c re- sponse s and are t he r e fo re of only s e c o n d a r y in te res t .
As expec ted , Figs. 10 a n d 11 show t h a t t he f luc tua t ions of the resu l t s were of g rea te r m a g n i t u d e as t he s a m p l i n g rate was decreased . C h a n g i n g the m a x i m u m degree of cu rve f rom 10 deg to 20 deg d id no t a p p e a r to ma te r i a l ly
affect t he resul ts . To be r e a s o n a b l y c o n f i d e n t of r e su l t s w i th 5 -percen t accuracy , t he f igures i n d i c a t e t h a t at l eas t every 4th f r ame shou ld be read. With a p p r o x i m a t e l y 200 f r a m e s / s e c o n d of fi lm s p e e d s in t h e e v a l u a t i o n exper i - m e n t a n d 500 f r a m e s / s e c o n d in t he ful l -scale tes ts , a corre- s p o n d i n g s a m p l i n g ra te for t he ful l-scale t e s t s w o u l d b e 4 (500/200) or eve ry 10th f rame. Thus , i t c an b e a s s u m e d t h a t full-scale tes t r u n s w i t h m a x i m u m 10-deg cu rve fits, da ta s a m p l i n g a t eve ry 6th f rame, a n d s a m p l i n g t h a t b r a c k e t s the e v e n t b y 0.10 s o n e a c h e n d will p r o d u c e k i n e m a t i c quan t i t i e s t h a t are w i t h i n _* 5 p e r c e n t of t h e ac tua l va lues .
C o n c l u s i o n s
I t h a s b e e n s h o w n by m e a n s of a s i m p l e t e s t h o w the da t a -acqu i s i t i on t e c h n i q u e s of h i g h - s p e e d p h o t o g r a p h y and a c c e l e r o m e t e r r e a d i n g s c o m p a r e w i t h t heo re t i c a l val- ues. I t h a d b e e n a s s u m e d t h a t t he d i f f e r en t i a t i on of c ine d a t a w o u l d n o t b e as a c c u r a t e as i n t e g r a t i o n of ac- c e l e r o m e t e r da ta for t he des i r ed k i n e m a t i c quan t i t i e s . However , th i s was no t t he case, a n d it c an be c o n c l u d e d f rom th i s s t u d y t h a t t he c ine da ta will y ie ld r e su l t s t h a t are j u s t as accura te , a n d p r o b a b l y m o r e accura te , t h a n the a c c e l e r o m e t e r da ta . Of course , c o n s i d e r a b l y m o r e in-
_~ANALOG TO DIGITALL~[ CONVERTER [ [
TAPE L~
RECORDERI t ELECTRONIC ]
,,TERS I "1
COMPUTER
O S C I L L O G R A P H ~
Fig. 3~Data-processing system
125 ft (38.1 m) 25Oft (76.2 rn)
CAMERA 7 T (24 fps)
EXPERIMENTAL ~IMPACT POINT BARRIER~ / �9 ~ ]
CAMERA, %PACT i - > ~ " (600 f p s ~
TEST VEHICLE
REFERE~E ~R,O AND OVERHEAD I CAMERAS 4 (600 / fps) ANO 5 (600fps~
CAMERA 2 (600 fps) �9 _ _ _ _
CAMERA 3 (750 fps)
150 f t 45.7 m)
4
CAMEl 6 (64 fps)
(38.1 in)
fps = f r a m e s per second
.7m)
Fig. 4--Typical camera positions for crash test
Experimental Mechanics I 169

s t r u m e n t a t i o n is n e c e s s a r y for re t r ieva l of t h e acce le rome- ter da ta a n d can p r e s e n t u n d e s i r a b l e sou rces of ins t ru - m e n t error . F u r t h e r , in i t ia l cond i t i ons m u s t be k n o w n in the i n t e g r a t i o n process , a n d the i n s t a n t a n e o u s d i rec t ion m u s t b e d e t e r m i n e d if t h e m o t i o n is curv i l inea r . The h i g h - s p e e d c ine re t r i eva l has the a d v a n t a g e s of g rea te r s impl ic i ty a n d t h e se l f - s ta r t ing charac te r i s t i c , b u t care m u s t be exe rc i sed in t h e d i f f e ren t i a t ion of t h e data. The er rors c a u s e d b y d i f f e r en t i a t i on of curve-f i ts n e a r the e n d s of t h e s a m p l e d da ta c an b e m a d e less s ign i f ican t i f t he pe r iod of i n t e r e s t c an be b r a c k e t e d on b o t h e n d s by t he da ta sampl ing .
A c k n o w l e d g m e n t s
T h e a u t h o r w i s h e s to e x p r e s s his a p p r e c i a t i o n to the I n t e r n a l R e s e a r c h P a n e l of S o u t h w e s t R e s e a r c h In s t i t u t e for s p o n s o r i n g t h e p ro j ec t in w h i c h th i s w o r k was per- formed.
R e f e r e n c e s
I. Rank, P. H., Jr., "'FORTRAN II Subroutine fi~r Least-Squares Polynomial Fitting by Orthogonal Polynomials." Clearinghouse Document AD 620802 (April 1965).
2. Calcote, L. R., -Investigation of optimum Crusb/Breakaway Characteristics af Roadside Structures," Final Report, Southwest Research Institute Internal Research Pr~ject 03-9122 (Jan. 1975).
Fig. 6--Experimental-test apparatus
Fig. 5~Typical computer plots
/
(~~.a.CCELEROMETER
~TARGET ~ .......... 2
Fig. 7--Plan of test apparatus
170 J May 1977
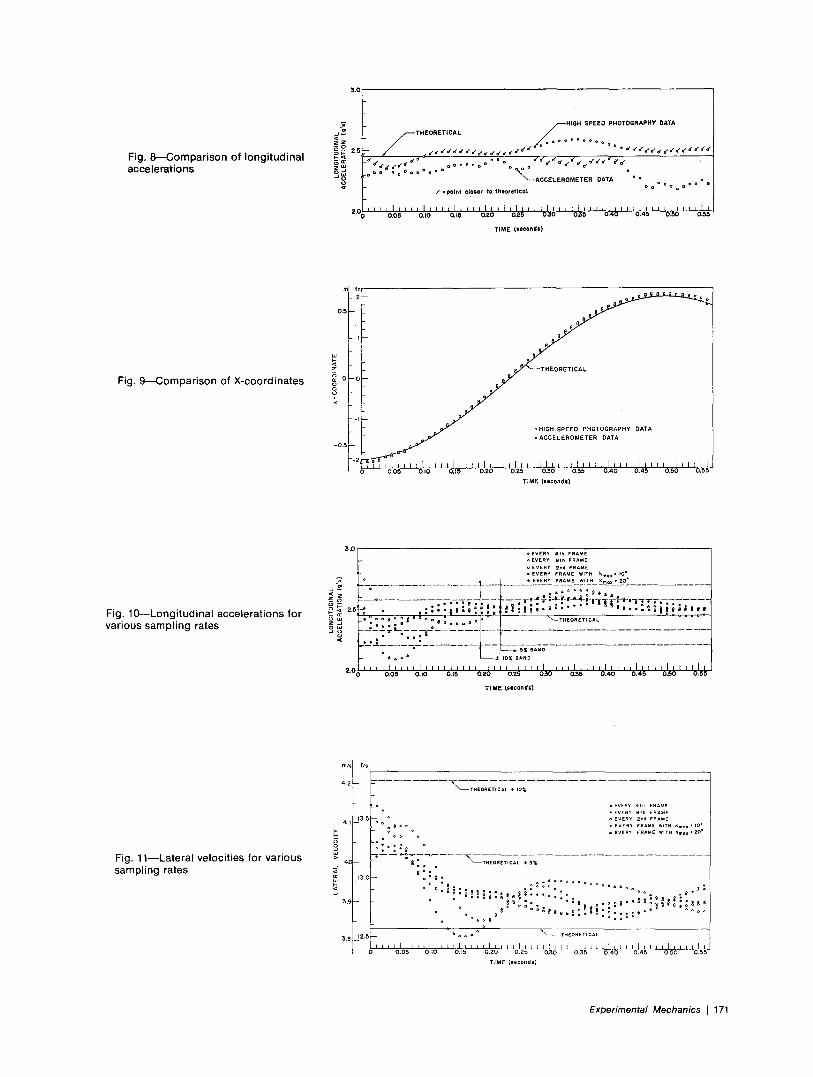
Fig. 8--Comparison of longitudinal accelerations
3 .0
~ ~5 ~ -<
o,~ o
2.C
THEORETICAL ~H IGH-SPEEO PHOTOGRAPHY DATA
"~ACCELEROMETER DATA == a ee~eaaeeo e
/ �9 po in t c ;oser to f heo re t l co l
0 . 05 O.lO O.iG 0 .20 0 .25 0 .50 035 0 .40 0 .45 0 .50 O~G
T IME (seconds}
Fig. 9--Comparison of X-coordinates
f t
0 . 5 - -
- I @
< - THEORETICAL
0 - -
_ oH IGH-SPEEO PHOTOGRAPHY DATA
aACCELEROMETER DATA -0 .5
--2 ~ l l , * n ~ l 0 0 .05 0.10 0.15 0 .20 0 .25 0~0 0 .~ 0 .40 O. 5 0 . 50 O.D5
T iME [seconds}
Fig. l O--Longitudinal accelerations for various sampling rates
3 .0 oEVERY 4th FRAME aEVERY 8th FRAME a EVERY 2rid FRAME
* �9 EVERY FRAME WITH km= x �9 I0 I e �9 EVERY FRAME WLTH kmo x �9 20"
~ w
o u l - - ' - ~ ~ - - : - ~ . . . . . . . . . . . . . . . . . . . . . . . . . . . . . . . . . < , - - u 5~ ;~ ; ; - . . . . . . . . . . . . . . . . . . . . . . . . . .
= = = • I0% BAN{)
2.D 0 .05 0.10
T iME (second=}
Fig. 11--Lateral velocities for various sampling rates
m/s f /g
4.2
13.5 4.1
<
~ : 1 3 0 w . "
J
5,e 12.~
"•THSORETICAL +~o%
eEVERY 4th FRAME A EVERY e~h FRAME o EVERY 2nd FRAME
e o o �9 EVERY FRAME WITH kmaN r iO" �9 EVERY FRAME WITH kmoxe20 e
o= o
R~ : :o
�9 , " ' 4 t :
~~ : ~ , , , I ; 2 ' . ~ so , e "
& = ~ ~ = o ~ *~THEORETFCAL
" 'o'o;'' . . . . 'o ' , ; ' ' ~o!,~'' % ; " 'o!~' ' 'o. i ; ' ' 'o'~;'' 'o!,~'' 'o!,~'' 'o!~' ' 'o~ T IME [seconds)
Experimental Mechanics I 171
Recommended