A Cradle-to-Gate Life Cycle Assessment of ½” Regular and 5/8” Type X Gypsum Wallboard
Prepared for the Gypsum Association, Inc. By Dr. Lindita Bushi and Mr. Jamie Meil Athena Sustainable Materials Institute Final Report November 2011 [December 21, 2011]
Life Cycle Assessment of ½” Regular and 5/8” Type X Gypsum Wallboard Products i
Executive Summary
Goals and Scope
The Gypsum Association (GA) and its members engaged the Athena Sustainable Materials
Institute to conduct a representative, transparent and ISO 14040/44:2006 compliant cradle-to-
gate life cycle assessment (LCA) of 1,000 square feet (92.9 m2) of the industry’s two most
common gypsum wallboard products – ½” (12.7 mm) Regular and 5/8“ (15.9 mm) Type X
gypsum wallboard – as produced in the United States in 2010. Both of these gypsum wallboard
(GWB) products are used extensively in building construction and renovation as an enclosing
surface for interior walls and ceilings.
The GA intends to share the results of this benchmark study with suppliers and product users
throughout its value (supply) chain, use the study results to support its marketing efforts, upload
these reliable and up-to-date life cycle inventory (LCI) data to the US LCI Database
(http://www.nrel.gov/lci/) and have these data integrated into key building LCA tools.
In support of the study, primary LCI data were collected for three major gate-to-gate processes
in the production of gypsum wallboard (GWB): natural or crude gypsum ore extraction (six
quarries and one underground mining site), gypsum paper manufacture (three plants) and GWB
production (17 plants) for the reference year 2010. The GWB manufacturing plant study sample
included all GA member companies and represented about 25% of all establishments producing
gypsum and about 30% of all GWB produced in the USA. To ensure representativeness, the
GWB manufacturing plant study also considered the scale of operations including a mix of
small, medium and large facilities, their geographical location in each US census region and
their source of gypsum – adjacent quarry, mine, imported gypsum ore and their use of FGD
synthetic gypsum.
Methodology
Life cycle assessment is an analytical tool used to comprehensively quantify and interpret the
energy and material flows to and from the environment over the life cycle of a product, process,
or service. This LCA study is conducted in accordance with ISO 14040:2006 and ISO
14044:2006. The study data, methods, results and report underwent an independent critical
review by an external LCA expert.

Athena Institute
Life Cycle Assessment of ½” Regular and 5/8” Type X Gypsum Wallboard Products ii
A cradle-to-gate LCA assessment was conducted to evaluate the environmental performance of
½” Regular and 5/8“ Type X gypsum wallboard products by considering the potential impacts of
the selected life cycle stages, starting with extracting raw materials from the earth (the “cradle”)
and ending at the plant exit “gate” where the product is ready to be shipped to a distributor or
user.
Within all three gate-to-gate processes (natural gypsum ore extraction, gypsum paper and GWB
manufacture), “mass” was deemed the most appropriate physical parameter for allocating the
total environmental load between the reference or functional product of interest and co-
product(s). Plant specific formulations for 1,000 square feet of the two products of interest were
used to calculate the required input raw materials (both primary and secondary) and the
ancillary materials.
To solve the “multi-functionality” of coal-fired power generation process and calculate the
environmental profile of the flue gas desulfurized (FGD) synthetic gypsum input, a co-product of
coal power plant, a “system expansion” approach was used to avoid allocation.
The study supported a comprehensive set of life cycle impact assessment (LCIA) impact
categories based on ISO 21930:2007 “Sustainability in Building Construction – Environmental
Declaration of Building Products”, and the US EPA TRACI impact assessment characterization
model provided a North American context for calculating the impact category indicator results.
The study’s large representative sample size, reliable, up-to date and transparent process data
and its comprehensive set of supported environmental life cycle impact category indicators
provide a credible LCA benchmark for the gypsum wallboard industry. Overall, the data quality
underlying the study is considered “high” or “good”.
Results
The cradle-to-gate weighted average environmental profile results for ½” Regular and 5/8” Type
X GWB finished products is reported in Table ES1. The cradle-to-gate manufacture of 1,000 sq.
ft. of ½” Regular and 5/8” Type X GWB embodies about 4.1 GJ and 5.5 GJ of primary energy
use and emits in the order of 233 kg and 315 kg (CO2 equivalent) of greenhouse gas emissions,
respectively. For both GWB products, over 90% of the total primary energy inputs were derived
from non-renewable fossil fuel resources.

Athena Institute
Life Cycle Assessment of ½” Regular and 5/8” Type X Gypsum Wallboard Products iii
Table ES1. Cradle-to-Gate Environmental Profile for GWB Products (1,000 sq. ft.)
Impact category indicator Unit 1/2" Regular GWB
5/8" Type X GWB
Global warming kg CO2 eq 233.3 315.4 Acidification H+ moles eq 93.9 127.0 Respiratory effects kg PM2.5 eq 0.45 0.61 Eutrophication kg N eq 0.30 0.37 Ozone depletion kg CFC-11 eq 1.1E-05 1.5E-05 Smog kg NOx eq 0.467 0.632 Total Primary Energy MJ 4051.4 5445.1
Non renewable, fossil MJ 3725.7 5047.7 Non-renewable, nuclear MJ 180.7 242.9
Non-renewable, biomass MJ 2.4 2.6 Renewable, biomass MJ 122.1 124.3
Renewable, wind, solar, geothermal MJ 2.2 2.9 Renewable, water MJ 18.3 24.7
Abiotic depletion kg Sb eq 4.3E-03 6.2E-03 Water use m3 3.1 4.1
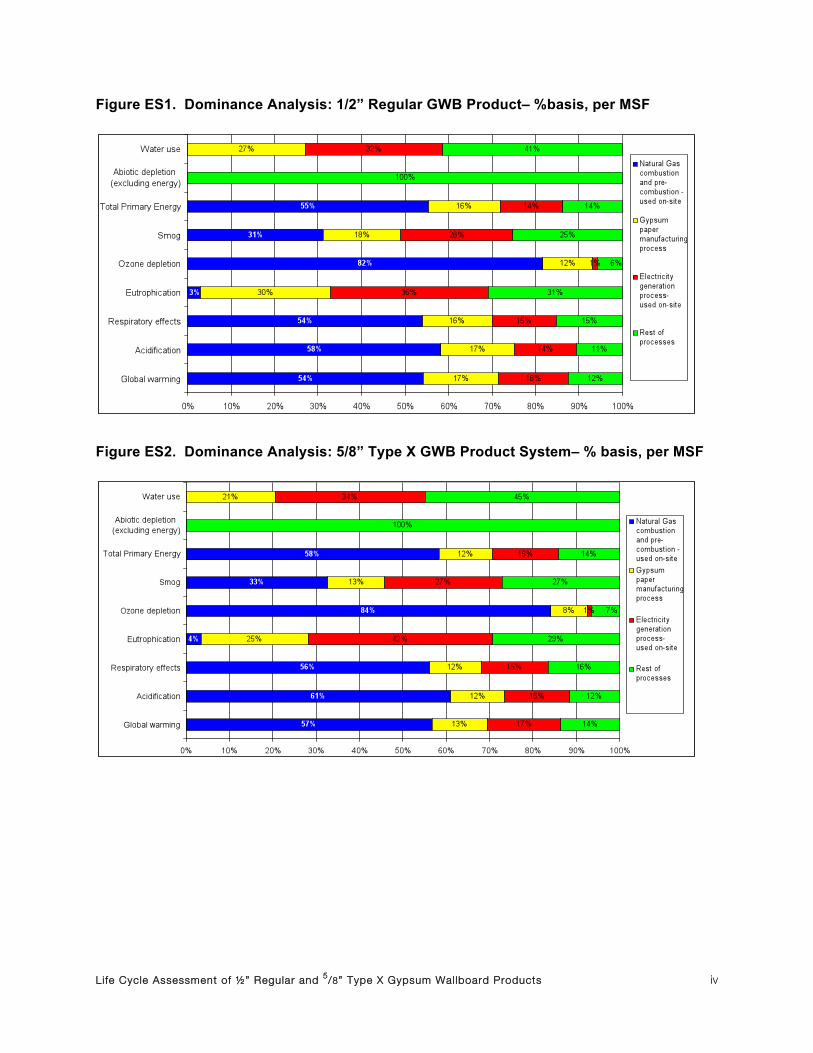
A dominance analysis revealed that the three main inputs of the GWB manufacturing system
were, in descending order, on-site natural gas use, gypsum paper and on-site electricity use.
Figure ES1 and ES2 illustrate the results of the dominance analysis for 1,000 sq. ft. (MSF) of
1/2” Regular and 5/8” Type X GWB finished products.
In fact, the GWB plant’s energy use was the single largest contributor to the majority of the LCIA
category indicator results - global warming, acidification, respiratory effects, ozone depletion,
smog and total primary energy – often accounting for greater than 70% of the total impact
results for the two GWB products.
The input of gypsum paper was the next most consistent and significant contributor to the
majority of the LCIA category results (excluding abiotic resource depletion) and ranged from 8%
to 30% of the total impact results for the two products.
Life Cycle Assessment of ½” Regular and 5/8” Type X Gypsum Wallboard Products iv
Figure ES1. Dominance Analysis: 1/2” Regular GWB Product– %basis, per MSF
Figure ES2. Dominance Analysis: 5/8” Type X GWB Product System– % basis, per MSF

Life Cycle Assessment of ½” Regular and 5/8” Type X Gypsum Wallboard Products v
Dry and wet additives in the production of GWB products accounted for 25% to 27% of the total
eutrophication potential impact across the two product systems. The contribution of additives to
the rest of the LCIA category results ranged from 3% to 11% for the two products.
Inbound transportation of raw and ancillary materials and the outbound transportation of wastes
for treatment accounted for 32% to 33% of the smog potential, but transportation contributed no
more than 8% to the other LCIA category results for the two GWB products.
The contribution of the natural gypsum extraction system (both domestic & imported) to the
depletion of abiotic resources potential was 98%. Natural gypsum’s contribution to the rest of
the LCIA category results ranged from 0.3% to 8% of the total impact results for the two
products. The net impact of FGD synthetic gypsum use was an environmental benefit to the
product system due the diversion/avoidance of landfilling FGD gypsum. The FGD gypsum
impact credit ranged from 1% to 7% across the set of LCIA category measures; except for smog
formation potential, where the credit effect was closer to 30% due to avoidance of transportation
to the landfill.
On average, for every 1,000 sq. ft. of GWB product manufactured about 0.4% of all material
inputs end up as solid waste. Of the total solid waste, 0.04% was deemed “hazardous waste” to
be incinerated – the majority of the solid waste outputs were either recycled, used as
agricultural gypsum, returned to the quarry site for the purpose of land reclamation or sent to
landfill.
An influence analysis indicated that 78% to 82% of the total LCIA results were within the GWB
plant’s sphere of operational control of which, plant energy use was the prime contributor. A
sensitivity analysis of “on-site energy use” at the GWB plant indicated that plant energy use was
also about three times more sensitive to the use of natural gas than electricity. As a result,
increased efforts to reduce natural gas use offers the most immediate opportunity to improve
the environmental performance of GWB plants and products. Additional sensitivity analyses
revealed that a change in the source location of natural gypsum imports (Canada or Mexico)
had a minimal influence (<1%) on the overall LCIA results.
The study’s scope was limited to the cradle-to-gate manufacture of the two products of interest.
A logical expansion of the study would be to extend it to a full cradle-to-grave assessment,

Athena Institute
Life Cycle Assessment of ½” Regular and 5/8” Type X Gypsum Wallboard Products vi
which would better demonstrate the full life cycle effect of GWB products by including its
installation, maintenance, service life, possible recyclability and end-of-life disposal. These
cradle-to-grave profiles can then be used to develop both Business-to-Business and Business-
to-Consumer environmental product declarations (EPDs) for these products to support the GA’s
future marketing efforts.

Life Cycle Assessment of ½” Regular and 5/8” Type X Gypsum Wallboard Products vii
Acknowledgements
The Athena Sustainable Materials Institute prepared this cradle-to-gate life cycle assessment of
two gypsum wallboard products with sponsorship by the Gypsum Association (GA). The
Institute would like to gratefully acknowledge the GA’s LCA Working Task Group members
listed below and especially Michael A. Gardner, Executive Director, and Dr. Robert Wessel,
Assistant Executive Director of the Gypsum Association, for their valuable comments and
support during the study and preparation of this report. The final report contents reflect the
views of the authors, who are responsible for the facts and accuracy of the information
presented and do not necessarily reflect the views of the Gypsum Association and its members.
Gypsum Association’s LCA Working Task Group Members:
Michael A. Gardner Executive Director, Gypsum Association
Dr. Robert Wessel Assistant Executive Director, Gypsum Association
Barry Reid Product Development Manager, Georgia-Pacific Gypsum LLC
Chuck Price Director of Engineering, National Gypsum Company
Jessica Sanderson Manager, Sustainability, USG Corporation
Michael Danks Technical Services Manager - Manufacturing, American Gypsum
Company LLC
Pamela Shinkoda Systems Innovation Manager, CertainTeed Gypsum North
American Services, Inc.
Patrick Miller Business Unit Environmental Manager Building Products, Temple-
Inland
Richard Snyder Environmental Services Manager, PABCO Gypsum
Scott Walton EHS Manager, Lafarge North America Inc.

Athena Institute
Life Cycle Assessment of ½” Regular and 5/8” Type X Gypsum Wallboard Products viii
Glossary of Terms
Based on ISO 14040/44:2006 – Terms and Definition Section [1].
Allocation: Partitioning the input or output flows of a process or a product system between the
product system under study and one or more other product systems.
Completeness check: Process of verifying whether information from the phases of a life cycle
assessment is sufficient for reaching conclusions in accordance with the goal and scope
definition.
Consistency check: Process of verifying that the assumptions, methods and data are
consistently applied throughout the study and are in accordance with the goal and scope
definition performed before conclusions are reached.
Cradle-to-gate: A cradle-to-gate assessment considers impacts starting with extracting raw
materials from the earth (the “cradle”) and ending at the plant exit “gate” where the product is to
be shipped to the user. In-bound transportation of input fuels and materials to the plant is
included. Out-bound transportation of the product to the user is not included. The use phase,
maintenance and disposal phase of the product are also not included within the scope of this
study. Disposal of on-site waste at the plant and outside, and transportation within the plant (if
applicable) are included.
Functional Unit: Quantified performance of a product system for use as a reference unit.
Life Cycle: Consecutive and interlinked stages of a product system, from raw material
acquisition or generation from natural resources to final disposal.
Life Cycle Assessment (LCA): Compilation and evaluation of the inputs, outputs and the
potential environmental impacts of a product system throughout its life cycle.

Athena Institute
Life Cycle Assessment of ½” Regular and 5/8” Type X Gypsum Wallboard Products ix
Life Cycle Impact Assessment (LCIA): Phase of life cycle assessment aimed at
understanding and evaluating the magnitude and significance of the potential environmental
impacts for a product system throughout the life cycle of the product.
Life Cycle Interpretation: Phase of life cycle assessment in which the findings of either the
inventory analysis or the impact assessment, or both, are evaluated in relation to the defined
goal and scope in order to reach conclusions and recommendations.
Life Cycle Inventory (LCI): Phase of Life Cycle Assessment involving the compilation and
quantification of inputs and outputs for a product throughout its life cycle.
Product system: Collection of unit processes with elementary and product flows, performing
one or more defined functions, and which models the life cycle of a product.
Reference flow: Measure of the outputs from processes in a given product system required to
fulfill the function expressed by the functional unit.
Sensitivity analysis: Systematic procedures for estimating the effects of the choices made
regarding methods and data on the outcome of a study.
Sensitivity check: Process of verifying that the information obtained from a sensitivity analysis
is relevant for reaching the conclusions and giving recommendations
System boundary: Set of criteria specifying which unit processes are part of a product system.
Note- The term system boundary is not used in this International Standard in relation to LCIA.
System expansion: Expanding the product system to include the additional functions related to
the co-products, taking into account the requirements of 4.2.3.3.

Life Cycle Assessment of ½” Regular and 5/8” Type X Gypsum Wallboard Products x
Based on ISO 14021:1999(E)- Clause 7.8 Recycled content.
Pre-consumer material: Material diverted from the waste stream during a manufacturing
process. Excluded is reutilization of materials such as rework, regrind or scrap generated in a
process and capable of being reclaimed within the same process that generated it.
Post-consumer material: Material generated by households or by commercial, industrial and
institutional facilities in their role as end-users of the product that can no longer be used for its
intended purpose. This includes returns of material from the distribution chain.
Athena Institute
Life Cycle Assessment of ½” Regular and 5/8” Type X Gypsum Wallboard Products xi
Table of Contents Executive Summary ...................................................................................................................... i List of Tables.............................................................................................................................. xiii List of Figures ............................................................................................................................ xvi Acronyms and Abbreviations.................................................................................................. xvii 1 Introduction............................................................................................................................... 1 2 Life Cycle Assessment.............................................................................................................. 4 3 Goal and Scope Study Definition.............................................................................................. 7
3.1 Goals of the study............................................................................................................. 7 3.1.1 Reasons for carrying out the study ........................................................................7 3.1.2 Intended applications.............................................................................................8 3.1.3 Intended audience ..................................................................................................9 3.1.4 Comparative assertions..........................................................................................9
3.2 System Scope ................................................................................................................. 10 3.2.1 System boundaries...............................................................................................10 3.2.2 Functional unit definition ....................................................................................15 3.2.3 Cut-off criteria .....................................................................................................16 3.2.4 Allocation methods..............................................................................................17
3.3 Data Quality ................................................................................................................... 24 3.3.1 Primary and secondary data sources and modeling software ..............................24 3.3.2 Primary data collection system............................................................................29 3.3.3 Precision and Completeness ................................................................................29 3.3.4 Consistency and Reproducibility.........................................................................30 3.3.5 Representativeness...............................................................................................30
3.4 Life Cycle Impact Assessment Indicators ...................................................................... 31 4 LCI Flow Reporting for Key System Processes ..................................................................... 37
4.1 Gypsum Quarrying Overview ........................................................................................ 37 4.1.1 Other Sources of Gypsum....................................................................................42
4.2 Gypsum Paper Manufacturing Overview....................................................................... 43 4.3 Gypsum Wallboard Manufacturing Overview............................................................... 50
5 LCA Results ............................................................................................................................ 61 5.1 Gypsum Quarrying LCIA Results.................................................................................. 61 5.2 Gypsum Paper LCIA Results ......................................................................................... 66 5.3 Gypsum Wallboard LCIA Results ................................................................................. 76
5.3.1 ½” Regular Gypsum Board .................................................................................76 5.3.2 5/8” Type X Gypsum Board................................................................................87
6 LCA Interpretation.................................................................................................................. 98 6.1 Identification of the significant issues............................................................................ 98
6.1.1 Dominance Analysis............................................................................................98

Athena Institute
Life Cycle Assessment of ½” Regular and 5/8” Type X Gypsum Wallboard Products xii
6.1.2 Influence Analysis .............................................................................................101 6.1.3 Contribution Analysis........................................................................................103
6.2 Completeness, Consistency and Sensitivity Checks .................................................... 105 6.2.1 Sensitivity Checks .............................................................................................105
6.2.1.1 Sensitivity Analysis- 50/50 Mix of Natural and Synthetic FGD Gypsum..............................................................................................106
6.2.1.2 Sensitivity Analysis- 70/30 Mix of Natural Gypsum Imports from Canada/Mexico ..................................................................................107
6.2.1.3 Sensitivity Analysis- On-site energy consumption.............................108 6.2.1.4 Sensitivity Analysis- FGD system expansion approach .....................110
6.3 Conclusions, limitations and recommendations........................................................... 112 7 References ............................................................................................................................. 117 Appendices.................................................................................................................................. 119 Appendix A:Case Studies on Allocation Procedures.................................................................. 120 Appendix B:Critical Review Report........................................................................................... 127

Athena Institute
Life Cycle Assessment of ½” Regular and 5/8” Type X Gypsum Wallboard Products xiii
List of Tables Table 1. General Overview of the LCI System Boundary ................................................. 15 Table 2. 2008 Electricity Grid Mixes for United States, Canada and Mexico ................ 26 Table 3. Key Primary and Secondary LCI Data Sources .................................................. 27 Table 4. Selected LCIA & LCI Flow Indicators................................................................... 36 Table 5. Material, Energy and Process Related Emissions per Short Ton of Natural
Gypsum...................................................................................................................... 40 Table 6. Inbound and outbound transportation data- Quarry System ............................. 41 Table 7. Material, Energy and Process Related Emissions per MSF of Gypsum Paper .
............................................................................................................................ 47 Table 8. Inbound and outbound transportation mode and distances - Gypsum Paper
System ....................................................................................................................... 49 Table 9. Product Formulations per MSF of Regular and Type ”X” Gypsum Wallboard
(weighted average) .................................................................................................. 53 Table 10. Material, Energy and Process Related Emissions per MSF of Gypsum
Wallboard .................................................................................................................. 54 Table 11. Inbound and outbound transportation mode and distances - Gypsum
Wallboard System .................................................................................................... 58 Table 12. Weighted Average Gypsum Quarrying/Mining LCIA results – absolute basis,
per short ton natural gypsum.................................................................................. 62 Table 13. Weighted Average Gypsum Quarrying/Mining LCIA results – percent basis . 63 Table 14. Contribution of Fuel Types to “On-site Energy Consumption” Category
Indicators – absolute basis, per short ton natural gypsum ................................ 64 Table 15. Weighted Average Gypsum Backing Paper LCIA results – absolute basis, per
MSF ............................................................................................................................ 68 Table 16. Weighted Average Gypsum Facing Paper LCIA results – absolute basis, per
MSF ............................................................................................................................ 69 Table 17. Weighted Average Gypsum Backing Paper LCIA results – percent basis, per
MSF ............................................................................................................................ 70 Table 18. Weighted Average Gypsum Facing Paper LCIA results – percent basis, per
MSF ............................................................................................................................ 71 Table 19. Contribution of Chemical Types to Total Chemical Usage for Gypsum Backing
Paper Manufacturing LCIA Results– absolute basis, per MSF ......................... 73 Table 20. Contribution of Chemical Types to Total Chemical Usage Category Indicators
for Gypsum Backing Paper Manufacturing– percent basis, per MSF .............. 74 Table 21. Weighted Average ½” Regular GWB LCIA results –absolute basis, per MSF78 Table 22. Weighted Average ½” Regular GWB LCIA results – percent basis, per MSF 78

Athena Institute
Life Cycle Assessment of ½” Regular and 5/8” Type X Gypsum Wallboard Products xiv
Table 23. Summary: Gypsum Input LCIA Contribution Analysis -½” Regular GWB– absolute basis, per MSF ......................................................................................... 79
Table 24. Summary: Gypsum Input LCIA Contribution Analysis -½” Regular GWB– percent basis, per MSF ........................................................................................... 80
Table 25. Summary: Gypsum Plant Energy Use LCIA Contribution Analysis - ½” Regular GWB– absolute basis, per MSF .............................................................. 82
Table 26. Summary: Additives Input LCIA Contribution Analysis - ½” Regular GWB – absolute basis, per MSF ......................................................................................... 85
Table 27. Summary: Additives Input LCIA Contribution Analysis - ½” Regular GWB– percent basis, per MSF ........................................................................................... 86
Table 28. Weighted Average5/8” Type X GWB LCIA results –absolute basis, per MSF 89 Table 29. Weighted Average5/8” Type X GWB LCIA results –percent basis, per MSF .. 89 Table 30. Summary: Gypsum Input LCIA Contribution Analysis - 5/8” Type X GWB–
absolute basis, per MSF ......................................................................................... 90 Table 31. Summary: Gypsum Input LCIA Contribution Analysis - 5/8” Type X GWB–
percentage basis, per MSF .................................................................................... 91 Table 32. Summary: Gypsum Plant Energy Use LCIA Contribution Analysis - 5/8” Type X
GWB–absolute basis, per MSF .............................................................................. 93 Table 33. Summary: Additives Input LCIA Contribution Analysis - 5/8” Type X GWB–
absolute basis, per MSF ......................................................................................... 96 Table 34. Summary: Additives Input LCIA Contribution Analysis - 5/8” Type X GWB–
percent basis, per MSF ........................................................................................... 97 Table 35. Dominance Analysis: ½” Regular GWB Product System – absolute basis, per
MSF ............................................................................................................................ 99 Table 36 Dominance Analysis: ½” Regular GWB Product System – percent basis, per
MSF .......................................................................................................................... 100 Table 37 Dominance Analysis: 5/8” Type X GWB Product System– absolute basis, per
MSF .......................................................................................................................... 100 Table 38. Dominance Analysis: 5/8” Type X GWB Product System– percent basis, per
MSF .......................................................................................................................... 101 Table 39. Influence Analysis: ½” Regular GWB Product System– percent basis, per
MSF .......................................................................................................................... 102 Table 40. Influence Analysis: 5/8” Type X GWB Product System– percent basis, per
MSF .......................................................................................................................... 103 Table 41. Substance Contribution Analysis: ½”Regular GWB Product System– Absolute
and percent basis, per MSF ................................................................................. 104 Table 42 Sensitivity Analysis: Change of the Baseline from 41/59 to 50/50 natural to
synthetic FGD mix- ½” Regular GWB Product System– absolute and percent basis, per MSF........................................................................................................ 107

Athena Institute
Life Cycle Assessment of ½” Regular and 5/8” Type X Gypsum Wallboard Products xv
Table 43. Sensitivity Analysis: 70%/30% of Natural Gypsum Imports from Canada/Mexico - ½” Regular GWB Product System LCIA Results – absolute basis and percent, per MSF ................................................................................. 108
Table 44. Sensitivity Analysis: 18% Change in GWB Plant Electricity Use- ½” Regular GWB Product System - GWP and TPE LCIA Results – absolute and percent basis, per MSF........................................................................................................ 109
Table 45. Sensitivity Analysis: 16% Change in GWB Plant Natural Gas Use - ½” Regular GWB Product System- GWP and TPE LCIA Results– absolute and percent basis, per MSF ......................................................................................... 110
Table 46. Sensitivity Analysis: Exclusion of “System Expansion Avoidance” Effect - ½” Regular GWB Product System– absolute basis, per MSF .............................. 111

Athena Institute
Life Cycle Assessment of ½” Regular and 5/8” Type X Gypsum Wallboard Products xvi
List of Figures Figure 1. Stages of an LCA as per ISO 14044:2006............................................................. 5 Figure 2. “Cradle-to-Gate” System Boundaries of the Gypsum Wallboard Manufacturing
............................................................................................................................ 12 Figure 3. “Cradle-to-Gate” System Boundaries of the Gypsum Quarry ........................... 13 Figure 4. “Cradle-to-Gate” System Boundaries of the Gypsum Paper Manufacturing .. 14 Figure 5. Model for describing system expansion approach for the FGD synthetic
gypsum, co-products generated at coal fired power plants............................... 22 Figure 6. Model for describing system expansion for the utilization of post-consumer
gypsum material ....................................................................................................... 23 Figure 7. Contribution of Gypsum Sources to total input gypsum – Percent basis ....... 52 Figure 8. Contribution of Fuel Types to “On-site Energy Consumption” Category
Indicators – percent basis ....................................................................................... 65 Figure 9. Contribution of Fuel Types to “On-site Energy Consumption” Category
Indicators – Gypsum Backing Paper– percent basis, per MSF......................... 72 Figure 10. Contribution of Recycled Paper Input Types to “Total Waste Paper Sorting
and Transportation” Category Indicators- Gypsum Facing Paper Manufacturing– percent basis, per MSF ............................................................... 75
Figure 11. Summary: Gypsum Input LCIA Contribution Analysis - ½” Regular GWB– percent basis, per MSF ........................................................................................... 81
Figure 12. Summary: Gypsum Plant Energy Use LCIA Contribution Analysis - ½” Regular GWB– percent basis, per MSF................................................................ 83
Figure 13. Summary: Inbound/Outbound Transportation LCIA Contribution Analysis - ½” Regular GWB– percent basis, per MSF................................................................ 84
Figure 14. Summary: Gypsum Input LCIA Contribution Analysis - 5/8” Type X GWB– percent basis, per MSF ........................................................................................... 92
Figure 15. Summary: Gypsum Plant Energy Use LCIA Contribution Analysis - 5/8” Type X GWB– percent basis, per MSF .................................................................................. 94
Figure 16. Summary: Inbound/Outbound Transportation LCIA Contribution Analysis - 5/8” Regular GWB– percent basis, per MSF ......................................................... 95

Athena Institute
Life Cycle Assessment of ½” Regular and 5/8” Type X Gypsum Wallboard Products xvii
Acronyms and Abbreviations
ADP Abiotic Depletion Potential
Btu British thermal units
CED Cumulative Energy Demand
CF Characterization factors
CFCs Chlorofluorocarbons
CFC-11 Trichlorofluoromethane
CML Institute of Environmental Sciences (CML), Netherlands
DBS Dunnage, Bunks, Sleutters
EPDs Environmental Product Declarations
FGD Flue Gas Desulfurization
GA Gypsum Association
GWB Gypsum Wallboard
GWP Global Warming Potential
H+ Hydrogen ion
HFCs Hydrochlorofluorocarbons
HHV Higher Heating Value
IC Impact categories
IPCC International Panel on Climate Change
Athena Institute
Life Cycle Assessment of ½” Regular and 5/8” Type X Gypsum Wallboard Products xviii
ISO International Organization for Standardization
LCA Life Cycle Assessment
LCI Life Cycle Inventory
LCIA Life cycle impact assessment
LEED Leadership in Energy & Environmental Design
MJ Megajoule
MSF Thousand square feet
N Nitrogen
NIST National Institute of Standards and Technology
NOx Nitrogen oxides
OCC Old Corrugated Container
P Phosphorous
PM 2.5 Particulate matter less than 2.5 micrometers in diameter
PM 10 Particulate matter less than 10 micrometers in diameter
POCP Photochemical Ozone Creation Potential
Sb Antimony
SETAC The Society of Environmental Toxicology and Chemistry
SO2 Sulfur dioxide
STMP Sodium Trimetaphosphate
Athena Institute
Life Cycle Assessment of ½” Regular and 5/8” Type X Gypsum Wallboard Products xix
TPM Total Particulate Matter
TRA Tool for the Reduction and Assessment of Chemical and Other Environmental Impacts
UNEP United Nations Environment Program
US EPA United States Environmental Protection Agency
VOCs Volatile Organic Compounds
WMO World Meteorological Organization

Athena Institute
Life Cycle Assessment of ½” Regular and 5/8” Type X Gypsum Wallboard Products 1
1 Introduction
The objective of this study was to develop a transparent ISO 14040/44:2006 compliant,
weighted average, benchmark cradle-to-gate life cycle assessment (LCA) of 1,000 square feet
(92.9 m2) of two common gypsum wallboard products produced by the Gypsum Association’s
(GA) member companies: namely, ½” Regular and 5/8“ Type X gypsum wallboard.
Gypsum wallboard (GWB) is ubiquitous in building construction, covering walls, ceilings and
partitions in both residential and commercial building applications. In 2009,18.3 billion square
feet of gypsum wallboard was consumed in the United States. Of this amount, Regular ½” and
Type X accounted for 80% of all gypsum wallboard consumed [11]. Over time, the use of flue
gas desulfurized (FGD) synthetic gypsum as a substitute for crude or raw quarried gypsum has
grown to represent 50% or more of the gypsum furnish used in the USA to manufacture gypsum
wallboard. This study is based on primary LCI data collected for quarried and mined natural
gypsum, production of GWB facing and backing papers and GWB plant manufacturing for the
reference year 2010. The study also incorporates a system expansion approach to estimate the
environmental profile of synthetic FGD gypsum used in the production of the two board types.
The results of the LCA study will be incorporated into GA’s “Go-to-Market” product literature and
will be made available for inclusion in the US LCI Database, LCA software and calculation tools
to support the needs of GA member companies, their suppliers, architectural, engineering, and
specifying professionals, LCA practitioners and tool developers, academia, governmental
organizations, policy makers and other interested value chain parties who require reliable
information on sustainable building products and processes.
The Gypsum Association is an international, not-for-profit trade association founded in 1930 and
is based in the Washington, DC area. The mission of the Gypsum Association is to promote the
use of gypsum while advancing the development growth, and general welfare of the gypsum
industry in the United States and Canada on behalf of its member companies1. The GA and its
member companies foster an accountable and environmentally responsible attitude toward the
preservation of natural resources, the establishment of recycling and waste management
1 Gypsum Association website, 2011: http://www.gypsum.org

Athena Institute
Life Cycle Assessment of ½” Regular and 5/8” Type X Gypsum Wallboard Products 2
programs, and the many diverse issues relating to land reclamation and use. Present-day
manufacturing processes enable gypsum panels to be manufactured using synthetic, recycled
or recovered material, gypsum manufacturing facilities to employ energy-efficient technologies,
and depleted gypsum mines and quarries to be rehabilitated to merge with the existing natural
landscape. A full description of the GA and its activities can be found at www.gypsum.org.
The Gypsum Association engaged the Athena Sustainable Materials Institute to benchmark and
characterize the key environmental life cycle flows to and from nature associated with the
manufacture of ½” Regular and 5/8” Type X gypsum wallboard products for the reference year
2010. Future work may focus on positioning these gypsum products relative to all materials
within typical building archetypes from an environmental perspective over the full life cycle of a
building. This initial effort of the GA and its members is a key-step in developing a more
strategic approach for communicating and improving the sustainability of gypsum wallboard
products.
The report is organized as follows:
Section 2 provides a brief overview of the LCA framework according to ISO 14040/44:2006.
Section 3 describes the goal and scope of the study including the study’s intent, applications
and target audiences. It also sets out the system boundary, functional unit, cut-off
criteria, allocation methods, data quality indicators, key data sources and the life cycle
impact indicators supported by the study.
Section 4 provides an overview of the three gate-to-gate processes making up the GWB cradle-
to-gate product system and summarizes the materials, energy and emission to air,
water and land inventory flows associated with each of the processes.
Section 5 builds on Section 4 by linking the upstream materials, energy, and component
processes back to earth to present the complete cradle-to-gate life cycle impact
assessment (LCIA) results for the two reference product systems – quarried gypsum
and gypsum paper production – and then for the functional unit of the two gypsum
wallboard products of interest. The contribution of various raw and ancillary material
Athena Institute
Life Cycle Assessment of ½” Regular and 5/8” Type X Gypsum Wallboard Products 3
inputs, energy types and processes to the various product system results are
highlighted in this section.
Section 6 brings together the LCI and LCIA results to identify significant issues in the context of
the goal and scope of the study. Issues are identified via dominance, influence and
contribution analysis for the two product systems. This section then provides an
evaluation of the study’s completeness and methodology consistency in relation to the
goal and scope of the study. Various sensitivity analyses are also performed to check
the robustness of the results and to determine the extent to which changes in the
product system may significantly impact GWB manufacture. Finally, the section
presents the study’s conclusions, limitations and makes some recommendations for
possible next steps to extend the usefulness of the study.

Athena Institute
Life Cycle Assessment of ½” Regular and 5/8” Type X Gypsum Wallboard Products 4
2 Life Cycle Assessment
Life cycle assessment (LCA) is an analytical tool used to comprehensively quantify and interpret
the energy and material flows to and from the environment over the entire life cycle of a product,
process, or service [1]. Environmental flows include emissions to air, water, and land, as well as
the consumption of energy and material resources. By including the impacts throughout the
product life cycle, LCA provides a comprehensive view of the environmental aspects of the
product and a more accurate picture of the true environmental trade-offs in product selection.
Two international standards, ISO 14040:2006 and ISO 14044:20062, describe an iterative four-
stage or phased methodology framework for completing an LCA, as shown in Figure 1: (1) goal
and scope definition, (2) life cycle inventory, (3) life cycle impact assessment, and (4)
interpretation.
An LCA starts with an explicit statement of the goal and scope of the study, the functional unit,
the system boundaries, the assumptions and limitations, the allocation methods used, and the
impact categories chosen. The goal and scope includes a definition of the context of the study,
which explains how and to whom the results are to be communicated. The ISO standards
require that the goal and scope of an LCA be clearly defined and consistent with the intended
application. The functional unit defines what is being studied. The purpose of the functional unit
is to quantify the service delivered by the product system and provide a reference to which the
inputs and outputs can be related. Allocation is the method used to partition the environmental
load of a process when several products or functions share the same process.
In inventory analysis a flow model of the technical system is constructed using data on inputs
and outputs. The flow model is often illustrated with a flow chart that includes the activities that
are going to be assessed and gives a clear picture of the technical system boundary. The input
and output data needed for the construction of the model (such as materials and energy flows,
emissions to air and water, and waste generation) are collected for all activities within the
system boundary. Then the environmental loads of the defined system are calculated and
related back to the functional unit, and the flow model is finished.
2 ISO 14040:2006. Environmental Management – Life Cycle Assessment – Principles and Framework. ISO 14044:2006. Environmental Management – Life Cycle Assessment – Requirements and guidelines.

Athena Institute
Life Cycle Assessment of ½” Regular and 5/8” Type X Gypsum Wallboard Products 5
Figure 1. Stages of an LCA as per ISO 14044:2006
Inventory analysis is followed by impact assessment, in which the life cycle inventory data are
characterized in terms of their potential environmental impacts; for example, resulting in
acidification, ozone depletion, and global warming. The impact assessment phase of LCA is
aimed at evaluating the significance of potential environmental impacts based on the LCI flow
results. Classical life cycle impact assessment (LCIA) consists of the following mandatory
elements: selection of impact categories, category indicators, and characterization models; and
continues with the classification stage, where the inventory parameters are sorted and assigned
to specific impact categories.
The categorized LCI flows are then characterized using one of many possible LCIA
methodologies into common equivalence units and summed to provide an overall impact
category total. This equivalency conversion is based on characterization factors as prescribed
by the selected LCIA methodology. In many LCAs, characterization concludes the LCIA
analysis; this is also the last compulsory stage according to ISO 14044:2006. However, in
addition to the mandatory LCIA elements (selection, classification, and characterization), other

Athena Institute
Life Cycle Assessment of ½” Regular and 5/8” Type X Gypsum Wallboard Products 6
optional LCIA elements (normalization, grouping, and weighting) may be conducted depending
on the goal and scope of the LCA study. In normalization, the results of the impact categories
from the study are usually compared with the total impact in the region of interest. Grouping
consists of sorting and possibly ranking of the impact categories. During weighting, the different
environmental impacts are weighted against each other to get a single number for the total
environmental impact. As per ISO 14044:2006, “weighting shall not be used in LCA studies
intended to be used in comparative assertions intended to be disclosed to the public”. While
this study does not make explicit comparative assertions, readers and users of this study may
infer a comparison and thus weighting and other optional LCIA elements are excluded to be
consistent with the goal and scope of the LCA study and the ISO 14044:2006 protocol.
The results from the inventory analysis and impact assessment are summarized during the
interpretation phase. The outcome of the interpretation phase is a set of conclusions and
recommendations for the study. According to ISO 14040:2006 the interpretation should include:
identification of significant issues based on the results of the LCI and LCIA phases of
LCA;
evaluation of the study considering completeness, sensitivity, and consistency checks;
conclusions, limitations and recommendations.
The working procedure of LCA is iterative, as illustrated by the back-and-forth arrows in Figure
1. The iteration means that information gathered in a latter stage can cause effects in a former
stage. When this occurs, the former stage and the following stages have to be reworked taking
into account the new information. At the end, the results and conclusions of the LCA will be
completely and accurately reported to the intended audience. The data, methods, assumptions,
limitations, and results will be transparent and presented in sufficient detail to allow the
interested parties to comprehend the complexities and trade-offs inherent in the LCA. The report
will also allow the results and interpretation to be used in a manner consistent with the goals of
the study.
Athena Institute
Life Cycle Assessment of ½” Regular and 5/8” Type X Gypsum Wallboard Products 7
3 Goal and Scope Study Definition
This is a sector-driven initiative by the GA and its members to conduct a benchmarking LCA
study of the industry’s two primary products: ½” Regular and 5/8” Type X gypsum wallboard.
The geographical scope of the study is North America. Primary or foreground LCI data have
been collected for quarried and mined gypsum, facing and backing gypsum paper manufacture
and for the two commonly produced gypsum wallboard industry products for the reference year
2010.
3.1 Goals of the study As per ISO 14044:2006, the goal of an LCA should state the following:
the reasons for carrying out the study;
the intended application;
the intended audience, i.e., to whom the results of the study are intended to be
communicated; and
whether the results are intended to be used in comparative assertions intended to be
disclosed to the public.
3.1.1 Reasons for carrying out the study
In collaboration with the GA LCA working team members, the following drivers for carrying out
this LCA study were identified.
To better characterize the overall environmental performance of the membership’s
primary products.
To be able to share, and respond to customer and public requests for, accurate
environmental information on GA member processes and products.
To better understand the contribution of various GWB processes within the cradle-to-
gate profile of GWB products.

Athena Institute
Life Cycle Assessment of ½” Regular and 5/8” Type X Gypsum Wallboard Products 8
To assist other organizations in understanding and communicating the environmental
footprint and performance of their products when incorporating GWB products.
More specifically the goals of this study are as follows:
1. Determine the cradle-to-gate environmental profile, on a production weighted average
(representative) basis of 1,000 square feet of ½” Regular gypsum wallboard product,
and identify key environmental inputs and outputs associated with the manufacture of
this GWB product.
2. Determine the cradle-to-gate environmental profile, on a production weighted average
(representative) basis of 1,000 square feet of 5/8” Type X gypsum wallboard product, and
identify key environmental inputs and outputs associated with the manufacture of this
GWB product.
The manufacture of both board types conforms to ASTM C1396 / C1396M - 09a 3 providing a
backing or finished surface to enclose walls, ceilings and floor surfaces; however, 5/8” Type X
gypsum wallboard also has a one hour fire rating (ASTM E119 - 10b4) – an additional
functionality associated with its finished thickness and properties. While both products have
similar applications they provide different functionality; therefore no immediate product based
comparative assertion is inferred or implied across the two products of interest in this study.
3.1.2 Intended applications
Intended applications for the results of this study are as follows.
1. To update and benchmark the environmental implications associated with the industry’s
two primary GWB products which will support future projects such as:
promoting and tracking the continuous improvement of the environmental performance
of the gypsum based building materials as technology improves over time; and
3ASTM C1396 / C1396M - 09a- Standard Specification for Gypsum Board. http://www.astm.org/Standards/C1396.htm. 4ASTM E119 - 10b-Standard Test Methods for Fire Tests of Building Construction and Materials. http://www.astm.org/Standards/E119.htm.

Athena Institute
Life Cycle Assessment of ½” Regular and 5/8” Type X Gypsum Wallboard Products 9
industry average carbon footprint reporting or the preparation of an environmental
product declaration (EPD).
2. Market Support. The LCA will provide detailed gate-to-gate process and cradle-to-gate
product profiles, with key indicators of environmental performance. These product and
process environmental profiles will support education and marketing efforts with
environmentally conscious customers or organizations to properly position GWB
products in the building construction industry (e.g., LEED – Leadership in Energy &
Environmental Design green building certification system and Green Globes rating
system, government procurement programs, etc.).
3. To populate the US LCI Database and have data incorporated into North American LCA
software tools. The primary process LCI data will be submitted to the US LCI Database
and made available to building related LCA software developers – the Athena Institute
and the National Institute of Standards and Technology (NIST) – for inclusion in their
tools (i.e., ATHENA® Impact Estimator for Buildings, ATHENA® EcoCalculator for
Assemblies and/or BEES – Building for Environmental and Economic Sustainability).
3.1.3 Intended audience
The intended audience for the results of this LCA study include GA member companies, their
suppliers, architectural, engineering, and specifying professionals, LCA practitioners and tool
developers, academia, U.S. governmental organizations, policy makers and other interested
supply/value chain parties who require reliable information on sustainable building products and
processes. 3.1.4 Comparative assertions
This LCA does not include or support comparative assertions; however, it may lead to future
comparative studies intended to be disclosed to the public. Therefore, an independent critical
review process by an external expert was conducted in conformity with Clause 6.2, ISO
14044:2006 to verify whether this LCA has met the requirements for methodology, data,
interpretation and reporting and whether it is consistent with the ISO 14040/44:2006 principles.
Mr. David H. Reisdorph, LCA expert withtheGreenTeam Inc. conducted the critical review of the

Athena Institute
Life Cycle Assessment of ½” Regular and 5/8” Type X Gypsum Wallboard Products 10
GA LCA study. As per ISO requirements the full review statement and the response to
reviewer’s recommendation are presented in Appendix B.
3.2 System Scope
The study’s scope was to develop an ISO14040/44 compliant cradle-to-gate life cycle
assessment for two primary gypsum wallboard industry products – ½” Regular and 5/8” Type X –
for the 2010 reference year.
3.2.1 System boundaries
A cradle-to-gate assessment considers impacts starting with the extraction of raw materials from
the earth (the “cradle”) and ending at the plant exit “gate” where the product is packaged and
ready for shipment to either a distribution center or directly to the product user.
In-bound transportation of input fuels, primary raw materials, ancillary and packaging materials
as well as the intermediate product inputs such as facing and backing paper delivered to the
plant was included. Out-bound transportation of the finished gypsum wallboard was not included
but it was recorded to support future projects. The use phase, maintenance and end-of-life
phases of the product were also not included within the scope of the study. On-site
transportation of materials and product (e.g., by forklift) and outbound transport and waste
treatment were included. The impacts of FGD synthetic gypsum, a co-product of electricity
generation at coal-fired plants, internal gypsum wallboard material which is recycled back in the
GWB production system, and the collection and use of post-consumer GWB was also included
within the system boundary.
For the gypsum wallboard plant, a plant gate-to-gate “black box” approach was applied,
meaning that input/output data were rolled up and not reported for every single constituent
operation occurring within the plant; e.g., secondary crushing and drying of the raw furnish,
calcined stucco production, wet and dry additives blending, board lay-up, drying, scoring, cutting
and packaging for final shipment were rolled up and were not reported or studied as separate
unit processes. This “black box” approach necessitated using an allocation methodology to
partition and allocate the input and output flows for the products of interest from the other
Athena Institute
Life Cycle Assessment of ½” Regular and 5/8” Type X Gypsum Wallboard Products 11
products produced at the gypsum wallboard plant. See section 3.2.4 Allocation Methods for a
discussion of the allocation methodology applied in this study. A similar “black box” approach
was applied to the gypsum quarrying and gypsum papers production system boundaries.
Figures 2 to 4 depict the cradle-to-gate system boundaries for the three primary product
systems studied: gypsum wallboard manufacture; crude gypsum ore quarrying/mining; and
gypsum facing and backing papers production.
The cradle-to-gate environmental profiles for the two GWB primary products can be used at a
later stage to evaluate the full cradle-to-grave profile of these products. A cradle-to-grave
assessment typically considers impacts at each stage of a product's life cycle, from the time
natural resources are extracted from the ground and processed, through each subsequent
stage of manufacturing, transportation, product use, recycling and, ultimately, disposal. These
cradle-to-grave profiles can then be used to develop both Business-to-Business and Business-
to-Consumer environmental product declarations (EPDs) for these products to further support
the GA’s marketing efforts in the future.

Athena Institute
Life Cycle Assessment of ½” Regular and 5/8” Type X Gypsum Wallboard Products 12
Figure 2. “Cradle-to-Gate” System Boundaries of the Gypsum Wallboard Manufacturing

Athena Institute
Life Cycle Assessment of ½” Regular and 5/8” Type X Gypsum Wallboard Products 13
Figure 3. “Cradle-to-Gate” System Boundaries of the Gypsum Quarry

Athena Institute
Life Cycle Assessment of ½” Regular and 5/8” Type X Gypsum Wallboard Products 14
Figure 4. “Cradle-to-Gate” System Boundaries of the Gypsum Paper Manufacturing

Athena Institute
Life Cycle Assessment of ½” Regular and 5/8” Type X Gypsum Wallboard Products 15
Table 1 presents a summary of the elements included and excluded from the cradle-to-gate
system boundary.
Table 1. General Overview of the LCI System Boundary
Included Excluded
“Cradle-to-Gate” system boundary • Input raw materials • Input process ancillary materials • Input energy supply • Operation of primary production and
pollution abatement equipment • Operation of mobile support equipment • Input water (for process and cooling) • On-site recycling of post-consumer
GWB waste • Packaging of products • In-bound transportation of raw materials,
ancillary materials, intermediate products and fuels
• Overhead (heating, lighting) of manufacturing facilities
• Out-bound transportation and disposal of generated waste
• Fixed capital equipment • Hygiene related water use • Transportation of employees
Raw material is defined as primary or secondary material that is used to produce a product
(secondary material includes recycled material); ancillary material is defined as material input
that is used by the unit process producing the product, but which does not constitute part of the
product (ISO 14044:2006).
3.2.2 Functional unit definition
The functional unit is defined in ISO 14040:2006 as the quantified performance of a product
system for use as a reference unit.
The functional units of the two GWB product systems of interest were as follows.
Manufacture of 1000 square feet of ½” Regular gypsum wallboard ready for shipment at
the plant gate.

Athena Institute
Life Cycle Assessment of ½” Regular and 5/8” Type X Gypsum Wallboard Products 16
Manufacture of 1000 square feet of 5/8“ Type X gypsum wallboard ready for shipment at
the plant gate.
The two GWBs of interest vary in thickness, constituent make-up and functionality with the 5/8“
Type X gypsum wallboard having a one-hour fire rating; as a result, no comparative assertion is
inferred or implied. The two GWB products are capable of covering an area of 1,000 sq. ft. of
wall, floor or ceiling (excluding any off-cut waste).
The functional unit of the gypsum quarry production system was the production of one short ton
natural gypsum ore (2,000 lbs). The functional unit of gypsum facing and backing paper
production system was the manufacture of 1,000 square feet (1 MSF) of gypsum paper. Both
quarried gypsum and gypsum paper are reference flows for the production of the functional
units. ISO defines the reference flow as a measure of the outputs from processes in a given
product system required to fulfill the function expressed by functional unit. Since no functional
comparison is being performed, the functional unit and reference flow for the two GWB of
interest are the same.
3.2.3 Cut-off criteria
The cut-off criteria for input flows to be considered within the system boundary were as follows.
Mass – if a flow is less than 1% of the total mass of the inputs considered within the
product system it may be excluded, providing its environmental relevance is minor.
Energy – if an input flow is less than 1% of the total product system’s energy inputs it
may be excluded, providing its environmental relevance is minor.
Environmental relevance – if an input flow meets the above two criteria, but is
determined (via secondary data analysis) to contribute 2% or more to any product life
cycle impact category (see below), it is included within the system boundary.
The sum of the neglected input flows was not to exceed 3% of the total mass, energy or
environmental relevance. Similar cut-off criteria were used to identify which outputs needed to
be traced to the environment; for example, by including waste treatment processes.

Athena Institute
Life Cycle Assessment of ½” Regular and 5/8” Type X Gypsum Wallboard Products 17
3.2.4 Allocation methods
The multi-functionality of many processes has been previously identified as a significant
methodological LCA issue. The general situation is that most processes that constitute part of a
product system are multi-functional: (1) they produce more than one product (co-production); (2)
treat two or more waste inputs (combined waste treatment); (3) treat one waste input and
produce one valuable output (open- or closed-loop recycling); or (4) serve three or more
valuable functions from both an input and output perspective [10]. In such cases the materials
and energy flows, as well as associated environmental releases, shall be allocated to the
different products according to clearly stated procedures (ISO 14044:2006, Clause 4.3.4).
As per ISO 14044:2006, allocation means partitioning the input or output flows of a process or a
product system between the product system under study and one or more other product
systems. The guidance provided by ISO recognizes the variety of approaches that can be used
to deal with multifunctional processes. Under the heading “Allocation”, ISO 14044:2006
presents a hierarchy of different approaches to this multi-functionality problem. As the hierarchy
addresses approaches other than allocation and also identifies the first two approaches as
"avoiding allocation", it is argued that a clearer and more appropriate approach would be the
encompassing title “Solving multi-functionality of processes“ [22].
ISO suggests a generic step-wise framework in LCA. The following three steps are required:
Step 1 Wherever possible allocation should be avoided by –
(a) Dividing the unit process to be allocated into two or more sub-processes and collecting
the input and output data related to these sub-processes, or
(b) Expanding the product system to include additional functions related to the co-products,
taking into account the requirements of ISO 14044.
Step 2 Where allocation cannot be avoided, the inputs and outputs of the system should be
partitioned between its different products and functions in a way that reflects the underlying
physical relationships between them; that is, they should reflect the fact that inputs and
outputs are changed by quantitative changes in the products or functions delivered by the
system.

Athena Institute
Life Cycle Assessment of ½” Regular and 5/8” Type X Gypsum Wallboard Products 18
Step 3 Where physical relationships alone cannot be established or used as the basis for
allocation, the inputs should be allocated between the products and functions in a way that
reflects other relationships between them. For example, input and output data might be
allocated between co-products in relation to the economic value of the products.
ISO requirements and recommendations were followed in this LCA study for allocation
procedures in general (Clause 4.3.4.2) and allocation procedures for reuse and recycling
(Clause 4.3.4.3).
“Quarry” production system – “Mass” was deemed as the most appropriate physical
parameter for allocation of the total environmental load of the quarry system between quarried
gypsum (97%) and the “solid rock sold to other industries” co-product (3%). On average, 0.033
short tons of solid rock was sold to other industries per short ton of quarried gypsum produced
(see Table 5). Overburden remained on-site for reclamation and was deemed “burden free”.
“Gypsum Paper” production system – “Mass” was also deemed as the most appropriate
physical parameter for allocation of the total environmental load of gypsum paper system
between gypsum paper (97%) and the “downgraded and side-rolls” co-products (3%). On
average, 29 sq. ft. of downgraded and side-rolls were generated during the manufacture of 1
MSF gypsum paper (see Table 7).
“Gypsum wallboard ” production system – Gypsum wallboard manufacturing is a complex
technical system with a wide range of input materials and gypsum product outputs. As a result,
plant specific generic formulations for 1,000 square feet of the two products of interest were
used to calibrate and calculate the required input raw (both primary and secondary) and
ancillary materials. “Mass” was also deemed as the most appropriate physical parameter for
allocation used for the gypsum wallboard system (between ½” Regular and 5/8” Type X GWB
products and other types of calcined GWB co-products) to estimate the input energy flows
(electricity, natural gas, propane, etc.), water input, process emissions and waste flows.
Synthetic FGD Gypsum - Electricity generated at the coal-fired power station is the main
product of the coal combustion multi-functional process. FGD synthetic gypsum is a co-product

Athena Institute
Life Cycle Assessment of ½” Regular and 5/8” Type X Gypsum Wallboard Products 19
of coal-fired power generation process – a result of SO2 scrubbing of stack emissions enforced
by the US EPA Clean Air Act– and a major raw material used in the production of GWB.
For FGD gypsumto be a saleable co-product for use in GWB manufacturing it needs to undergo
processing (dewatering) and transport to the GWB manufacturing facility. As a result, the
intermediate processing (dewatering) and transport of FGD was included within the system
boundary. It should be mentioned that salable FGD synthetic gypsum has the same molecular
composition as crude or raw gypsum and displaces crude gypsum on a one-to-one basis.
Typically, FGD gypsum undergoes additional secondary drying at the GWB plant; this drying is
included in the facility level LCI data.
ISO requirements and recommendations were followed in this LCA study to solve “multi-
functionality” of coal-fired power generation process and calculate the environmental profile of
the FGD synthetic gypsum, a co-product of coal power plant.
As recommended by ISO Step 1.a, division of the process to sub-processed was not possible
for the coal-fired power generation process as the product and co-product are intrinsically
linked. Subdivision is often but not always possible to avoid allocation for black box unit
processes and can be typically applied for example to products whose manufacture is not
intrinsically linked (see Example A.1, Appendix A).
To avoid allocation, ISO recommends using Step 1.b - to expand the product system to include
the additional functions related to the co-products (known as “system expansion” approach).
System expansion/substitution are also called “system enlargement” and “crediting" / "avoided
burden approach”, respectively. This is a combined concept for ensuring the equality of
multifunctional systems with each other [22].
System expansion is applicable for product system modeling that is interested to include
existing interactions with other systems (Attributional LCA studies, Situation C1) [22]. ISO
14049:2000 provides some examples of allocation avoidance by expanding product system
boundaries (see Section 6.4, 8.3.1, 8.3.2).

Athena Institute
Life Cycle Assessment of ½” Regular and 5/8” Type X Gypsum Wallboard Products 20
The LCA team also considered the possibility of splitting the input/output data between the
primary product (electricity) and the co-product (FGD synthetic gypsum) in a way that reflects
either the physical or economic relationships between them (ISO Step 2 and 3). As per ISO
Step 2, the LCA team should determine whether a physical parameter could be identified as a
basis for calculating the allocation factor. Any physical parameter, e.g., mass, surface, volume,
feedstock energy, thermal conductivity, viscosity, specific mass, etc., could be taken into
consideration in order to identify the physical parameter which reflects the underlying physical
relationship between product and the other co-products [4].
Physical allocation is possible if the ratio between product and co-product (s) can be varied
without changing the inputs and outputs (see examples A.2 and A3, Appendix A).
The fact that, the ratio between the electricity generated and FGD synthetic gypsum cannot be
varied indicates that the pure physical allocation cannot be applied. ISO 14049:2000, Section
7.3.2, provides a similar example of bitumen production system as a typical case study where
pure physical allocation cannot be applied (see example A.4, Appendix A).
Furthermore, the LCA team analyzed the system to determine if the economic allocation can be
applied (ISO step 3). As per economic allocation rules, the total environmental burden of the
coal-fired power generation process is "shared" between the product (electricity) and co-product
(FGD synthetic gypsum) according to total proceeds of the multi-functional process. The
proceeds are based on “prices” per unit of product and co-products.
Three major difficulties are identified below which made the application of economic allocation
uncertain:
(1) Because this was not an LCA study of US coal-fired power plants it was not possible to
get access to total proceeds and prices per unit of electricity generated and FGD synthetic
gypsum (FOB –free on board prices for product and co-product are unknown);
(2) Price fluctuations is another issue which add to the argument and it would have required
to look at the minimum three-year averages of proceeds and prices [23];
(3) FGD synthetic gypsum is not a pure output functional flow (co-product); US Statistics
show that FGD material generated at the coal-fired power plants is not fully utilized and a

Athena Institute
Life Cycle Assessment of ½” Regular and 5/8” Type X Gypsum Wallboard Products 21
significant portion of it is regarded as waste. As per EPA 2008 report, 12 million short tons of
FGD gypsum were generated in 2005 in US and 9.27 million short tons of FGD gypsum
were used overall by all industries. Over 8 million short tons of FGD gypsum were used as a
substitute for raw gypsum in wallboard manufacturing [18]. Of the total synthetic gypsum
sold and used in the US in 2009, 81% was used for wallboard production, 7% was used in
cement and concrete manufacture, 5% for structural fills or embankments, 3% in agriculture,
and the remaining amount for other miscellaneous applications [11]. Still, 50% of all
synthetic gypsum produced in 2009 was neither sold, nor used, and in most cases was
landfilled [14]. In such cases, ISO recommends that it is necessary to identify the ratio
between co-products and waste since the inputs and outputs shall be allocated to the co-
products part only [2]. This can only be conducted if you have access to US coal power
plant specific data and information – which is not the case (see point 1).
System expansion was deemed the most appropriate approach to solve the multi-functionality of
coal-fired power generation process not just because ISO recommends this approach as step 1,
but also because neither the correct physical nor economic allocation factor could be effectively
applied.
Figure 5 describes the model for system expansion applied for the FGD synthetic gypsum co-
product generated at coal-fired power plants. Based on the US statistics, the supply for FGD
gypsum is already higher than the demand, which means that FGD is not fully used. For that
reason, the gypsum wallboard production system (B) is debited for intermittent treatment of
FGD (de-watering, transportation) and credited for avoided landfilling of FGD (as per “system
expansion” rules [16], [17], [22]) and the coal-fired power generation process (A) is debited for
FGD landfilling.
Environmental burden of Product A (Electricity, coal) = Process A + Process W
Environmental burden of Product B (GWB products) = Process B + Process I - Process W
It should be noted that the GWB production system is modeled based on the 2008 US electricity
grid mix and electricity generated from coal-fired power plants is a major contributor of the US
electricity grid (see Table 2). This means, that GWB system is directly “credited” for the FGD

Athena Institute
Life Cycle Assessment of ½” Regular and 5/8” Type X Gypsum Wallboard Products 22
synthetic gypsum diverted from landfilling and “in-directly” debited for the FGD which ends-up to
landfill through the use of Product A (electricity, coal-fired power plants).
Figure 5. Model for describing system expansion approach for the FGD synthetic gypsum, co-products generated at coal fired power plants
Figure 6 describes the model for system expansion applied for the post-consumer gypsum
material (GWB on-site construction off-cuts). Post consumer GWB material collected from
construction/demolition sites isn’t always fully utilized and part of it is regarded as waste. For
that reason, the GWB production system (B) is debited for intermittent treatment (collection,
transportation and plant specific processing) of the post-consumer gypsum input and credited
for the avoided waste disposal and transportation to landfill of the post consumer gypsum waste
according to the LCA system expansion rules [16], [17], [22].

Athena Institute
Life Cycle Assessment of ½” Regular and 5/8” Type X Gypsum Wallboard Products 23
Figure 6. Model for describing system expansion for the utilization of post-consumer gypsum material
Furthermore, the application of FGD synthetic gypsum and post consumer gypsum material in
the manufacturing process is beneficial for the gypsum industry as it reduces the dependency
on abiotic resources (natural gypsum ore).
Similarly, the closed-loop recycling of internal gypsum waste contributes to a sustainable GWB
manufacturing process as it also reduces the need for primary gypsum material and thereby,
reduces the overall environmental load of the GWB products.

Athena Institute
Life Cycle Assessment of ½” Regular and 5/8” Type X Gypsum Wallboard Products 24
3.3 Data Quality 3.3.1 Primary and secondary data sources and modeling software
The study encompasses three inter-connected primary processes producing natural or crude
gypsum ore, gypsum facing and backing papers and the two selected GWB products: ½”
Regular and 5/8” Type X.
Primary LCI data were collected for each of these three processes: quarried/mined gypsum ore,
gypsum papers production and GWB production for the reference year 2010.
The study LCI data collected from the GA member companies was done with the expressed
intent of attaining an acceptable representation of the US industry average technology mix. The
GA’s LCA Working Task Group identified a representative sample of GWB plants within its
membership on the basis of technical attributes, production scale and geographic location to
arrive at a representative weighted average profile. Described below is the GA’s well-defined
platform for plant selection for inclusion in the study sample.
In 2010, about 60 GWB manufacturing plants were operating in the US.
Of these, 17 plants were selected to adequately represent:
- GA’s membership production volume (including having at least one plant from each GA
member company participate in the study);
- the scale of plant operations including a mix of small, medium and large operations;
- the geographical spread of the participating facilities included having at least one plant
in each US census region included in the study.
To approximate the gypsum source ratio, a mix of plants processing either natural
(crude) gypsum rock or flue gas desulfurized (FGD) synthetically derived gypsum or a
blend of both these two major inputs was selected.
A mix of plants using locally derived gypsum ore (adjacent quarry operation) versus
imported natural gypsum ore transported by various modes and distances were included

Athena Institute
Life Cycle Assessment of ½” Regular and 5/8” Type X Gypsum Wallboard Products 25
in the sample (crude gypsum ore imports include Canada or Mexico depending on plant
location).
A mix of plants that are dependent on local versus more distant sources of FGD
synthetic gypsum were also included in the sample.
For GWB manufacturing process, 17 LCI data questionnaires were completed to provide a
GWB representative production weighted sample. For the gypsum paper manufacturing, three
plants provided primary LCI data. Six quarries and one gypsum ore underground mining
operation provided primary data on raw gypsum ore production for the reference year 2010.
Two of the quarrying operations were located in Canada with the remaining operations located
in the US.
For other ancillary or process materials, such as the production of chemical inputs, fuels and
electricity, secondary data from commercially available LCI databases were deemed acceptable
(e.g., US LCI Database, North American adjusted ecoinvent, etc.) [8], [20]. Whenever available,
cradle-to-gate material and energy input flow data were derived from the US LCI Database,
incorporated in the SimaPro v.7.3.0 LCA Software, March 2011. The study drew on these data
to model environmental impacts of fuel(s) extraction, processing and combustion, and various
transportation modes for input material and waste transportation. The US adjusted European
ecoinvent v.2.2 LCI database (“US-EI”), from May 2010, a European database that contains
over 4,000 unit processes (http://www.ecoinvent.ch/) was used to address the environmental
impact of numerous chemical inputs and ancillary materials and other relevant unit processes.
The complete cradle-to-gate LCI modeling of all intermediate and final product systems was
performed using SimaPro v 7.3.
Based on 2010 World Resource Institute (WRI) statistical data, the American, Canadian and
Mexican electricity grid mixes for the reference year 2008 were modeled using the US LCI
Database and ecoinvent upstream LCI datasets. The US electricity grid model accounts for the
generation fuel mix for 2008 and also facilitated the co-product modeling of FGD gypsum from
coal combustion and making adjustments to coal combustion solid waste flows as per the
“system expansion” approach (see Section 3.3.4).

Athena Institute
Life Cycle Assessment of ½” Regular and 5/8” Type X Gypsum Wallboard Products 26
Table 2 shows the electricity grid mixes for the US, Canada and Mexico. Table 3 below
summarizes key secondary source data for the major upstream material and energy flows.
Table 2. 2008 Electricity Grid Mixes for United States, Canada and Mexico

Athena Institute
Life Cycle Assessment of ½” Regular and 5/8” Type X Gypsum Wallboard Products 27
Table 3. Key Primary and Secondary LCI Data Sources
LCI data sets Source of LCI Database*)
Natural Gypsum System
Gate-to-gate activity data- natural gypsum extraction Primary data collected from 7 sites
Inbound/outbound transportation- natural gypsum extraction
Primary data collected from 7 sites
Explosives US adjusted ecoinvent v 2.2 LCI database Lubricating oil, hydraulic fluid, greases, engine oil and antifreeze US adjusted ecoinvent v 2.2 LCI database
US, Canada and Mexico electricity grid
US LCI Database ecoinvent v 2.2 LCI LCI datasets developed for U.S conditions US adjusted ecoinvent v 2.2 LCI database
Diesel, gasoline, propane and natural gas
US LCI Database
Rail, road and barge transportation US LCI Database
Waste treatment US adjusted ecoinvent v 2.2 LCI database
Gypsum Paper System
Gate-to gate activity data- gypsum paper production Primary data collected from 3 plants
Inbound/outbound transportation- gypsum paper production Primary data collected from 3 plants
Waste paper sorting US adjusted ecoinvent v 2.2 LCI database Starch, retention chemicals, sizing agents, polymer emulsifier, other chemicals, chemicals used for on-site water treatment.
Material Safety Data Sheet (MSDSs) provided by 3 surveyed plants; US LCI Database US adjusted ecoinvent v 2.2 LCI database
Lubricating oil, hydraulic fluid and greases US adjusted ecoinvent v 2.2 LCI database
Packaging materials US LCI Database US adjusted ecoinvent v 2.2 LCI database
US electricity grid
US LCI Database ecoinvent v 2.2 LCI LCI datasets developed for U.S conditions US adjusted ecoinvent v 2.2 LCI database
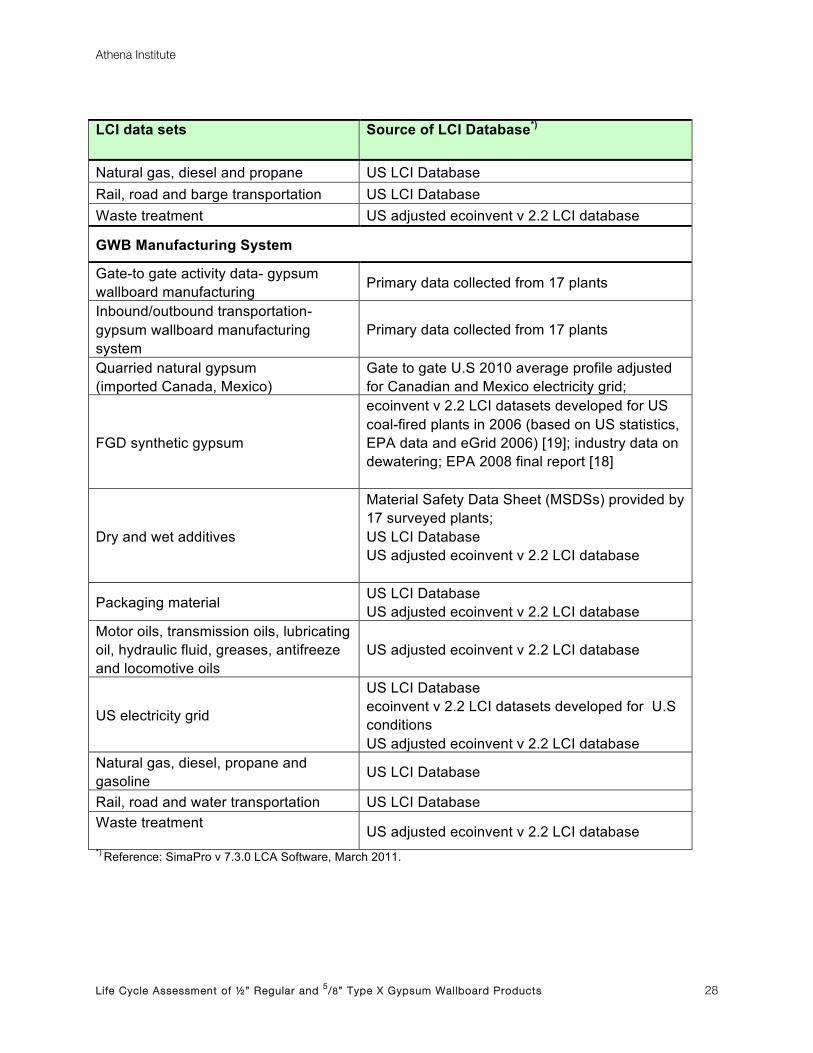
Athena Institute
Life Cycle Assessment of ½” Regular and 5/8” Type X Gypsum Wallboard Products 28
LCI data sets Source of LCI Database*)
Natural gas, diesel and propane US LCI Database Rail, road and barge transportation US LCI Database Waste treatment US adjusted ecoinvent v 2.2 LCI database
GWB Manufacturing System
Gate-to gate activity data- gypsum wallboard manufacturing Primary data collected from 17 plants
Inbound/outbound transportation- gypsum wallboard manufacturing system
Primary data collected from 17 plants
Quarried natural gypsum (imported Canada, Mexico)
Gate to gate U.S 2010 average profile adjusted for Canadian and Mexico electricity grid;
FGD synthetic gypsum
ecoinvent v 2.2 LCI datasets developed for US coal-fired plants in 2006 (based on US statistics, EPA data and eGrid 2006) [19]; industry data on dewatering; EPA 2008 final report [18]
Dry and wet additives
Material Safety Data Sheet (MSDSs) provided by 17 surveyed plants; US LCI Database US adjusted ecoinvent v 2.2 LCI database
Packaging material US LCI Database US adjusted ecoinvent v 2.2 LCI database
Motor oils, transmission oils, lubricating oil, hydraulic fluid, greases, antifreeze and locomotive oils
US adjusted ecoinvent v 2.2 LCI database
US electricity grid
US LCI Database ecoinvent v 2.2 LCI datasets developed for U.S conditions US adjusted ecoinvent v 2.2 LCI database
Natural gas, diesel, propane and gasoline US LCI Database
Rail, road and water transportation US LCI Database Waste treatment US adjusted ecoinvent v 2.2 LCI database *) Reference: SimaPro v 7.3.0 LCA Software, March 2011.

Athena Institute
Life Cycle Assessment of ½” Regular and 5/8” Type X Gypsum Wallboard Products 29
3.3.2 Primary data collection system
This section describes the data collection system (DCS) for this LCA study.
The GA study team followed the following generic DCS procedures.
Identification of the data that needs to be collected.
Planning when, where, and how data are to be collected and by whom.
Identification and treatment of data gaps.
The actual data collection (measurement, estimations as per EPA factors, expert
knowledge, etc.).
Documentation of the resulting data, together with possible sources of error, bias or
lack of knowledge.
Data review.
Averaging the data across the plants on a suitable technical format to reveal any
outliers.
Internal validation of the data collection system, the collected data and its
documentation.
Communication of the data and its documentation.
3.3.3 Precision and Completeness
Precision: the GA participating companies through measurement and calculation collected
primary data on the production of natural gypsum, gypsum paper and gypsum wallboard
products. The gate-to-gate input and output plant data was individually validated by the LCA
team for accuracy.
Completeness: All relevant, specific processes including inputs (raw materials, energy and
auxiliary materials) and outputs (emission and production volume) are considered and modeled
to represent the gypsum wallboard products. The relevant background processes are taken
from the US LCI Database and US adjusted ecoinvent v 2.2 LCI database and modeled in
SimaPro software v.7.3.0, March 2011.

Athena Institute
Life Cycle Assessment of ½” Regular and 5/8” Type X Gypsum Wallboard Products 30
3.3.4 Consistency and Reproducibility
Consistency: To ensure consistency, the LCI modeling of the seven quarries/mines, three
gypsum paper and 17 gypsum wallboard scenarios applied the same modeling structure across
the respective product system, which consists of input raw and ancillary material, energy flows,
water resource inputs, product and co-products outputs, emissions to air, water, and soil and
waste disposal, and the same background LCI data from the new GA SimaPro LCI database
were used. Cross-checks concerning the plausibility of mass and energy flows were
continuously conducted. Each input material and energy flow as well as output flow was
checked and rechecked using a mass and energy balance approach to maintain a high level of
consistency.
Reproducibility: Internal reproducibility is possible since the data and the models are stored
and available in a database (GA SimaPro LCI database, 2011). A high level of transparency is
provided throughout the report as the weighted average LCI profiles are presented for both the
reference flows and products of interest (see Section 4). The provision of more detailed data to
allow full external reproducibility was not possible due to reasons of confidentiality.
3.3.5 Representativeness
The representativeness of the data is summarized as follows.
Time related coverage of the primary collected data: 2010.
Secondarydata: the most appropriate LCI datasets were used as found in the US LCI
Database and US adjusted ecoinvent v.2.2 database, 2011.
Geographical coverage: the geographical coverage was primarily the US with the
exception of the imported natural gypsum from Canada and Mexico (North America).
Technological coverage: typical or average.
The representativeness of the data has been deemed “good to fair” as the best available data
are used and these data adequately reflect North American geographic representativeness and
prevailing technologies.

Athena Institute
Life Cycle Assessment of ½” Regular and 5/8” Type X Gypsum Wallboard Products 31
3.4 Life Cycle Impact Assessment Indicators
Life cycle impact assessment is the phase in which the set of results of the inventory analysis –
mainly the inventory flow table – is further processed and characterized in terms of
environmental impacts. According to LCA-based ISO 14040/44, the mandatory elements of the
life cycle impact assessment (LCIA) include:
• selection of impact categories, category indicators, and characterization models;
• assignment of LCI results (classification) to the impact categories; and
• calculation of category indicator results (characterization).
It should be noted that while LCI enjoys a fairly consistent methodology, the life cycle impact
assessment phase is very much a “work in progress” and there is no overall agreement on
which LCIA categories should be included in an LCA or a single accepted methodology for
calculating all of the impact categories to be included. ISO 14044:2006, Clause 4.4.2.2.1,
states: “The selection of impact categories, category indicators and characterization models
shall be both justified and consistent with the goal and scope of the LCA”. Typically, LCIA is
completed in isolation of the LCI; that is, the LCI requests a complete mass and energy balance
for each unit process or product system under consideration, and once completed the LCI is
“sifted” (classified and characterized) through various LCIA indicator methods and categories to
determine potential impacts. When defining the impact categories, an indicator must be chosen
somewhere in the environmental mechanism. Often indicators are chosen at an intermediate
level somewhere along that mechanism (mid-point indicators). Sometimes they are chosen at
endpoint level (end-point indicators) [5].
For this study, ISO 21930:2007 “Sustainability in Building Construction – Environmental
Declaration of Building Products” [3] was used to identify and select the various impact
categories to be included in the LCIA, and the US EPA Tool for the Reduction and Assessment
of Chemical and Other Environmental Impacts (TRACI) was used as the LCIA baseline
characterization model [21]. ISO 21930 provides an internationally accepted scope for decisions
as to which LCIA categories should be supported for building sustainability metric analysis,
while the TRACI LCIA methodology provides a North American context for the actual measures

Athena Institute
Life Cycle Assessment of ½” Regular and 5/8” Type X Gypsum Wallboard Products 32
to be supported. ISO 21930 stipulates a number of mid-point LCIA characterization measures to
be supported and while not opposing end-point measures, discourages their use until they are
more internationally accepted. The measures advocated by ISO 21930 include the following:
1. Use of resources and energy
Depletion of non-renewable material resources
Use of renewable resource
Depletion of non-renewable primary energy
Use of renewable primary energy
2. Climate change
3. Depletion of the stratospheric ozone layer
4. Formation of photochemical oxidants
5. Acidification of land and water sources
6. Eutrophication
Optional end-point LCIA measures listed in ISO 21930 include human toxicity and eco-toxicity;
however, uncertainty increases, often exponentially, with movement from mid-point to end-point
measures and, therefore, these end-point measures have been excluded from this study.
Absent from the TRACI list is any impact category dealing with solid waste. While TRACI
supports fossil fuel depletion (on a global scale), it does not readily report primary energy use –
primary energy use is not an impact category, but rather an intermediate flow indicator between
the environment and the productive anthropogenic technosphere. As a result, for the purposes
of this study, water use and total primary energy use are tabulated and summarized with the
other impact category indicators directly from the LCI results. Further, the abiotic resource
depletion (excluding energy) impact category is based on the CML2001 LCIA method5 [9] and
the cumulative energy demand (CED) LCIA method (ecoinvent 2001 [8]) is adopted to organize
and report primary resource and energy use. Total primary energy is the sum of all energy
sources drawn directly from the earth, such as natural gas, oil, coal, biomass, and hydropower
energy. The total primary energy can be further broken down into categories. For this reason, a
measure of total primary energy derived from LCI flows broken down into renewable and non-
renewable and feedstock energy sources is also included. As per North American convention,
5A problem-oriented Life Cycle Assessment method developed by the Institute of Environmental Sciences of the University of Leiden (CML), The Netherlands.

Athena Institute
Life Cycle Assessment of ½” Regular and 5/8” Type X Gypsum Wallboard Products 33
higher heating value (HHV) of primary energy carriers is used to calculate the primary energy
values used in the study. Higher heating value, gross heating value, or total heating value
includes the latent heat of vaporization and is determined when water vapor in the fuel
combustion products is condensed. Conversely, lower heating value or net heating value does
not include the latent heat of vaporization. In the US, when the heating value of a fuel is
specified without designating higher or lower, it generally means the higher heating value.
With respect to the other LCIA measures, the following (see list below) TRACI and CML impact
categories (IC) and characterization basis were used in this study. A characterization factor is a
factor derived from a characterization model, which is applied to convert an assigned life cycle
inventory analysis result to the common unit of the category indicator. The common unit allows
calculation of the category indicator result.
a. Global warming potential (IC) – TRACI uses global warming potentials characterization
factors (CF), a midpoint metric proposed by the International Panel on Climate Change
(IPCC, 2007), for the calculation of the potency of greenhouse gases relative to that of
carbon dioxide (CO2). The 100-year time horizons recommended by the IPCC and used
internationally for policy making and reporting are adopted within TRACI. The
methodology and science behind the global warming potential (GWP) calculation can be
considered one of the most accepted LCIA categories. GWP100 is expressed on
equivalency basis relative to CO2, that is, equivalent CO2 mass basis.
b. Acidification potential (IC) – As per TRACI, acidification comprises processes that
increase the acidity (hydrogen ion concentration, [H+]) of water and soil systems.
Acidification is a more regional rather than global impact affecting fresh water and forests
as well as human health when high concentrations of sulfur dioxide (SO2) are attained.
The acidification potential (CF) of an air emission is calculated on the basis of the
number of H+ ions which can be produced and therefore is expressed as potential H+
equivalents on a mass basis.
c. Respiratory effects (IC)– The midpoint level selected by TRACI was used based on
exposure to elevated particulate matter less than 2.5 micrometers in diameter (PM 2.5).
Particulate matter is the term for particles found in the air, including dust, dirt, soot,
smoke, and liquid droplets (i.e. filterable particulates). Emissions of SO2 and NOx lead to

Athena Institute
Life Cycle Assessment of ½” Regular and 5/8” Type X Gypsum Wallboard Products 34
formation of the secondary particulates sulfate and nitrate (i.e., condensable
particulates).Particles can be suspended in the air for long periods of time. Some
particles are large or dark enough to be seen as soot or smoke. Others are so small that
individually they can only be detected with an electron microscope. Many man-made and
natural sources emit PM directly or emit other pollutants that react in the atmosphere to
form PM. These solid and liquid particles come in a wide range of sizes. Particles less
than 10 micrometers in diameter (PM10) pose a health concern because they can be
inhaled into and accumulate in the respiratory system. Particles less than 2.5
micrometers in diameter (PM2.5) are referred to as "fine" particles and are believed to
pose the greatest health risks. Because of their small size (approximately 1/30th the
average width of a human hair), fine particles can lodge deep within the lungs.
d. Eutrophication potential (IC) – In TRACI, eutrophication is defined as the fertilization of
surface waters by nutrients that were previously scarce. This measure encompasses the
release of mineral salts and their nutrient enrichment effects on waters – typically made
up of nitrogen (N) and phosphorous (P) compounds and organic matter flowing into
waterways. The result is expressed on an equivalent mass of nitrogen basis. The
characterization factors estimate the eutrophication potential of a release of chemicals
containing N or P to air or water, per kilogram of chemical released, relative to 1 kg N
discharged directly to surface freshwater.
e. Ozone depletion potential (IC) – Stratospheric ozone depletion is the reduction of the
protective ozone within the stratosphere caused by emissions of ozone-depleting
substances. International consensus exists on the use of ozone depletion potentials
(CF), a metric proposed by the World Meteorological Organization (WMO) for calculating
the relative importance of chlorofluorocarbons (CFCs), hydrochlorofluorocarbons
(HFCs), and halons expected to contribute significantly to the breakdown of the ozone
layer. TRACI uses the ozone depletion potentials published in the Handbook for the
International Treaties for the Protection of the Ozone Layer (UNEP-SETAC 2000), where
chemicals are characterized relative to trichlorofluoromethane (CFC-11).
f. Photochemical smog potential (IC) – Photochemical ozone formation potential (CF) –
Under certain climatic conditions, air emissions from industry and transportation can be
trapped at ground level where, in the presence of sunlight, they produce photochemical
smog, a symptom of photochemical ozone creation potential (POCP). While ozone is not
Athena Institute
Life Cycle Assessment of ½” Regular and 5/8” Type X Gypsum Wallboard Products 35
emitted directly, it is a product of interactions of volatile organic compounds (VOCs) and
nitrogen oxides (NOx). The “smog” indicator is expressed on a mass of equivalent NOx.
g. Total primary energy– Total primary energy is the sum of all energy sources that are
drawn directly from the earth, such as natural gas, oil, coal, biomass or hydropower
energy. The total primary energy contains further categories, namely non-renewable and
renewable energy, and fuel and feedstock energy. Non-renewable energy includes all
fossil and mineral primary energy sources, such as natural gas, oil, coal and nuclear
energy. Renewable energy includes all other primary energy sources, such as
hydropower and biomass. Feedstock energy is that part of the primary energy entering
the system which is not consumed and/or is available as fuel energy and for use outside
the system boundary. Total primary energy is expressed in mega joules (MJ).
h. Abiotic resource depletion potential (IC)– As per CML 2001 method, the abiotic
depletion potential (ADP) factors for characterizing abiotic resources are based on
ultimate reserves and extraction rates. According to Guinee & Heijungs (1995) a method
based on ultimate reserves and rates of extraction is the best option, as these
parameters best indicate the seriousness of resource depletion. As the notion of
economic reserves involves a variety of economic considerations not directly related to
the environmental problem of resource depletion, the measure of ultimate reserves
appears to be a more appropriate yardstick. The indicator is expressed in kg of the
reference resource antimony (Sb). For the full list of the natural resources included,
please see the referenced link to Leiden University’s Guide on Environmental Life Cycle
Assessment. Fossil fuels are excluded because they were reported separately within
total primary energy (see below).
i. Water use– summarizes the cradle-to-gate LCI water usage flows, and is expressed in
kg.
In North America, the impact method and characterization factors for land use are still in
development. Although it can have a significant bearing on the results of an LCA, most North
American LCI data do not support measures of land use (e.g., US LCI Database) nor is there a
platform for collecting or characterizing this inventory flow; therefore land use has been
excluded from this study. Table 2 summarizes the selected impact categories and intermediate

Athena Institute
Life Cycle Assessment of ½” Regular and 5/8” Type X Gypsum Wallboard Products 36
indicators, their unit equivalence basis (or reporting basis), source of the characterization
method and geographic specificity supported and used in the study.
Table 4. Selected LCIA & LCI Flow Indicators
LCIA and LCI flow category Unit equivalence
basis (indicator result)
Source of the characterization
method
Level of site specificity selected
Global warming kg CO2 – equivalents (eq) TRACI Global
Acidification kg H+-eq TRACI North America Respiratory effects kg PM2.5-eq TRACI North America Eutrophication kg N water-eq TRACI North America Ozone depletion kg CFC-11-eq TRACI Global Photochemical smog kg NOx-eq TRACI North America Total primary energy*) MJ
Non-renewable, fossil† MJ Non-renewable, nuclear† MJ
Renewable (solar, wind, hydro, geothermal)† MJ
Renewable (biomass)† MJ Feedstock, fossil† MJ
Feedstock, biomass† MJ
CED 2001 adapted Global
Abiotic resource depletion, excluding energy kg Sb-eq CML 2001 Global
Water use*) kg Sum of LCI flows North America † Sub-set of primary energy. *) LCI flow category

Athena Institute
Life Cycle Assessment of ½” Regular and 5/8” Type X Gypsum Wallboard Products 37
4 LCI Flow Reporting for Key System Processes
This section first presents an overview of the input material and energy flows and outputs (on a
weighted average basis) for the two primary upstream processes (natural gypsum quarrying and
gypsum paper production) for the reference year 2010. It then presents the ½-inch Regular and 5/8-inch Type X GWB product formulations and input material and energy flows and outputs (on
a weighted average basis) for the gypsum wallboard manufacturing process for the 2010
reference year. To respect the confidentiality agreement with the GA participating plants, input
and output data are rolled up to the level that assures confidentially of each individual plant and
provides optimal data transparency for the interested parties.
4.1 Gypsum Quarrying Overview Natural or crude gypsum is a relatively soft, rock-like mineral that was deposited in ancient
seas. Chemically, gypsum is calcium sulfate dihydrate (CaSO4. 2H2O). Most of the gypsum
quarries operating in North America are vertically integrated with GWB manufacturing
companies and board plants are often located in close proximity to gypsum quarry operations.
However, the US is also the largest importer of crude gypsum in the world, most of which comes
from Canada (70% of imports), serving the US East coast and Mexico (25% of all imports),
serving the US West coast [11].
Gypsum rock is open pit quarried or mined underground, generally by drilling and blasting, then
moved to a primary crusher on the quarry/mine site. In North America, high quality gypsum ore
is typically open-pit quarried as opposed to mined. The quarry process begins with the removal
of overburden (earth) over the gypsum deposit. The gypsum rock is then drilled and blasted
loose where it is then extracted and transported to the primary crusher. At the primary crusher
the gypsum rock is reduced to approximately 2” (50mm) to 5” (125mm) or less in size. From
here the crushed rock can be sent to the board plant (trucked or belt conveyed) for secondary
crushing. It may be also be transported by ship, rail or truck to board manufacturing plants
farther away.
For the purposes of this study, six gypsum quarries and one mine site were surveyed for the
reference year 2010 and provided their material and energy inputs and related process

Athena Institute
Life Cycle Assessment of ½” Regular and 5/8” Type X Gypsum Wallboard Products 38
emissions. According to the 2009 Minerals Yearbook [11] there were a total 48 gypsum
extraction sites operating in the US in 2009 – the study sample represents about 15% of these
operations.
The gate-to-gate system boundaries for quarrying and mining process included the following
activities:
• Drilling
• Blasting
• Excavating
• Pit loading
• Primary crushing
• Screening
• Conveying
• Truck hauling
• Water spraying
• Benefication Operations
• Surface Milling
• Road Grading
• Stock piling
• Scaling (scrape loose rock from ceiling and walls)
• Drilling/installing roof bolts to stabilize roofing system
Table 5 presents the material, energy and process (non-combustion) related emissions per
short ton (2000 lb) of natural gypsum rock on a weighted average basis. Additional information
on inbound and outbound transportation was collected and is reported in Table 6. The
participating sites also reported additional information on annual unpaved road transport to
better estimate particulate emissions associated with the system process.
A three-year (2008 to 2010) weighted average of gypsum production from each participating site
was used to estimate the weighted average factors for the population sample and reference
year (2010). The three-year production average factors were used to smooth out any major
production changes at individual production sites and to better protect confidential company
information. Co-product production for this process amounted to less than 4% of total outputs;

Athena Institute
Life Cycle Assessment of ½” Regular and 5/8” Type X Gypsum Wallboard Products 39
where necessary, mass allocation was used to partition flows between the primary product and
co-products. All reported flows are for the reference year 2010.
The source of natural or crude gypsum rock identified in the GWB manufacturing profile
included the US, Canada and Mexico. The weighted average profile for the six quarries and
one mine site was adjusted to reflect the national delivered electricity mix for each of these
sources, which resulted in three LCI profiles – Natural Gypsum Rock (domestic US), Natural
Gypsum Rock (Canada) and Natural Gypsum Rock (Mexico). All three natural gypsum rock
reference profiles were drawn upon when constructing the weighted average profile for the two
GWB products of interest.

Athena Institute
Life Cycle Assessment of ½” Regular and 5/8” Type X Gypsum Wallboard Products 40
Table 5. Material, Energy and Process Related Emissions per Short Ton of Natural Gypsum Input/Output Flows Units Quantity
1. Material Inputs
Explosives Pounds 0.547 Lubricants Pounds 0.035 Hydraulic fluid Pounds 0.033 Greases Pounds 0.007 Engine Oil Pounds 0.019 Antifreeze Pounds 0.007 2. Energy Inputs
Diesel fuel oil Gallons 0.404 Gasoline Gallons 0.008 Propane Pound 0.00059 Purchased Electricity kWh 1.210 Natural Gas MMBtu 0.059 3. Water Consumption
Fresh water used for water spraying and benefication
Gallons 36
Recycled water used for water spraying Gallons 34 4. Product and Co-product Outputs
Quarried gypsum tons (short) 1.0 Overburden tons (short) 1.94 Other solid rock sold to other industries tons (short) 0.033 5. Process (non-combustion) Emissions to air
Total Particulate Matter (TPM) Pounds 0.277
PM10 (PM<10 microns, but > 2.5 microns)
Pounds 0.109
PM2.5 (PM< 2.5 microns) Pounds 0.057
Mercury Pounds 4.869E-06 On-site air emissions from unpaved-road transportation
Total Particulate Matter (TPM)
Pounds 0.288
PM10 (PM<10 microns, but > 2.5 microns)
Pounds 0.091
PM2.5 (PM< 2.5 microns) Pounds 0.013

Athena Institute
Life Cycle Assessment of ½” Regular and 5/8” Type X Gypsum Wallboard Products 41
Input/Output Flows Units Quantity
6. Emissions to water (water effluent)
Total suspended solids (TSS)- storm water discharge
Pounds 0.002
Total suspended solids (TSS)- ground water
Pounds 2.3E-06
Oil and Grease, hexane- ground water Pounds 1.8E-06 Chloride- ground water Pounds 1.1E-04 Sulfate, total (as SO4)- ground water Pounds 5.3E-04 7. Solid Waste
Solid waste Pounds 0.075 Waste Oil Pounds 0.0032 Table 6. Inbound and outbound transportation data- Quarry System In-bound transportation (one way)
Road (in miles)
Barge (in miles)
Explosives 398
Lubricants 205
Hydraulic fluid 195
Greases 205
Engine Oil 960
Antifreeze 960
Out-bound transportation (one-way)
Road (in miles)
Barge (in miles)
Solid ore/rock sold to other industries 2 646
Solid waste 25
Waste oil for disposal 280

Athena Institute
Life Cycle Assessment of ½” Regular and 5/8” Type X Gypsum Wallboard Products 42
4.1.1 Other Sources of Gypsum
In addition to quarried/mined natural gypsum production, synthetic gypsum is generated as a
co-product of various industrial processes and is used in the manufacture of GWB. The primary
source of synthetic gypsum used in GWB manufacture is flue gas desulfurization (FGD) from
coal-fired electric power plants. Most coal-burning power plants in the United States are
required by the US Environmental Protection Agency to install sulfur dioxide scrubbing systems.
This creates a significant source of gypsum, at a lower price than the cost of its quarried or
mined counterpart, which has led to the construction of wallboard production facilities near or
adjacent to coal-fired power plants. Of the total synthetic gypsum sold and used in the US in
2009, 81% was used for wallboard production, 7% was used in cement and concrete
manufacture, 5% for structural fills or embankments, 3% for agricultural use, and the remaining
amount for other miscellaneous applications [11]. Still, 50% of all synthetic gypsum produced in
2009 was neither sold, nor used, and in most cases was landfilled [14].The use of synthetic
gypsum from flue gas desulfurization (FGD) has increased and will likely continue to do so as
more coal-fired electric power plants convert their desulfurization processes to produce
marketable gypsum.
In the US, the most widely used flue gas SO2 abatement method is non-regenerative, forced
oxidation wet scrubbers using calcium based sorbents producing calcium-sulfur compounds.
The use of a widely available and inexpensive sorbent (limestone), production of a usable co-
product (gypsum, calcium sulfate dehydrate, CaSO4.2H2O), reliability, availability, and most
importantly, the efficiency achievements that can be as high as 99% are the incentives behind
the popularity of this technology especially at large-scale utilities. Since the flue gas contains
sulfur as SO2, the initial reaction outcome is calcium sulfite hemi-hydrate. To generate the more
inert calcium sulfate dihydrate, the calcium sulfite must be oxidized. This is typically done in the
scrubber system with a process called ‘in situ forced oxidation’. In this process, excess air is
added to the system to oxidize the calcium sulfite to calcium sulfate (gypsum). Large gypsum
crystals are then separated by means of a hydrocyclone and collected in a separate vessel. In
the last stage, the gypsum crystal suspension is filtered or centrifuged, and the gypsum cake is
washed with clean water to remove water-soluble substances – especially chlorides, sodium
and magnesium ions. Dewatering to less than 10% moisture is achieved by means of vacuum
filter beds or centrifuges. It is this last step, dewatering, that differentiates the gypsum from a

Athena Institute
Life Cycle Assessment of ½” Regular and 5/8” Type X Gypsum Wallboard Products 43
potential waste to a saleable co-product suitable for use in gypsum board manufacturing [15].
Utilities will sometimes employ dewatering to further reduce the mass of the co-product waste to
reduce landfill transportation and disposal costs.
For the purposes of this study, a “system expansion” approach was employed to model and
account for the use of FGD synthetic gypsum in the US GWB industry (see Section 3.2.4).
4.2 Gypsum Paper Manufacturing Overview
Gypsum wallboard is often described as a sandwich, with gypsum in its core and paper as its
facings (known as facing and backing gypsum paper). The raw materials used for gypsum
paper facings are all from recycled sources, either post industrial or post consumer newspaper,
Kraft clippings, mixed waste papers and old corrugated container (OCC).
The manufacture of gypsum facing papers is similar to other paper making processes and starts
with the recycled paper furnish being fed into a pulper, a large blender that disintegrates and
dissolves the old paper into a pulp – a slurry of paper fibers. The paper slurry is also cleaned of
various contaminants (e.g., bailing wire, staples, and glue) before it is fed into the paper-making
machine. Two types of paper making equipment – rotating cylinders or a Fourdrinier flat wire
machine, may be used to produce gypsum paper. A cylinder machine rotates a large drum
through the pulp slurry vat. A wide felt belt passes over the top of the turning drum cylinder.
The cylinder pulls the pulp up and presses it against the bottom felt, where it sticks to form a
single ply of paper – depending on the machine and slurry composition it can take as few as
three to up to nine cylinder made plies pressed together to make a continuous sheet of gypsum
board paper. The characteristics of the pulp entering the vats determine whether the system
produces cream stock, often called “ivory”, used for the face of the gypsum wallboard or gray
stock, which makes the backside paper of gypsum wallboard. The gray stock is derived
exclusively from OCC, while the cream or ivory uses a combination of all recycled inputs for its
pulp plies. Instead of a set of cylinder machines, the Fourdrinier uses two machines to make a
two-ply paper with the same characteristics as the multi-ply cylinder made paper. The pulp
slurry is systematically fed onto a continuous running wire screen (the Fourdrinier). As the
screen moves forward, water drains from the pulp through the screen to create paper. One
Fourdrinier machine makes the surface (top) ply, which may be cream or gray stock depending
Athena Institute
Life Cycle Assessment of ½” Regular and 5/8” Type X Gypsum Wallboard Products 44
on the pulp mixture and the desired paper type. The second machine produces a gray (bottom)
ply.
From this point, both systems operate in the same way. In the press section, the paper plies
are pressed together to squeeze out excess water. Next the paper enters a series of high-
temperature dryers where any remaining water is removed. The dry paper is then sent to a
calendar stack, where different chemicals or treatments are applied (e.g., retention chemicals
and sizing agents). The paper is then gathered on a roll, trimmed and packaged for shipment.
Overall, the gate-to-gate system boundaries for gypsum paper manufacturing process included
the following activities:
• Pulper
• Agitator
• Cleaning
• High density cleaning
• Primary coarse screening
• Secondary screening
• Thickening
• Digester
• Storage tank
• Refining
• Blending
• Paper machining
• Drying
• Pressing
• Rewinding
• Cutting
• Wrapping
• Shipping
• Overhead operations
Three gypsum paper plants participated in this study and provided material and energy inputs
and process related emission flows for the reference year 2010 (Table 7). They also provided

Athena Institute
Life Cycle Assessment of ½” Regular and 5/8” Type X Gypsum Wallboard Products 45
annual production outputs and transportation mode and distances for all process inputs and
outputs (Table 8).
The collection, sorting and bailing of recycled paper inputs was included, based on secondary
sourced LCI data, and primary data were used for inbound transportation of recycled paper.
Both cylinder and Fourdrinier production methods were represented in the study sample and all
three plants produced both ivory (2, 3, 6 and 9-base layers) and gray stock gypsum papers,
made 100% of OCC (2, 3, 6 and 9-base layers).
All three gypsum paper plants provided Material Safety Data Sheets (MSDSs) for all input
chemicals. Due to confidentiality agreements a rolled-up value is presented for the main types
of chemicals used, such as sizing agents, retention chemicals, polymer emulsifier, dyes,
defoamer and water treatment chemicals. All chemicals provided by plants were individually
modeled as per MSDS ingredients and were followed back to nature using adjusted secondary
LCI data sources for chemical production adjusted to US conditions.
The reference flow for the cradle-to-gate gypsum paper process was one thousand (1,000)
square feet of paper (MSF). On average, cream or ivory paper is slightly heavier (44.1 lbs/MSF)
than gray backing paper (41.5 lbs./MSF).
The weighted average LCI profile of 1 MSF facing and backing gypsum paper was calculated
based on the total input and output flows and the annual production for 2010 at the plant level.
The LCI modeling did account for the variation in the type of recycled paper input and their
amounts used in the production of ivory and gray stock gypsum papers (see Table 7). The
weighted average profile across the three plants was again based on a three-year average
production level from 2008 to 2010; however, all recorded flow data was for the 2010 reference
year. With the exception of a “Low NOx burner”, the participating plants reported no other use
of environmental abatement pollution equipment.
Table 7 presents the weighted average technosphere flows, process (non-combustion) related
emissions and outputs for the production of one thousand square feet of facing and backing
gypsum paper. The major material input in the production of gypsum paper was OCC, followed
by mixed waste papers and Kraft clippings. Relative to the paper inputs, the large assortment of

Athena Institute
Life Cycle Assessment of ½” Regular and 5/8” Type X Gypsum Wallboard Products 46
chemicals represented less than 1% of the total mass of material inputs.
Electricity and natural gas were the major energy types used in the production of gypsum
papers – a portion of the electricity used is produced on-site in natural gas boilers (equipped
with low NOx burners) in tandem with steam driven turbines. The other portion of the low-
pressure steam was used to dry paper. As per confidentiality agreements, the breakdown of
natural gas consumption for electricity and heat can’t be presented but this does not influence
the project results in any form. Paper production involves considerable water use with
evaporative losses; however, about a quarter of this water is recycled within the process.

Athena Institute
Life Cycle Assessment of ½” Regular and 5/8” Type X Gypsum Wallboard Products 47
Table 7. Material, Energy and Process Related Emissions per MSF of Gypsum Paper Input/Output Flows Units 1 MSF –
Facing gypsum paper
1 MSF – Backing
gypsum paper 1. Material Inputs
Old Corrugated Container (OCC) Pounds 25.6 46.3
Kraft clippings Pounds 6.3
Mixed waste papers/ flyleaves & signature/ white news blank, magazine blank, coated fly
Pounds 17.4
Starch Pounds 4.31E-03 4.24E-03
Retention chemicals (Flocculant/Coagulant)
Pounds 8.66E-02 8.38E-02
Sizing agents Pounds 2.51E-01 2.29E-01
Polymer emulsifier Pounds 1.08E-02 1.08E-02
Other chemicals (Defoamer/Dyes/Fungicide)
Pounds 1.32E-02 1.30E-02
Chemicals used for on-site water treatment (P & N based)
Pounds 2.67E-02 2.42E-02
Packaging materials Pounds 1.05E-01 9.57E-02
Lubricants Pounds 4.04E-03 3.71E-03
Hydraulic fluid Pounds 1.55E-04 1.55E-04
Greases Pounds 1.60E-04 1.57E-04
2. Energy Inputs
Total electricity (both purchased and on-site co-generated)
kWh 13.84 12.84
Total natural gas (excluding electricity production)
Cubic Feet 122.80 117.32
Diesel fuel oil Gallons 1.61E-03 1.43E-03
Propane Pounds 1.37E-02 1.34E-02
3. Water Consumption
Fresh well water Gallons 40.857 36.834
Fresh water from “municipality city water system”
Gallons 8.360 7.646

Athena Institute
Life Cycle Assessment of ½” Regular and 5/8” Type X Gypsum Wallboard Products 48
Input/Output Flows Units 1 MSF – Facing
gypsum paper
1 MSF – Backing
gypsum paper Recycled water re-entering the paper production system
Gallons 11.430 11.242
Water discharged Gallons 47.397 42.442
4. Product and -product Outputs
MSF 1.000 1.000 Gypsum Paper
Pounds 44.1 41.5 MSF 0.029 0.029 Co-products - downgraded & side rolls
Pounds 1.30 1.22 5. Process (non-combustion) Emissions to air
Non-Methane VOCs Pounds 3.86E-04 3.80E-04
6. Emissions to water (water effluent)
Total suspended solids (TSS) Pounds 2.81E-02 2.57E-02 Biological Oxygen Demand (BOD) Pounds 3.50E-02 3.40E-02 Lead Pounds 2.60E-07 2.59E-07 Zinc Pounds 7.15E-06 7.15E-06 Copper Pounds 2.73E-06 2.73E-06 Total Nitrogen Pounds 5.48E-05 5.39E-05 Total Phosphorus Pounds 4.50E-06 4.43E-06 7. Emissions to industrial soil (on-site)
Lead Pounds 5.84E-08 5.74E-08 8. Solid Waste
Non-hazardous solid waste Pounds 4.45E+00 4.18E+00 Hazardous solid waste Pounds 3.85E-04 3.85E-04 9. Wastewater and other liquid waste
Wastewater Gallons 2.86E+01 2.58E+01 Sludge waste Pounds 1.99E+00 1.76E+00 Solvent mixture waste Gallons 3.40E-05 3.40E-05
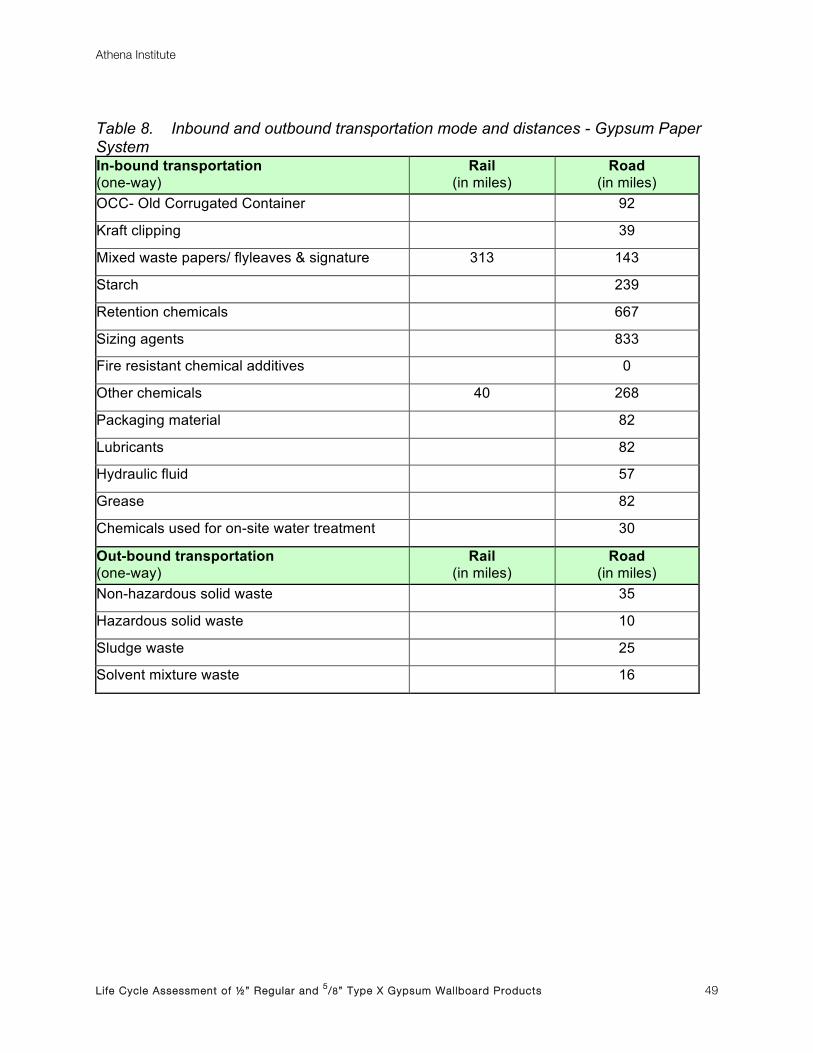
Athena Institute
Life Cycle Assessment of ½” Regular and 5/8” Type X Gypsum Wallboard Products 49
Table 8. Inbound and outbound transportation mode and distances - Gypsum Paper System In-bound transportation (one-way)
Rail (in miles)
Road (in miles)
OCC- Old Corrugated Container 92
Kraft clipping 39
Mixed waste papers/ flyleaves & signature 313 143
Starch 239
Retention chemicals 667
Sizing agents 833
Fire resistant chemical additives 0
Other chemicals 40 268
Packaging material 82
Lubricants 82
Hydraulic fluid 57
Grease 82
Chemicals used for on-site water treatment 30
Out-bound transportation (one-way)
Rail (in miles)
Road (in miles)
Non-hazardous solid waste 35
Hazardous solid waste 10
Sludge waste 25
Solvent mixture waste 16

Athena Institute
Life Cycle Assessment of ½” Regular and 5/8” Type X Gypsum Wallboard Products 50
4.3 Gypsum Wallboard Manufacturing Overview
Gypsum wallboard is manufactured in a two-step process. In the first step finely crushed and
ground gypsum, calcium sulfate dihydrate (CaSO4. 2H2O), is heated and partially dehydrated
(calcined) to calcium sulfate hemihydrate (CaSO4.1/2H2O), called stucco in the industry, also
popularly known as “Plaster of Paris”. A unique characteristic of stucco is that when mixed with
the proper amount of water, it forms a smooth plastic mass that can be molded to various
shapes. When hardening is complete, the mass has been chemically restored to its rock like
state – calcium sulfate dihydrate. In the second step of the manufacturing process the stucco is
mixed with a number of additives. A foaming agent and an excess amount of water is also
added to prepare a gypsum slurry which is extruded on a fast moving, board production line
between two layers of gypsum paper. The “raw” gypsum board is then allowed to fully hydrate –
calcium sulfate hemihydrate is converted back to dihydrate – before it is cut to the desired size
and before it enters a heated kiln, where at elevated temperatures excess water is driven off.
The gypsum board is then packaged and stacked, ready to be shipped.
The GWB industry produces a range of different boards in various thicknesses for different
applications. While some boards, such as Regular and Type X, are commodities produced in
large volumes, others are more specialty or proprietary products – e.g., water-resistant gypsum
board, exterior grade gypsum board and specialty faced (foil and vinyl) boards. A number of
plants also produce joint compounds used in the installation of GWB products.
Seventeen (17) US gypsum wallboard manufacturing plants provided their board formulation
data for the two products of interest and their annual technosphere material and energy inputs
and reported process emissions for their total production for the 2010 reference year. The GA
estimates that 60 GWB plants were operating in 2010. All GA member companies participated
by providing their company information to GA to support the GA plant sample selection process.
One-quarter of the industry’s plants were selected to participate and provided LCI data to the
study, underscoring the high degree of representativeness of the sample as well as the gypsum
industry’s overall support of the project. It is estimated that the study sample plants accounted
for about one-third of all GWB produced in the US in 2010.
With the exception of specific product formulations for ½” Regular and 5/8” Type X GWB, the
plants provided their LCI elementary flow data for their total production of GWB. Each plant’s

Athena Institute
Life Cycle Assessment of ½” Regular and 5/8” Type X Gypsum Wallboard Products 51
specific product formulation was modeled separately, but their energy use and process
emissions were allocated on the basis of equivalent total mass processed. The weighted
average result was estimated by horizontal averaging of each plant’s product formulation for the
2010 reference year by its production contribution to the total output for the plant sample.
The gate-to-gate system boundaries for gypsum wallboard manufacturing process included the
following activities:
• Secondary crushing
• Screening
• Gypsum furnish drying and conveying
• Calcining
• Dry and wet mixing
• Board lay-up
• Scoring and chamfering
• Board drying
• Cutting and stacking
• Packaging and bundling
• Overhead operations
The following environmental abatement pollution equipment were installed at the surveyed
plants to control particulate matter (PM) emissions:
Fabric Filter - High temperature (baghouses)
Fabric Filter- Low temperature (baghouse)
Bin Vents
Drum Filter
Dry Filter
Cartridge Filters
Precipitator
Water Sprinklers for Dust Control

Athena Institute
Life Cycle Assessment of ½” Regular and 5/8” Type X Gypsum Wallboard Products 52
Table 9 presents the weighted average formulations for the two GWB products of interest
across the 17 plants. In terms of gypsum sources, 41% was natural, 57% FGD synthetic and
2% was from post-consumer onsite construction off-cuts. Major additive differences between the
two products were noted for vermiculite, fiberglass and fire resistance chemical usage; all three
of these inputs contribute to the greater fire resistance of the Type X GWB. Water usage
differences were directly proportional to the quantity of gypsum used to satisfy the final GWB
product thickness. Both product formulations attained a final free moisture content of 3.3%
(non-chemically bound water). On average, ½” Regular and 5/8” Type X GWB have a finished
density (with 3.3% MC) of 1.57 and of 2.22 lbs. per sq. ft., respectively.
Figure 7 shows the weighted average breakdown in percentage of gypsum material by source.
Figure 7. Contribution of Gypsum Sources to total input gypsum – Percent basis

Athena Institute
Life Cycle Assessment of ½” Regular and 5/8” Type X Gypsum Wallboard Products 53
Table 9. Product Formulations per MSF of Regular and Type ”X” Gypsum Wallboard (weighted average)
Inputs Units ½” Regular gypsum wallboard
5/8” Type X gypsum wallboard
Gypsum material
Natural gypsum ore Pounds 602 858 Synthetic gypsum-FGD Pounds 852.1 1218.4 Post-consumer gypsum Pounds 27.7 41.2 Gypsum Paper Facing paper Pounds 43.3 43.1 Backing paper Pounds 41.5 41.5 Additives (both dry and wet)
Starch Pounds 7.2 7.2 Vermiculite Pounds 7.75 9.73 Fiberglass Pounds 0.7 5.5 Dispersant Pounds 4.9 5.4
Retarder Pounds 0.9 0.8 Potassium Sulfate Pounds 0.3 0.3
Dextrose Pounds 1.13 0.9 Clay, kaolin Pounds 0.00 1.27
Water Pounds 942 1312 Boric Acid Pounds 0.22 0.13
Land Plaster Pounds 2.36 1.53 Foaming agent (soap) Pounds 1.24 1.32
BM Accelerator Pounds 1.67 1.38 Ammonium Sulfate Pounds 0.11 0.01
Edge Paste Pounds 0.64 0.64 STMP Pounds 0.12 0.12
Shredded Paper Pounds 0.56 0.42
Total (wet weight) Pounds 2,318 3,248 Finished density (with 3.3% MC) Pounds 1,567 2,220
Final moisture content (MC) % 3.3% 3.3%

Athena Institute
Life Cycle Assessment of ½” Regular and 5/8” Type X Gypsum Wallboard Products 54
Table 10 summarizes the weighted average technosphere materials and allocated energy flows
and process (non-combustion) related emissions for the two products. About 30% of the natural
gypsum rock input was imported from either Canada or Mexico. On average its takes about 47
kWh and 1,820 cubic feet of natural gas to produce an MSF of ½-inch gypsum board and 67
kWh and 2,577 cubic feet of natural gas to produce an MSF of 5/8-inch gypsum board.
While the electricity is used at all production stages most of the natural gas is used during the
drying of the raw gypsum, calcining or stucco production and drying the final board product.
Process emissions to air were dominated by particulate releases. Small amounts of lead and
mercury were also reported, which was attributed to the use of FGD synthetic gypsum. A small
amount of gypsum was recycled within the plant (closed loop recycling) and some off-spec
GWB production was used for packaging and transportation related activities. For every MSF of
GWB product manufactured about 0.4% by mass of solid waste was generated. The total solid
waste consisted of 44% “non-hazardous (including packaging)” waste sent to landfill, 47%
“other” waste that was either recycled by conversion to agricultural gypsum or taken by the
mines and quarries for reclamation use, 8% miscellaneous material (paper, plastic, wood and
steel) sent to recyclers and 0.04% was categorized as “hazardous” waste (dry oil, oil filters,
batteries, lamps, etc.) sent to an incinerator.
Table 10. Material, Energy and Process Related Emissions per MSF of Gypsum Wallboard
Inputs/Outputs Units 1 MSF - ½” Regular GWB
1 MSF - 5/8” Type X GWB
1. Material Inputs
Mined/quarried natural gypsum ore (US source) Pounds 415.9 583.9
Mined/quarried natural gypsum ore (imported from Canada/Mexico) Pounds 186.3 274.0
Synthetic gypsum (FGD) Pounds 852.1 1218.4
Post-consumer gypsum Pounds 27.8 41.2
Additives (both dry and wet)
Starch Pounds 7.2 7.2
Vermiculite Pounds 7.75 9.73
Fiberglass Pounds 0.70 5.47

Athena Institute
Life Cycle Assessment of ½” Regular and 5/8” Type X Gypsum Wallboard Products 55
Inputs/Outputs Units 1 MSF - ½” Regular GWB
1 MSF - 5/8” Type X GWB
Dispersant Pounds 4.88 5.42
Retarder Pounds 0.903 0.816
Potassium Sulfate Pounds 0.342 0.255
Dextrose Pounds 1.135 0.903
Clay, kaolin Pounds 0.00 1.27
Boric Acid Pounds 0.22 0.13
Land Plaster Pounds 2.36 1.53
Foaming agent (soap) Pounds 1.24 1.32
BM Acclerator Pounds 1.67 1.38
Ammonium Sulfate Pounds 0.11 0.01
Edge Paste Pounds 0.63 0.64
STMP Pounds 0.12 0.12
Shredded Paper Pounds 0.56 0.42
Talc Pounds 3.9E-04 3.9E-04
Packaging materials Paper End tape Pounds 7.07E-01 9.96E-01
Ink (water based) Pounds 4.85E-03 6.87E-03
Ink (oil based) Pounds 3.11E-04 4.32E-04
Ink (alcohol based) Pounds 3.64E-03 5.15E-03
Shrink-wrap Pounds 4.49E-02 6.34E-02
Plastic slip sheets Pounds 4.36E-02 6.25E-02
Rail bags Pounds 6.52E-02 9.10E-02
Other Plastics Pounds 2.70E-02 3.87E-02
Cardboard Edge Protectors Pounds 2.15E-03 3.04E-03
Plastic Banding Pounds 9.27E-04 1.34E-03
Steel Banding Pounds 2.25E-03 3.27E-03
Zip tape Pounds 1.64E-02 2.34E-02
Dunnage/Bunks/Sleutters (DBS) Pounds 2.52E+01 3.55E+01

Athena Institute
Life Cycle Assessment of ½” Regular and 5/8” Type X Gypsum Wallboard Products 56
Inputs/Outputs Units 1 MSF - ½” Regular GWB
1 MSF - 5/8” Type X GWB
Adhesive for DBS Pounds 4.12E-04 5.89E-04
Consumables
Motor Oils Pounds 1.92E-03 2.63E-03
Gear Oil (Transmission) Pounds 2.60E-03 3.57E-03
Lubricants Pounds 5.59E-03 7.91E-03
Hydraulic Fluid Pounds 7.31E-05 1.03E-04
Greases Pounds 2.16E-04 2.80E-04
Antifreeze Pounds 1.27E-03 1.80E-03
Locomotive Oil Pounds 2.68E-03 3.47E-03
2. Energy Inputs
Electricity kWh 47.11 66.93 Natural gas Cubic Feet 1819.86 2576.51 Diesel fuel oil Gallons 0.0439 0.0628 Propane Pounds 9.665 13.827 Gasoline Gallons 9.665 13.827
3. Water Consumption
Water (process) Pounds 942 1312
Fresh water % 95.8%
Reclaimed water % 4.2% Fresh water used for cooling or steam production Gallons 101 142
4. Product and Co-product Outputs
Reference flow Square Feet 1,000 1,000
Total final weight Pounds 1,567 2,220
Co-product Outputs Internal gypsum waste - recycled back into the production system Pounds 42.3 60.6
Off-spec GWB used as BDS Square feet 9.77 9.77

Athena Institute
Life Cycle Assessment of ½” Regular and 5/8” Type X Gypsum Wallboard Products 57
Inputs/Outputs Units 1 MSF - ½” Regular GWB
1 MSF - 5/8” Type X GWB
Pounds 14.84 20.77
5. Process (non-combustion) emissions to air
Total Particulate Matter (PM) Pounds 1.01E-01 1.44E-01 as PM10 Pounds 7.32E-02 1.05E-01
as PM2.5 Pounds 2.79E-02 3.94E-02 VOC Pounds 5.10E-03 7.53E-03 Lead (Pb) Pounds 2.77E-05 3.90E-05 Mercury (Hg) Pounds 1.52E-05 2.20E-05
6. Emissions to water
Total suspended solids (TSS) Pounds 3.75E-05 5.02E-05 Total Organic Carbon (TOC) Pounds 1.66E-05 2.41E-05 Lead Pounds 4.09E-11 5.94E-11 Zinc Pounds 1.95E-08 2.49E-08 Copper Pounds 3.25E-09 4.15E-09 Sulfates Pounds 6.09E-06 7.79E-06 Sulfide Pounds 1.87E-07 2.39E-07 Oil & Grease Pounds 1.33E-05 1.85E-05 Ammonia Pounds 2.05E-06 2.97E-06
7. Solid Waste Non-hazardous solid waste (including packaging) to landfill Pounds 2.72E+00 3.84E+00
Other(s) solid waste Pounds 2.90E+00 4.05E+00
Paper to recycler Pounds 2.98E-01 4.30E-01
Plastic to recycler Pounds 5.67E-03 8.15E-03
Wood to recycler Pounds 1.40E-01 2.02E-01
Steel scrap to recycler Pounds 5.34E-02 7.60E-02 Hazardous solid waste to incinerator Pounds 2.66E-03 3.69E-03
8. Wastewater and other liquid waste
Wastewater to waste treatment facility Gallons 1.75E-02 2.44E-02
Solvent mixture waste to incinerator Gallons 5.54E-03 7.87E-03
Sludge waste to landfill Pounds 2.23E-02 3.20E-02

Athena Institute
Life Cycle Assessment of ½” Regular and 5/8” Type X Gypsum Wallboard Products 58
Table 11 shows the transportation mode and distances for all inputs into the process and
outputs. Trucking was the primary mode of transport for materials and waste flows followed by
rail. Barges are primarily used for transportation of quarried natural gypsum (both domestic and
imported) and FGD synthetic gypsum. Belt conveyors were often used by gypsum wallboard
plants for the transportation of gypsum raw materials from adjacent quarry operations and on-
site.
Table 11. Inbound and outbound transportation mode and distances - Gypsum Wallboard System In-bound transportation (one-way)
Rail (in miles)
Road (in miles)
Barge (in miles)
Conveyor (in feet)
Input gypsum material
Mined natural gypsum ore (domestic) 1.24E+04 Quarried natural gypsum ore (domestic) 2.21E+01 7.40E+01 1.34E+03 Quarried natural gypsum ore (imported) 1.60E+03 Synthetic gypsum (FGD) 2.45E-02 2.30E+01 4.56E+01 1.02E+03
Post-consumer gypsum 1.25E+02 1.12E+02 Additives (both dry and wet)
Starch 5.30E+02 4.72E+02 Vermiculite 3.27E+02 Fiberglass 6.09E+01 5.94E+02 Edge Glue 4.04E+02 Retarder 6.56E+02 Dispersant 1.62E+02 6.50E+02 Boric Acid 1.98E+02 1.58E+02 Soap Foam 1.69E+02 7.74E+02 BM Accelerator 5.88E+01 Shredded paper 1.57E+02 8.17E-01 Potasium sulfate 4.46E+02 Ammonium Sulfate 5.60E+01 Sugar 5.73E+02 Talc 2.18E+02 STMP 2.52E+02 Clay 1.25E+01 Gypsum paper
Facing paper 1.77E+02 4.52E+02 Backing Paper 2.00E+02 4.56E+02

Athena Institute
Life Cycle Assessment of ½” Regular and 5/8” Type X Gypsum Wallboard Products 59
In-bound transportation (one-way)
Rail (in miles)
Road (in miles)
Barge (in miles)
Conveyor (in feet)
Packaging material
Gypsum board end paper (Bundling Tape) 2.30E+02 9.20E+02 Other Paper (Zip Tape) 3.66E+02 Ink (water and oil based) 5.21E+00 5.73E+02 Shrink-wrap 3.51E+02 Plastic Banding 2.21E+02 Rail bags 3.99E+02 Other Plastic 5.81E+01 Plastic Slip Sheets 3.46E+02 Adhesive for Dunnage/bunks/sleutters 1.32E+02 Cardboard Edge Protectors 4.53E+01 Steel Banding 1.02E+02 Lubricants
Lubricants 2.26E+01 2.08E+02 Hydraulic fluid 2.26E+01 1.46E+02 Motor oil 2.26E+01 6.15E+01 Gear Oil 2.26E+01 5.38E+01 Grease 2.26E+01 1.46E+02 Locomotive Oil 2.26E+01 0.00E+00 Antifreeze 5.47E+01 Out-bound transportation (one-way)
Rail (in miles)
Road (in miles)
Barge (in miles)
Conveyor (in feet)
½" Regular gypsum wallboard 1.31E+02 2.79E+02 2.06E+00 5/8" Type X gypsum wallboard 1.33E+02 2.78E+02 2.06E+00 Non-hazardous solid waste 3.53E+01 Hazardous solid waste 4.13E+01 Packaging Waste 3.38E+01 Wastewater 1.65E+00 Solvent mixture waste 1.43E+01 Sludge waste 4.12E+00 Paper Recycled 3.34E+01 Plastic Recycled 8.56E+00 Wood recycled 9.42E+00 Steel recycled 3.84E+00 Non-hazardous solid waste (2) 3.90E+01

Athena Institute
Life Cycle Assessment of ½” Regular and 5/8” Type X Gypsum Wallboard Products 60
The cradle-to-gate Life Cycle Inventories for the 5 (five) selected product systems are
summarized in an MS Excel spreadsheet” as follows:
Table S1.1 Cradle-to-gate LCI Results for 1,000 sq. ft. of 1/2-inch Regular GWB product;
Table S1.2 Cradle-to-gate LCI Results for 1 m2 of 1/2-inch Regular GWB product
- to be submitted at US LCI Database in 2011;
Table S2.1 Cradle-to-gate LCI Results for 1,000 sq. ft. of 5/8-inch Type X GWB product;
Table S2.2 Cradle-to-gate LCI Results for 1 m2 of 5/8-inch Regular GWB product
- to be submitted at US LCI Database in 2011;
Table S3 Cradle-to-gate LCI Results for 1,000 sq. ft. of backing gypsum paper;
Table S4 Cradle-to-gate LCI Results for 1,000 sq. ft. of facing gypsum paper; and
Table S5 Cradle-to-gate LCI Results for 1 short ton natural gypsum ore.
These LCI profiles are generated with Sima Pro LCA Software v.7.3.0, 2011 and consist of input
resources and output emissions to air, water and land and solid waste and are available upon
request at:
Gypsum Association 6525 Belcrest Road, Suite 480,
Hyattsville, MD 20782,
Phone: 301.277.8686,
Fax: 301.277.8747,
E-mail: [email protected]
http://www.gypsum.org

Athena Institute
Life Cycle Assessment of ½” Regular and 5/8” Type X Gypsum Wallboard Products 61
5 LCA Results
This section builds on the previous discussion by linking the upstream energy, materials and
component processes back to earth to present the complete cradle-to-gate life cycle impact
assessment (LCIA) results for the two reference product systems – gypsum quarrying and
paper production – and then for the functional unit of the two gypsum wallboard products of
interest. All results in this section were internally checked for plausibility and a mass balance
was completed on each product system. All flows were modeled in their entirety – that is, no
cut-off criteria were applied. The results have been categorized as geographically applicable to
the United States (specific) and North America (general), temporally to the reference year 2010
and representative of the average technology mix.
5.1 Gypsum Quarrying LCIA Results
Table 12 presents the cradle-to-gate life cycle impact assessment results for the production of
one short ton of natural quarried/mined gypsum rock by major input and contributing process.
In 2010, it took 169 MJ of primary energy to produce a ton of crude gypsum rock. Almost all of
the energy used is derived from fossil sources. Further, 90% of all energy use was ascribed to
on-site fuel use (see Table 12), of which diesel, natural gas and electricity use accounted for
46%, 44% and 10%, respectively (see Figure 8). The production of each ton of gypsum rock
results in the emission of 11.4 kg of greenhouse gases on a CO2 equivalent basis. On-site
energy was also the primary source of the greenhouse gas emissions accounting for 83% of the
total. In fact, on-site energy use was the major contributor to the acidification, eutrophication
and smog potential indicators. The production of explosives was the major component
contributing to ozone depletion (76%), while on-site processes were the largest main
contributing process to the respiratory effects indicator (89%) and abiotic depletion (100%)
which is a direct impact of the crude gypsum extraction. Table 13 summarizes the percent
contribution of each process or component to each category impact indicator. Table 14 shows
the absolute contribution of each fuel type used to the total on-site energy consumption.

Athena Institute
Life Cycle Assessment of ½” Regular and 5/8” Type X Gypsum Wallboard Products 62
Table 12. Weighted Average Gypsum Quarrying/Mining LCIA results – absolute basis, per short ton natural gypsum

Athena Institute
Life Cycle Assessment of ½” Regular and 5/8” Type X Gypsum Wallboard Products 63
Table 13. Weighted Average Gypsum Quarrying/Mining LCIA results – percent basis

Athena Institute
Life Cycle Assessment of ½” Regular and 5/8” Type X Gypsum Wallboard Products 64
Table 14. Contribution of Fuel Types to “On-site Energy Consumption” Category Indicators – absolute basis, per short ton natural gypsum

Athena Institute
Life Cycle Assessment of ½” Regular and 5/8” Type X Gypsum Wallboard Products 65
Figure 8. Contribution of Fuel Types to “On-site Energy Consumption” Category Indicators – percent basis
Note: Gasoline and propane combined contribute less than 1% to all the category indicators with the exception of “Smog” (1.3%). For example, the
global warming impact category is dominated by diesel (50%), natural gas (40%) and electricity (10%).

Athena Institute
Life Cycle Assessment of ½” Regular and 5/8” Type X Gypsum Wallboard Products 66
5.2 Gypsum Paper LCIA Results
Tables 15 and 16 present the LCIA results for the cradle-to-gate production of 1,000 sq. ft. of
backing and facing papers in the US by input or process, respectively. Because of the similar
densities between facing and backing gypsum paper, respectively 44.1 and 41.5 lbs/MSF, the
overall results for the two gypsum paper types are very similar. The cradle-to-gate manufacture
of gypsum backing paper incorporates about 322 MJ of primary energy and emits in the order of
19.5 kg of greenhouse gases (CO2 equivalent basis). The cradle-to-gate manufacture of
gypsum facing paper incorporates about 345 MJ of primary energy and emits in the order of
20.9 kg of greenhouse gases (CO2 equivalent basis).
Over 90% of the primary energy use was due to the consumption of energy at the gypsum
paper plant (see Tables 17 and 18 for the percent contribution to each indicator for backing and
facing papers). Further, on-site energy use accounted for over 90% of the fossil hydrocarbon
fuel use attributed to the manufacture of gypsum paper, which consequently was also the
primary source of the greenhouse gas emissions. With the exception of eutrophication, abiotic
resource depletion and water use impacts, on-site energy consumption at the gypsum paper
plant contributed 80% or more to each of the impact indicator category results. Waste disposal
and treatment accounted for 50% of the eutrophication effect primarily due to the treatment of
effluent flows. On-site process and energy use were two main contributors to water use, over
50% and 41% respectively.
Figure 9 isolates the contribution of various fuel use types to the “on-site energy consumption
process” for gypsum backing paper. While electricity, natural gas, diesel and propane were all
used within the plant gate, it was electricity and natural gas use that were the primary
contributor to the impact category results (diesel and propane combined contribute less than
one percent to any of the category indicators).
As noted previously, gypsum paper manufacturing requires the input of several chemical types;
however, these chemicals typically represent less than one percent of the total resource flows
and were a minor contributor to the overall LCIA results for the manufacture of gypsum papers
with the exception of the abiotic depletion impact which was over 57%. Table 19 and 20
document the contribution (in absolute and percent basis) of the various chemical families to the

Athena Institute
Life Cycle Assessment of ½” Regular and 5/8” Type X Gypsum Wallboard Products 67
total chemical usage effect for gypsum backing paper system. Of the array of chemical inputs,
sizing agents and effluent treatment chemicals were found to be the most significant
contributors to the category impact indicators.
Lastly, Figure 10 depicts the contribution of the various recycled paper input types to the total
waste paper sorting and inbound transport category for the cradle-to-gate manufacture of
gypsum facing paper. The contribution of Kraft clippings was found to be lower than that of
either OCC or mixed writing paper.

Athena Institute
Life Cycle Assessment of ½” Regular and 5/8” Type X Gypsum Wallboard Products 68
Table 15. Weighted Average Gypsum Backing Paper LCIA results – absolute basis, per MSF

Athena Institute
Life Cycle Assessment of ½” Regular and 5/8” Type X Gypsum Wallboard Products 69
Table 16. Weighted Average Gypsum Facing Paper LCIA results – absolute basis, per MSF
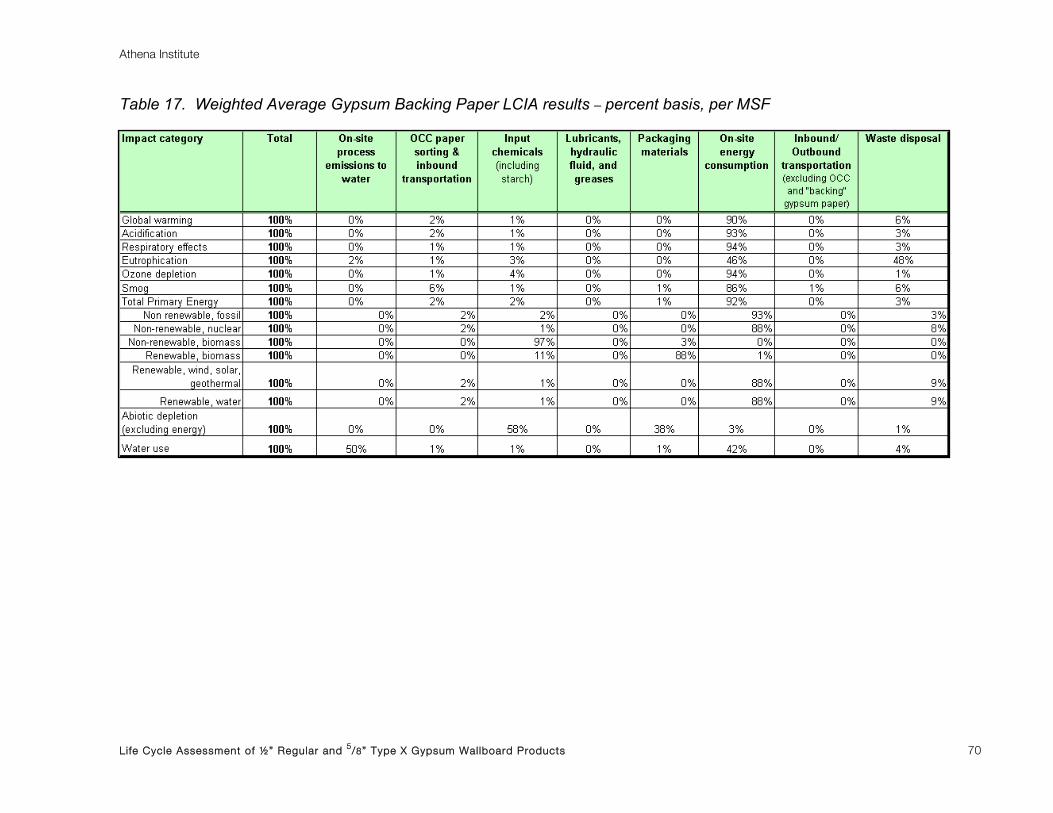
Athena Institute
Life Cycle Assessment of ½” Regular and 5/8” Type X Gypsum Wallboard Products 70
Table 17. Weighted Average Gypsum Backing Paper LCIA results – percent basis, per MSF

Athena Institute
Life Cycle Assessment of ½” Regular and 5/8” Type X Gypsum Wallboard Products 71
Table 18. Weighted Average Gypsum Facing Paper LCIA results – percent basis, per MSF

Athena Institute
Life Cycle Assessment of ½” Regular and 5/8” Type X Gypsum Wallboard Products 72
Figure 9. Contribution of Fuel Types to “On-site Energy Consumption” Category Indicators – Gypsum Backing Paper– percent basis, per MSF
Note: Diesel and propane combined contribute less than 1% to any of the category indicators. For example, the global warming impact category is dominated by electricity and natural gas, 55% and 45% respectively.

Athena Institute
Life Cycle Assessment of ½” Regular and 5/8” Type X Gypsum Wallboard Products 73
Table 19. Contribution of Chemical Types to Total Chemical Usage for Gypsum Backing Paper Manufacturing LCIA Results– absolute basis, per MSF

Athena Institute
Life Cycle Assessment of ½” Regular and 5/8” Type X Gypsum Wallboard Products 74
Table 20. Contribution of Chemical Types to Total Chemical Usage Category Indicators for Gypsum Backing Paper Manufacturing– percent basis, per MSF

Athena Institute
Life Cycle Assessment of ½” Regular and 5/8” Type X Gypsum Wallboard Products 75
Figure 10. Contribution of Recycled Paper Input Types to “Total Waste Paper Sorting and Transportation” Category Indicators- Gypsum Facing Paper Manufacturing– percent basis, per MSF

Athena Institute
Life Cycle Assessment of ½” Regular and 5/8” Type X Gypsum Wallboard Products 76
5.3 Gypsum Wallboard LCIA Results
This section presents and discusses the cradle-to-gate LCIA results for the two gypsum
wallboard products of interest: ½” (12.7 mm) Regular and 5/8“ (15.9 mm) Type X gypsum
wallboard. The functional unit for each product was a 1,000 sq. ft. (92.9 m2) of GWB. The
tabulated results include the previously presented reference flow products (natural gypsum ore
by source location and gypsum backing and facing papers) as well the aforementioned system
expansion methodology for modeling the input synthetic FGD gypsum.
5.3.1 ½” Regular Gypsum Board
Tables 21 and 22 summarize the cradle-to-gate LCIA results for 1,000 sq. ft. of ½” Regular
GWB by material input and contributing process activity. The cradle-to-gate manufacture of
1,000 sq. ft. of ½” Regular GWB embodies about 4.05 GJ of primary energy use and emits in
the order of 233 kg of greenhouse gas emissions. Over 92% of the total primary energy is
derived from non-renewable fossil fuels. On-site energy use at the GWB plant and the input of
gypsum paper were the major contributing sources to both total primary (76% and 16%,
respectively) and fossil energy use (79% and 16%).
Table 23, 24 and Figure 11 show the contribution of gypsum source inputs (both in absolute and
percent basis) to the LCIA category indicator results. Positive (+) values/percentages present an
environmental burden related to the activity e.g. the extraction of natural gypsum ore (both
domestic & imported). The contribution of the natural gypsum extraction system (both domestic
& imported) to the depletion of abiotic resources potential was 98%. Its contribution to the rest of
the LCIA category results ranged from 0.3% to 8% of the total impact results for the two
products. Negative (-) values/percentages represent a reduction of the environmental burden (a
benefit to the environment). The net impact of synthetic FGD gypsum use resulted in net benefit
to the environment due to its diversion from landfilling. The reduction of the environmental
burden (the environmental benefit) across the LCIA category results was relatively minor
(generally ranging between 1% and 7%) with the exception of smog (29%).
Overall, the GWB plant’s energy use was the single largest contributor to the majority of the
LCIA category results. With the exception of eutrophication, abiotic depletion potential and

Athena Institute
Life Cycle Assessment of ½” Regular and 5/8” Type X Gypsum Wallboard Products 77
water use, plant energy use generally accounted for greater than 70% of the impact outcome.
Gypsum paper inputs were the next most consistent and significant contributor to the impact
categories and ranged from 12% (ozone depletion potential) to accounting for 30% of the
eutrophication potential for the product system. Dry and wet additives accounted for 27% of the
eutrophication potential effect. In-bound transportation of raw and ancillary materials and the
out-bound transportation of wastes for treatment accounted for about 32% of the smog
potential, but otherwise it’s contribution ranged from 2% to 8% to the supported impact category
indicators. Packaging (including the use of off-spec GWB as bunks and sluetters), on-site
process emissions/effluent control and waste disposal were also relatively minor contributors to
the supported impact indicators.
Table 25 and Figure 12 summarizes the weighted average GWB plant energy use contribution
by fuel type to each impact indicator for the production of 1,000 sq. ft. of ½” Regular GWB. Both
electricity and natural gas use dominated the majority of the impacts. Gasoline was also a
contributor to global warming, smog formation and primary energy use. Diesel and propane use
had only a minor impact across all impact category results.
Figure 13 summarizes the contribution of inbound materials and outbound waste transportation
by mode to the LCIA results for total transportation. The impact of transportation was driven by
the input of gypsum by barge and truck followed by the input of additives by truck. Waste
treatment transportation by truck was a minor contributor the overall effect of transportation.
Tables 26 and 27 show the contribution of the various additives to the overall LCIA contribution
of additives category indicators in absolute and on a percent basis. The input of starch, glass
fiber, dispersant and soap foam were the major inputs contributing to the LCIA indicators for
additives.

Athena Institute
Life Cycle Assessment of ½” Regular and 5/8” Type X Gypsum Wallboard Products 78
Table 21. Weighted Average ½” Regular GWB LCIA results –absolute basis, per MSF
Table 22. Weighted Average ½” Regular GWB LCIA results – percent basis, per MSF

Athena Institute
Life Cycle Assessment of ½” Regular and 5/8” Type X Gypsum Wallboard Products 79
Table 23. Summary: Gypsum Input LCIA Contribution Analysis -½” Regular GWB– absolute basis, per MSF
Note: Positive (+) values represent an environmental burden related to the activity e.g. the extraction of natural gypsum ore. Negative (-) values represent a reduction of the environmental burden (a benefit to the environment). The net impact of synthetic FGD gypsum use resulted in net benefit to the environment due to its diversion from landfilling.
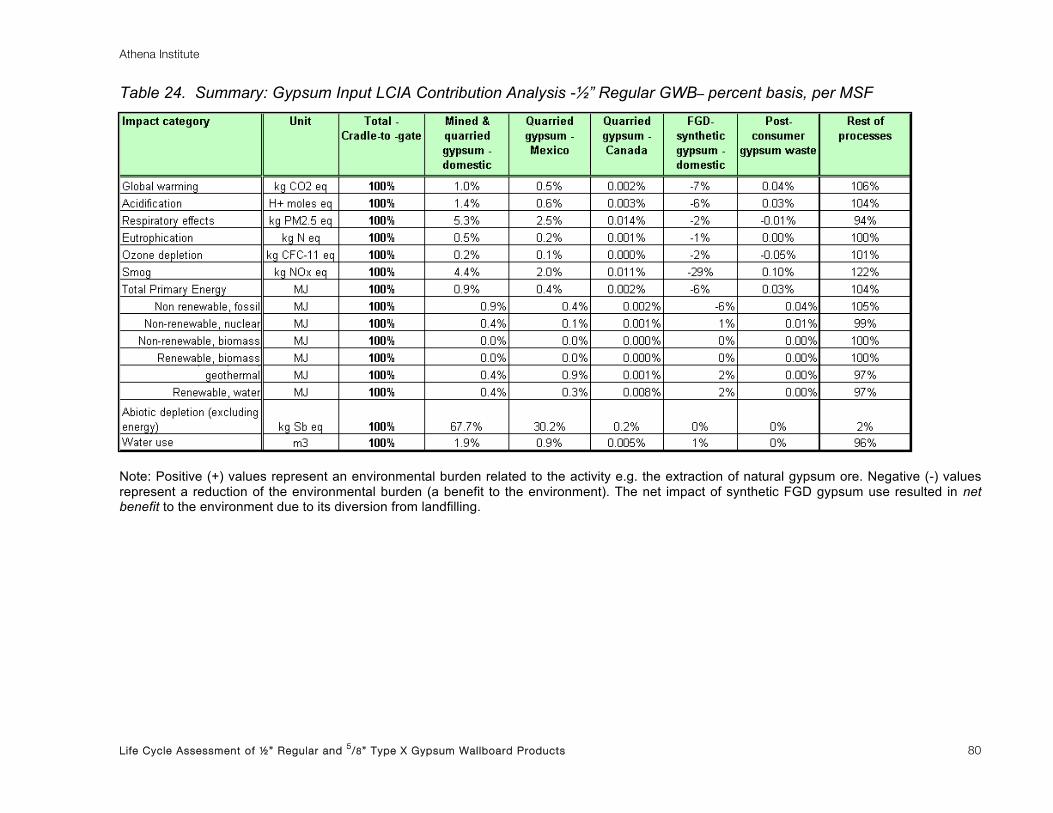
Athena Institute
Life Cycle Assessment of ½” Regular and 5/8” Type X Gypsum Wallboard Products 80
Table 24. Summary: Gypsum Input LCIA Contribution Analysis -½” Regular GWB– percent basis, per MSF
Note: Positive (+) values represent an environmental burden related to the activity e.g. the extraction of natural gypsum ore. Negative (-) values represent a reduction of the environmental burden (a benefit to the environment). The net impact of synthetic FGD gypsum use resulted in net benefit to the environment due to its diversion from landfilling.

Athena Institute
Life Cycle Assessment of ½” Regular and 5/8” Type X Gypsum Wallboard Products 81
Figure 11. Summary: Gypsum Input LCIA Contribution Analysis - ½” Regular GWB– percent basis, per MSF
Note: Positive (+) percentages represent an environmental burden related to the activity e.g. the extraction of natural gypsum ore. The contribution of the natural gypsum extraction system (both domestic & imported) to the depletion of abiotic resources potential was 98%. Its contribution to the rest of the LCIA category results ranged from 0.3% to 8% of the total impact results for the two products. Negative (-) percentages represent a reduction of the environmental burden (a benefit to the environment). The net impact of the FGD synthetic gypsum use was beneficial to the environment due to the avoidance of synthetic FGD landfilling. The reduction of the environmental burden (the environmental benefit) across the LCIA category results was relatively minor (generally ranging between 1% and 7%) with the exception of smog (29%).
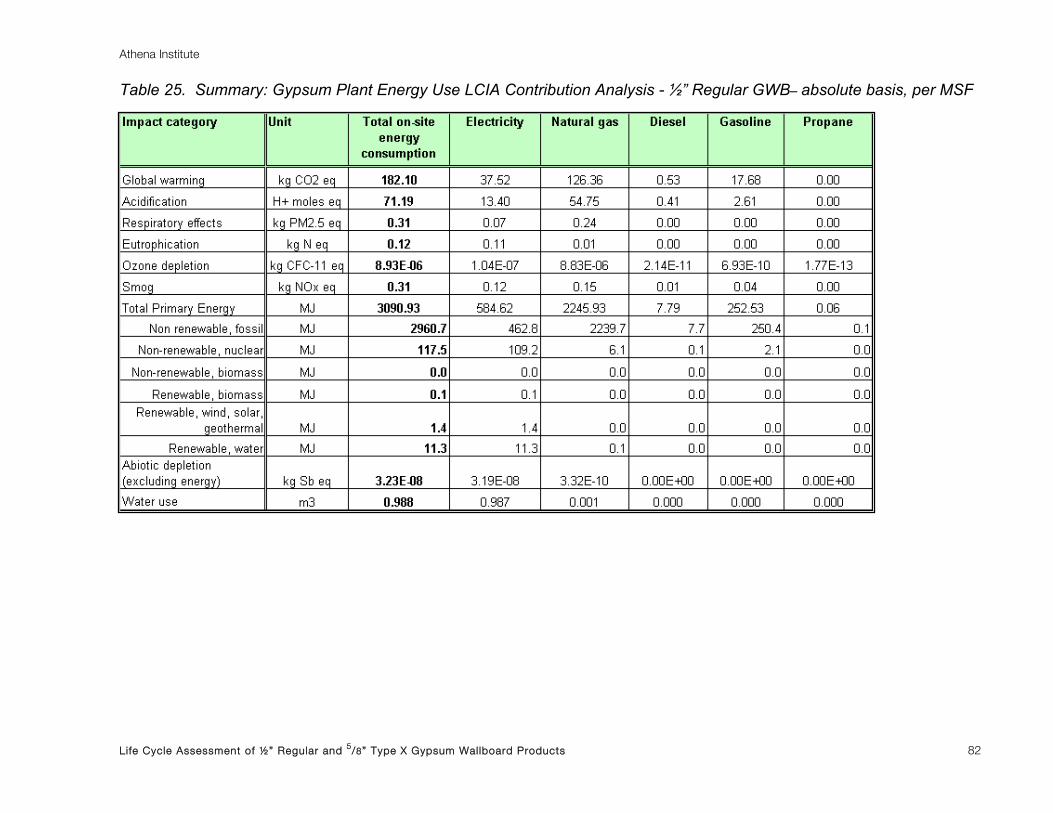
Athena Institute
Life Cycle Assessment of ½” Regular and 5/8” Type X Gypsum Wallboard Products 82
Table 25. Summary: Gypsum Plant Energy Use LCIA Contribution Analysis - ½” Regular GWB– absolute basis, per MSF

Athena Institute
Life Cycle Assessment of ½” Regular and 5/8” Type X Gypsum Wallboard Products 83
Figure 12. Summary: Gypsum Plant Energy Use LCIA Contribution Analysis - ½” Regular GWB– percent basis, per MSF
Note: Diesel and propane combined contribute less than 1% to all the category indicators with the exception of smog (3%). For example, the global warming impact category is dominated by natural gas (69%), electricity (21%) and gasoline (10%) usage.

Athena Institute
Life Cycle Assessment of ½” Regular and 5/8” Type X Gypsum Wallboard Products 84
Figure 13. Summary: Inbound/Outbound Transportation LCIA Contribution Analysis - ½” Regular GWB– percent basis, per MSF
Note: Raw gypsum and FGD (rail), packaging (both rail and truck), lubricants (both rail and truck) and waste (truck) combined contribute less than 1% to any of the category indicators. For example, the global warming impact category is dominated by raw gypsum & FGD-trucking (13.0%), raw gypsum & FGD-barge (60.5%) transportation, additives by rail (2.3%), additives by truck (23.6%) and rest (0.6%- less than 1%).

Athena Institute
Life Cycle Assessment of ½” Regular and 5/8” Type X Gypsum Wallboard Products 85
Table 26. Summary: Additives Input LCIA Contribution Analysis - ½” Regular GWB – absolute basis, per MSF

Athena Institute
Life Cycle Assessment of ½” Regular and 5/8” Type X Gypsum Wallboard Products 86
Table 27. Summary: Additives Input LCIA Contribution Analysis - ½” Regular GWB– percent basis, per MSF

Athena Institute
Life Cycle Assessment of ½” Regular and 5/8” Type X Gypsum Wallboard Products 87
5.3.2 5/8” Type X Gypsum Board
Tables 28 and 29 summarize the cradle-to-gate LCIA results for 1,000 sq. ft. of 5/8” Type X GWB
by material input and contributing process activity. The cradle-to-gate manufacture of 1,000 sq.
ft. of 5/8” Type X GWB embodies about 5.45 GJ of primary energy use and emits in the order of
315 kg of greenhouse gas emissions. Over 90% of the total primary energy is derived from
non-renewable fossil fuels. On-site energy use at the GWB plant and the input of gypsum paper
were the major contributing sources to both total primary (80% and 12%, respectively) and fossil
energy use (83% and 12%).
Tables 30 and 31 and Figure 14 show the contribution of gypsum source inputs (both in
absolute and percent basis) to the LCIA category indicator results. Positive (+)
values/percentages present an environmental burden related to the activity e.g. the extraction of
natural gypsum ore (both domestic & imported). The contribution of the natural gypsum
extraction system (both domestic & imported) to the depletion of abiotic resources potential was
97%. Its contribution to the rest of the LCIA category results ranged from 0.3% to 8% of the total
impact results for the two products. Negative (-) values/percentages present a reduction of the
environmental burden (a benefit to the environment). The net impact of synthetic FGD gypsum
use resulted in net benefit to the environment due to its diversion from landfilling. The reduction
of the environmental burden (the environmental benefit) across the LCIA category results was
relatively minor (generally ranging between 1% and 8%) with the exception of smog (30%).
Overall, the GWB plant’s energy use was the single largest contributor to the majority of the
LCIA category results for the product of interest. With the exception of eutrophication, abiotic
depletion potential and water use, plant energy use generally accounted for greater than 70% of
the impact outcome for 5/8” Type X GWB. Gypsum paper inputs were the next most consistent
and significant contributor to the impact categories and ranged from 8% (ozone depletion
potential) to accounting for 25% of the eutrophication potential for the product system. Dry and
wet additives accounted for 25% of the eutrophication potential effect, but were otherwise a
minor contributor to the LCIA indicator results. In-bound transportation of raw and ancillary
materials and the out-bound transportation of wastes for treatment accounted for 33% of the
smog potential, but otherwise it’s contribution ranged from 2% to 8% to the supported impact
category indicators. Packaging (including the use of off-spec GWB as bunks and sluetters),
Athena Institute
Life Cycle Assessment of ½” Regular and 5/8” Type X Gypsum Wallboard Products 88
production consumables (lubricants, etc.), on-site process emissions/effluent control (except for
water use) and waste disposal were also relatively minor contributors to the LCIA impact
indicators.
Table 32 and Figure 15 summarize the weighted average GWB plant energy use contribution by
fuel type to each impact indicator for the production of 1,000 sq. ft. of 5/8” Type X GWB. Both
electricity and natural gas use dominated the majority of the impacts. Gasoline was also a
contributor to global warming, smog formation and total primary energy use. Diesel and
propane use had only a minor impact across all impact category results.
Figure 16 presents the contribution of the inbound transportation of materials and the outbound
transportation of waste outputs by mode for the total transportation LCIA effect related to the 5/8”
Type X GWB product system. The transport of gypsum (all sources) by barge and truck
dominates the contribution to all impact category indicators. The water use and abiotic
depletion indicator was dominated by conveyance of raw gypsum from the quarry to the GWB
plant. Additives transportation by truck was a second order contributor to the total
transportation effect. Waste treatment transportation by truck was an insignificant contributor to
the total effect of transportation.
Tables 33 and 34 provide a contribution analysis by additive (absolute and percent basis) to the
overall impact of the dry and wet additives used in the manufacture of 1,000 sq. ft. of 5/8” Type X
GWB. The contribution analysis identified starch and glass fiber as the two primary impact
sources for additive inputs in the manufacture of 5/8” Type X GWB. Dispersants, retarders and
soap foam as a grouping were the next most significant contributors to the impact of all
additives.

Athena Institute
Life Cycle Assessment of ½” Regular and 5/8” Type X Gypsum Wallboard Products 89
Table 28. Weighted Average5/8” Type X GWB LCIA results –absolute basis, per MSF
Table 29. Weighted Average5/8” Type X GWB LCIA results –percent basis, per MSF

Athena Institute
Life Cycle Assessment of ½” Regular and 5/8” Type X Gypsum Wallboard Products 90
Table 30. Summary: Gypsum Input LCIA Contribution Analysis - 5/8” Type X GWB– absolute basis, per MSF
Note: Positive (+) values represent an environmental burden related to the activity e.g. the extraction of natural gypsum ore. Negative (-) values represent a reduction of the environmental burden (a benefit to the environment). The net impact of synthetic FGD gypsum use resulted in net benefit to the environment due to its diversion from landfilling.
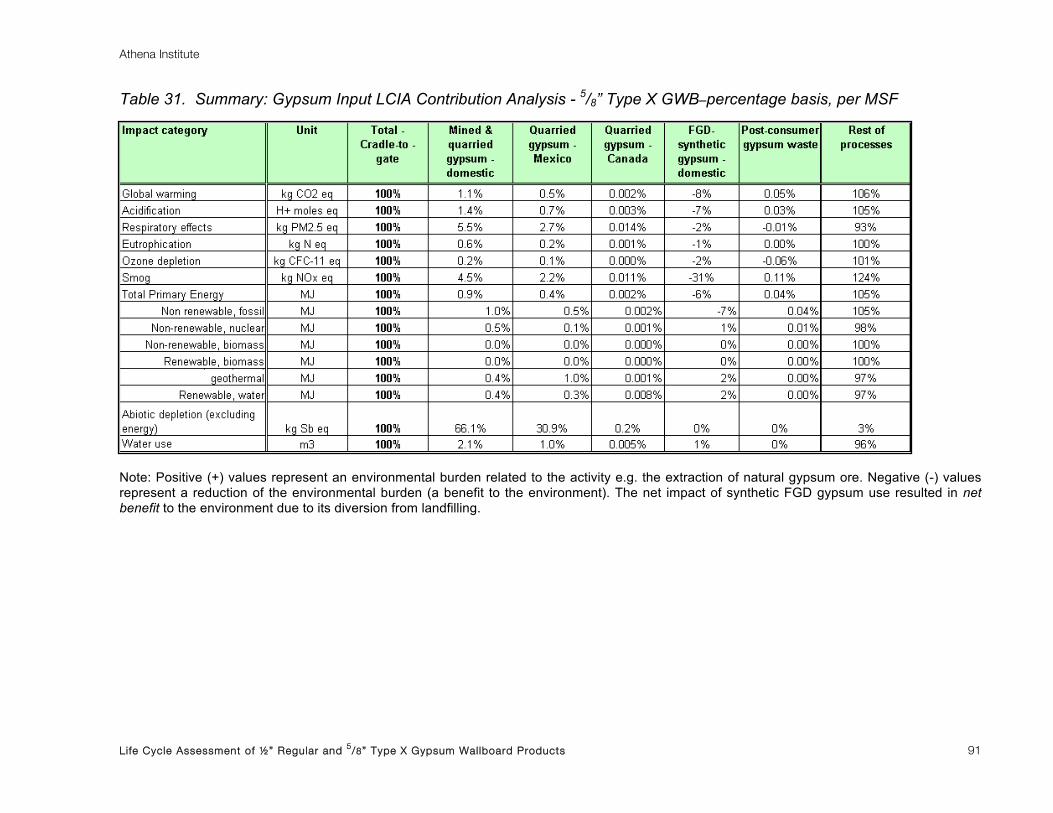
Athena Institute
Life Cycle Assessment of ½” Regular and 5/8” Type X Gypsum Wallboard Products 91
Table 31. Summary: Gypsum Input LCIA Contribution Analysis - 5/8” Type X GWB–percentage basis, per MSF
Note: Positive (+) values represent an environmental burden related to the activity e.g. the extraction of natural gypsum ore. Negative (-) values represent a reduction of the environmental burden (a benefit to the environment). The net impact of synthetic FGD gypsum use resulted in net benefit to the environment due to its diversion from landfilling.

Athena Institute
Life Cycle Assessment of ½” Regular and 5/8” Type X Gypsum Wallboard Products 92
Figure 14. Summary: Gypsum Input LCIA Contribution Analysis - 5/8” Type X GWB– percent basis, per MSF
Note: Positive (+) percentages represent an environmental burden related to the activity e.g. the extraction of natural gypsum ore. The contribution of the natural gypsum extraction system (both domestic & imported) to the depletion of abiotic resources potential was 97%. Its contribution to the rest of the LCIA category results ranged from 0.3% to 8% of the total impact results for the two products. Negative (-) percentages represent a reduction of the environmental burden (a benefit to the environment). The net impact of the FGD synthetic gypsum use was beneficial to the environment due to the avoidance of synthetic FGD landfilling. The reduction of the environmental burden (the environmental benefit) across the LCIA category results was relatively minor (generally ranging between 1% and 8%) with the exception of smog (30%).
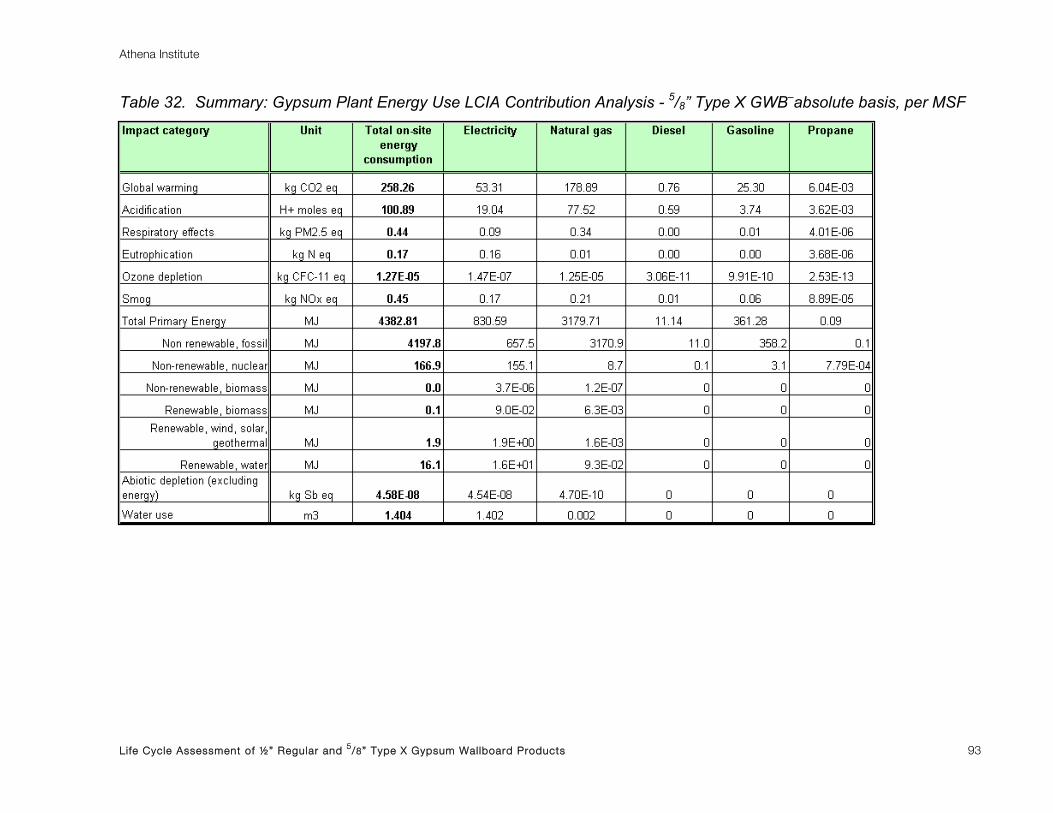
Athena Institute
Life Cycle Assessment of ½” Regular and 5/8” Type X Gypsum Wallboard Products 93
Table 32. Summary: Gypsum Plant Energy Use LCIA Contribution Analysis - 5/8” Type X GWB–absolute basis, per MSF

Athena Institute
Life Cycle Assessment of ½” Regular and 5/8” Type X Gypsum Wallboard Products 94
Figure 15. Summary: Gypsum Plant Energy Use LCIA Contribution Analysis - 5/8” Type X GWB– percent basis, per MSF
Note: Diesel and propane combined contribute less than 1% to all the category indicators with the exception of smog (3%). For example, global warming impact category is dominated by natural gas (69%), electricity (21%) and gasoline (10%) use.

Athena Institute
Life Cycle Assessment of ½” Regular and 5/8” Type X Gypsum Wallboard Products 95
Figure 16. Summary: Inbound/Outbound Transportation LCIA Contribution Analysis - 5/8” Regular GWB– percent basis, per MSF
Note: Raw gypsum and FGD (rail), packaging (both rail and truck), lubricants (both rail and truck) and waste (truck) combined contribute less than 1% to any of the category indicators. For example, the global warming impact category is dominated by raw gypsum & FGD-truck (14%), raw gypsum & FGD-barge (65%), additives-rail (2%) and additives-truck (19%).

Athena Institute
Life Cycle Assessment of ½” Regular and 5/8” Type X Gypsum Wallboard Products 96
Table 33. Summary: Additives Input LCIA Contribution Analysis - 5/8” Type X GWB– absolute basis, per MSF
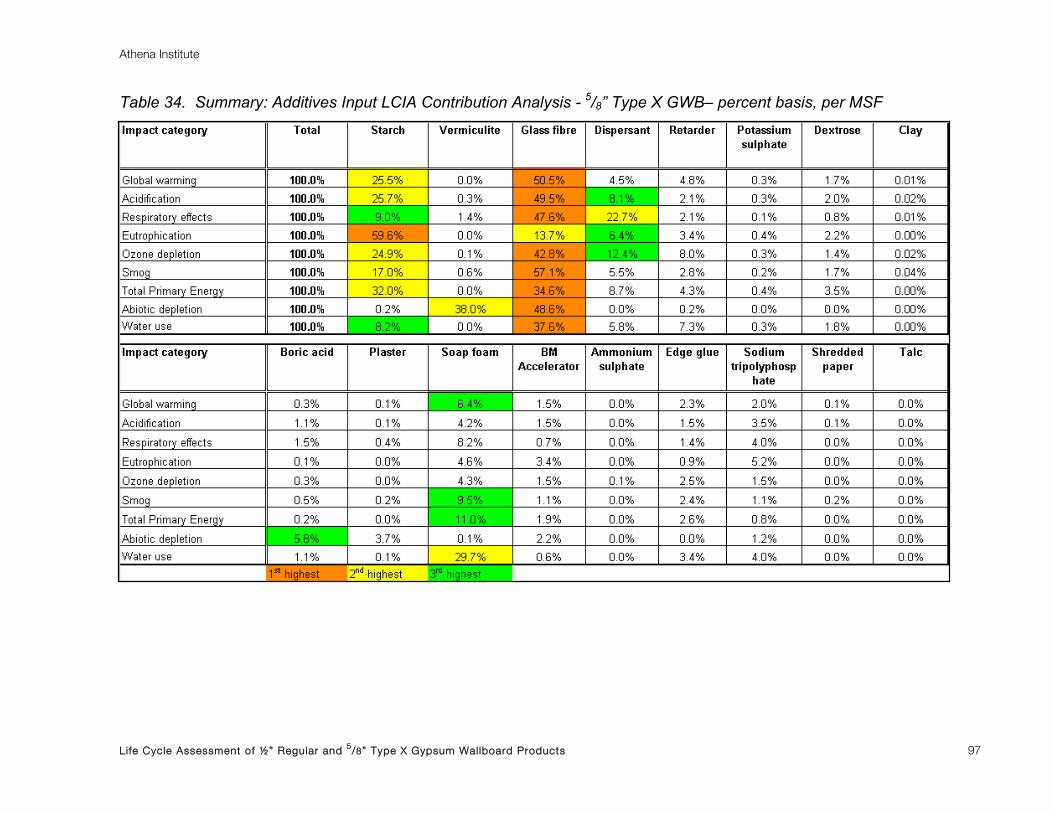
Athena Institute
Life Cycle Assessment of ½” Regular and 5/8” Type X Gypsum Wallboard Products 97
Table 34. Summary: Additives Input LCIA Contribution Analysis - 5/8” Type X GWB– percent basis, per MSF

Athena Institute
Life Cycle Assessment of ½” Regular and 5/8” Type X Gypsum Wallboard Products 98
6 LCA Interpretation
Interpretation is the phase of LCA in which the findings from the inventory analysis and the
impact assessment are brought together and significant issues are identified and considered in
the context of the study goal and scope. In addition, the study’s completeness, consistency of all
applied information and sensitivity to key assumptions or parameters as they relate to the goal
and scope of the study are evaluated. Lastly, the interpretation phase ends by drawing
conclusions, stating the study’s limitations and making recommendations for further study (as
per Clause 4.5.1.1, ISO 14044:2006.
6.1 Identification of the significant issues
ISO recommends several possible methods to identify significant issues such as dominance,
influence, and contribution analysis. Based on established LCA practices, the following
analytical techniques were applied for the interpretation phase of this study:
Dominance Analysis: in whichremarkable or significant contributions are examined [2].
Influence Analysis: in which the possibility of influencing the environmental issues is
examined for the product system of interest [2].
Contribution Analysis: in which the contribution of life cycle stages, groups of processes or
specific substances to the total results are examined [2].
Contribution analysis may also be dealt with in the interpretation phase; however, Section 5
of this report already detailed the key contributing life cycle stages, processes, material,
energy inputs and transportation modes for each product system. In this section, the
contribution analysis was limited to the examination of the three major contributing flows for
each of the selected impact indicators categories. Overall the findings of the contribution
analysis are highlighted in the conclusion section.
6.1.1 Dominance Analysis
Tables 35 and 36 present the three most significant inputs that dominate the overall LCIA
category indicators for the cradle-to-gate production of ½” Regular GWB on an absolute and

Athena Institute
Life Cycle Assessment of ½” Regular and 5/8” Type X Gypsum Wallboard Products 99
percent basis. Similarly, Tables 37 and 38 show that the same three inputs (on-site natural gas
combustion and pre-combustion, gypsum paper manufacturing, and on-site electricity use) also
dominate the overall LCIA category indicators for the cradle-to-gate production of 5/8” Type X
GWB on an absolute and percent basis.
The use of natural gas at the GWB plant dominates the resulting LCIA profile for both product
systems of interest. Both gypsum paper manufacturing and electricity use at the GWB plant
followed a distant second and third in terms of dominance, but the three inputs together account
for upwards of 86% of total primary energy use and 88% of the GWP effect. The abiotic
resource depletion and to some extent water use were driven by other inputs to the product
systems.
Table 35. Dominance Analysis: ½” Regular GWB Product System – absolute basis, per MSF
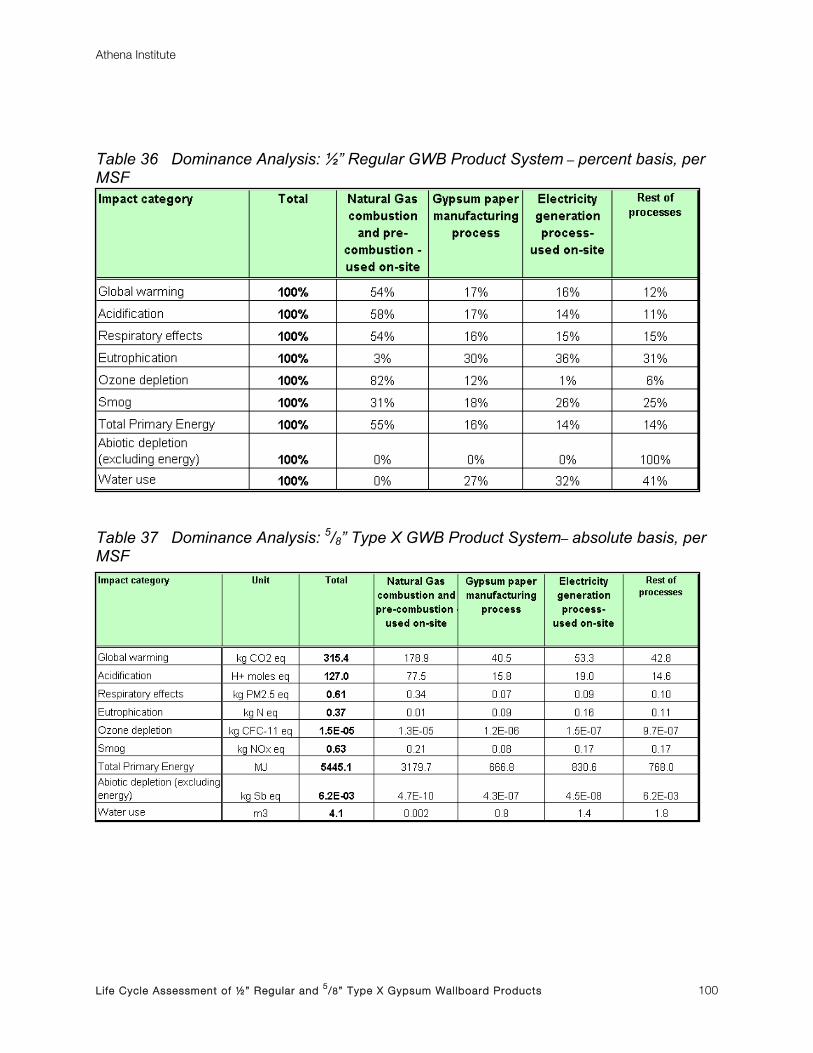
Athena Institute
Life Cycle Assessment of ½” Regular and 5/8” Type X Gypsum Wallboard Products 100
Table 36 Dominance Analysis: ½” Regular GWB Product System – percent basis, per MSF
Table 37 Dominance Analysis: 5/8” Type X GWB Product System– absolute basis, per MSF

Athena Institute
Life Cycle Assessment of ½” Regular and 5/8” Type X Gypsum Wallboard Products 101
Table 38. Dominance Analysis: 5/8” Type X GWB Product System– percent basis, per MSF
6.1.2 Influence Analysis
Table 39 and 40 depict the results of the cradle-to-gate influence analysis by impact category
for the ½” Regular and 5/8” Type X GWB product systems. The influence analysis conducted for
this project shows the degree to which the various LCIA results are controlled by the GWB plant
as opposed to the suppliers of inputs to the plant (both materials and energy). With the
exception of water use and eutrophication potential, the analysis indicates that about 78% of the
LCIA results are within the sphere of the GWB plant’s control and 22% of the impacts are due to
upstream suppliers over which the plants may have limited control. The difference between the
two product systems (½” Regular and 5/8” Type X) is minimal, but consistently about 4% - with
the 5/8” Type X product influenced less by suppliers, reflecting a slightly higher impact of on-site
energy consumption and air emissions to the total environmental impact.

Athena Institute
Life Cycle Assessment of ½” Regular and 5/8” Type X Gypsum Wallboard Products 102
Table 39. Influence Analysis: ½” Regular GWB Product System– percent basis, per MSF

Athena Institute
Life Cycle Assessment of ½” Regular and 5/8” Type X Gypsum Wallboard Products 103
Table 40. Influence Analysis: 5/8” Type X GWB Product System– percent basis, per MSF
6.1.3 Contribution Analysis
In the framework of the interpretation phase, substance contribution analysis is conducted and
consists of identifying the three major contributing substances/flows per each selected LCIA
impact category. Table 41 provides an LCIA indicator substance contribution summary, which
highlights the contributing substance flows to the total cradle-to-gate indicator outcome. For
example, just three greenhouse gases (carbon dioxide-CO2, methane-CH4 and nitrous oxide-
N2O) were responsible for over 99% of the global warming potential. Gypsum (in ground) is
responsible for 97% of the abiotic resource depletion for the ½” Regular GWB product system.
Nitrogen oxides (NOx) is responsible for 74%% of the overall smog potential and sulfur dioxide
(SO2) and particulate air emissions were the main contributors to the respiratory effects potential
indicators (99%).

Athena Institute
Life Cycle Assessment of ½” Regular and 5/8” Type X Gypsum Wallboard Products 104
Table 41. Substance Contribution Analysis: ½”Regular GWB Product System– Absolute and percent basis, per MSF

Athena Institute
Life Cycle Assessment of ½” Regular and 5/8” Type X Gypsum Wallboard Products 105
6.2 Completeness, Consistency and Sensitivity Checks
Evaluating the study’s completeness, consistency and sensitivity helps to establish and
enhance confidence in, and the reliability of, the results of the LCA study, including the
significant issues identified in the first element of the interpretation [2].
The objective of the completeness check is to ensure that all relevant information and data
needed for the interpretation are available and complete [2]. Three selected production systems
(gypsum wallboard, gypsum paper and natural gypsum extraction) were checked for data
completeness including all elements such as raw and ancillary material input, energy input,
transportation, water consumption, product and co-products outputs, emissions to air, water and
land and waste disposal. All the input and output data were found to be complete and no data
gaps were identified along the three selected production systems or between the products of
interest such as ½” Regular and 5/8” Type X GWB or backing and facing gypsum paper.
The objective of the consistency check is to determine whether the assumptions, methods,
models and data are consistent with the goal and scope of the study [2]. Through a rigorous
iterative process, consistency was ensured between the ½” Regular and 5/8” Type X GWB
production systems in terms of assumptions, methods, models and data quality including data
source, accuracy, data age, time-related coverage, technology and geographical coverage (see
Section 3.3 Data Quality).
6.2.1 Sensitivity Checks
A sensitivity check is defined, as process of verifying that the information obtained from a
sensitivity analysis is relevant for reaching the conclusions and making recommendations.
Sensitivity analysis tries to determine the influence of variations in assumptions, methods and
data on the results of the study [2]. Sensitivity analysis is a procedural comparison of the results
obtained using baseline assumptions, methods or data with the results obtained using altered
assumptions, methods or data. Sensitivity analysis was conducted on two key production
parameters – the relative mix of natural gypsum rock and synthetic FGD gypsum used to
produce GWB and the source of the natural gypsum against underlying industry norms (6.2.1.1

Athena Institute
Life Cycle Assessment of ½” Regular and 5/8” Type X Gypsum Wallboard Products 106
and 6.2.1.2). Sensitivity of the LCIA results to a change in “on-site energy consumption” within
the GWB plant by fuel type is also investigates and presented in section 6.2.1.3. Section
6.2.1.4 shows the results of a sensitivity analysis of the “system expansion/ avoided burden”
approach used in this LCA study relative to a “cut-off” approach to solve the “multi-functionality”
of coal-fired power generation process to calculate the environmental profile of the synthetic
FGD gypsum input, a co-product of coal power plant.
6.2.1.1 Sensitivity Analysis- 50/50 Mix of Natural and Synthetic FGD Gypsum
As little as a decade ago, synthetic FGD gypsum use represented only 20% of total gypsum
input in the manufacture of gypsum wallboard. The Gypsum Association’s records, and
statistics suggest, that the mix of natural and synthetic FGD gypsum use in the US is now about
50/506. The weighted average sample of GWB plants participating in this study attained an
overall 41/59 mix of natural to synthetic FGD gypsum use. In order to better understand the
influence of a change in the source type of gypsum, a sensitivity analysis was performed
whereby the gypsum inputs were recast as a 50/50 mix of natural and synthetic FGD gypsum –
an approximately 10% change in the mix of gypsum inputs.
Table 42 summarizes the LCIA results of the sensitivity analysis for an approximate 10%
change in the mix of natural to synthetic gypsum on the ½” Regular GWB cradle-to-gate product
system. The first “Baseline total” column reflects the cradle-to gate results of the ½” Regular
GWB baseline scenario which consists of the weighted average mix of 41/59 natural to synthetic
FGD (see Table 21). The second “Sensitivity total” column reports the cradle-to gate results of
the ½” Regular GWB sensitivity scenario assuming a 50/50 mix of natural to synthetic FGD.
The sensitivity results indicated that an approximately 10% increase in the use of natural
gypsum with a corresponding decrease in the use of synthetic FGD gypsum would amount to a
2% increase in the overall indicator results for the ½” Regular GWB product system with the
exception of the abiotic resource depletion and smog potential which increased by 20% and 9%
respectively. Similar conclusions are applicable to the 5/8” Type X GWB product system.
6See http://www.gypsumsustainability.org/recycled.html

Athena Institute
Life Cycle Assessment of ½” Regular and 5/8” Type X Gypsum Wallboard Products 107
Table 42 Sensitivity Analysis: Change of the Baseline from 41/59 to 50/50 natural to synthetic FGD mix- ½” Regular GWB Product System– absolute and percent basis, per MSF
6.2.1.2 Sensitivity Analysis- 70/30 Mix of Natural Gypsum Imports from Canada/Mexico
A second sensitivity analysis was performed to determine the influence of variations of the
source of imported natural gypsum on the GWB product system – again using the ½” Regular
GWB product system as the basis for the analysis. The baseline study indicated a mix of
imported raw gypsum rock that was sourced almost exclusively from Mexico (99%). The
Mineral Yearbook statistics indicate that Canada is the primary source of gypsum imports (66%)
with imports from Mexico accounting for roughly 26%, Spain 7% and the remaining 1% from
other countries [11]. A possible reason for this study’s departure from the national gypsum
import statistics was the fact that in the process of selecting a geographical and technological
representative plant sample, more plants were located in the southwest region, where they
source their imported gypsum from Mexico. To determine the significance of a change in
gypsum import source, the imported natural gypsum inputs were reset with Canada and Mexico
as the source regions for 70% and 30% of imports, respectively. A limitation of this sensitivity
analysis was that, while the baseline study results reflect natural gypsum mining and quarrying
activities, the only difference modeled for the two import countries was the source electricity grid
(Canada’s and Mexico’s). However, this limitation may not be significant given that diesel fuel
use was the largest energy input in the production of natural gypsum and would likely have a
similar influence in either Canada or Mexico.

Athena Institute
Life Cycle Assessment of ½” Regular and 5/8” Type X Gypsum Wallboard Products 108
The sensitivity results indicated that the source location of the natural gypsum input had a
minimal influence (<1%) on the LCIA results reported for the ½” Regular GWB product system
(Table 43). While Canada’s electricity grid is cleaner than Mexico’s (less reliance on fossil fuels
used to generate and deliver electricity), quarrying itself was not found to be an electricity use
intensive operation. As a result, the baseline results are not significantly influenced by a
significant change in the source region and may well adequately reflect the statistics reported by
the Minerals Yearbook. Similar conclusions are applicable to the 5/8” Type X GWB product
system.
Table 43. Sensitivity Analysis: 70%/30% of Natural Gypsum Imports from Canada/Mexico - ½” Regular GWB Product System LCIA Results – absolute basis and percent, per MSF
6.2.1.3 Sensitivity Analysis- On-site energy consumption
A third sensitivity analysis was constructed around “on-site energy consumption” at the GWB
plant – by far the most significant contributor to the LCIA results for both GWB product systems.
The weighted average energy use for ½-inch Regular product result was dominated by the use
of electricity (47 kWh/MSF) and natural gas (1820 ft.3/MSF) at the GWB plant. A statistical
analysis of the 17 GWB plants that participated in the study indicated that 71% of the sample fell
within a range of +/- 21% (coefficient of variation7 of the electricity data sample) and 76% of the
plant sample were within +/- 16% (coefficient of variation of the natural gas data sample) for
7 The coefficient of variation COV is the ratio of the standard deviation to the arithmetic mean, and represents a normalized measure of the dispersion of the sample data,
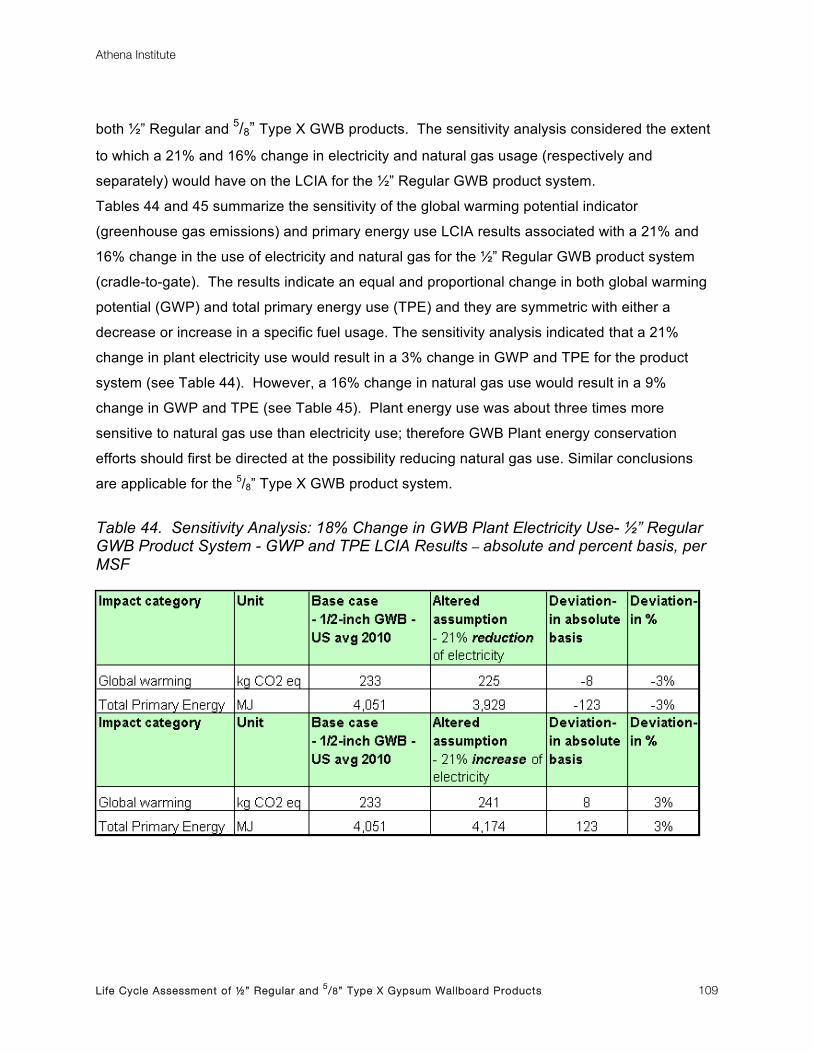
Athena Institute
Life Cycle Assessment of ½” Regular and 5/8” Type X Gypsum Wallboard Products 109
both ½” Regular and 5/8” Type X GWB products. The sensitivity analysis considered the extent
to which a 21% and 16% change in electricity and natural gas usage (respectively and
separately) would have on the LCIA for the ½” Regular GWB product system.
Tables 44 and 45 summarize the sensitivity of the global warming potential indicator
(greenhouse gas emissions) and primary energy use LCIA results associated with a 21% and
16% change in the use of electricity and natural gas for the ½” Regular GWB product system
(cradle-to-gate). The results indicate an equal and proportional change in both global warming
potential (GWP) and total primary energy use (TPE) and they are symmetric with either a
decrease or increase in a specific fuel usage. The sensitivity analysis indicated that a 21%
change in plant electricity use would result in a 3% change in GWP and TPE for the product
system (see Table 44). However, a 16% change in natural gas use would result in a 9%
change in GWP and TPE (see Table 45). Plant energy use was about three times more
sensitive to natural gas use than electricity use; therefore GWB Plant energy conservation
efforts should first be directed at the possibility reducing natural gas use. Similar conclusions
are applicable for the 5/8” Type X GWB product system.
Table 44. Sensitivity Analysis: 18% Change in GWB Plant Electricity Use- ½” Regular GWB Product System - GWP and TPE LCIA Results – absolute and percent basis, per MSF

Athena Institute
Life Cycle Assessment of ½” Regular and 5/8” Type X Gypsum Wallboard Products 110
Table 45. Sensitivity Analysis: 16% Change in GWB Plant Natural Gas Use - ½” Regular GWB Product System- GWP and TPE LCIA Results– absolute and percent basis, per MSF
6.2.1.4 Sensitivity Analysis- FGD system expansion approach
A fourth sensitivity analysis was conducted around the system expansion/ avoided burden
approach to solve the “multi-functionality” of coal-fired power generation process and calculate
the environmental profile of the FGD synthetic gypsum, a co-product of coal power plant.
Based on system expansion/ avoided burden approach, the reported baseline results included
the “dewatering” of FGD gypsum and its “transport” to the GWB plant, but also credited the FGD
gypsum system with the avoidance of the “FGD landfilling” process.
As presented in Section 3.2.4 Allocation procedures and Appendix A, it’s not possible to find
pure physical causal or economic relationship between the product and co-product of the multi-
functional coal-fired power generation process. The sensitivity analysis uses a “cut-off”
approach and considers only the “dewatering” of FGD gypsum and its “transport” to the GWB
plants. That is, no FGD landfilling “credit” and “burden” is applied to the GWB production system
and coal-fired electricity generation system, respectively. It should be noted that using a “cut-
off” approach is not recommended by ISO, but it’s a simple approach used by LCA practitioners
in classical LCA studies (known as Situation C2 [5]).

Athena Institute
Life Cycle Assessment of ½” Regular and 5/8” Type X Gypsum Wallboard Products 111
Table 46 depicts the sensitivity of the LCIA results when using the “cut-off” approach for the ½”
Regular GWB cradle-to-gate product system. The sensitivity analysis indicated that the overall
effect on the LCIA results for the ½” Regular GWB cradle-to-gate product system would be
marginally higher. With the exception of the smog potential indicator, the LCIA results for the
product system increased between 0% and 8%. In this sensitivity scenario, the FGD synthetic
gypsum is now contributing to an increase in the environmental burden as opposed to an offset
in the baseline result for the ½”Regular GWB cradle-to-gate product system. Similar conclusions
would be applicable to the 5/8” Type X GWB product system. This sensitivity analysis does not
call into question the validity of the ISO 14044:2006 recommended methodology for using a
“system expansion” approach, but rather indicates the power and appropriateness of this
methodology to solve the multi-functionality problem associated with the coal-fired power
generation process and thus, providing a reasonable estimate of the respective environmental
burden of electricity generation (determining product) and FGD synthetic gypsum (co-product).
Table 46. Sensitivity Analysis: Exclusion of “System Expansion Avoidance” Effect - ½” Regular GWB Product System– absolute basis, per MSF

Athena Institute
Life Cycle Assessment of ½” Regular and 5/8” Type X Gypsum Wallboard Products 112
6.3 Conclusions, limitations and recommendations
The study’s major conclusions for the two GWB finished product systems and each intermediate
reference flow input (natural gypsum extraction and gypsum paper production) is reported
below.
½” Regular and 5/8” Type X Gypsum Wallboard (cradle-to-gate)
• The manufacture of 1,000 sq. ft. of ½” Regular and 5/8” Type X GWB products embodies
about 4.05 GJ and 5.45 GJ of primary energy use. For both GWB product types, over
90% of the total primary energy were derived from non-renewable fossil fuels. Over
76% of the primary energy use was due to the “on-site” consumption of energy at the
GWB plants in the form of natural gas (73%), electricity (19%) and gasoline (8%) with
diesel and propane use making up less than 1%.
• The manufacture of 1,000 sq. ft. of ½” Regular and 5/8” Type X GWB products resulted to
233 kg and 315 kg (CO2 equivalent) of greenhouse gas emissions, respectively. On-site
energy use was also the primary source of the greenhouse gas emissions accounting for
over 78% of the total.
• Two major on-site energy flows used at GWB plants (natural gas and electricity) and the
input of gypsum paper were the three major contributing sources to the cradle-to-gate
life cycle impact assessment (LCIA) results for the two products of interest.
• On-site energy use was the single largest contributor to the majority of the LCIA category
results for the products of interest such as total primary energy, global warming,
acidification, respiratory effects, ozone depletion and smog and accounted; typically
accounting for greater than 70% of the total impact results across the two products.
• The input of gypsum paper was the next most consistent and significant contributor to
the majority of the LCIA category results (excluding abiotic resource depletion) and
ranged from 8% to 30% of the total impact results for the two product systems.
• Dry and wet additives in the production of GWB products accounted for 25% to 27% of
the total eutrophication potential impact. The contribution to the rest of the LCIA
category results ranged from 3% to 11% of the total impact results for the two product
systems.

Athena Institute
Life Cycle Assessment of ½” Regular and 5/8” Type X Gypsum Wallboard Products 113
• Inbound transportation of raw and ancillary materials and the outbound transportation of
wastes for treatment accounted for 32% to 33% of the smog potential. The contribution
to the rest of the LCIA category results ranged from 0% to 8% of the total impact results
for the two products.
• The contribution of the natural gypsum extraction system (both domestic & imported) to
the depletion of abiotic resources potential was 98%. The contribution to the rest of the
LCIA category results ranged from 0.3% to 8% of the total impact results for the two
products.
• The net impact of the FGD synthetic gypsum use resulted in a beneficial credit to the
product system due to the diversion or avoidance of landfilling FGD gypsum. With the
exception of the smog potential indicator, the reduction of the environmental burden
attributed to synthetic FGD gypsum use across the majority of the LCIA category results
was rather minimal (ranging between 1% and 8%).
• While on-site natural gas use, gypsum paper and on-site electricity use dominated the
resulting GWB environmental profile, an influence analysis indicated that 78% to 82% of
the total LCIA results are within the plant’s sphere of operational control. A sensitivity
analysis of “on-site energy use” indicated that plant energy use is about three times
more sensitive to the use of natural gas than electricity.
• The results indicated that the source location of the natural gypsum input (Canada or
Mexico) had a minimal influence (<1%) on the LCIA results reported for the ½” Regular
GWB product system. Similar conclusions are applicable to the 5/8” Type X GWB product
system.
• The results indicated that a 10% increase in the use of natural gypsum with a
corresponding decrease in the use of synthetic FGD gypsum would result in about a 2%
increase of the overall LCIA indicator results for the ½” Regular GWB product system
with the exception of the abiotic resource depletion and smog potential which would
increased by 20% and 9%, respectively. Similar conclusions are again applicable to the 5/8” Type X GWB product system.

Athena Institute
Life Cycle Assessment of ½” Regular and 5/8” Type X Gypsum Wallboard Products 114
Natural Gypsum Rock Extraction (cradle-to-gate)
• The total primary energy use in the manufacture of one short ton of natural gypsum ore
was 169 MJ and was dominated by the on-site energy use (90%), of which diesel,
natural gas and electricity use accounted for 46%, 44% and 10%, respectively.
• The production of each short ton of natural gypsum ore results in the emission of 11.4 kg
of greenhouse gases on a CO2 equivalent basis. On-site energy use was also the
primary source of the greenhouse gas emissions accounting for 83% of the total.
• On-site energy use was the major contributor to the acidification (94%), eutrophication
(86%) and smog potential indicators (96%).
• On-site processes were the largest main contributing process to the respiratory effects
indicator (89%), and abiotic depletion (100%), which is a direct impact of the crude
gypsum extraction and water use (99%).
Gypsum Paper Production (cradle-to-gate)
• The cradle-to-gate manufacture of gypsum paper is entirely based on the input of post-
industrial and consumer recycled papers, of which old corrugated container stock was
the primary raw material input.
• The manufacture of 1,000 sq. ft of backing and facing gypsum papers incorporates about
322 MJ and 345 MJ of primary energy, respectively. Over 90% of the primary energy
use was due to the consumption of energy at the gypsum paper plant in the form of
electricity (52%) and natural gas (47%) with diesel and propane use making up less than
1% of the total energy use.
• The manufacture of 1,000 sq. ft of backing and facing gypsum papers resulted in the
emission of 20 kg and 21 kg of greenhouse gases on a CO2 equivalent basis. On-site
energy use was also the primary source of the greenhouse gas emissions accounting for
90% of the total.
• On-site energy use was the major contributor to the acidification potential (over 92%),
respiratory effects (94%), smog (over 80%) and ozone depletion potential (94%).
• On-site processes and energy use were two main contributors to water use, over 50%
and 41% respectively. Waste disposal and treatment accounted for 50% of the
eutrophication impact primarily due to the treatment of effluent flows.

Athena Institute
Life Cycle Assessment of ½” Regular and 5/8” Type X Gypsum Wallboard Products 115
• Gypsum paper manufacturing involves numerous and varied chemical inputs; however,
these chemicals account for less than one percent of the total mass of inputs and were a
relatively minor contributor to the overall LCIA results for the manufacture of gypsum
papers with the exception of the abiotic depletion impact which amounted to over 55%.
Limitations
• Human toxicity and eco-toxicity impact categories related to the product systems studied
were not evaluated as these end-point LCIA measures were deemed as “optional”
measures in ISO 21930:2007 “Sustainability in Building Construction – Environmental
Declaration of Building Products”. It’s to be mentioned that “uncertainty” of the results
increases, often exponentially, with movement from mid-point to end-point measures.
Therefore, these end-point measures have been excluded from this study.
• Land use (and its occupation), as a possible impact category, was also not evaluated in
this LCA study. There is currently no North American based platform to collect or
measure these flows, let alone characterize them. So far, the US LCI generic datasets
used in this project do not report these flows. Furthermore, the land use and occupation
impact category is not advocated by ISO 21930:2007. Hence, for a number of reasons
land use was excluded from the scope of this study.
• This study scope was limited to a cradle-to-gate Life Cycle Assessment of ½” Regular
and 5/8” Type X GWB products and did not integrate the installation, maintenance, use
phase and end of life activity stages associated with the product system. Consequently,
the impact of these downstream life cycle activities is not captured in this LCA study.
Recommendations
• The journey toward sustainable development requires that businesses find innovative
ways to be profitable and at the same time improve the environmental performance of
production processes and products through:
- Cleaner production processess → Resource saving/ Margins
- Environmental management →Continual improvements/ Reputation
- Clean and sustainable products → Competitive advantage/ Revenues

Athena Institute
Life Cycle Assessment of ½” Regular and 5/8” Type X Gypsum Wallboard Products 116
Reducing the dependency on earth’s natural resources (e.g. natural gypsum ore) by
incorporating the FGD synthetic gypsum, which is diverted from landfill, contributes to an
improved environmental profile for GWB products. This sustainability aspect should be
further explored by taking into consideration the social and economic dimensions (“triple
bottom line”) of synthetic FGD gypsum use and how it has and may positively influence
the sustainability of the industry in the future.
• “On-site” energy conservation efforts at GWB facilities are strongly recommended. The
study results indicate that “on-site” energy use is the single largest contributor to the
overall LCIA results and these results are particularly sensitive to changes in on-site
energy use. More specifically, efforts to reduce natural gas use offer the most
immediate opportunity to improve the environmental performance of GWB plants and
products. Gypsum quarries conservation efforts should target the reduction of diesel fuel
and natural gas use. Gypsum paper plants energy conservation efforts should be
directed to the reduction of the electricity and natural gas use.
• As mentioned previously, the study’s scope was limited to the cradle-to-gate
manufacture of the two GWB products of interest. A logical expansion of the study
would be to extend it to a full cradle-to-grave assessment, which would better
demonstrate the full life cycle impact of these two GWB products by including their
respective service lives, possible recyclability and end-of-life. The possibility of having a
Gypsum Association level EPD prepared for the two products of interest is also
recommended.
Athena Institute
Life Cycle Assessment of ½” Regular and 5/8” Type X Gypsum Wallboard Products 117
7 References 1 ISO 14040:2006. Environmental Management – Life Cycle Assessment – Principles and
Framework.
2 ISO 14044:2006. Environmental Management – Life Cycle Assessment – Requirements and guidelines.
3 ISO 21930:2007. Sustainability in Building Construction – Environmental Declaration of Building Products.
4 ISO/TR 14049: Environmental management — Life cycle assessment — Examples of application of ISO 14041 to goal and scope definition and inventory analysis
5 ISO/TR 14047: Environmental management — Life cycle assessment- Examples of application of ISO 14042.
6 ASTM C1396 / C1396M - 09a- Standard Specification for Gypsum Board. http://www.astm.org/Standards/C1396.htm .
7 ASTM E119 - 10b- Standard Test Methods for Fire Tests of Building Construction and Materials. http://www.astm.org/Standards/E119.htm
8 Frischknecht, R. and N. Jungbluth (editors). 2004 Implementation of Life Cycle Impact Assessment Methods. Ecoinvent Report No. 34. Data V1.1. Dübendorf, Switzerland: Ecoinvent.
9 Leiden University. Guide on Environmental Life Cycle Assessment. Part 2B Operation Annex. 2001. Leiden, Netherlands: Leiden University.
10 Lundie, Sven, Andreas Ciroth, and Gjalt Huppes. 2007. Inventory Methods in LCA: Towards Consistency and Improvement. 135 pages. UNEP-SETAC Life Cycle Initiative, Life Cycle Inventory Program, Task Force 3: Methodological Consistency.
11 Robert D. Crangle, Jr. 2011 GYPSUM. 2009 Minerals Yearbook, U.S. Department of the Interior, U.S. Geological Survey. Table 5- Prefabricated Gypsum Products Sold or Used in the United States.
12 EPA-AP 42- Gypsum Manufacturing- Final report 2005. http://www.epa.gov/ttn/chief/ap42/ch11/final/c11s16.pdf
13 SimaPro v 7.3.0, LCA Software, PRé Consultants, 2011.
14 American Coal Ash Association, 2011, 2009 coal combustion product (CCP) production & use survey report: Aurora, CO, American Coal Ash Association, February 8, 1 p. (Accessed May 11, 2011, at http:// acaa.affiniscape.com/associations/8003/files/2009_CCP_Production_Use_ Survey_Corrected_020811.pdf).

Athena Institute
Life Cycle Assessment of ½” Regular and 5/8” Type X Gypsum Wallboard Products 118
15 Athena Institute (1997) Life Cycle Analysis of Gypsum Wallboard and Associated Finishing Products. Prepared by George J. Venta, Venta, Glaser and Associates.
16 Weidema, B 2001: Avoiding Co-Product Allocation in LCA, Journal of Industrial Ecology 4(3):11-33, 2001.
17 CALCAS Final Report 18, 2009 - CALCAS, Coordination Action for innovation in Life Cycle Analysis for Sustainability- Guidelines for application of deepened and broadened LCA http://www.estis.net/builder/includes/page.asp?site=calcas&page_id=8215FF89-5114-4748-BE6C-1F0F1E69DAF5
18 EPA 2008, Waste and Materials-Flow Benchmark Sector Report: Beneficial Use of Secondary Materials - Coal Combustion Products. Economics, Methods, and Risk Analysis Division, Office of Solid Waste, Office of Solid Waste and Emergency Response, U.S. Environmental Protection Agency, Washington, D.C. 20460.
19 Ecoinvent Report No. 6 2007, Coal, Appendix 16, Coal Energy Chain in USA, pg 288-301
20 US LCI Database. Maintained by National Renewable Energy Laboratory. http://www.nrel.gov/lci/.
21 Bare Jane C, and others. 2003. TRACI- The Tool for the Reduction and Assessment of Chemical and Other Environmental Impacts, Journal of Industrial Ecology, Volume 6, Number 3–4.
22 European Commission - Joint Research Centre - Institute for Environment and Sustainability: International Reference Life Cycle Data System (ILCD) Handbook - General guide for Life Cycle Assessment - Detailed guidance. First edition March 2010. EUR 24708 EN. Luxembourg. Publications Office of the European Union; 2010 (http://lct.jrc.ec.europa.eu/assessment/publications)
23 Jeroen B. Guinée, Reinout Heijungs and Gjalt Huppes: Economic Allocation: Examples and Derived Decision Tree, Int J LCA 9 (1) 23 – 33 (2004).

Athena Institute
Life Cycle Assessment of ½” Regular and 5/8” Type X Gypsum Wallboard Products 119
Appendices

Athena Institute
Life Cycle Assessment of ½” Regular and 5/8” Type X Gypsum Wallboard Products 120
Appendix A : Case Studies on Allocation Procedures Figure A.1 depicts the ISO recommended stepwise allocation procedures as per Clause 4.3.4.2,
ISO 14044:2006.
Figure A.1 Overview of the allocation procedures
ISO recommends as step 1.1 to avoid allocation by “dividing” the unit process into two or more
sub-processes. “Dividing” can be applied for example to products whose manufacture is not
intrinsically linked (see Example A.1 below).
Example A.1
ISO 14049: 2000 presents a case study of “dividing” the coating process (see blue line) in two
sub-processes, chromium and organic coating (see red lines) to avoid allocation (see Figure

Athena Institute
Life Cycle Assessment of ½” Regular and 5/8” Type X Gypsum Wallboard Products 121
A.2). In this case, if the data are collected for the coating line in general, it will be required to
allocate the environmental inputs and outputs between the two lines. Allocation is avoided
through division of coating process in two sub-processes and collection of LCI data separately
for chromium and organic coating sub-processes.
Figure A.2 System where allocation may be avoided through a more precise data collection and
dividing into two different subsystems [4].
If the Step 1.1 is not applicable, then ISO recommends step 1.2 to avoid allocation by “system
expansion”. ISO 14049:2000 provides some examples of allocation avoidance by expanding
system boundaries (see Section 6.4, 8.3.1, 8.3.2), but these are primarily intended for the LCA
practitioners and not for public.
Based on the data availability and the product system, allocation cannot always be avoided;
therefore, ISO recommends Step 2 and 3 to solve the “multi-functionality” of processes.
Allocation factors have to be calculated to share the input/output data to product and the co-
products in a way that reflects either the physical or economic relationships between them.
Step 2 should determine whether a physical parameter can be identified as a basis for
calculating the allocation factor. Any physical parameter, e.g., mass, feedstock energy, thermal
conductivity, viscosity, specific mass, etc., could be taken into consideration in order to identify

Athena Institute
Life Cycle Assessment of ½” Regular and 5/8” Type X Gypsum Wallboard Products 122
the physical parameter which reflects the underlying physical relationship between product and
the other co-products [4].
Physical allocation is possible if the ratio between product A and product B can be varied
without changing the inputs and outputs (see example A.2 below).
Example A.2
A lorry is loaded with steel and copper metal parts. Total maximum load mass of transportation
is 20 tones, which consists of 5 tons steel (25% by mass) and 15 tons copper parts (75% by
mass). Amount of diesel consumption for the total transportation distance is 100 liters. The LCA
study requires the relevant data for steel parts only.
If the ratio between the steel and copper parts can be changed without changing the total mass
of 20 tons, then the inputs and outputs (e.g. amount of diesel and air emissions) also will remain
constant. This can be established e.g. the rate can be changed to 10 tons steel and 10 tons
copper parts and the lorry will consume the same amount of diesel of 100 liters.
Therefore, “mass” of metal parts can be considered as the pure physical parameter. Based on
that, 25% percent of the total environmental load of the transportation can be allocated to steel
parts and the remaining 75% to copper parts8.
Example A.3
This example shows a case where “mass” is not the correct physical parameter but instead the
“surface” of the product is [4].
Two different metal parts A and B are lacquered on the same paint line9. The lacquer
consumption, the energy inputs, and the emissions of volatile organic compounds (VOC), etc.,
are only known for the combined lacquering. The LCA study requires the relevant data for
product A only. 8 Examples on pure physical relationships are also provided in ISO 14049:2000, but these are primarly intended for the LCA practicioners and not for public. 9 This is an example presented in ISO 14041 and referenced in ISO/TR 14049: 2000.

Athena Institute
Life Cycle Assessment of ½” Regular and 5/8” Type X Gypsum Wallboard Products 123
In this case, allocation can be avoided by performing an experimental run where only product A
is lacquered. If there are technical or economic reasons why such a test run cannot take place,
then allocation is necessary.
Physical allocation is possible if the ratio between product A and product B can be varied
without changing the inputs and outputs.
- If the ratio between A and B is changed without changing the sum of the “masses” of A
and B this can result in different quantities of lacquer, hence mass allocation is not correct.
- If the ratio between A and B can be changed without changing the sum of the “surfaces”
to be lacquered, then the inputs and outputs also will remain constant.
Therefore, “surface” of metal parts can be considered as the pure physical parameter. The
allocation factor can be calculated as the surface to be lacquered of all parts of A divided by the
total surface to be lacquered of all parts (A plus B) which are lacquered in the same time period.
Example A.2 and A.3 show cases where a physical parameter (either mass or surface) can be
identified as a basis for calculating the allocation factors.
There are product systems or processes where the ratio between the product and co-products
cannot be varied without changing the inputs and outputs, which indicates that the pure physical
allocation cannot be applied.
Example A.4
ISO 14049:2000 provides the example of bitumen production system as a typical case study
where pure physical allocation cannot be applied (see Section 7.3.2). Bitumen is produced from
petroleum refineries as well as other co-products such as gasoline, kerosene, gas oil and fuel
oil. The refinery process may yield to 5% mass fraction of bitumen and 95% mass fraction of
other co-products.
The ratio between the mass of bitumen and the mass of other co-products can only be varied in
a small range, which involves significant change of the process parameters including energy
consumption. In such a case, any physical parameter, e.g., mass, feedstock energy, thermal

Athena Institute
Life Cycle Assessment of ½” Regular and 5/8” Type X Gypsum Wallboard Products 124
conductivity, viscosity, specific mass, etc., could be taken into consideration in order to identify
the physical parameter which reflects the underlying physical relationship between bitumen and
the other co-products. Mass has sometimes been applied in the case, but none of all those
parameters can be justified to be preferable to the other ones. The fact that in this example the
ratio between the bitumen and the other co-products cannot be varied indicates that the
physical allocation cannot be applied.
Therefore, the third choice proposed in ISO 14044, i.e., the economic allocation can be applied.
In this method, for example, the total environmental burden of the manufacturing process is
"shared" between the product and co-products according to total proceeds of the multi-
functional process. The proceeds are based on “prices” per unit of product and co-products.
Furthermore, ISO recommends that some outputs may be partly co-products and partly waste.
In such cases, it is necessary to identify the ratio between co-products and waste since the
inputs and outputs shall be allocated to the co-products part only [2].
Example A.5
Figure A.3 shows the example used by Guinee et. al 2004 [23] on co-production of caustic soda
(NaOH), chlorine (Cl2) and hydrogen (H2) – a classical example of application of economic
allocation.

Athena Institute
Life Cycle Assessment of ½” Regular and 5/8” Type X Gypsum Wallboard Products 125
Figure A.3 Co-production process of caustic soda, chlorine and hydrogen (numbers are
hypothetical [23]
The functional flows (product and co-products) are caustic soda, chlorine and hydrogen. By
assuming the quantities, prices and proceeds stated in Table A.1, allocation factors (α, β and γ)
can be calculated. Input and output flows (11.7 kg sodium chloride and 0.001 kg hydrogen
chloride) should be allocated to the three functional flows.
Table A.1 Co-production process of caustic soda, chlorine and hydrogen (numbers are
hypothetical [23]
Function flow Quantity Price ($/unit) Proceeds Allocation factor
NaOH (product; kg) 8 1.65 13.20 0.698 (α)
Cl2 (co-product; kg) 7.1 0.80 5.68 0.301 (β)
H2 (co-product; kg) 0.2 0.10 0.02 0.001 (γ)
Total - - 18.90 1.00
Note: All numbers are hypothetical and the original table was adjusted for simplification.

Athena Institute
Life Cycle Assessment of ½” Regular and 5/8” Type X Gypsum Wallboard Products 126
Table A.2 shows that the 100% rule counts for economic allocation: for each flow, the quantities
of the mono-functional processes together precisely constitute the original quantity of the multi-
functional processes for that specific flow. Of final interest is that one should distinguish
between the allocation of a multi-functional process and the ratios in which mono-functional
processes participate in each of the separated systems. Figure A.4 illustrates how the multi-
functional electrolysis process can be allocated into three different mono-functional processes
[23].
Table A.2 The unallocated multi-functional and the allocated mono-functional process data for
the electrolysis of sodium chloride [23]
Function flow Multi-functional process
Mono-functional NaOH production
Mono-functional Cl2 production
Mono-functional H2 production
NaCl (input; kg) 11.7 0.698× 11.7 = 8.17 0.301 × 11.7 = 3.52 0.001 × 11.7 = 0.01
HCl (output: kg) 1E-03 0.698× 1E-03= 6.98E-04 0.301 × 1E-03 = 3.01E-04 0.001 × 1E-03 = 1E-06
NaOH (product; kg) 8 8 0 0
Cl2 (co-product; kg) 7.1 0 7.1 0
H2 (co-product; kg) 0.2 0 0 0.2
Note: The original table was adjusted for simplification.
Figure A.4 Application of the economic allocation rules for the electrolysis of NaCl multi-
functional process [23]

Athena Institute
Life Cycle Assessment of ½” Regular and 5/8” Type X Gypsum Wallboard Products 127
Appendix B: Critical Review Report

Athena Institute
Life Cycle Assessment of ½” Regular and 5/8” Type X Gypsum Wallboard Products 128

Athena Institute
Life Cycle Assessment of ½” Regular and 5/8” Type X Gypsum Wallboard Products 129

Athena Institute
Life Cycle Assessment of ½” Regular and 5/8” Type X Gypsum Wallboard Products 130

Athena Institute
Life Cycle Assessment of ½” Regular and 5/8” Type X Gypsum Wallboard Products 131

Athena Institute
Life Cycle Assessment of ½” Regular and 5/8” Type X Gypsum Wallboard Products 132
Responses to recommendations
The LCA team is in full agreement with the critical review report and appreciates the reviewer’s
comments and recommendation.
As mentioned in Section 3.5- Data Quality, this LCA study uses 100% the life cycle inventories
of the US LCI Database, 2010 (publicly available) and US adjusted European ecoinvent v.2.2
LCI database (“US-EI”), 2010- the best available LCI databases; both of which are incorporated
in the SimaPro v.7.3.0 LCA Software, March 2011. Given the extremely high number of life
cycle inventories used in this particular project would not be possible to list all these inventories
individually. Table 3 provides a summary of key primary and secondary LCI data sources.
Furthermore, due to confidentiality agreements with the GA participating plants the chemical
names for the main types of chemicals used, such as sizing agents, retention chemicals,
polymer emulsifier, dyes, defoamer, water treatment chemicals, retarder, dispersant etc. can’t
be revealed but were individually modeled as per MSDS and were followed back to nature. It’s
also to be noted that there’s no ISO requirement to list all the Life Cycle Inventories used in the
project. A fully transparent LCI modeling is documented in the Gypsum Association (GA) Sima
Pro LCI Database 2011.
Recommended