A Dual-Readout F2 Assay That CombinesFluorescence Resonance Energy Transferand Fluorescence Polarization for MonitoringBimolecular Interactions
Yuhong Du,1,* Zaneta Nikolovska-Coleska,2,* Min Qui,1 Lian Li,1
Iestyn Lewis,1 Raymond Dingledine,1 Jeanne A. Stuckey,3,4
Krzysztof Krajewski,5 Peter P. Roller,5 Shaomeng Wang,6
and Haian Fu1,7
1Department of Pharmacology and Emory Chemical BiologyDiscovery Center, Emory University School of Medicine,Atlanta, Georgia.Departments of 2Pathology and 4Biological Chemistry; 3LifeSciences Institute; 6Departments of Internal Medicine andMedicinal Chemistry, University of Michigan ComprehensiveCancer Center; University of Michigan, Ann Arbor, Michigan.5Laboratory of Medicinal Chemistry, National Cancer Institute-Frederick, National Institutes of Health, Frederick, Maryland.7Winship Cancer Institute, Emory University, Atlanta, Georgia.*These two authors contributed equally to this work.
ABSTRACTForster (fluorescence) resonance energy transfer (FRET) and fluores-
cence polarization (FP) are widely used technologies for monitoring
bimolecular interactions and have been extensively used in high-
throughput screening (HTS) for probe and drug discovery. Despite their
popularity in HTS, it has been recognized that different assay tech-
nologies may generate different hit lists for the same biochemical
interaction. Due to the high cost of large-scale HTS campaigns, one
has to make a critical choice to employee one assay platform for a
particular HTS. Here we report the design and development of a dual-
readout HTS assay that combines two assay technologies into one
system using the Mcl-1 and Noxa BH3 peptide interaction as a model
system. In this system, both FP and FRET signals were simultaneously
monitored from one reaction, which is termed ‘‘Dual-Readout F2 as-
say’’ with F2 for FP and FRET. This dual-readout technology has been
optimized in a 1,536-well ultra-HTS format for the discovery of Mcl-1
protein inhibitors and achieved a robust performance. This F2 assay
was further validated by screening a library of 102,255 compounds. As
two assay platforms are utilized for the same target simultaneously,
hit information is enriched without increasing the screening cost. This
strategy can be generally extended to other FP-based assays and is
expected to enrich primary HTS information and enhance the hit
quality of HTS campaigns.
INTRODUCTION
Protein–protein interactions are involved in the control of
diverse physiological and pathological processes in living
organisms such as cell apoptosis and proliferation, which
represent an emerging class of molecular targets for
novel drug discovery.1 To monitor molecular interactions, a
number of assay technologies have been developed, such as time-
resolved Forster (or fluorescence) resonance energy transfer
(TR-FRET), fluorescence polarization (FP), and surface plasmon
resonance.2–5 These assay technologies, particularly in homoge-
nous format, have been extensively used in high-throughput
screening (HTS) campaigns for the identification of new chemical
entities in the drug discovery field and new molecular probes for
chemical biology studies.5 However, the application of different
assay technologies often gives rise to different hit lists even when
monitoring the same biochemical interaction. Because of the high
cost of screening large chemical libraries, HTS campaigns are
often conducted in a single-point format and investigators are
forced to choose a single-assay technology. To enhance the ef-
ficiency of HTS campaigns, we have designed and developed a
novel HTS technology that allows the generation of two HTS
readouts from one reaction by combining FRET and FP technol-
ogies into one platform. This technology is termed dual-readout
F2 assay, where F2 standing for FRET and FP. We have fur-
ther miniaturized the F2 assay to a 1,536-well ultra-HTS (uHTS)
ABBREVIATIONS: DMSO, dimethyl sulfoxide; FI, fluorescence intensity; FOC, fold of control; FP, fluorescence polarization; HTS, high-throughput screening; mP, milli-
polarization; S/B, signal-to-background ratio; SD, standard deviation; S/N, signal-to-noise ratio; TMR, 5/6-carboxytetramethyl-rhodamine; TR-FRET, time-resolved
fluorescence resonance energy transfer; uHTS, ultra high-throughput screening.
382 ASSAY and Drug Development Technologies AUGUST 2011 DOI: 10.1089/adt .2010.0292
format. To provide a proof of concept, this F2 uHTS assay tech-
nology was used to monitor the interaction of Mcl-1 and Noxa for
the eventual goal of discovering the next generation of small
molecule modulators of apoptosis.
Apoptosis, or programmed cell death, is a critical process in both
development and homeostasis of multicellular organisms.6 Altera-
tions in apoptotic pathways can disrupt the delicate balance between
cell proliferation and cell death and lead to a variety of diseases.6,7
Mcl-1 belongs to the prosurvival Bcl-2 subfamily along with Bcl-XL,
Bcl-2, Bcl-w, and A1.7–9 Mcl-1 is overexpressed in many human
cancers and its overexpression contributes to chemoresistance and
disease relapse.10–12 Recently, a number of groups have reported the
discovery of small-molecules known as BH3 mimetics, which induce
apoptosis by inhibiting antiapoptotic Bcl-2 family members.13–23
This family of molecules demonstrates a wide range of both potency
and selectivity for different antiapoptotic Bcl-2 proteins. However,
there is still a need for developing BH3 mimetics that can efficiently
and selectively target Mcl-1 protein.
One of the essential elements in discovering and identifying small-
molecule Mcl-1 inhibitors is the development of a robust, quantitative,
and high-throughput assay for evaluation of the binding affinities of
potential small molecule inhibitors. In vitro binding studies have
demonstrated that BH3 peptides from pro-apoptotic proteins exhibit
preferences in binding to anti-apoptotic proteins (Bcl-2, Bcl-xL, and
Mcl-1).24 Noxa BH3 peptide is highly selective for Mcl-1 and Bcl-2A1
proteins (within the nM range) but does not bind detectably to the other
members of this family (>100mM).24 Recently published structures of
Mcl-1 in complex with the Noxa and Puma BH3 domains demonstrate
that Noxa specifically targets Mcl-1 and exploits a basic patch unique
to the Mcl-1 sequence.25 These interactions between Mcl-1 and the
Noxa BH3 peptide form the basis for the design of the dual-readout F2
assay, which can be used to screen for small molecule inhibitors that
selectively disrupt the interaction of Mcl-1 protein and Noxa.
MATERIALS AND METHODSPeptides
All the peptides were synthesized at Emory Microchemistry and
Proteomic Facility. The 26-mer Noxa peptide (residues 18–43:
PAELEVECATQLRRFGDKLNFRQKLL-NH2) used in this study was
synthesized and labeled with 5/6-carboxytetramethyl-rhodamine
(TMR). The nonlabeled Noxa peptide and 21-residue Bid-BH3 peptide
(residues 79–99; QEDIIRNIARHLAQVGDSMDR-NH2) were synthe-
sized and used as peptide antagonists.
Expression and Purification of RecombinantMcl-1 Protein
Human Mcl-1 cDNA was purchased from Origene. The Mcl-1
fragment, amino acid residues 171–327, was cloned into the pHis-
TEV vector (a modified pET vector) through BamHI and EcoRI
sites, using the oligonucleotides: 5’-CGGGATCCGAGGACGAGTT
GTACCG-GCAG-3’ and 5’-GGAATTCCTAGCCAC-CTTCTAGGTCCTC
TAC-3’. Mcl-1 protein with an N-terminal 6xHis tag was produced in
Escherichia coli BL21 (DE3) cells. Cells were grown at 378C in 2xYT
containing antibiotics to an OD600 of 0.6. Protein expression was in-
duced by 0.4mM isopropyl b-D-1-thiogalactopyranoside at 378C for
4h. Cells were lysed in 50mM Tris pH 8.0 buffer containing 500mM
NaCl, 0.1% bME, and 40mL of Leupeptin/Aprotin. Mcl-1 protein was
purified from the soluble fraction using Ni-NTA resin (Qiagen), fol-
lowing the manufacturer’s instructions. The protein was further purified
on a Source Q15 column (resin and column are from Amersham Bios-
ciences) in 25mM Tris pH 8.0 buffer, with NaCl gradient. The purified
recombinant Mcl-1 protein was stored at �808C in following buffer:
25 mM Tris pH 8.0, 100 mM NaCl, 5 mM DTT, and 25% glycerol.
Dual FRET/FP MeasurementsTR-FRET and FP measurements were performed using black
1,536-well plates (Corning Costar, Cat# 3724) in an Envision Mul-
tilabel plate reader (Perkin Elmer Life Sciences). To each well, a
mixture of TMR-Noxa peptide, Mcl-1 protein, and terbium-anti-His
antibody (His-Tb) were added to a final volume of 5 mL in the assay
buffer (20 mM Tris buffer, pH 7.5, 50 mM NaCl, and 0.01% NP40). The
TR-FRET and FP signals were measured from the same well either in
TR-FRET or FP module with an Envision Multilabel plate reader.
In the TR-FRET readout, Mcl-1 protein with a 6xHis tag was
indirectly labeled with the terbium through a terbium-conjugated
anti-6xHis antibody (LanthaScreen�; Invitrogen). Terbium and
rhodamine comprise a fluorescence energy transfer pair. Interaction
of Mcl-1 protein with TMR-Noxa peptide brings two conjugated
fluorophores into proximity, leading to an energy transfer from
terbium to rhodamine and the generation of FRET signals (Fig. 1).
FRET signal is detected in an Envision Multilabel plate reader with a
laser excitation at 337 nm, and emission at 545–7 and 572–7.5 nm to
measure the fluorescence signal from terbium and rhodamine, with a
dual-dichroic mirror at 400/555 nm. The delay time is set at 100 ms.
The TR-FRET signal is expressed as TR-FRET signal ratio: F572/
F545 nm · 104, where F572 and F545 nm are fluorescence counts
at 572 and 545 nm for rhodamine and terbium, respectively. The
TR-FRET signal window was calculated as the difference between the
TR-FRET signal values for bound TMR-Noxa (TMR-Noxa peptide
with Mcl-1) and the TR-FRET signal values for the free TMR-Noxa
(TMR-Noxa peptide only without Mcl-1).
In the FP readout, the same reaction mixtures for TR-FRET readout
were used to measure the FP signals using the FP module (Fig. 1). The
binding of the Mcl-1 protein to rhodamine-labeled Noxa-peptide
slows down the rotation of the TMR-Noxa peptide and generates the
FP signal upon excitation by a polarized light.26 The assay wells for
FP readout were the same as for TR-FRET experiment. For TMR-Noxa
peptide, an excitation filter at 531–25 nm and dual-emission filters
(p and s) at 595–60 nm were used with a dual-dichroic mirror at 555/
595 nm. All FP signals were recorded and expressed as milli-
polarization (mP) units. The FP assay window was calculated by
subtracting the mP values recorded for free TMR-Noxa peptide from
mP values recorded for bounded TMR-Noxa peptide in the presence
of Mcl-1 protein. The FP data were corrected with G factor as opti-
mized for the Envision Multilabel plate reader to avoid instrument
artifacts as recommended.27,28
A DUAL-READOUT ASSAY FOR HTS
ª M A R Y A N N L I E B E R T , I N C . . VOL. 9 NO. 4 . AUGUST 2011 ASSAY and Drug Development Technologies 383
Development and Optimization of the Dual-ReadoutF2 Assay for Mcl-1 Protein
The key point for the dual F2 assay development was to determine
the concentrations of the binding partners at the optimal conditions
for both readouts. We first determined the optimal concentrations of
the TMR-Noxa peptide. Increasing concentrations of TMR-Noxa
peptide with terbium-anti-His antibody (2 nM) were mixed with
buffer in the presence or absence of Mcl-1 protein (50 nM). A 5 mL of
the mixture was dispensed to each well of 1,536-well plates. The dual
TR-FRET/FP measurements were then performed as described above.
To determine the equilibrium binding of TMR-Noxa peptide and
Mcl-1 protein using dual TR-FRET and FP measurements, increasing
amounts of Mcl-1 protein were incubated with TMR-Noxa peptide
(125 nM) terbium-anti-His antibody (2 nM) at room temperature for
1 h. The dual TR-FRET and FP measurements were performed as
described above. All experimental data were analyzed using Prism
5.0 software (Graphpad Software) and the IC50s were determined by
nonlinear curve fitting as the concentration of the Mcl-1 protein at
which 50% of the ligand is bound.
Assay Validation with Unlabeled Peptide Antagonistsin the Dual TR-FRET/FP Assay
To verify the specificity of the dual TR-FRET/FP Mcl-1 binding
assay, two peptide antagonists, nonlabeled Noxa and Bid peptides,
were used to test their ability to compete with the binding of TMR-
Noxa peptide to Mcl-1 protein measured by the dual TR-FRET and FP.
An increasing concentration of nonlabeled Noxa (0.5 mL) or Bid
peptide diluted in dimethyl sulfoxide (DMSO) was added to 4.5 mL of
the reaction containing Mcl-1 protein (62.5 nM), TMR-Noxa peptide
(125 nM), and terbium-anti-His antibody (2 nM). After incubating at
room temperature for 1 h, the TR-FRET and FP signals were mea-
sured. For each assay, background reaction (in the absence of Mcl-1)
and control reaction (containing vehicle, DMSO, without competition
peptide) were included in each assay plate. The competitive effect of
the peptides on binding was expressed as percentage of control TR-
FRET or FP signal as the following:
% of control¼ [(Signalpeptide� Signalbackground)=(Signalcontrol
� Signalbackground)] · 100
Data were plotted against log10 values of peptide concentrations
and analyzed using Prism 5.0 software (Graphpad Software). IC50
values were determined by nonlinear curve fitting as the concen-
trations of the peptides at which 50% of control FRET or FP signal
was inhibited.
High-Throughput Assay PerformanceTo evaluate the quality and suitability of the dual-readout F2
Mcl-1 binding assay for HTS, the Z’ factor was calculated for both
TR-FRET and FP measurement based on the following equation: Z’factor¼ 1–(3SDbþ 3SDf)/(mb – mf), where SDb and SDf are the stan-
dard deviations for bound (b) and free (f) peptides without Mcl-1
protein, whereas mb and mf are the mean FRET or FP signals for bound
and free peptides, respectively. The Z’ factor reflects the quality of the
assay itself without intervention of test compounds. To monitor assay
sensitivity, the signal-to-noise ratio (S/N) was calculated for FP mea-
surement as follows: S/N¼ (mb – mf)/
(SD2bþ SD2
f)0.5 and the signal-to-
background ratio (S/B) was deter-
mined for TR-FRET assay using the
following equation: S/B¼ mb/mf.
Validation of the Dual-ReadoutF2 Assay in 1,536-Well uHTSFormat
For the validation of the dual-
readout F2 assay in uHTS format, a
library of 102,255 compounds from
Molecular Library Screening Center
Network was tested. About 4.5 mL of
assay reaction buffer that contains
Mcl-1 protein (62.5 nM), TMR-Noxa
(125 nM), and terbium-anti-His
(2 nM) was dispensed into 1,536-well
assay plates using a MultiDrop
Combi (Thermo-Fisher Scientific).
Then, compounds (0.1 mL; 1 mM in
100% DMSO) in 384-well storage
plates (Corning) were transferred to
1,536-well assay plates using a Pin-
Tool (VP Scientific) integrated with
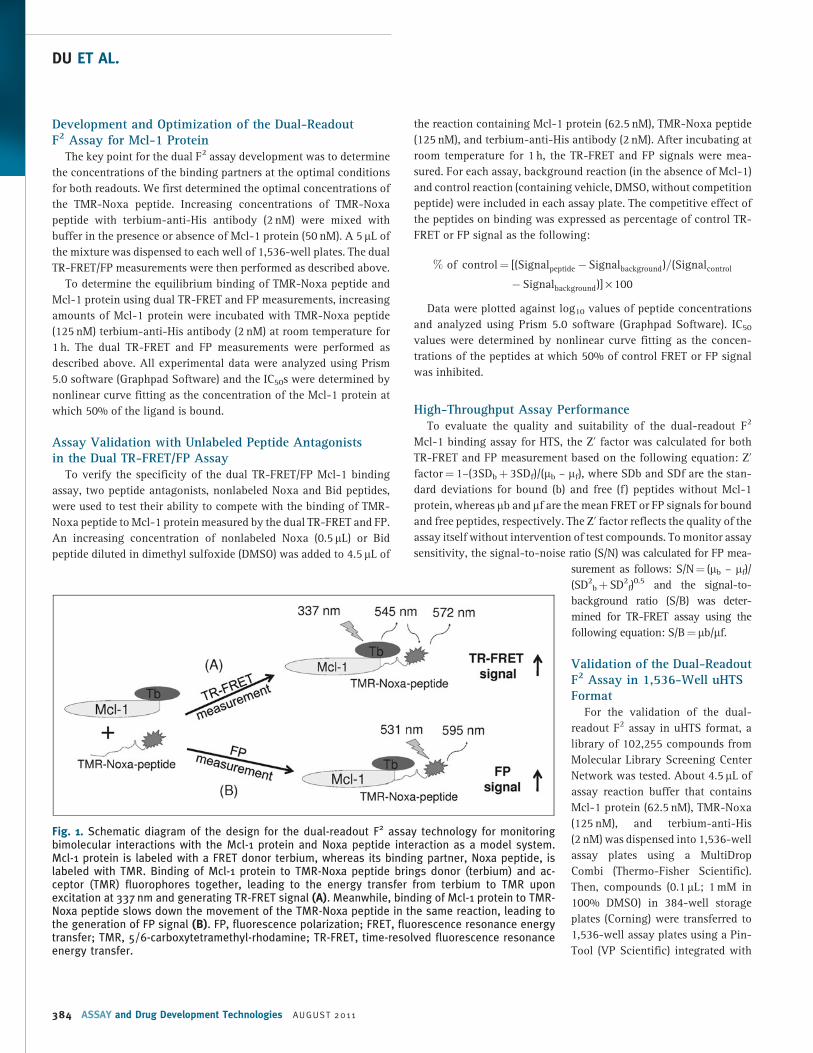
Fig. 1. Schematic diagram of the design for the dual-readout F2 assay technology for monitoringbimolecular interactions with the Mcl-1 protein and Noxa peptide interaction as a model system.Mcl-1 protein is labeled with a FRET donor terbium, whereas its binding partner, Noxa peptide, islabeled with TMR. Binding of Mcl-1 protein to TMR-Noxa peptide brings donor (terbium) and ac-ceptor (TMR) fluorophores together, leading to the energy transfer from terbium to TMR uponexcitation at 337 nm and generating TR-FRET signal (A). Meanwhile, binding of Mcl-1 protein to TMR-Noxa peptide slows down the movement of the TMR-Noxa peptide in the same reaction, leading tothe generation of FP signal (B). FP, fluorescence polarization; FRET, fluorescence resonance energytransfer; TMR, 5/6-carboxytetramethyl-rhodamine; TR-FRET, time-resolved fluorescence resonanceenergy transfer.
DU ET AL.
384 ASSAY and Drug Development Technologies AU GUST 2011
Beckman NX liquid handler (Beckman Coulter). The reactions were
mixed thoroughly using the shaker integrated with BeckmanNX and
incubated at room temperature for 1 h. The plates were delivered
through integrated robotic systems to the Envision multimode reader
as described above for recording TR-FRET and FP signals. Screening
data were analyzed using the CambridgeSoft Software (Cam-
bridgeSoft Corporation).
RESULTS AND DISCUSSIONSDesign of the Dual-Readout F2 Assay
FRET and FP are two most widely used fluorescence-based ho-
mogenous HTS technologies for monitoring bimolecular interac-
tions. FRET is a nonradioactive, photophysical effect in which energy
that is absorbed by a donor fluorophore is transferred to an acceptor
fluorophore.29 Energy transfer from donor to acceptor fluorophores
occurs when (1) the emission spectrum of the donor fluorophore
significantly overlaps with the absorption spectrum of the acceptor
fluorophore; (2) the donor and acceptor transition dipole orientations
are approximately parallel; and (3) the donor and acceptor molecules
are in close proximity (10–100 A). By coupling the donor and ac-
ceptor fluorophores to two interacting molecules, the fluorophores
may be brought into close proximity and induce a FRET signal. The
attractive feature of TR-FRET is the time delay of the signal mea-
surement, which reduces the prompt autofluorescence from tested
library compounds. FP is a sensitive nonradioactive technique for the
study of biomolecular interactions in solution. When fluorescent
small molecules (such as tagged peptides) in solution are bound by
large molecules (such as a protein), the movement of the resulting
complex becomes slower. In this way, the binding of a fluorescently
labeled peptide to a protein can be monitored by the change in
emitted polarization signals.
TR-FRET or FP assay format is usually employed individually for a
specific HTS campaign. However, it is well documented that different
assay and detection technologies, such as FRET versus FP, can gen-
erate quite different hit lists for the same biochemical interaction.30–32
To enhance the quality of the hit list from primary screens, this study
evaluated the feasibility of combining two assay formats, FRET and
FP, into one HTS reaction, in which both FRET and FP signals were
read from the same well. The Mcl-1 and Noxa interaction involved in
apoptosis regulation was used as a model system. For the F2 assay
design, epitope-tagged Mcl-1 protein is indirectly labeled with a TR-
FRET donor, terbium, through terbium-conjugated anti-epitope-
antibody (Fig. 1). Noxa peptide is directly labeled with a corresponding
acceptor fluorophore, TMR, for terbium pairing in this case. For the
TR-FRET readout, the binding of TMR-labeled Noxa peptide to Mcl-1
bring donor (terbium) and acceptor (TMR) into proximity, leading to
the energy transfer from terbium to TMR upon excitation and the
generation of the FRET signal, which can be detected at 572 nm. The
same TMR-labeled Noxa peptide used as TR-FRET acceptor serves as
fluorescence tracer in the FP readout. The TMR-Noxa-peptide is
relatively small and rotates faster in the solution. Upon excitation
with plane-polarized light, the emitted light is random and results in
a lower FP signal. Whereas, binding of TMR-Noxa peptide to the large
Mcl-1 protein slows down the movement of the TMR-Noxa peptide,
leading to the emission of polarized light and an increased FP signal.
Thus, both TR-FRET and FP signals can be obtained from the same
reaction without the need of additional reagents. As expected, ad-
dition of antagonists or compounds that disrupt the Mcl-1/Noxa
complex formation will result in lowered signals in both TR-FRET
and FP readouts.
Dual-Readout F2 Assay DevelopmentAnalysis and optimization of TMR-labeled Noxa peptide in the dual-
assay platform. The key point for the successful dual TR-FRET/FP
assay is to choose the assay conditions optimal for both assays in
the same reaction. We first evaluated the concentrations of TMR-
Noxa-peptide optimal for the dual measurements. Increasing con-
centrations of TMR-Noxa-peptide were mixed with constant amount
of terbium-anti-His antibody in the presence or absence of Mcl-1
protein (50 nM). Five microliters of the mixture was transferred to a
1,536-well plate, and TR-FRET signal, FP signal, and fluorescence
intensity (FI) for TMR-labeled Noxa peptide were measured using the
Envision plate reader. For FP measurement, the tracer’s fluorescent
quantum yield has to be significantly higher than that of the back-
ground (buffer) itself.33 As shown in Figure 2A, as low as 4 nM of
TMR-Noxa-peptide alone, the FI signal from tracer is >15 times
higher than background from buffer-only wells and reached about
1,100 times higher at 250 nM of the tracer. At around 500 nM of
TMR-Noxa peptide, the detected FI signal was saturated and reached
the maximum detection limitation using the current reader settings,
which already generated a wide range of signal window between 1
and 1,100 times. As a control, the FI was not significantly changed in
the presence of Mcl-1 protein. The addition of Mcl-1 protein (50 nM)
to increasing concentrations of TMR-Noxa peptide resulted in an
increased FP signal (Fig. 2B). The maximum FP assay window was
78.8 mp at 31.3 nM of TMR-Noxa peptide. Further increasing the
TMR-Noxa peptide to 125 nM resulted in a decrease in the FP signal
window. The estimated Kd for the binding of TMR-Noxa peptide to
50 nM of Mcl-1 protein is about 2.6 nM.
We then measured the TR-FRET signal for the same reaction in the
same wells used for FP measurement. As shown in Figure 2C, in the
presence of 50 nM of Mcl-1 protein, increasing TMR-Noxa peptide
led to a dose-dependent increase in TR-FRET signals. The maximum
FRET signal window is about 2,300. TMR-Noxa peptide alone in the
absence of Mcl-1 protein gave minimal FRET signal. The Kd for the
binding of TMR-Noxa peptide to 50 nM of Mcl-1 in the TR-FRET
measurement is *85.5 nM. This result is consistent with reported
binding affinity of Noxa BH3 peptide,24 as well as with our results
obtained with surface plasmon resonance direct binding assay (Kd of
72 nM), and FP-based competitive assay (Ki¼ 97 nM) (data not
shown).
The goal of the designed dual-readout F2 assay is to provide a
multiplexed assay platform that is simple for routine use as well as
applicable for HTS or uHTS. Therefore, we evaluated the dual-readout
assay performance through assessing its Z’ factor in both TR-FRET
and FP measurement, S/B of the TR-FRET read, and S/N of the FP
A DUAL-READOUT ASSAY FOR HTS
ª M A R Y A N N L I E B E R T , IN C . . VOL. 9 NO. 4 . AUGUST 2011 ASSAY and Drug Development Technologies 385
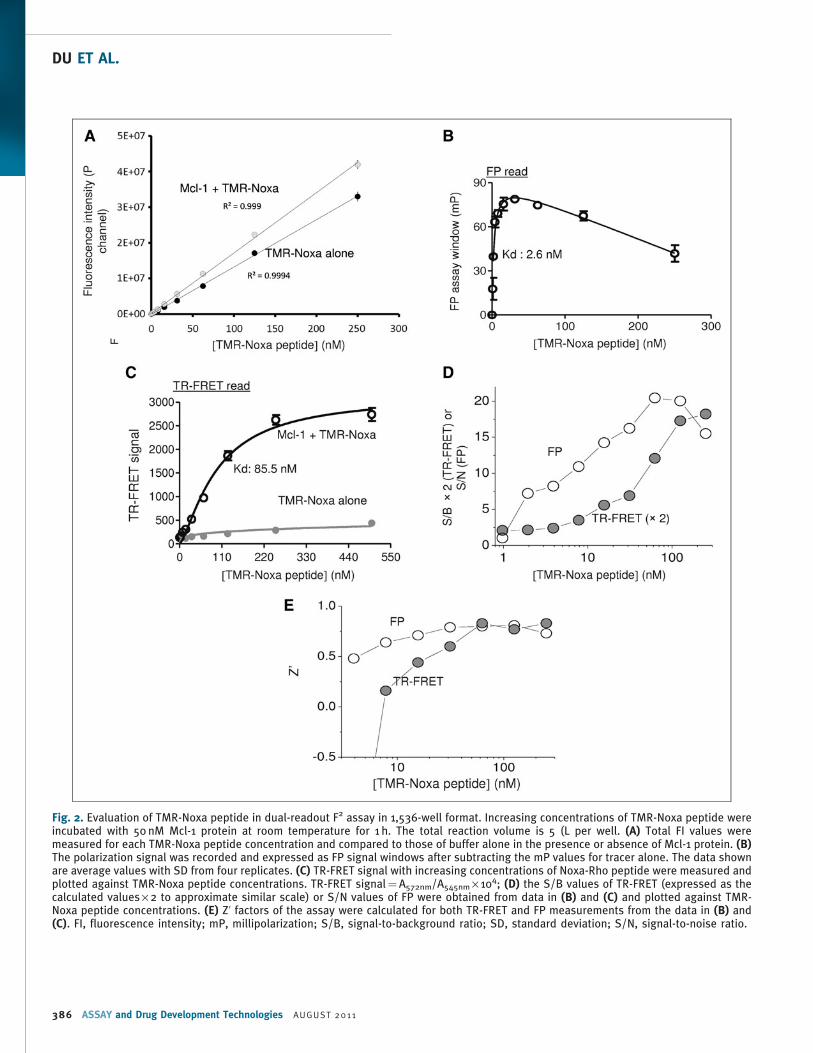
Fig. 2. Evaluation of TMR-Noxa peptide in dual-readout F2 assay in 1,536-well format. Increasing concentrations of TMR-Noxa peptide wereincubated with 50 nM Mcl-1 protein at room temperature for 1 h. The total reaction volume is 5 (L per well. (A) Total FI values weremeasured for each TMR-Noxa peptide concentration and compared to those of buffer alone in the presence or absence of Mcl-1 protein. (B)The polarization signal was recorded and expressed as FP signal windows after subtracting the mP values for tracer alone. The data shownare average values with SD from four replicates. (C) TR-FRET signal with increasing concentrations of Noxa-Rho peptide were measured andplotted against TMR-Noxa peptide concentrations. TR-FRET signal¼A572nm/A545nm · 104; (D) the S/B values of TR-FRET (expressed as thecalculated values · 2 to approximate similar scale) or S/N values of FP were obtained from data in (B) and (C) and plotted against TMR-Noxa peptide concentrations. (E) Z’ factors of the assay were calculated for both TR-FRET and FP measurements from the data in (B) and(C). FI, fluorescence intensity; mP, millipolarization; S/B, signal-to-background ratio; SD, standard deviation; S/N, signal-to-noise ratio.
DU ET AL.
386 ASSAY and Drug Development Technologies AU GUST 2011
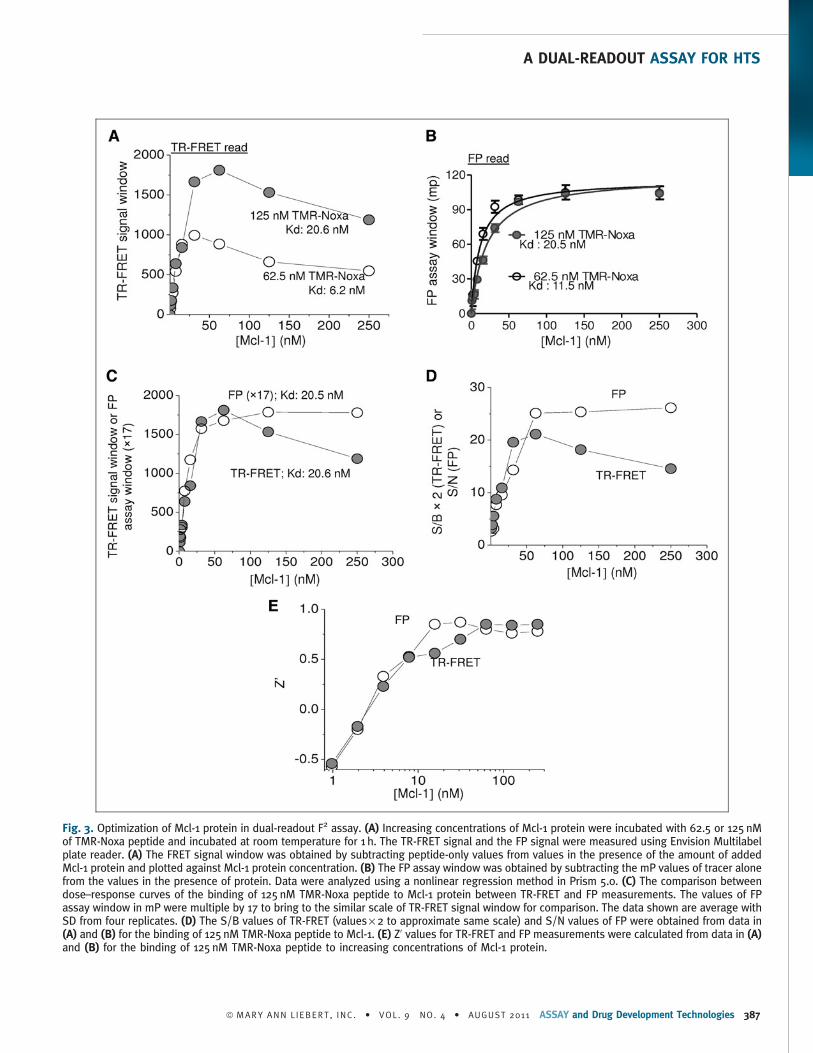
Fig. 3. Optimization of Mcl-1 protein in dual-readout F2 assay. (A) Increasing concentrations of Mcl-1 protein were incubated with 62.5 or 125 nMof TMR-Noxa peptide and incubated at room temperature for 1 h. The TR-FRET signal and the FP signal were measured using Envision Multilabelplate reader. (A) The FRET signal window was obtained by subtracting peptide-only values from values in the presence of the amount of addedMcl-1 protein and plotted against Mcl-1 protein concentration. (B) The FP assay window was obtained by subtracting the mP values of tracer alonefrom the values in the presence of protein. Data were analyzed using a nonlinear regression method in Prism 5.0. (C) The comparison betweendose–response curves of the binding of 125 nM TMR-Noxa peptide to Mcl-1 protein between TR-FRET and FP measurements. The values of FPassay window in mP were multiple by 17 to bring to the similar scale of TR-FRET signal window for comparison. The data shown are average withSD from four replicates. (D) The S/B values of TR-FRET (values · 2 to approximate same scale) and S/N values of FP were obtained from data in(A) and (B) for the binding of 125 nM TMR-Noxa peptide to Mcl-1. (E) Z’ values for TR-FRET and FP measurements were calculated from data in (A)and (B) for the binding of 125 nM TMR-Noxa peptide to increasing concentrations of Mcl-1 protein.
A DUAL-READOUT ASSAY FOR HTS
ª M A R Y A N N L I E B E R T , IN C . . VOL. 9 NO. 4 . AUGUST 2011 ASSAY and Drug Development Technologies 387
read. Binding of 50 nM Mcl-1 to increasing concentrations of TMR-
Noxa peptide resulted in an increase in both S/B (TR-FRET) and S/N
(FP) values (Fig. 2D). The S/B of TR-FRET signal at 125 nM of TMR-
Noxa peptide was about 8.6 and achieved maximum (9.1) when
250 nM of TMR-Noxa peptide was tested. The S/N of the FP read was
20 at 62.5 nM of TMR-Noxa peptide and reached saturation at
62.5 nM or higher concentrations of TMR-Noxa peptide. Z’ factors
were all above 0.5 for both TR-FRET and FP readouts when higher
than 30 nM of TMR-Noxa peptide were tested (Fig. 2E), indicating a
robust and high-quality assay for HTS.34
The Kds obtained by TR-FRET and FP measurements for the same
reaction appear to be distinct. The Kd for the binding of TMR-Noxa
peptide to 50 nM of Mcl-1 measured in the TR-FRET read (85.5 nM) is
*32.9 times higher that the Kd obtained from FP read (2.6 nM). This
may be due to the different signal strength measured by a given
fluorophore-ligand concentration in each assay format. The FP assay
format is amenable to using a lower fluorophore-ligand concentra-
tion than the TR-FRET assay format. To achieve high enough signal
and remain within the dynamic range of the assay for both TR-FRET
and FP measurements, the concentrations of TMR-Noxa peptide used
in the dual-readout assays need to be carefully selected. For the FP
assay format, when used at a lower concentration of the fluorophore,
fluorescence contributions from library compound will have a more
dramatic impact on the assay because the detection readout is a
measure of the sum of all fluorescent species in the assay. As the
fluorophore concentration increases in the assay, the contributions
from fluorescent compounds are reduced. Therefore, the use of higher
concentrations of fluorophore-labeled ligand would have the ad-
vantage to reduce the fluorescence interference from library com-
pounds in the FP assay format.35 Thus, based on the titration curves
of TMR-Noxa peptide in FP readout and TR-FRET readout, concen-
trations of 62.5 and 125 nM TMR-Noxa peptide were selected for the
further evaluation in the dual-readout F2 assay.
Analysis and optimization of Mcl-1 protein in the dual-readout F2
assay platform. To determine the Mcl-1 protein concentrations op-
timal for the dual-readout F2 assay, we carried out titration experi-
ments. A constant concentration of the TMR-Noxa peptide (62.5 or
125 nM) was titrated with increasing concentrations of the Mcl-1
protein (1–1,000 nM). The binding signals were measured in both TR-
FRET and FP modes.
Increasing concentrations of Mcl-1 led to dose-dependent increase
of the FRET signal with either 62.5 or 125 nM of TMR-Noxa peptide
(Fig. 3A). The TR-FRET signal reached a maximum when 31.3 nM of
Mcl-1 protein was mixed with 62.5 nM of TMR-Noxa, or when
62.5 nM of Mcl-1 was incubated with 125 nM of TMR-Noxa peptide,
respectively. The estimated Kd of Mcl-1 was 6.2 and 20.6 nM, re-
spectively, under these two conditions.
In the FP measurement, as the amount of Mcl-1 protein increased,
progressively increased FP signal was observed until reaching satu-
ration. A maximum assay window about 100 mP was achieved. The
Kds for the binding to 62.5 and 125 nM of TMR-Noxa peptide in the
FP read were 11.5 and 20.5 nM, respectively.
Both TR-FRET and FP assays from the same reaction gave rise to a
consistent and robust assay performance. The Kd of the Mcl-1
binding to 125 nM of TMR-Noxa peptide was 20.6 nM in the TR-FRET
read and 20.5 nM in the FP read (Fig. 3C). Mcl-1 protein at 62.5 nM
generated the maximum S/B (10.6) in the TR-FRET read and S/N
(25.1) in the FP read (Fig. 3D). Further increasing Mcl-1 protein
concentration led to decreased signals in TR-FRET readout, although
the FP readout remained constant (Fig. 3C, D). Z’ factors were above
0.5 for both TR-FRET and FP readouts when Mcl-1 protein concen-
trations were >7.8 nM. From these analyses, it appears that it is
feasible to identify assay conditions that permit the optimal perfor-
mance by both TR-FRET and FP assay types for the Mcl-1/Noxa
interaction. Accordingly, an assay condition that utilizes 125 nM of
TMR-Noxa peptide and 62.5 nM of Mcl-1 protein was selected and
used for the following studies. With this assay condition, optimized
performance regarding assay window and robustness can be
achieved for both TR-FRET and FP measurement.
Validation of the Dual-Readout F2 Technologyin a Competition Assay
To validate the dual-readout F2 assay format for HTS, we have
developed a competition assay by using unlabeled Noxa peptide. The
unlabeled Noxa peptide is expected to compete with the TMR-Noxa
for Mcl-1 binding. Indeed, the addition of unlabeled Noxa-peptide
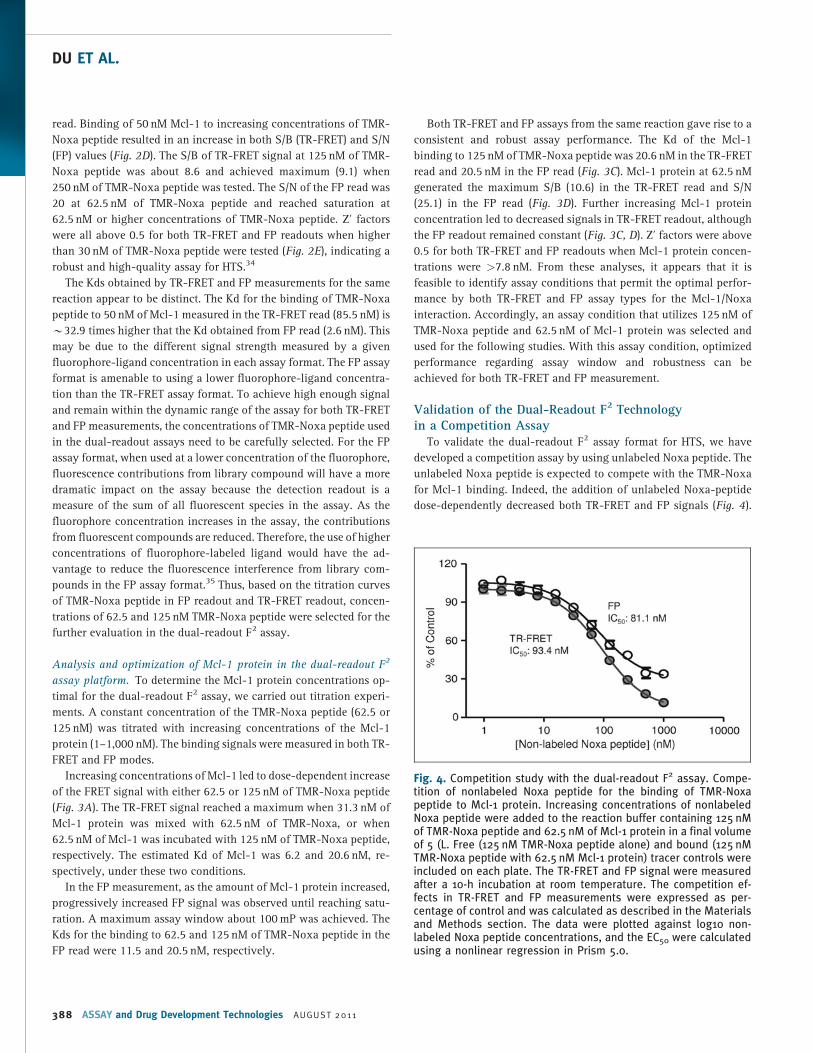
dose-dependently decreased both TR-FRET and FP signals (Fig. 4).
Fig. 4. Competition study with the dual-readout F2 assay. Compe-tition of nonlabeled Noxa peptide for the binding of TMR-Noxapeptide to Mcl-1 protein. Increasing concentrations of nonlabeledNoxa peptide were added to the reaction buffer containing 125 nMof TMR-Noxa peptide and 62.5 nM of Mcl-1 protein in a final volumeof 5 (L. Free (125 nM TMR-Noxa peptide alone) and bound (125 nMTMR-Noxa peptide with 62.5 nM Mcl-1 protein) tracer controls wereincluded on each plate. The TR-FRET and FP signal were measuredafter a 10-h incubation at room temperature. The competition ef-fects in TR-FRET and FP measurements were expressed as per-centage of control and was calculated as described in the Materialsand Methods section. The data were plotted against log10 non-labeled Noxa peptide concentrations, and the EC50 were calculatedusing a nonlinear regression in Prism 5.0.
DU ET AL.
388 ASSAY and Drug Development Technologies AUGUST 2011
Importantly, both TR-FRET and FP readouts gave rise to similar IC50
values for the Noxa antagonist peptide with 93.4 nM for TR-FRET and
81.1 nM for FP, respectively. These data indicate that the dual-
readout F2 assay can be used for measuring the inhibitory effect of
potential antagonists and searching for Mcl-1 protein inhibitors.
uHTS Format DevelopmentTo evaluate the suitability of the dual-readout F2 technology for
the identification of Mcl-1 inhibitors in an uHTS format, DMSO
tolerance and stability of the assay were examined. DMSO is a
common solvent used in dissolving many natural and organic
compounds as employed in generating small molecular libraries for
HTS. To access the full applicability of dual-readout F2 for uHTS, it is
necessary to test the effect of the DMSO on the assay performance
before screening for Mcl-1 protein inhibitors. For this purpose, both
TR-FRET and FP signals were recorded upon the addition of in-
creasing concentrations of DMSO to wells in a 1,536-well plate. As
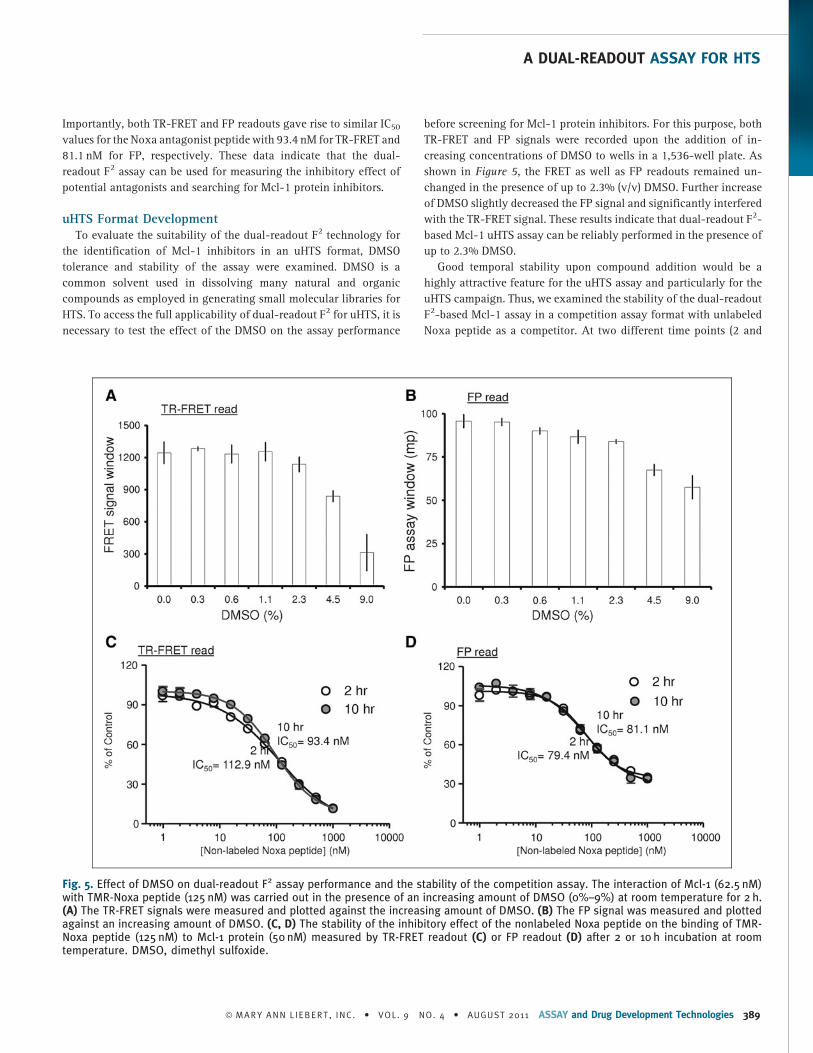
shown in Figure 5, the FRET as well as FP readouts remained un-
changed in the presence of up to 2.3% (v/v) DMSO. Further increase
of DMSO slightly decreased the FP signal and significantly interfered
with the TR-FRET signal. These results indicate that dual-readout F2-
based Mcl-1 uHTS assay can be reliably performed in the presence of
up to 2.3% DMSO.
Good temporal stability upon compound addition would be a
highly attractive feature for the uHTS assay and particularly for the
uHTS campaign. Thus, we examined the stability of the dual-readout
F2-based Mcl-1 assay in a competition assay format with unlabeled
Noxa peptide as a competitor. At two different time points (2 and
Fig. 5. Effect of DMSO on dual-readout F2 assay performance and the stability of the competition assay. The interaction of Mcl-1 (62.5 nM)with TMR-Noxa peptide (125 nM) was carried out in the presence of an increasing amount of DMSO (0%–9%) at room temperature for 2 h.(A) The TR-FRET signals were measured and plotted against the increasing amount of DMSO. (B) The FP signal was measured and plottedagainst an increasing amount of DMSO. (C, D) The stability of the inhibitory effect of the nonlabeled Noxa peptide on the binding of TMR-Noxa peptide (125 nM) to Mcl-1 protein (50 nM) measured by TR-FRET readout (C) or FP readout (D) after 2 or 10 h incubation at roomtemperature. DMSO, dimethyl sulfoxide.
A DUAL-READOUT ASSAY FOR HTS
ª M A R Y A N N L I E B E R T , I N C . . VOL. 9 NO. 4 . AUGUST 2011 ASSAY and Drug Development Technologies 389
10 h) after adding increasing concentrations of unlabeled Noxa
peptide to the reaction containing TMR-Noxa peptide (125 nM) and
Mcl-1 (62.5 nM), FRET and FP signals in a 1,536-well plate were
measured. The results showed that the inhibitory effect of the unla-
beled Noxa peptide on the assay is indeed very stable as revealed by
virtually unchanged IC50 values in the TR-FRET read (Fig. 5C) and the
FP read (Fig. 5D) at both time points. Such assay stability in the
presence of an antagonist allows for the large batch sizes typical of
uHTS screens.
Validation of the Dual-Readout F2-Based Mcl-1Assay in an uHTS Format
To be amenable for uHTS, the dual-readout F2 assay should exhibit
minimal variation between well-to-well, plate-to-plate, and day-to-
day operations. To test the utility of our optimized dual-readout assay
in an uHTS format, we examined the precision and robustness of the
assay in eighty 1,536-well microplates performed in a low volume on
different days. About 4.5 mL of reaction buffer containing TMR-Noxa
peptide (125 nM), Mcl-1 (62.5 nM), and terbium-anti-His antibody
(2 nM) was dispensed to a 1,536-well black plate using a Multidrop
Combi. On each 1,536-well plate, each of 32 wells contains a free
TMR-Noxa peptide control (125 nM) and terbium-anti-His antibody
(2 nM) without Mcl-1 protein, which gives a minimal TR-FRET and
FP signal. Another 32 wells contain TMR-Noxa peptide, Mcl-1 pro-
tein (62.5 nM), and terbium-anti-His antibody (2 nM), which defines
the assay window for both TR-FRET and FP readout. The reactions
were incubated for 2 h. Both TR-FRET and FP analyses were per-
formed in the TR-FRET mode and FP mode, respectively, with the
EnVision microplate reader. Analysis across eighty 1,536-well plates
demonstrated stable signals in the TR-FRET (Fig. 6A) and FP reads
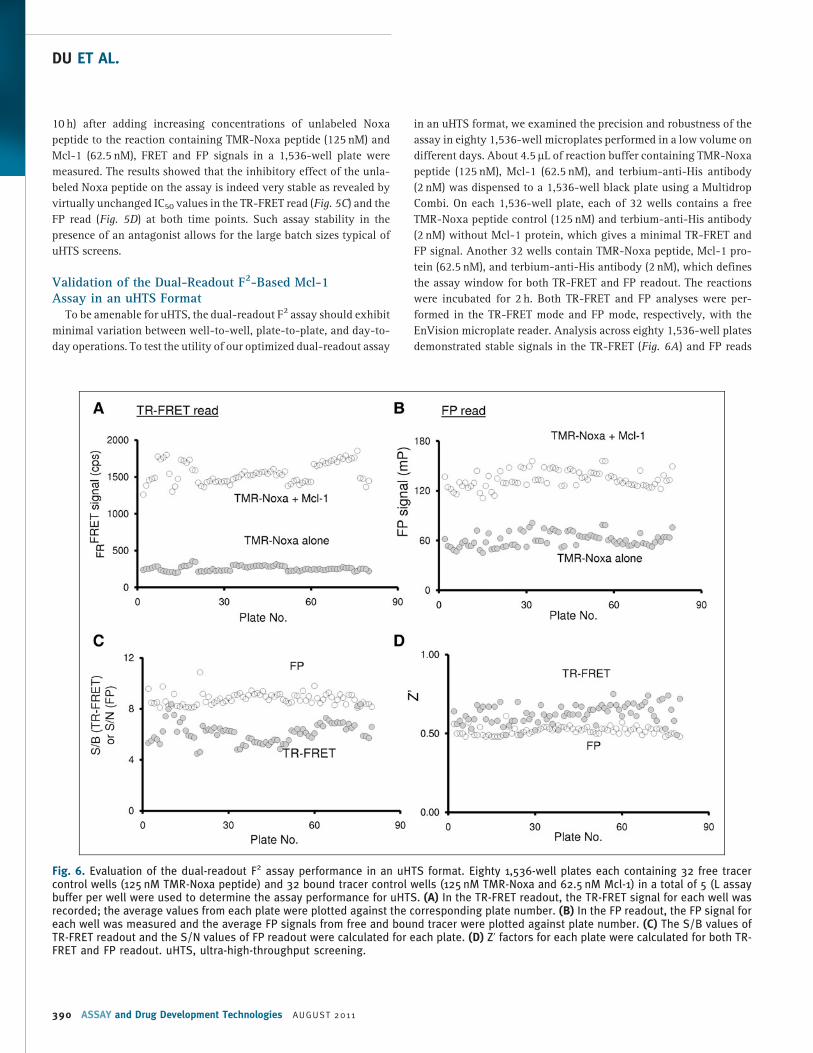
Fig. 6. Evaluation of the dual-readout F2 assay performance in an uHTS format. Eighty 1,536-well plates each containing 32 free tracercontrol wells (125 nM TMR-Noxa peptide) and 32 bound tracer control wells (125 nM TMR-Noxa and 62.5 nM Mcl-1) in a total of 5 (L assaybuffer per well were used to determine the assay performance for uHTS. (A) In the TR-FRET readout, the TR-FRET signal for each well wasrecorded; the average values from each plate were plotted against the corresponding plate number. (B) In the FP readout, the FP signal foreach well was measured and the average FP signals from free and bound tracer were plotted against plate number. (C) The S/B values ofTR-FRET readout and the S/N values of FP readout were calculated for each plate. (D) Z’ factors for each plate were calculated for both TR-FRET and FP readout. uHTS, ultra-high-throughput screening.
DU ET AL.
390 ASSAY and Drug Development Technologies AUGU ST 2011
(Fig. 6B) with large assay windows. The average TR-FRET signal from
80 plates was 1,553.6 cps with an SD of 136.8. The average FP signal
was 133.9 mP with an SD of 10.2. To further evaluate the applicability
of the dual-readout F2 technology for the 1,536-well based uHTS, the
assay performance parameter S/B (TR-FRET), S/N (FP), and Z’ factors
were calculated. The S/B values for TR-FRET readout, as determined
for each plate, were consistently higher than 5 and the average value
was 6.2 from 80 plates with an SD of 0.8 (Fig. 6C). The S/N values for
the FP read were constantly higher than 8 and the average was 8.8
with an SD of 0.5 (Fig. 6C). The Z’ factors were all above 0.5 for both
TR-FRET read and FP read (Fig. 6D), demonstrating a robust and
consistent assay with minimal variations. Thus, the dual-readout F2-
based Mcl-1/Noxa binding assay in 1,536-well plate is of excellent
quality for uHTS.
To test the utility of the dual-readout F2 assay for uHTS, we per-
formed a screening using a 102,255-compound library from the
Molecular Library Screening Center Network. Library compounds
(0.1 mL of 1 mM stock in DMSO) were dispensed into 1,536-well plates
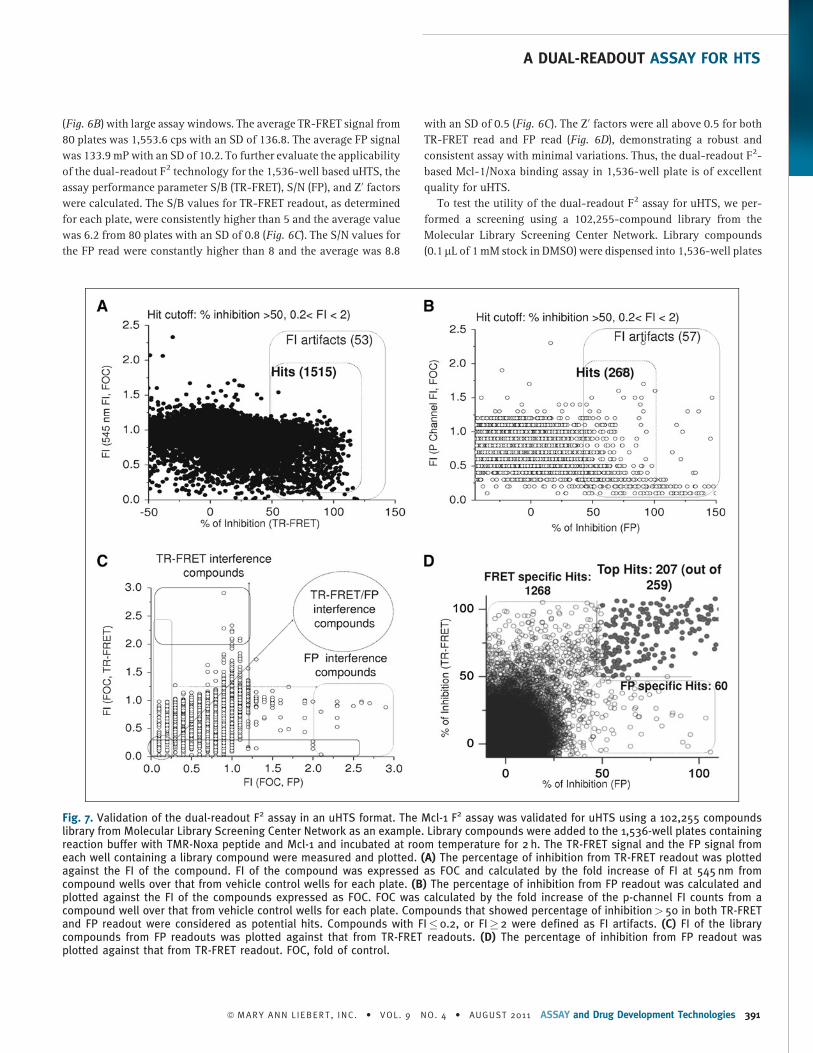
Fig. 7. Validation of the dual-readout F2 assay in an uHTS format. The Mcl-1 F2 assay was validated for uHTS using a 102,255 compoundslibrary from Molecular Library Screening Center Network as an example. Library compounds were added to the 1,536-well plates containingreaction buffer with TMR-Noxa peptide and Mcl-1 and incubated at room temperature for 2 h. The TR-FRET signal and the FP signal fromeach well containing a library compound were measured and plotted. (A) The percentage of inhibition from TR-FRET readout was plottedagainst the FI of the compound. FI of the compound was expressed as FOC and calculated by the fold increase of FI at 545 nm fromcompound wells over that from vehicle control wells for each plate. (B) The percentage of inhibition from FP readout was calculated andplotted against the FI of the compounds expressed as FOC. FOC was calculated by the fold increase of the p-channel FI counts from acompound well over that from vehicle control wells for each plate. Compounds that showed percentage of inhibition> 50 in both TR-FRETand FP readout were considered as potential hits. Compounds with FI� 0.2, or FI� 2 were defined as FI artifacts. (C) FI of the librarycompounds from FP readouts was plotted against that from TR-FRET readouts. (D) The percentage of inhibition from FP readout wasplotted against that from TR-FRET readout. FOC, fold of control.
A DUAL-READOUT ASSAY FOR HTS
ª M A R Y A N N L I E B E R T , I N C . . VOL. 9 NO. 4 . AUGUST 2011 ASSAY and Drug Development Technologies 391

containing 4.5 mL per well of reaction buffer (125 nM TMR-Noxa
peptide, 62.5 nM Mcl-1, and 2 nM terbium-anti-His conjugate). The
final compound concentration was 21.7 mM with a final DMSO
concentration of 2.2%. Analysis of the TR-FRET-derived data revealed
a total of 1,568 positive compounds that decreased the TR-FRET
assay window by >50% with a hit rate of 1.5% (Fig. 7A). Compounds
with intrinsic fluorescence or fluorescence-quenching properties
were identified by the FI at 545 nm. Fold of control (FOC) was calcu-
lated by FI of 545 nm from compound wells over that from vehicle
control wells. FI artifacts were defined by FOC� 0.2 (80% quenching)
or� 2 (twofold fluorescence over the control). Among those 1,568
positives obtained from TR-FRET, 53 compounds were possible artifact
compounds, which resulted in an artifact rate of 3.4%.
On the other hand, the FP readout gave rise to 325 positives when
the hit cutoff was set at 50% inhibition of FP assay window compared
to DMSO control wells (Fig. 7B). p-Channel FI of the FP read was used
for reference to identify fluorescent or fluorescence-quenching
compounds in FP readout. FI of the compound was expressed as FOC
and calculated as p-channel counts from compound well over that
from vehicle control wells. Fifty-seven compounds have been found
to interfere with the assay with fluorescence (FI� 2) or fluorescence
quenching (FI� 0.2). The artifact rate was 21.3%.
These data indicate that FP readout generates higher artifact rate
(21.3%) than that from TR-FRET readout (3.4%), suggesting that FP
assay might be more sensitive to fluorescence interference from
screening compounds, which is consistent with previous reports.35
When we plotted the FI of FP from the compound against FI of TR-
FRET, we found that some compounds interfered only with the FP
readout or TR-FRET, whereas some fluorescent-quenching com-
pounds interfered with both readouts.
Interestingly, most of FP-derived positives also showed up as
positives in the TR-FRET assay format (Fig. 7C). Two hundred fifty-
nine compounds showed % inhibition> 50 in both TR-FRET and FP
readout with 52 fluorescence-interfering compounds, resulting in
207 top hits. Thus, by requiring that a hit be positive in both TR-FRET
and FP readouts, the strategy using the dual readouts would expect to
greatly reduce the number of false positives that are caused by
compound fluorescence or quenching at the wavelengths employed
in either assay. Therefore, the dual F2 assay technology allows us to
better rank and prioritizes hits from HTS and enables the selection of
high quality hits for the follow-up studies.
Interestingly, 1,268 compounds were identified as positives only
in the TR-FRET assay and 60 positive compounds were exclusive to
the FP readout (Fig. 7C). This suggests that different assay technol-
ogies may generate different hit list, which is consistent with previ-
ous reports.31 With the advances of the instrumentation and the
precision of the modern liquid-handling technologies, the variation
issue of HTS has been drastically reduced. Simply repeating the
screening will not significantly change the hit list. While false-
positive issues have been extensively addressed in the HTS field,
false-negatives have not gained much attention primarily because
that large-scale screening for one target using multiple platforms is
not practical. The application of the F2 assay platform permits the
recovery of missed hits from one assay, such as FP, by the other, such
as TR-FRET, resulting in the increased quality of screening by re-
ducing the number of false-negatives. Such an apparent advantage of
the F2 assay requires further experimental validation.
SUMMARYWe have developed a novel HTS technology termed dual-readout
F2 assay through combining FRET and FP assays into one platform
for monitoring bimolecular interactions. Using the interaction of
Mcl-1 and Noxa as a model system, we have optimized the F2 assay in
a 1,536-well format for the screening of Mcl-1 protein inhibitors. It
should be noted that a main technical challenge of the dual-readout
F2 approach is the opposing requirements of TR-FRET verses FP for
optimal reagent concentrations. A donor assay component labeled
with lanthanide (Tb-Mcl-1 in this study) defines sensitivity of the TR-
FRET readout. Conversely, the fluorescent peptide (TMR-Noxa) pro-
vides the readout in FP assay. Optimizations of FP and TR-FRET
readouts would require fixing peptide and protein concentration,
respectively, and titrating with protein and peptide, correspondingly.
To avoid potential pitfalls, titration of both assay components in the
presence of a broad range of multiple concentrations of its coun-
terpart, often around a reported Kd value, would be critical to achieve
an optimized condition. Compilation of these data would help se-
lecting the most appropriate ratio and concentrations of the two
assay components, specifically advantageous for protein–peptide
pairs with a priori unknown affinities.
Further validation of the dual-readout F2 assay by screening a
102,255-compound library revealed that the number of positives in
dual readouts was less than that from a single-readout platform.
These dual-positive hits after the exclusion of false-positives, such as
fluorescent compounds or quenchers, as shown in Figure 7, should be
selected as primary positives for secondary and biological validation
assays. As two assay formats are utilized for the same target at the
same time in the same reaction, the dual-readout F2 technology is
likely to minimize the number of false-positives and false-negatives,
enrich primary HTS information, and increase screening quality and
efficiency.
ACKNOWLEDGMENTSThis work was supported in part by the grants from the National
Institutes of Health PHS 5U54 HG003918 (to R.D. and H.F.),
NS056915-01 (to Z.N.-C.), P01 CA116676 (to H.F.), Emory Uni-
versity’s SPORE in Head and Neck Cancer Career Development award
(P50 CA128613; to Y.D.), Emory Faculty Distinction Fund, and
Georgia Cancer Coalition and Georgia Research Alliance (to H.F.).
DISCLOSURE STATEMENTNo competing financial interests exist.
REFERENCES
1. Wells JA, McClendon CL: Reaching for high-hanging fruit in drug discovery at
protein-protein interfaces. Nature 2007;450:1001–1009.
DU ET AL.
392 ASSAY and Drug Development Technologies AUGU ST 2011
2. Jameson DM, Croney JC: Fluorescence polarization: past, present and future.
Comb Chem High Throughput Screen 2003;6:167–173.
3. Rich RL, Myszka DG: Advances in surface plasmon resonance biosensor
analysis. Curr Opin Biotechnol 2000;11:54–61.
4. Selvin PR: The renaissance of fluorescence resonance energy transfer. NatStruct Biol 2000;7:730–734.
5. Inglese J, Johnson RL, Simeonov A, et al.: High-throughput screening assays for
the identification of chemical probes. Nat Chem Biol 2007;3:466–479.
6. Thompson CB: Apoptosis in the pathogenesis and treatment of disease. Science1995;267:1456–1462.
7. Adams JM, Cory S: The Bcl-2 protein family: arbiters of cell survival. Science1998;281:1322–1326.
8. Chao DT, Korsmeyer SJ: BCL-2 family: regulators of cell death. Annu RevImmunol 1998;16:395–419.
9. Petros AM, Medek A, Nettesheim DG, et al.: Solution structure of the
antiapoptotic protein bcl-2. Proc Natl Acad Sci USA 2001;98:3012–3017.
10. Wuilleme-Toumi S, Robillard N, Gomez P, et al.: Mcl-1 is overexpressed in
multiple myeloma and associated with relapse and shorter survival. Leukemia2005;19:1248–1252.
11. Kaufmann SH, Karp JE, Svingen PA, et al.: Elevated expression of the apoptotic
regulator Mcl-1 at the time of leukemic relapse. Blood 1998;91:991–1000.
12. Hussain SR, Cheney CM, Johnson AJ, et al.: Mcl-1 is a relevant therapeutic
target in acute and chronic lymphoid malignancies: down-regulation enhances
rituximab-mediated apoptosis and complement-dependent cytotoxicity. ClinCancer Res 2007;13:2144–2150.
13. Degterev A, Lugovskoy A, Cardone M, et al.: Identification of small-molecule
inhibitors of interaction between the BH3 domain and Bcl-xL. Nat Cell Biol2001;3:173–182.
14. Tzung SP, Kim KM, Basanez G, et al.: Antimycin A mimics a cell-death-inducing
Bcl-2 homology domain 3. Nat Cell Biol 2001;3:183–191.
15. Oltersdorf T, Elmore SW, Shoemaker AR, et al.: An inhibitor of Bcl-2 family
proteins induces regression of solid tumours. Nature 2005;435:677–681.
16. Petros AM, Dinges J, Augeri DJ, et al.: Discovery of a potent inhibitor of the
antiapoptotic protein Bcl-xL from NMR and parallel synthesis. J Med Chem2006;49:656–663.
17. Bruncko M, Oost TK, Belli BA, et al.: Studies leading to potent, dual inhibitors of
Bcl-2 and Bcl-xL. J Med Chem 2007;50:641–662.
18. Wang G, Nikolovska-Coleska Z, Yang CY, et al.: Structure-based design of
potent small-molecule inhibitors of anti-apoptotic Bcl-2 proteins. J Med Chem2006;49:6139–6142.
19. Tang G, Yang CY, Nikolovska-Coleska Z, et al.: Pyrogallol-based molecules as
potent inhibitors of the antiapoptotic Bcl-2 proteins. J Med Chem 2007;50:
1723–1726.
20. Tang G, Ding K, Nikolovska-Coleska Z, et al.: Structure-based design of
flavonoid compounds as a new class of small-molecule inhibitors of the anti-
apoptotic Bcl-2 proteins. J Med Chem 2007;50:3163–3166.
21. Tang G, Nikolovska-Coleska Z, Qiu S, Yang CY, Guo J, Wang S: Acylpyrogallols as
inhibitors of antiapoptotic Bcl-2 proteins. J Med Chem 2008;51:717–720.
22. Tse C, Shoemaker AR, Adickes J, et al.: ABT-263: a potent and orally bioavailable
Bcl-2 family inhibitor. Cancer Res 2008;68:3421–3428.
23. Chen S, Dai Y, Harada H, Dent P, Grant S: Mcl-1 down-regulation potentiates
ABT-737 lethality by cooperatively inducing Bak activation and Bax translocation.
Cancer Res 2007;67:782–791.
24. Chen L, Willis SN, Wei A, et al.: Differential targeting of prosurvival Bcl-2
proteins by their BH3-only ligands allows complementary apoptotic function.
Mol Cell 2005;17:393–403.
25. Day CL, Smits C, Fan FC, Lee EF, Fairlie WD, Hinds MG: Structure of the BH3
domains from the p53-inducible BH3-only proteins Noxa and Puma in complex
with Mcl-1. J Mol Biol 2008;380:958–971.
26. Du Y, Masters SC, Khuri FR, Fu H: Monitoring 14–3-3 protein interactions with
a homogeneous fluorescence polarization assay. J Biomol Screen 2006;11:
269–276.
27. Tetin SY, Hazlett TL: Optical spectroscopy in studies of antibody-hapten
interactions. Methods 2000;20:341–361.
28. Rajkowski KM, Cittanova N: Corrected equations for the calculation of protein-
ligand binding results from fluorescence polarization data. J Theor Biol 1981;
93:691–696.
29. Ullman EF, Kirakossian H, Singh S, et al.: Luminescent oxygen channeling
immunoassay: measurement of particle binding kinetics by chemiluminescence.
Proc Natl Acad Sci USA 1994;91:5426–5430.
30. Wu X, Glickman JF, Bowen BR, Sills MA: Comparison of assay technologies for a
nuclear receptor assay screen reveals differences in the sets of identified
functional antagonists. J Biomol Screen 2003;8:381–392.
31. Sills MA, Weiss D, Pham Q, Schweitzer R, Wu X, Wu JJ: Comparison of assay
technologies for a tyrosine kinase assay generates different results in high
throughput screening. J Biomol Screen 2002;7:191–214.
32. Wu X, Sills MA, Zhang JH: Further comparison of primary hit identification
by different assay technologies and effects of assay measurement variability.
J Biomol Screen 2005;10:581–589.
33. Du Y, Moulick K, Rodina A, et al.: High-throughput screening fluorescence
polarization assay for tumor-specific Hsp90. J Biomol Screen 2007;12:915–
924.
34. Zhang JH, Chung TD, Oldenburg KR: A simple statistical parameter for use in
evaluation and validation of high throughput screening assays. J Biomol Screen1999;4:67–73.
35. Turek-Etienne TC, Small EC, Soh SC, et al.: Evaluation of fluorescent compound
interference in 4 fluorescence polarization assays: 2 kinases, 1 protease, and 1
phosphatase. J Biomol Screen 2003;8:176–184.
Address correspondence to:
Haian Fu, PhD
Department of Pharmacology
and Emory Chemical Biology Discovery Center
Emory University
Atlanta, GA 30322
E-mail: [email protected]
Zaneta Nikolovska-Coleska, PhD
Department of Pathology
University of Michigan
Ann Arbor, MI 48109-5602
E-mail: [email protected]
A DUAL-READOUT ASSAY FOR HTS
ª M A R Y A N N L I E B E R T , IN C . . VOL. 9 NO. 4 . AUGUST 2011 ASSAY and Drug Development Technologies 393
Recommended