A Global Daily Gauge-based A Global Daily Gauge-based Precipitation Analysis, Part I: Precipitation Analysis, Part I:
Assessing Objective TechniquesAssessing Objective Techniques
Mingyue Chen &
CPC Precipitation Working GroupCPC/NCEP/NOAA
The 32th Annual Climate Diagnostics & Prediction WorkshopOct. 22-26, 2007, Tallahassee, FL
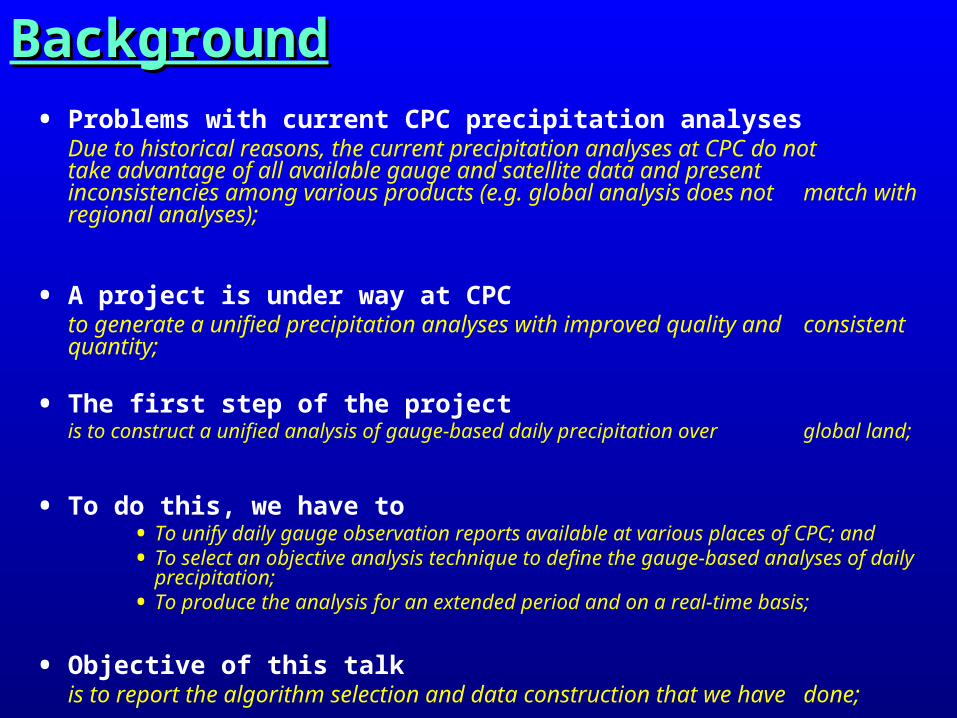
BackgroundBackground• Problems with current CPC precipitation analyses
Due to historical reasons, the current precipitation analyses at CPC do not take advantage of all available gauge and satellite data and present
inconsistencies among various products (e.g. global analysis does not match with regional analyses);
• A project is under way at CPC to generate a unified precipitation analyses with improved quality and
consistent quantity;
• The first step of the project is to construct a unified analysis of gauge-based daily precipitation over
global land;
• To do this, we have to • To unify daily gauge observation reports available at various places of CPC; and• To select an objective analysis technique to define the gauge-based analyses of
daily precipitation;• To produce the analysis for an extended period and on a real-time basis;
• Objective of this talk is to report the algorithm selection and data construction that we have
done;
Strategy of Algorithm SelectionStrategy of Algorithm Selection
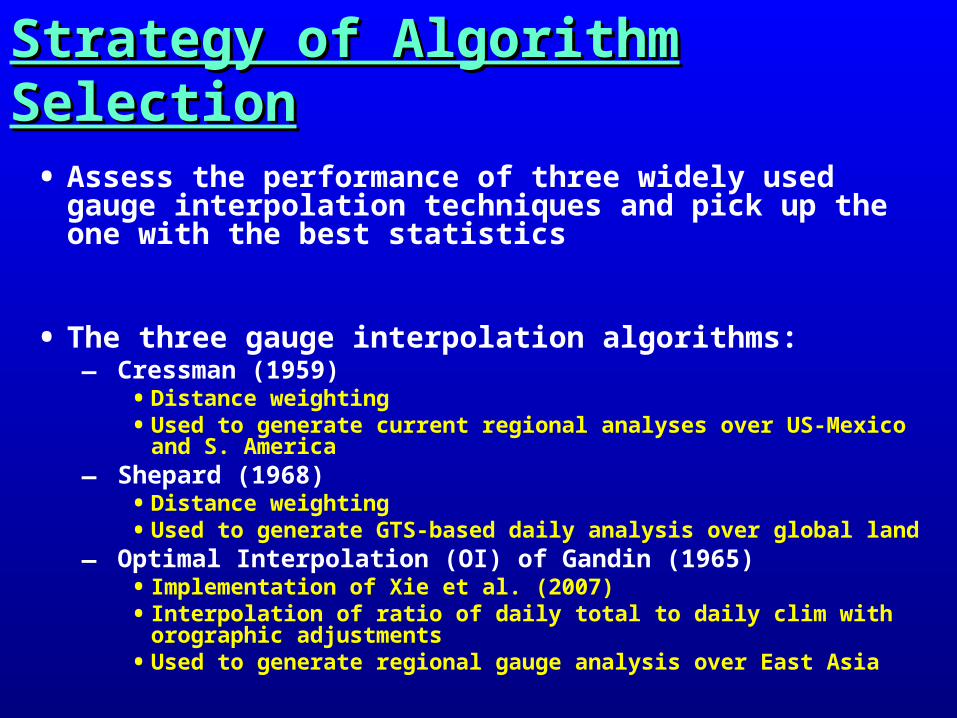
• Assess the performance of three widely used gauge interpolation techniques and pick up the one with the best statistics
• The three gauge interpolation algorithms:– Cressman (1959)
• Distance weighting • Used to generate current regional analyses over US-Mexico and S.
America
– Shepard (1968)• Distance weighting• Used to generate GTS-based daily analysis over global land
– Optimal Interpolation (OI) of Gandin (1965)• Implementation of Xie et al. (2007)• Interpolation of ratio of daily total to daily clim with orographic
adjustments• Used to generate regional gauge analysis over East Asia
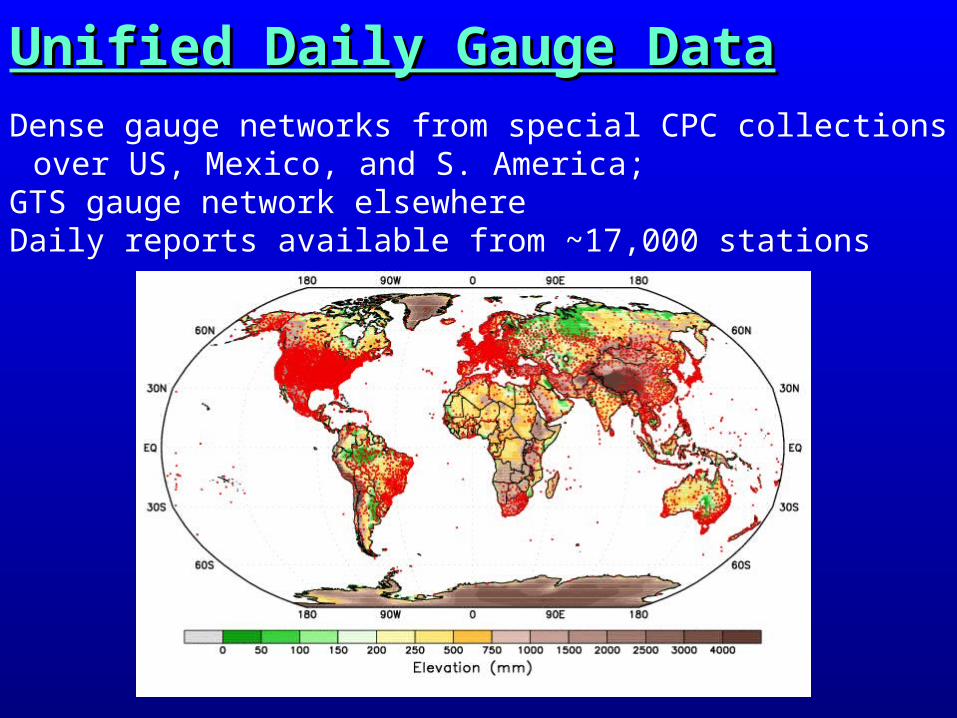
Unified Daily Gauge DataUnified Daily Gauge Data Dense gauge networks from special CPC collections
over US, Mexico, and S. America; GTS gauge network elsewhere Daily reports available from ~17,000 stations
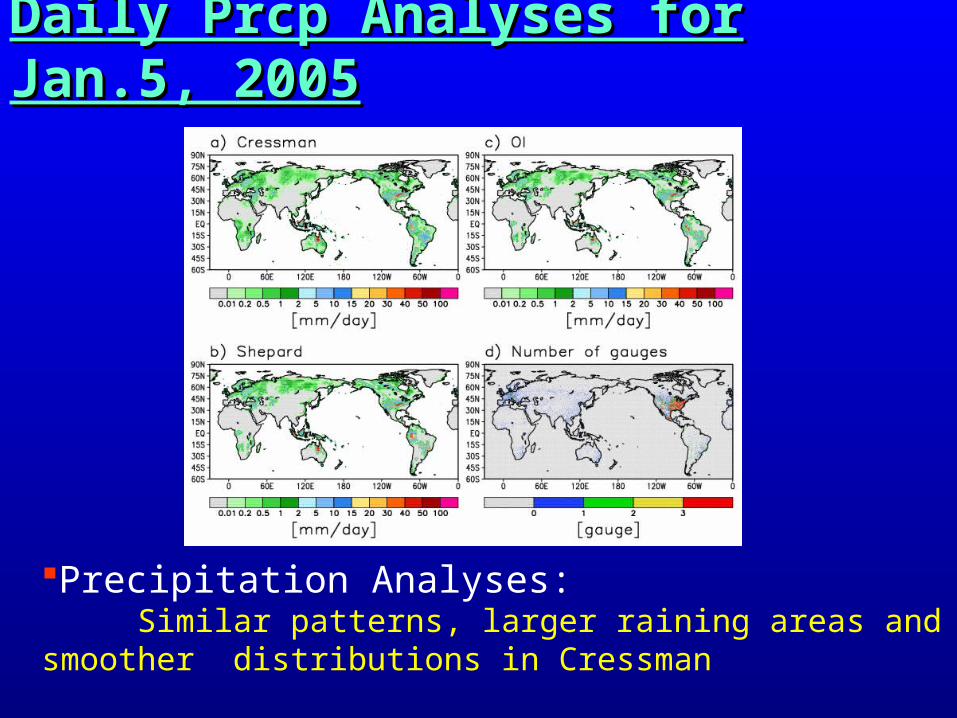
Daily Prcp Analyses for Jan.5, 2005Daily Prcp Analyses for Jan.5, 2005
Precipitation Analyses: Similar patterns, larger raining areas and smoother
distributions in Cressman
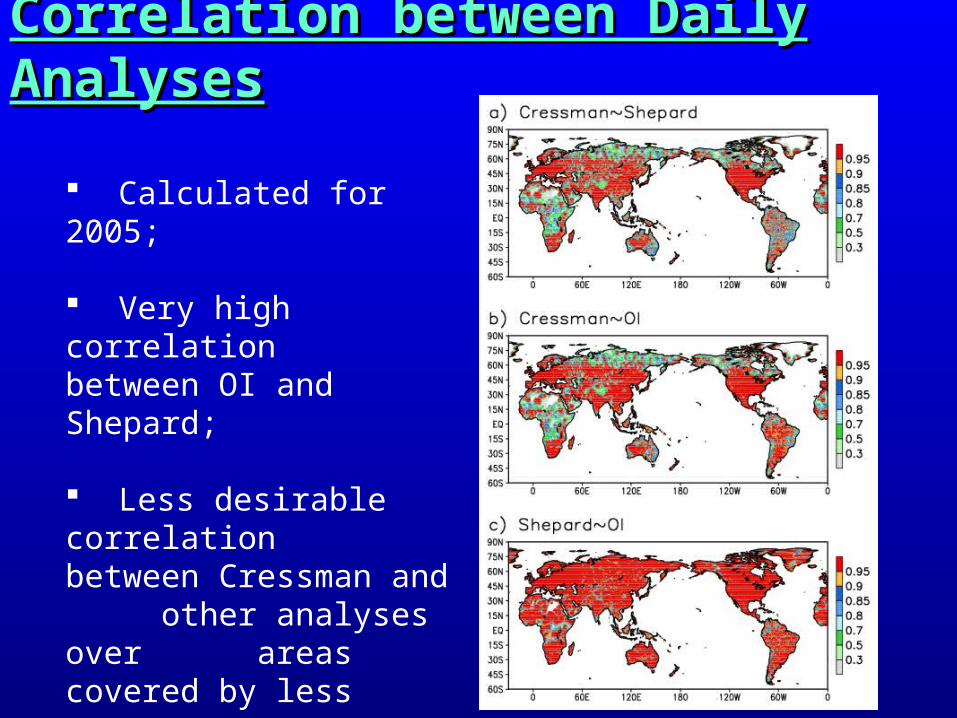
Correlation between Daily AnalysesCorrelation between Daily Analyses
Calculated for 2005;
Very high correlation between OI and Shepard;
Less desirable correlation between Cressman and other analyses over areas covered by less gauges;
Cross-Validation TestsCross-Validation Tests Withdraw daily precipitation reports at 10% stations
selected randomly;
Define the analyzed values of precipitation at the 10% withdrawn stations by interpolating gauge reports at the remaining 90% of the stations;
Repeat this process for 10 times so that each station is withdrawn once;
Compare the analyzed values with the withdrawn station observations to assess the performance of the algorithms
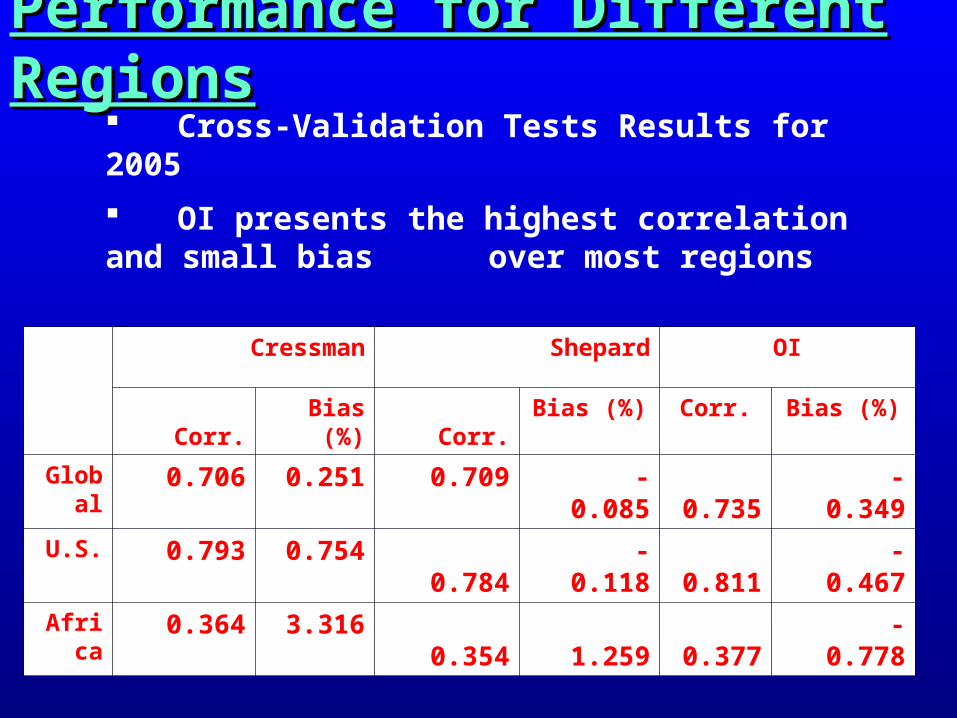
Performance for Different RegionsPerformance for Different Regions
Cross-Validation Tests Results for 2005
OI presents the highest correlation and small bias over most regions
Cressman Shepard OI
Corr. Bias (%) Corr. Bias (%) Corr. Bias (%)
Global 0.706 0.251 0.709 -0.085 0.735 -0.349
U.S. 0.793 0.754 0.784 -0.118 0.811 -0.467
Africa 0.364 3.316 0.354 1.259 0.377 -0.778
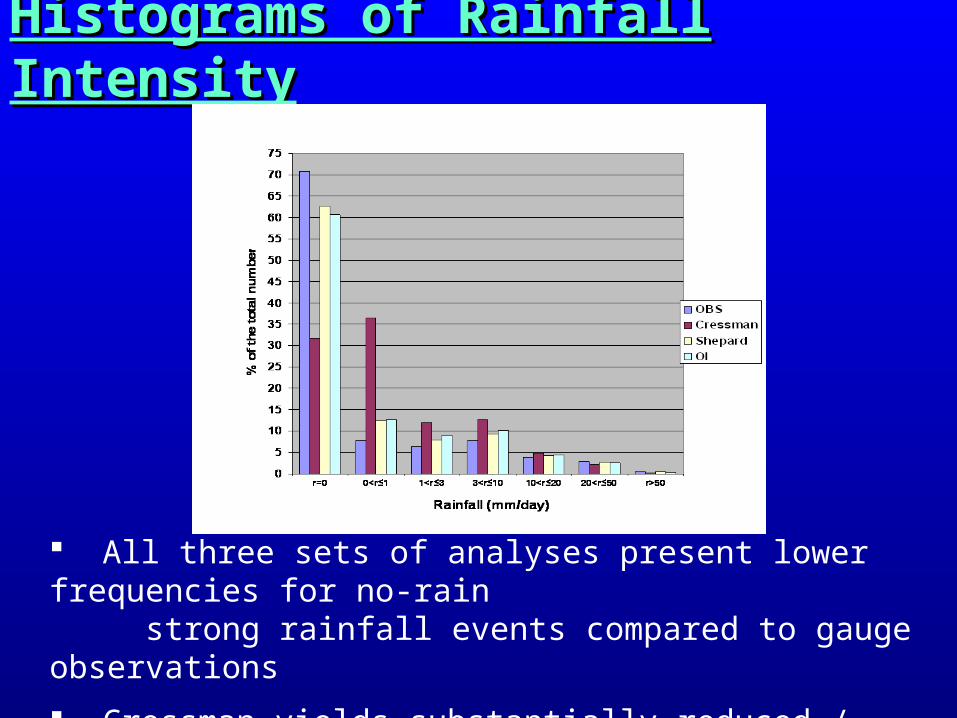
Histograms of Rainfall IntensityHistograms of Rainfall Intensity
All three sets of analyses present lower frequencies for no-rain strong rainfall events compared to gauge observations
Cressman yields substantially reduced / inflated frequencies for no-rain / light rain events
Gauge Network Density Impacts TestsGauge Network Density Impacts Tests
To examine how the objective techniques perform in interpolating station reports from gauge networks of different densities;
Select the CONUS as our test region for the availability of a very dense;
Create gauge-based analysis of daily precipitation with a subset of all available gauge data and compare the analysis with original station data
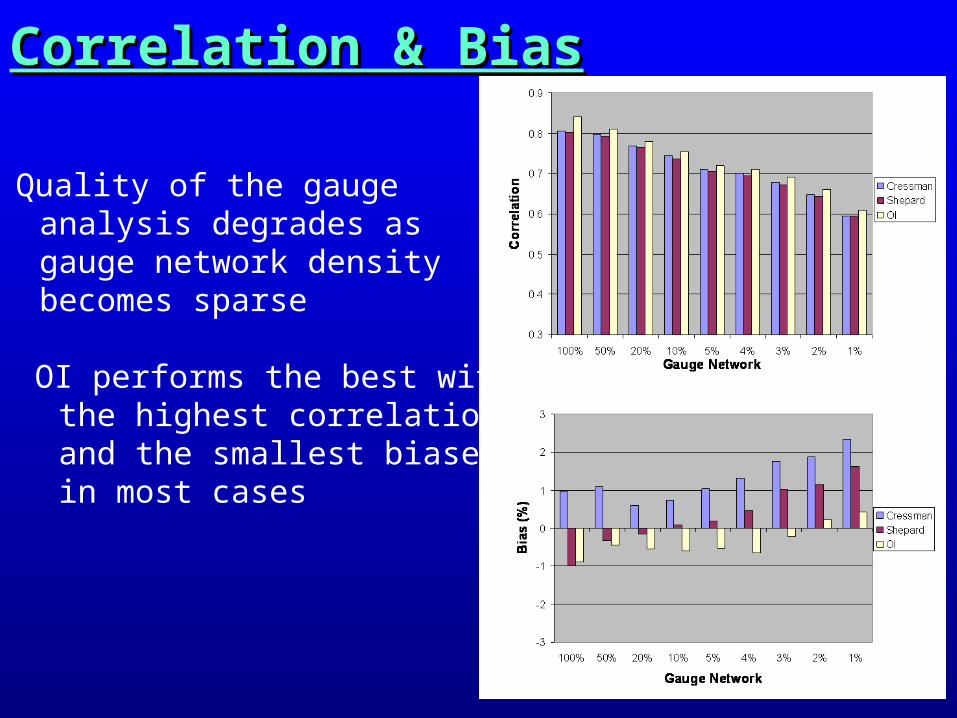
Correlation & BiasCorrelation & Bias
Quality of the gauge analysis degrades as gauge network density becomes sparse
OI performs the best with the highest correlation and the smallest biases in most cases
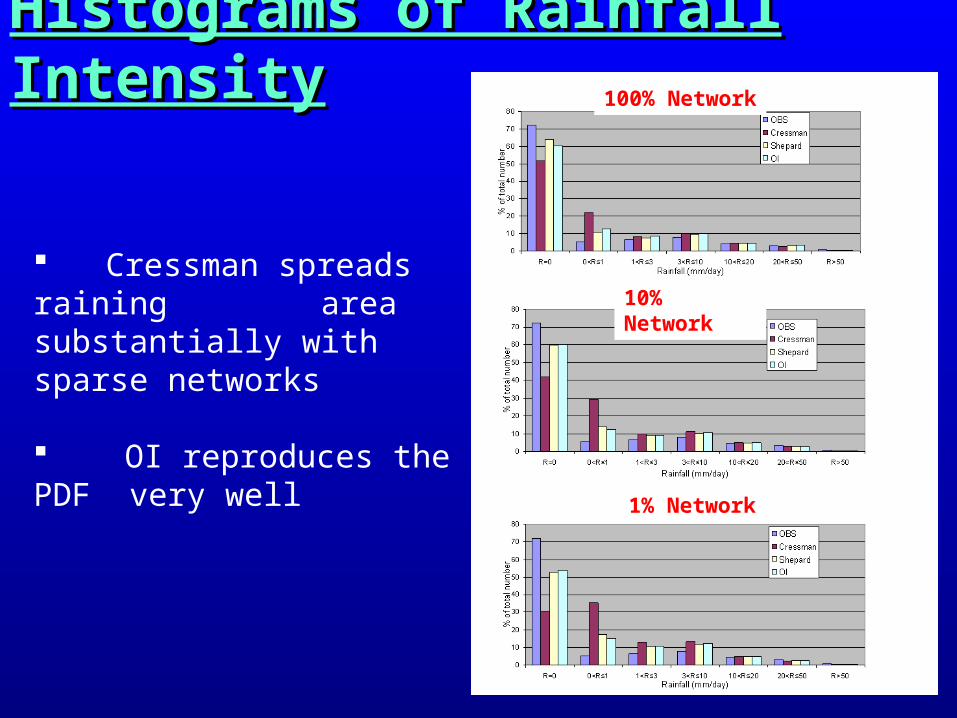
Histograms of Rainfall IntensityHistograms of Rainfall Intensity100% Network
10% Network
1% Network
Cressman spreads raining area substantially with
sparse networks
OI reproduces the PDF very well
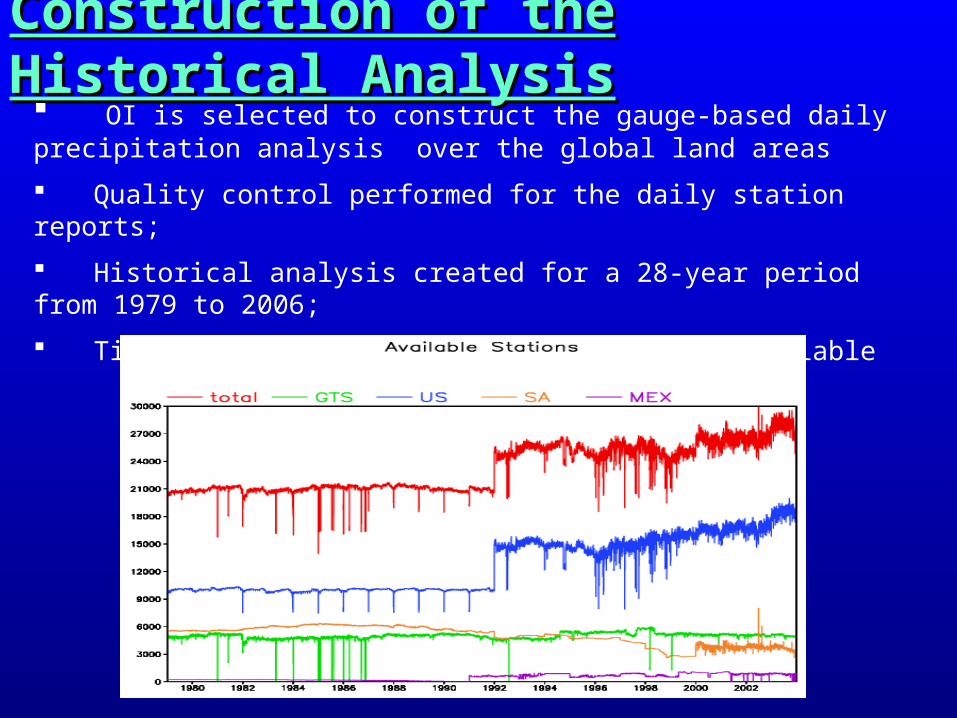
Construction of the Historical AnalysisConstruction of the Historical Analysis OI is selected to construct the gauge-based daily precipitation analysis
over the global land areas
Quality control performed for the daily station reports;
Historical analysis created for a 28-year period from 1979 to 2006;
Time series of numbers of gauge reports available
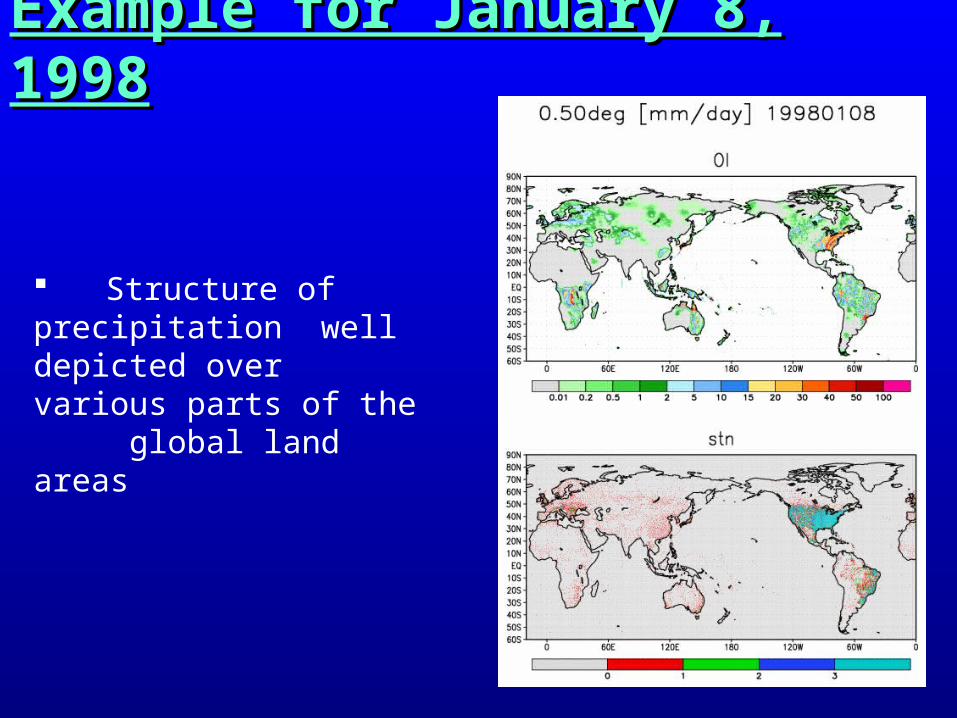
Example for January 8, 1998Example for January 8, 1998
Structure of precipitation well depicted over
various parts of the global land areas
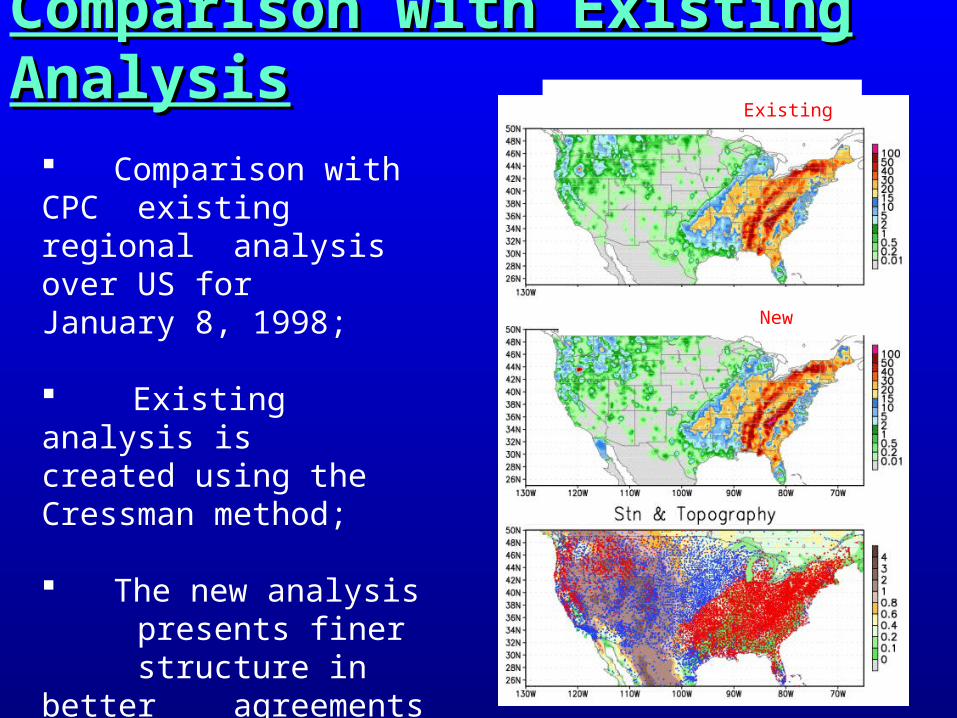
Comparison with Existing AnalysisComparison with Existing Analysis
Comparison with CPC existing regional analysis over US for January 8, 1998;
Existing analysis is created using the Cressman method;
The new analysis presents finer structure in better agreements with station data;
Existing
New
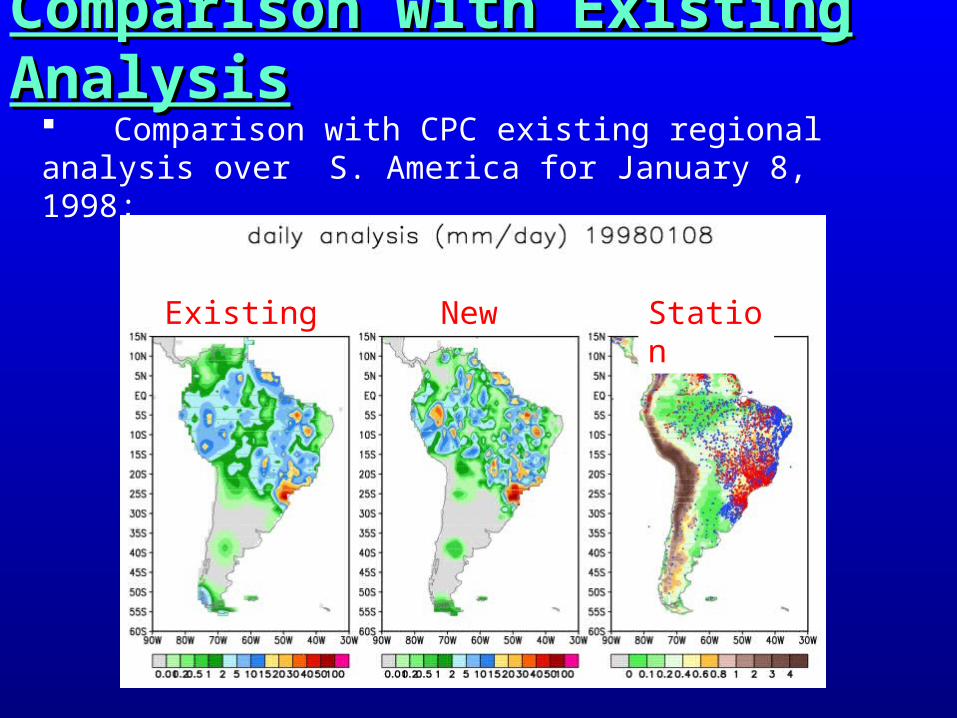
Comparison with Existing AnalysisComparison with Existing Analysis Comparison with CPC existing regional analysis over
S. America for January 8, 1998;
Existing New Station
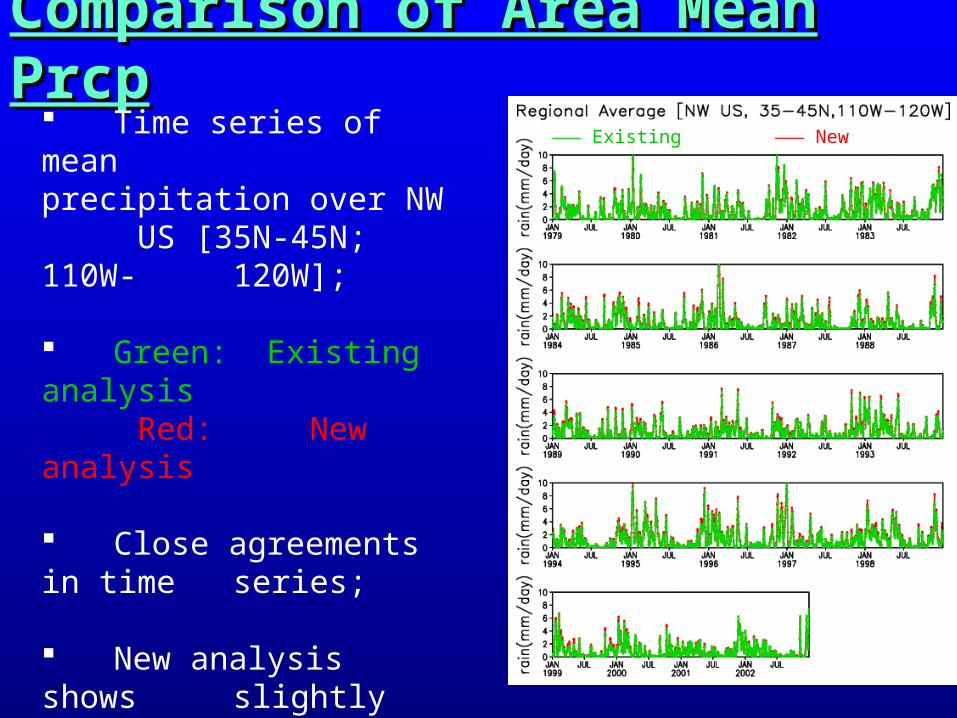
Comparison of Area Mean PrcpComparison of Area Mean Prcp Time series of mean precipitation over NW US [35N-45N; 110W-120W];
Green: Existing analysis Red: New analysis
Close agreements in time series;
New analysis shows slightly larger precipitation due to improved analysis method
Existing New
SummarySummary• Performance of three widely used gauge interpolation methods has
been examined through cross-validation tests and gauge network density impact tests.
• Based on the assessments, the Optimal Interpolation (OI) algorithm is selected to define our gauge-based analysis of daily precipitation.
• Quality control (QC) is performed for daily gauge precipitation reports.
• Gauge-based analyses have been created by interpolating the QCed station data using the OI algorithm for an extended period from 1979 to 2006.
• Preliminary comparisons showed improved quality of our new analysis compared to existing CPC analyses.
• Further work is underway to check the new analysis and to apply it for various climate studies.
Recommended