A quartz crystal microbalance-based molecular ruler for biopolymersw
Hongwei Ma,*ab
Jian’an He,bZhiqiang Zhu,
cBei’er Lv,
aDi Li,
c
Chunhai Fancand Jing Fang
b
Received (in Cambridge, UK) 16th September 2009, Accepted 18th November 2009
First published as an Advance Article on the web 9th December 2009
DOI: 10.1039/b919179h
We developed a quartz crystal microbalance (QCM) based
molecular ruler that measures the length of surface immobilized,
hydrated biopolymers (DNA and proteins). These biopolymers
acted as stakes that solidified surrounding liquid at high
frequency vibration in QCM measurements, which led to a
simple linear frequency–thickness relation.
Many biopolymer interactions are accompanied with size
changes, such as antigen–antibody recognitions, RNA–protein
interactions and DNA hybridizations, etc. The ability to
accurately measure these changes greatly affects our under-
standing of the life process and our ability in designing
molecular machines. Sophisticated instrument and complex
techniques have been applied to measure the size change of
these activities, including neutron scattering,1 atomic force
microscopy,2,3 Forster resonance energy transfer and nano-
particle plasmonics.4,5 While proving efficient, these methods
are only affordable by a few laboratories and they do not
satisfy the routine need of many chemists and biologists.
Quartz crystal microbalance (QCM) is mainly used as a
mass sensor.6,7 It is also used as an online thickness-monitoring
device specifically in the vacuum deposition industry since the
Sauerbrey eqn (1) predicts a simple linear relationship between
the frequency change (Df) and area averaged mass change
(Dm = Tr), where T is the thickness increase and r is the
density of deposited metal:6
Dm = �CDfn/n (1)
where Dfn and fn are the frequency shift and the resonance
frequency at overtone number n, respectively; fn = nf0, n = 1,
3, 5, 7, 9, 11, 13. . .; constant C is 17.7 ng cm�2 Hz�1 for an
AT-cut, 5 MHz crystal. Recently, such simple linear frequency
and thickness change relation (f–T) was also found for
polymers in air.8–11 Furthermore, for QCM in liquid environ-
ment, such simple f–T relation was true but limited to a certain
working thickness range. For example, we found that a
number of polymers exhibited such simple f–T relation if the
dry film thickness was less than 40 nm (note that the wet
thickness would be much higher due to the swelling behavior
of polymer brushes).8–10 Those observations led us to explore
whether QCM operated in liquid environment could be used
as a molecular ruler. We will demonstrate below that QCM
could indeed measure the length of hydrated biopolymers.
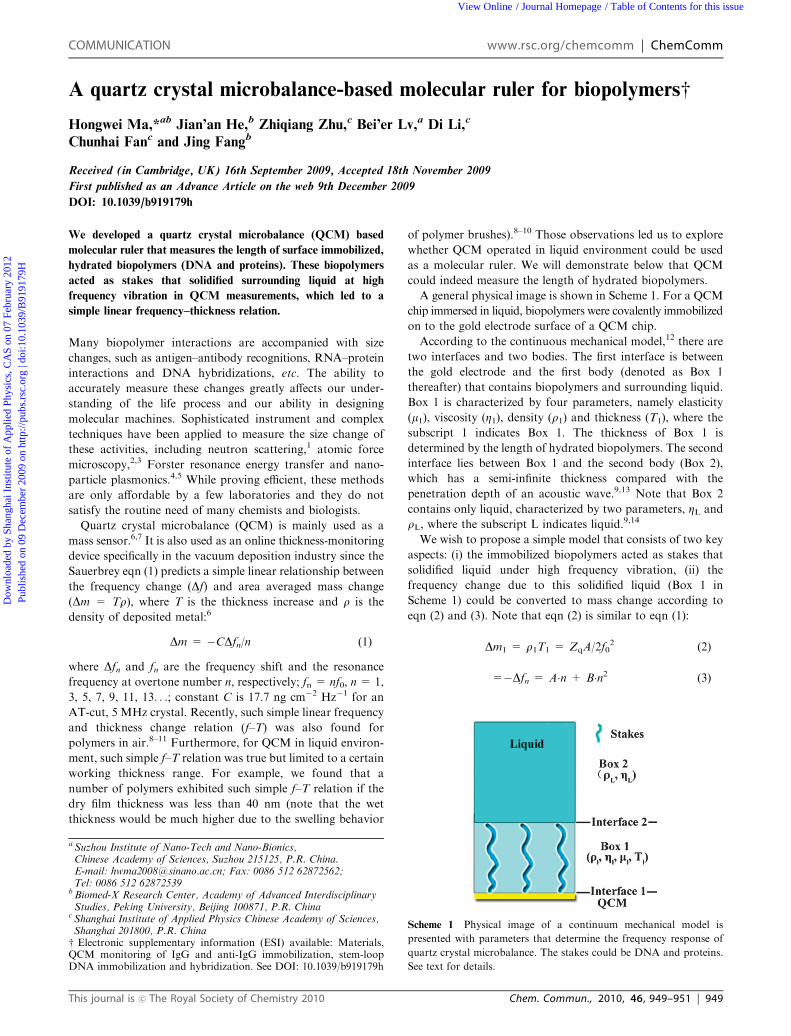
A general physical image is shown in Scheme 1. For a QCM
chip immersed in liquid, biopolymers were covalently immobilized
on to the gold electrode surface of a QCM chip.
According to the continuous mechanical model,12 there are
two interfaces and two bodies. The first interface is between
the gold electrode and the first body (denoted as Box 1
thereafter) that contains biopolymers and surrounding liquid.
Box 1 is characterized by four parameters, namely elasticity
(m1), viscosity (Z1), density (r1) and thickness (T1), where the
subscript 1 indicates Box 1. The thickness of Box 1 is
determined by the length of hydrated biopolymers. The second
interface lies between Box 1 and the second body (Box 2),
which has a semi-infinite thickness compared with the
penetration depth of an acoustic wave.9,13 Note that Box 2
contains only liquid, characterized by two parameters, ZL and
rL, where the subscript L indicates liquid.9,14
We wish to propose a simple model that consists of two key
aspects: (i) the immobilized biopolymers acted as stakes that
solidified liquid under high frequency vibration, (ii) the
frequency change due to this solidified liquid (Box 1 in
Scheme 1) could be converted to mass change according to
eqn (2) and (3). Note that eqn (2) is similar to eqn (1):
Dm1 = r1T1 = ZqA/2f02 (2)
=�Dfn = A�n + B�n2 (3)
Scheme 1 Physical image of a continuum mechanical model is
presented with parameters that determine the frequency response of
quartz crystal microbalance. The stakes could be DNA and proteins.
See text for details.
a Suzhou Institute of Nano-Tech and Nano-Bionics,Chinese Academy of Sciences, Suzhou 215125, P.R. China.E-mail: [email protected]; Fax: 0086 512 62872562;Tel: 0086 512 62872539
b Biomed-X Research Center, Academy of Advanced InterdisciplinaryStudies, Peking University, Beijing 100871, P.R. China
c Shanghai Institute of Applied Physics Chinese Academy of Sciences,Shanghai 201800, P.R. Chinaw Electronic supplementary information (ESI) available: Materials,QCM monitoring of IgG and anti-IgG immobilization, stem-loopDNA immobilization and hybridization. See DOI: 10.1039/b919179h
This journal is �c The Royal Society of Chemistry 2010 Chem. Commun., 2010, 46, 949–951 | 949
COMMUNICATION www.rsc.org/chemcomm | ChemComm
Dow
nloa
ded
by S
hang
hai I
nstit
ute
of A
pplie
d Ph
ysic
s, C
AS
on 0
7 Fe
brua
ry 2
012
Publ
ishe
d on
09
Dec
embe
r 20
09 o
n ht
tp://
pubs
.rsc
.org
| do
i:10.
1039
/B91
9179
HView Online / Journal Homepage / Table of Contents for this issue
where r1 and T1 are the density and thickness of the solidified
liquid, respectively; Zq = 8.8 � 106 kg m�2 s�1 is the acoustic
impedance of the crystalline quartz.
In a recent report,10 we found that by fitting the data
according to eqn (3), the frequency changes contributed by
mass changes could be separated from that contributed by
viscoelasticity changes. The fitted value A contains only the
wet mass (i.e., biopolymers with solidified liquid), free of
viscoelastic contribution. Thus, one could calculate the
thickness of hydrated/swelled biopolymers if the density of
Box 1 was known. And we will prove below that the density of
Box 1 could be approximated as the density of liquid itself
(i.e., the density of PBS buffer). Two types of biopolymers,
namely DNA and protein IgG were tested to validate our
proposed model and their hydrated lengths were successfully
determined.
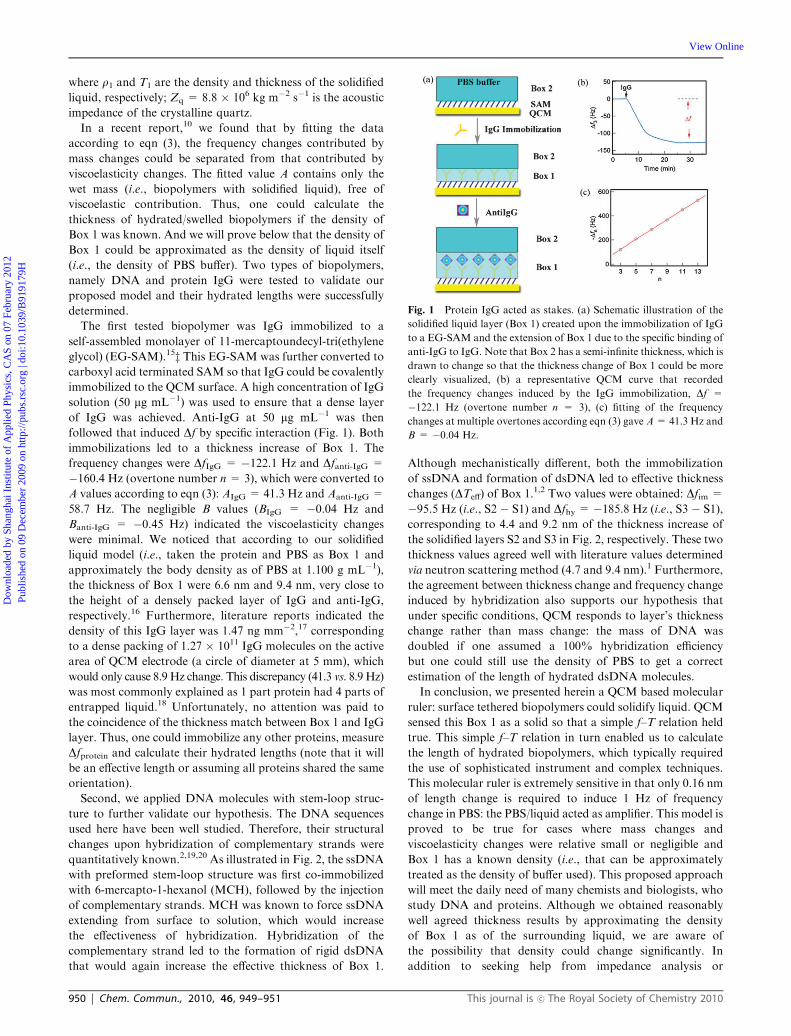
The first tested biopolymer was IgG immobilized to a
self-assembled monolayer of 11-mercaptoundecyl-tri(ethylene
glycol) (EG-SAM).15z This EG-SAM was further converted to
carboxyl acid terminated SAM so that IgG could be covalently
immobilized to the QCM surface. A high concentration of IgG
solution (50 mg mL�1) was used to ensure that a dense layer
of IgG was achieved. Anti-IgG at 50 mg mL�1 was then
followed that induced Df by specific interaction (Fig. 1). Both
immobilizations led to a thickness increase of Box 1. The
frequency changes were DfIgG = �122.1 Hz and Dfanti-IgG =
�160.4 Hz (overtone number n = 3), which were converted to
A values according to eqn (3): AIgG = 41.3 Hz and Aanti-IgG =
58.7 Hz. The negligible B values (BIgG = �0.04 Hz and
Banti-IgG = �0.45 Hz) indicated the viscoelasticity changes
were minimal. We noticed that according to our solidified
liquid model (i.e., taken the protein and PBS as Box 1 and
approximately the body density as of PBS at 1.100 g mL�1),
the thickness of Box 1 were 6.6 nm and 9.4 nm, very close to
the height of a densely packed layer of IgG and anti-IgG,
respectively.16 Furthermore, literature reports indicated the
density of this IgG layer was 1.47 ng mm�2,17 corresponding
to a dense packing of 1.27 � 1011 IgG molecules on the active
area of QCM electrode (a circle of diameter at 5 mm), which
would only cause 8.9 Hz change. This discrepancy (41.3 vs. 8.9 Hz)
was most commonly explained as 1 part protein had 4 parts of
entrapped liquid.18 Unfortunately, no attention was paid to
the coincidence of the thickness match between Box 1 and IgG
layer. Thus, one could immobilize any other proteins, measure
Dfprotein and calculate their hydrated lengths (note that it will
be an effective length or assuming all proteins shared the same
orientation).
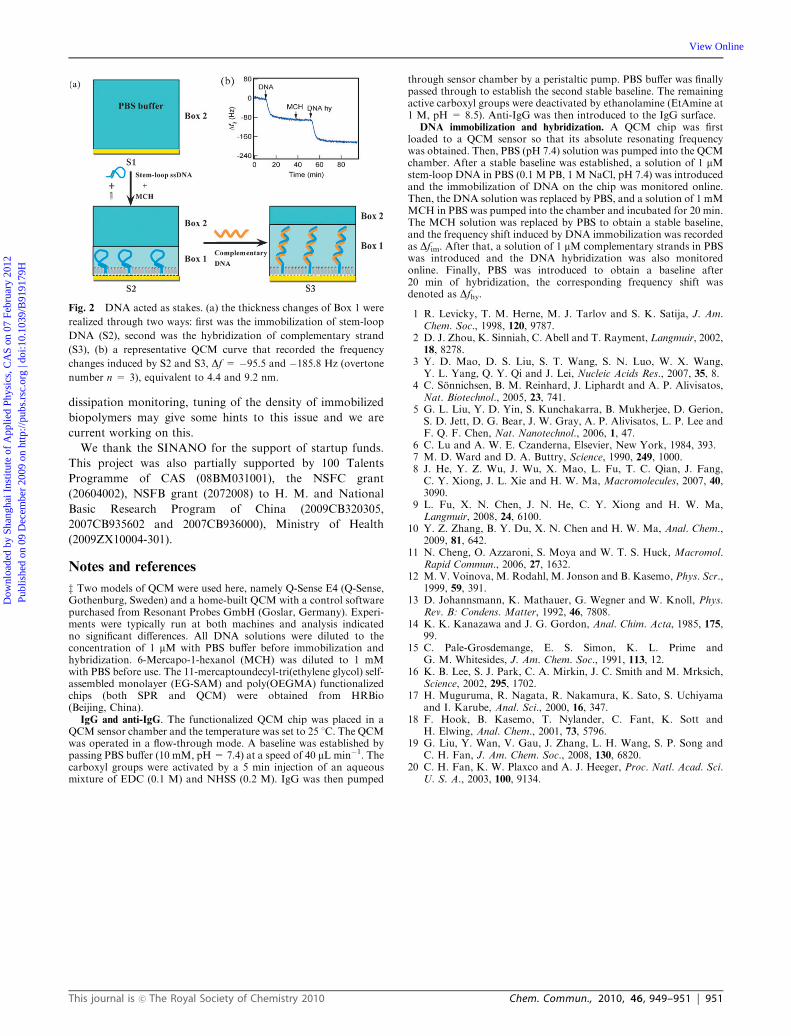
Second, we applied DNA molecules with stem-loop struc-
ture to further validate our hypothesis. The DNA sequences
used here have been well studied. Therefore, their structural
changes upon hybridization of complementary strands were
quantitatively known.2,19,20 As illustrated in Fig. 2, the ssDNA
with preformed stem-loop structure was first co-immobilized
with 6-mercapto-1-hexanol (MCH), followed by the injection
of complementary strands. MCH was known to force ssDNA
extending from surface to solution, which would increase
the effectiveness of hybridization. Hybridization of the
complementary strand led to the formation of rigid dsDNA
that would again increase the effective thickness of Box 1.
Although mechanistically different, both the immobilization
of ssDNA and formation of dsDNA led to effective thickness
changes (DTeff) of Box 1.1,2 Two values were obtained: Dfim =
�95.5 Hz (i.e., S2 � S1) and Dfhy = �185.8 Hz (i.e., S3 � S1),
corresponding to 4.4 and 9.2 nm of the thickness increase of
the solidified layers S2 and S3 in Fig. 2, respectively. These two
thickness values agreed well with literature values determined
via neutron scattering method (4.7 and 9.4 nm).1 Furthermore,
the agreement between thickness change and frequency change
induced by hybridization also supports our hypothesis that
under specific conditions, QCM responds to layer’s thickness
change rather than mass change: the mass of DNA was
doubled if one assumed a 100% hybridization efficiency
but one could still use the density of PBS to get a correct
estimation of the length of hydrated dsDNA molecules.
In conclusion, we presented herein a QCM based molecular
ruler: surface tethered biopolymers could solidify liquid. QCM
sensed this Box 1 as a solid so that a simple f–T relation held
true. This simple f–T relation in turn enabled us to calculate
the length of hydrated biopolymers, which typically required
the use of sophisticated instrument and complex techniques.
This molecular ruler is extremely sensitive in that only 0.16 nm
of length change is required to induce 1 Hz of frequency
change in PBS: the PBS/liquid acted as amplifier. This model is
proved to be true for cases where mass changes and
viscoelasticity changes were relative small or negligible and
Box 1 has a known density (i.e., that can be approximately
treated as the density of buffer used). This proposed approach
will meet the daily need of many chemists and biologists, who
study DNA and proteins. Although we obtained reasonably
well agreed thickness results by approximating the density
of Box 1 as of the surrounding liquid, we are aware of
the possibility that density could change significantly. In
addition to seeking help from impedance analysis or
Fig. 1 Protein IgG acted as stakes. (a) Schematic illustration of the
solidified liquid layer (Box 1) created upon the immobilization of IgG
to a EG-SAM and the extension of Box 1 due to the specific binding of
anti-IgG to IgG. Note that Box 2 has a semi-infinite thickness, which is
drawn to change so that the thickness change of Box 1 could be more
clearly visualized, (b) a representative QCM curve that recorded
the frequency changes induced by the IgG immobilization, Df =
�122.1 Hz (overtone number n = 3), (c) fitting of the frequency
changes at multiple overtones according eqn (3) gave A= 41.3 Hz and
B = �0.04 Hz.
950 | Chem. Commun., 2010, 46, 949–951 This journal is �c The Royal Society of Chemistry 2010
Dow
nloa
ded
by S
hang
hai I
nstit
ute
of A
pplie
d Ph
ysic
s, C
AS
on 0
7 Fe
brua
ry 2
012
Publ
ishe
d on
09
Dec
embe
r 20
09 o
n ht
tp://
pubs
.rsc
.org
| do
i:10.
1039
/B91
9179
H
View Online
dissipation monitoring, tuning of the density of immobilized
biopolymers may give some hints to this issue and we are
current working on this.
We thank the SINANO for the support of startup funds.
This project was also partially supported by 100 Talents
Programme of CAS (08BM031001), the NSFC grant
(20604002), NSFB grant (2072008) to H. M. and National
Basic Research Program of China (2009CB320305,
2007CB935602 and 2007CB936000), Ministry of Health
(2009ZX10004-301).
Notes and references
z Two models of QCM were used here, namely Q-Sense E4 (Q-Sense,Gothenburg, Sweden) and a home-built QCM with a control softwarepurchased from Resonant Probes GmbH (Goslar, Germany). Experi-ments were typically run at both machines and analysis indicatedno significant differences. All DNA solutions were diluted to theconcentration of 1 mM with PBS buffer before immobilization andhybridization. 6-Mercapo-1-hexanol (MCH) was diluted to 1 mMwith PBS before use. The 11-mercaptoundecyl-tri(ethylene glycol) self-assembled monolayer (EG-SAM) and poly(OEGMA) functionalizedchips (both SPR and QCM) were obtained from HRBio(Beijing, China).
IgG and anti-IgG. The functionalized QCM chip was placed in aQCM sensor chamber and the temperature was set to 25 1C. The QCMwas operated in a flow-through mode. A baseline was established bypassing PBS buffer (10 mM, pH= 7.4) at a speed of 40 mL min�1. Thecarboxyl groups were activated by a 5 min injection of an aqueousmixture of EDC (0.1 M) and NHSS (0.2 M). IgG was then pumped
through sensor chamber by a peristaltic pump. PBS buffer was finallypassed through to establish the second stable baseline. The remainingactive carboxyl groups were deactivated by ethanolamine (EtAmine at1 M, pH = 8.5). Anti-IgG was then introduced to the IgG surface.
DNA immobilization and hybridization. A QCM chip was firstloaded to a QCM sensor so that its absolute resonating frequencywas obtained. Then, PBS (pH 7.4) solution was pumped into the QCMchamber. After a stable baseline was established, a solution of 1 mMstem-loop DNA in PBS (0.1 M PB, 1 M NaCl, pH 7.4) was introducedand the immobilization of DNA on the chip was monitored online.Then, the DNA solution was replaced by PBS, and a solution of 1 mMMCH in PBS was pumped into the chamber and incubated for 20 min.The MCH solution was replaced by PBS to obtain a stable baseline,and the frequency shift induced by DNA immobilization was recordedas Dfim. After that, a solution of 1 mM complementary strands in PBSwas introduced and the DNA hybridization was also monitoredonline. Finally, PBS was introduced to obtain a baseline after20 min of hybridization, the corresponding frequency shift wasdenoted as Dfhy.
1 R. Levicky, T. M. Herne, M. J. Tarlov and S. K. Satija, J. Am.Chem. Soc., 1998, 120, 9787.
2 D. J. Zhou, K. Sinniah, C. Abell and T. Rayment, Langmuir, 2002,18, 8278.
3 Y. D. Mao, D. S. Liu, S. T. Wang, S. N. Luo, W. X. Wang,Y. L. Yang, Q. Y. Qi and J. Lei, Nucleic Acids Res., 2007, 35, 8.
4 C. Sonnichsen, B. M. Reinhard, J. Liphardt and A. P. Alivisatos,Nat. Biotechnol., 2005, 23, 741.
5 G. L. Liu, Y. D. Yin, S. Kunchakarra, B. Mukherjee, D. Gerion,S. D. Jett, D. G. Bear, J. W. Gray, A. P. Alivisatos, L. P. Lee andF. Q. F. Chen, Nat. Nanotechnol., 2006, 1, 47.
6 C. Lu and A. W. E. Czanderna, Elsevier, New York, 1984, 393.7 M. D. Ward and D. A. Buttry, Science, 1990, 249, 1000.8 J. He, Y. Z. Wu, J. Wu, X. Mao, L. Fu, T. C. Qian, J. Fang,C. Y. Xiong, J. L. Xie and H. W. Ma, Macromolecules, 2007, 40,3090.
9 L. Fu, X. N. Chen, J. N. He, C. Y. Xiong and H. W. Ma,Langmuir, 2008, 24, 6100.
10 Y. Z. Zhang, B. Y. Du, X. N. Chen and H. W. Ma, Anal. Chem.,2009, 81, 642.
11 N. Cheng, O. Azzaroni, S. Moya and W. T. S. Huck, Macromol.Rapid Commun., 2006, 27, 1632.
12 M. V. Voinova, M. Rodahl, M. Jonson and B. Kasemo, Phys. Scr.,1999, 59, 391.
13 D. Johannsmann, K. Mathauer, G. Wegner and W. Knoll, Phys.Rev. B: Condens. Matter, 1992, 46, 7808.
14 K. K. Kanazawa and J. G. Gordon, Anal. Chim. Acta, 1985, 175,99.
15 C. Pale-Grosdemange, E. S. Simon, K. L. Prime andG. M. Whitesides, J. Am. Chem. Soc., 1991, 113, 12.
16 K. B. Lee, S. J. Park, C. A. Mirkin, J. C. Smith and M. Mrksich,Science, 2002, 295, 1702.
17 H. Muguruma, R. Nagata, R. Nakamura, K. Sato, S. Uchiyamaand I. Karube, Anal. Sci., 2000, 16, 347.
18 F. Hook, B. Kasemo, T. Nylander, C. Fant, K. Sott andH. Elwing, Anal. Chem., 2001, 73, 5796.
19 G. Liu, Y. Wan, V. Gau, J. Zhang, L. H. Wang, S. P. Song andC. H. Fan, J. Am. Chem. Soc., 2008, 130, 6820.
20 C. H. Fan, K. W. Plaxco and A. J. Heeger, Proc. Natl. Acad. Sci.U. S. A., 2003, 100, 9134.
Fig. 2 DNA acted as stakes. (a) the thickness changes of Box 1 were
realized through two ways: first was the immobilization of stem-loop
DNA (S2), second was the hybridization of complementary strand
(S3), (b) a representative QCM curve that recorded the frequency
changes induced by S2 and S3, Df = �95.5 and �185.8 Hz (overtone
number n = 3), equivalent to 4.4 and 9.2 nm.
This journal is �c The Royal Society of Chemistry 2010 Chem. Commun., 2010, 46, 949–951 | 951
Dow
nloa
ded
by S
hang
hai I
nstit
ute
of A
pplie
d Ph
ysic
s, C
AS
on 0
7 Fe
brua
ry 2
012
Publ
ishe
d on
09
Dec
embe
r 20
09 o
n ht
tp://
pubs
.rsc
.org
| do
i:10.
1039
/B91
9179
H
View Online
Recommended