ASSOCIATION BETWEEN DIABETES MELLITUS AND METABOLIC SYNDROME
Coordinator:
Conf. Dr. Fazakas Zita
Author:
Fanfaret Ioan Serban
http://diabetesstopshere.org/wp-content/uploads/2010/09/DSHDraft1.jpg
BACKGROUND:
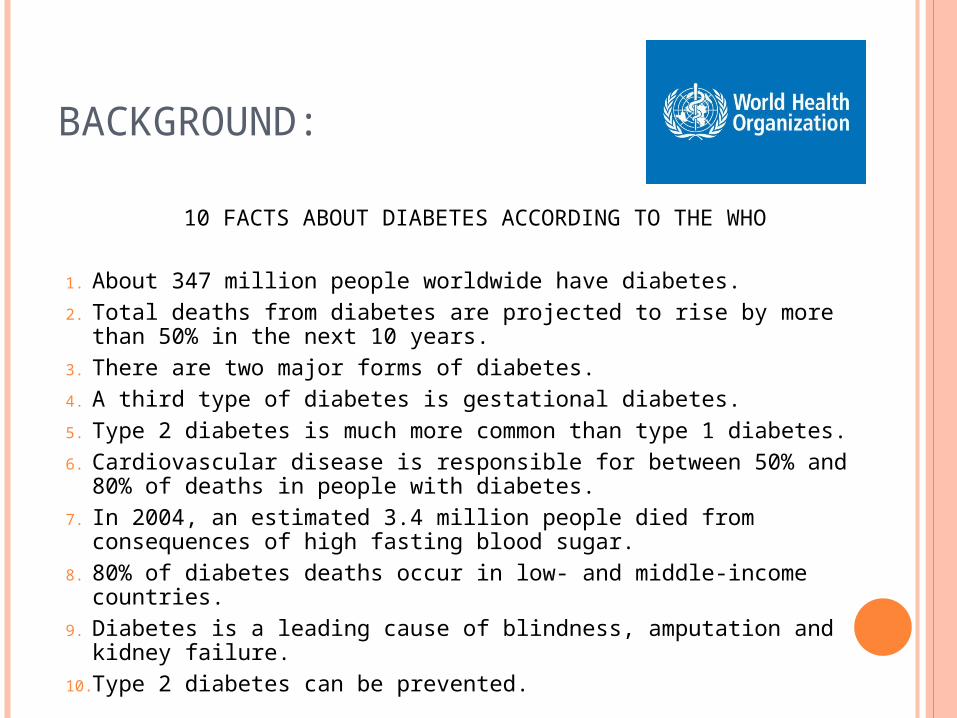
10 FACTS ABOUT DIABETES ACCORDING TO THE WHO
1. About 347 million people worldwide have diabetes.
2. Total deaths from diabetes are projected to rise by more than 50% in the next 10 years.
3. There are two major forms of diabetes.
4. A third type of diabetes is gestational diabetes.
5. Type 2 diabetes is much more common than type 1 diabetes.
6. Cardiovascular disease is responsible for between 50% and 80% of deaths in people with diabetes.
7. In 2004, an estimated 3.4 million people died from consequences of high fasting blood sugar.
8. 80% of diabetes deaths occur in low- and middle-income countries.
9. Diabetes is a leading cause of blindness, amputation and kidney failure.
10. Type 2 diabetes can be prevented.
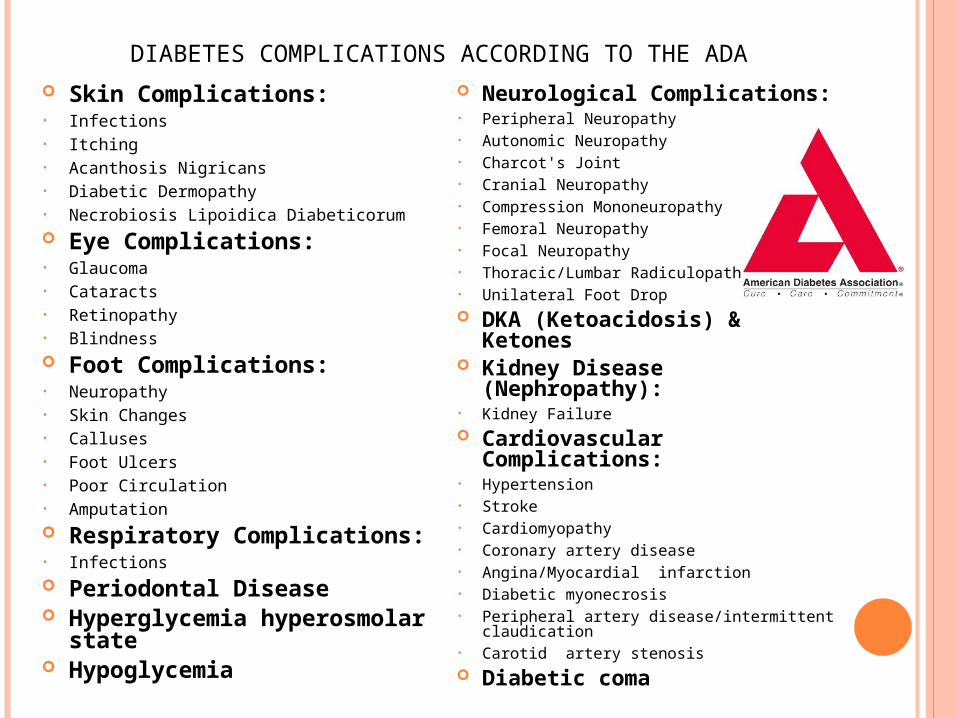
DIABETES COMPLICATIONS ACCORDING TO THE ADA
Skin Complications:• Infections• Itching• Acanthosis Nigricans• Diabetic Dermopathy• Necrobiosis Lipoidica Diabeticorum Eye Complications:• Glaucoma• Cataracts• Retinopathy• Blindness Foot Complications:• Neuropathy• Skin Changes• Calluses• Foot Ulcers• Poor Circulation• Amputation Respiratory Complications:• Infections Periodontal Disease Hyperglycemia hyperosmolar state Hypoglycemia
Neurological Complications:• Peripheral Neuropathy• Autonomic Neuropathy• Charcot's Joint• Cranial Neuropathy• Compression Mononeuropathy• Femoral Neuropathy• Focal Neuropathy• Thoracic/Lumbar Radiculopathy• Unilateral Foot Drop DKA (Ketoacidosis) & Ketones Kidney Disease (Nephropathy):• Kidney Failure Cardiovascular Complications:• Hypertension• Stroke• Cardiomyopathy• Coronary artery disease • Angina/Myocardial infarction • Diabetic myonecrosis• Peripheral artery disease/intermittent claudication• Carotid artery stenosis Diabetic coma
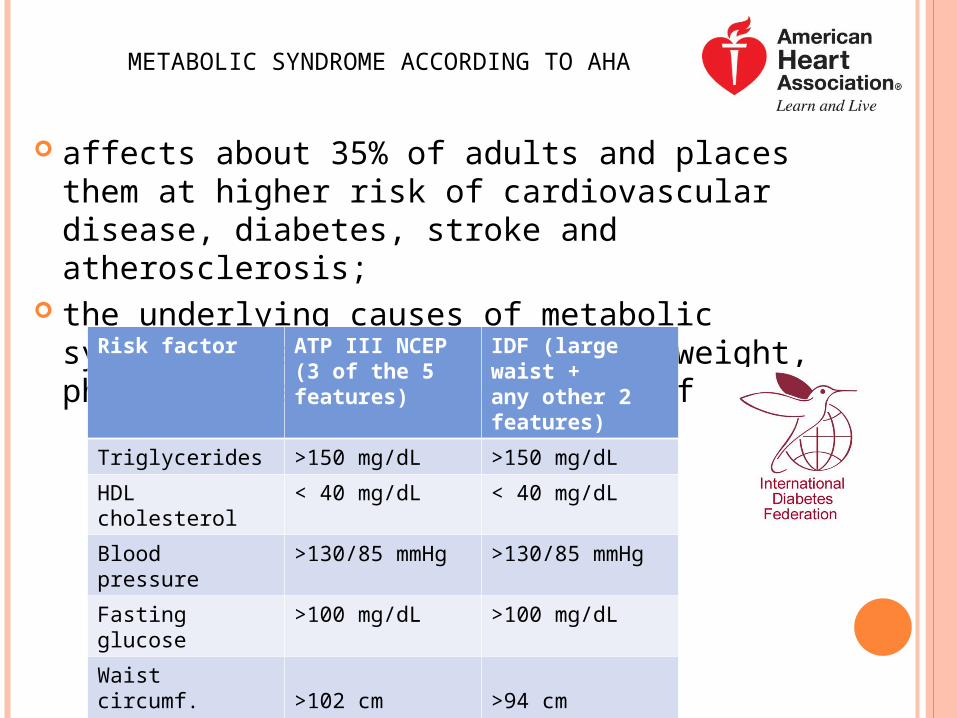
METABOLIC SYNDROME ACCORDING TO AHA
affects about 35% of adults and places them at higher risk of cardiovascular disease, diabetes, stroke and atherosclerosis;
the underlying causes of metabolic syndrome are obesity, being overweight, physical inactivity and genetic factors.
Risk factor ATP III NCEP(3 of the 5features)
IDF (large waist +any other 2features)
Triglycerides >150 mg/dL >150 mg/dL
HDL cholesterol < 40 mg/dL < 40 mg/dL
Blood pressure >130/85 mmHg >130/85 mmHg
Fasting glucose >100 mg/dL >100 mg/dL
Waist circumf.MenWoman
>102 cm>88 cm
>94 cm>80 cm
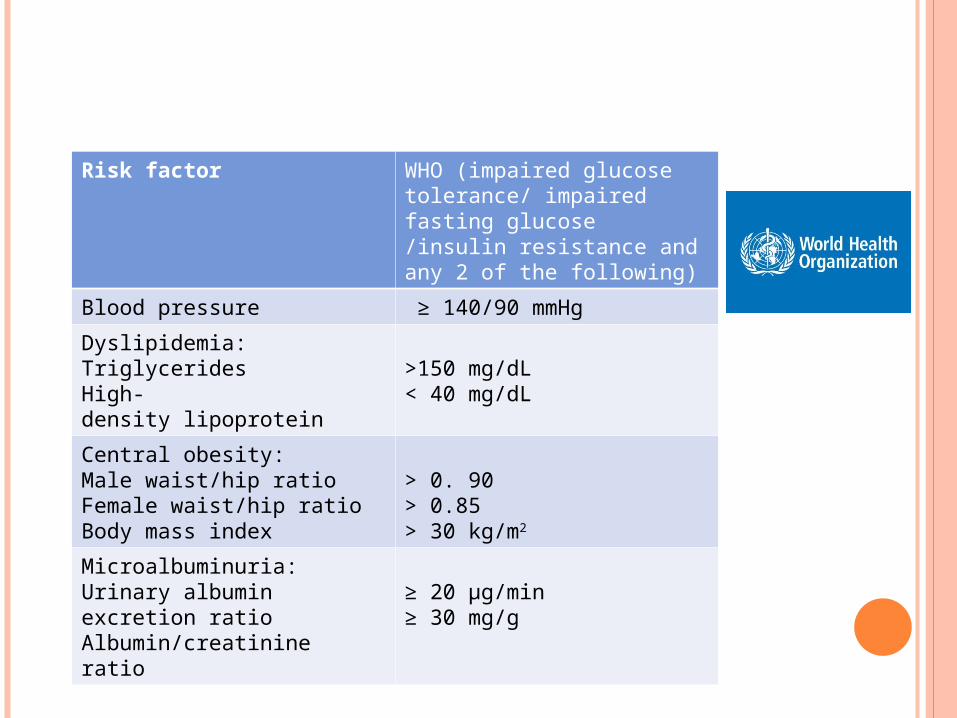
Risk factor WHO (impaired glucose tolerance/ impaired fasting glucose /insulin resistance and any 2 of the following)
Blood pressure ≥ 140/90 mmHg
Dyslipidemia:Triglycerides High-density lipoprotein
>150 mg/dL< 40 mg/dL
Central obesity:Male waist/hip ratio Female waist/hip ratioBody mass index
> 0. 90 > 0.85> 30 kg/m2
Microalbuminuria:Urinary albumin excretion ratioAlbumin/creatinine ratio
≥ 20 µg/min≥ 30 mg/g
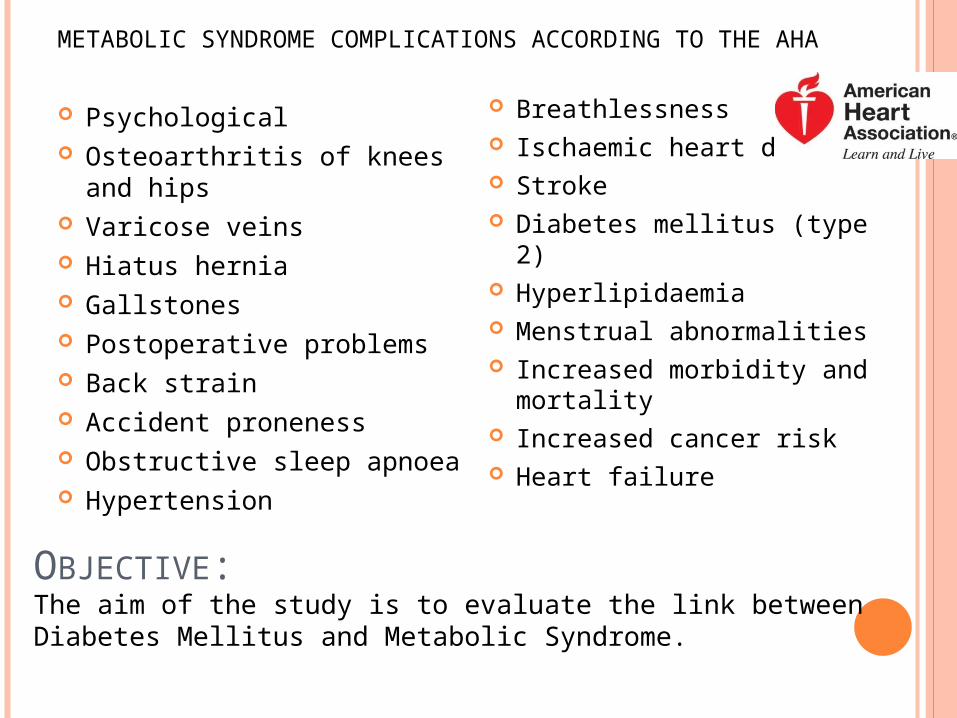
METABOLIC SYNDROME COMPLICATIONS ACCORDING TO THE AHA
Psychological Osteoarthritis of knees and hips Varicose veins Hiatus hernia Gallstones Postoperative problems Back strain Accident proneness Obstructive sleep apnoea Hypertension
Breathlessness Ischaemic heart disease Stroke Diabetes mellitus (type 2) Hyperlipidaemia Menstrual abnormalities Increased morbidity and
mortality Increased cancer risk Heart failure
OBJECTIVE:The aim of the study is to evaluate the link between Diabetes Mellitus and Metabolic Syndrome.

MY WORK
MATERIAL AND METHOD:
We included 106 patients being in the evidence of three General Pactitioners Cabinets from Tg. Mures.
Information was provided from the medical records of all patients diagnosed with both Diabetes type 1 and 2.
Patients were evaluated for:
1. gender,
2. age,
3. medical conditions,
4. complications,
5. medical treatment,
6. laboratory analysis.
Type 1 diabetes according to WHO• is characterized by deficient insulin production and requires daily
administration of insulin;• symptoms may occur suddenly and include polyuria, polydipsia,
constant hunger, weight loss, vision changes and fatigue.
Type 2 diabetes according to WHO• results from the body’s ineffective use of insulin;• comprises 90% of people with diabetes around the world, and is the
result of excess body weight and physical inactivity;• symptoms may be similar to those of type 1 diabetes, but are often less
marked
Medical treatment: Involves lowering blood glucose and the levels of other known risk
factors that damage blood vessels:• Biguanide (metformin)
• Sulfonylureas• Meglitinides
• Thiazolidinediones• Dipeptidyl peptidase-4 (DPP4) inhibitors
• GLP-1 agonists (exenatide and liraglutide)• Insulin treatment
American association of diabetes also recommends:• blood pressure control, • feet care, • screening and treatment for retinopathy, • blood lipid control,• screening for early signs of diabetes-related kidney disease.
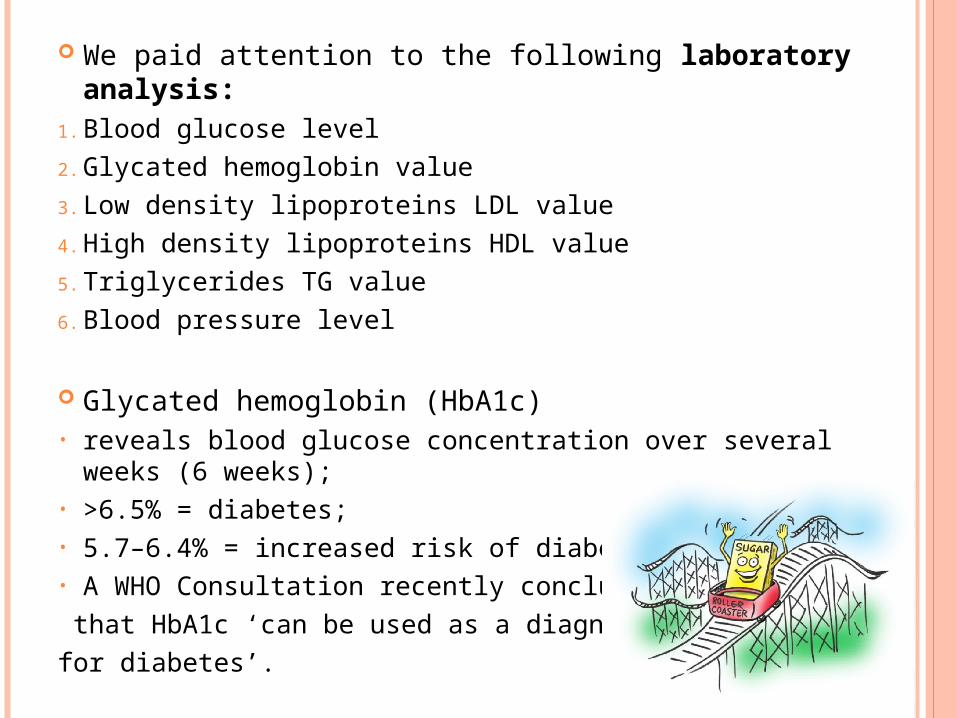
We paid attention to the following laboratory analysis: 1. Blood glucose level
2. Glycated hemoglobin value
3. Low density lipoproteins LDL value
4. High density lipoproteins HDL value
5. Triglycerides TG value
6. Blood pressure level
Glycated hemoglobin (HbA1c)• reveals blood glucose concentration over several weeks (6 weeks);• >6.5% = diabetes;• 5.7–6.4% = increased risk of diabetes;• A WHO Consultation recently concluded
that HbA1c ‘can be used as a diagnostic test
for diabetes’.
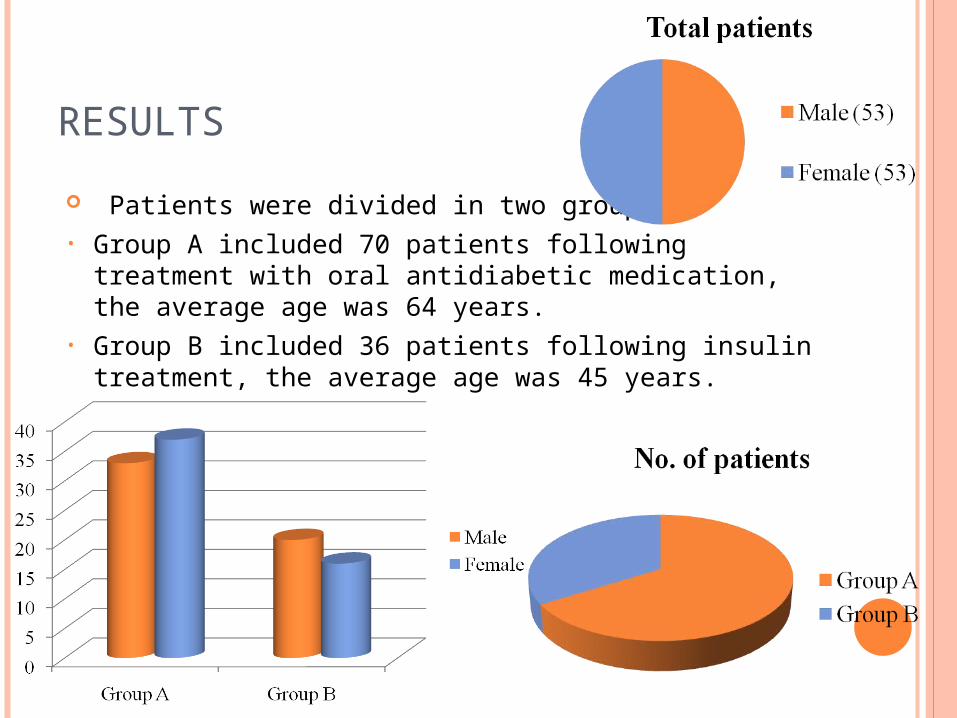
RESULTS
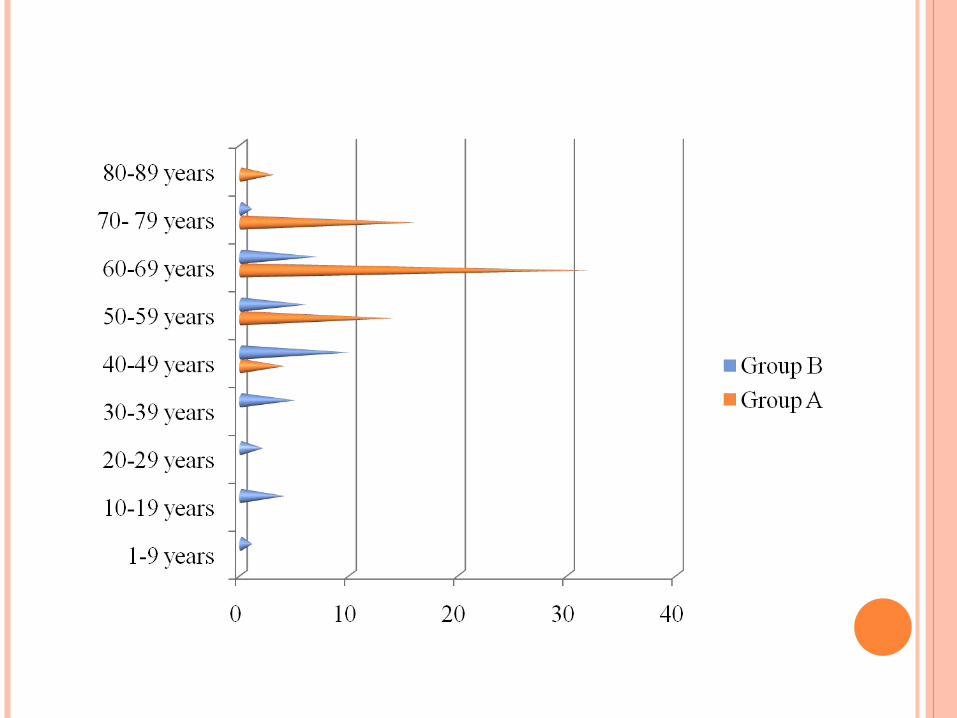
Patients were divided in two groups: • Group A included 70 patients following treatment with oral
antidiabetic medication, the average age was 64 years. • Group B included 36 patients following insulin treatment, the
average age was 45 years.
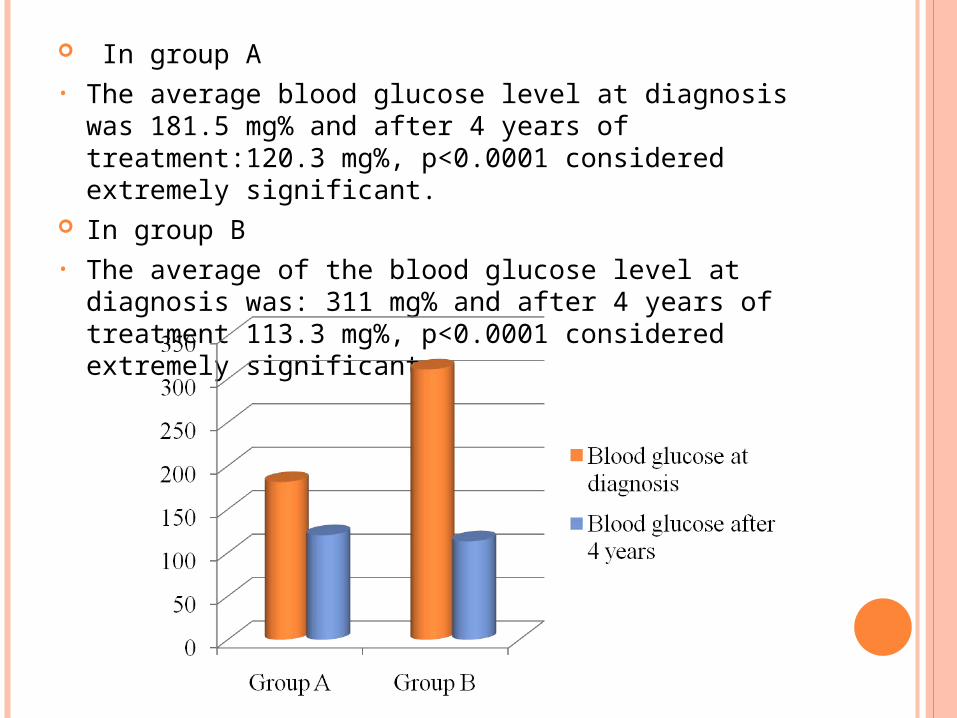
In group A • The average blood glucose level at diagnosis was 181.5 mg% and
after 4 years of treatment:120.3 mg%, p<0.0001 considered extremely significant.
In group B• The average of the blood glucose level at diagnosis was: 311 mg%
and after 4 years of treatment 113.3 mg%, p<0.0001 considered extremely significant.
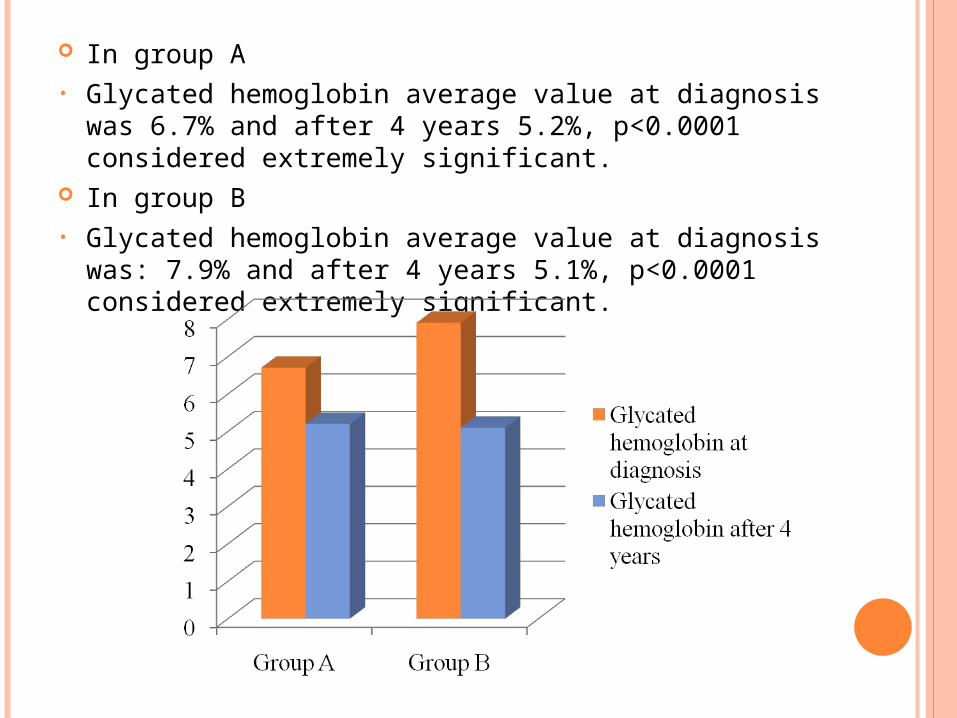
In group A• Glycated hemoglobin average value at diagnosis was 6.7% and after 4
years 5.2%, p<0.0001 considered extremely significant. In group B• Glycated hemoglobin average value at diagnosis was: 7.9% and after 4
years 5.1%, p<0.0001 considered extremely significant.
In group A• Glycated hemoglobin is most strongly correlated with
blood glucose (r=0.752), serum triglyceride (TG), (r=0.310) and serum low density lipoproteins (LDL), (r=0.271).
In group B• Glycated hemoglobin is also most strongly correlated
with blood glucose (r=0.692), serum triglycerides (TG), (r=0.319) and low density lipoproteins (LDL), (r=0.228).
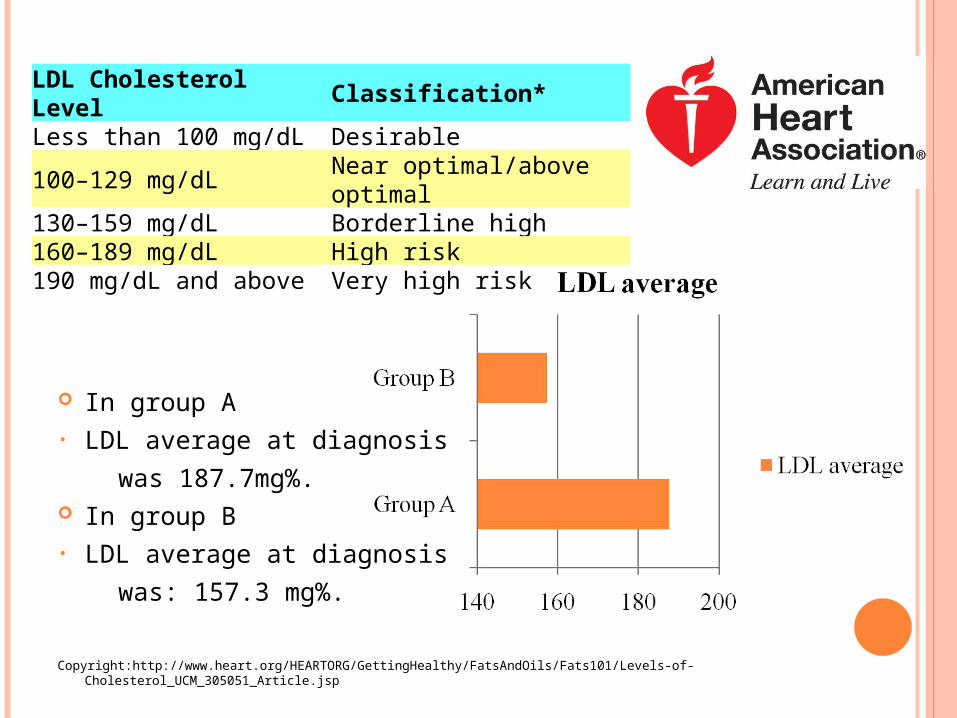
In group A• LDL average at diagnosis
was 187.7mg%. In group B• LDL average at diagnosis
was: 157.3 mg%.
Copyright:http://www.heart.org/HEARTORG/GettingHealthy/FatsAndOils/Fats101/Levels-of-Cholesterol_UCM_305051_Article.jsp
LDL Cholesterol Level Classification*Less than 100 mg/dL Desirable100–129 mg/dL Near optimal/above optimal130–159 mg/dL Borderline high160–189 mg/dL High risk190 mg/dL and above Very high risk
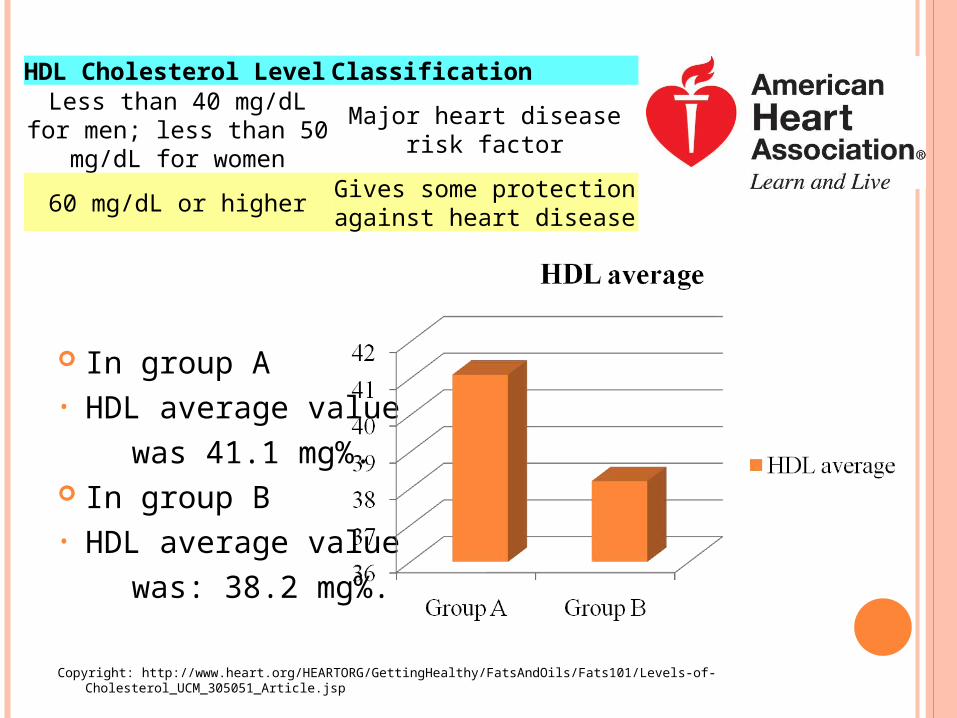
In group A• HDL average value
was 41.1 mg%. In group B• HDL average value
was: 38.2 mg%.
Copyright: http://www.heart.org/HEARTORG/GettingHealthy/FatsAndOils/Fats101/Levels-of-Cholesterol_UCM_305051_Article.jsp
HDL Cholesterol Level Classification
Less than 40 mg/dL for men; less than 50 mg/dL for women
Major heart disease risk factor
60 mg/dL or higherGives some protection against
heart disease
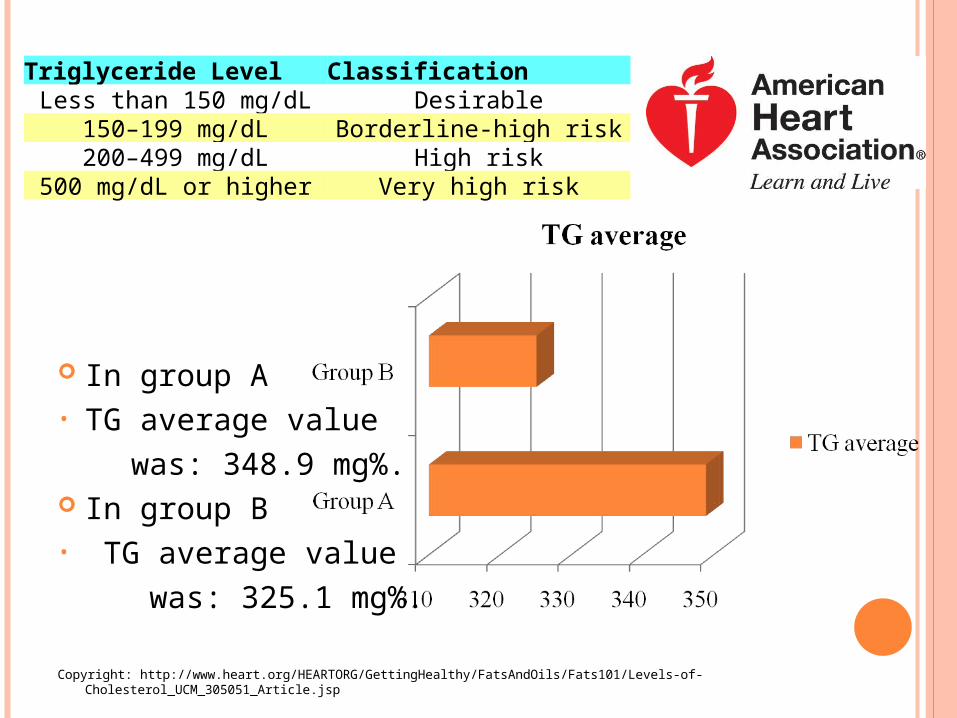
In group A• TG average value
was: 348.9 mg%. In group B• TG average value
was: 325.1 mg%.
Copyright: http://www.heart.org/HEARTORG/GettingHealthy/FatsAndOils/Fats101/Levels-of-Cholesterol_UCM_305051_Article.jsp
Triglyceride Level ClassificationLess than 150 mg/dL Desirable
150–199 mg/dL Borderline-high risk200–499 mg/dL High risk
500 mg/dL or higher Very high risk
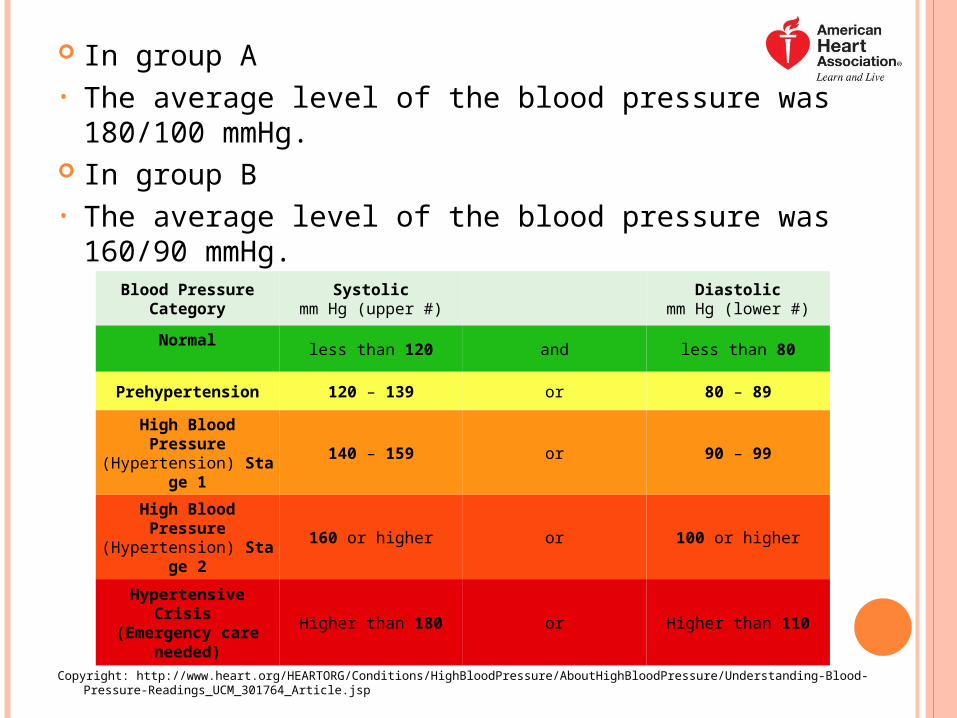
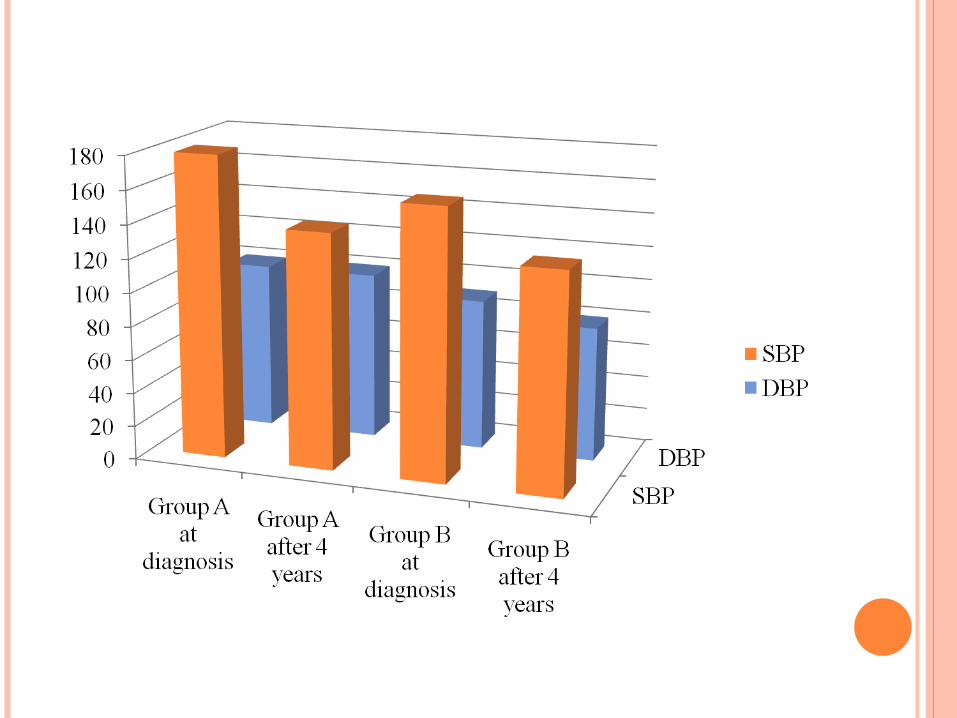
In group A• The average level of the blood pressure was 180/100 mmHg. In group B• The average level of the blood pressure was 160/90 mmHg.
Copyright: http://www.heart.org/HEARTORG/Conditions/HighBloodPressure/AboutHighBloodPressure/Understanding-Blood-Pressure-Readings_UCM_301764_Article.jsp
Blood PressureCategory
Systolicmm Hg (upper #)
Diastolic
mm Hg (lower #)
Normal
less than 120 and less than 80
Prehypertension 120 – 139 or 80 – 89
High Blood Pressure(Hypertension) Stage 1
140 – 159 or 90 – 99
High Blood Pressure(Hypertension) Stage 2
160 or higher or 100 or higher
Hypertensive Crisis (Emergency care needed)
Higher than 180 or Higher than 110
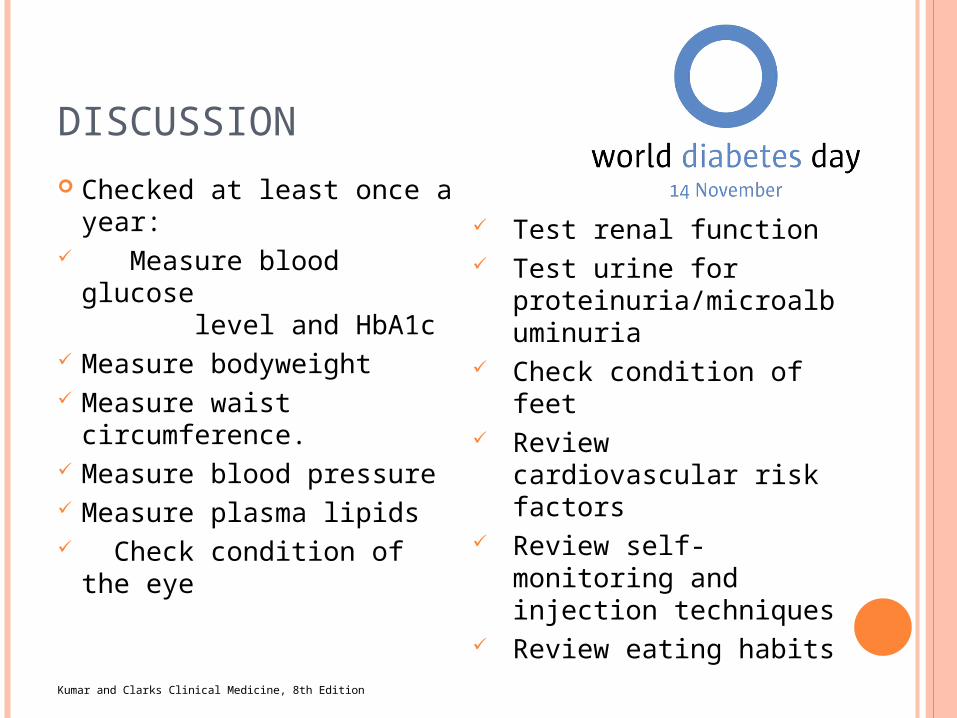
DISCUSSION
Checked at least once a year: Measure blood glucose
level and HbA1c Measure bodyweight Measure waist
circumference. Measure blood pressure Measure plasma lipids Check condition of the eye
Kumar and Clarks Clinical Medicine, 8th Edition
Test renal function Test urine for
proteinuria/microalbuminuria
Check condition of feet Review cardiovascular
risk factors Review self-monitoring
and injection techniques Review eating habits
CONCLUSIONS
In group A the average age was higher than in group B and included more patients. Patients in group A had higher values of the lipid profile and blood pressure, but lower values of the blood glucose and glycated hemoglobin than patients in group B.
Glycated hemoglobin is strongly correlated with blood glucose, TG and LDL.
Diabetes Mellitus has a negative influence over the lipid metabolism, carbohydrates and cardiovascular system and there is a strong association between Diabetes Mellitus and Metabolic Syndrome.
BIBLIOGRAPHY
American Diabetes Association: http://www.diabetes.org/ American Heart Association: http://www.heart.org/ World Health Organization: http://www.who.int/en/ International Diabetes Federation: http://www.idf.org/ Kumar and Clarks Clinical Medicine, 8th Edition The Johns Hopkins Internal Medicine Board Review, 4th Edition ABC.of.Diabetes.6th.Ed Guide to Lab & Diagnostic Tests, Tracey B. Hopkins
THANK YOU FOR YOUR ATTENTION!
Recommended