A Wireless Sensor for Monitoring Chloride Ingress in Concrete
MMC09-028
12th AASHTO-TRB Maintenance Management Conference Annapolis, MDJuly 19-23, 2009
July 21, 2009
Contact [email protected](240) 228-6378(443) 841-8825 (mobile)
Rengaswamy (Srini) Srinivasan
Team and Acknowledgement
Bliss Carkhuff, Johns Hopkins University
Terry Phillips, Johns Hopkins University
Hassan M. Saffarian, Corrosion Sensors, LLC
July 21, 20092
Program Sponsor: Maryland State Highway AdministrationMDSHA Chief of Research: Allison R. Hardt
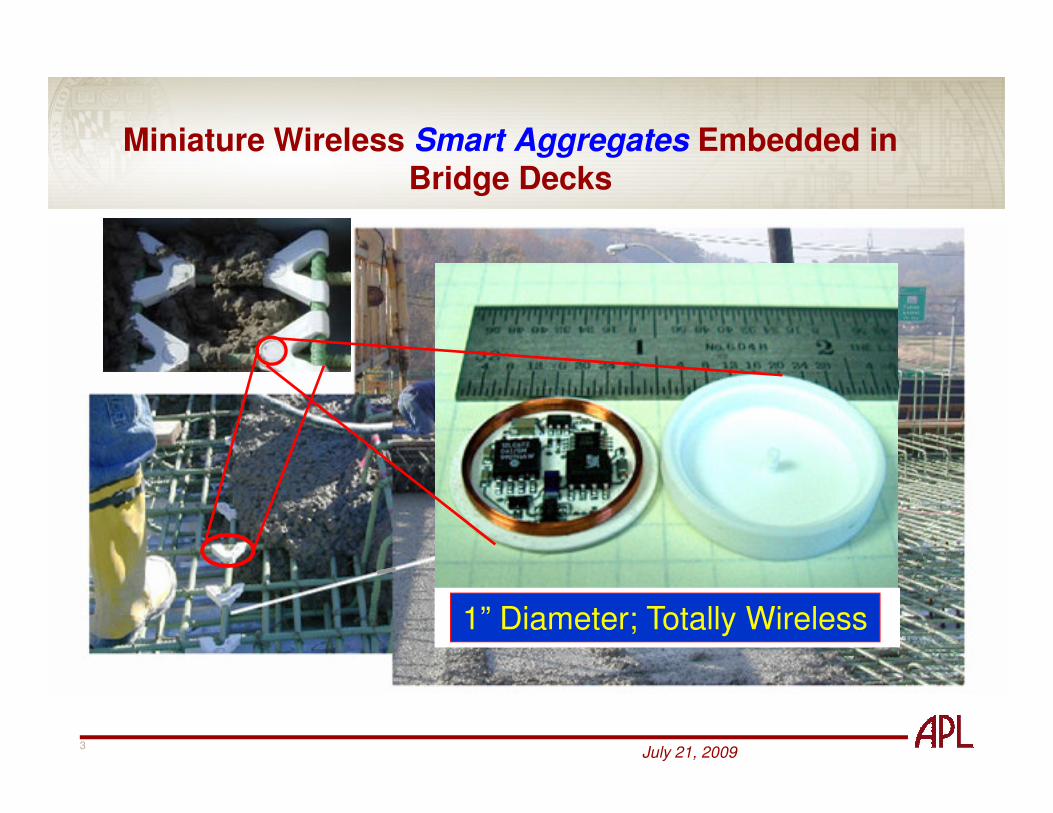
Miniature Wireless Smart Aggregates Embedded inBridge Decks
July 21, 20093
Figure 5 - Completed Smart Aggregate before final assembly
1” Diameter; Totally Wireless
Embeddable Sensor Overview
• Background
• Chloride Sensor
• Corrosion Sensor
July 21, 20094
• Corrosion Sensor
1. Corrosion rate2. Coating health monitor3. Water corrosivity
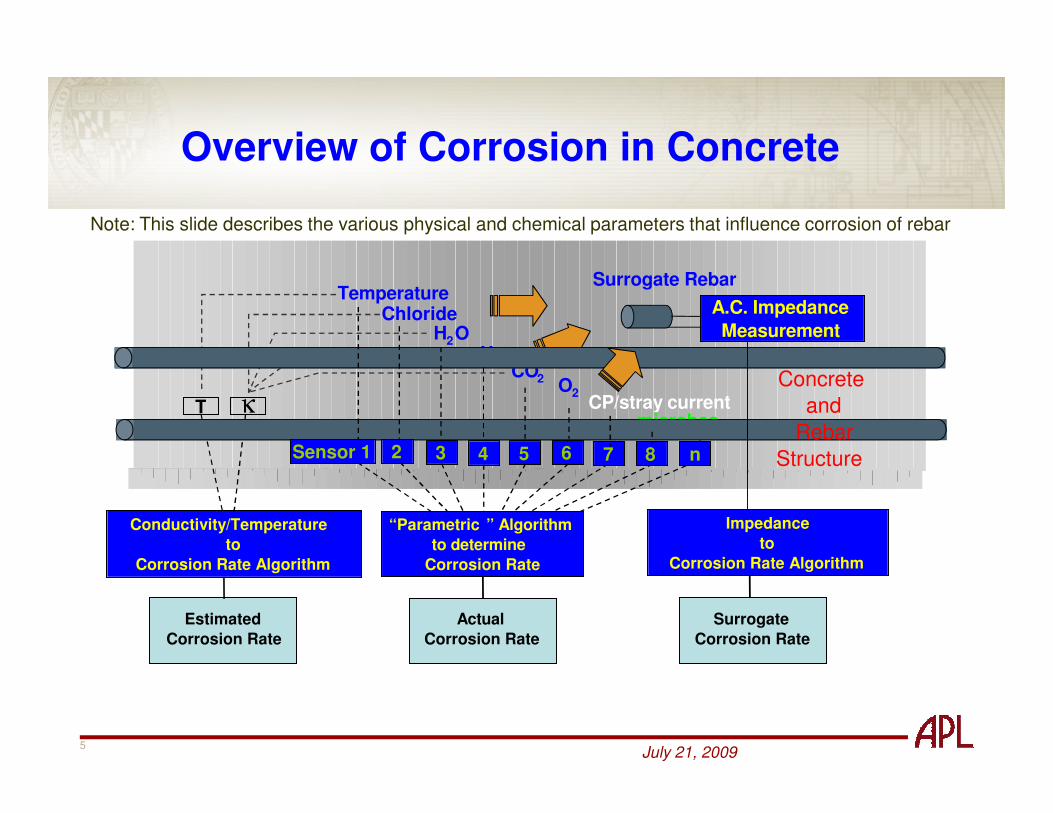
Overview of Corrosion in Concrete
TemperatureChloride
H2OpH
CO2O2
CP/stray current
Concrete
and
Surrogate Rebar
A.C. Impedance
Measurement
T κ
Note: This slide describes the various physical and chemical parameters that influence corrosion of rebar
July 21, 20095
Estimated
Corrosion Rate
CP/stray current
other
Conductivity/Temperature
to
Corrosion Rate Algorithm
microbesand
Rebar
StructureSensor 1
“Parametric ” Algorithm
to determine
Corrosion Rate
2 3 4 5 6 7 8 n
Actual
Corrosion Rate
Surrogate
Corrosion Rate
Impedance
to
Corrosion Rate Algorithm
T κ
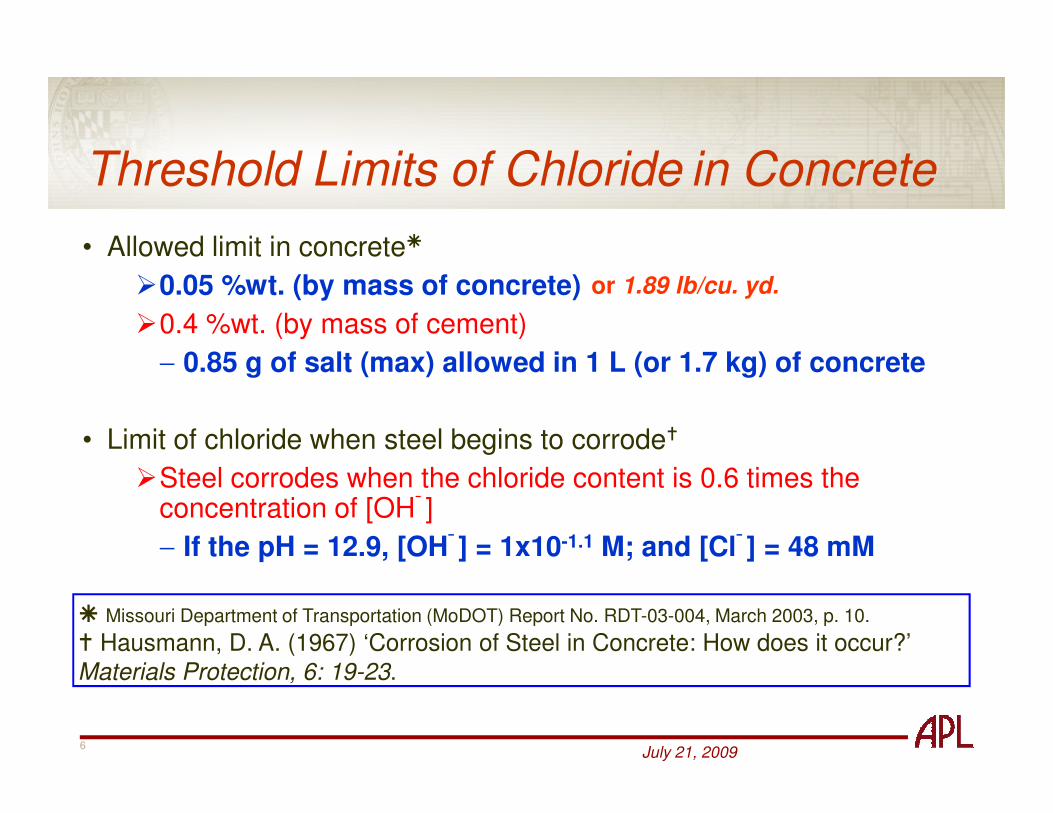
Threshold Limits of Chloride in Concrete
• Allowed limit in concrete�
�0.05 %wt. (by mass of concrete)
�0.4 %wt. (by mass of cement)
− 0.85 g of salt (max) allowed in 1 L (or 1.7 kg) of concrete
or 1.89 lb/cu. yd.
July 21, 20096
• Limit of chloride when steel begins to corrode�
�Steel corrodes when the chloride content is 0.6 times the concentration of [OH¯ ]
− If the pH = 12.9, [OH¯ ] = 1x10-1.1 M; and [Cl¯ ] = 48 mM
� Missouri Department of Transportation (MoDOT) Report No. RDT-03-004, March 2003, p. 10.
� Hausmann, D. A. (1967) ‘Corrosion of Steel in Concrete: How does it occur?’
Materials Protection, 6: 19-23.
Composition of Concrete
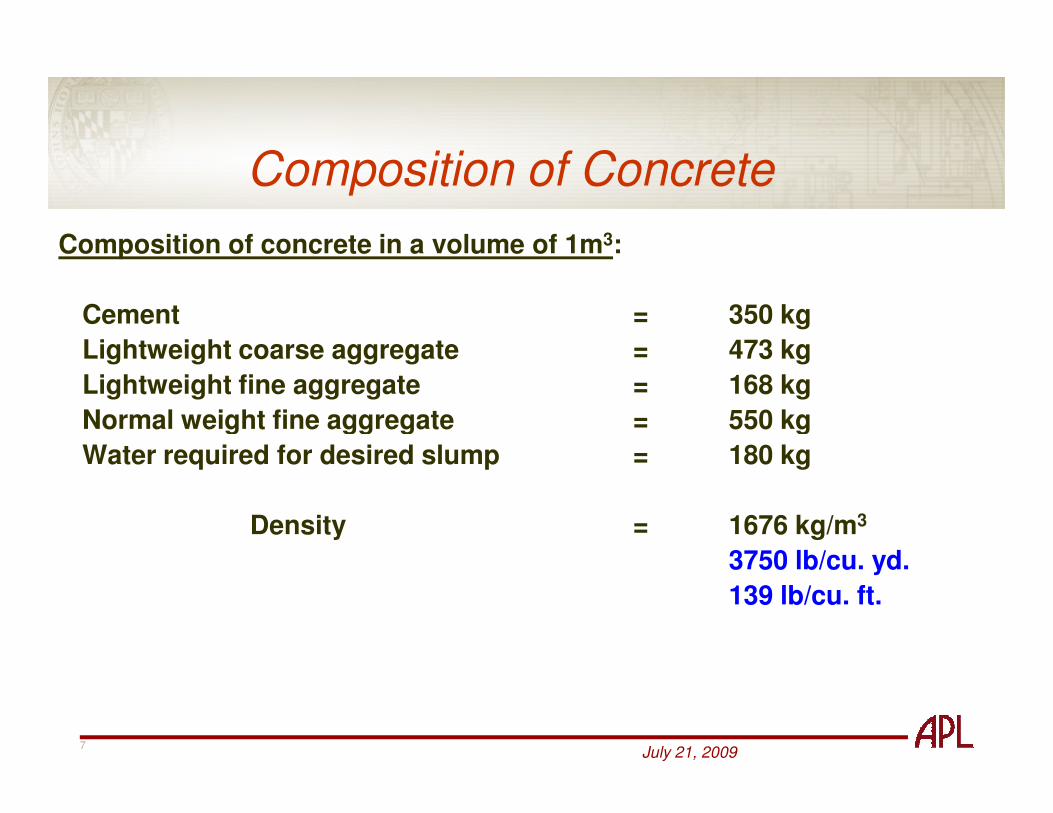
Composition of concrete in a volume of 1m3:
Cement = 350 kg
Lightweight coarse aggregate = 473 kg
Lightweight fine aggregate = 168 kg
Normal weight fine aggregate = 550 kg
July 21, 20097
Normal weight fine aggregate = 550 kg
Water required for desired slump = 180 kg
Density = 1676 kg/m3
3750 lb/cu. yd.
139 lb/cu. ft.
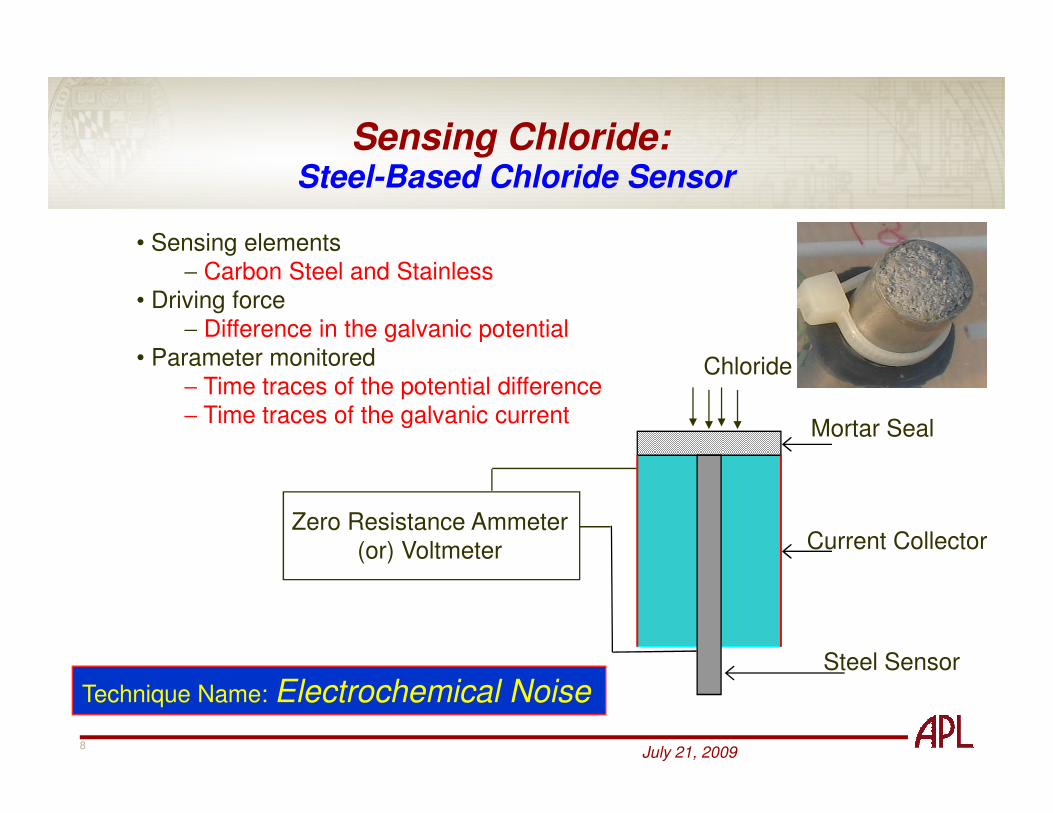
Sensing Chloride:
• Sensing elements− Carbon Steel and Stainless
• Driving force− Difference in the galvanic potential
• Parameter monitored− Time traces of the potential difference− Time traces of the galvanic current
Chloride
Steel-Based Chloride Sensor
July 21, 20098
− Time traces of the galvanic current
Zero Resistance Ammeter(or) Voltmeter
Steel Sensor
Current Collector
Mortar Seal
Technique Name: Electrochemical Noise
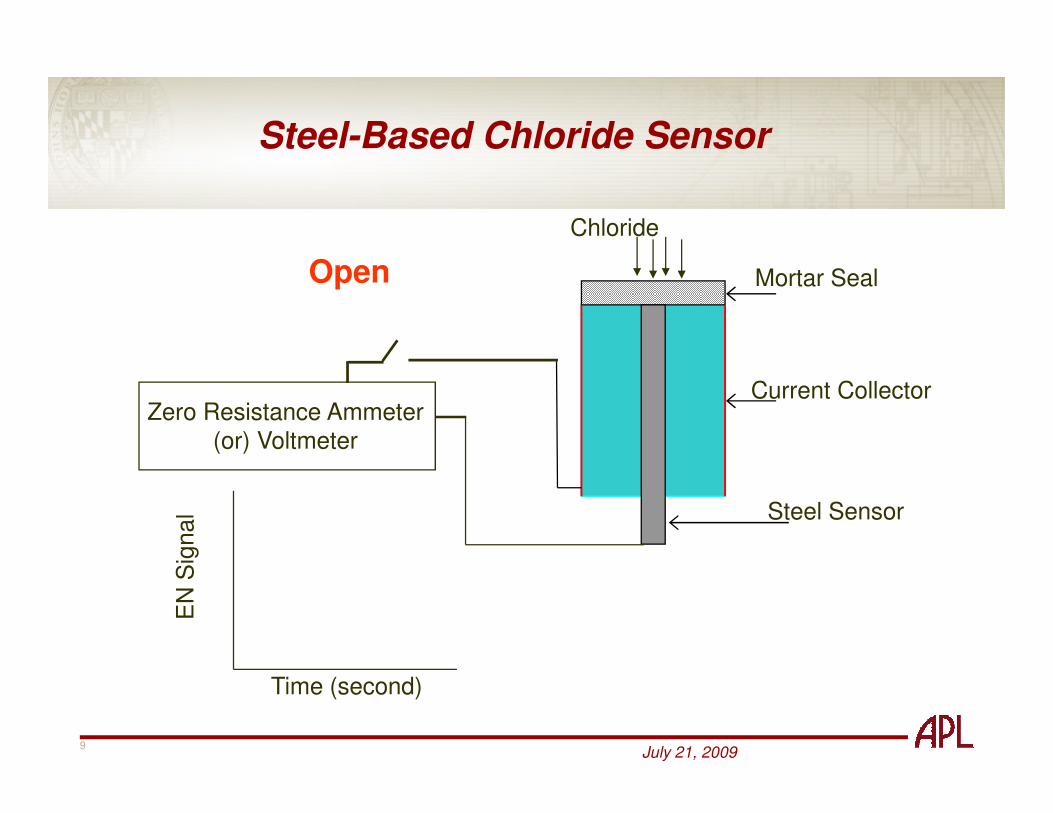
Steel-Based Chloride Sensor
Open
Zero Resistance Ammeter
Chloride
Current Collector
Mortar Seal
July 21, 20099
Time (second)
EN
Sig
nal
Zero Resistance Ammeter(or) Voltmeter
Steel Sensor
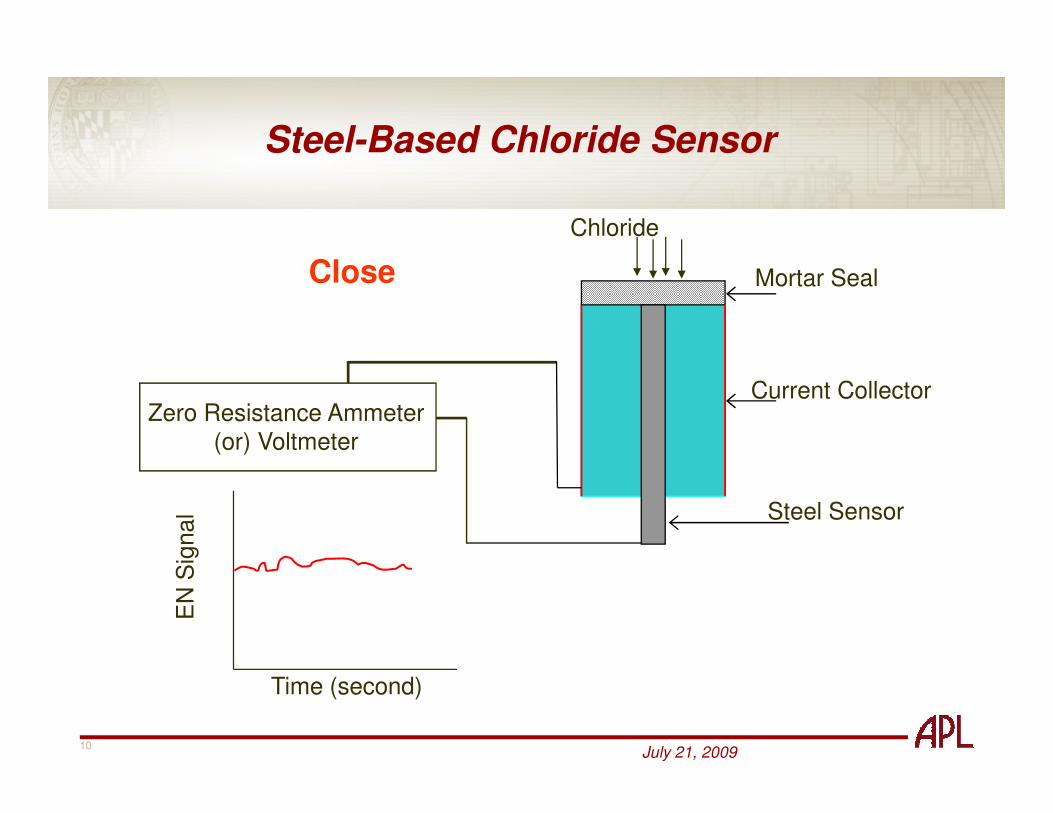
Steel-Based Chloride Sensor
Close
Zero Resistance Ammeter
Chloride
Current Collector
Mortar Seal
July 21, 200910
Time (second)
EN
Sig
nal
Zero Resistance Ammeter(or) Voltmeter
Steel Sensor
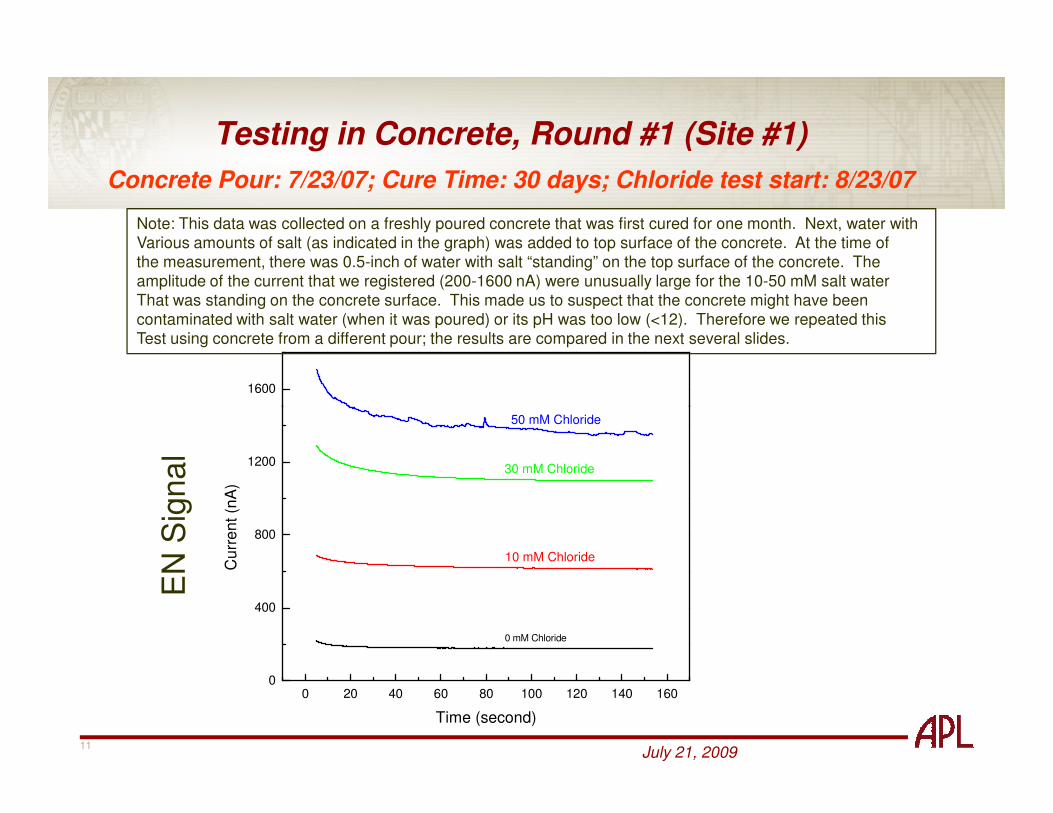
Testing in Concrete, Round #1 (Site #1)
Concrete Pour: 7/23/07; Cure Time: 30 days; Chloride test start: 8/23/07
1600
Note: This data was collected on a freshly poured concrete that was first cured for one month. Next, water withVarious amounts of salt (as indicated in the graph) was added to top surface of the concrete. At the time ofthe measurement, there was 0.5-inch of water with salt “standing” on the top surface of the concrete. Theamplitude of the current that we registered (200-1600 nA) were unusually large for the 10-50 mM salt waterThat was standing on the concrete surface. This made us to suspect that the concrete might have beencontaminated with salt water (when it was poured) or its pH was too low (<12). Therefore we repeated thisTest using concrete from a different pour; the results are compared in the next several slides.
July 21, 200911
0 20 40 60 80 100 120 140 1600
400
800
1200
50 mM Chloride
30 mM Chloride
10 mM Chloride
Cu
rre
nt (n
A)
Time (second)
0 mM Chloride
EN
Sig
nal
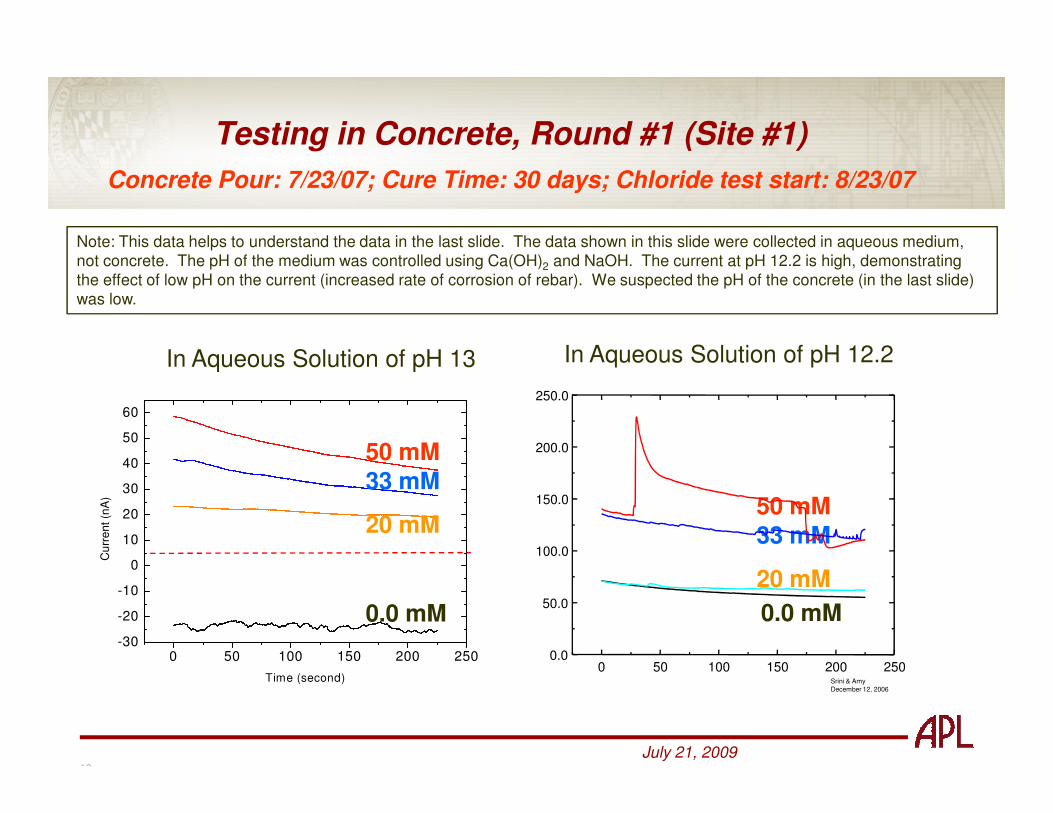
Testing in Concrete, Round #1 (Site #1)
Concrete Pour: 7/23/07; Cure Time: 30 days; Chloride test start: 8/23/07
In Aqueous Solution of pH 13
Note: This data helps to understand the data in the last slide. The data shown in this slide were collected in aqueous medium,not concrete. The pH of the medium was controlled using Ca(OH)2 and NaOH. The current at pH 12.2 is high, demonstratingthe effect of low pH on the current (increased rate of corrosion of rebar). We suspected the pH of the concrete (in the last slide) was low.
60
250.0
In Aqueous Solution of pH 12.2
July 21, 200912
0.0 mM
20 mM
33 mM
50 mM
0 50 100 150 200 250-30
-20
-10
0
10
20
30
40
50
60
Cu
rre
nt (n
A)
Time (second)0 50 100 150 200 250
0.0
50.0
100.0
150.0
200.0
Srini & Amy
December 12, 2006
0.0 mM
20 mM
33 mM
50 mM
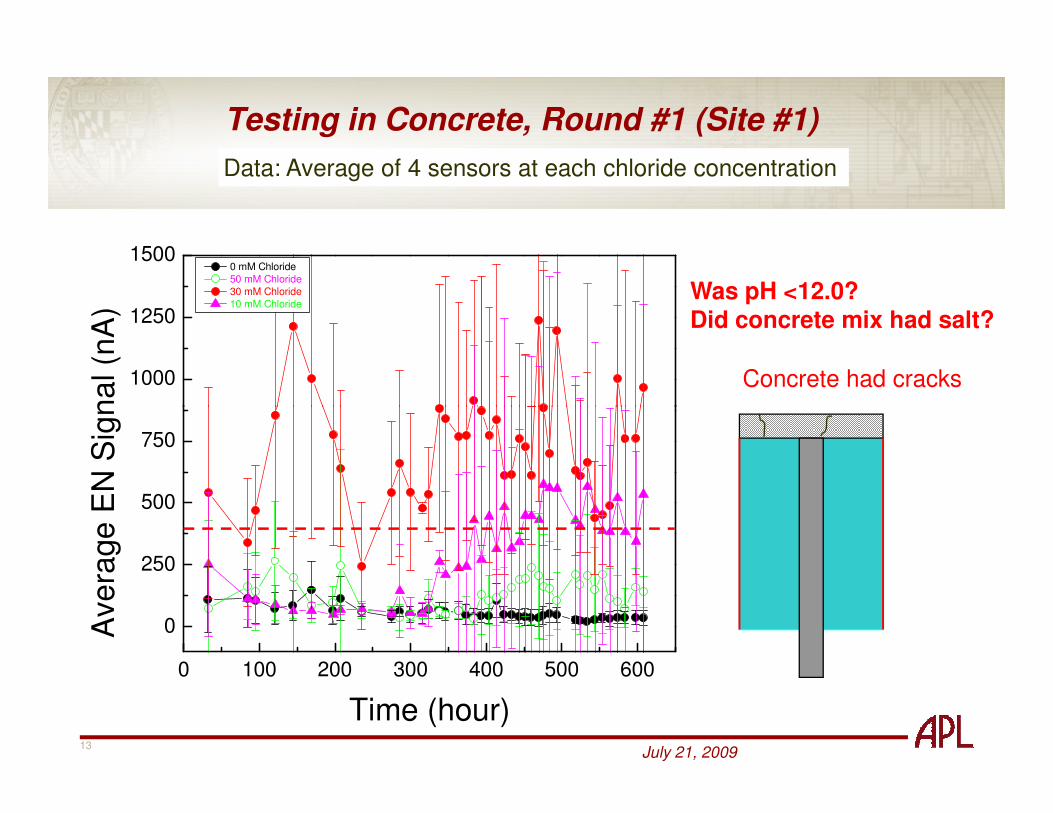
Testing in Concrete, Round #1 (Site #1)
1000
1250
1500
Ave
rage
EN
Sig
na
l (n
A)
0 mM Chloride
50 mM Chloride
30 mM Chloride
10 mM Chloride
Data: Average of 4 sensors at each chloride concentration
Concrete had cracks
Was pH <12.0?Did concrete mix had salt?
July 21, 200913
0 100 200 300 400 500 600
0
250
500
750
Ave
rage
EN
Sig
na
l (n
A)
Time (hour)

Testing in Concrete, Round #2 (Site #2)
Concrete Pour: 9/27/07; Cure Time: 31 days; Chloride test start: 10/29/07
-10
-5
0
0 mM
10 mM
Mean = -4.34 nA
300 hours after exposureNote: this is the second attempt mentioned earlier. Note,the amplitude of currents are much lower.
July 21, 200914
-20 0 20 40 60 80 100 120 140 160-30
-25
-20
-15
-10
Mean = -26.3 nA
Mean = -18.36 nA
Mean = -14.64 nA
Cu
rren
t (n
A)
Time (second)
10 mM
30 mM
50 mM

Testing in Concrete, Round #2 (Site #2)
Concrete Pour: 9/27/07; Cure Time: 31 days; Chloride test start: 10/29/07
-10
-5
0
-5
0
300 hours after exposure 1650 hours after exposure
O mM Chloride0 mM Chloride
Note: The amplitude of currents did not go up further,even as we increased the chloride concentration,because the pH of the concrete was perhaps >12.
July 21, 200915
-20 0 20 40 60 80 100 120 140 160-30
-25
-20
-15
-10
Cu
rre
nt (n
A)
Time (second)-20 0 20 40 60 80 100 120 140 160
-30
-25
-20
-15
-10
Cu
rren
t (n
A)
Time (second)
10 mM Chloride
30 mM Chloride
50 mM Chloride
300 mM Chloride
600 mM Chloride
1200 mM Chloride
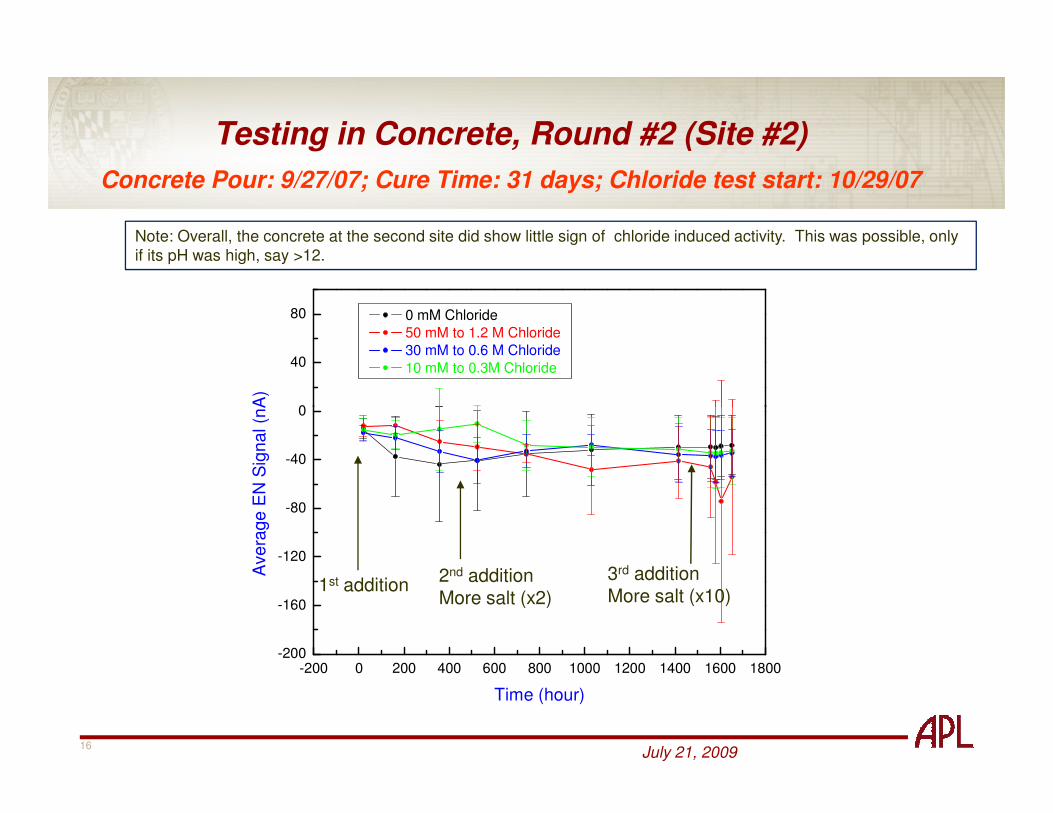
Testing in Concrete, Round #2 (Site #2)
Concrete Pour: 9/27/07; Cure Time: 31 days; Chloride test start: 10/29/07
0
40
80
A
ve
rag
e E
N S
ign
al (n
A)
0 mM Chloride
50 mM to 1.2 M Chloride
30 mM to 0.6 M Chloride
10 mM to 0.3M Chloride
Note: Overall, the concrete at the second site did show little sign of chloride induced activity. This was possible, onlyif its pH was high, say >12.
July 21, 200916
-200 0 200 400 600 800 1000 1200 1400 1600 1800-200
-160
-120
-80
-40
0
Ave
rag
e E
N S
ign
al (n
A)
Time (hour)
1st addition2nd additionMore salt (x2)
3rd additionMore salt (x10)
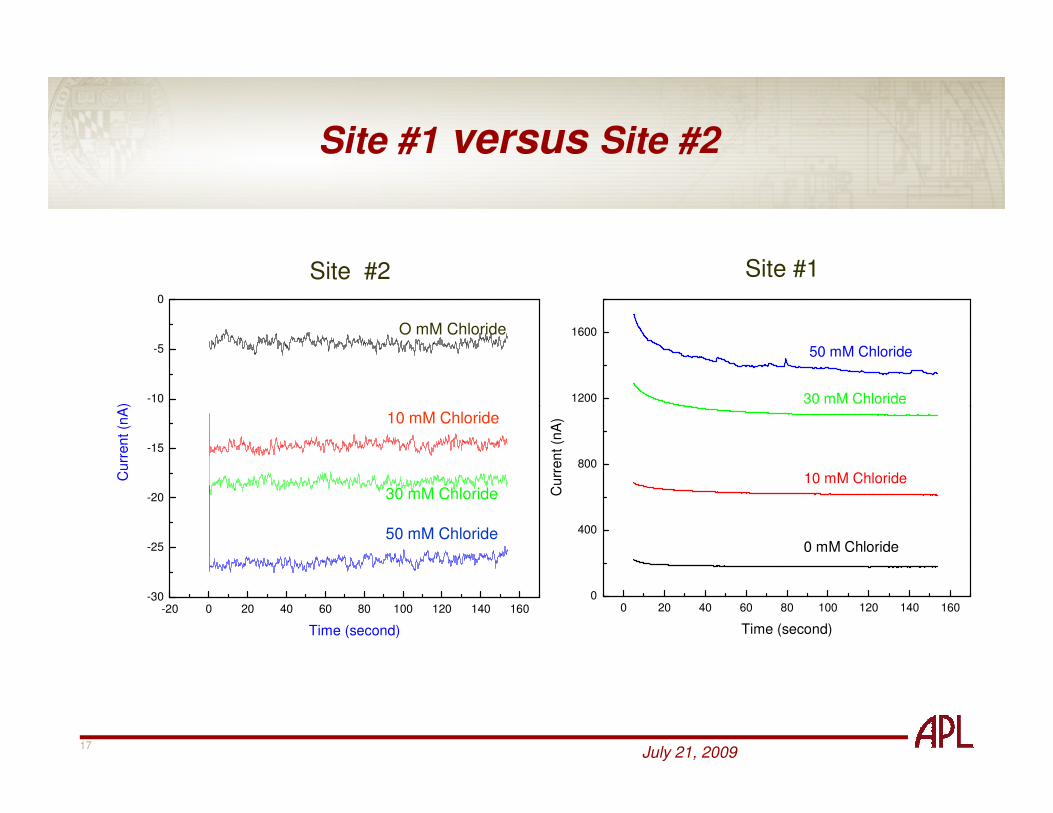
Site #1 versus Site #2
1200
1600
50 mM Chloride
30 mM Chloride
-10
-5
0
Cu
rren
t (n
A)
Site #2 Site #1
O mM Chloride
July 21, 200917
0 20 40 60 80 100 120 140 1600
400
800
10 mM Chloride
Cu
rren
t (n
A)
Time (second)
0 mM Chloride
-20 0 20 40 60 80 100 120 140 160-30
-25
-20
-15
Cu
rren
t (n
A)
Time (second)
10 mM Chloride
30 mM Chloride
50 mM Chloride
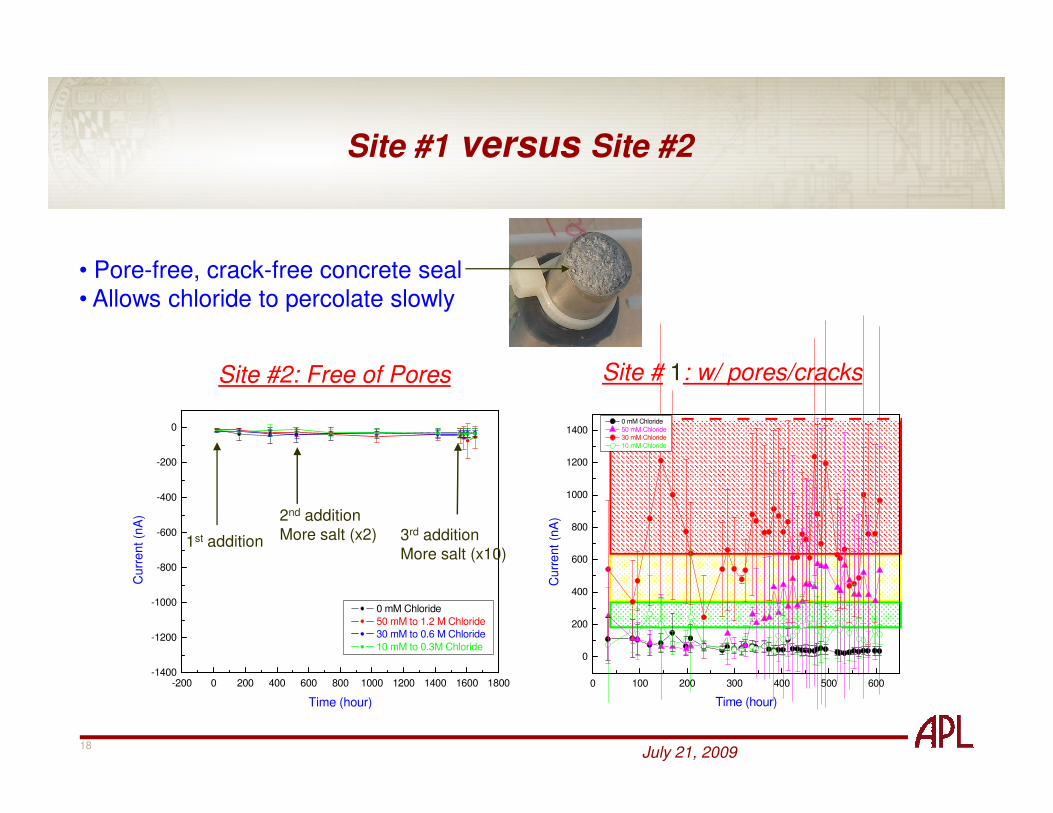
Site #1 versus Site #2
Site # 1: w/ pores/cracksSite #2: Free of Pores
• Pore-free, crack-free concrete seal• Allows chloride to percolate slowly
July 21, 200918
-200 0 200 400 600 800 1000 1200 1400 1600 1800-1400
-1200
-1000
-800
-600
-400
-200
0
Cu
rre
nt (n
A)
Time (hour)
0 mM Chloride
50 mM to 1.2 M Chloride
30 mM to 0.6 M Chloride
10 mM to 0.3M Chloride
1st addition
2nd additionMore salt (x2) 3rd addition
More salt (x10)
0 100 200 300 400 500 600
0
200
400
600
800
1000
1200
1400
Cu
rre
nt
(nA
)
Time (hour)
0 mM Chloride
50 mM Chloride 30 mM Chloride
10 mM Chloride

Test Results from Coring Concrete from Bridge Decks
Site #1 versus Site #2
Site #1: Salt is too high; pH is too low
Site #1
Allowed LimitsSalt: 1.89 lb/cu. yd.pH: ~12Density: 140 lb/cu. ft.
July 21, 200919
Salt is low; pH is high; Density is high
Site #2
Chloride Sensors Summary
• The sensor predicted
– Problems at Site #1
– Found Site #2 concrete was good
July 21, 200920
– Found Site #2 concrete was good

Steel-Based Corrosion Sensor
Impedance Meter
Chloride
Current Collector
Mortar Seal
Embeddable Wireless Corrosion Rate Meter for Concrete
July 21, 200921
Impedance Meter
Steel Sensor
0 200 400 600 800 1000 12000
200
400
600
800
1000
1200
100 Hz 0.05 Hz
-ZIm
ag
inary (
oh
m)
ZReal
(ohm)
Solarton 1260
MW-EIS
(TEDCO)
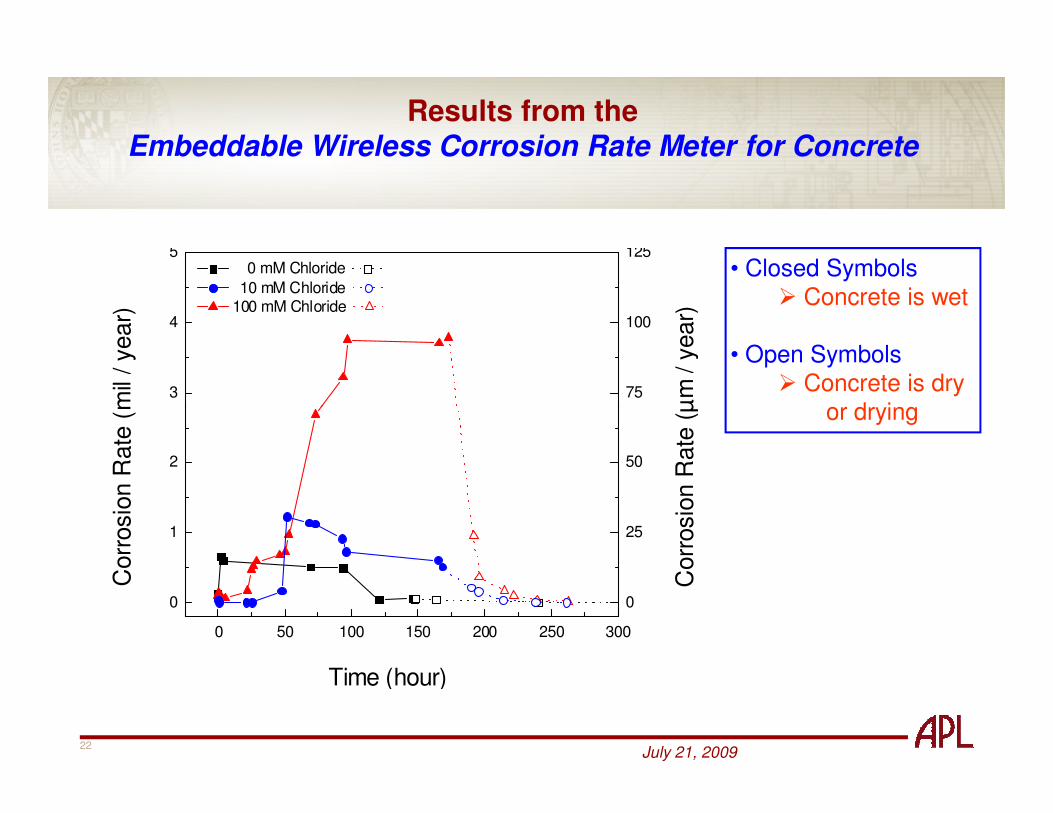
Results from theEmbeddable Wireless Corrosion Rate Meter for Concrete
3
4
5
75
100
125 0 mM Chloride
10 mM Chloride
100 mM Chloride
Corr
osio
n R
ate
(m
il / year)
µm
/ y
ear)
• Closed Symbols� Concrete is wet
• Open Symbols� Concrete is dry
or drying
July 21, 200922
0 50 100 150 200 250 300
0
1
2
0
25
50
Time (hour)
Corr
osio
n R
ate
(m
il
Corr
osio
n R
ate
(µ
m
or drying
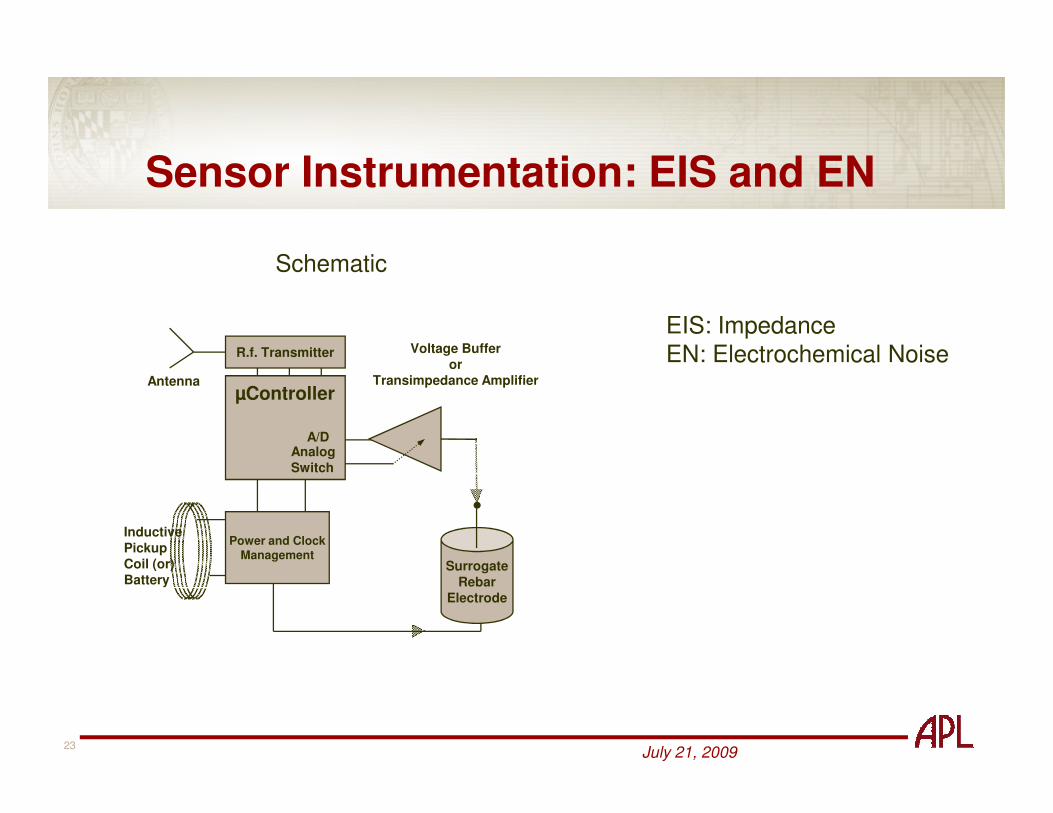
Sensor Instrumentation: EIS and EN
Schematic
Voltage Bufferor
Transimpedance AmplifierµController
R.f. Transmitter
Antenna
EIS: ImpedanceEN: Electrochemical Noise
July 21, 200923
InductivePickupCoil (or)Battery
SurrogateRebar
Electrode
Power and ClockManagement
A/DAnalogSwitch
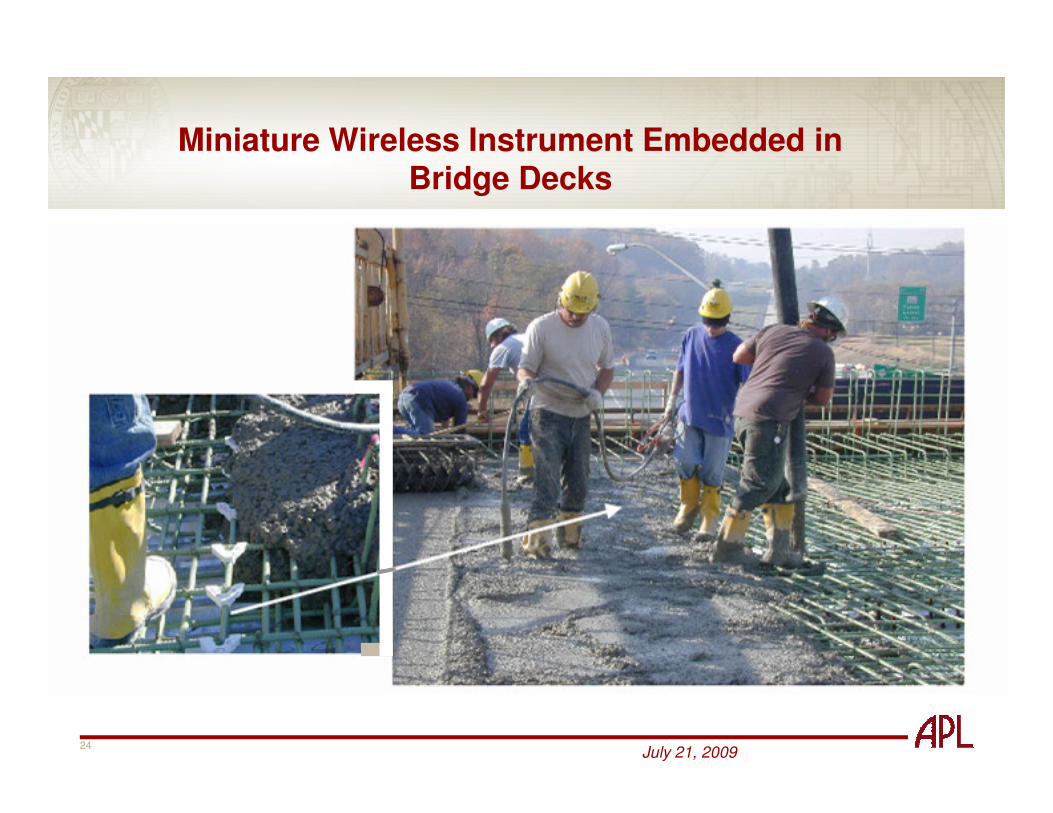
Miniature Wireless Instrument Embedded inBridge Decks
July 21, 200924
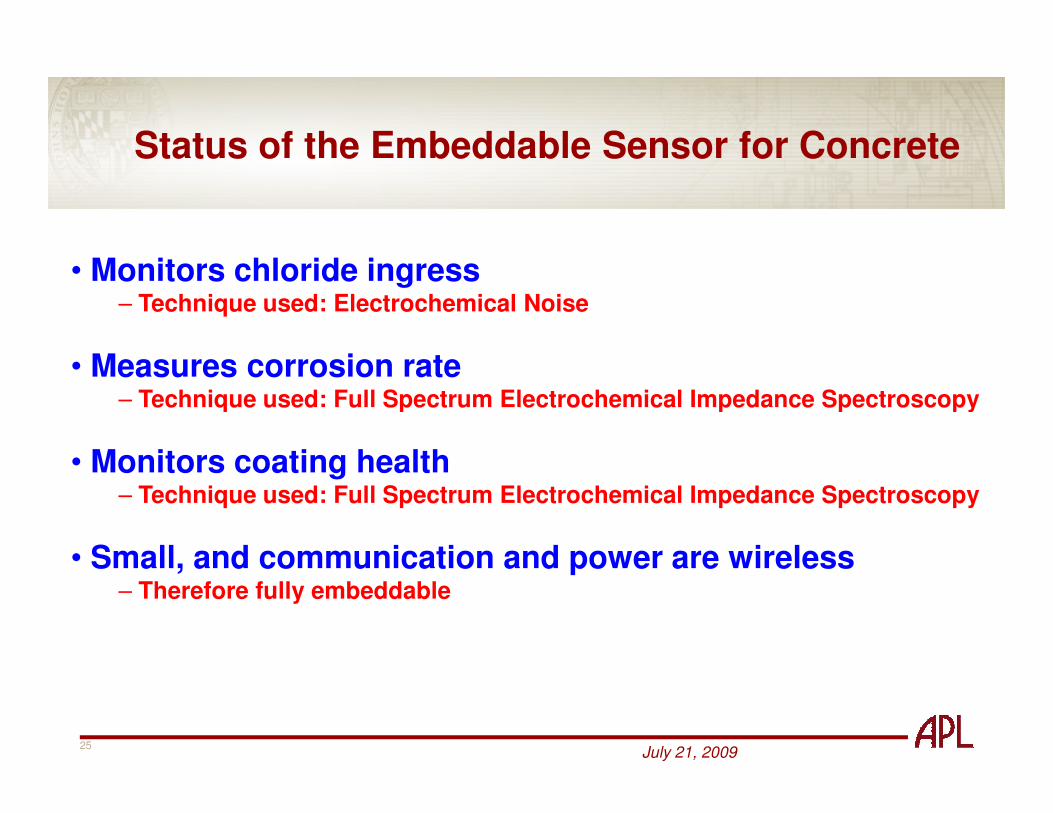
Status of the Embeddable Sensor for Concrete
• Monitors chloride ingress– Technique used: Electrochemical Noise
• Measures corrosion rate– Technique used: Full Spectrum Electrochemical Impedance Spectroscopy
July 21, 200925
– Technique used: Full Spectrum Electrochemical Impedance Spectroscopy
• Monitors coating health– Technique used: Full Spectrum Electrochemical Impedance Spectroscopy
• Small, and communication and power are wireless– Therefore fully embeddable
Recommended