Asset Management Group Assignment Style Analysis

Contents Indexes Selection ................................................................................................... 3
Sector Style Analysis .............................................................................................. 5
Strategic ........................................................................................................ 5
Rolling ........................................................................................................... 5
Tactical .......................................................................................................... 6
Geographic Style Analysis ...................................................................................... 7
Strategic ........................................................................................................ 7
Rolling ........................................................................................................... 8
Tactical .......................................................................................................... 9
Confidence Interval ..................................................................................... 11
Efficient Frontier ......................................................................................... 11
Appendix I: Correlation Matrix of Indexes ............................................................ 13

Group Assignment – Style Analysis The analysis carried out is grounded on the application of Sharpe's Style Analysis to the mutual fund BGF GLOBAL EQUITY FUND CLASS A2 EUR and will allow us to assess its composition relying on publicly available quotations of the fund itself obtained from the website www.blackrock.co.uk.
Indexes Selection
Since BGF GLOBAL EQUITY FUND CLASS A2 EUR is a global fund, we reckon that a proper Style Analysis should be based on both geographic areas and industry sectors rather than on specific styles. For what concerns the indexes to be used to perform the Style Analysis by Industry Sectors we have decided to include ten of them, choosing each one according to the characteristics of mutual exclusivity, exhaustivity and low level of correlation that each asset class should have. Initially, we intended to select indexes according to their average mutual correlation1, but such a method provided us with inconsistent results because many of them were not mutually exclusive. For instance, basing on this reasoning we had to include on our analysis both Pharmaceutical, Biotech, Pharma/Biotech and Healthcare together as indexes. However, Healthcare Sector already includes both Pharma and Biotech and Pharma/Biotech which of course already embeds both Biotech and Pharma. This is the list of the sectors that have been included in the analysis:
Industrials
Materials
Consumer Discretionary
Energy
IT
Consumer Staples
Health Care
Financials
Telecommunication
Utilities According to the MSCI methodology selection criteria2, these sectors are the most comprehensive ones, in the sense that each company is contained in one and only one of the above said sectors
1 See Appendix I.
2 MSCI Global Investable Market Indexes Methodology. MSCI Index Research, pp. 98-106 (Appendix V: Global Industry
Classification Standard), November 2014.
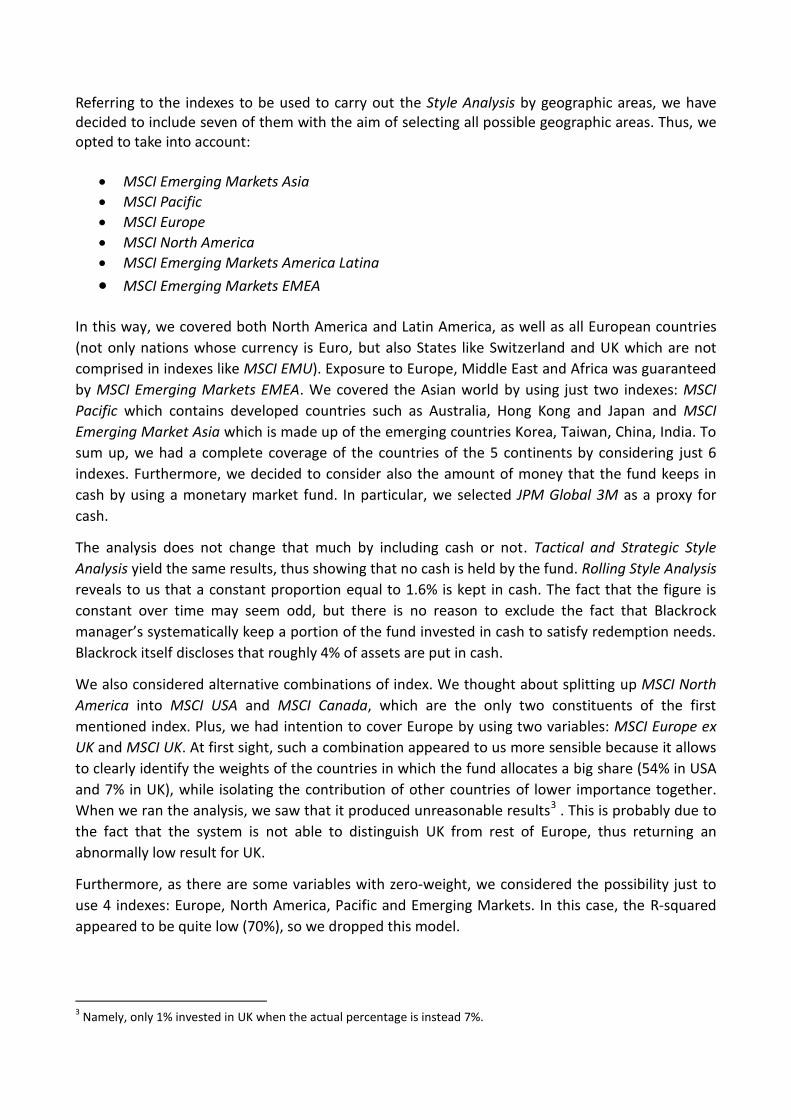
Referring to the indexes to be used to carry out the Style Analysis by geographic areas, we have decided to include seven of them with the aim of selecting all possible geographic areas. Thus, we opted to take into account:
MSCI Emerging Markets Asia
MSCI Pacific
MSCI Europe
MSCI North America
MSCI Emerging Markets America Latina
MSCI Emerging Markets EMEA
In this way, we covered both North America and Latin America, as well as all European countries
(not only nations whose currency is Euro, but also States like Switzerland and UK which are not
comprised in indexes like MSCI EMU). Exposure to Europe, Middle East and Africa was guaranteed
by MSCI Emerging Markets EMEA. We covered the Asian world by using just two indexes: MSCI
Pacific which contains developed countries such as Australia, Hong Kong and Japan and MSCI
Emerging Market Asia which is made up of the emerging countries Korea, Taiwan, China, India. To
sum up, we had a complete coverage of the countries of the 5 continents by considering just 6
indexes. Furthermore, we decided to consider also the amount of money that the fund keeps in
cash by using a monetary market fund. In particular, we selected JPM Global 3M as a proxy for
cash.
The analysis does not change that much by including cash or not. Tactical and Strategic Style
Analysis yield the same results, thus showing that no cash is held by the fund. Rolling Style Analysis
reveals to us that a constant proportion equal to 1.6% is kept in cash. The fact that the figure is
constant over time may seem odd, but there is no reason to exclude the fact that Blackrock
manager’s systematically keep a portion of the fund invested in cash to satisfy redemption needs.
Blackrock itself discloses that roughly 4% of assets are put in cash.
We also considered alternative combinations of index. We thought about splitting up MSCI North
America into MSCI USA and MSCI Canada, which are the only two constituents of the first
mentioned index. Plus, we had intention to cover Europe by using two variables: MSCI Europe ex
UK and MSCI UK. At first sight, such a combination appeared to us more sensible because it allows
to clearly identify the weights of the countries in which the fund allocates a big share (54% in USA
and 7% in UK), while isolating the contribution of other countries of lower importance together.
When we ran the analysis, we saw that it produced unreasonable results3 . This is probably due to
the fact that the system is not able to distinguish UK from rest of Europe, thus returning an
abnormally low result for UK.
Furthermore, as there are some variables with zero-weight, we considered the possibility just to
use 4 indexes: Europe, North America, Pacific and Emerging Markets. In this case, the R-squared
appeared to be quite low (70%), so we dropped this model.
3 Namely, only 1% invested in UK when the actual percentage is instead 7%.

Sector Style Analysis
Strategic The Strategic Style Analysis is implemented by using 60 months of data. As it is possible to see in the graph below, almost half of the total allocation appears to have been assigned to Consumer Discretionary. Furthermore, Materials, Industrials and Energy hold a significant portion of the portfolio: the allocation relative to these ones is respectively 22,5%, 7,1% and 4,1%. However, no shares have been allocated to IT, Telecommunications and Utilities. The R-squared achieved by this approach is quite satisfying, as it is 80,31%.
Rolling It is helpful to examine the behavior of a manager's average exposure to asset classes by implementing a Time Series Analysis, by the use of a fixed number of periods for each one through time. To do so, we performed a Rolling Style Analysis, which iterates through the multivariate regression model in a series of continuous time windows, each of them with a fixed number of observations. In our analysis, we used a rolling window of 36 weeks, which is updated for 24 periods. As it is plainly evident, there is a significant allocation to Consumer Discretionary. However, in recent months we witness a pattern reversion, as the fund managers suddenly decided to disinvest from the index. The same thing happened to MSCI World Materials and MSCI World Industrials. Correspondingly, managers tended to increase the weights given to new indexes such as MSCI World Energy and MSCI World Utilities. It appears that there has been a lot of activism of asset managers. This could be partly explained by the fact that managers in charge of the fund changed frequently. The R-squared of the Rolling Style Analysis rarely falls below 80%. This is a good result, since it means that the model explains most of the variability of the independent variable.
7,1%
22,5%
4,1%
54,2%
2,9% 5,9%
3,4% 0,0% 0,0% 0,0%
Energy Materials Industrials Cons.Discr.
Cons.Staples
HealthCare
Financials IT TLC Utilities
0,0%
10,0%
20,0%
30,0%
40,0%
50,0%
60,0%
Strategic Style Analysis

Tactical If the main goal is to monitor the more recent situation, the Tactical Style Analysis perfectly matches such objective. This method is implemented by using the last 52 weeks of data. It is possible to notice that on the one hand, the fund managers fully disinvested from Financials, Chemicals and Infrastructure while on the other hand, they greatly rose the share invested in new sectors such as Industrials, Materials and Energy. Their weights respectively increased to 25,4%, 23,9% and 10%. The graph below also confirms what has been demonstrated in the previous Rolling Window Analysis, that is the downward trend of the weight given to Consumer Discretionary, which
0%
10%
20%
30%
40%
50%
60%
70%
80%
90%
100%
Rolling Style Analysis
MSCI World Utilities
MSCI World Telecomunications
MSCI World IT
MSCI World Financials
MSCI World Health Care
MSCI World Cons. Staples
MSCI World Cons. Discr.
MSCI World Industrials
MSCI World Materials
MSCI World Energy
0,00%
20,00%
40,00%
60,00%
80,00%
100,00%
31-Oct-2012 31-Mar-2013 31-Aug-2013 31-Jan-2014 30-Jun-2014
Style R2

dropped to 16,5%. The Tactical Style Analysis shows an acceptable value of the R-squared, 78,92%.
Geographic Style Analysis
Strategic
The Strategic Style Analysis is carried out by using 60 months. The R-squared obtained with such a
method is equal to 79.74%. We deem that such a value is rather acceptable since it is close to 80%.
10,0%
23,9% 25,4%
16,5%
10,4%
3,0%
0,0%
10,9%
0,0% 0,0% 0,0%
5,0%
10,0%
15,0%
20,0%
25,0%
30,0%
Tactical Style Analysis
0,0%
28,3%
0,0%
5,8%
25,2%
40,7%
0,0% 0,0%
5,0%
10,0%
15,0%
20,0%
25,0%
30,0%
35,0%
40,0%
45,0%
EM LatAm EM Asia Pacific EM EMEA Europe North Am Cash
Strategic Style Analysis
The allocation to Developed Countries is equal to 65.9%, although this figure has changed
significantly over time4. For what concerns Emerging Markets, the fund seems to invest largely in
Asian Developing Countries (28.3%), while only a marginal quantity of assets is allocated in EMEA
Emerging Countries (5,8%).
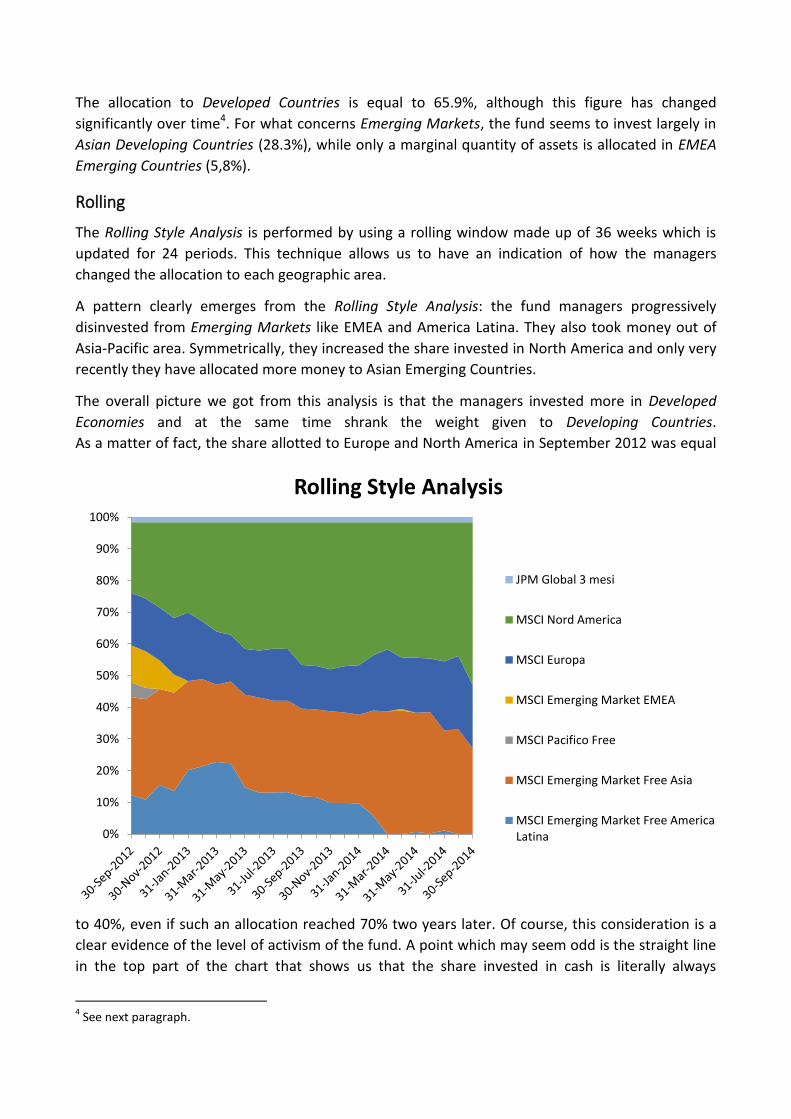
Rolling
The Rolling Style Analysis is performed by using a rolling window made up of 36 weeks which is
updated for 24 periods. This technique allows us to have an indication of how the managers
changed the allocation to each geographic area.
A pattern clearly emerges from the Rolling Style Analysis: the fund managers progressively
disinvested from Emerging Markets like EMEA and America Latina. They also took money out of
Asia-Pacific area. Symmetrically, they increased the share invested in North America and only very
recently they have allocated more money to Asian Emerging Countries.
The overall picture we got from this analysis is that the managers invested more in Developed
Economies and at the same time shrank the weight given to Developing Countries.
As a matter of fact, the share allotted to Europe and North America in September 2012 was equal
to 40%, even if such an allocation reached 70% two years later. Of course, this consideration is a
clear evidence of the level of activism of the fund. A point which may seem odd is the straight line
in the top part of the chart that shows us that the share invested in cash is literally always
4 See next paragraph.
0%
10%
20%
30%
40%
50%
60%
70%
80%
90%
100%
Rolling Style Analysis
JPM Global 3 mesi
MSCI Nord America
MSCI Europa
MSCI Emerging Market EMEA
MSCI Pacifico Free
MSCI Emerging Market Free Asia
MSCI Emerging Market Free AmericaLatina
constant over time. As we said earlier, we have no reason to exclude that Blackrock managers’
systematically keep 1.6% of the fund in cash.
The R-squared of the Rolling Style Analysis is quite often above 80%. After July 2014, the method
proves to be affected by a lower power in explaining the sources of fund return as the R-squared
falls below 80%. This might be the indication of a change in the fund allotment which has not
already been captured by the Style Analysis. This interpretation is confirmed by the fact that the
latest allocation resulting from the Rolling Style Analysis is rather different from the one of the
Tactical Style Analysis5.
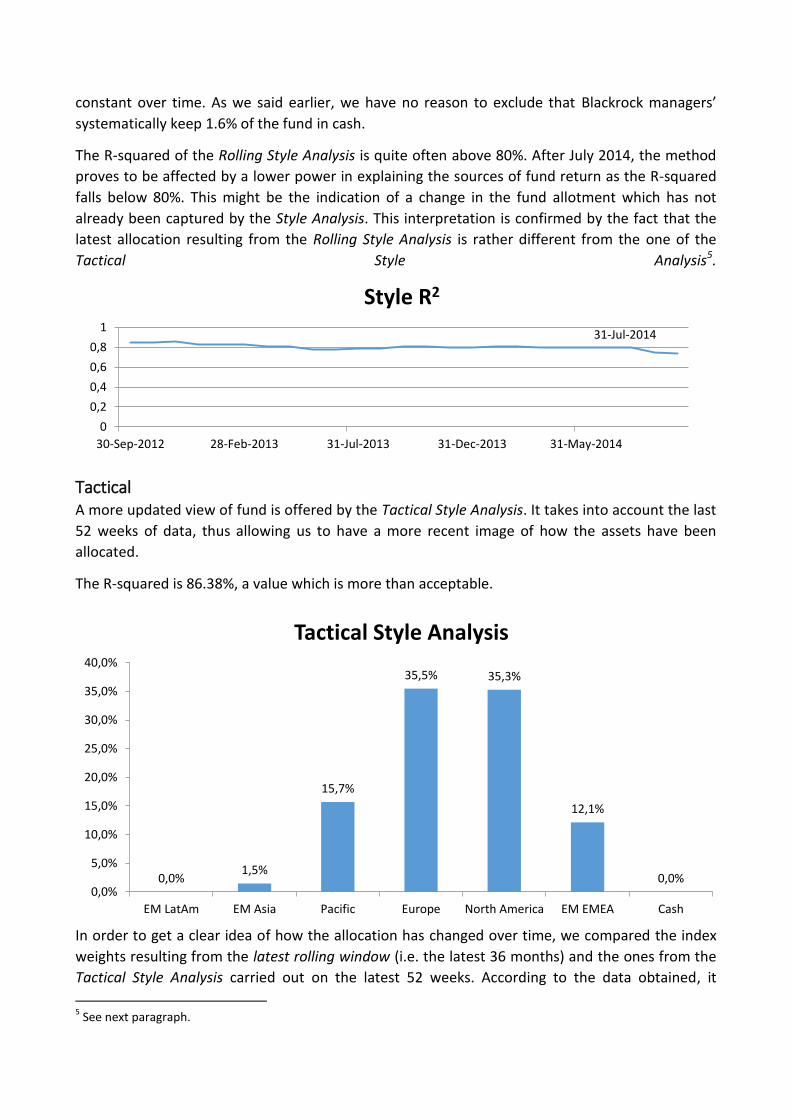
Tactical A more updated view of fund is offered by the Tactical Style Analysis. It takes into account the last
52 weeks of data, thus allowing us to have a more recent image of how the assets have been
allocated.
The R-squared is 86.38%, a value which is more than acceptable.
In order to get a clear idea of how the allocation has changed over time, we compared the index
weights resulting from the latest rolling window (i.e. the latest 36 months) and the ones from the
Tactical Style Analysis carried out on the latest 52 weeks. According to the data obtained, it
5 See next paragraph.
31-Jul-2014
0
0,2
0,4
0,6
0,8
1
30-Sep-2012 28-Feb-2013 31-Jul-2013 31-Dec-2013 31-May-2014
Style R2
0,0% 1,5%
15,7%
35,5% 35,3%
12,1%
0,0% 0,0%
5,0%
10,0%
15,0%
20,0%
25,0%
30,0%
35,0%
40,0%
EM LatAm EM Asia Pacific Europe North America EM EMEA Cash
Tactical Style Analysis

appears that the asset managers overweighed Europe and underweighted North America.
Surprisingly, the weight assigned to Asian Emerging Countries dropped sharply from 25% to 1.5%.
At the same time, the fund exhibits a stake which goes from zero to a not negligible figure for
many indexes. This is the case for Pacific (from 0% to 15.7%) and for EM EMEA (from 0% to 12.1%).
The point is: did the allocation really swing so dramatically or is there any kind of estimation error?
In order to answer to this question, we compared the figures we got from our analysis with the
numbers officially published by Blackrock. We realized that the latest rolling style analysis gives us
results which are closer to the ones given by the management company, while the percentages
obtained through the Tactical Analysis seem to be more weird than before. For example, we have
55% of allocation to North America according to Blackrock and 51% according to the Rolling Style
Analysis, then we have 22% allocated to Europe versus 20% resulting from our analysis. The
Rolling Style Analysis appears to fail in distinguishing allocations of emerging countries, but it looks
like that the picture we had from the Rolling Style is more sensitive than the one we got from the
Tactical Analysis.
0
0,1
0,2
0,3
0,4
0,5
0,6
EM LatAm EM Asia Pacific Europe North America EM EMEA Cash
How the allocation has changed over time
First Rolling (36 Months) Latest Rolling (36 Months) Tactical (52 Weeks)

Confidence Interval
Weights 1_EM America Latina 2_EM Asia 3_Pacifico
4_EM EMEA 5_Europa
6_Nord America
1_EM America Latina 26,4% -6,1% 42,7% -6,5% 11,1%
2_EM Asia 42,3% 27,4% 25,6% 7,9% 17,6%
3_Pacifico -9,0% 25,0% 11,3% 12,3% 44,4%
4_EM EMEA 56,0% 20,9% 10,2% 35,4% -14,1%
5_Europa -9,7% 7,3% 12,6% 40,2% 41,0%
6_Nord America 20,3% 20,3% 56,0% -19,8% 50,8%
Sum of weights 100,0% 100,0% 100,0% 100,0% 100,0% 100,0%
R-squared 68% 65% 46% 71% 54% 47%
Confidence Interval 7,06% 8,93% 8,53% 8,07% 8,60% 9,57%
We adopted Lobosco and Di Bartolomeo’s procedure as a tool to test the goodness of our index
choice. The procedure outlined by the two authors envisages regressions of each index on the
others to discover, for each variable, the amount of information which is already contained in the
remaining indexes. This implies that the factors presenting a high level of R-squared have a
volatility well explained by the ones of the others. This means that such indexes do not add any
information to the dependent variable so they are supposed to be dropped.
Furthermore, Lobosco and Di Bartolomeo’s methodology allows to come up with confidence
intervals for the weights obtained in the Strategic Style Analysis. There is no need to say that the
lower the confidence interval, the better is the index choice.
Some regressions show a high R-squared (60/70%). This cannot be due to a geographic overlap, as
we have accurately avoided it during the preliminary selection of the factors. The most likely
reason is that there is a sort of Sector-Overlapping, namely that the indexes have exposure the
same industry sector.
On the contrary, the Confidence Interval is always low as it never exceeds 10%. This result confirms
the high accuracy of the chosen indexes .
Efficient Frontier Rather than using just 10 portfolios, which would have produced an unreadable chart, we took
into account 10 portfolios by equally spacing the returns from the minimum index to the maximum
index (as asked by the assignment), plus 5 portfolios with equally spacing returns from 0.19% to
0.13% in order to display better the inefficient part of the frontier. Of course, we plotted the fund
portfolio (the violet dot), the minimum variance portfolio (in green) and the benchmark portfolio
resulting from the Style Analysis (in brown). We also charted the indexes used for the

Geographical Style Analysis. Since the minimum variance portfolio is almost only invested in cash,
we decided to calculate also the minimum variance portfolio excluding cash (red dot). This last
portfolio lays on the inefficient area of the risk-return chart: this means that the use of cash allows
to enhance the risk-return profile with respect to only equity portfolios
.As it is possible to see the fund does not lie on the
efficient frontier, although it has been able to
generate higher returns with lower volatility with
respect to 4 indexes. The fund is dominated by the
benchmark obtained thanks to the Style Analysis and
by MSCI North America, which is the only portfolio to
be on the efficient frontier. On the other side, MSCI
Emerging Markets Latin America has been the worst
index, as it is aligned on the inefficient frontier.
Overall, it seems that the fund managers provided a
modest risk-adjusted return. This is also confirmed by
the t-test we performed against the MSCI World used
as benchmark. We hypothesized a difference in the
average returns equal to zero and the test failed to reject the null hypothesis. This is equivalent to
say that there is no sufficient statistical evidence to claim that the fund provided better returns
with respect to the benchmark.
0,13%
0,26%
0,39%
0,52%
0,64%
0,77%
0,90%
1,03%
1,15%
North America
MV 0,14%
0,15% 0,16% 0,17% 0,18%
Benchmark
Fund
EM LatAm
EM Asia
Pacific
EM EMEA
Europe
1,28%
Cash
MVadj
0,00%
0,20%
0,40%
0,60%
0,80%
1,00%
1,20%
1,40%
0,00% 1,00% 2,00% 3,00% 4,00% 5,00% 6,00%
Exp
ect
ed
Re
turn
Standard Deviation
Efficient Frontier
Test t:two samples with different variances
MSCI World BGF
Mean 0,0095 0,0079
Variance 0,0007 0,0012
# Obs 60 60
Difference 0 gdl 112 Stat t 0,3009

Appendix I: Correlation Matrix of Indexes
Recommended