1
The Westminster Briefing
Presentation 5: Accelerated Climate Change and
the Task of Stabilisation
David Wasdell This is by way of a summary of the overall situation that has been outlined so far. Most of the systems known to affect climate change are in net positive feedback.
Figure 5.1
Technically we use positive feedback to talk about bad things and negative to talk about good things. Let’s talk about accelerating feedbacks and damping feedbacks shall we. Most of the feedbacks are accelerating climate change. Each mechanism in its own process accelerates the effect of that process. But as we started looking at the overall conceptual modelling of the feedback system we began to realise the outputs of one feedback are the inputs to all the others, particularly when they are
Most of the systems known to affect Most of the systems known to affect
Climate Change are now in net positive Climate Change are now in net positive
feedback. Each feedback mechanism feedback. Each feedback mechanism
accelerates its own specific process. As a accelerates its own specific process. As a
whole, the complex adaptive feedback whole, the complex adaptive feedback
system consists of an interactive set of system consists of an interactive set of
mutually reinforcing subsystems.mutually reinforcing subsystems.

2
temperature sensitive. So they begin to work together and accelerate each other. Extra heating because of the carbon cycle creates a situation where the ice cycle is accelerated. Less albedo reflection increases the warming, which increases all the other things that are temperature-dependent. So it is an interactive set of mutually reinforcing systems.
Figure 5.2
I shall never forget (to Peter Wadhams) sitting in your study in Cambridge, when you said, “David I think you have just put your finger on something that nobody has spotted before”. That we have what we call a second order feedback system. Feedback on feedback that accelerates climate change. And that faces us with the possibility of what has been called “The Tipping Point” in the whole earth system. Now tipping points are rapidly becoming buzz words and YouTube words. We have tipping points in our giving up of smoking and all sorts of things. But a tipping point occurs when a system’s behaviour gets to a threshold and then moves past that threshold into behaviours from which it does not easily return. It accelerates away from equilibrium. If we go beyond the point, not just where natural systems pass that threshold, but where natural and human systems together reach the point where human intervention can no longer return the system to base, then we precipitate runaway climate change. That will set off a major extinction event, like the five massive extinctions and crises in the whole biosphere that we have so far experienced in the geological history. That now is being seen as a very real possibility.
This second orderThis second order
feedback systemfeedback system
thereforetherefore
accelerates the rate ofaccelerates the rate of
Climate ChangeClimate Change

3
Figure 5.3
So what is a tipping point? Here is quite a good example of it.
Figure 5.4
Here you have what is called an ‘attractor basin’ where behaviours are held stably in a zone which may go to ice ages and inter-glacial warm periods, but it stays within that envelope of possibilities. What the Industrial Revolution has done has
Beyond the Tipping Beyond the Tipping PointPoint
Facing theFacing the
AnthropoceneAnthropocene
Extinction EventExtinction Event
“Tipping Point”or Bifurcation
Between Two Attractor Basins

4
pushed with the feedbacks and the forcings up to a ridge, a watershed if you will, and pushed us just into the beginnings of accelerated change that can take us out of that traditional attractor basin, and push us into a hotter earth scenario. It would indeed be contained eventually, probably by massive cloud formation and would not go as far as the Venus answer of very, very hot earth. The last time Peter Wadhams and I discussed this, he said, “I think we should look at that again David, because I am not quite certain where these boundaries occur!” So that is an example of a tipping point, or bifurcation. It is a bifurcation if you are walking along the ridge because you can go either way. It is a tipping point if you are coming up and over the watershed into a new basin.
Figure 5.5
This represents the cross section through this watershed zone between the two attractor basins. To the left lies the old stable equilibrium, the ice-ages and the inter-glacial warm periods. Then comes an inflection point where positive feedbacks begin to start acting. That leads on to the unstable equilibrium, where amplifying feedbacks just outweigh the containing feedbacks and the whole system is very unstable – is it going to go this way, is it going to go that way. As we go on increasing positive feedback, it goes over the top of the hill, and leads to the beginnings of accelerated change and potentially runaway global heating. That is the natural system. Now I want to couple that with the human system. I will introduce this slowly, it is a complicated concept and I find difficulty
Increase in Global Heating
Unstable Equilibrium
Potential Energy of Equilibrium State
Inflection Point
Original stable Equilibrium
Runaway Global Heating

5
explaining it, let alone other people understanding it. What we are looking at here is the critical threshold where as a species we lose control of the runaway process.
Figure 5.6
Figure 5.7
Figure 5.8
Introducing the ConceptIntroducing the Conceptofof
“Critical Threshold”“Critical Threshold”
the point beyond whichthe power of positive feedback
overwhelms the capacity forhuman intervention
the point at whichthe cost of climate stabilisation
escalates asymptoticallytowards infinity

6
If you put humanity and the natural system together as one system then there would be a tipping point where whatever we do, we can’t stop it happening anymore.
Figure 5.9
So down near the origin in the bottom left hand corner, back in the old equilibrium area, increased global heating didn’t trigger very much positive feedback and we had lots of power to intervene. Climate stabilisation cost virtually nothing, as is represented by the light-green area. The more the heating has increased, the more the temperature has gone up, the more positive feedback is engaged in the system, the less power we have to act on it, until we begin to approach the critical threshold. Here there is so much positive feedback in the system that the interventions we can make do not overcome the accelerated feedback. At that point we lose control and precipitate runaway change. In fact as we approach the critical threshold, it is not just that it costs more to make the intervention or takes more intervention to make the difference. The cost actually goes off to infinity. It is an asymptotic line here. We cross that threshold at our peril. Now let’s combine the two graphs in one. We think we are just on the right side of the unstable equilibrium, the point where positive feedback starts accelerating the climate beyond the instability and towards the critical threshold.

7
Stern recognised that the sooner we intervene, the lower would be the economic cost of climate stabilisation. He did not recognise that there is a limit to the timescale beyond which intervention is impossible. So this really does turn the economics on its head.
Figure 5.10
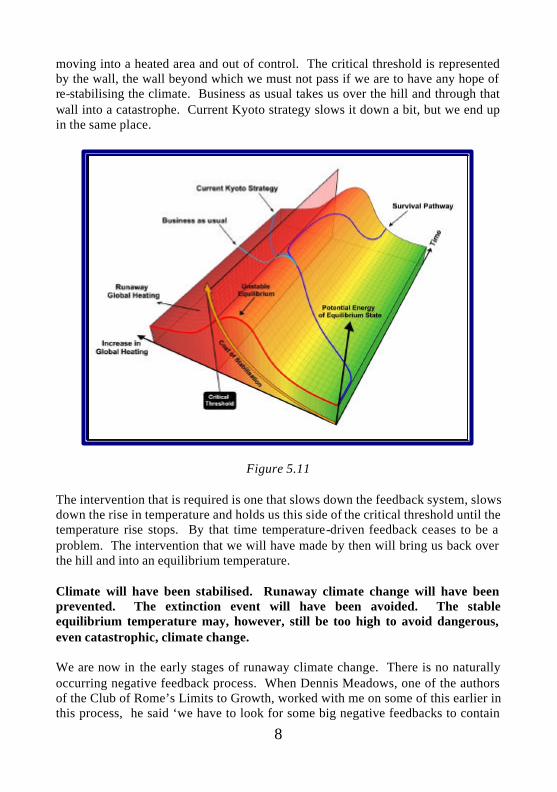
Only yesterday, I was talking to the First Secretary of the Swedish Embassy in Ottawa. He said, “It is no longer a question of can we afford it. It is a question of can we do it. Then we have to cut our economics to fit the imperative from the environment.” So economic imperatives are no longer the driver of climate policy. The environment drives the policy and the policy has to cut its economics to fit the cloth of the environmental system. That is a huge shift strategically in our understanding of climate change and has not been taken into account in Kyoto. It has not been taken into account in European legislation. It has not been taken into account in the current Bill before Parliament. Now I want to introduce the time dimension to this diagram (see Figure 5.11). We have had to rotate it a bit so that the camera angles show up the various pathways through the landscape. On the left face is the picture I had before. The green valley represents the old equilibrium area where it was safe enough, and climate was stable within limits. Running from lower left to upper right is the ridge of unstable equilibrium. Beyond the ridge is the runaway potential of the system
8
moving into a heated area and out of control. The critical threshold is represented by the wall, the wall beyond which we must not pass if we are to have any hope of re-stabilising the climate. Business as usual takes us over the hill and through that wall into a catastrophe. Current Kyoto strategy slows it down a bit, but we end up in the same place.
Figure 5.11
The intervention that is required is one that slows down the feedback system, slows down the rise in temperature and holds us this side of the critical threshold until the temperature rise stops. By that time temperature-driven feedback ceases to be a problem. The intervention that we will have made by then will bring us back over the hill and into an equilibrium temperature. Climate will have been stabilised. Runaway climate change will have been prevented. The extinction event will have been avoided. The stable equilibrium temperature may, however, still be too high to avoid dangerous, even catastrophic, climate change. We are now in the early stages of runaway climate change. There is no naturally occurring negative feedback process. When Dennis Meadows, one of the authors of the Club of Rome’s Limits to Growth, worked with me on some of this earlier in this process, he said ‘we have to look for some big negative feedbacks to contain

9
this system’, but they are not out there to be found. We have to make them ourselves.
Figure 5.12
So strategically we have to generate a negative feedback, a damping intervention of sufficient power to overcome the already active accelerating feedbacks, and maintain its effectiveness during that period while temperature driven feedback threatens to destabilise it and push it beyond the wall. That is one extraordinarily difficult intervention. I do not personally believe it is impossible, as some
We are now in the early stages of runaway Climate Change.
There does not appear to be any naturally occurring
negative feedback process in place to contain its effects.
Strategically we have to generate a negative feedback
intervention of sufficient power to overcome the now active positive feedback process.
Then maintain its effectiveness during the period while
temperature-driven feedback continues to be active.

10
doomsters say, but it certainly is out of all keeping with the strategies currently in place. In order to focus on the new strategic task we now face, I will introduce a different way of looking at the material, namely the perspective of “Radiative Forcing”.
Figure 5.13
Radiative Forcing is the difference between energy that comes in from the sun and the energy we radiate back out again. At the moment we are pushing out about 1% less than we are receiving, that is what is causing the problem. We are moving away from radiative balance (the equilibrium position with no global heating) and increasing the amount of excess heat that we are holding year by year.
Figure 5.14
Radiative ForcingRadiative Forcing
-
Time
AcceleratingGlobal Heating
0
-ve
+ve
Thermal Equilibrium
GlobalHeating

11
Figure 5.15
Peter Cox has shown us something like this already, so I will move through it quite quickly. Here are the contributions to radiative forcing – global heating – from four different sources, up to the year 2000. Firstly from methane, which has levelled off at the moment. That is largely because we have shifted from coal-fired to gas -fired power stations, we have started to deal with outputs from landfill, we have plugged the leaks in gas pipes, and we have stopped venting methane into the atmosphere from the oil fields. As the feedbacks in the methane system increase, we would expect this to begin to go up again over the coming decades. Nitrous oxides, a product of extensive fertiliser use, though small are still increasing. That is another area in which we can intervene. Emission of CFCs has been cut off, following implementation of the Montreal Protocol, but they stay in the atmosphere for a long time so their effect on global heating will only slowly degrade. The major contributor, of course, is carbon dioxide. The next slide (Figure 5.16) is taken from the work of Jim Hansen and others at the Gifford Institute of Space Studies at NASA. It provides a summary of all the different contributors to global heating apart from low altitude water vapour, and change in albedo. Carbon dioxide, at the year 2000, drove radiative forcing of 1½ watts per square metre; methane about half a watt; CFCs about one-third of a watt; the nitrogen oxides just over a tenth. Ozone – at the very high levels in the atmosphere it is a slight coolant, but low level ozone is adding about four-tenths of a watt per square metre. A bit of water vapour at high altitude is produced by the breakdown of methane.

12
Figure 5.16
Here is a new one: – black carbon. It is generated by the burning of Biomass, the incomplete combustion of fossil fuels, and industrial processes. Sooty particles of black carbon are released which then absorb heat and warm the atmosphere. It also settles on the surface of ice and snow and makes it more absorbent of heat and light energy, so it reduces the albedo of the snow areas. There are blackening areas in the snow of the northern hemisphere from the huge industrial explosion in China. Aerosols – the sulphate particles also scatter light energy and reflect it back, so they are coolants. This is global dimming from the particulates. They also have an indirect effect by creating extra cloud cover which also reflects out light. Land use, deforestation increases albedo, leading to slight cooling. Finally, sun has increased its energy outputs a little during this period, though there has been a slight decrease since 1987, the years in which the fastest global warming has occurred. So if we take those last 5 items and add them together for convenience, we have a negative radiative forcing of about 1 watt per square metre.
Figure 5.17

13
Now we put this into graphical form. We stayed in radiative balance (no global warming) until the start of the industrial revolution, then it began to increase. By the year 2000, CO2 on its own was contributing 1½ watts per square metre.
Figure 5.18
By 2007, CO2 concentration had risen to 382 ppm, adding another 0.3 watt per square metre. Add in CO2 equivalents, nitrous oxide, methane, CFCs, and ozone, and the concentration rises to about 445 ppm CO2e.
Figure 5.19
Radiative Forcing
380
400420
4402.5+ CO2e
2007
Radiative Forcing
20072007
380
460480
4002.5
+ H2Ovap
3.6
+ CO 2e
380
420440
2007
+ Albedo-change?

14
Now we add in the effect of increase in concentration of atmospheric water vapour. Water vapour adds about 1 watt per square metre per degree rise in temperature. So our global warming of 0.7 of a degree so far, has added about 0.7 watts per square metre to the radiative forcing. In other words the water vapour feedback has added 50% to the heating due to the CO2 we have put up there already. Then there is a small amount of change in albedo to add onto that. That gives us a total radiative forcing of about 4 watts per square metre. If we now subtract the 1 watt per square metre net cooling that I have shown you before, then we arrive at a figure of roughly 3 watts per square metre. That is the heat engine driving climate change. If you have a reasonably large house, then if you put a 1 kilowatt fire into the attic and leave it on all the time, you get some idea of the heat energy that is driving global warming.
Figure 5.20
In order to stabilise the climate, we have to balance inputs and outputs in the energy equations. That means reducing radiative forcing to zero. If we have to reduce radiative forcing by the equivalent of 3 watts per square metre, what is the amount by which we will have to reduce carbon dioxide concentration in order to do that? As a rule of thumb, a reduction of 3 watts per square metre would require a reduction of something like 160 to 180 ppm in the current concentration of atmospheric CO2. That is what would be required to re -stabilise climate. Radiative forcing is currently increasing at 25% per decade, and accelerating. If we made a strategic intervention at today’s date, we would need to slow the rate of increase, stop it going any higher, begin to reduce the heating, turn the heat engine down and bring the radiative forcing back to zero.
Time
Accelerating Global Heating
0
-ve
+ve
Thermal Equilibrium
Global Heating
Effects of required Strategic Intervention
Global Cooling
Intervention Point

15
Any such intervention would take time to come into effect. During that period temperature would continue to rise, activating further powerful feedbacks from increased water-vapour concentration, reduced ice albedo, release of frozen methane, continued degrade of CO2 sinks, and release of non-anthropogenic CO2 from burning forests. To be successful the intervention would have to take all these factors into account. That might stabilise the climate and prevent runaway heating, but it would still involve an increased temperature. That is because the temperature of the earth would have risen to the point where it would be radiating the same amount of energy that we are receiving, but under conditions of an enhanced greenhouse effect (i.e. through a slightly thicker “duvet”). We would have prevented the Anthropocene Extinction Event, but we would certainly not have prevented dangerous climate change, and could still be facing potentially catastrophic climate change as a result of the increased temperature. The situation would be under control but hotter. If that equilibrium temperature were judged to be too hot, then we would need to go into a period of global cooling (negative radiative forcing) and reduce the output temperature to something that minimised catastrophic climate change. In the last two years the analysis of climate dynamics has proceeded far beyond that portrayed in the latest IPCC Assessment Report. It was not taken into account in the Stern Report. The Climate Bill, currently before Parliament is based on even more out of date material, and is therefore utterly inadequate as a response to the current crisis. Acceleration of climate change is already a matter of observation. Virtually every parameter is moving faster than predicted by the international ensemble of climate models.
Figure 5.21
In Conclusion:In Conclusion:
Some Comments fromSome Comments fromAround the WorldAround the World

16
Figure 5.22
Figure 5.23
Warming is accelerating
GREATLY, especially "Recently"
Dennis Bushnell, Chief Scientist, NASA Langley Research Center
12th January 2007
The Earth’s climate is remarkably sensitive to
global forcings. Positive feedbacks predominate. This allows the entire planet to
be whipsawed between climate states…. Recent greenhouse gas emissions place the Earth
perilously close to dramatic climate change that could run out of our control, with great dangers
for humans and other creatures.
James Hansen, Director, NASA Goddard Institute for Space Studies. 18 th February 2007

17
Figure 5.24
Figure 5.25
We have already
passed the stage of dangerous climate change. The task
now is to avoid catastrophic
climate change
Prof John Holdren, President AAAS
August 2006
“The possibility of a tipping point in the earth system as a whole which prevents the recovery of stable equilibrium and leads to a process of
runaway climate change, is now the critical research agenda, requiring the concentration of global resources in a “Manhattan Project” style
engagement. All other work on impact assessment, mitigation and adaptation depends
on the outcome of this overarching issue.”
John Schellnhuber: Director, PIK Potsdam.Quoted from EU Commission Report
On Complexity Science Workshop. 15th June 2006

18
Figure 5.26
Figure 5.27
Planet EarthPlanet Earth
We Have a ProblemWe Have a Problem
There now exists aThere now exists a
State of PlanetaryState of Planetary
EmergencyEmergency
Recommended