Adaptive page segmentation for color technical journals’ cover images1
Wei-Yuan Chen, Shu-Yuan Chen*
Department of Computer Engineering and Science, Yuan-Ze University, 135 Far-East Rd, Nei-Li, Chung-Li, Taoyuan 32026, Taiwan, Republic of China
Received 20 September 1996; received in revised form 18 September 1997; accepted 8 December 1997
Abstract
Page segmentation to locate text blocks is a prior and primary step in document processing, in particular for understanding a journal’scover page. However, texts, graphics and images are usually isolated in most documents, unlike cover pages in which texts may be overlaidonto graphics or images. In this paper a new adaptive page segmentation method is proposed to extract text blocks from various types of colortechnical journals’ cover images. Although color involves useful information to overcome the overlapping problem, color processingrequires tremendous computation loads. Thus, a complexity analysis is included to adaptively adjust processing steps in our approach. Inother words, simple cover images, with few colors and no text–graphics/image overlapping, can be treated as monochrome images to speedup processing time, while for complex cover images, with many colors and text–graphics/image overlapping, correct segmentation resultscan still be obtained but more processing time is required. To accomplish the design concept mentioned above, our method includes severalcomponents. First, in order to degrade the processing complexity on true color images, a new simple quantization method is employed toreduce the color numbers from 24-bit true colors to 42 colors or less. In the block segmentation stage, smearing, labeling and complexityanalysis techniques are used together with edge and color information to find out coherent blocks adaptively. After that, in the blockclassification stage, some conventional and some new features are computed from each block to decide whether it is a text block or not.Finally, in the post-processing stage, some spatial relations are adopted to rectify the classification results. Experimental results prove thefeasibility and practicality of the proposed approach.q 1998 Elsevier Science B.V. All rights reserved.
Keywords:Page segmentation; Text extraction; Color quantization; Block classification; Document processing; Complex background
1. Introduction
1.1. Motivation
Rapid processes in computer technology allow computervision to be applied in many fields. However, many challen-ging research issues must be overcome to accomplish thegoal of replacing human eyesight by computer vision. Forexample, it is a difficult and worth-studying problem toextract text blocks from complex background in colorimages and then recognize characters within these blocks,although it is a trivial activity for human eyes. More impor-tantly, this particular pattern recognition technique can beapplied to journal contents recognition and journal check-inautomation for library automation. Thus, the goal of thispaper is to develop a good page segmentation method toseparate text blocks from non-text blocks for the colortechnical journals’ cover images.
Actually, text-block extraction has been studied in thefield of document analysis for many years and several tech-niques have been developed to achieve the requirements.But texts, graphics and images are usually isolated inmost documents, unlike cover pages in which texts maybe overlaid on graphics or images. Moreover, most of pre-vious research issues were focused on monochrome images.Therefore, we intend to solve this type of problem so as notonly to propose a novel page segmentation method for thecolor images of cover pages but also to develop a generaltext extraction method for any types of color documentimages.
Unfortunately, the variety of color cover images isdiverse. According to the criterion of processing difficulty,the color cover images can be classified into the followingtwo levels. One includes all the simple images in whichtexts, images or graphics are isolated, as shown in Fig. 11;the other includes all the complex images in which textblocks are overlaid on images or graphics, as shown inFig. 13. In order to handle all the varieties the proposedmethod must have the ability of self-tuning to the complexityof color cover images. In other words, the proposed method
0262-8856/98/$ - see front matterq 1998 Elsevier Science B.V. All rights reserved.PII S0262-8856(98)00062-6
* Corresponding author. Tel: 886 3463 8800 ext.357; fax: 886 3463 8850;e-mail: [email protected]
1 This work was supported partially by the National Science Council,Republic of China, under NSC 85-2213-E-155-021.
Image and Vision Computing 16 (1998) 855–877
IMAVIS 1518
must adjust processing steps such that both categories canbe processed correctly but with different performance.
1.2. Survey of related studies
Since the early 1980s a lot of techniques have been pro-posed to accomplish the task of page segmentation, but mostof these techniques have been proposed for monochromedocument images. For example, there are two famousapproaches, the RLSA (run-length smoothing algorithm)[1] and the RXYC (recursive X–Y cuts) [2], on whichmost of later studies [3–9,24,25,27] are based. The RLSAwas proposed by Johnstom [1] to distinguish text blocksfrom graphics and first extended by Wong et al. [3] to obtainvarious types of blocks, each containing the same type ofdata. The method is to smear a binary image by connectingthe black pixels which are close to each other. Then blockscan be found by combining the horizontal and verticalsmearing results. Nagy, Seth and Stoddard [2] use horizon-tal and vertical projections and make cuts corresponding todeep valleys in profiles to segment a document image intodisjointed blocks. However, most of the segmenting proce-dures based on the above two approaches will fail on theimages having severe tilt angles. Several major categories ofskew detection are based on the techniques of projectionprofile [10], Hough transform [11], white streams [12] andnearest-neighbor cluster [13,14].
Besides the above two approaches often used, severalother techniques have been proposed to achieve page seg-mentation for monochrome documents. Examples are usingknowledge model [15,16] and text regularity properties[12,14]. Nagy et al. [15,16] accomplish both document seg-mentation and component labeling simultaneously. Thesegmentation is aided by performing component labelingbased on a specific grammar regarding technical journallayout. The text regularity property is included in Ref.[12] by using white spaces for block segmentation andusing correlation between adjacent scanlines for text identi-fication. In [14] such property is signified in documentspectrum,docstrum, which is based on nearest-neighborclustering of page components.
Actually, docstrumcan provide proper information toobtain the orientation, text lines and text blocks of adocument. On the other hand, Jain [17,18] involves suchregularities by regarding text regions as texture. Then themutichannel filtering technique for texture segmentation,with specific Gabor filters, is used for page segmentation.For a broad survey, see [19–22].
Recently, more and more printed documents withcomplex layout and multiple colors are published everyday. One of the most difficult tasks to develop a generaldocument analysis system is how to handle the millions ofnumerous colors in the digitized image rapidly and accu-rately. Median-cut color quantization [23] is a simple anduseful method. Tsai et al. used this method for color quan-tization in Ref. [24] and further modified it as a two-step
method in [25]. Another approach is based on the histogramanalysis. Zhong et al. [26] labeled image pixels as a fewprototype colors. The prototypes are found as local maximain a smoothed color histogram of the input image. Mostly,the number of prototypes is about 5–500. A variant quan-tization method, differing from the above two, was proposedby Suen and Wang [27]. It used edge detection techniques toquantize the true color images into binary images.
Different color quantization methods can greatly impressdifferent text features and classification procedures. Ba-sically, features and classification techniques proposed formonochrome images can be used directly on an individualcolor plane of a quantized color image if each color plane istreated as a monochrome one [24,25]. However, suchapproach has two shortcomings. One is that if the segmenta-tion procedure is applied on a color plane individually,computing time is rising greatly. The other is that treatingcolor as a whole can provide more information than treatingcolor as three independent components. Thus, manyapproaches have been proposed to develop document ana-lysis techniques directly on the color images. In Ref. [26], ahybrid method, combining connected component methodand spatial variance techniques, was proposed to locatetexts in complex color images. The basic idea is that regionswith high variance correspond to text lines and regions withlow variance correspond to white regions between the textlines. Together with the color quantization method based onhistogram analysis, text regions can be located. However,this method will fail when texts are overlaid on a complexgraphic background. On the other hand, edge-based colorquantization method was used in Ref. [27] to extract textstrings from images of color printed documents. Fordocuments with uniform background, it is a good andrapid technique.
1.3. Proposed approach
1.3.1. Overview of the proposed approachTo reach the requirement mentioned in Section 1.1,
human heuristics is employed in the proposed approach.That is, texts can be observed only when the contrastbetween them and their surrounding background is highenough. More specifically, we will define all the blockswith a large color difference from their surroundings asprimary blocks. Then, further processing can be restrictedonly to these primary blocks to reduce computation load.
However, for a primary block, color processing stillinvolves a great deal of computational load. On the otherhand, color is useful information to overcome the text–gra-phics/image overlapping problem since texts with uniformcolor can be detected by considering only those pixels witha specific color. In order to solve the overlapping problembut not to sacrifice the processing speed for the non-over-lapping case we employ an adaptive block segmentationprocedure on the primary block. In other words, complexityanalysis for further subdivision, which is based on the
856 W.-Y. Chen, S.-Y. Chen/Image and Vision Computing 16 (1998) 855–877
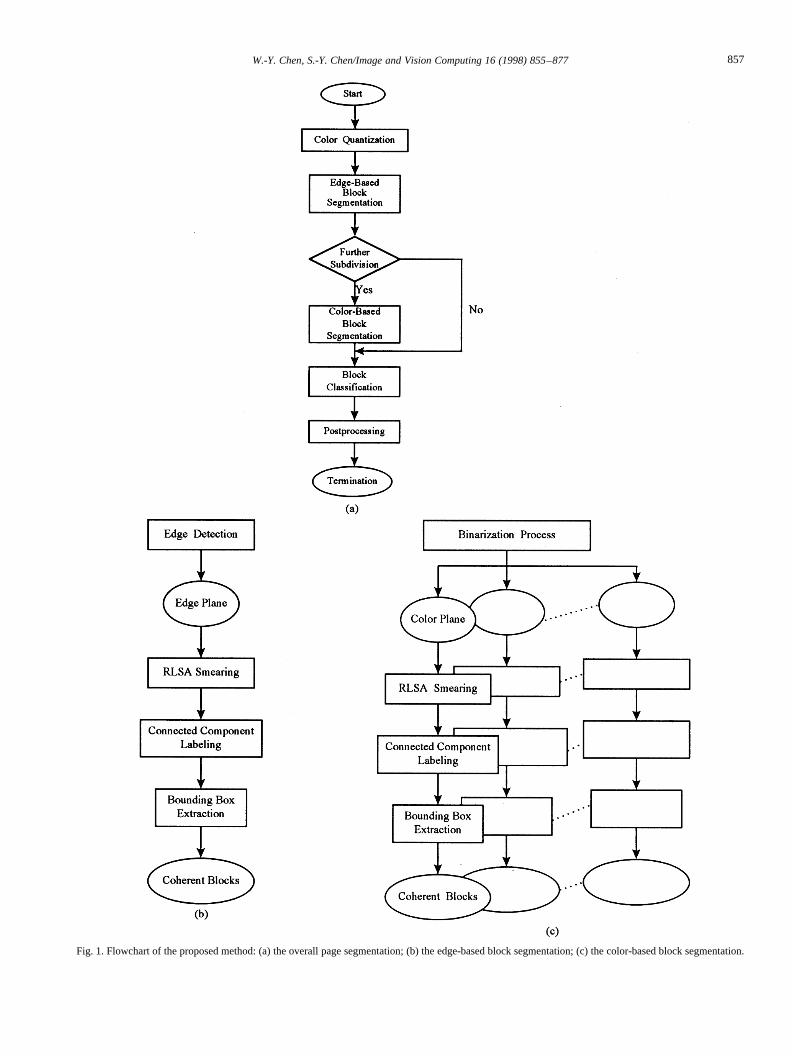
Fig. 1. Flowchart of the proposed method: (a) the overall page segmentation; (b) the edge-based block segmentation; (c) the color-based block segmentation.
857W.-Y. Chen, S.-Y. Chen/Image and Vision Computing 16 (1998) 855–877
number of colors included in the block, is performed on theprimary block first. The resulting simple primary block canbe considered a coherent block on which no subdivision isneeded; while the resulting complex primary block withtexts, graphics and images intermixed must be furtherdecomposed into coherent blocks using color information.In general, simple images will be decomposed into manysmaller primary blocks, each of which is a coherent blockand can be classified directly. In contrast, complex imageswill be decomposed into a few larger adulterant primaryblocks, on each of which further subdivision will be neededand classification can then be applied.
In summary, a simple image can be handled by involvingonly one color plane, just like a monochrome image; whilefor a complex image, multiple color planes must beinvolved and thus more computation time is demanded.Henceforth, adaptive page segmentation can be accomplished.
In order to complete the design concept mentioned above,our method can be separated by four major parts: colorquantization, adaptive block segmentation including edge-based and colorbased block segmentation, block classi-fication and post-processing, as shown in Fig. 1(a).Moreover, the edge-based and color-based block segmenta-tion is composed of three steps as shown in Fig. 1(b),(c),respectively. In the remainder of this paper the four majorparts will be described in Sections 2–5, respectively.Experimental results and conclusions are included in Sec-tions 6 and 7.
1.3.2. AssumptionsSome restrictions are made in this paper to reduce the
complexity of our method:
1. The skew angle of the scanned image cannot be toosloppy.
2. A character is assumed to have uniform color. Texts withgradient colors are avoided.
3. Documents contain horizontal textlines only. However,the proposed method can be extended to handletextlines written in vertical direction. Nevertheless,such a generalized algorithm will involve excessivecomputation.
2. Simple color quantization
When an A4 journal cover page is scanned as a 250 dpi(dot per inch) true color image, the amount of raw datastorage will be over 15 Mb. Storage is a huge load for theimage processing. It is also a heavy burden if the true colorimage is processed directly. In fact, only a few primarycolors are sufficient for segmentation processing. To savecomputational requirement, we propose a simple colorquantization method to reduce the color clusters from16 777 216 to 42 or less. In this section, quantized colorsare first defined in Section 2.1 followed by quantizationmethod described in Section 2.2.
2.1. Definition of quantized colors
The RGB color system is first transformed to the YIQcolor system, because YIQ color system is more related to
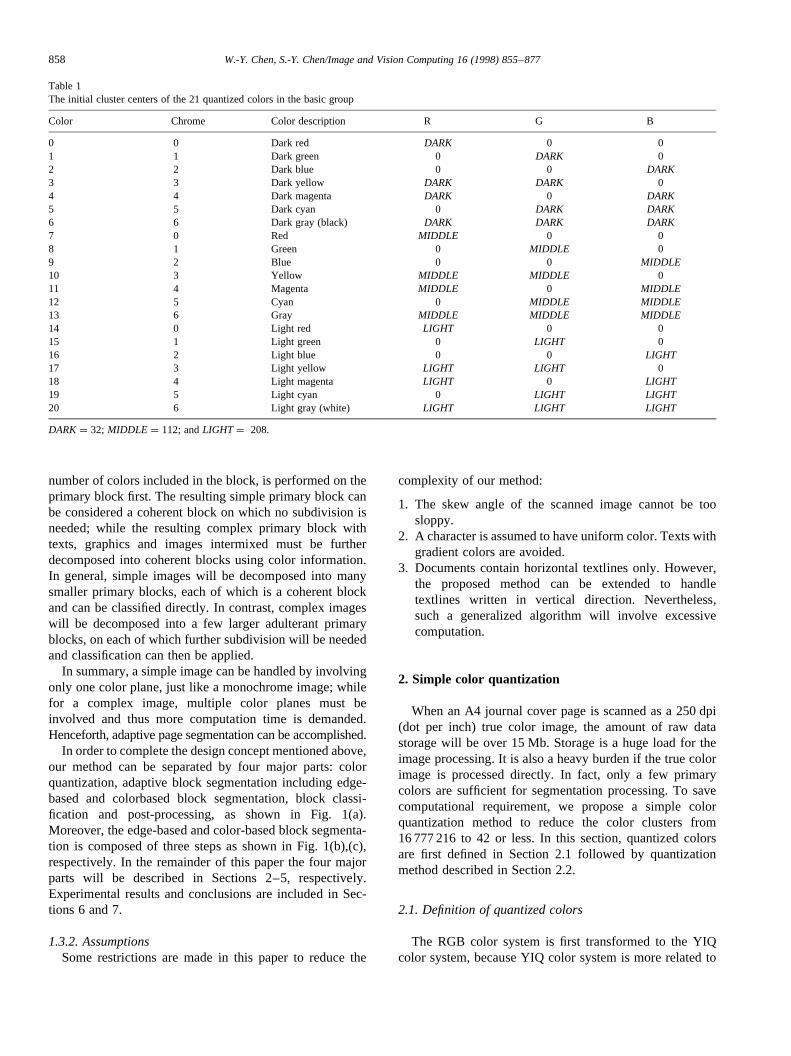
Table 1The initial cluster centers of the 21 quantized colors in the basic group
Color Chrome Color description R G B
0 0 Dark red DARK 0 01 1 Dark green 0 DARK 02 2 Dark blue 0 0 DARK3 3 Dark yellow DARK DARK 04 4 Dark magenta DARK 0 DARK5 5 Dark cyan 0 DARK DARK6 6 Dark gray (black) DARK DARK DARK7 0 Red MIDDLE 0 08 1 Green 0 MIDDLE 09 2 Blue 0 0 MIDDLE10 3 Yellow MIDDLE MIDDLE 011 4 Magenta MIDDLE 0 MIDDLE12 5 Cyan 0 MIDDLE MIDDLE13 6 Gray MIDDLE MIDDLE MIDDLE14 0 Light red LIGHT 0 015 1 Light green 0 LIGHT 016 2 Light blue 0 0 LIGHT17 3 Light yellow LIGHT LIGHT 018 4 Light magenta LIGHT 0 LIGHT19 5 Light cyan 0 LIGHT LIGHT20 6 Light gray (white) LIGHT LIGHT LIGHT
DARK¼ 32; MIDDLE ¼ 112; andLIGHT ¼ 208.
858 W.-Y. Chen, S.-Y. Chen/Image and Vision Computing 16 (1998) 855–877
human visual perception. The conversion from RGB to YIQis defined by [28]:
Y
I
Q
26643775¼
0:299 0:587 0:114
0:596 ¹ 0:275 ¹ 0:321
0:212 ¹ 0:523 0:311
26643775
R
G
B
26643775: (1)
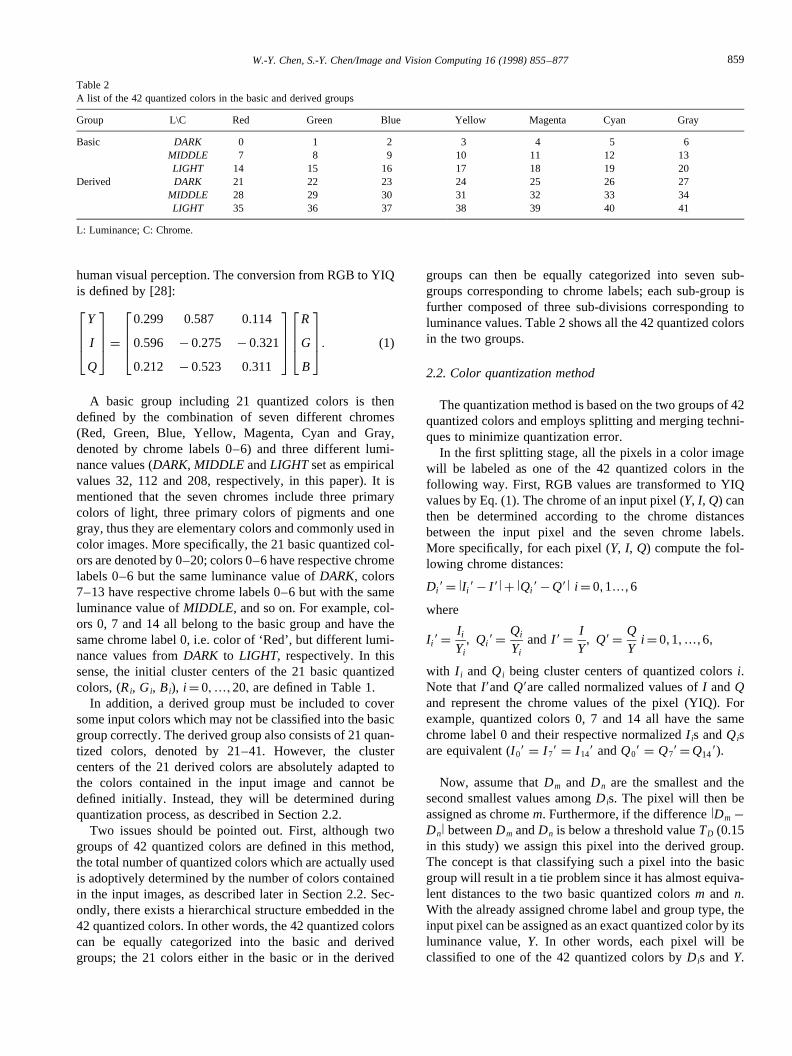
A basic group including 21 quantized colors is thendefined by the combination of seven different chromes(Red, Green, Blue, Yellow, Magenta, Cyan and Gray,denoted by chrome labels 0–6) and three different lumi-nance values (DARK, MIDDLE andLIGHT set as empiricalvalues 32, 112 and 208, respectively, in this paper). It ismentioned that the seven chromes include three primarycolors of light, three primary colors of pigments and onegray, thus they are elementary colors and commonly used incolor images. More specifically, the 21 basic quantized col-ors are denoted by 0–20; colors 0–6 have respective chromelabels 0–6 but the same luminance value ofDARK, colors7–13 have respective chrome labels 0–6 but with the sameluminance value ofMIDDLE, and so on. For example, col-ors 0, 7 and 14 all belong to the basic group and have thesame chrome label 0, i.e. color of ‘Red’, but different lumi-nance values fromDARK to LIGHT, respectively. In thissense, the initial cluster centers of the 21 basic quantizedcolors, (Ri, Gi, Bi), i ¼ 0;…; 20; are defined in Table 1.
In addition, a derived group must be included to coversome input colors which may not be classified into the basicgroup correctly. The derived group also consists of 21 quan-tized colors, denoted by 21–41. However, the clustercenters of the 21 derived colors are absolutely adapted tothe colors contained in the input image and cannot bedefined initially. Instead, they will be determined duringquantization process, as described in Section 2.2.
Two issues should be pointed out. First, although twogroups of 42 quantized colors are defined in this method,the total number of quantized colors which are actually usedis adoptively determined by the number of colors containedin the input images, as described later in Section 2.2. Sec-ondly, there exists a hierarchical structure embedded in the42 quantized colors. In other words, the 42 quantized colorscan be equally categorized into the basic and derivedgroups; the 21 colors either in the basic or in the derived
groups can then be equally categorized into seven sub-groups corresponding to chrome labels; each sub-group isfurther composed of three sub-divisions corresponding toluminance values. Table 2 shows all the 42 quantized colorsin the two groups.
2.2. Color quantization method
The quantization method is based on the two groups of 42quantized colors and employs splitting and merging techni-ques to minimize quantization error.
In the first splitting stage, all the pixels in a color imagewill be labeled as one of the 42 quantized colors in thefollowing way. First, RGB values are transformed to YIQvalues by Eq. (1). The chrome of an input pixel (Y, I, Q) canthen be determined according to the chrome distancesbetween the input pixel and the seven chrome labels.More specifically, for each pixel (Y, I, Q) compute the fol-lowing chrome distances:
Di9 ¼ lIi9 ¹ I 9lþ lQi9 ¹ Q9l i ¼ 0,1…, 6
where
Ii9 ¼Ii
Yi, Qi9 ¼
Qi
Yiand I 9 ¼
IY
, Q9 ¼QY
i ¼ 0,1, …,6,
with I i and Qi being cluster centers of quantized colorsi.Note thatI9andQ9are called normalized values ofI andQand represent the chrome values of the pixel (YIQ). Forexample, quantized colors 0, 7 and 14 all have the samechrome label 0 and their respective normalizedI is andQisare equivalent (I 09 ¼ I 79 ¼ I 149 andQ09 ¼ Q79 ¼ Q149).
Now, assume thatDm and Dn are the smallest and thesecond smallest values amongDis. The pixel will then beassigned as chromem. Furthermore, if the differencelDm ¹
Dnl betweenDm andDn is below a threshold valueTD (0.15in this study) we assign this pixel into the derived group.The concept is that classifying such a pixel into the basicgroup will result in a tie problem since it has almost equiva-lent distances to the two basic quantized colorsm and n.With the already assigned chrome label and group type, theinput pixel can be assigned as an exact quantized color by itsluminance value,Y. In other words, each pixel will beclassified to one of the 42 quantized colors byDis andY.
Table 2A list of the 42 quantized colors in the basic and derived groups
Group L\C Red Green Blue Yellow Magenta Cyan Gray
Basic DARK 0 1 2 3 4 5 6MIDDLE 7 8 9 10 11 12 13LIGHT 14 15 16 17 18 19 20
Derived DARK 21 22 23 24 25 26 27MIDDLE 28 29 30 31 32 33 34LIGHT 35 36 37 38 39 40 41
L: Luminance; C: Chrome.
859W.-Y. Chen, S.-Y. Chen/Image and Vision Computing 16 (1998) 855–877
We can then update the cluster center of each quantizedcolor according to all the pixels labeled as the correspondingcolor.
In the second stage, we just merge similar colors together.There are two conditions under which we have to perform amerge operation:
1. If the luminance of one quantized color is below a thresh-old valueTYB (50 in this study), the color will be regardedas black and merged into quantized color six.
2. If two quantized colors have their respectiveI, Q, andYvalues close to each other, they will be merged together.
After the merging stage has been completed, the numberof quantized colors remained, sayK, can be considered asthe total number of quantized colors used in the input colorimage. The major steps of the color quantization method aregiven below.
Algorithm. Color Quantization
Input.(1) An input color image;
(2) threshold valueTD, TA, TYB, TYM, TIM andTQM, theyare empirical values and set as 0.15, 0.0005, 50, 35, 0.1and 0.25, respectively;(3) the width and height of the input color image, sayWIDTH andHEIGHT
Output.(1) A quantized color image;
(2) the number of quantized colors used in the image,sayK./*Initial stage*/
Step 1. Initialize the cluster centers of the 21 quantizedcolors in the basic group as those defined in Table 1,and transform respectiveRGBvalues intoYIQ values,i.e. (Yi, I i, Qi), i ¼ 0,1,…,20.Step 2. Compute the normalizedI and Q values forquantized colors 0–6, i.e.
Ii9 ¼Ii
Yi,Qi9 ¼
Qi
Yii ¼ 0,1, …,6:
Step 3. Create the other color group (the other 21 quan-tized colors) with undefined cluster centers./*Split stage*/For each pixel in the input color image, perform Steps4–10.Step 4. Convert (R, G, B) values of the pixel intoðY; I ;QÞ values.Step 5. Compute the normalized values ofI and Qassociated with the pixel by
I 0 ¼IY
, Q9 ¼QY:
Step 6. Compute the chrome distances between the
pixel and chrome labels 0–6 by
Di9 ¼ lIi9 ¹ I 9lþ lQi9 ¹ Q9l i ¼ 0,1, …,6:
Step 7. Find the minimum and the second minimumvalues amongDi, say Dm and Dn, and compute thedifferencelDm ¹ Dnl betweenDm andDn.
If lDm ¹ Dnl $ TD, thenB is set as 0.If lDm ¹ Dnl # TD, thenB is set as 21.
Step 8. According to the luminanceY, compute threedifference values, lY-DARKl, lY-MIDDLEl, andlY-LIGHTl.
If lY-DARKl is the smallest one, thenL is set as 0If lY-MIDDLEl is the smallest one, thenL is set as 7.If lY-LIGHTl is the smallest one, thenL is set as 14.
Step 10. Assign the pixel as quantized colormþ B þ L./*Update stage*/Step 11. Update the cluster center of each quatizedcolor i as the averageYIQ values of all the pixelswith the same labeli./*Merge stage*/The quantized colors into which more thanTA 3WIDTH 3 HEIGHT pixels have been classified in thesplit stage are considered possible colors used in theinput image. Furthermore, such colors can be candi-dates for performing the merging operation. The mer-ging process will be repeated for each candidate untilno merging operation is needed.Step 12. If the luminanceY of one quantized colori isbelow TYB, then colori is merged into color six anddeleted. Consequently, re-label all of the pixels withlabel i as six and update the cluster centers of colorsix accordingly.Step 13. Compute the distances between any two quan-tized colorsi andj by DY ¼ Yi ¹ Yj, DI ¼ Ii ¹ Ij ;D ¼ QQi ¹ Qj.
If DY , TYM, DI , TIM, andDQ , TQM, colorsi andj are merged together as colorj and colori is deleted.Consequently, re-assign all the pixels with labeli ascolor j and update the cluster center of colorj./*Termination stage*/After the merging stage has been completed, the num-ber of quantized colors remaining, sayK, is the totalnumber of quantized colors actually used in the inputcolor image.
3. Adaptive block segmentation
The purpose of block segmentation is to decompose thequantized image into components which will be the units fortype classification. In order to handle various types of colorjournal cover images adaptively, we will adopt the follow-ing segmentation procedure.
860 W.-Y. Chen, S.-Y. Chen/Image and Vision Computing 16 (1998) 855–877
Edge-based segmentation is first performed to find outmajor connected components, having contrast from theirsurrounding, as primary blocks. Complexity analysis isthen employed on each primary block to decide whetherfurther subdivision is necessary. If it is true, color-basedsegmentation is adopted to obtain more coherent connectedcomponents, each of which contains only the pixels of thesame color. Otherwise, the primary block can be considereda coherent block and classified directly.
Whether in the edge-based segmentation or in the color-based segmentation, blocks can be extracted by the samebounding-box extraction algorithm which uses smearingand labeling techniques. In this section, bounding-boxextraction algorithm is first described in Section 3.1followed by edge-based block segmentation, complex ana-lysis for subdivision and color-based block segmentation inSection 3.2Section 3.3Section 3.4, respectively.
3.1. Bounding-box extraction
To extract coherent blocks as connected components onbinary image, black pixels close to each other should belinked together. A RLSA (run length smearing algorithm)[1,3] has been used earlier to achieve the goal. The al-gorithm is briefly described as follows.
Let 1 denote black pixels and 0 denote white ones. Givenan arbitrary sequence of 0s and 1s, and a constraint, sayC,which determines whether the black pixels are located closeenough, the white pixels between two black pixels whosedistance is smaller than or equal to a constraintC arereplaced by 1. For example, consider the following binarysequence:
110010000100010010000111
With a constraint valueC ¼ 3, the above binary string isconverted into the sequence:
111110000111111110000111
The RLSA can be applied row-by-row as well as column-by-column on the binarized plane, yielding two distinct bit-maps. In general, the horizontal and vertical spacings ofdocuments are different, thus different constraints,CH andCV, are used for row and column processing. In this studyCH and CV are set asWIDTH/4 andHEIGHT/16, respec-tively. The two resulting bit-maps are then combined in alogical AND operation. Additional horizontal smearingoperation with smaller constraint (CS ¼ WIDTH/64) onthe AND-combination results produce the final smearingresult.
After that, the labeling technique [29] can be applied onthe final smearing result to find out all the 8-connectedcomponents. Bounding boxes, each enclosing a connectedcomponent on the binarized plane, are then defined as therectangle with four sides being the top, bottom, left and right
extremes of the corresponding connected components. Notethat the width and height of the bounding box, denoted byWidth and Height, are important features for furtherprocessing.
3.2. Edge-based block segmentation
Since each pixel in a quantized image is characterized bytheR, G andB values, edges will occur on the borders wherethe values ofR, G andB have sudden transitions. Thus, theedge strength of each point can be evaluated as the sum ofthe magnitudes ofR, G and B gradients, which can beobtained by Sobel operators [29]. After the pixels withstrong edge values have been detected as edge pixels, thequantized color image is transformed into a binary image ofedge-representation, i.e. edge plane, by setting the edgepoints to 1s and the others to 0s.
The bounding-box extraction algorithm, as described inSection 3.1, can be applied on the edge plane to find out allthe bounding boxes contained in the edge plane. In fact,such bounding boxes are regarded as the primary blocks,which are the units of complexity analysis and furtherprocessing. The flowchart of the edge-based block segmen-tation is shown in Fig. 1(b).
3.3. Complexity analysis for subdivision
First, some notations used for complex analysis aresummarized below.
Dominant color: in a block, the color with the largestnumber of pixels is called the dominant color. Thiscolor is usually considered as background color.Second dominant color: in a block, the color with thesecond largest number of pixels is referred to as thesecond dominant color. This color is usually consideredas foreground color, e.g. text color.Two-color mode: if the number of pixels of the domi-nant or the second dominant color is over a thresholdvalue TCN, then the block is called two-color mode.Notice that the value ofTCN is adjustable according tothe block size, i.e.TCN ¼ 0.77 3 Width 3 Height. Inother words, a block exhibits two-color mode if itsbackground and foreground pixels occupy a great partof itself.Multi-color mode : a block is called multi-color modeif it is not two-color mode.
For a primary block, complexity analysis for subdivisionis based on the number of colors included in itself. If theprimary block is two-color mode then it can be regarded as acoherent block on which classification can be applieddirectly. In other words, further subdivision on such a pri-mary block is not necessary. On the contrary, if the primaryblock is multi-color mode, it must be further decomposedinto more coherent blocks, each with the same color.
861W.-Y. Chen, S.-Y. Chen/Image and Vision Computing 16 (1998) 855–877
3.4. Color-based block segmentation
As mentioned in Section 3.3, a multi-color mode primaryblock requires further subdivision. To reach this goal, wecan apply bounding-box extraction algorithm, as describedin Section 3.1, on individual color planes, each of which is abinary image by setting all the pixels with a specific quan-tized color to 1s and the others to 0s. Thus, coherent blockson the respective color planes can be found out. The flow-chart of color-based block segmentation is shown in Fig.1(c). Note that the number of color planes is equal to thenumber of quantized colors which are actually used in thecolor image, i.e.K determined in quantization process inSection 2.2.
Now, we have many coherent blocks, either from edge-based or form color-based block segmentation. Since thosecoherent blocks are the units of block classification, we mustdecide what is the foreground text color before applying theclassification procedure. A simple rule is described below. Ifthe coherent block is extracted from edge plane, then it mustbe two-color mode. In such case, the second dominant colorof the primary block is usually regarded as the foregroundtext color. Only when the second dominant color of theprimary block is the same as the background color ofthe whole image is the dominant color chosen as textcolor for the block. If the block is extracted from an indivi-dual color plane, then the corresponding quantized color,used in the binarization process as described above, isregarded as foreground text color, and all the other colorsas background color.
4. Block classification
In this paper, the block classification problem is trans-formed into the problem of using features to identify textblocks. Several conventional features [3] are chosen forclassification and listed in Section 4.1. In addition, fournew features are proposed in Section 4.2. Since all the fea-tures associated with text block should be bounded in areasonable threshold interval, ranges of these thresholdsare listed in Section 4.3. Finally, the classification rulesare included in Section 4.4.
4.1. Review of conventional features
Conventional features used in this study are listed asfollows:
1. The height of the bounding box.
Height¼ height of bounding box:
2. The width of the bounding box.
Width¼ width of bounding box:
3. The size of the bounding box.
Size¼ Width3 Height:
4. The eccentricity of the bounding box.
Eccenticity¼WidthHeight
:
5. The saturation degree in the bounding box.
Saturation¼number_of_foreground_pixels
Width3 Height:
4.2. Proposed features
6. The transition variance in the block.Assume that transition occurs when a background pixel
turns to be a foreground pixel (or vice versa) along eachscan line. In general the transition variance of a series ofscan lines in a text block is smaller than that of a graphicblock. Thus, this feature can be used to distinguish textblocks from graphic blocks.
More specifically, we will scan pixels row by row andfrom left to right in the bounding box and definet i as thetotal number of transitions in thei-th row. For example,given the following pixel sequence with two color mode:-
where 2s and 5s denote background and foreground colors,respectively. The numbers of transitionst1 andt2 are six andtwo for rows one and two, respectively.
Then, we can define the feature,TransVar, by
TransVar¼
∑ilti ¹ tavgl
tavg(2)
wheretavg is the average of all thet is. Henceforth, substitut-ing the values oft is in the above example into Eq. (2), wecan obtain
tavg¼6þ 2
2¼ 4
TransVar¼lt1 ¹ tavglþ lt2 ¹ tavgl
tavg¼
2þ 24
¼ 1:
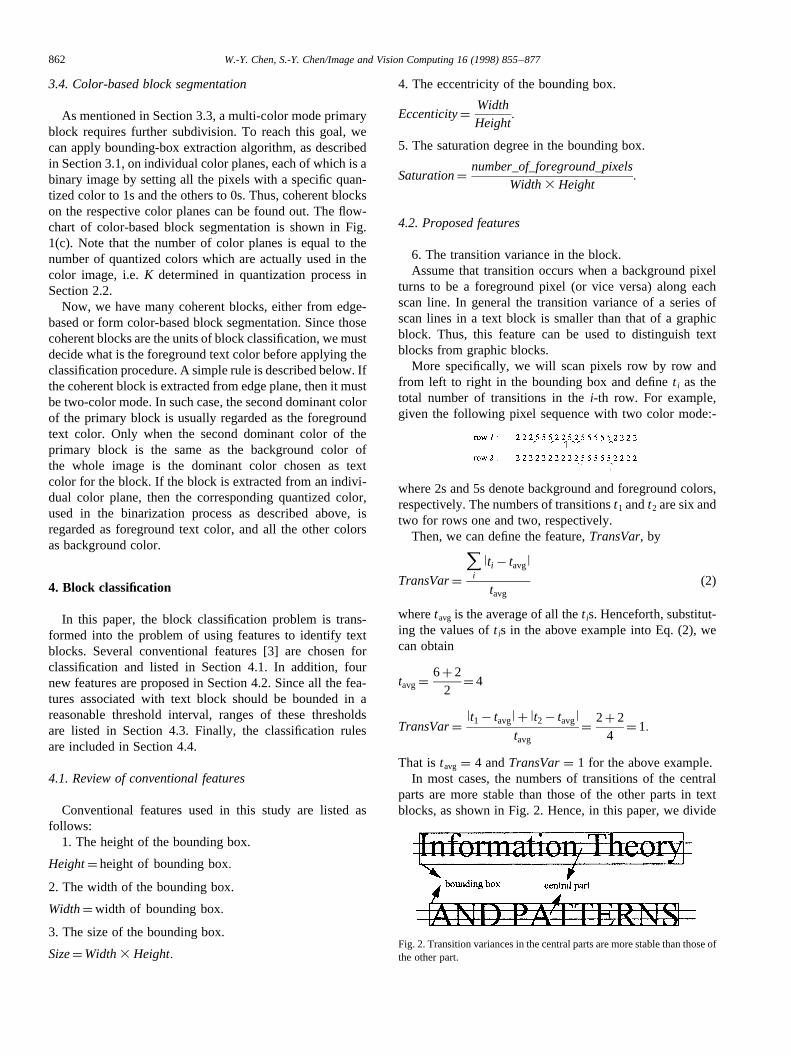
That istavg ¼ 4 andTransVar¼ 1 for the above example.In most cases, the numbers of transitions of the central
parts are more stable than those of the other parts in textblocks, as shown in Fig. 2. Hence, in this paper, we divide
Fig. 2. Transition variances in the central parts are more stable than those ofthe other part.
862 W.-Y. Chen, S.-Y. Chen/Image and Vision Computing 16 (1998) 855–877
the bounding box into three parts from the top to the bottomand involve only the central part of the block to compute thefeatureTransVar.
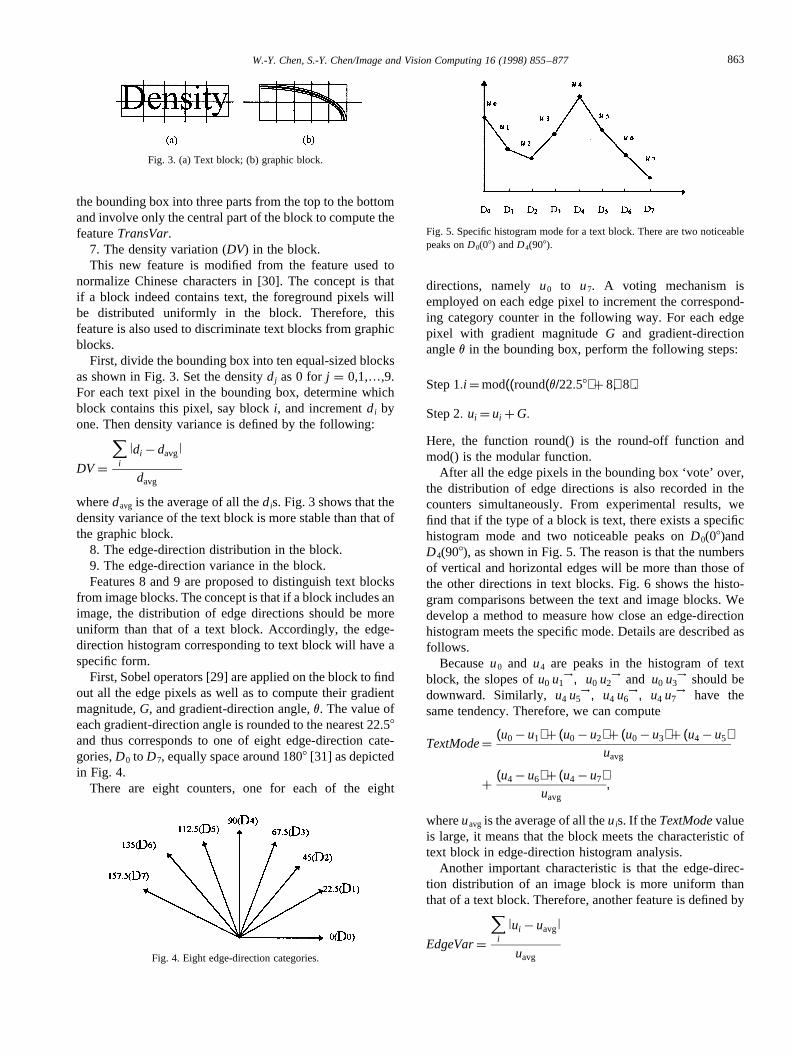
7. The density variation (DV) in the block.This new feature is modified from the feature used to
normalize Chinese characters in [30]. The concept is thatif a block indeed contains text, the foreground pixels willbe distributed uniformly in the block. Therefore, thisfeature is also used to discriminate text blocks from graphicblocks.
First, divide the bounding box into ten equal-sized blocksas shown in Fig. 3. Set the densitydj as 0 forj ¼ 0,1,…,9.For each text pixel in the bounding box, determine whichblock contains this pixel, say blocki, and incrementdi byone. Then density variance is defined by the following:
DV ¼
∑ildi ¹ davgl
davg
wheredavg is the average of all thedis. Fig. 3 shows that thedensity variance of the text block is more stable than that ofthe graphic block.
8. The edge-direction distribution in the block.9. The edge-direction variance in the block.Features 8 and 9 are proposed to distinguish text blocks
from image blocks. The concept is that if a block includes animage, the distribution of edge directions should be moreuniform than that of a text block. Accordingly, the edge-direction histogram corresponding to text block will have aspecific form.
First, Sobel operators [29] are applied on the block to findout all the edge pixels as well as to compute their gradientmagnitude,G, and gradient-direction angle,v. The value ofeach gradient-direction angle is rounded to the nearest 22.58and thus corresponds to one of eight edge-direction cate-gories,D0 to D7, equally space around 1808 [31] as depictedin Fig. 4.
There are eight counters, one for each of the eight
directions, namelyu0 to u7. A voting mechanism isemployed on each edge pixel to increment the correspond-ing category counter in the following way. For each edgepixel with gradient magnitudeG and gradient-directionanglev in the bounding box, perform the following steps:
Step 1:i ¼ mod((round(v=22:58) þ 8), 8):
Step 2: ui ¼ ui þ G:
Here, the function round() is the round-off function andmod() is the modular function.
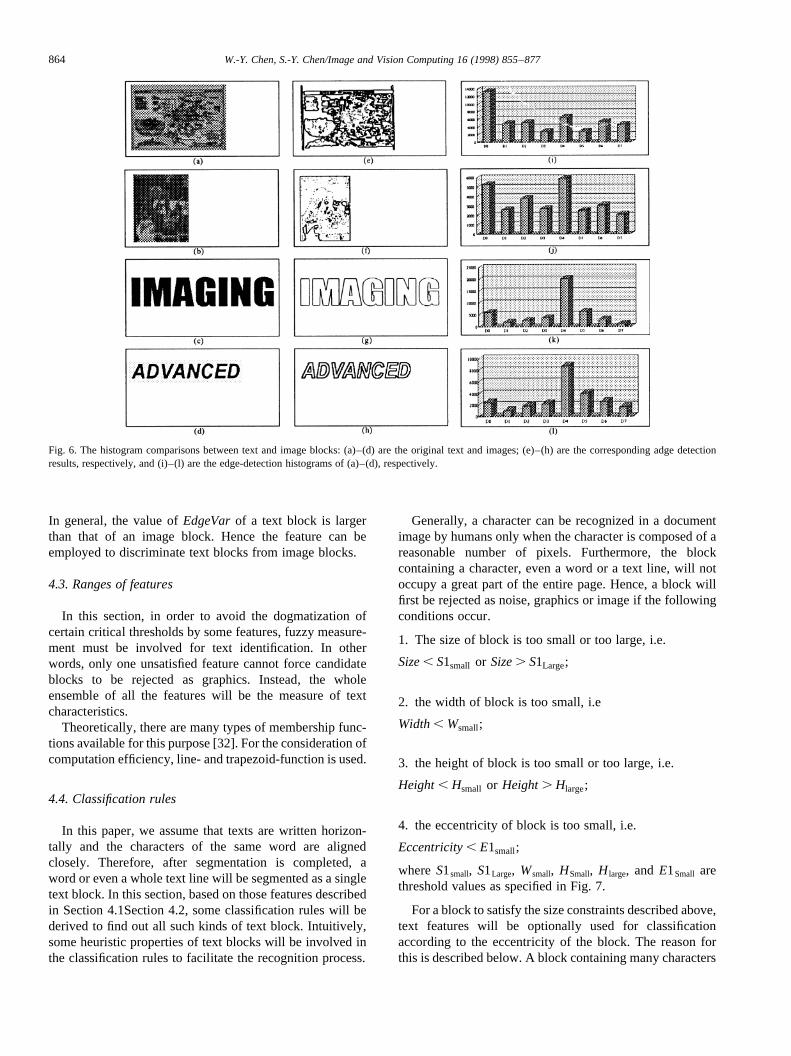
After all the edge pixels in the bounding box ‘vote’ over,the distribution of edge directions is also recorded in thecounters simultaneously. From experimental results, wefind that if the type of a block is text, there exists a specifichistogram mode and two noticeable peaks onD0(08)andD4(908), as shown in Fig. 5. The reason is that the numbersof vertical and horizontal edges will be more than those ofthe other directions in text blocks. Fig. 6 shows the histo-gram comparisons between the text and image blocks. Wedevelop a method to measure how close an edge-directionhistogram meets the specific mode. Details are described asfollows.
Becauseu0 and u4 are peaks in the histogram of textblock, the slopes ofu0 u1
→, u0 u2→ and u0 u3
→ should bedownward. Similarly, u4 u5
→, u4 u6→, u4 u7
→ have thesame tendency. Therefore, we can compute
TextMode¼(u0 ¹ u1) þ (u0 ¹ u2) þ (u0 ¹ u3) þ (u4 ¹ u5)
uavg
þ(u4 ¹ u6) þ (u4 ¹ u7)
uavg,
whereuavg is the average of all theuis. If theTextModevalueis large, it means that the block meets the characteristic oftext block in edge-direction histogram analysis.
Another important characteristic is that the edge-direc-tion distribution of an image block is more uniform thanthat of a text block. Therefore, another feature is defined by
EdgeVar¼
∑ilui ¹ uavgl
uavg
Fig. 3. (a) Text block; (b) graphic block.
Fig. 4. Eight edge-direction categories.
Fig. 5. Specific histogram mode for a text block. There are two noticeablepeaks onD0(08) andD4(908).
863W.-Y. Chen, S.-Y. Chen/Image and Vision Computing 16 (1998) 855–877
In general, the value ofEdgeVarof a text block is largerthan that of an image block. Hence the feature can beemployed to discriminate text blocks from image blocks.
4.3. Ranges of features
In this section, in order to avoid the dogmatization ofcertain critical thresholds by some features, fuzzy measure-ment must be involved for text identification. In otherwords, only one unsatisfied feature cannot force candidateblocks to be rejected as graphics. Instead, the wholeensemble of all the features will be the measure of textcharacteristics.
Theoretically, there are many types of membership func-tions available for this purpose [32]. For the consideration ofcomputation efficiency, line- and trapezoid-function is used.
4.4. Classification rules
In this paper, we assume that texts are written horizon-tally and the characters of the same word are alignedclosely. Therefore, after segmentation is completed, aword or even a whole text line will be segmented as a singletext block. In this section, based on those features describedin Section 4.1Section 4.2, some classification rules will bederived to find out all such kinds of text block. Intuitively,some heuristic properties of text blocks will be involved inthe classification rules to facilitate the recognition process.
Generally, a character can be recognized in a documentimage by humans only when the character is composed of areasonable number of pixels. Furthermore, the blockcontaining a character, even a word or a text line, will notoccupy a great part of the entire page. Hence, a block willfirst be rejected as noise, graphics or image if the followingconditions occur.
1. The size of block is too small or too large, i.e.
Size, S1small or Size. S1Large;
2. the width of block is too small, i.e
Width, Wsmall;
3. the height of block is too small or too large, i.e.
Height, Hsmall or Height. Hlarge;
4. the eccentricity of block is too small, i.e.
Eccentricity, E1small;
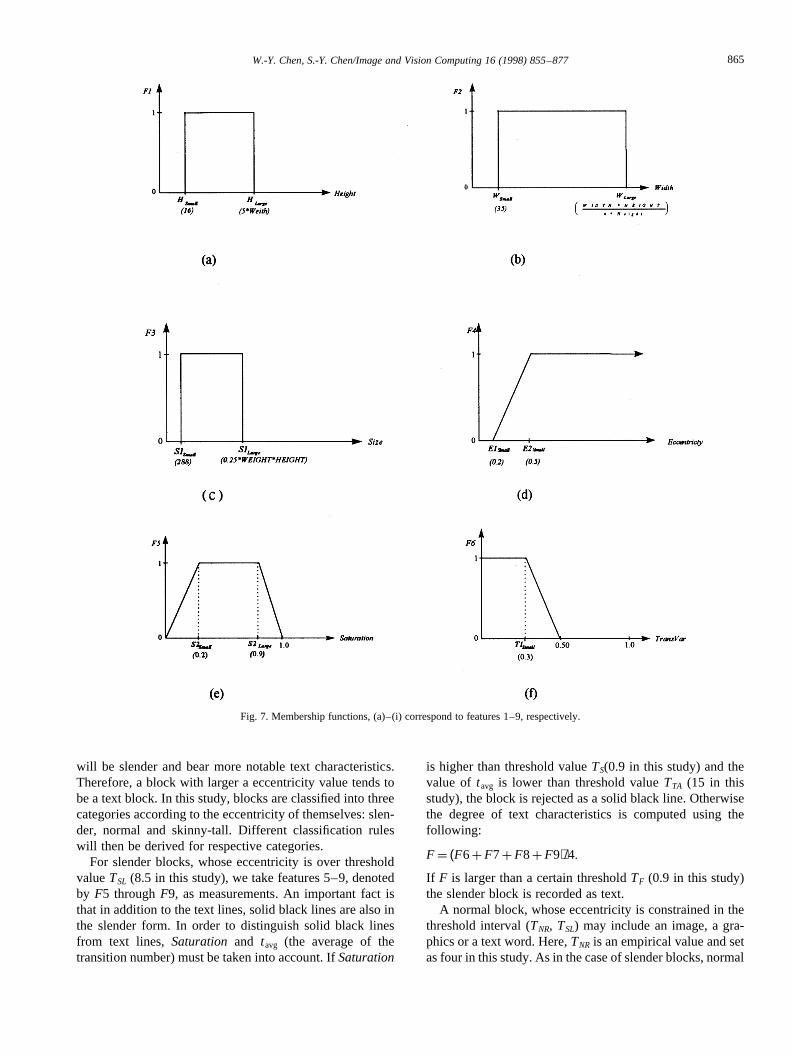
whereS1small, S1Large, Wsmall, HSmall, H large, and E1Small arethreshold values as specified in Fig. 7.
For a block to satisfy the size constraints described above,text features will be optionally used for classificationaccording to the eccentricity of the block. The reason forthis is described below. A block containing many characters
Fig. 6. The histogram comparisons between text and image blocks: (a)–(d) are the original text and images; (e)–(h) are the corresponding adge detectionresults, respectively, and (i)–(l) are the edge-detection histograms of (a)–(d), respectively.
864 W.-Y. Chen, S.-Y. Chen/Image and Vision Computing 16 (1998) 855–877
will be slender and bear more notable text characteristics.Therefore, a block with larger a eccentricity value tends tobe a text block. In this study, blocks are classified into threecategories according to the eccentricity of themselves: slen-der, normal and skinny-tall. Different classification ruleswill then be derived for respective categories.
For slender blocks, whose eccentricity is over thresholdvalueTSL (8.5 in this study), we take features 5–9, denotedby F5 throughF9, as measurements. An important fact isthat in addition to the text lines, solid black lines are also inthe slender form. In order to distinguish solid black linesfrom text lines, Saturation and tavg (the average of thetransition number) must be taken into account. IfSaturation
is higher than threshold valueTS(0.9 in this study) and thevalue of tavg is lower than threshold valueTTA (15 in thisstudy), the block is rejected as a solid black line. Otherwisethe degree of text characteristics is computed using thefollowing:
F ¼ (F6þ F7þ F8þ F9)=4:
If F is larger than a certain thresholdTF (0.9 in this study)the slender block is recorded as text.
A normal block, whose eccentricity is constrained in thethreshold interval (TNR, TSL) may include an image, a gra-phics or a text word. Here,TNR is an empirical value and setas four in this study. As in the case of slender blocks, normal
Fig. 7. Membership functions, (a)–(i) correspond to features 1–9, respectively.
865W.-Y. Chen, S.-Y. Chen/Image and Vision Computing 16 (1998) 855–877
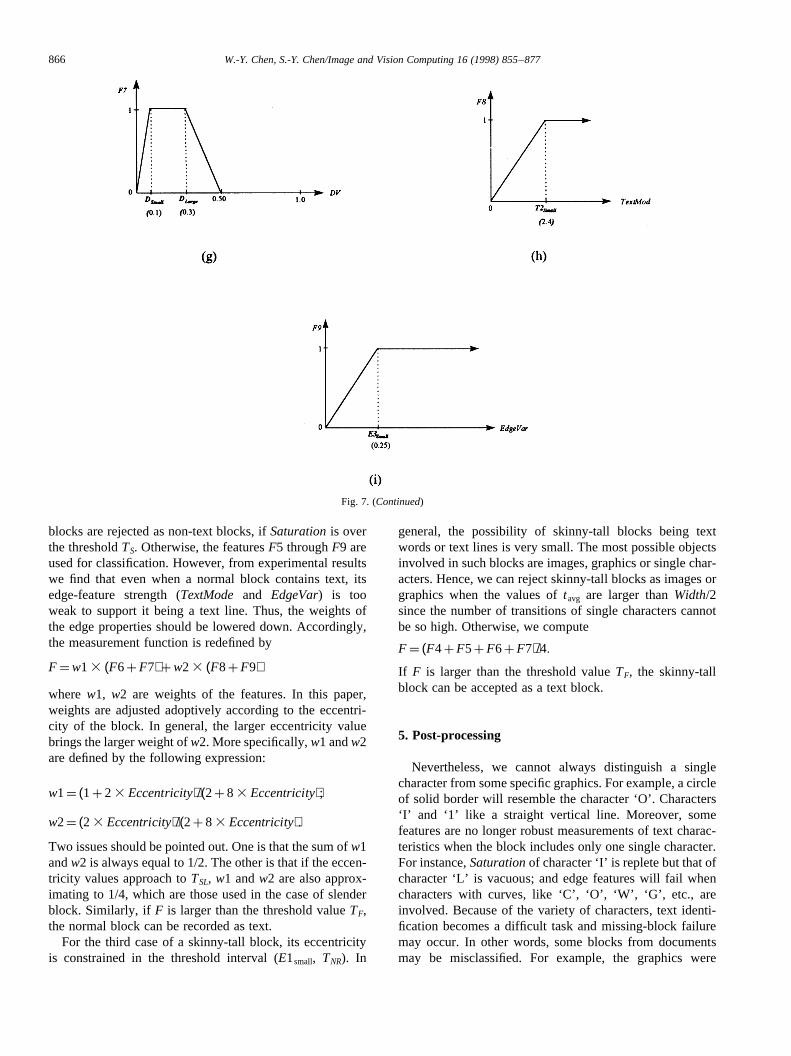
blocks are rejected as non-text blocks, ifSaturationis overthe thresholdTS. Otherwise, the featuresF5 throughF9 areused for classification. However, from experimental resultswe find that even when a normal block contains text, itsedge-feature strength (TextMode and EdgeVar) is tooweak to support it being a text line. Thus, the weights ofthe edge properties should be lowered down. Accordingly,the measurement function is redefined by
F ¼ w1 3 (F6þ F7) þ w2 3 (F8þ F9)
where w1, w2 are weights of the features. In this paper,weights are adjusted adoptively according to the eccentri-city of the block. In general, the larger eccentricity valuebrings the larger weight ofw2. More specifically,w1 andw2are defined by the following expression:
w1¼ (1þ 2 3 Eccentricity)=(2þ 8 3 Eccentricity);
w2¼ (2 3 Eccentricity)=(2þ 8 3 Eccentricity):
Two issues should be pointed out. One is that the sum ofw1andw2 is always equal to 1/2. The other is that if the eccen-tricity values approach toTSL, w1 andw2 are also approx-imating to 1/4, which are those used in the case of slenderblock. Similarly, if F is larger than the threshold valueTF,the normal block can be recorded as text.
For the third case of a skinny-tall block, its eccentricityis constrained in the threshold interval (E1small, TNR). In
general, the possibility of skinny-tall blocks being textwords or text lines is very small. The most possible objectsinvolved in such blocks are images, graphics or single char-acters. Hence, we can reject skinny-tall blocks as images orgraphics when the values oftavg are larger thanWidth/2since the number of transitions of single characters cannotbe so high. Otherwise, we compute
F ¼ (F4þ F5þ F6þ F7)=4:
If F is larger than the threshold valueTF, the skinny-tallblock can be accepted as a text block.
5. Post-processing
Nevertheless, we cannot always distinguish a singlecharacter from some specific graphics. For example, a circleof solid border will resemble the character ‘O’. Characters‘I’ and ‘1’ like a straight vertical line. Moreover, somefeatures are no longer robust measurements of text charac-teristics when the block includes only one single character.For instance,Saturationof character ‘I’ is replete but that ofcharacter ‘L’ is vacuous; and edge features will fail whencharacters with curves, like ‘C’, ‘O’, ‘W’, ‘G’, etc., areinvolved. Because of the variety of characters, text identi-fication becomes a difficult task and missing-block failuremay occur. In other words, some blocks from documentsmay be misclassified. For example, the graphics were
Fig. 7. (Continued)
866 W.-Y. Chen, S.-Y. Chen/Image and Vision Computing 16 (1998) 855–877
regarded as texts, texts were regarded as graphics, or over-lapping texts might occur.
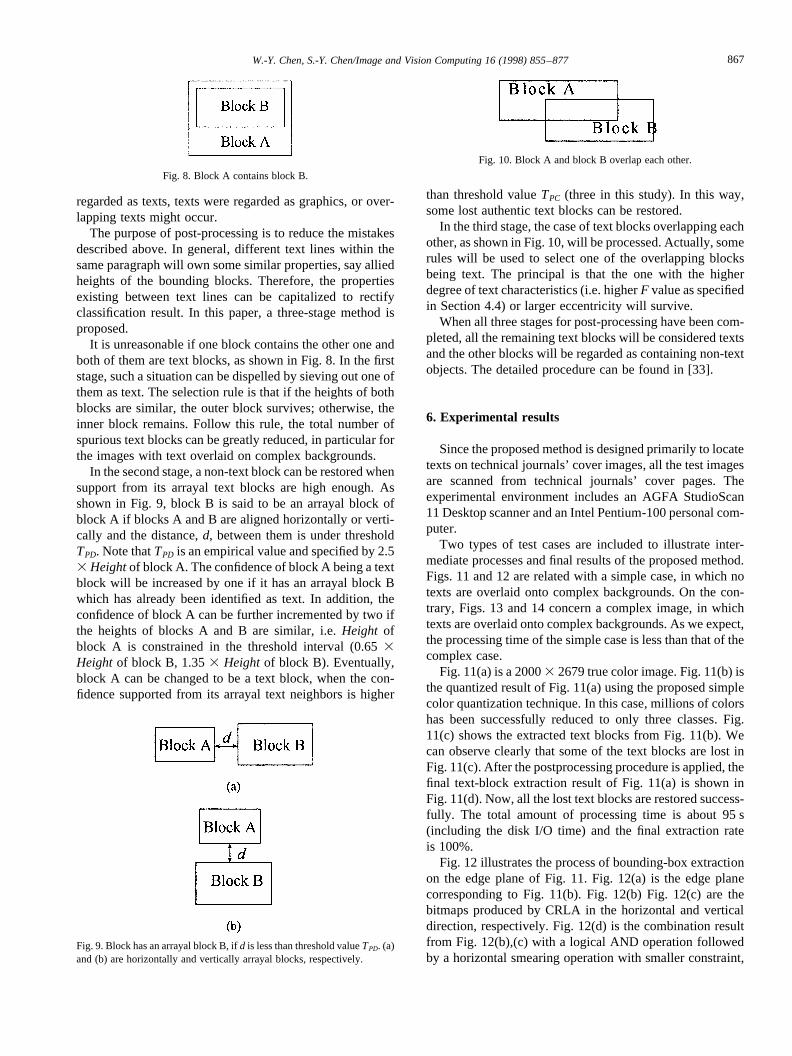
The purpose of post-processing is to reduce the mistakesdescribed above. In general, different text lines within thesame paragraph will own some similar properties, say alliedheights of the bounding blocks. Therefore, the propertiesexisting between text lines can be capitalized to rectifyclassification result. In this paper, a three-stage method isproposed.
It is unreasonable if one block contains the other one andboth of them are text blocks, as shown in Fig. 8. In the firststage, such a situation can be dispelled by sieving out one ofthem as text. The selection rule is that if the heights of bothblocks are similar, the outer block survives; otherwise, theinner block remains. Follow this rule, the total number ofspurious text blocks can be greatly reduced, in particular forthe images with text overlaid on complex backgrounds.
In the second stage, a non-text block can be restored whensupport from its arrayal text blocks are high enough. Asshown in Fig. 9, block B is said to be an arrayal block ofblock A if blocks A and B are aligned horizontally or verti-cally and the distance,d, between them is under thresholdTPD. Note thatTPD is an empirical value and specified by 2.53 Heightof block A. The confidence of block A being a textblock will be increased by one if it has an arrayal block Bwhich has already been identified as text. In addition, theconfidence of block A can be further incremented by two ifthe heights of blocks A and B are similar, i.e.Height ofblock A is constrained in the threshold interval (0.653Height of block B, 1.353 Height of block B). Eventually,block A can be changed to be a text block, when the con-fidence supported from its arrayal text neighbors is higher
than threshold valueTPC (three in this study). In this way,some lost authentic text blocks can be restored.
In the third stage, the case of text blocks overlapping eachother, as shown in Fig. 10, will be processed. Actually, somerules will be used to select one of the overlapping blocksbeing text. The principal is that the one with the higherdegree of text characteristics (i.e. higherF value as specifiedin Section 4.4) or larger eccentricity will survive.
When all three stages for post-processing have been com-pleted, all the remaining text blocks will be considered textsand the other blocks will be regarded as containing non-textobjects. The detailed procedure can be found in [33].
6. Experimental results
Since the proposed method is designed primarily to locatetexts on technical journals’ cover images, all the test imagesare scanned from technical journals’ cover pages. Theexperimental environment includes an AGFA StudioScan11 Desktop scanner and an Intel Pentium-100 personal com-puter.
Two types of test cases are included to illustrate inter-mediate processes and final results of the proposed method.Figs. 11 and 12 are related with a simple case, in which notexts are overlaid onto complex backgrounds. On the con-trary, Figs. 13 and 14 concern a complex image, in whichtexts are overlaid onto complex backgrounds. As we expect,the processing time of the simple case is less than that of thecomplex case.
Fig. 11(a) is a 20003 2679 true color image. Fig. 11(b) isthe quantized result of Fig. 11(a) using the proposed simplecolor quantization technique. In this case, millions of colorshas been successfully reduced to only three classes. Fig.11(c) shows the extracted text blocks from Fig. 11(b). Wecan observe clearly that some of the text blocks are lost inFig. 11(c). After the postprocessing procedure is applied, thefinal text-block extraction result of Fig. 11(a) is shown inFig. 11(d). Now, all the lost text blocks are restored success-fully. The total amount of processing time is about 95 s(including the disk I/O time) and the final extraction rateis 100%.
Fig. 12 illustrates the process of bounding-box extractionon the edge plane of Fig. 11. Fig. 12(a) is the edge planecorresponding to Fig. 11(b). Fig. 12(b) Fig. 12(c) are thebitmaps produced by CRLA in the horizontal and verticaldirection, respectively. Fig. 12(d) is the combination resultfrom Fig. 12(b),(c) with a logical AND operation followedby a horizontal smearing operation with smaller constraint,
Fig. 8. Block A contains block B.
Fig. 9. Block has an arrayal block B, ifd is less than threshold valueTPD. (a)and (b) are horizontally and vertically arrayal blocks, respectively.
Fig. 10. Block A and block B overlap each other.
867W.-Y. Chen, S.-Y. Chen/Image and Vision Computing 16 (1998) 855–877
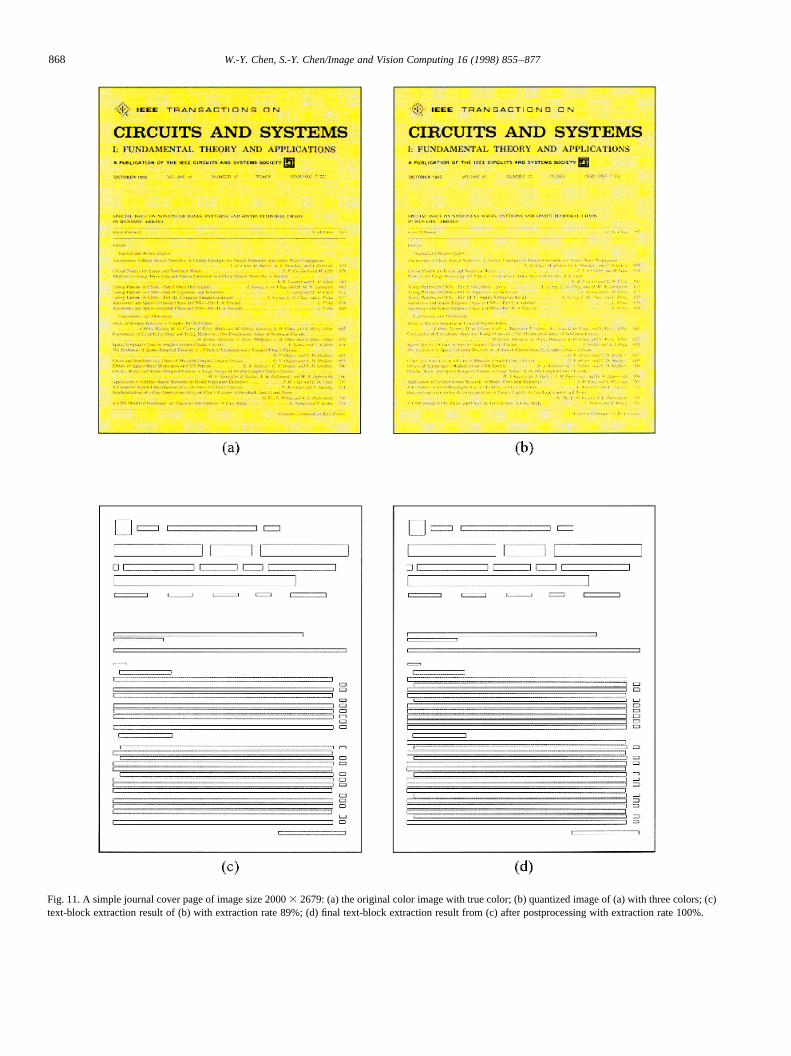
Fig. 11. A simple journal cover page of image size 20003 2679: (a) the original color image with true color; (b) quantized image of (a) with three colors; (c)text-block extraction result of (b) with extraction rate 89%; (d) final text-block extraction result from (c) after postprocessing with extraction rate 100%.
868 W.-Y. Chen, S.-Y. Chen/Image and Vision Computing 16 (1998) 855–877
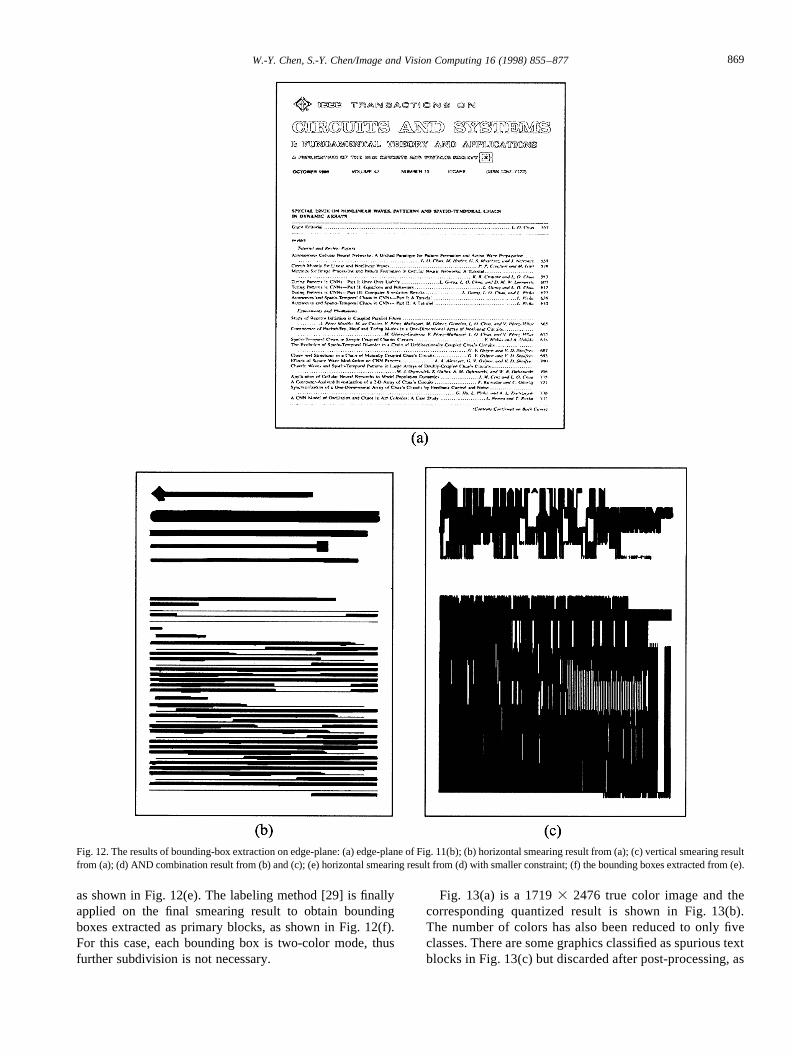
as shown in Fig. 12(e). The labeling method [29] is finallyapplied on the final smearing result to obtain boundingboxes extracted as primary blocks, as shown in Fig. 12(f).For this case, each bounding box is two-color mode, thusfurther subdivision is not necessary.
Fig. 13(a) is a 17193 2476 true color image and thecorresponding quantized result is shown in Fig. 13(b).The number of colors has also been reduced to only fiveclasses. There are some graphics classified as spurious textblocks in Fig. 13(c) but discarded after post-processing, as
Fig. 12. The results of bounding-box extraction on edge-plane: (a) edge-plane of Fig. 11(b); (b) horizontal smearing result from (a); (c) vertical smearing resultfrom (a); (d) AND combination result from (b) and (c); (e) horizontal smearing result from (d) with smaller constraint; (f) the bounding boxes extracted from (e).
869W.-Y. Chen, S.-Y. Chen/Image and Vision Computing 16 (1998) 855–877
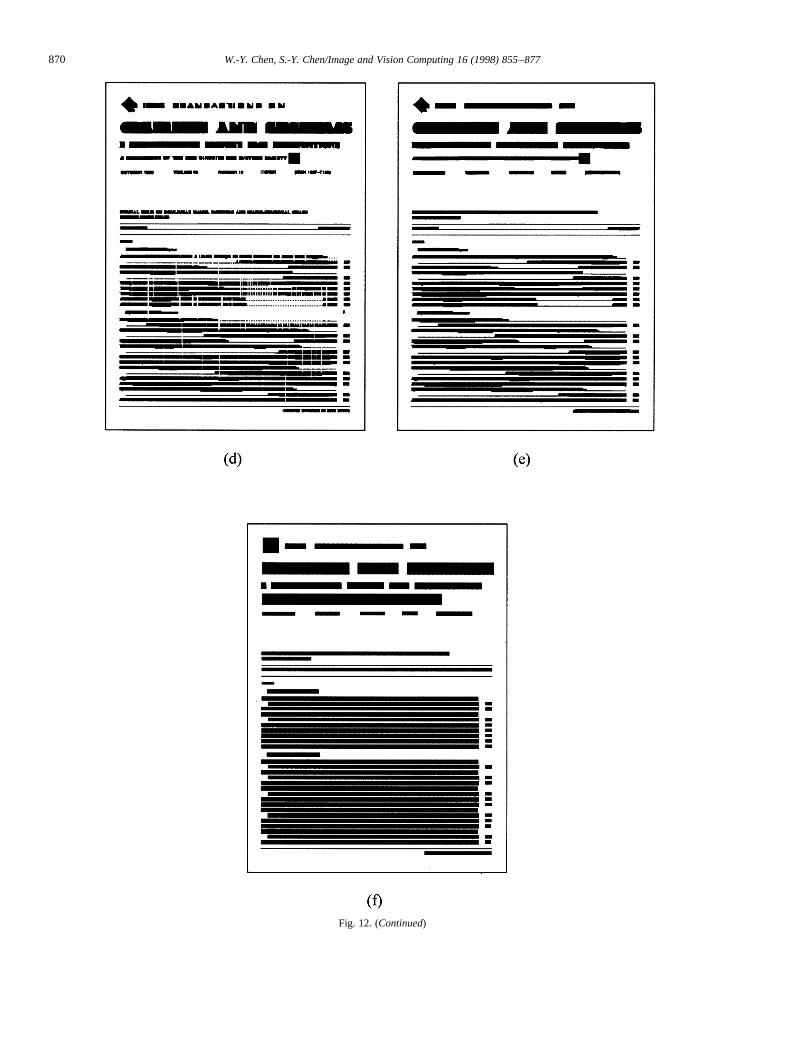
Fig. 12. (Continued)
870 W.-Y. Chen, S.-Y. Chen/Image and Vision Computing 16 (1998) 855–877
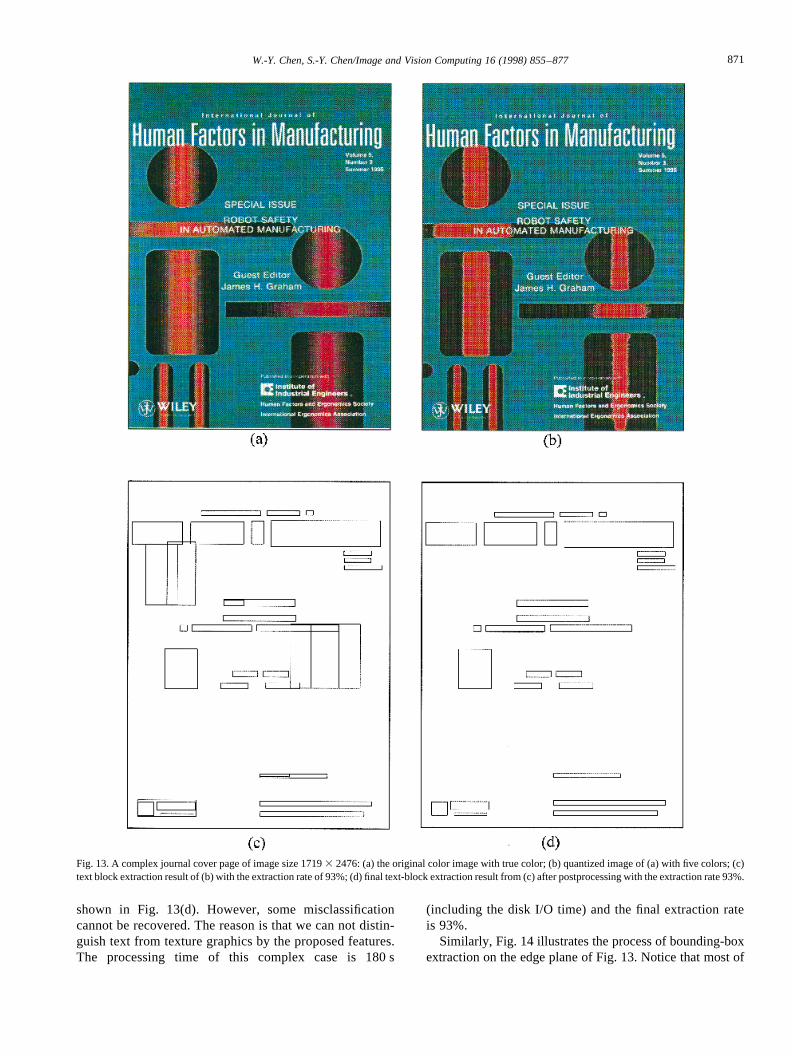
shown in Fig. 13(d). However, some misclassificationcannot be recovered. The reason is that we can not distin-guish text from texture graphics by the proposed features.The processing time of this complex case is 180 s
(including the disk I/O time) and the final extraction rateis 93%.
Similarly, Fig. 14 illustrates the process of bounding-boxextraction on the edge plane of Fig. 13. Notice that most of
Fig. 13. A complex journal cover page of image size 17193 2476: (a) the original color image with true color; (b) quantized image of (a) with five colors; (c)text block extraction result of (b) with the extraction rate of 93%; (d) final text-block extraction result from (c) after postprocessing with the extraction rate 93%.
871W.-Y. Chen, S.-Y. Chen/Image and Vision Computing 16 (1998) 855–877
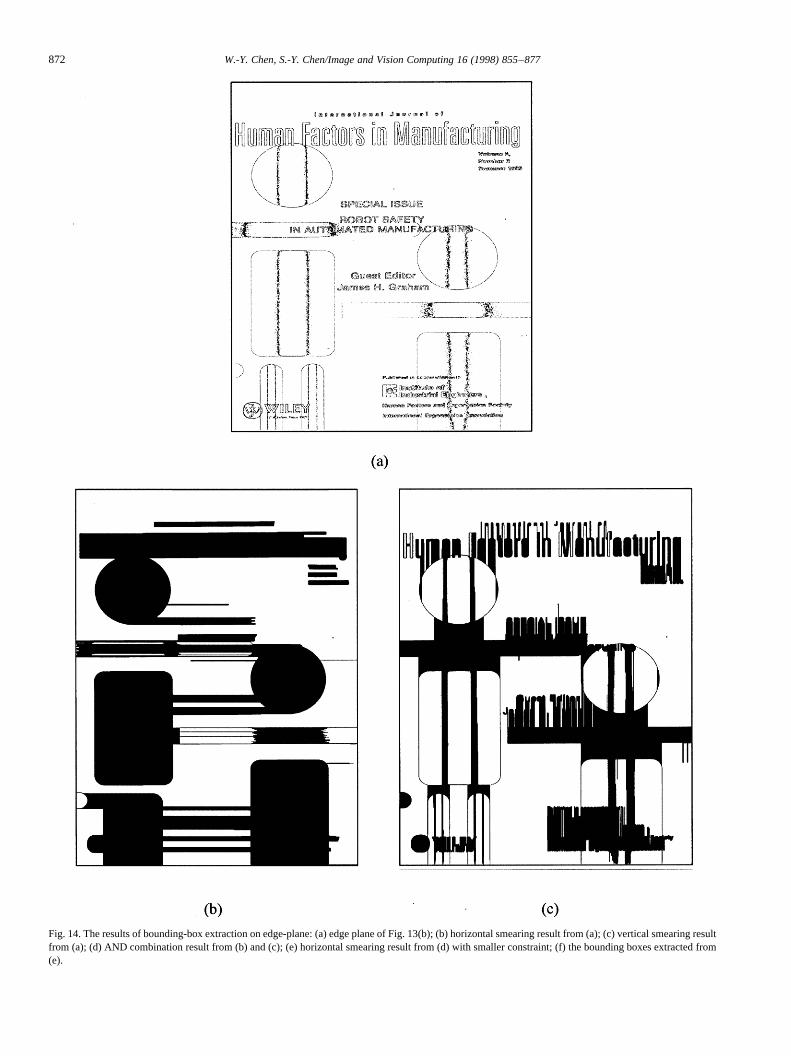
Fig. 14. The results of bounding-box extraction on edge-plane: (a) edge plane of Fig. 13(b); (b) horizontal smearing result from (a); (c) vertical smearing resultfrom (a); (d) AND combination result from (b) and (c); (e) horizontal smearing result from (d) with smaller constraint; (f) the bounding boxes extracted from(e).
872 W.-Y. Chen, S.-Y. Chen/Image and Vision Computing 16 (1998) 855–877
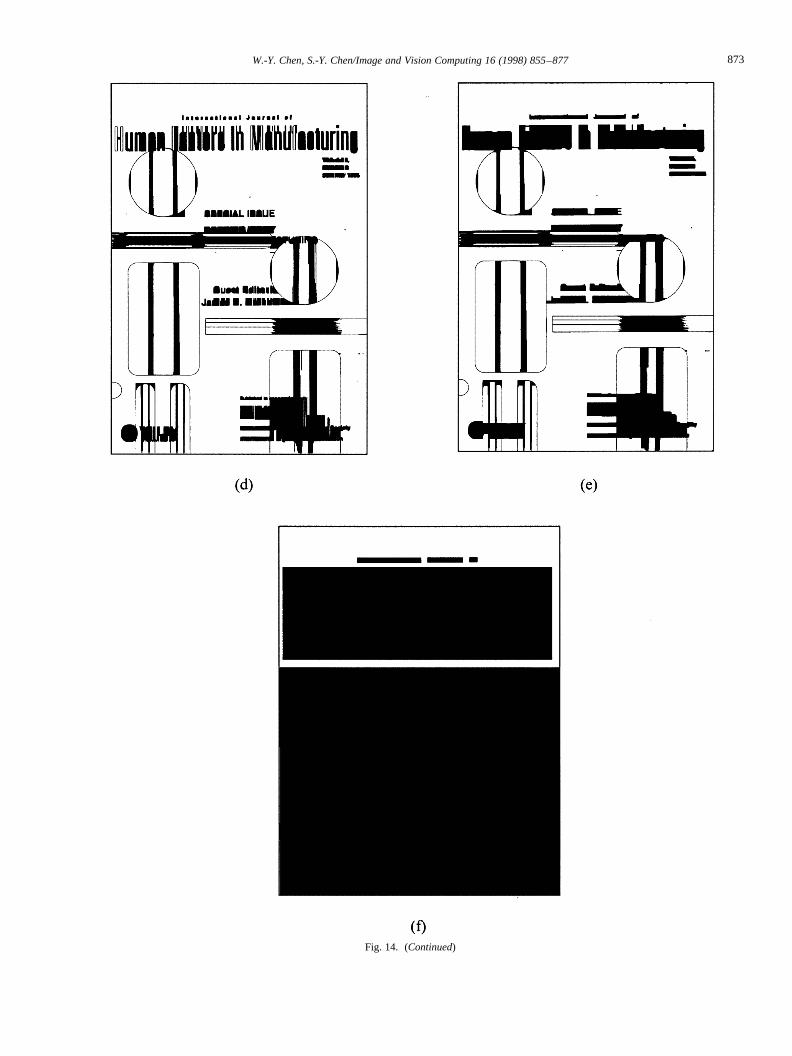
Fig. 14. (Continued)
873W.-Y. Chen, S.-Y. Chen/Image and Vision Computing 16 (1998) 855–877
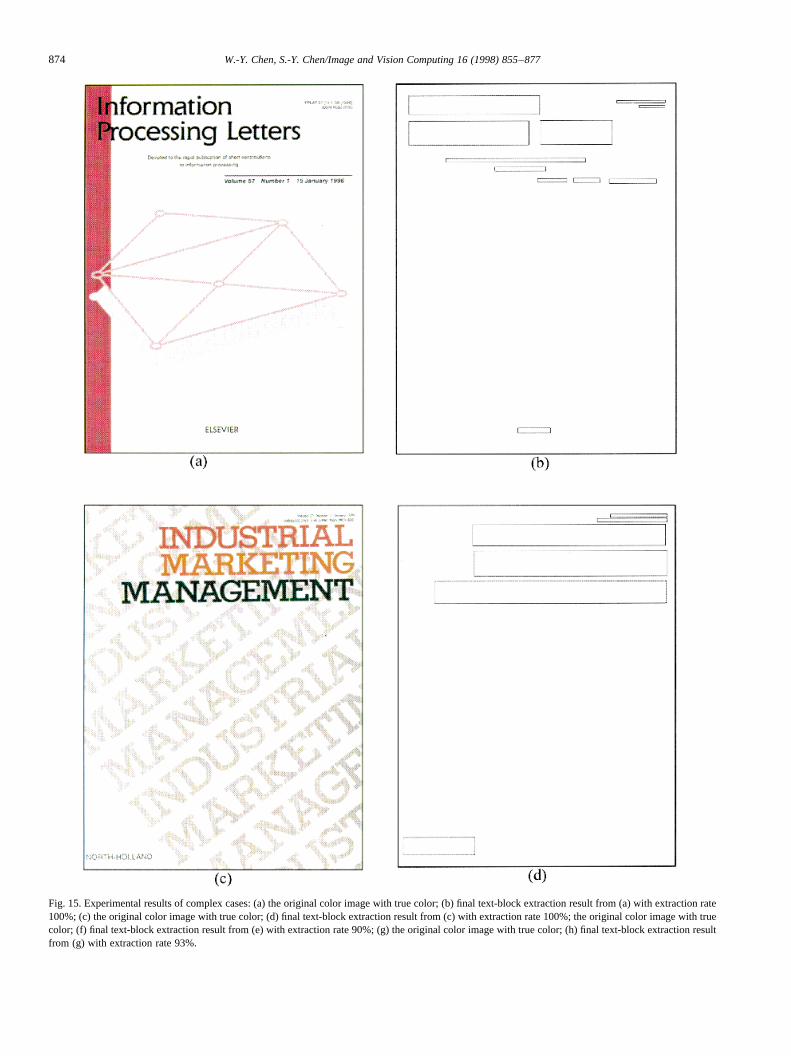
Fig. 15. Experimental results of complex cases: (a) the original color image with true color; (b) final text-block extraction result from (a) with extraction rate100%; (c) the original color image with true color; (d) final text-block extraction result from (c) with extraction rate 100%; the original color imagewith truecolor; (f) final text-block extraction result from (e) with extraction rate 90%; (g) the original color image with true color; (h) final text-block extraction resultfrom (g) with extraction rate 93%.
874 W.-Y. Chen, S.-Y. Chen/Image and Vision Computing 16 (1998) 855–877
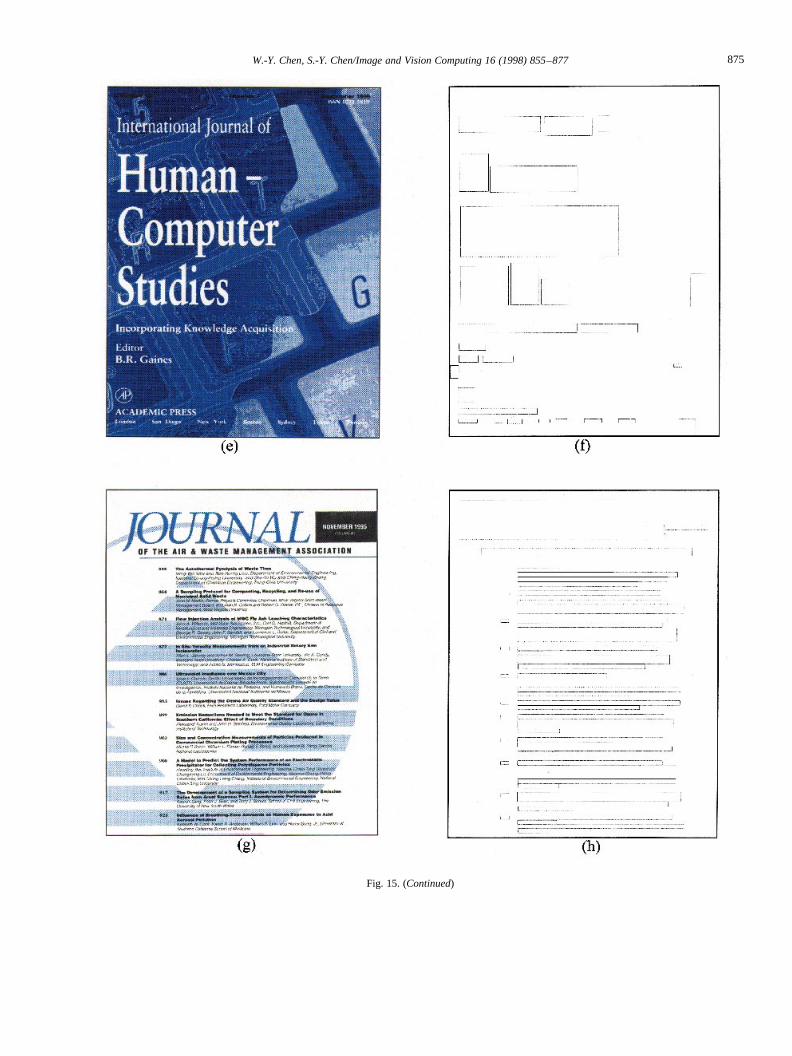
Fig. 15. (Continued)
875W.-Y. Chen, S.-Y. Chen/Image and Vision Computing 16 (1998) 855–877
the bounding boxes in Fig. 14(f) are multi-color mode, thussubdivision is needed for such blocks. Hence, the bounding-boxextraction algorithm must be applied again on all the indi-vidual color planes for each of the resulting bounding boxeson the edge plane.
Furthermore, Fig. 15 shows the segmentation results offour more complex cases. The final extraction rates of thefour cases are 100%, 100%, 93% and 90%, respectively.The reasons causing error are described below. First, thecontrast between foreground and background is not apparentsuch that text will be merged into background during theprocess of color quantization. Second, several text lines maybe smeared into a single block while the proposed featuresare based on a single textline.
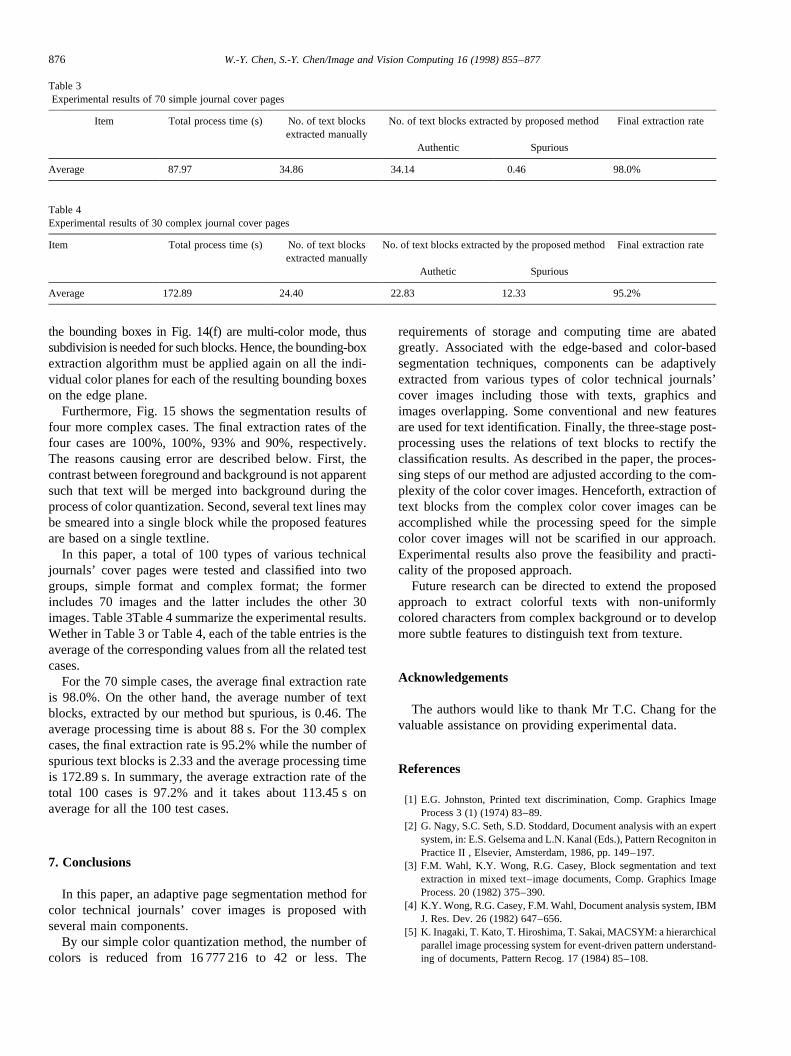
In this paper, a total of 100 types of various technicaljournals’ cover pages were tested and classified into twogroups, simple format and complex format; the formerincludes 70 images and the latter includes the other 30images. Table 3Table 4 summarize the experimental results.Wether in Table 3 or Table 4, each of the table entries is theaverage of the corresponding values from all the related testcases.
For the 70 simple cases, the average final extraction rateis 98.0%. On the other hand, the average number of textblocks, extracted by our method but spurious, is 0.46. Theaverage processing time is about 88 s. For the 30 complexcases, the final extraction rate is 95.2% while the number ofspurious text blocks is 2.33 and the average processing timeis 172.89 s. In summary, the average extraction rate of thetotal 100 cases is 97.2% and it takes about 113.45 s onaverage for all the 100 test cases.
7. Conclusions
In this paper, an adaptive page segmentation method forcolor technical journals’ cover images is proposed withseveral main components.
By our simple color quantization method, the number ofcolors is reduced from 16 777 216 to 42 or less. The
requirements of storage and computing time are abatedgreatly. Associated with the edge-based and color-basedsegmentation techniques, components can be adaptivelyextracted from various types of color technical journals’cover images including those with texts, graphics andimages overlapping. Some conventional and new featuresare used for text identification. Finally, the three-stage post-processing uses the relations of text blocks to rectify theclassification results. As described in the paper, the proces-sing steps of our method are adjusted according to the com-plexity of the color cover images. Henceforth, extraction oftext blocks from the complex color cover images can beaccomplished while the processing speed for the simplecolor cover images will not be scarified in our approach.Experimental results also prove the feasibility and practi-cality of the proposed approach.
Future research can be directed to extend the proposedapproach to extract colorful texts with non-uniformlycolored characters from complex background or to developmore subtle features to distinguish text from texture.
Acknowledgements
The authors would like to thank Mr T.C. Chang for thevaluable assistance on providing experimental data.
References
[1] E.G. Johnston, Printed text discrimination, Comp. Graphics ImageProcess 3 (1) (1974) 83–89.
[2] G. Nagy, S.C. Seth, S.D. Stoddard, Document analysis with an expertsystem, in: E.S. Gelsema and L.N. Kanal (Eds.), Pattern Recogniton inPractice II , Elsevier, Amsterdam, 1986, pp. 149–197.
[3] F.M. Wahl, K.Y. Wong, R.G. Casey, Block segmentation and textextraction in mixed text–image documents, Comp. Graphics ImageProcess. 20 (1982) 375–390.
[4] K.Y. Wong, R.G. Casey, F.M. Wahl, Document analysis system, IBMJ. Res. Dev. 26 (1982) 647–656.
[5] K. Inagaki, T. Kato, T. Hiroshima, T. Sakai, MACSYM: a hierarchicalparallel image processing system for event-driven pattern understand-ing of documents, Pattern Recog. 17 (1984) 85–108.
Table 3Experimental results of 70 simple journal cover pages
Item Total process time (s) No. of text blocksextracted manually
No. of text blocks extracted by proposed method Final extraction rate
Authentic Spurious
Average 87.97 34.86 34.14 0.46 98.0%
Table 4Experimental results of 30 complex journal cover pages
Item Total process time (s) No. of text blocksextracted manually
No. of text blocks extracted by the proposed method Final extraction rate
Authetic Spurious
Average 172.89 24.40 22.83 12.33 95.2%
876 W.-Y. Chen, S.-Y. Chen/Image and Vision Computing 16 (1998) 855–877
[6] D. Wang, S.N. Srihari, Classification of newspaper image blocksusing texture analysis, Comp. Vision, Graphics Image Process. 47(1989) 327–352.
[7] T. Akiyama, N. Hagita, Automated entry system for printed docu-ments, Pattern Recog. 23 (1990) 1141–1154.
[8] K.C. Fan, C.H. Liu, Y.K. Wang, Segmentation and classification ofmixed text/graphics/image documents, Pattern Recog. Lett. 15 (1994)1201–1209.
[9] K.C. Fan, L.S. Wang, Segmentation of document blocks using densityfeature and connectivity histogram, Pattern Recog. Lett. 16 (1995)955–962.
[10] W. Postl, Detection of linear oblique structures and skew scan indigitized documents, in: Proc. Int. Conf. Pattern Recognition, 1986,pp. 687–689.
[11] S.N. Srihari, V. Govindaraju, Analysis of textual images using theHough transform, Machine Vision Applic. 2 (1989) 141–153.
[12] T. Pavlidis, J. Zhou, Page segmentation and classification, CVGIP:Graphical Models Image Process. 54 (1992) 484–496.
[13] A. Hashizume, P.S. Yeh, A. Rosenfeld, A method of detecting theorientation of aligned components, Pattern Recog. Lett. 4 (1986) 125–136.
[14] L. O’Goman, The document spectrum for page layout analysis, IEEETrans. Pattern Anal. Mach. Intell. 15 (1993) 1162–1173.
[15] G. Nagy, S. Seth, A prototype document image analysis system fortechnical journals, IEEE Comp. 25 (1992) 10–22.
[16] M. Krishnamoorthy, G. Nagy, S. Seth, M. Viswanathan, Syntacticsegmentation and labeling of digitized pages from technical journals,IEEE Trans. Pattern Anal. Mach. Intell. 15 (1993) 737–747.
[17] A.K. Jain, S. Bhattacharjee, Text segmentation using Gabor filters forautomatic document processing, Mach. Vision Applic. 5 (1992) 169–184.
[18] A.K. Jain, Y. Zhong, Page segmentation using texture analysis, Pat-tern Recog. 5 (1996) 743–770.
[19] R. Kasturi, L. O’Gorman, Document image analysis: a bibliography,Mach. Vision Applic. 5 (1992) 231–243.
[20] J. Schurmann, N. Bartneck, T. Bayer, J. Franke, E. Mandler, M.
Oberkander, Document analysis—from pixels to contents, Proc.IEEE 80 (1992) 1101–1119.
[21] S. Tsujimoto, H. Asada, Major components of a complete text readingsystem, Proc. IEEE 80 (1992) 1133–1149.
[22] Y. Tang, C.D. Yan, C.Y. Suen, Document processing for automaticknowledge acquisition, IEEE Trans. Knowledge Data Engng 6 (1994)3–21.
[23] P. Heckbert, Color image quantization for frame buffer display,Comp. Graphics 16 (1982) 297–307.
[24] Y.S. Lin and W.H. Tsai, Image segmentation for color documentanalysis, in: Proc. IPPR Conf. Computer Vision, Graphics Image Pro-cessing, Taiwan, 1994, pp. 135–142.
[25] H. Chuang and W.H. Tsai, Segmentation of text, graphics, and specialcomponents for color document image analysis, in: Proc. IPPR Conf.Computer Vision, Graphics Image Processing, Taiwan, 1995, pp.471–478.
[26] Y. Zhong, K. Karu, A.K. Jain, Locating text in complex color image,Pattern Recog. 28 (1995) 1523–1535.
[27] M. Suen and J.F. Wang, Text string extraction from images of colorprinted documents, in: Proc. IPPR Conf. Computer Vision, GraphicsImage Processing, Taiwan, 1995, pp. 534–541.
[28] J.D. Foley, A.V. Dam, S.K. Feiner and J.F. Hughes, Computer Gra-phics, Addison–Wesley, 1992.
[29] C. Gonzalez and R.E. Woods, Digital Image Processing, Addison–Wesley, 1992.
[30] S. Lin and J.J. Leou, A genetic algorithm approach to Chinese hand-writing normalization, in: Proc. Int. Computer Symposium, Taiwan,1994, pp. 638–644.
[31] H. Sun, W. Kwok, Concealment of damaged block transformationcoded images using projections onto convex sets, IEEE Trans.Image Process. 4 (1995) 470–477.
[32] J. Zimmermann, Fuzzy Set Theory, Kluwer, Dordrecht, 1991.[33] W.Y. Chen, Adaptive page segmentation for color document images,
Master Thesis of the Institute of Electrical Engineering and ComputerEngineering and Science, Yuan Ze University, Republic of China,1996.
877W.-Y. Chen, S.-Y. Chen/Image and Vision Computing 16 (1998) 855–877
Recommended