AFP Southern Nevada ChapterWednesday, April 22, 2009
Jerry Hubbard, CTPManager Working Capital & Cash ConversionNV Energy, Inc.
Focus on Working Capital
2
Focus on Working Capital
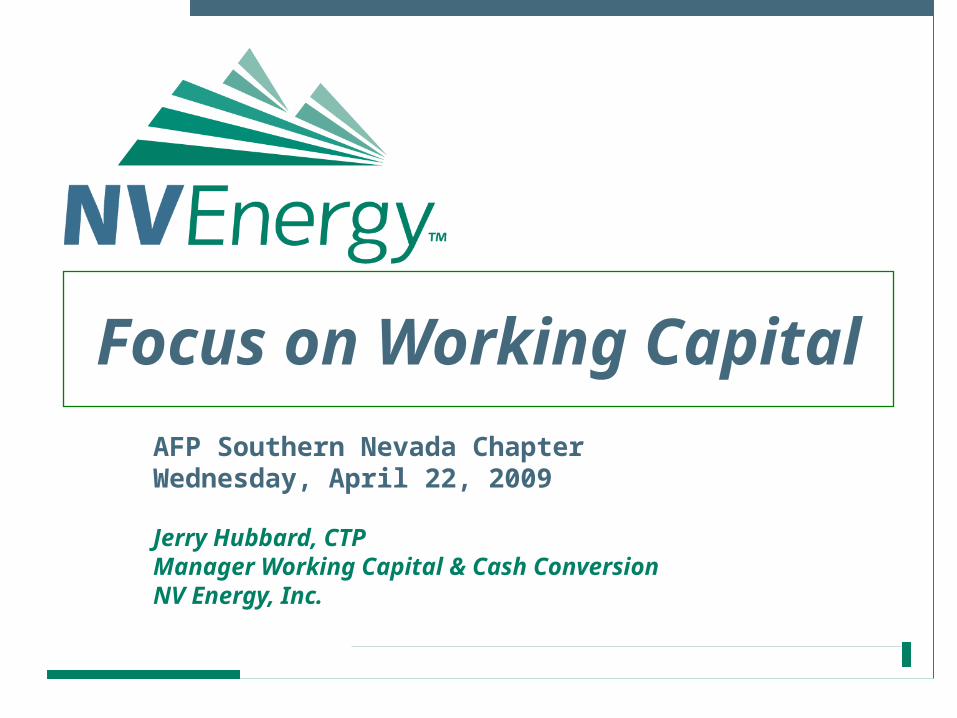
AGENDAIntroduction Today’s Working Capital Challenges Working Capital Strategies NV Energy’s Working Capital Management
NV Energy Working Capital NV Energy Cash Conversion Important Internal Strategic Relationships Components
Accounts Receivable Inventory Accounts Payable
Corporate Card Program 2009 Initiatives
3
Working Capital
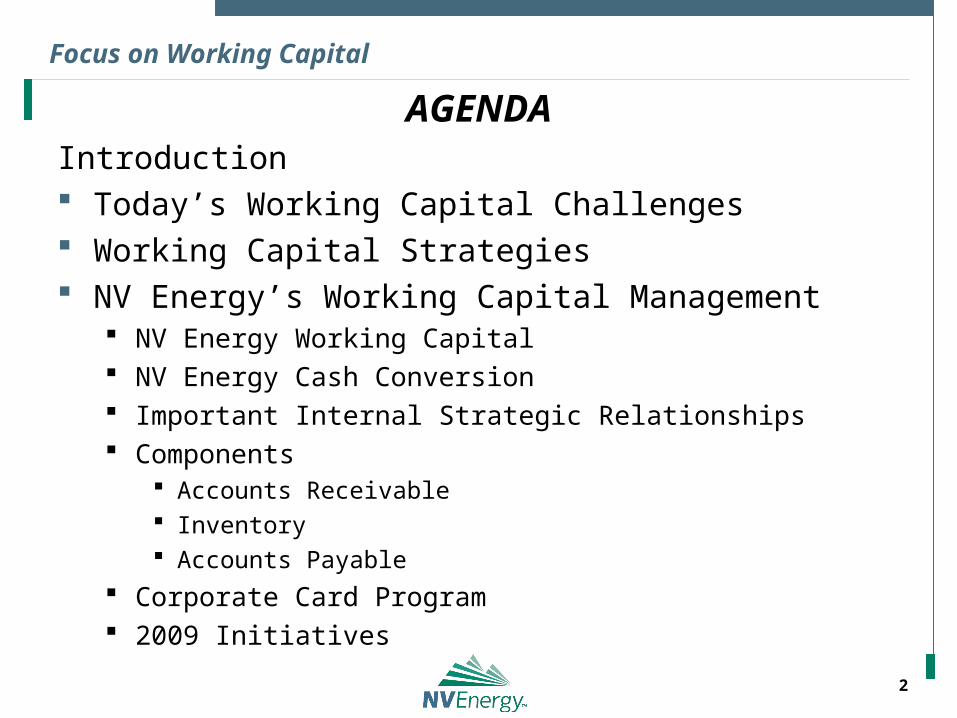
Working Capital Defined The sum of current assets (cash, A/R, inventory) less the sum of
current liabilities (A/P, accruals). These are the accounts through which cash flows during the cash conversion cycle.
Textbook formula: WC = Current Assets – Current Liabilities
NV Energy focuses on three key components: A/R Inventory A/P
These three primary categories are used because they can be individually managed and directly affect the amount of money available to fund operations and strategic initiatives on a daily basis.
4
Today’s Working Capital Challenges
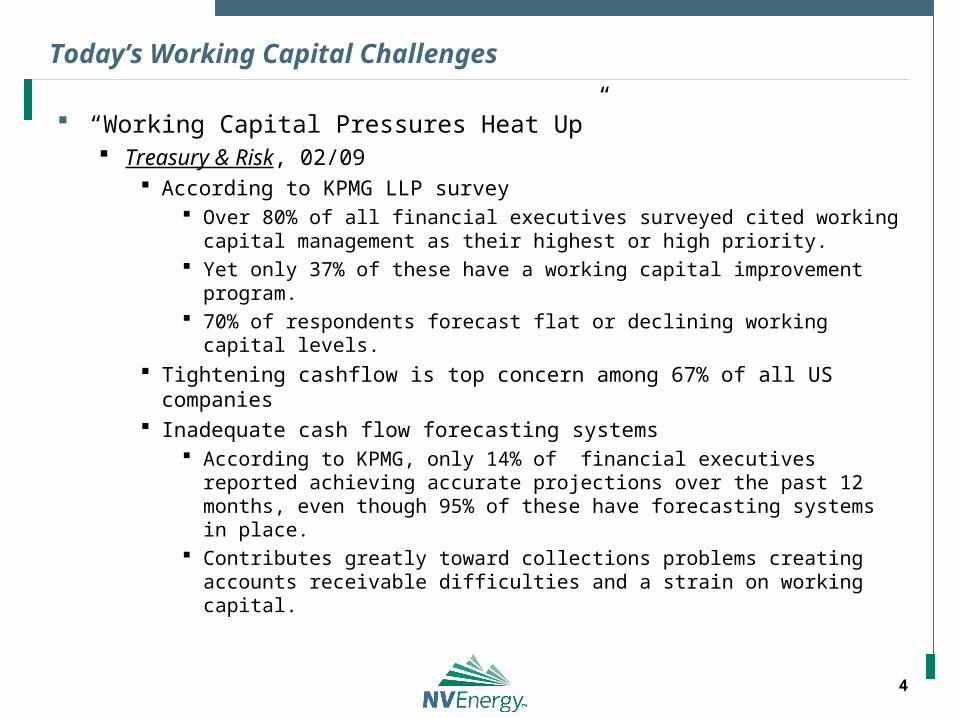
“Working Capital Pressures Heat Up” Treasury & Risk, 02/09
According to KPMG LLP survey Over 80% of all financial executives surveyed cited working capital
management as their highest or high priority. Yet only 37% of these have a working capital improvement
program. 70% of respondents forecast flat or declining working capital levels.
Tightening cashflow is top concern among 67% of all US companies Inadequate cash flow forecasting systems
According to KPMG, only 14% of financial executives reported achieving accurate projections over the past 12 months, even though 95% of these have forecasting systems in place.
Contributes greatly toward collections problems creating accounts receivable difficulties and a strain on working capital.
5
Today’s Working Capital Challenges
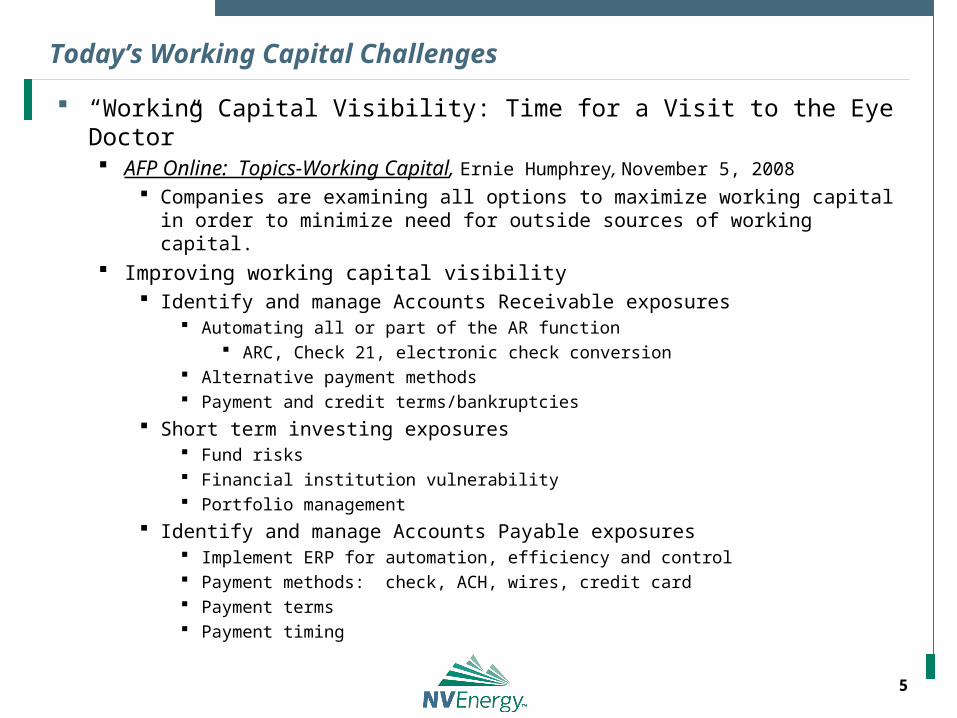
“Working Capital Visibility: Time for a Visit to the Eye Doctor” AFP Online: Topics-Working Capital, Ernie Humphrey, November 5, 2008
Companies are examining all options to maximize working capital in order to minimize need for outside sources of working capital.
Improving working capital visibility Identify and manage Accounts Receivable exposures
Automating all or part of the AR function ARC, Check 21, electronic check conversion
Alternative payment methods Payment and credit terms/bankruptcies
Short term investing exposures Fund risks Financial institution vulnerability Portfolio management
Identify and manage Accounts Payable exposures Implement ERP for automation, efficiency and control Payment methods: check, ACH, wires, credit card Payment terms Payment timing
6
Working Capital Strategies
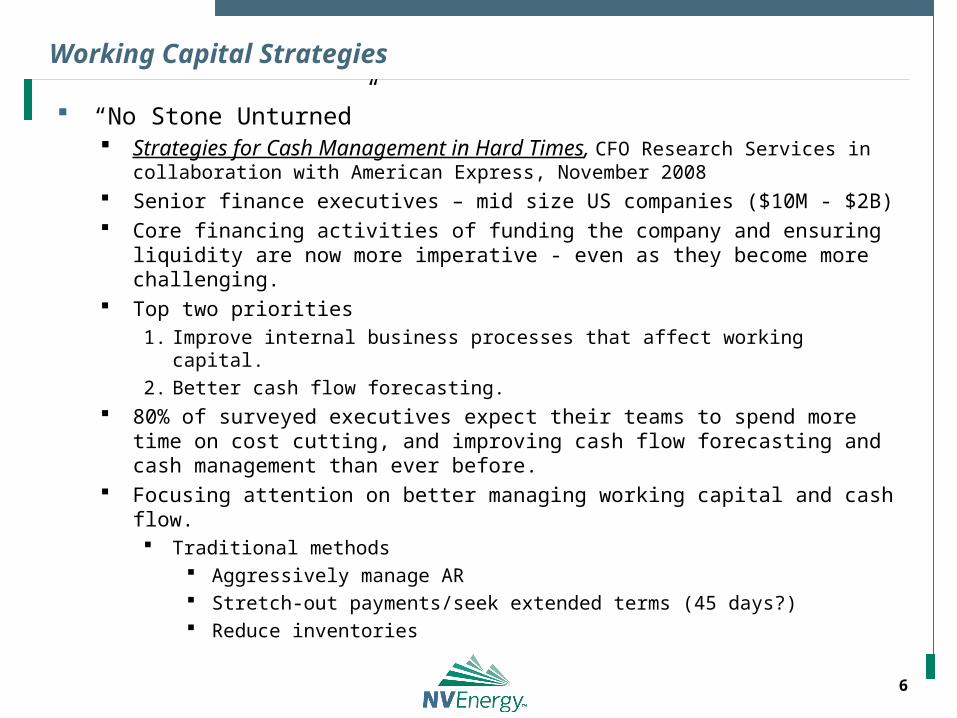
“No Stone Unturned” Strategies for Cash Management in Hard Times, CFO Research Services
in collaboration with American Express, November 2008 Senior finance executives – mid size US companies ($10M - $2B) Core financing activities of funding the company and ensuring liquidity are
now more imperative - even as they become more challenging. Top two priorities
1. Improve internal business processes that affect working capital.
2. Better cash flow forecasting. 80% of surveyed executives expect their teams to spend more time on cost
cutting, and improving cash flow forecasting and cash management than ever before.
Focusing attention on better managing working capital and cash flow. Traditional methods
Aggressively manage AR Stretch-out payments/seek extended terms (45 days?) Reduce inventories
7
Working Capital Strategies
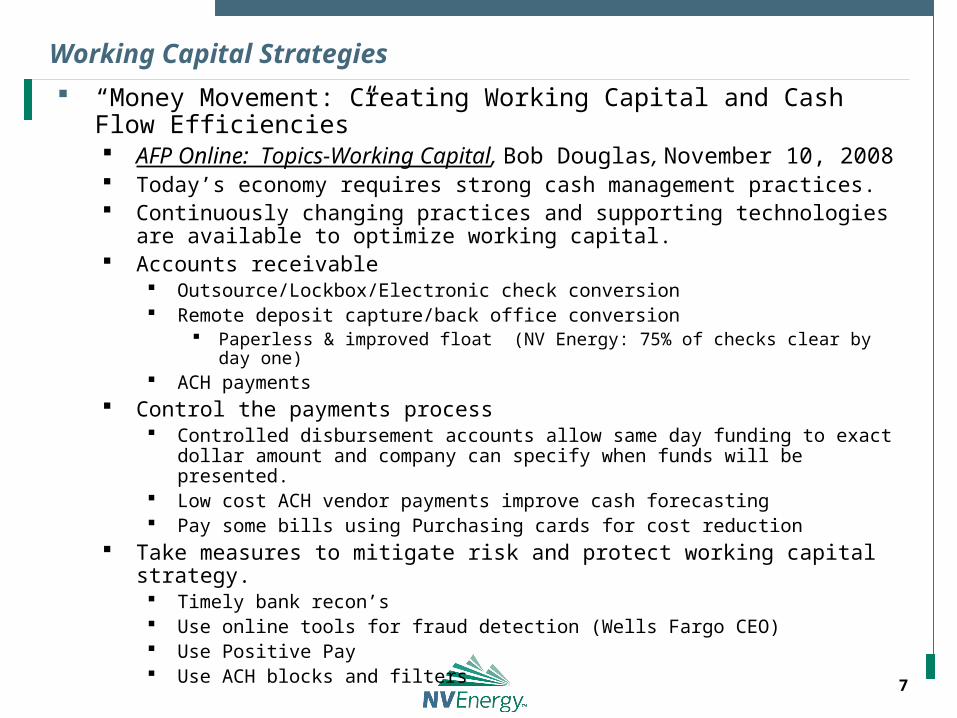
“Money Movement: Creating Working Capital and Cash Flow Efficiencies” AFP Online: Topics-Working Capital, Bob Douglas, November 10,
2008 Today’s economy requires strong cash management practices. Continuously changing practices and supporting technologies are available
to optimize working capital. Accounts receivable
Outsource/Lockbox/Electronic check conversion Remote deposit capture/back office conversion
Paperless & improved float (NV Energy: 75% of checks clear by day one) ACH payments
Control the payments process Controlled disbursement accounts allow same day funding to exact dollar
amount and company can specify when funds will be presented. Low cost ACH vendor payments improve cash forecasting Pay some bills using Purchasing cards for cost reduction
Take measures to mitigate risk and protect working capital strategy. Timely bank recon’s Use online tools for fraud detection (Wells Fargo CEO) Use Positive Pay Use ACH blocks and filters
8
NV Energy’s Working Capital Management
Focus on Working Capital
9
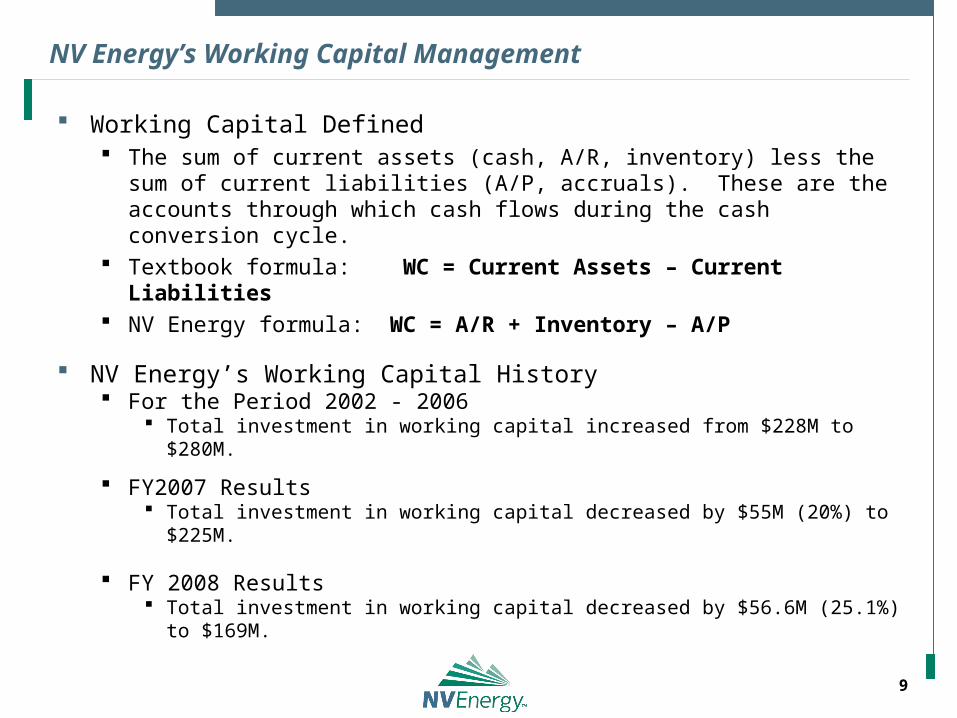
NV Energy’s Working Capital Management
Working Capital Defined The sum of current assets (cash, A/R, inventory) less the sum of current
liabilities (A/P, accruals). These are the accounts through which cash flows during the cash conversion cycle.
Textbook formula: WC = Current Assets – Current Liabilities NV Energy formula: WC = A/R + Inventory – A/P
NV Energy’s Working Capital History For the Period 2002 - 2006
Total investment in working capital increased from $228M to $280M.
FY2007 Results Total investment in working capital decreased by $55M (20%) to $225M.
FY 2008 Results Total investment in working capital decreased by $56.6M (25.1%) to $169M.
10
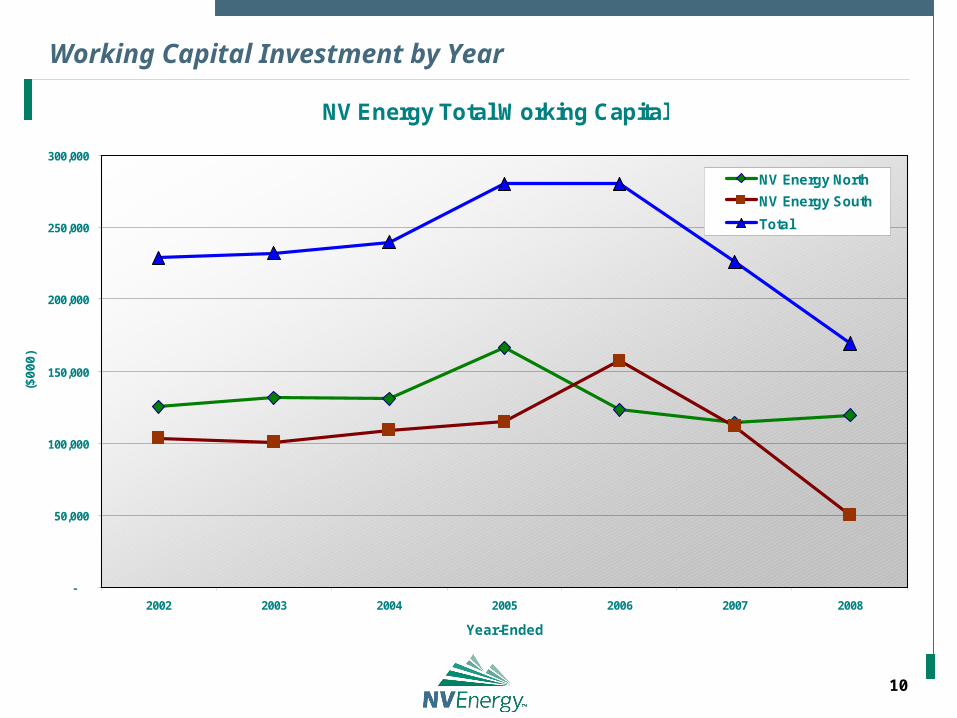
Working Capital Investment by Year
NV Energy Total Working Capital
-
50,000
100,000
150,000
200,000
250,000
300,000
2002 2003 2004 2005 2006 2007 2008
Year-Ended
($0
00
)
NV Energy North
NV Energy South
Total
11
NV Energy’s Working Capital Management
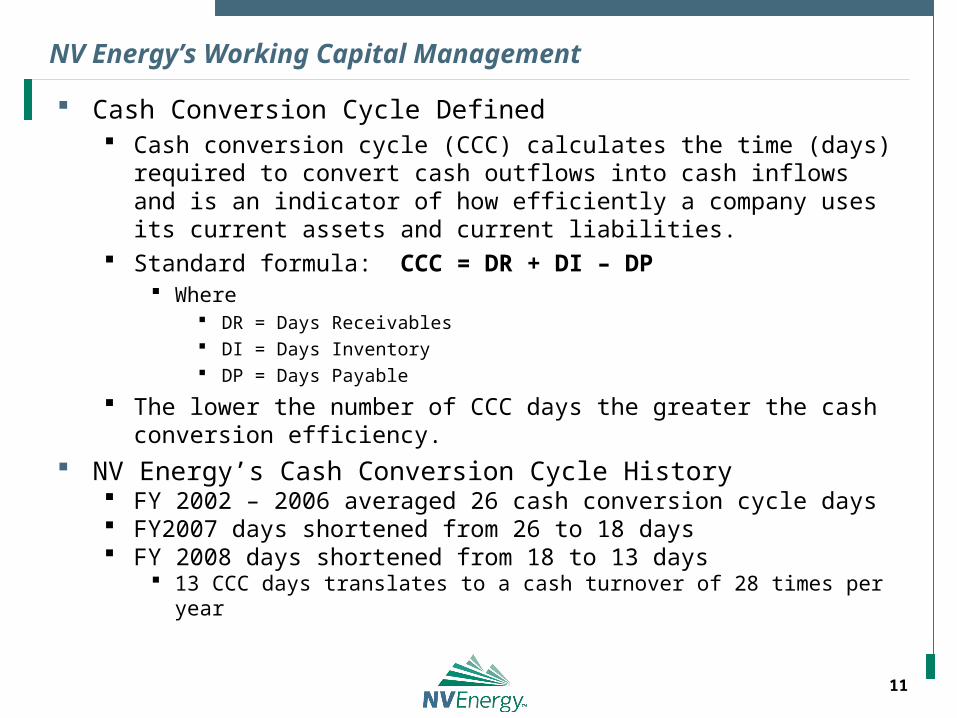
Cash Conversion Cycle Defined Cash conversion cycle (CCC) calculates the time (days) required to
convert cash outflows into cash inflows and is an indicator of how efficiently a company uses its current assets and current liabilities.
Standard formula: CCC = DR + DI – DP Where
DR = Days Receivables DI = Days Inventory DP = Days Payable
The lower the number of CCC days the greater the cash conversion efficiency.
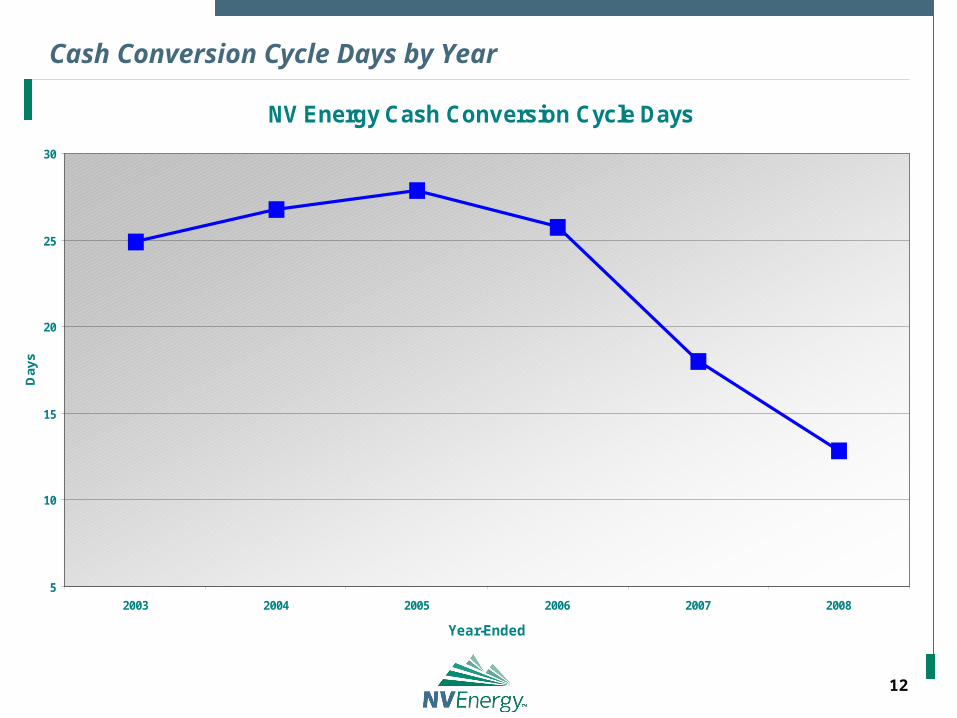
NV Energy’s Cash Conversion Cycle History FY 2002 – 2006 averaged 26 cash conversion cycle days FY2007 days shortened from 26 to 18 days FY 2008 days shortened from 18 to 13 days
13 CCC days translates to a cash turnover of 28 times per year
12
Cash Conversion Cycle Days by Year
NV Energy Cash Conversion Cycle Days
5
10
15
20
25
30
2003 2004 2005 2006 2007 2008
Year-Ended
Day
s
13
NV Energy’s Working Capital Management
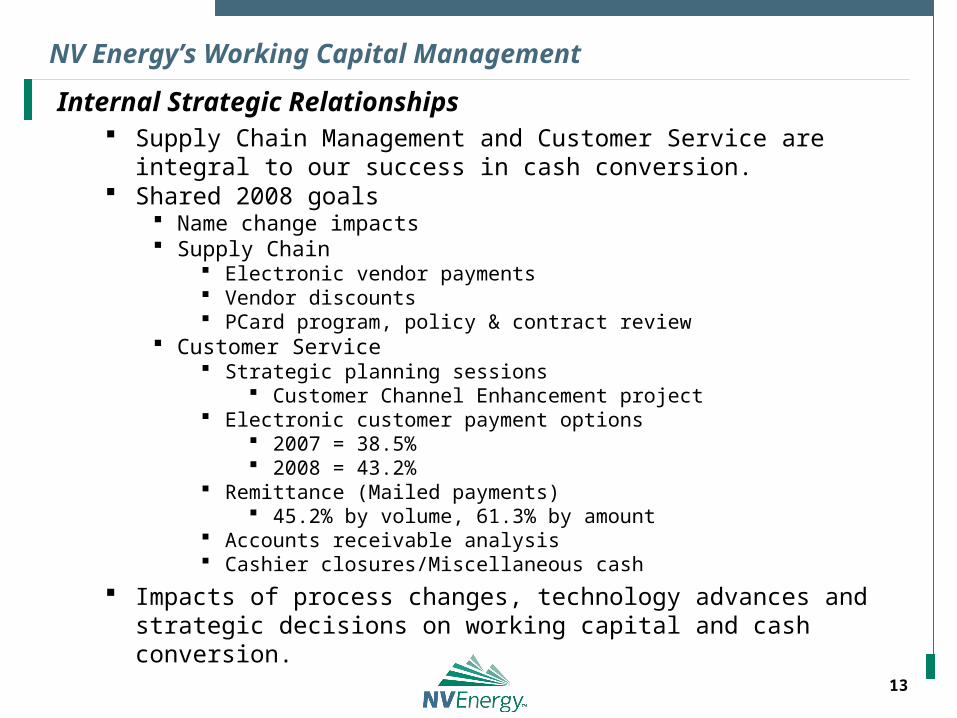
Internal Strategic Relationships Supply Chain Management and Customer Service are integral to our
success in cash conversion. Shared 2008 goals
Name change impacts Supply Chain
Electronic vendor payments Vendor discounts PCard program, policy & contract review
Customer Service Strategic planning sessions
Customer Channel Enhancement project Electronic customer payment options
2007 = 38.5% 2008 = 43.2%
Remittance (Mailed payments) 45.2% by volume, 61.3% by amount
Accounts receivable analysis Cashier closures/Miscellaneous cash
Impacts of process changes, technology advances and strategic decisions on working capital and cash conversion.
2008 Working Capital Results 14
Working Capital Components
NV Energy’s Working Capital Management
15
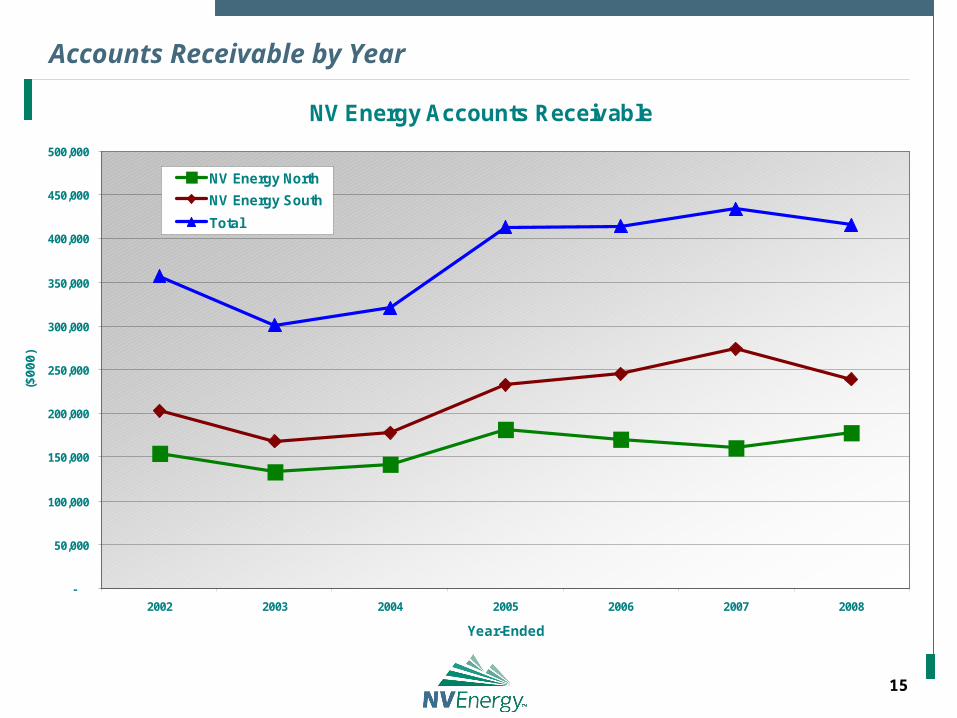
Accounts Receivable by Year
NV Energy Accounts Receivable
-
50,000
100,000
150,000
200,000
250,000
300,000
350,000
400,000
450,000
500,000
2002 2003 2004 2005 2006 2007 2008
Year-Ended
($0
00
)
NV Energy North
NV Energy South
Total
16
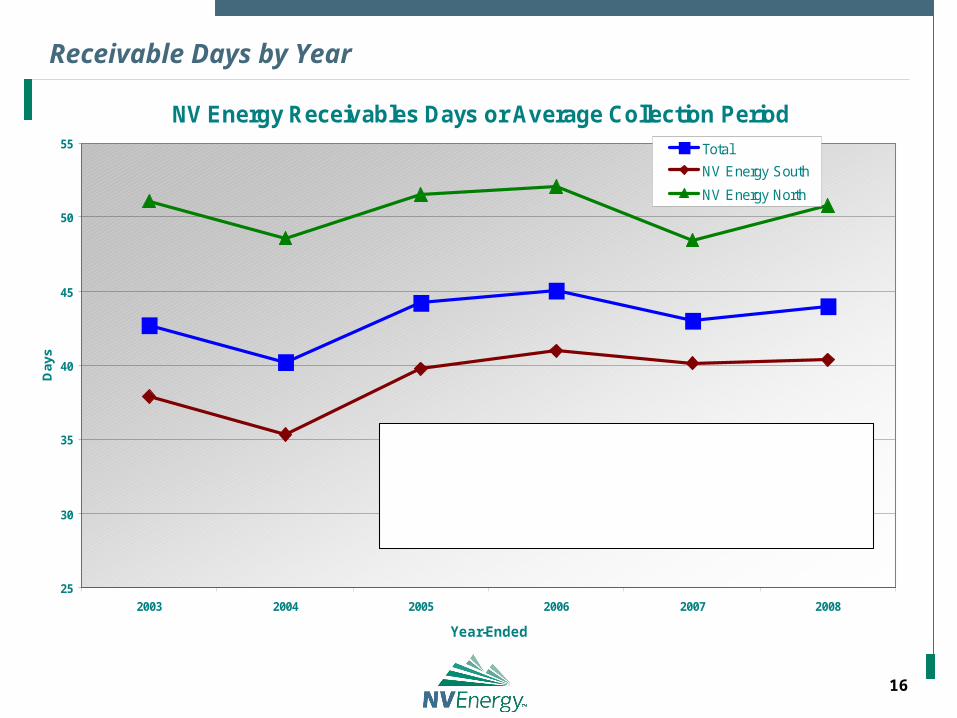
Receivable Days by Year
NV Energy Receivables Days or Average Collection Period
25
30
35
40
45
50
55
2003 2004 2005 2006 2007 2008
Year-Ended
Day
s
Total
NV Energy South
NV Energy North
1. (Average A/R divided by Sales) x 365.2. Number of days required to convert a sale into cashflow.3. Increased customer use of paperless payment options has resulted in general decrease in days.4. 2008 uptick attributed to economy and customers stretching and delaying utility payments before food, housing, etc.
17
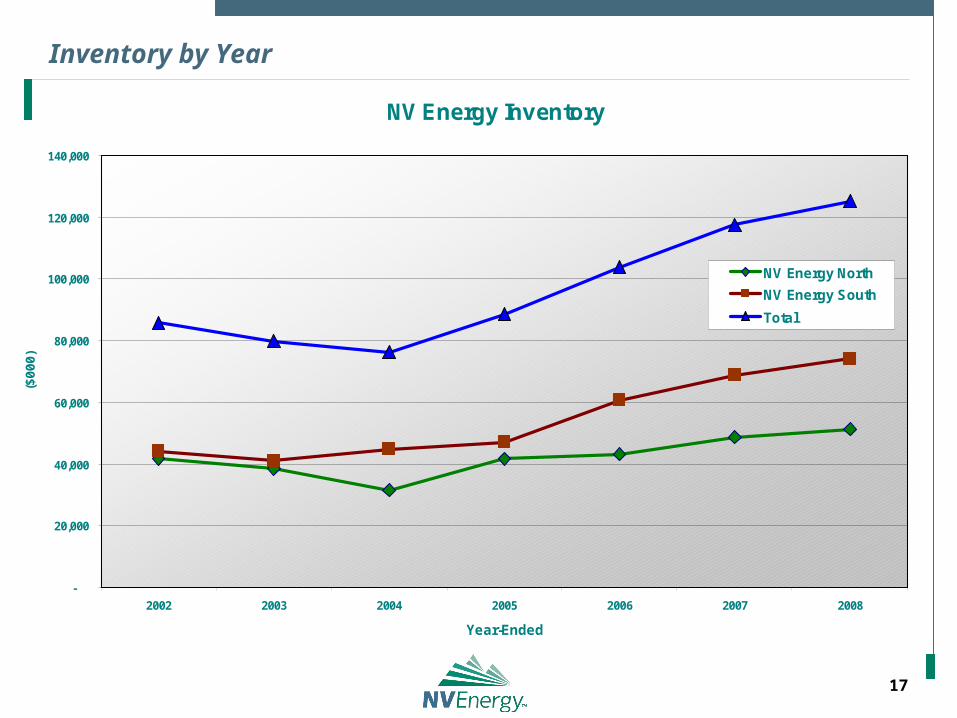
Inventory by Year
NV Energy Inventory
-
20,000
40,000
60,000
80,000
100,000
120,000
140,000
2002 2003 2004 2005 2006 2007 2008
Year-Ended
($0
00
)
NV Energy North
NV Energy South
Total
18
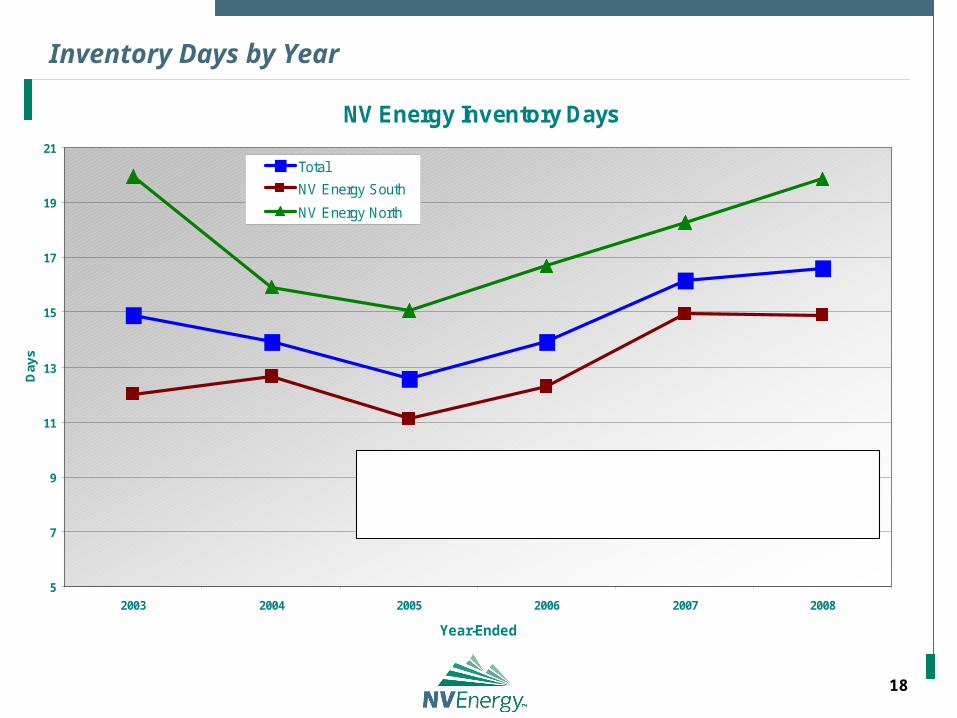
Inventory Days by Year
NV Energy Inventory Days
5
7
9
11
13
15
17
19
21
2003 2004 2005 2006 2007 2008
Year-Ended
Day
s
Total
NV Energy South
NV Energy North
1. (Average Inventory divided by COGS) x 365.2. How many days from the purchase of raw materials until the sale of finished goods.3. Days have increased as inventory balances have increased.
19
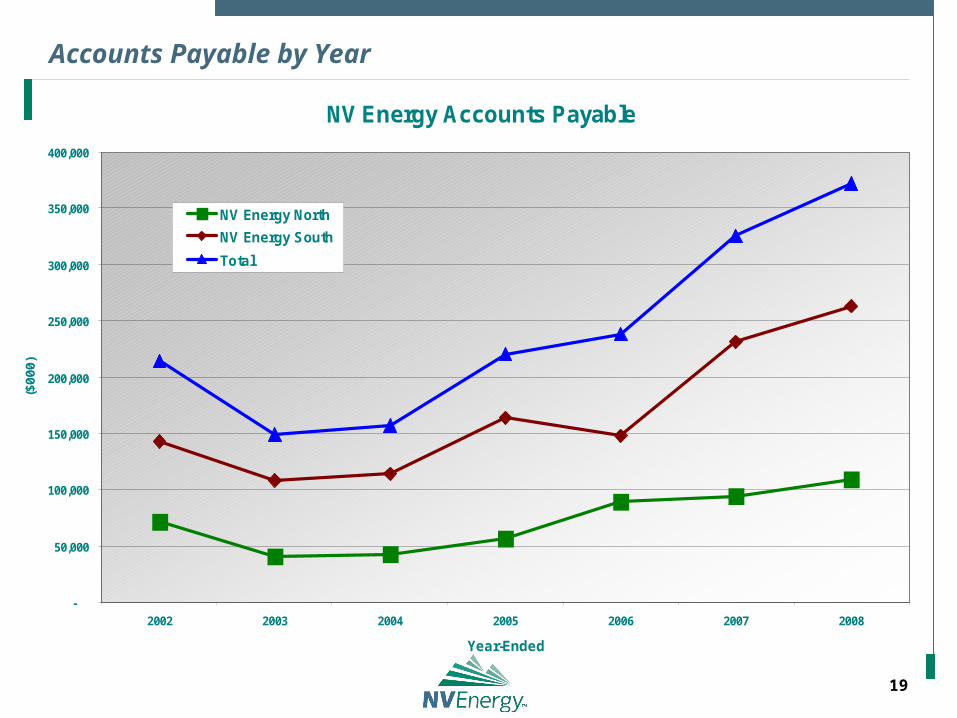
Accounts Payable by Year
NV Energy Accounts Payable
-
50,000
100,000
150,000
200,000
250,000
300,000
350,000
400,000
2002 2003 2004 2005 2006 2007 2008
Year-Ended
($00
0)
NV Energy North
NV Energy South
Total
20
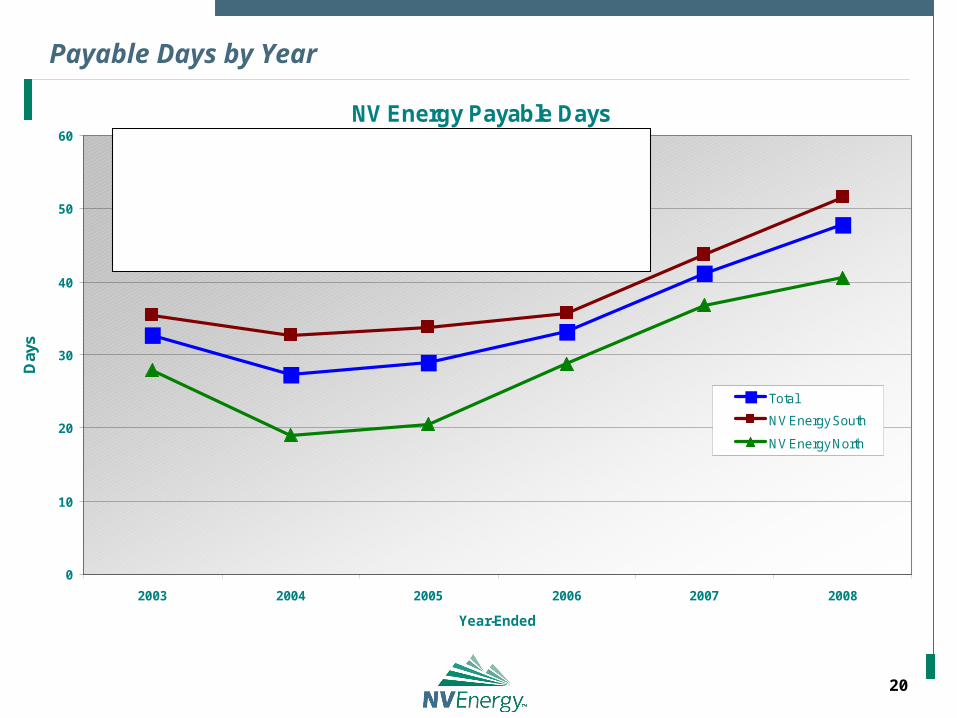
Payable Days by Year
NV Energy Payable Days
0
10
20
30
40
50
60
2003 2004 2005 2006 2007 2008
Year-Ended
Day
s
Total
NV Energy South
NV Energy North
1. (Average A/P divided by COGS) x 365.2. Average number of days between purchases and payments. 3. The interest-free trade credit period.4. 2008 A/P balance uptick due to comprehensive year-end accruals, $39 MM higher, and more invoices accrued than before.5. Backlog of 3,000 invoices reduced significantly and put in flow.6. A/P increased on-time processing better than prior years.
21
NV Energy’s Corporate Card Program
Completed our first year with a new corporate card provider. Exceeded 2008 spend goal of $20.0 MM
Achieved 2008 target rebate Annual spend applies to all card types
87% PCard 13% T&E card
Initiatives 2009 spend goal = $21.5 MM Increase PCard usage company-wide for frequent low dollar invoices Tighter controls and monitoring of past due T&E card balances
2008 significant cost in forfeited rebate due to past due T&E card balances. Cardholder Communications
Thorough statement review Best practices and tips Policy
Compromises/Data breaches Currently under review in collaboration with Supply Chain
22
NV Energy’s Working Capital Management
2009 Working Capital Initiatives Maintain reduced working capital investment Maintain low Cash Conversion Cycle days Accounts Receivable
Continue to support efforts to migrate customers to paperless payments Increase customer electronic payment options Customer ACH payments Desktop deposits: reduced float, bank fees and handling costs Lower cost, web-based/IVR customer credit card payment provider
Accounts Payable/Inventory Increased vendor discount program Vendor ACH (electronic) payment rollout Increase PCard usage and spend Increase 2009 A/P average on-time payment metric Lower A/P processing costs Supply Chain inventory reduction review
Analyze and better understand the reasons for differences between the two utilities.
23
Focus on Working Capital
Discussion and
Q&A
Recommended