AFRL-ML-WP-TM-2007-4019 INFLUENCE OF SURFACE ROUGHNESS ON THE SPECULAR REFLECTANCE OF LOW GLOSS COATINGS USING BIDIRECTIONAL REFLECTANCE MEASUREMENTS Lisa M. Farrier Nonstructural Materials Branch (AFRL/MLBT) Nonmetallic Materials Division Materials and Manufacturing Directorate Air Force Research Laboratory Air Force Materiel Command Wright-Patterson Air Force Base, OH 45433-7750 OCTOBER 2006 Thesis
Approved for public release; distribution unlimited.
STINFO COPY
MATERIALS AND MANUFACTURING DIRECTORATE AIR FORCE RESEARCH LABORATORY AIR FORCE MATERIEL COMMAND WRIGHT-PATTERSON AIR FORCE BASE, OH 45433-7750
NOTICE AND SIGNATURE PAGE
Using Government drawings, specifications, or other data included in this document for any purpose other than Government procurement does not in any way obligate the U.S. Government. The fact that the Government formulated or supplied the drawings, specifications, or other data does not license the holder or any other person or corporation; or convey any rights or permission to manufacture, use, or sell any patented invention that may relate to them. This report was cleared for public release by the Air Force Research Laboratory Wright Site (AFRL/WS) Public Affairs Office and is available to the general public, including foreign nationals. Copies may be obtained from the Defense Technical Information Center (DTIC) (http://www.dtic.mil). AFRL-ML-WP-TM-2007-4019 HAS BEEN REVIEWED AND IS APPROVED FOR PUBLICATION IN ACCORDANCE WITH ASSIGNED DISTRIBUTION STATEMENT. *//Signature// //Signature// LISA M. FARRIER, Program Manager STEPHEN L. SZARUGA, Acting Chief Nonstructural Materials Branch Nonstructural Materials Branch Nonmetallic Materials Division Nonmetallic Materials Division //Signature// SHASHI K. SHARMA, Acting Deputy Chief Nonmetallic Materials Division Materials and Manufacturing Directorate This report is published in the interest of scientific and technical information exchange, and its publication does not constitute the Government’s approval or disapproval of its ideas or findings. *Disseminated copies will show “//signature//” stamped or typed above the signature blocks.

i
REPORT DOCUMENTATION PAGE Form Approved OMB No. 0704-0188
The public reporting burden for this collection of information is estimated to average 1 hour per response, including the time for reviewing instructions, searching existing data sources, searching existing data sources, gathering and maintaining the data needed, and completing and reviewing the collection of information. Send comments regarding this burden estimate or any other aspect of this collection of information, including suggestions for reducing this burden, to Department of Defense, Washington Headquarters Services, Directorate for Information Operations and Reports (0704-0188), 1215 Jefferson Davis Highway, Suite 1204, Arlington, VA 22202-4302. Respondents should be aware that notwithstanding any other provision of law, no person shall be subject to any penalty for failing to comply with a collection of information if it does not display a currently valid OMB control number. PLEASE DO NOT RETURN YOUR FORM TO THE ABOVE ADDRESS.
1. REPORT DATE (DD-MM-YY) 2. REPORT TYPE 3. DATES COVERED (From - To)
October 2006 Thesis 5a. CONTRACT NUMBER
In-house 5b. GRANT NUMBER
4. TITLE AND SUBTITLE
INFLUENCE OF SURFACE ROUGHNESS ON THE SPECULAR REFLECTANCE OF LOW GLOSS COATINGS USING BIDIRECTIONAL REFLECTANCE MEASUREMENTS 5c. PROGRAM ELEMENT NUMBER
62102F 5d. PROJECT NUMBER
M06R 5e. TASK NUMBER
20
6. AUTHOR(S)
Lisa M. Farrier
5f. WORK UNIT NUMBER
00 7. PERFORMING ORGANIZATION NAME(S) AND ADDRESS(ES) 8. PERFORMING ORGANIZATION
REPORT NUMBER
Nonstructural Materials Branch (AFRL/MLBT) Nonmetallic Materials Division Materials and Manufacturing Directorate Air Force Research Laboratory, Air Force Materiel Command Wright-Patterson Air Force Base, OH 45433-7750
AFRL-ML-WP-TM-2007-4019
9. SPONSORING/MONITORING AGENCY NAME(S) AND ADDRESS(ES) 10. SPONSORING/MONITORING AGENCY ACRONYM(S)
AFRL-ML-WP Materials and Manufacturing Directorate Air Force Research Laboratory Air Force Materiel Command Wright-Patterson AFB, OH 45433-7750
11. SPONSORING/MONITORING AGENCY REPORT NUMBER(S)
AFRL-ML-WP-TM-2007-4019 12. DISTRIBUTION/AVAILABILITY STATEMENT
Approved for public release; distribution is unlimited. 13. SUPPLEMENTARY NOTES
This final report is a Master of Materials Science and Engineering dissertation submitted to the University of Dayton in partial fulfillment of its requirements for a Masters degree. PAO Case Number: AFRL/WS 06-2665, 13 Nov 2006. Report contains color.
14. ABSTRACT (Maximum 200 words) The objective of this study was to determine the effects of surface roughness and incident angle on the reflectance of low gloss coatings at grazing incidence. A specular peak has been identified from the forward scatter at longer wavelengths, 3.39 μm and 10.6 μm, for various painted surfaces. Depending on the surface roughness and wavelength, this specular component occurs at different angles. However, this effect has not been observed in the visible region. Material surfaces with well characterized surface roughness have been measured at a wavelength of 0.633 μm in an attempt to observe this effect in the visible region. The angle at which it was observed for various roughnesses has been obtained using bidirectional reflectance distribution function (BRDF) measurements.
15. SUBJECT TERMS Reflectance, coatings, specular, wavelength bidirectional reflectance distribution function (BRDF)
16. SECURITY CLASSIFICATION OF: 19a. NAME OF RESPONSIBLE PERSON (Monitor) a. REPORT Unclassified
b. ABSTRACT Unclassified
c. THIS PAGE Unclassified
17. LIMITATION OF ABSTRACT:
SAR
18. NUMBER OF PAGES
74 Lisa M. Farrier 19b. TELEPHONE NUMBER (Include Area Code)
N/A Standard Form 298 (Rev. 8-98)
Prescribed by ANSI Std. Z39-18

TABLE OF CONTENTS
ABSTRACT…………………………………………..…………………………… ii
ACKNOWLEDGEMENTS………………………..……………………………… iv
LIST OF ILLUSTRATIONS…………………….……………………………….. vii
LIST OF TABLES……………………………….………….……………………. ix
CHAPTER
I. INTRODUCTION…….………………………..……………………….. 1
II. BACKGROUND AND THEORY
Reflection of Light……………………..…………………………. 6
Gloss and Surface Roughness……..…………………………... 8
Bidirectional Reflectance………………………………………... 13
III. EXPERIMENT PROCEDURE
Coating Composition…………………………………………….. 16
Design of Experiments…………………………………………... 17
Coating Application………………………………………………. 20
Measurement Technique………………………………………... 22
Surface Roughness Evaluation………………………………… 26
IV. RESULTS AND DISCUSSION
Specular Scans using BRDF……………………………………. 31
Effects of Various Surface Roughness Parameters………….. 42
V. SUMMARY AND CONCLUSION.…………………………………… 48
APPENDICES
A. Particle Size Distribution Data……………………………………… 51
B. Formulation Spreadsheet…………………………………………… 53
C. Gloss Data……………………………………………………………. 54
D. Procedure for Scatterometer Measurements……………………... 55
iii
LIST OF ILLUSTRATIONS…………………….……………………………….. v
LIST OF TABLES……………………………….………….……………………. vii
ABSTRACT…………………………………………..…………………………… viii
ACKNOWLEDGEMENTS………………………..……………………………… ix

E. Surface Roughness Data……………………………………………. 57
REFERENCES…………………………………………………………………… 58
LIST OF ABBREVIATIONS…………..……..….................…………………... 60
iv
LIST OF ILLUSTRATIONS
1. Generic military coating arrangement.
2. BRDF plot at a wavelength 10.6 μm.
3. BRDF plot at a wavelength of 3.39 μm.
4. Law of reflection.
5. Reflection models.
6. Topcoat pigment representation.
7. Effects of pigment loading.
8. Glossmeter design.
9. Determination of gloss measurement geometries.
10. Definition of BRDF.
11. Gardco Novo-Gloss™ glossmeter.
12. Scatterometer equipment.
13. Spinner plate assembly.
14. Receiver assembly.
15. Three-dimensional map using stereopair imaging at 250X
magnification.
16. Wyko white light interferometer.
17. Setup of Michelson interferometer.
18. Specular scan using BRDF.
19. Onset angle.
20. Intensity and growth rate.
21. Effects of surface roughness and incident angle using initial set of 8
panels.
22. Effects of surface roughness and incident angle.
23. Three-dimensional topography of surface with Rq = 0.80 μm (Lo-Vel
27 with Dowanol, 6% PVC, 2 passes, new gun).
v

24. Three-dimensional topography of surface with Rq = 5.52 μm (Lo-Vel
HSF, 10% PVC, 2 passes, new gun).
25. Three-dimensional topography of surface with Rq = 1.70 μm (Lo-Vel
27, 8% PVC, 4 passes, MLS gun).
26. Autocovariance function with Rq = 0.57 μm (Lo-Vel 27 with Dowanol,
4% PVC, 2 passes, new gun).
27. Autocovariance function with Rq = 2.98 μm (Lo-Vel HSF, 6% PVC, 2
passes, new gun).
28. Autocovariance function with Rq = 1.68 μm (Lo-Vel 27, 8% PVC, 2
passes, MLS gun).
vi

LIST OF TABLES
1. A 3 factor 2 level DOE matrix.
2. Experiment variables.
3. Experiment matrix.
4. Spray process order.
5. Sample descriptions.
6. Comparison of various analytical techniques to measure surface
roughness.
7. Onset of specular reflection using BRDF.
8. Additional formulation descriptions.
9. Measured onset angles for the additional formulations.
vii

ABSTRACT
INFLUENCE OF SURFACE ROUGHNESS ON THE SPECULAR REFLECTANCE OF LOW GLOSS COATINGS USING BIRDIRECTIONAL
REFLECTANCE MEASUREMENTS Farrier, Lisa Marie University of Dayton Advisor: Dr. Andrey Voevodin
The objective of this study was to determine the effects of surface
roughness and incident angle on the reflectance of low gloss coatings at
grazing incidence. A specular peak has been identified from the forward
scatter at longer wavelengths, 3.39 µm and 10.6 µm, for various painted
surfaces. Depending on the surface roughness and wavelength, this specular
component occurs at different angles. However, this effect has not been
observed in the visible region. Material surfaces with well characterized
surface roughness have been measured at a wavelength of 0.633 µm in an
attempt to observe this effect in the visible region. The angle at which it was
observed for various roughnesses has been obtained using bidirectional
reflectance distribution function (BRDF) measurements.
viii

ACKNOWLEDGEMENTS
My special thanks to my advisor, Andrey Voevodin, for undertaking a
project outside of his research area. Bill Lynn for opening his door every time
I had a question and helping me interpret the data.
I would also like to thank Joel Johnson for his coatings formulation
experience and assistance in sample preparation. Wendy Shemano for her
patience and expertise in operating the scatterometers. Thanks to Steve
Szaruga for guidance in determining a project to pursue and allowing me the
time to complete this project. Art Safriet for precision machining the sample
mounts in order to balance and spin the panels. Mark Webb for helping
design the sample mount. John Buhrmaster for access to the spray booth on
multiple occasions. Carl Hager for training me on the Wyko interferometer.
And, finally to all my office mates who had to listen to all the obstacles
encountered during this project.
ix
CHAPTER ONE
INTRODUCTION
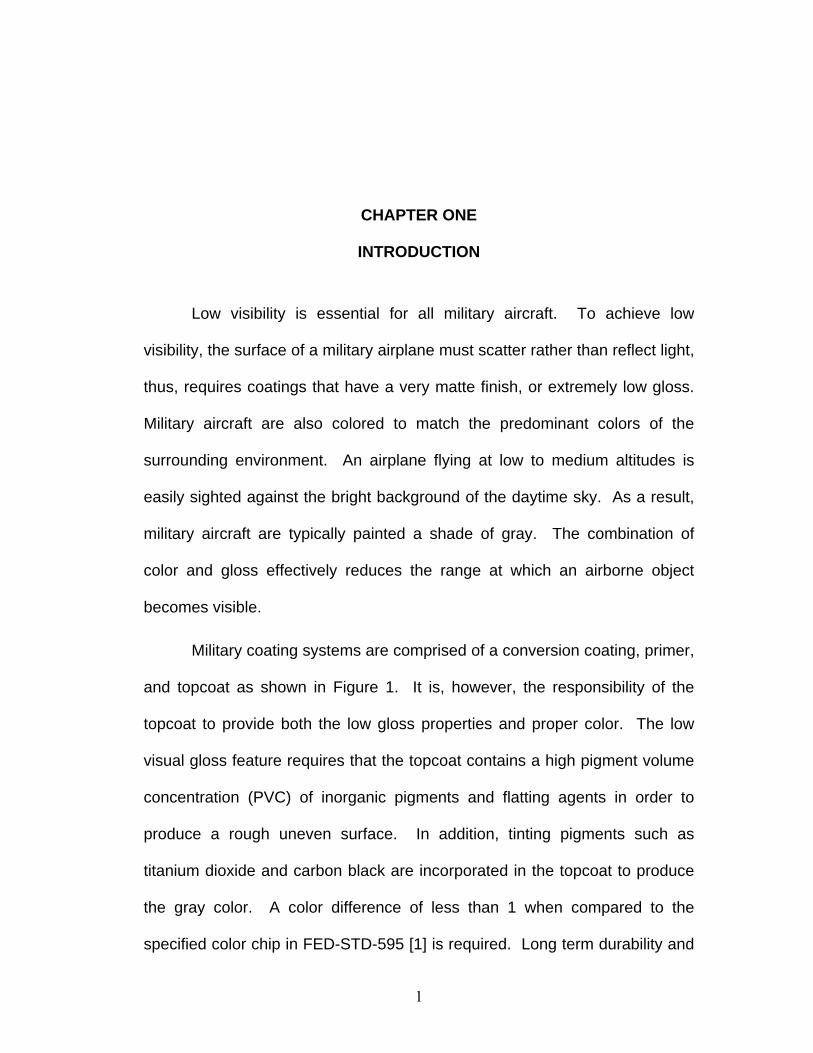
Low visibility is essential for all military aircraft. To achieve low
visibility, the surface of a military airplane must scatter rather than reflect light,
thus, requires coatings that have a very matte finish, or extremely low gloss.
Military aircraft are also colored to match the predominant colors of the
surrounding environment. An airplane flying at low to medium altitudes is
easily sighted against the bright background of the daytime sky. As a result,
military aircraft are typically painted a shade of gray. The combination of
color and gloss effectively reduces the range at which an airborne object
becomes visible.
Military coating systems are comprised of a conversion coating, primer,
and topcoat as shown in Figure 1. It is, however, the responsibility of the
topcoat to provide both the low gloss properties and proper color. The low
visual gloss feature requires that the topcoat contains a high pigment volume
concentration (PVC) of inorganic pigments and flatting agents in order to
produce a rough uneven surface. In addition, tinting pigments such as
titanium dioxide and carbon black are incorporated in the topcoat to produce
the gray color. A color difference of less than 1 when compared to the
specified color chip in FED-STD-595 [1] is required. Long term durability and
1
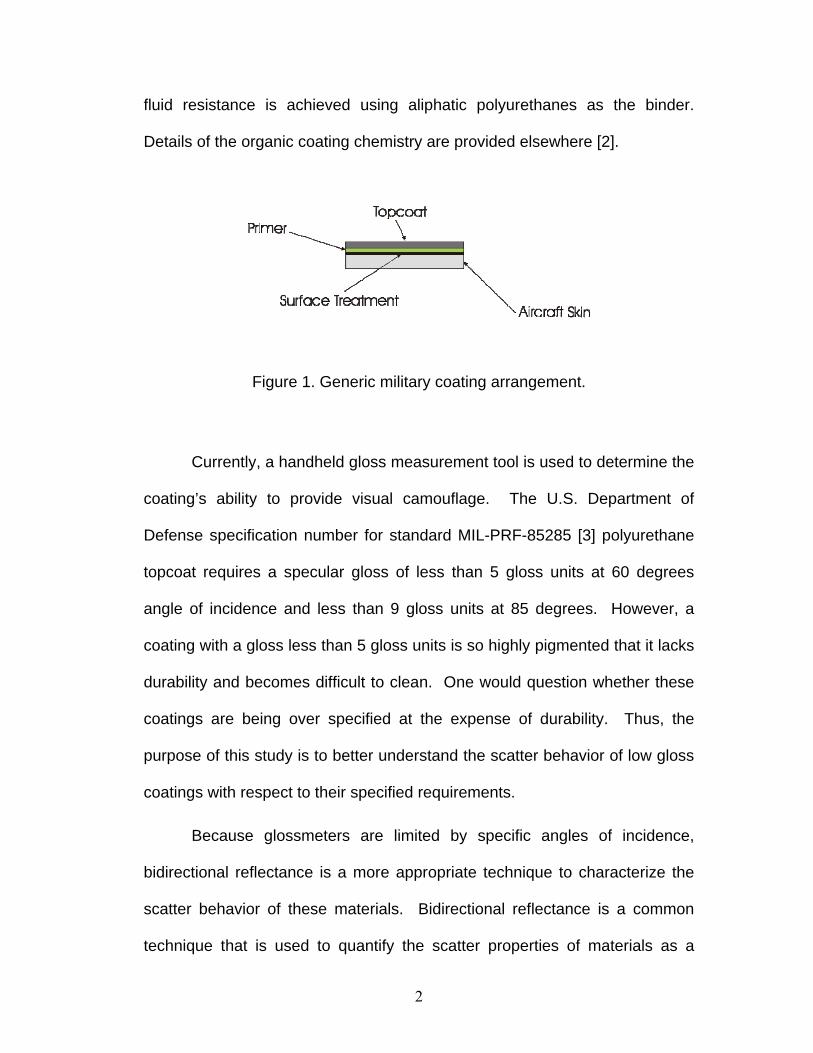
fluid resistance is achieved using aliphatic polyurethanes as the binder.
Details of the organic coating chemistry are provided elsewhere [2].
Figure 1. Generic military coating arrangement.
Currently, a handheld gloss measurement tool is used to determine the
coating’s ability to provide visual camouflage. The U.S. Department of
Defense specification number for standard MIL-PRF-85285 [3] polyurethane
topcoat requires a specular gloss of less than 5 gloss units at 60 degrees
angle of incidence and less than 9 gloss units at 85 degrees. However, a
coating with a gloss less than 5 gloss units is so highly pigmented that it lacks
durability and becomes difficult to clean. One would question whether these
coatings are being over specified at the expense of durability. Thus, the
purpose of this study is to better understand the scatter behavior of low gloss
coatings with respect to their specified requirements.
Because glossmeters are limited by specific angles of incidence,
bidirectional reflectance is a more appropriate technique to characterize the
scatter behavior of these materials. Bidirectional reflectance is a common
technique that is used to quantify the scatter properties of materials as a
2
function of wavelength and incident angle. Prior measurements (see Figure 2
and Figure 3) of like coatings have revealed a specular reflection component
at longer wavelengths, 3.39 µm and 10.6 µm. This specular component was
observed to occur at different angles depending on the surface roughness
and wavelength. Also, longer wavelengths appeared to produce this effect at
smaller angles of incidence, thus, it is expected that shorter visible
wavelengths would produce this effect at grazing angles (from 70 to 88
degrees) of incidence. However, this effect has not been observed in the
visible region indicating that the current camouflage coatings may be over
specified.
Figure 2 is a plot of the bidirectional reflectance distribution function
(BRDF) of a generic painted surface at a wavelength of 10.6 μm exhibiting
specular behavior for all angles of incidence. At the shorter 3.39 μm
wavelength, specular peaks are not revealed until approaching 75 degrees
angle of incidence as shown in Figure 3.
3

Figure 2. BRDF plot at a wavelength of 10.6 μm.
Specular component becoming visible
Figure 3. BRDF plot at a wavelength of 3.39 μm.
The objective of this study was to determine the effects of surface
roughness and incident angle on the specular reflectance of low gloss
coatings in the visible region. Material surfaces were created with well
characterized surface roughness and measured at a wavelength of 0.633 µm
4

in an attempt to observe this effect in the visible. The angle at which it was
observed for various roughnesses was obtained using BRDF.
5

CHAPTER TWO
BACKGROUND AND THEORY
Reflection of Light
Light incident upon a surface can be reflected, absorbed, or
transmitted. The interaction depends on the physical characteristics of the
light as well as the physical composition and characteristics of the object.
The conservation of energy leads to the following equation:
E + E + E = 1, r t a
where Er is the light reflected back from the surface of the object, Et is the
light transmitted through the object, and Ea is the light absorbed by the object.
Each is a function of wavelength. Thus, reflected waves are simply those that
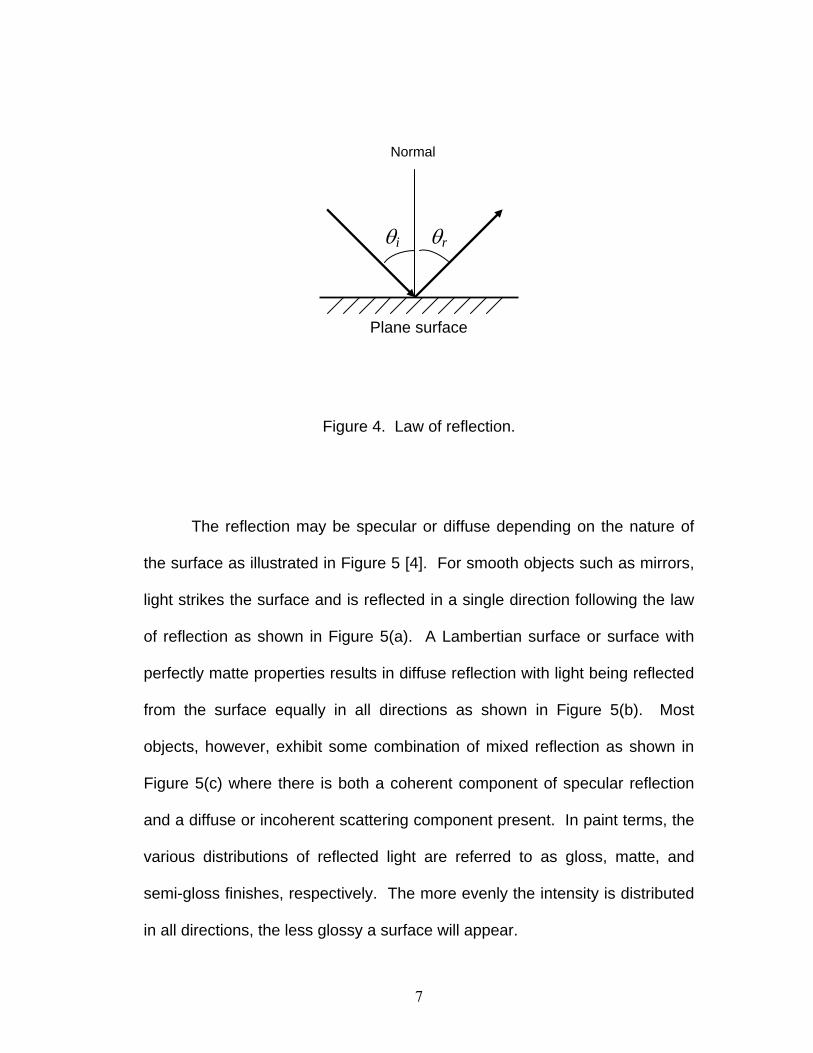
are neither transmitted nor absorbed. The law of reflection states that light
will be reflected from a surface at an angle equal to the incident angle, θ = θr i,
which is called specular reflection. Both angles are typically measured with
respect to the normal to the surface as shown in Figure 4. The law applies to
the reflection of light from surfaces that are horizontal, vertical, angled, and/or
curved.
6
Normal
θrθi
Plane surface
Figure 4. Law of reflection.
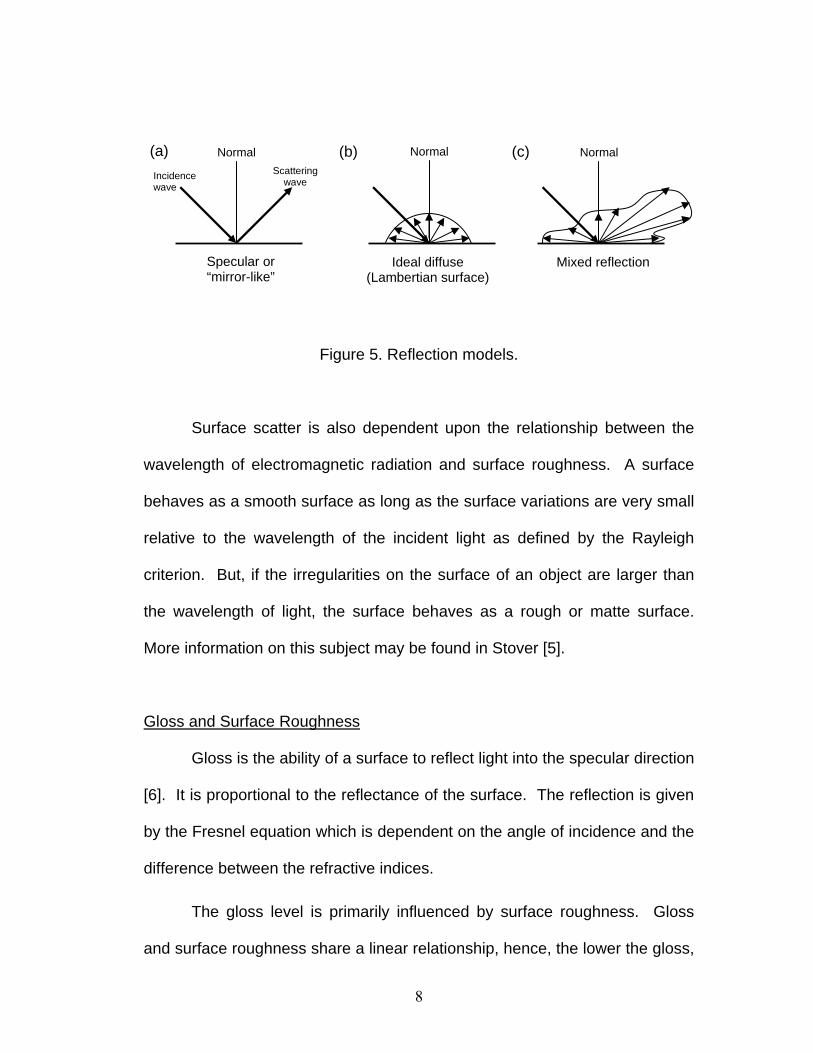
The reflection may be specular or diffuse depending on the nature of
the surface as illustrated in Figure 5 [4]. For smooth objects such as mirrors,
light strikes the surface and is reflected in a single direction following the law
of reflection as shown in Figure 5(a). A Lambertian surface or surface with
perfectly matte properties results in diffuse reflection with light being reflected
from the surface equally in all directions as shown in Figure 5(b). Most
objects, however, exhibit some combination of mixed reflection as shown in
Figure 5(c) where there is both a coherent component of specular reflection
and a diffuse or incoherent scattering component present. In paint terms, the
various distributions of reflected light are referred to as gloss, matte, and
semi-gloss finishes, respectively. The more evenly the intensity is distributed
in all directions, the less glossy a surface will appear.
7
Specular or “mirror-like”
Ideal diffuse (Lambertian surface)
Mixed reflection
Incidence wave
Scattering wave
(a) (c)(b)Normal Normal Normal
Figure 5. Reflection models.
Surface scatter is also dependent upon the relationship between the
wavelength of electromagnetic radiation and surface roughness. A surface
behaves as a smooth surface as long as the surface variations are very small
relative to the wavelength of the incident light as defined by the Rayleigh
criterion. But, if the irregularities on the surface of an object are larger than
the wavelength of light, the surface behaves as a rough or matte surface.
More information on this subject may be found in Stover [5].
Gloss and Surface Roughness
Gloss is the ability of a surface to reflect light into the specular direction
[6]. It is proportional to the reflectance of the surface. The reflection is given
by the Fresnel equation which is dependent on the angle of incidence and the
difference between the refractive indices.
The gloss level is primarily influenced by surface roughness. Gloss
and surface roughness share a linear relationship, hence, the lower the gloss,
8
the higher the surface roughness. For a paint or coating, pigmentation is
used to vary the surface roughness in an attempt to control the gloss. The
protrusion of these pigment particles causes the reflected light to be scattered
resulting in low gloss. It is affected by several factors including pigment
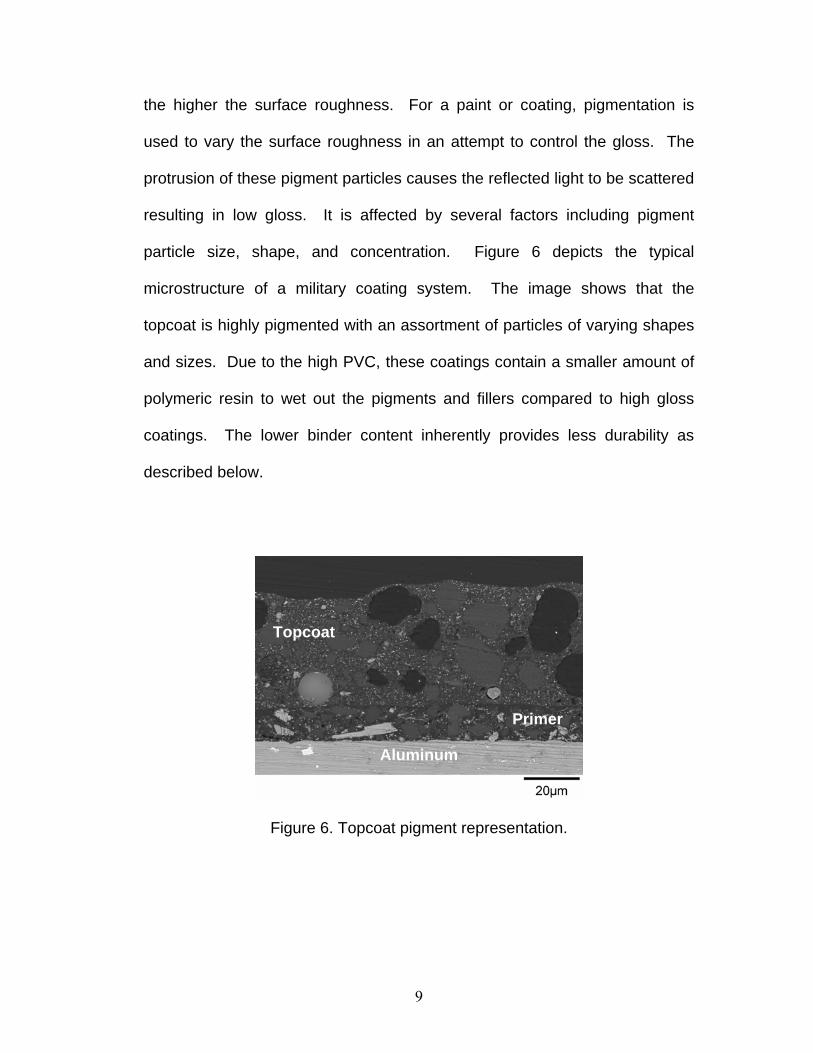
particle size, shape, and concentration. Figure 6 depicts the typical
microstructure of a military coating system. The image shows that the
topcoat is highly pigmented with an assortment of particles of varying shapes
and sizes. Due to the high PVC, these coatings contain a smaller amount of
polymeric resin to wet out the pigments and fillers compared to high gloss
coatings. The lower binder content inherently provides less durability as
described below.
Figure 6. Topco epresentation.
Topcoat
Primer
Aluminum
at pigment r
9
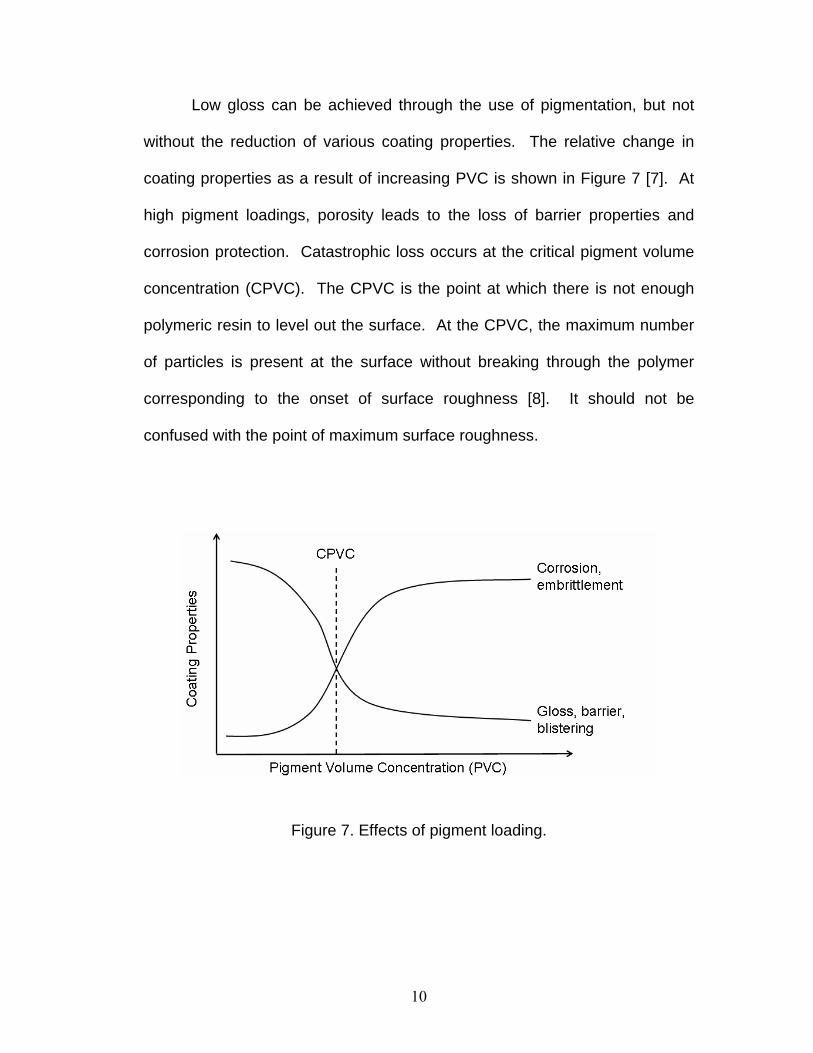
Low gloss can be achieved through the use of pigmentation, but not
without the reduction of various coating properties. The relative change in
coating properties as a result of increasing PVC is shown in Figure 7 [7]. At
high pigment loadings, porosity leads to the loss of barrier properties and
corrosion protection. Catastrophic loss occurs at the critical pigment volume
concentration (CPVC). The CPVC is the point at which there is not enough
polymeric resin to level out the surface. At the CPVC, the maximum number
of particles is present at the surface without breaking through the polymer
corresponding to the onset of surface roughness [8]. It should not be
confused with the point of maximum surface roughness.
Figure 7. Effects of pigment loading.
10
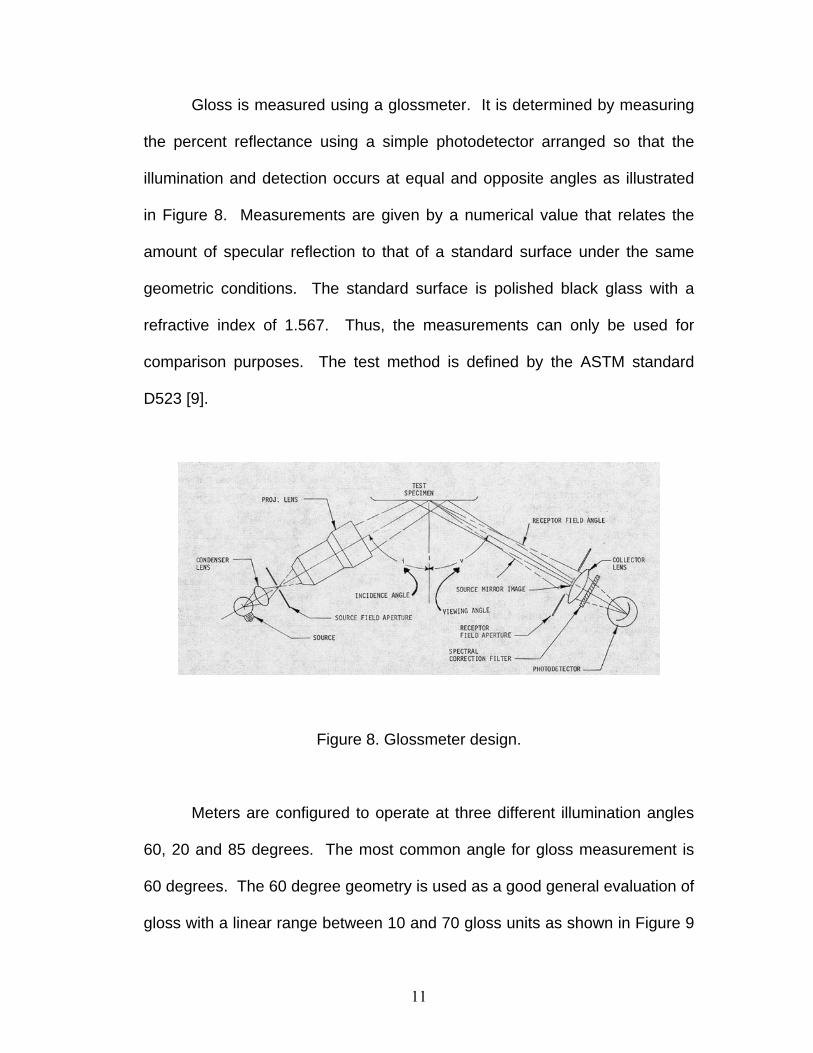
Gloss is measured using a glossmeter. It is determined by measuring
the percent reflectance using a simple photodetector arranged so that the
illumination and detection occurs at equal and opposite angles as illustrated
in Figure 8. Measurements are given by a numerical value that relates the
amount of specular reflection to that of a standard surface under the same
geometric conditions. The standard surface is polished black glass with a
refractive index of 1.567. Thus, the measurements can only be used for
comparison purposes. The test method is defined by the ASTM standard
D523 [9].
Figure 8. Glossmeter design.
Meters are configured to operate at three different illumination angles
60, 20 and 85 degrees. The most common angle for gloss measurement is
60 degrees. The 60 degree geometry is used as a good general evaluation of
gloss with a linear range between 10 and 70 gloss units as shown in Figure 9
11
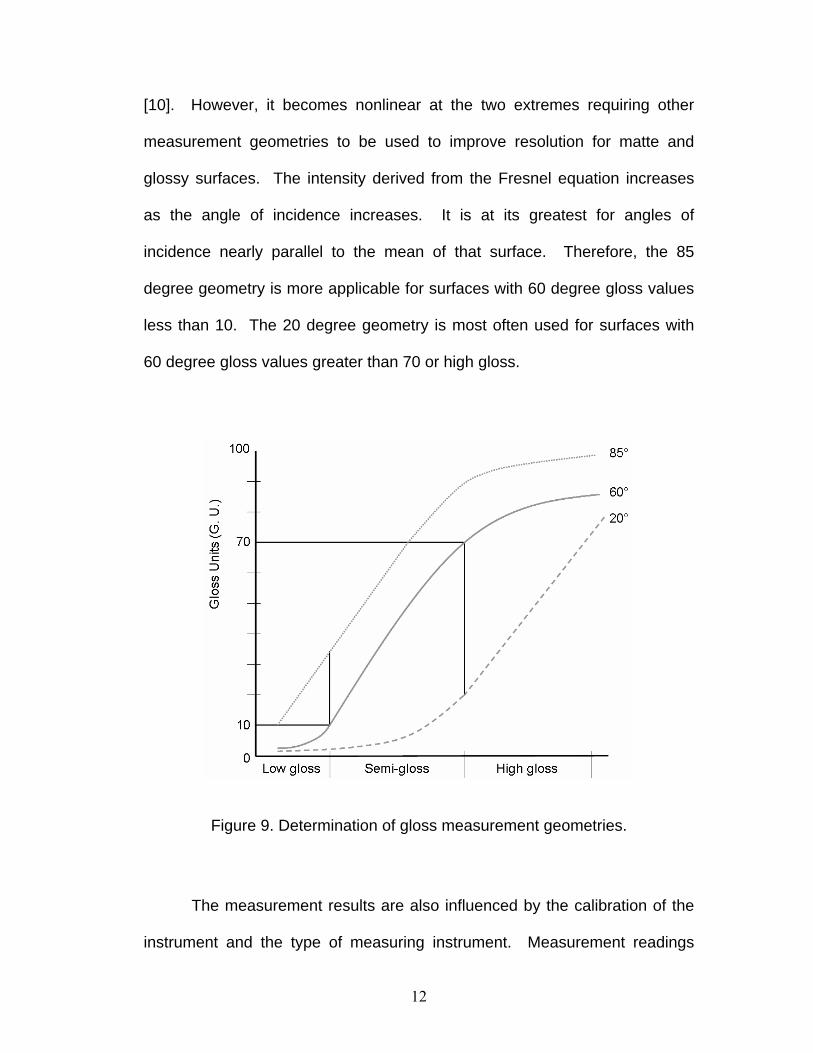
[10]. However, it becomes nonlinear at the two extremes requiring other
measurement geometries to be used to improve resolution for matte and
glossy surfaces. The intensity derived from the Fresnel equation increases
as the angle of incidence increases. It is at its greatest for angles of
incidence nearly parallel to the mean of that surface. Therefore, the 85
degree geometry is more applicable for surfaces with 60 degree gloss values
less than 10. The 20 degree geometry is most often used for surfaces with
60 degree gloss values greater than 70 or high gloss.
Figure 9. Determination of gloss measurement geometries.
The measurement results are also influenced by the calibration of the
instrument and the type of measuring instrument. Measurement readings
12

may vary due to mistakes performed during calibration such as using a dirty
or damaged calibration standard. The type of instrument also affects the
measurement results. Inconsistencies have been observed for
measurements taken at the same angle using two different meters. Often two
different gloss values are produced although meters are manufactured to
conform to the same gloss standard. Arney et. al. [11] determined that the
acceptance angle is different depending on manufacturer and that the
difference of only a few tenths of a degree can significantly alter the gloss
readings produced by an instrument.
Bidirectional Reflectance
BRDF is a commonly accepted measurement technique used to
describe the distribution of reflected light at a surface. The bidirectional
distribution function is determined from the ratio of scattered surface radiance
divided by incident surface irradiance at some specified polar (θ) and
azimuthal angles (φ). BRDF is typically presented as a function of
wavelength. The following equation was first defined by Nicodemus [12].
si
s
PP
irradiance aldifferentiradiance aldifferentiBRDF
θλ cos/Ω
==
Stover [13] describes the scattered surface radiance as the light flux scattered
per unit solid angle, Ω. The solid angle is used to refer to some small surface
area on the hemisphere which has units in steradians (sr). The projected
13
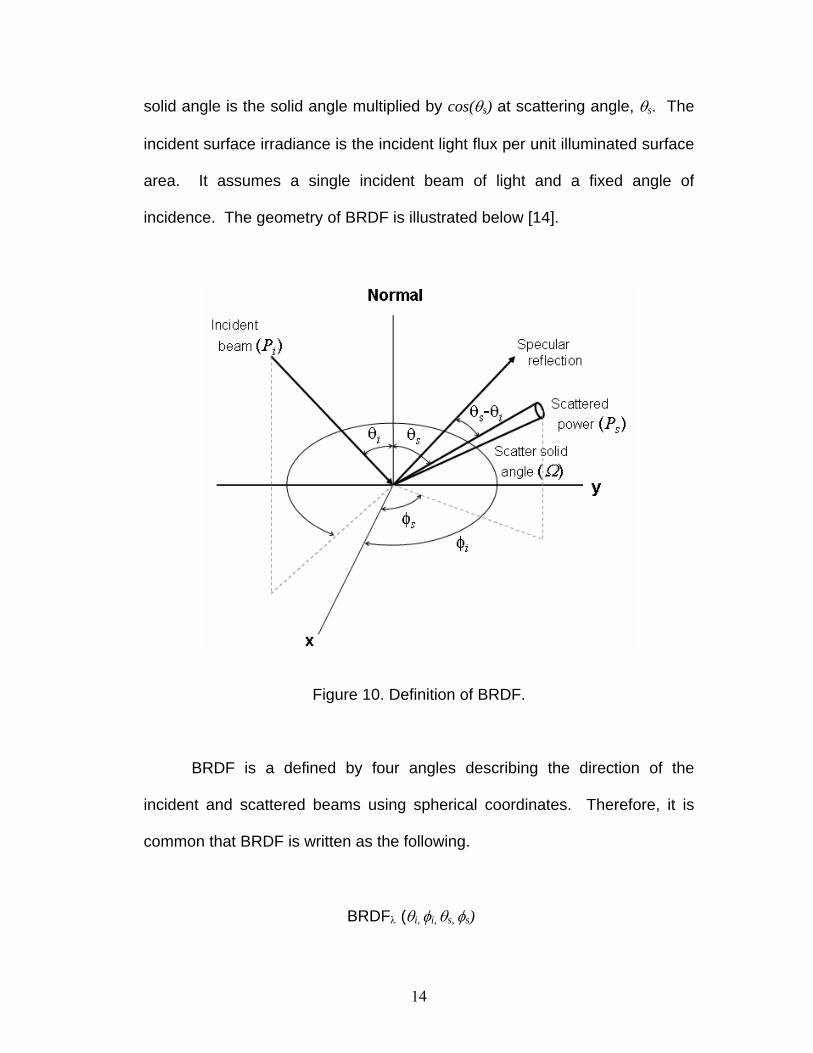
solid angle is the solid angle multiplied by cos(θ ) at scattering angle, θs s. The
incident surface irradiance is the incident light flux per unit illuminated surface
area. It assumes a single incident beam of light and a fixed angle of
incidence. The geometry of BRDF is illustrated below [14].
Figure 10. Definition of BRDF.
BRDF is a defined by four angles describing the direction of the
incident and scattered beams using spherical coordinates. Therefore, it is
common that BRDF is written as the following.
BRDFλ (θi, φi, θs, φ ) s
14
BRDF is measured by sweeping a single detector through an arc. The
incidence angle is kept constant and the angle of the detector is varied to
measure the scattered intensity at different angles. It can be normalized as a
probability density function (PDF) containing valuable information about the
topographic features of the surface. Measurements can therefore be used to
determine the size and distribution of surface features. The technique for
characterizing the surface roughness of smooth, clean reflective surfaces
from BRDF is well known; however, these calculations can not be used to
obtain the PSD for rough surfaces. Stover [15] provides a brief explanation
describing the limitations of the current analytical approaches for describing
the relationship between surface topography and reflective scatter from rough
surfaces.
15
CHAPTER THREE
EXPERIMENT PROCEDURE
Coating Composition
A generic coating was developed in order to obtain the broadest range
of surface roughnesses. A simple thermoplastic resin was modified with a
single pigment of varying size and concentration to obtain a desired surface
roughness. In addition, the color of the initial resin was modified using a
prepared carbon black dispersion to reduce volume scatter. The
concentration of carbon black was set at a constant 3% for all formulations
while the concentration of silica was varied. Precipitated silica is a common
flatting agent used in standard camouflage coatings to reduce gloss, thus, it
was selected to vary the surface roughness.
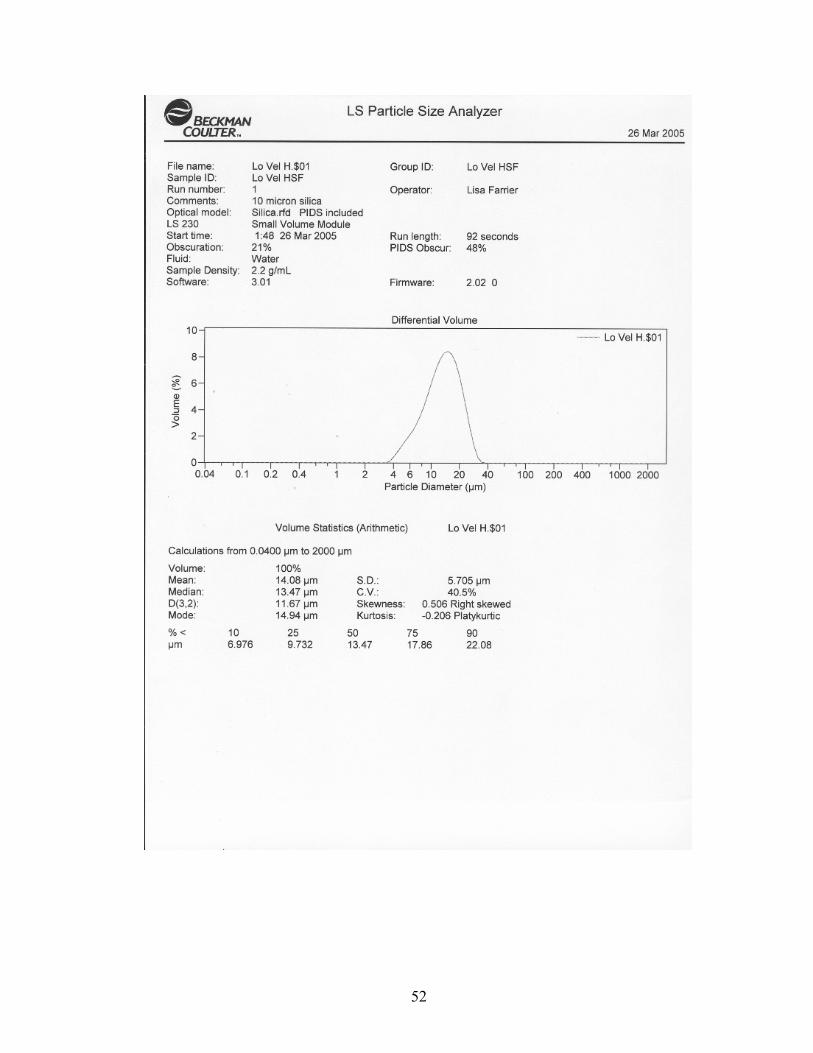
Two sizes of precipitated silica particles (Lo-Vel 27 and Lo-Vel HSF)
were selected from PPG Industries, Inc. The pigments were then measured
using a Beckman Coulter laser diffraction particle size analyzer. The results
of 3 runs per sample were averaged to obtain a particle size of 1.57 μm for
Lo-Vel 27 and 11.68 μm for Lo-Vel HSF. Appendix A has the particle size
distribution of run number 1 for each pigment.
16
Xylene was also added to dilute the formulation to a sprayable
viscosity. A spreadsheet was created to perform quick calculations of the
actual amounts of formulation components required for the various pigment
loadings. An example spreadsheet is illustrated in Appendix B.
Design of Experiments
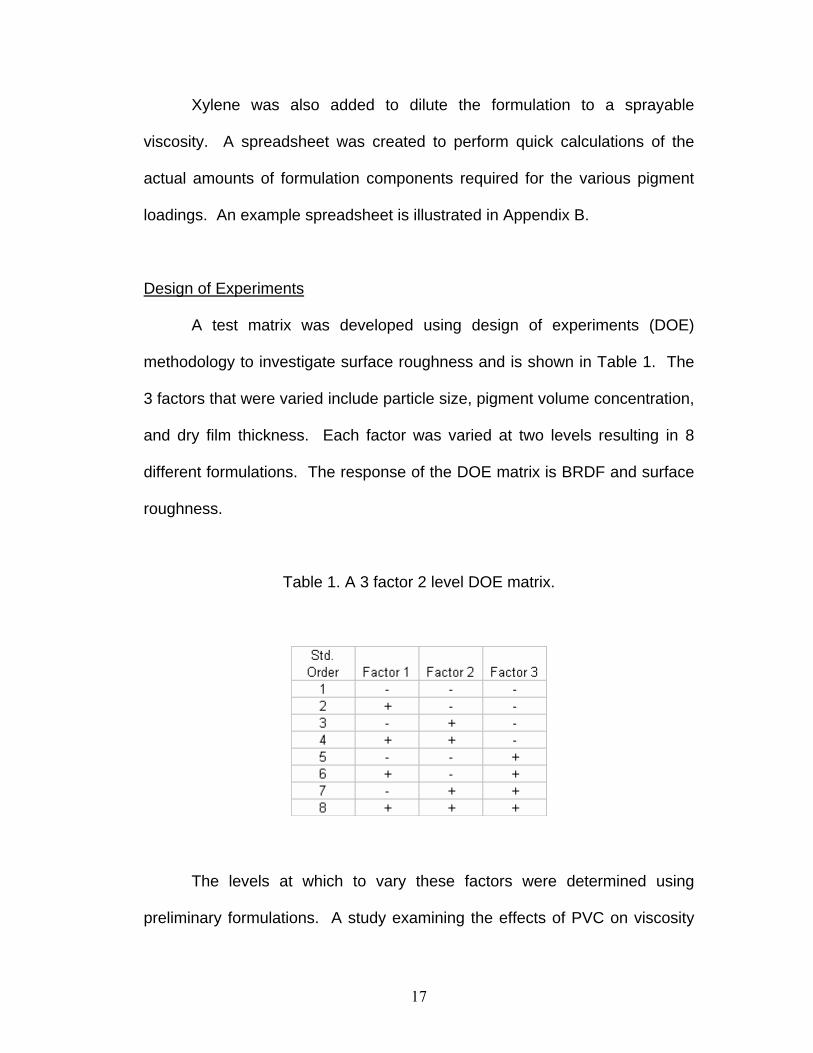
A test matrix was developed using design of experiments (DOE)
methodology to investigate surface roughness and is shown in Table 1. The
3 factors that were varied include particle size, pigment volume concentration,
and dry film thickness. Each factor was varied at two levels resulting in 8
different formulations. The response of the DOE matrix is BRDF and surface
roughness.
Table 1. A 3 factor 2 level DOE matrix.
The levels at which to vary these factors were determined using
preliminary formulations. A study examining the effects of PVC on viscosity
17

and surface roughness was completed for each pigment in order to identify a
formulation that exhibits the effect. A series of draw-downs at 1 mil
thicknesses were created on Leneta cards and 3 inch x 6 inch aluminum
panels. The pigment loading was increased at 2% PVC intervals. Leneta
cards were used to evaluate the hiding power of the carbon black
concentration to ensure an opaque surface.
The draw-downs were then visually inspected to determine the
specularity of the panel. The panels were first viewed at low grazing angles
using the naked eye. The specular effect was first observed at 8% PVC for
the 2 micron pigment and 6% PVC for the 10 micron pigment. It was easier
to identify the sudden specular effect from the 2 micron silica coatings.
Based upon the visual inspection of the draw downs, three formulations were
selected (Lo-Vel 27 at 4%, 6%, and 8% PVC) and sprayed on 12 inch x 12
inch panels of 0.032 inch thick aluminum to verify the presence of the effect in
the visible region. The 12 inch x 12 inch panels were placed on the
scatterometer and then visually inspected again. The scatterometer is
capable of detecting the specular peak within a 0.10 of a degree. The effect
was observed at 86 degrees angle of incidence in the visible region and 83
degrees angle of incidence in the near-infrared region for the 8% PVC
loading. During this evaluation, sample flatness was found to be critical for
identifying the specular component and indicated that a thicker substrate was
required.
18

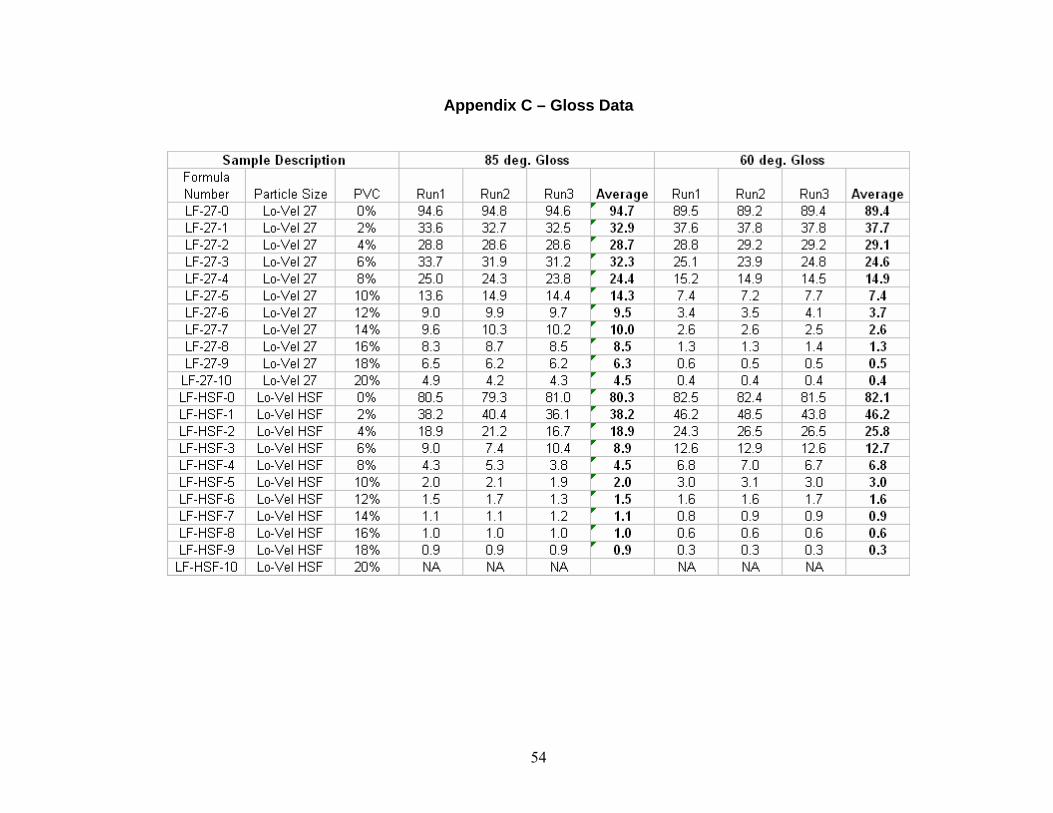
Gloss was also measured using a Gardco Novo-Gloss™ statistical
glossmeter shown in Figure 11 to further establish suitable values for the
PVC. Three readings were taken for each sample. The gloss data is
reported in Appendix C. The resultant experiment variables are described in
Table 2. The first value for the PVC was chosen based on visual inspection
and the second value was chosen based on the gloss requirements to impart
camouflage features (gloss @ 60° – max 5 and gloss @ 85° – max 9).
Table 2. Experiment variables.
Factor 1: Particle size PPG precipitated silica; Lo-Vel 27, 2 μm (-) and Lo-Vel HSF, 10 μm (+)
Factor 2: Pigment volume concentration
Lo-Vel 27 8% (-) and 12 % (+) Lo-Vel HSF 6% (-) and 10 % (+)
Factor 3: Dry film thickness 2 passes using HVLP gun (-) 4 passes using HVLP gun (+)
Figure 11. Gardco Novo-Gloss™ glossmeter.
19
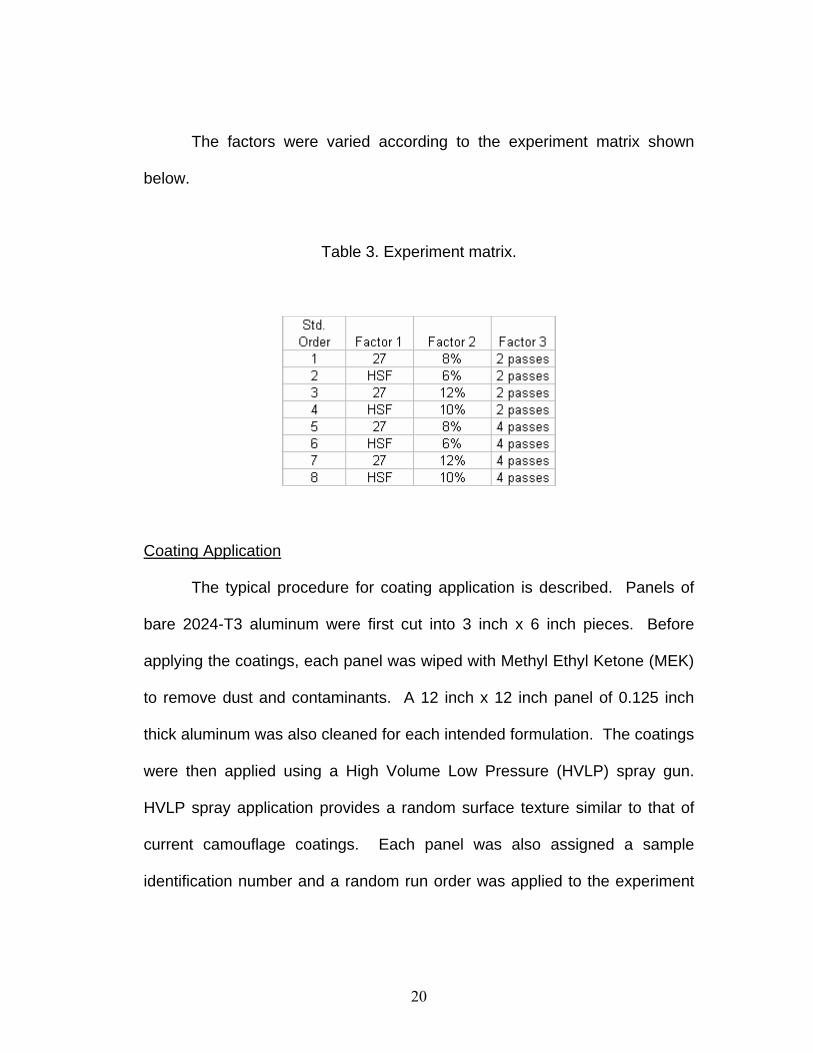
The factors were varied according to the experiment matrix shown
below.
Table 3. Experiment matrix.
Coating Application
The typical procedure for coating application is described. Panels of
bare 2024-T3 aluminum were first cut into 3 inch x 6 inch pieces. Before
applying the coatings, each panel was wiped with Methyl Ethyl Ketone (MEK)
to remove dust and contaminants. A 12 inch x 12 inch panel of 0.125 inch
thick aluminum was also cleaned for each intended formulation. The coatings
were then applied using a High Volume Low Pressure (HVLP) spray gun.
HVLP spray application provides a random surface texture similar to that of
current camouflage coatings. Each panel was also assigned a sample
identification number and a random run order was applied to the experiment
20

matrix before spraying. The formulation and order in which the panels were
sprayed is tabulated below.
Table 4. Spray process order.
During the spray process, all coatings were first applied using a HVLP
gun. However, after examining the surface appearance of the finished
panels, it was determined that some panels needed to be resprayed due to
surface defects and difficulties encountered during spraying. PNT00472,
PNT00462, and PNT00471 were resprayed using a gun with a larger nozzle.
Table 5 identifies the process conditions for each panel. The spray
equipment is noted as such the MLS gun refers to the small nozzle and the
new gun refers to the large nozzle.
21
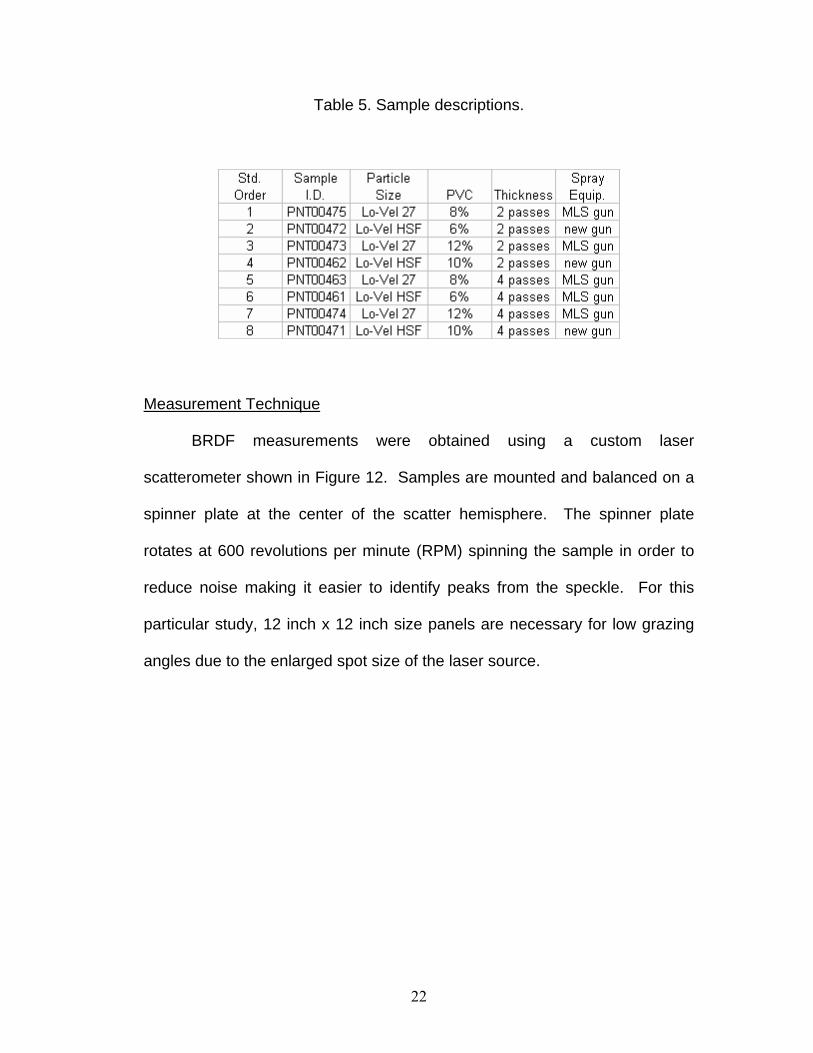
Table 5. Sample descriptions.
Measurement Technique
BRDF measurements were obtained using a custom laser
scatterometer shown in Figure 12. Samples are mounted and balanced on a
spinner plate at the center of the scatter hemisphere. The spinner plate
rotates at 600 revolutions per minute (RPM) spinning the sample in order to
reduce noise making it easier to identify peaks from the speckle. For this
particular study, 12 inch x 12 inch size panels are necessary for low grazing
angles due to the enlarged spot size of the laser source.
22

Figure 12. Scatterometer equipment.
Because the 12 inch x 12 inch panels of aluminum were so heavy, a
special sample mount was designed to replace the spinner plate assembly.
Figure 13 is a schematic of the spinner plate assembly. The mounts were
machined to precisely duplicate the holes connecting the plate to the
scatterometer. The new mounts were then permanently attached to the back
of each 12 inch x 12 inch panel using epoxy.
23

Figure 13. Spinner plate assembly.
Measurements were conducted using a HeNe gas laser producing
visible light at a wavelength of 0.633 μm. The light is scattered by the sample
to a receiver assembly shown in Figure 14. The receiver assembly consists
of a pre-amplifier, silicon detector, and receiver polarizer. Data was collected
in the plane of the receiver i.e. the incident beam and reflected beam are in-
plane with the receiver. Both s- and p- polarized radiation was measured to
determine the effect of polarization states. The s- indicates that the electric
field is perpendicular to the plane of incidence and p- indicates that the
electric field is parallel.
24

Figure 14. Receiver assembly.
Data was collected using different diameter apertures of 14 mm, 1 mm,
and 0.3 mm. Smaller apertures are able to resolve peaks more clearly by
restricting the amount of reflected energy at the receiver; however,
decreasing the aperture size results in increased noise in the data.
Therefore, the 14 mm aperture was used to provide the general shape of the
curve and determine the location in which the specular peak begins to
emerge from the speckle. Scans were performed at various angles of
incidence to within ± 3 degrees of the specular direction of the reflected beam
in search of a specular peak. The peaks initially appeared at angles greater
than 82 degrees using the 14 mm aperture for the samples studied. Once the
angle at which the specular peak was revealed, scans using the smaller
apertures could be limited to angles surrounding 82 degrees. Thus, scans
were started at 78 degrees to ensure the specular peak was captured for the
samples studied. The detailed procedures for the scatterometer
measurements at both s- and p- polarizations are documented in Appendix D.
25
Surface Roughness Evaluation
A variety of analytical techniques were evaluated to determine the
appropriate method for measuring surface roughness. This includes
scanning electron microscopy (SEM) stereopair imaging, atomic force
microscopy (AFM), stylus and laser profilometry, and white light
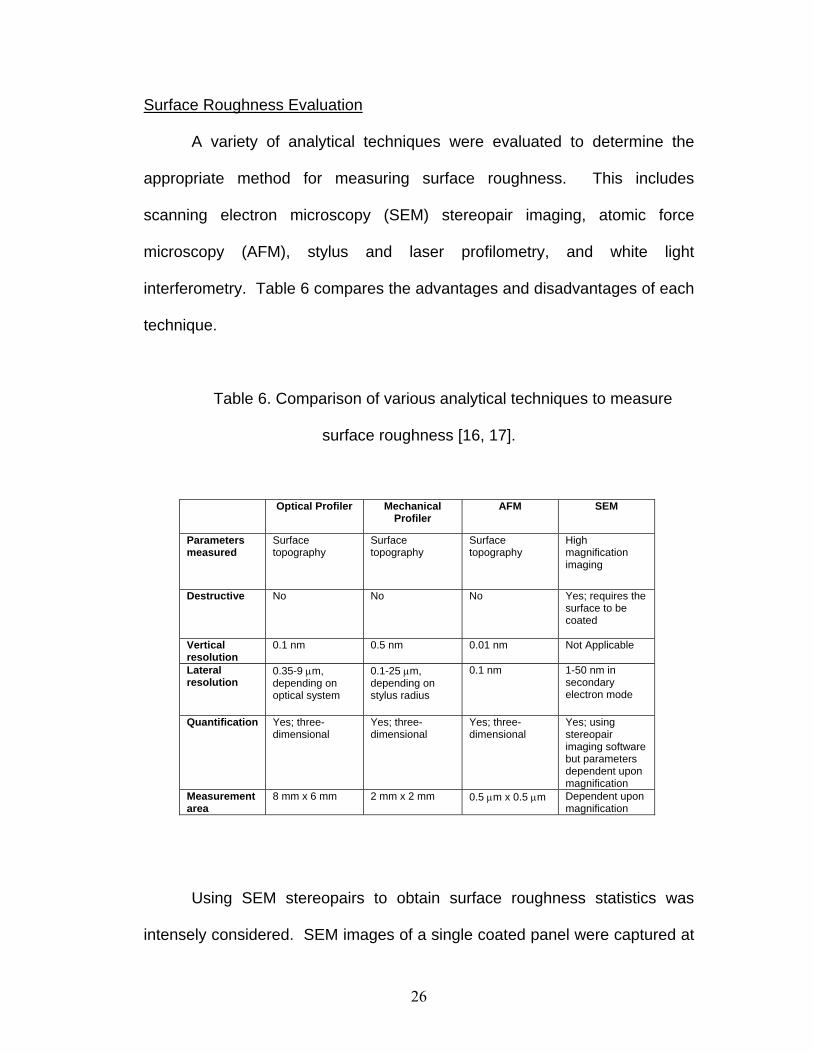
interferometry. Table 6 compares the advantages and disadvantages of each
technique.
Table 6. Comparison of various analytical techniques to measure
surface roughness [16, 17].
Optical Profiler Mechanical Profiler
AFM SEM
Parameters measured
Surface topography
Surface topography
Surface topography
High magnification imaging
Destructive No No No Yes; requires the surface to be coated
Vertical resolution
0.1 nm 0.5 nm 0.01 nm Not Applicable
Lateral resolution
0.1 nm 1-50 nm in secondary electron mode
0.35-9 μm, depending on optical system
0.1-25 μm, depending on stylus radius
Quantification Yes; three-dimensional
Yes; three-dimensional
Yes; three-dimensional
Yes; using stereopair imaging software but parameters dependent upon magnification
Measurement area
8 mm x 6 mm 2 mm x 2 mm Dependent upon magnification
0.5 μm x 0.5 μm
Using SEM stereopairs to obtain surface roughness statistics was
intensely considered. SEM images of a single coated panel were captured at
26

varying degrees of tilt: 0, -7, and +7 degrees. The images were then
combined using stereopair imaging software, Alicona MeX v4.1, to create a
three-dimensional map of the surface shown in Figure 15. The software also
calculated various surface parameters; however, these parameters are
dependent upon magnification indicating that the value for average roughness
at 250X is different than the value at 500X. Thus, these parameters can only
be used for comparison purposes.
Figure 15. Three-dimensional map using stereopair imaging at 250X
magnification.
Although AFM is a high resolution three-dimensional profilometer, it is
limited by the small size of its measurement area. This technique would be
more useful for measuring structured surfaces. Stylus and laser profilometry
27
are similar in that each is constrained by either the stylus radius or spot size.
The stylus appeared to ignore the valleys of comparable coatings with low
gloss while the laser rounded off the peaks. A significant portion of the data
was missing from the two-dimensional profiles. White light interferometry was
assessed next. The technique is old, but use of modern electronics such as
an improved detector has enhanced its capabilities tremendously. The white
light interferometer provided a couple advantages over laser, for example, the
multiple wavelength operation is able to measure larger steps and generate
less noise.
Therefore, surface roughness was measured using a Wyko NT1100
surface profiler shown in Figure 16. The Wyko surface profiler system is a
non-contact optical profiler that uses white light interferometry to measure
surface heights. Interference fringes are produced when light is reflected
from a reference mirror and is combined with light reflected from the sample
using a Michelson objective as illustrated in Figure 17. The NT1100 operates
in two working modes: vertical shift interference (VSI) and phase shift
interference (PSI). VSI mode is based on white light vertical scanning
interferometry and is used to measure rough surfaces with a maximum step
height of 1 mm. PSI mode measures smooth surfaces with a relatively small
step height of 150 nm using phase-shifting.
28
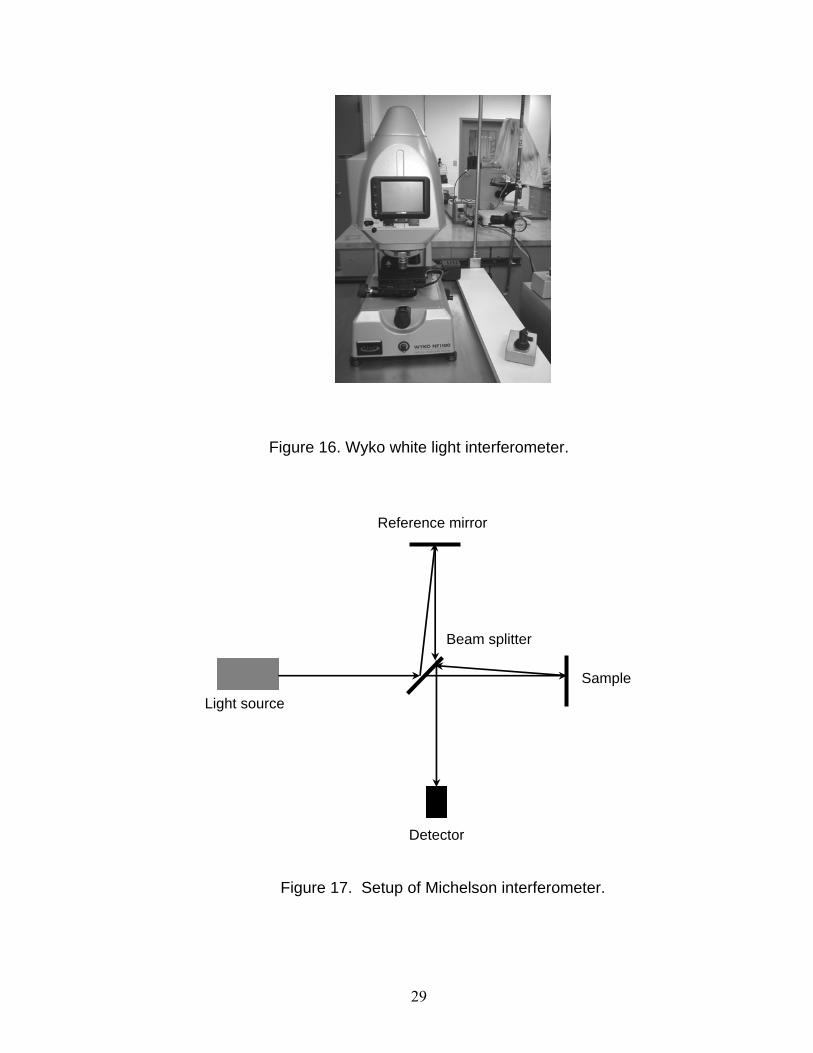
Figure 16. Wyko white light interferometer.
Light source
Detector
Reference mirror
Sample
Beam splitter
Figure 17. Setup of Michelson interferometer.
29

The 3 inch x 6 inch panels were measured using VSI mode using the
5X objective with a 1.0 numerical aperture resulting in a measurement area of
1.24 mm x 0.94 mm. In VSI mode, the short coherence length of white light is
filtered using a neutral density filter and the interferometric objective is
vertically moved to scan the surface at varying heights and the degree of
fringe modulation or coherence is measured [18]. The vertical scan length
was set to 15 μm x 15 μm for Lo-Vel 27 with a frequency modulation of 1%
and 30 μm x 30 μm for Lo-Vel HSF with a frequency modulation of 0.1%. The
modulation threshold determines the signal-to-noise level for which a given
pixel is considered valid. Data points that do not meet the criteria are marked
as invalid and not used during analysis. If the threshold is decreased too
much, then poor quality data points are considered.
Thirty locations were measured on the surface of each 3 inch x 6 inch
panel to obtain a statistical average of the surface roughness. Thirty data
points are generally required to obtain a normally distributed mean. This was
verified by plotting the distributions of sets of 15, 30, and 60 data points for a
single coated panel. For each location, multiple measurements were
combined over a 2 mm x 2 mm area using the stitching feature. The average
was then calculated for various surface parameters.
30

31
CHAPTER FOUR
RESULTS AND DISCUSSION
Specular Scans using BRDF
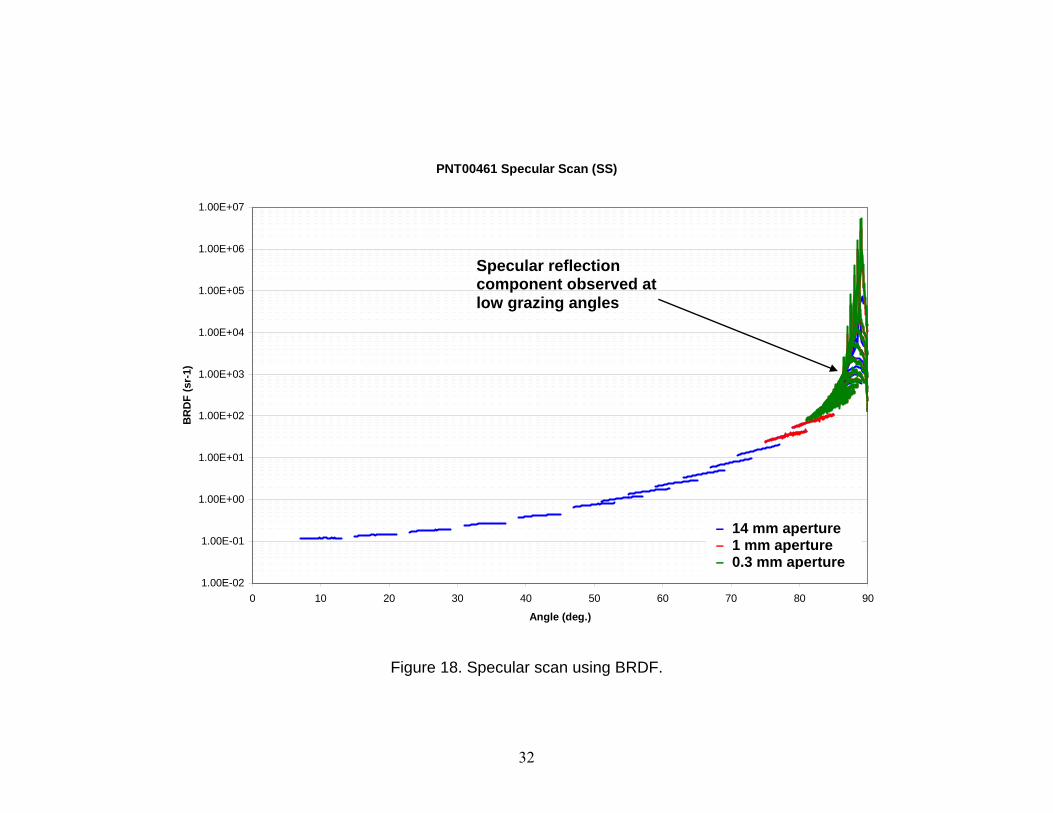
BRDF specular scans were obtained for each panel described in the
DOE experiment matrix at a wavelength of 0.633 μm from 10 to 90 degrees
angles of incidence for both s- and p- polarizations. The peaks were resolved
using 14 mm, 1 mm, and 0.3 mm apertures. The scans for each aperture
were overlayed on a single BRDF plot as shown in Figure 18 in which
specular reflection is observed at low grazing angles. An Excel macro was
written to automate the process.
32
PNT00461 Specular Scan (SS)
1.00E-02
1.00E-01
1.00E+00
1.00E+01
1.00E+02
1.00E+03
1.00E+04
1.00E+05
1.00E+06
1.00E+07
0 10 20 30 40 50 60 70 80 90
Angle (deg.)
BR
DF
(sr-
1)
Figure 18. Specular scan using BRDF.
Specular reflection component observed at low grazing angles
– 14 mm aperture – 1 mm aperture – 0.3 mm aperture
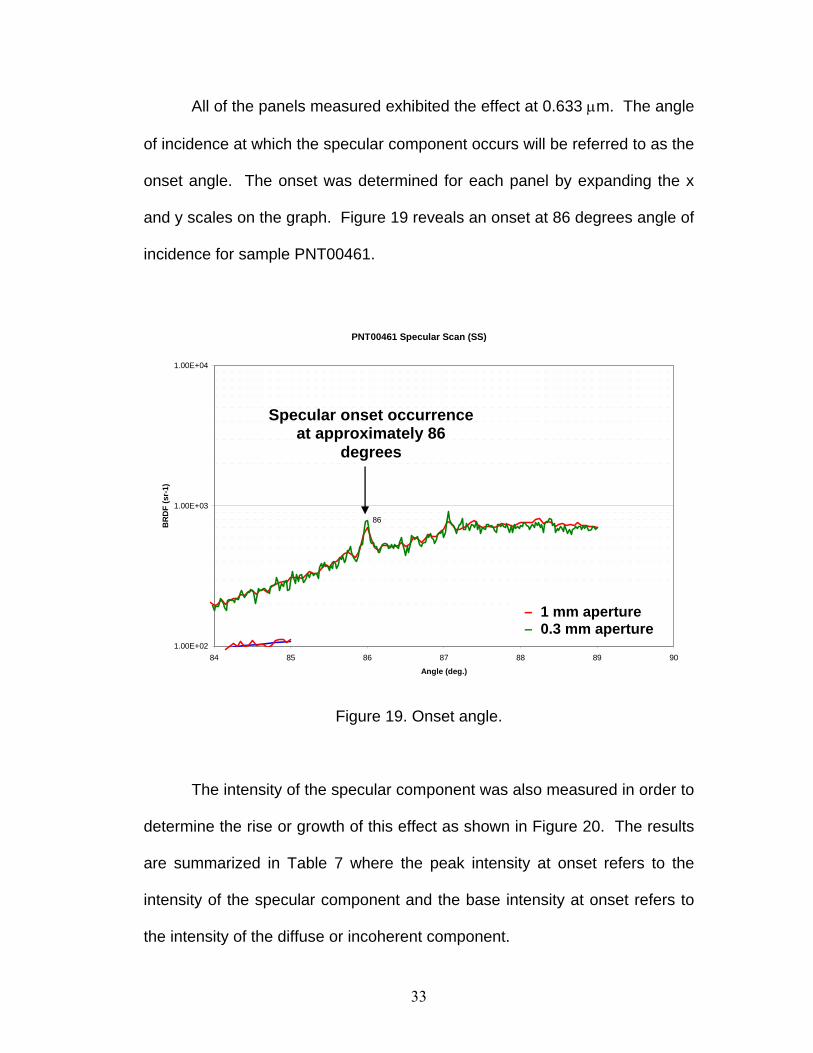
All of the panels measured exhibited the effect at 0.633 μm. The angle
of incidence at which the specular component occurs will be referred to as the
onset angle. The onset was determined for each panel by expanding the x
and y scales on the graph. Figure 19 reveals an onset at 86 degrees angle of
incidence for sample PNT00461.
PNT00461 Specular Scan (SS)
86
1.00E+02
1.00E+03
1.00E+04
84 85 86 87 88 89 90
Angle (deg.)
BR
DF
(sr-
1)
Specular onset occurrence at approximately 86
degrees
– 1 mm aperture – 0.3 mm aperture
Figure 19. Onset angle.
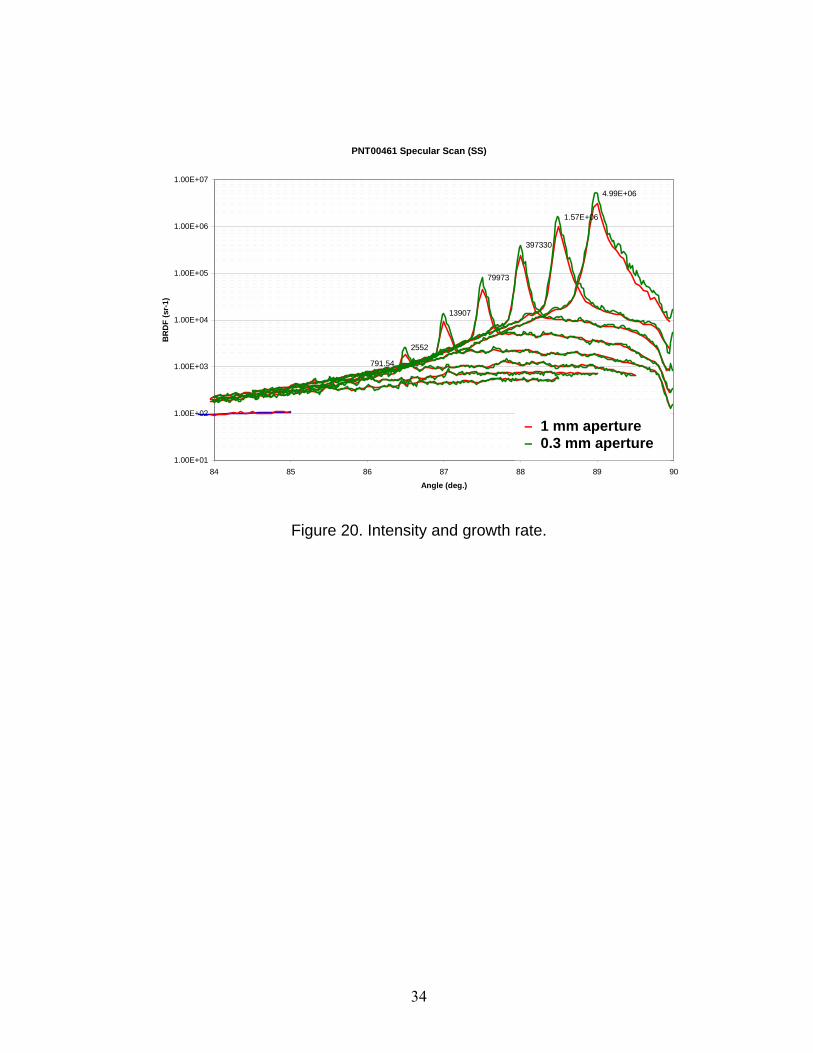
The intensity of the specular component was also measured in order to
determine the rise or growth of this effect as shown in Figure 20. The results
are summarized in Table 7 where the peak intensity at onset refers to the
intensity of the specular component and the base intensity at onset refers to
the intensity of the diffuse or incoherent component.
33
34
PNT00461 Specular Scan (SS)
791.54
2552
13907
79973
397330
1.57E+06
4.99E+06
1.00E+04
1.00E+05
1.00E+06
1.00E+07
88 89 90
BR
DF
(sr-
1)
1.00E+01
1.00E+02
1.00E+03
84 85 86 87
Angle (deg.)
Figure 20. Intensity and growth rate.
– 1 mm aperture – 0.3 mm aperture

35
Table 7. Onset of specular reflection using BRDF.
The intensity growth rate was similar at each roughness value. A
smaller particle size/smoother surface has a greater intensity at the onset
which was expected. Furthermore, no polarization effects were observed.
The onset angle specified for the s- polarization state is equal to that of the p-
polarization for the samples studied. Multiple scatter events occurring at the
surface attribute to this effect.
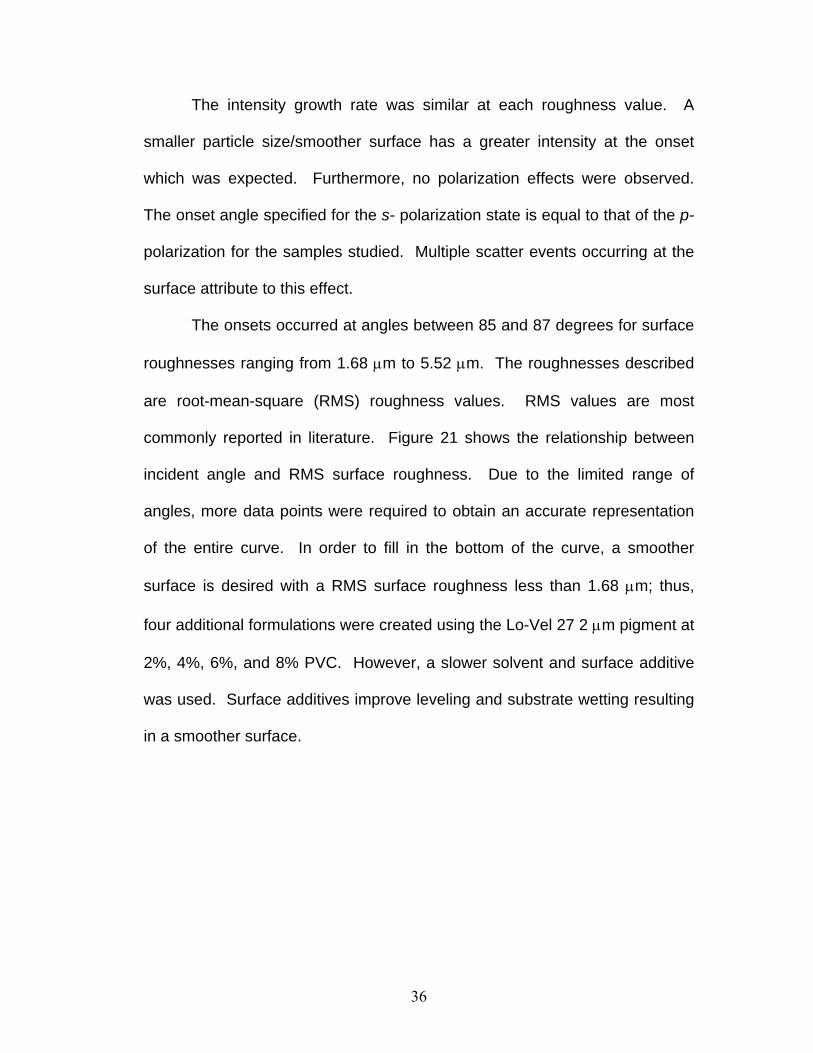
The onsets occurred at angles between 85 and 87 degrees for surface
roughnesses ranging from 1.68 μm to 5.52 μm. The roughnesses described
are root-mean-square (RMS) roughness values. RMS values are most
commonly reported in literature. Figure 21 shows the relationship between
incident angle and RMS surface roughness. Due to the limited range of
angles, more data points were required to obtain an accurate representation
of the entire curve. In order to fill in the bottom of the curve, a smoother
surface is desired with a RMS surface roughness less than 1.68 μm; thus,
four additional formulations were created using the Lo-Vel 27 2 μm pigment at
2%, 4%, 6%, and 8% PVC. However, a slower solvent and surface additive
was used. Surface additives improve leveling and substrate wetting resulting
in a smoother surface.
36

37
Table 8 describes the experiment variables for the additional
formulations.
Table 8. Additional formulation descriptions.
Factor 1
Factor 2
Factor 3
27 2% 2 passes 27 4% 2 passes 27 6% 2 passes 27 8% 2 passes
38
50.0
55.0
60.0
65.0
70.0
75.0
80.0
85.0
90.0
0 1 2 3 4 5 6
RMS roughness, Rq (μm)
Ons
et a
ngle
(deg
.)
■ Lo-Vel HSF (10μm)▲ Lo-Vel 27 (2 μm)
Figure 21. Effects of surface roughness and incident angle using initial set of 8 panels.
39
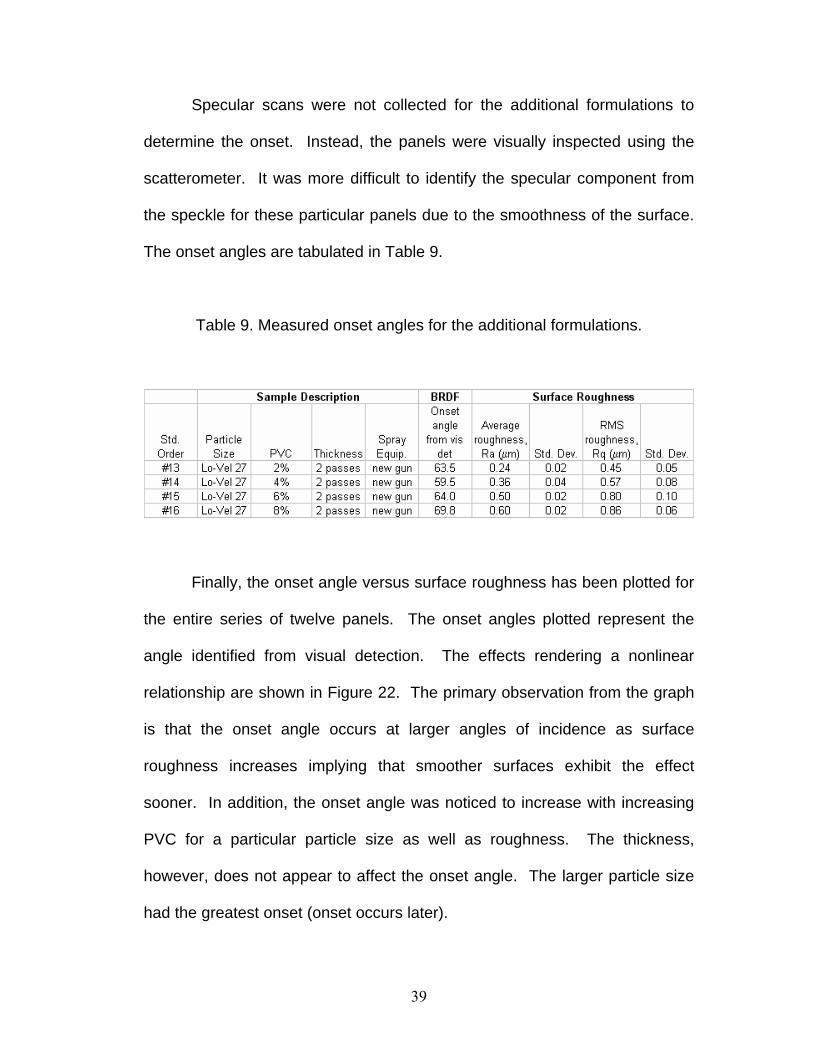
Finally, the onset angle versus surface roughness has been plotted for
the entire series of twelve panels. The onset angles plotted represent the
angle identified from visual detection. The effects rendering a nonlinear
relationship are shown in Figure 22. The primary observation from the graph
is that the onset angle occurs at larger angles of incidence as surface
roughness increases implying that smoother surfaces exhibit the effect
sooner. In addition, the onset angle was noticed to increase with increasing
PVC for a particular particle size as well as roughness. The thickness,
however, does not appear to affect the onset angle. The larger particle size
had the greatest onset (onset occurs later).
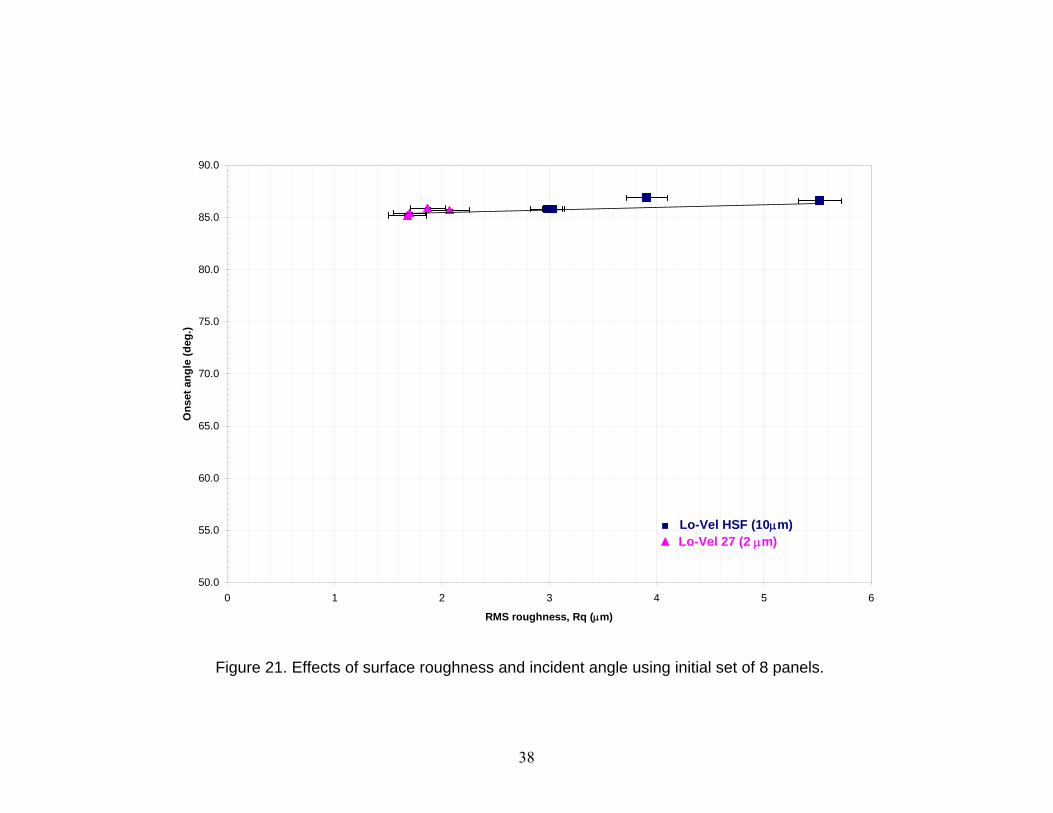
Specular scans were not collected for the additional formulations to
determine the onset. Instead, the panels were visually inspected using the
scatterometer. It was more difficult to identify the specular component from
the speckle for these particular panels due to the smoothness of the surface.
The onset angles are tabulated in Table 9.
Table 9. Measured onset angles for the additional formulations.
40
0.0
5.0
10.0
15.0
20.0
25.0
30.0
35.0
40.0
45.0
50.0
55.0
60.0
65.0
70.0
75.0
80.0
85.0
90.0
95.0
100.0
0 1 2 3 4 5 6
RMS roughness, Rq (μm)
Ons
et a
ngle
(deg
.)
■ Lo-Vel HSF (10μm)▲ Lo-Vel 27 (2 μm) ♦ Lo-Vel 27 (2 μm) with Dowanol
RMS roughness less than incidentwavlength (0.633 μm)
Figure 22. Effects of surface roughness and incident angle.
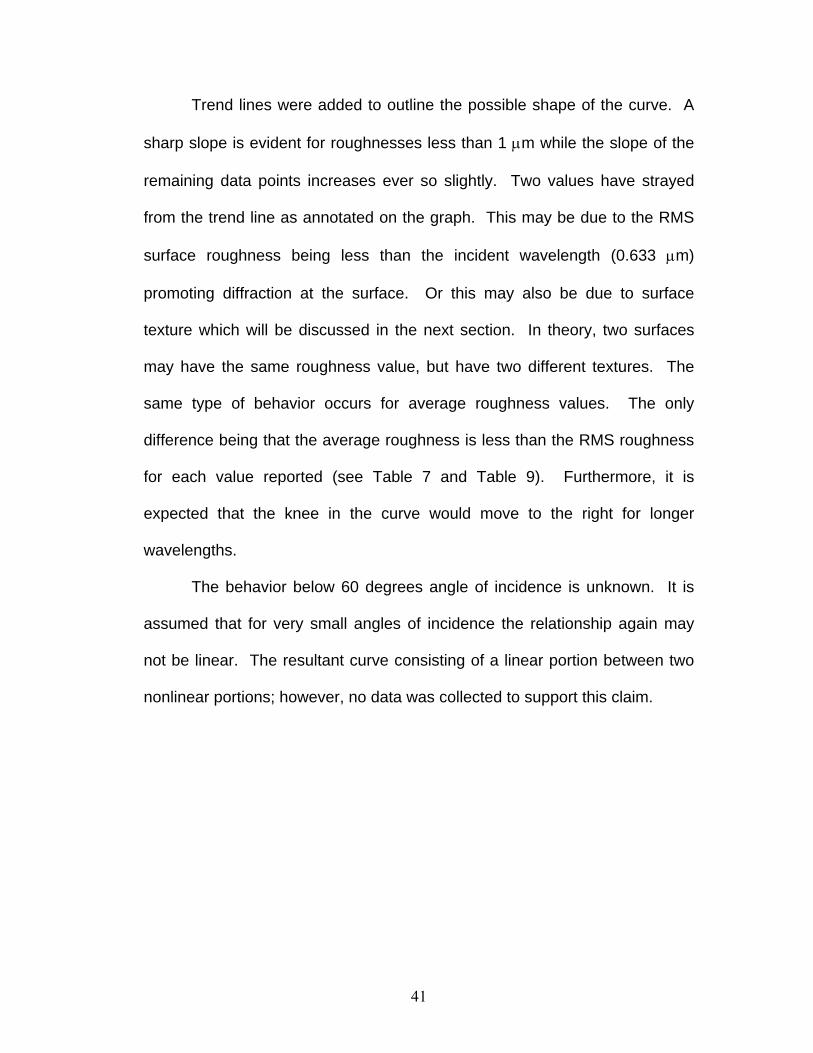
Trend lines were added to outline the possible shape of the curve. A
sharp slope is evident for roughnesses less than 1 μm while the slope of the
remaining data points increases ever so slightly. Two values have strayed
from the trend line as annotated on the graph. This may be due to the RMS
surface roughness being less than the incident wavelength (0.633 μm)
promoting diffraction at the surface. Or this may also be due to surface
texture which will be discussed in the next section. In theory, two surfaces
may have the same roughness value, but have two different textures. The
same type of behavior occurs for average roughness values. The only
difference being that the average roughness is less than the RMS roughness
for each value reported (see Table 7 and Table 9). Furthermore, it is
expected that the knee in the curve would move to the right for longer
wavelengths.
The behavior below 60 degrees angle of incidence is unknown. It is
assumed that for very small angles of incidence the relationship again may
not be linear. The resultant curve consisting of a linear portion between two
nonlinear portions; however, no data was collected to support this claim.
41

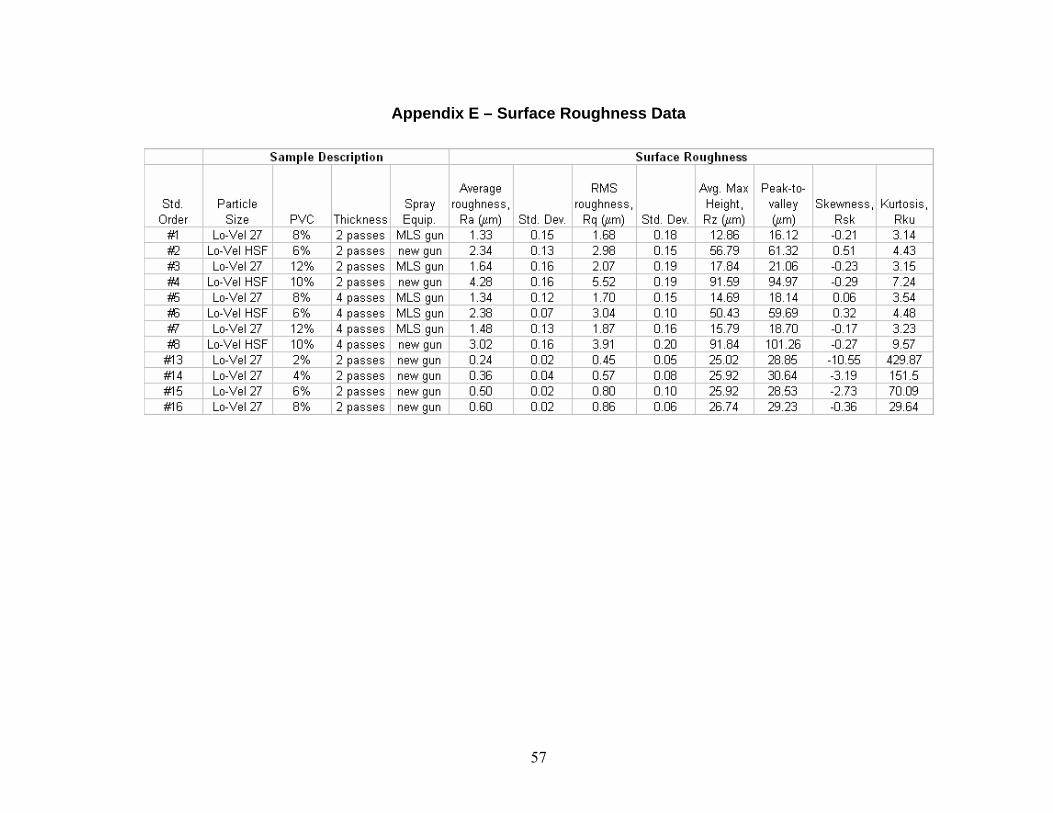
Effects of Various Surface Roughness Parameters
The various surface parameters measured using the Wyko
interferometer are listed below.
Average roughness, Ra
RMS roughness, Rq
Avg. max height, Rz
Peak-to-valley, Rt
Skewness, Rsk
Kurtosis, Rku
Autocovariance (t)
These parameters are used to describe the surface. For example, a
negative skewness indicates the predominance of valleys whereas a positive
skewness is present for surfaces with peaks. Kurtosis is used to explain the
texture of the surface. A spiky surface area will have a high Rku > 3, bumpy
surfaces have a low Rku < 3, and perfectly random surface Rku = 3. And
covariance can be used to further elaborate on the randomness of a surface.
A random surface generally has low correlation.
Figures 23, 24, and 25 are representative of the different surfaces
using Lo-Vel 27 with Dowanol, Lo-Vel HSF, and Lo-Vel 27. A different
surface texture was observed for each set of process conditions. Two of the
surfaces are uniformly spiky while the remaining surface has an inherent
waviness. This may be due to the change of spray equipment used. More
42

spikes, not necessarily larger spikes, are observed on the surface using the
smaller particle size when comparing Figure 23 and Figure 24.
Figure 23. Three-dimensional topography of surface with Rq = 0.80 μm
(Lo-Vel 27 with Dowanol, 6% PVC, 2 passes, new gun).
43

Figure 24. Three-dimensional topography of surface with Rq = 5.52 μm
(Lo-Vel HSF, 10% PVC, 2 passes, new gun).
Figure 25. Three-dimensional topography of surface with Rq = 1.70 μm
(Lo-Vel 27, 8% PVC, 4 passes, MLS gun).
44

The covariance was also examined for each set of process conditions.
The covariance is a measure of the correlation properties of the surface’s
roughness and is used to study the relationship between two data sets. If the
surface is periodic the resulting autocovariance will also be periodic. A
surface with periodic features shows higher correlation. The following figures
represent the autocovariance function for each set of process conditions.
Figure 26. Autocovariance function of surface with Rq = 0.57 μm (Lo-Vel 27
with Dowanol, 4% PVC, 2 passes, new gun).
45
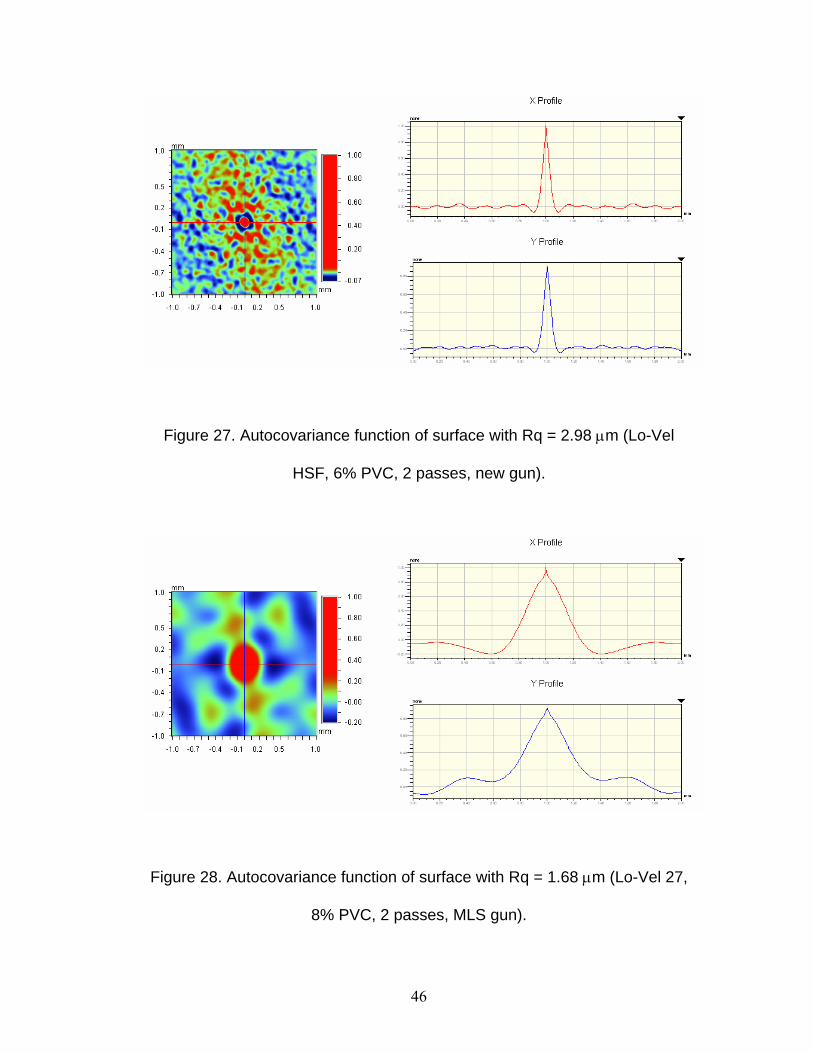
Figure 27. Autocovariance function of surface with Rq = 2.98 μm (Lo-Vel
HSF, 6% PVC, 2 passes, new gun).
Figure 28. Autocovariance function of surface with Rq = 1.68 μm (Lo-Vel 27,
8% PVC, 2 passes, MLS gun).
46

The PVC did not appear to affect the correlation properties of the
rough surfaces obtained using Lo-Vel 27 and Lo-Vel HSF; however, the set of
smoother surfaces using Lo-Vel 27 with Dowanol showed some sensitivity to
PVC. From the autocovariance functions, the larger particle has a more
random surface meaning the surface feature is less likely to repeat itself.
Overall, more correlation was observed at 4 passes versus 2 passes for each
set of processing conditions. This is most likely due to pigment settling that
occurs in thicker coatings. Surface roughness data is reported in Appendix E.
After thorough examination of the surface parameters, no one surface
property contributed solely to the occurrence of the specular component.
47
CHAPTER FIVE
SUMMARY AND CONCLUSION
Various rough surfaces have been characterized using BRDF to reveal
a specular peak in the visible region. Specular peaks were identified for RMS
roughnesses ranging between 1.68 μm and 5.52 μm. The angle at which this
specular component becomes visible changes depending on the surface
roughness, the rougher the surface the greater the angle of incidence. A
combination of surface roughness and randomness of the surface was
determined to contribute to this effect. Surface roughness was perceived to
affect the onset angle whereas randomness was perceived to affect the
intensity of the specular peak.
Camouflage coatings require a gloss less than 5 gloss units at 60
degrees of incidence and less than 9 gloss units at 85 degrees. Generic
coatings meeting the requirement produced this effect at angles greater than
86 degrees. To visually detect an aircraft at grazing angles implies that the
distance between the object and the observer is very large; thus, negating the
requirement to manage reflection at these angles. Furthermore, solar glint is
minimized at these angles because the reflection is concentrated at a narrow
48
viewing angle making visual tracking difficult [19]. So, does the coating
require a gloss less than 9? And could the gloss requirement be increased to
12, for example, to allow specular behavior at grazing angles and improve
durability? Decreasing the PVC by 4%, increases the onset angle only by 1
to 1.5 degrees. An area of concern would then be to understand the effects
of wavelength for a particular surface roughness. A very rough surface that is
not specular to visible light possibly will be to infrared radiation. Further
investigation is required to follow the occurrence of the specular effect at
various wavelengths for a single surface roughness.
The other issue discussed with regards to the gloss requirement is the
gloss measurement itself. The requirements specified for camouflage
coatings lie in the nonlinear portion of the measurement range at 60 degrees
and the behavior is unknown for values less than 10 at 85 degrees. The
results become questionable within these ranges, therefore, suggests that
gloss is not the proper tool for evaluating scatter from camouflage coatings.
However, gloss is an easy and portable measurement technique that can be
used in the field.
Accurate interpretation of the reflectance properties of a material
requires the knowledge of BRDF. It is the width of the BRDF peak that is
affected by the surface roughness and/or gloss as commonly reported in
literature; however, glossmeters measure the intensity of specular reflection
which is associated with the magnitude of the BRDF peak. This may
contribute to the inconsistencies experienced in gloss measurements. Of
49
equal concern is that gloss values may be artificial because of the presence
of this specular effect meaning that the gloss requirement was based on a
measurement value that was over specular. Hence, camouflage coatings are
being over specified by using gloss as the requirement. Perhaps surface
roughness could be used as a requirement. A roughness of at least 0.86 μm
is required to reach angles greater than 70 degrees according to the data
collected.
Ultimately, BRDF should be specified and the measurement should be
obtained at angles associated with certain threat conditions. By using BRDF,
the specular behavior of low gloss coatings was thoroughly examined in the
visible region wherein a specular peak was observed at grazing angles of
incidence. Specular behavior was also observed at 3.39 μm and 10.6 μm in
which the initial occurrence of the specular peak appeared at smaller angles
of incidence and varied as a function of wavelength. This effect has not been
previously documented in literature. The understanding of this behavior will
guide the development of future camouflage coatings. In addition, the
presence of a specular peak in the visible region can be explored to debate
image formation in rough surfaces and may be used to explain the mirages
that are formed when the conditions for the total internal reflection are not
satisfied as described by Tavassoly et. al. [20].
50

Appendix A – Particle Size Distribution Data
51
52
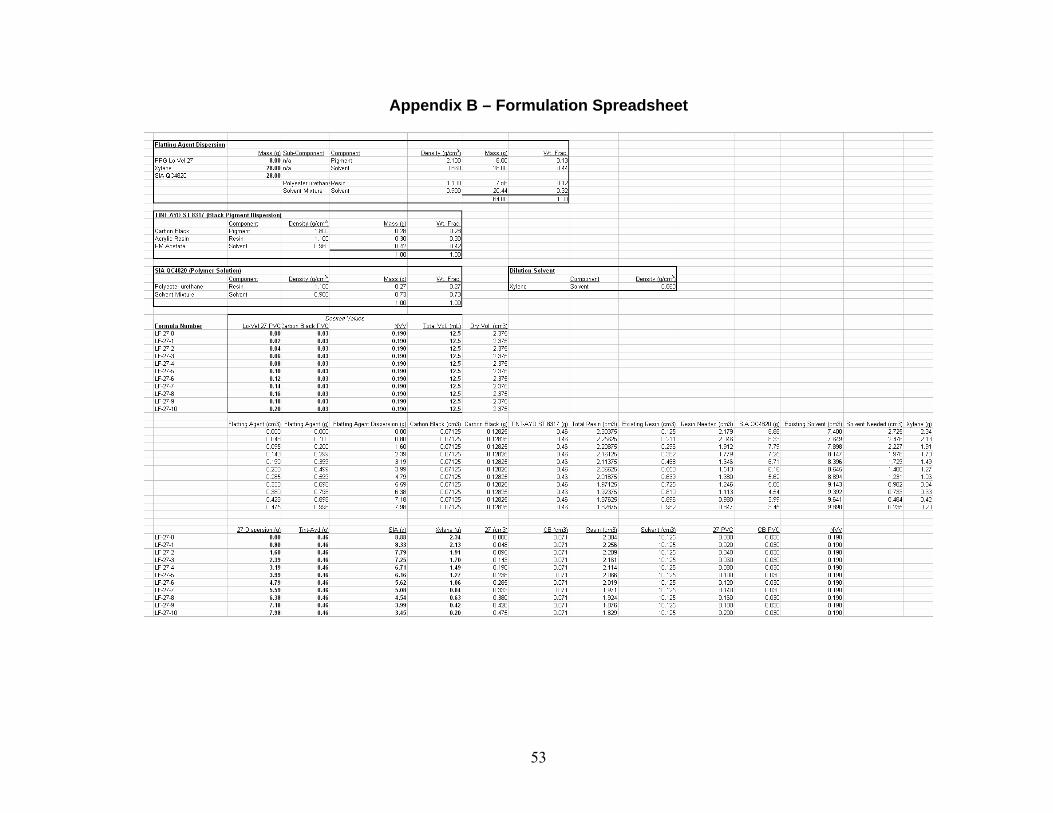
Appendix B – Formulation Spreadsheet
53
54
Appendix C – Gloss Data
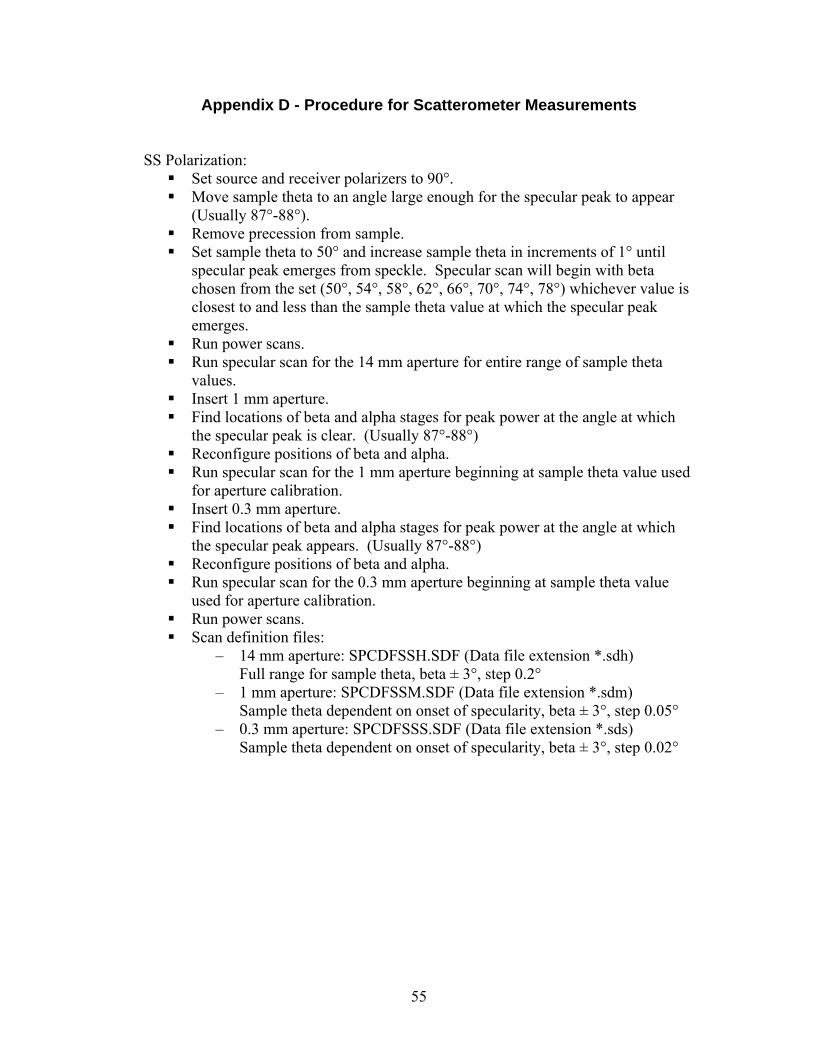
Appendix D - Procedure for Scatterometer Measurements
SS Polarization:
Set source and receiver polarizers to 90°. Move sample theta to an angle large enough for the specular peak to appear
(Usually 87°-88°). Remove precession from sample. Set sample theta to 50° and increase sample theta in increments of 1° until
specular peak emerges from speckle. Specular scan will begin with beta chosen from the set (50°, 54°, 58°, 62°, 66°, 70°, 74°, 78°) whichever value is closest to and less than the sample theta value at which the specular peak emerges.
Run power scans. Run specular scan for the 14 mm aperture for entire range of sample theta
values. Insert 1 mm aperture. Find locations of beta and alpha stages for peak power at the angle at which
the specular peak is clear. (Usually 87°-88°) Reconfigure positions of beta and alpha. Run specular scan for the 1 mm aperture beginning at sample theta value used
for aperture calibration. Insert 0.3 mm aperture. Find locations of beta and alpha stages for peak power at the angle at which
the specular peak appears. (Usually 87°-88°) Reconfigure positions of beta and alpha. Run specular scan for the 0.3 mm aperture beginning at sample theta value
used for aperture calibration. Run power scans. Scan definition files:
– 14 mm aperture: SPCDFSSH.SDF (Data file extension *.sdh) Full range for sample theta, beta ± 3°, step 0.2° – 1 mm aperture: SPCDFSSM.SDF (Data file extension *.sdm) Sample theta dependent on onset of specularity, beta ± 3°, step 0.05° – 0.3 mm aperture: SPCDFSSS.SDF (Data file extension *.sds) Sample theta dependent on onset of specularity, beta ± 3°, step 0.02°
55
56
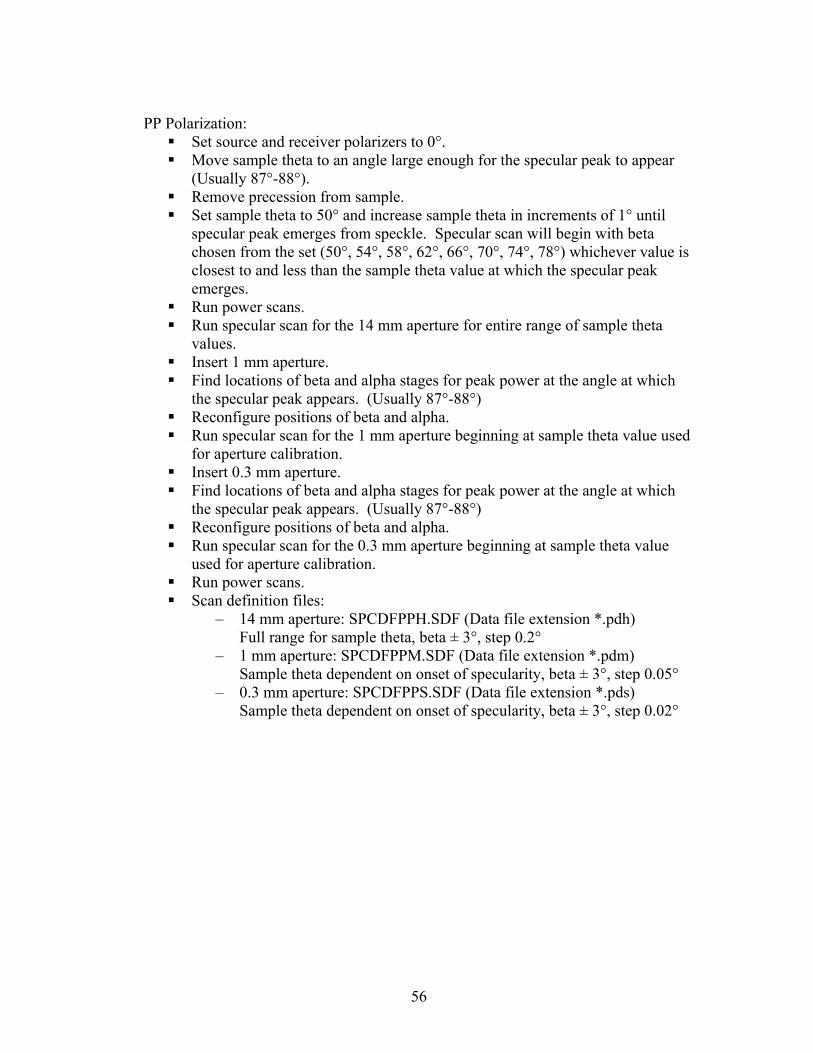
PP Polarization:
Set source and receiver polarizers to 0°. Move sample theta to an angle large enough for the specular peak to appear
(Usually 87°-88°). Remove precession from sample. Set sample theta to 50° and increase sample theta in increments of 1° until
specular peak emerges from speckle. Specular scan will begin with beta chosen from the set (50°, 54°, 58°, 62°, 66°, 70°, 74°, 78°) whichever value is closest to and less than the sample theta value at which the specular peak emerges.
Run power scans. Run specular scan for the 14 mm aperture for entire range of sample theta
values. Insert 1 mm aperture. Find locations of beta and alpha stages for peak power at the angle at which
the specular peak appears. (Usually 87°-88°) Reconfigure positions of beta and alpha. Run specular scan for the 1 mm aperture beginning at sample theta value used
for aperture calibration. Insert 0.3 mm aperture. Find locations of beta and alpha stages for peak power at the angle at which
the specular peak appears. (Usually 87°-88°) Reconfigure positions of beta and alpha. Run specular scan for the 0.3 mm aperture beginning at sample theta value
used for aperture calibration. Run power scans. Scan definition files:
– 14 mm aperture: SPCDFPPH.SDF (Data file extension *.pdh) Full range for sample theta, beta ± 3°, step 0.2° – 1 mm aperture: SPCDFPPM.SDF (Data file extension *.pdm) Sample theta dependent on onset of specularity, beta ± 3°, step 0.05° – 0.3 mm aperture: SPCDFPPS.SDF (Data file extension *.pds) Sample theta dependent on onset of specularity, beta ± 3°, step 0.02°
57
Appendix E – Surface Roughness Data

References
1. Federal Standard 595 Paint Specification – Colors used in government procurement, FED-STD-595 B, 11 January 1994.
2. Z. Wicks, et al. Organic coatings: Science and Technology. 2nd Ed., John
Wiley & Sons, New York (1999). 3. U.S. Military Specification – Polyurethane coatings for aircraft and support
equipment, MIL-PRF-85285C (AS), 30 April 1997. 4. Available at http://profc.udec.cl/~gabriel/tutoriales/rsnote/contents.htm,
accessed August 2006. 5. J. Stover. Optical Scattering: Measurements and Analysis. 2nd Ed., SPIE
Optical Engineering Press, Washington D. C. (1995). 6. Available at http://en.wikipedia.org/wiki/Gloss_(material_appearance),
accessed August 2006. 7. J. Johnson. Advanced Coating Systems for Aircraft Corrosion Protection.
Presentation. SERDP Partners in Environmental Technology. (2001). 8. J. Johnson. Computer Assisted Coatings Design: CPVC Issues. Ph.D.
Thesis, Chemistry Department, North Dakota State University, North Dakota (2000).
9. ASTM Standard D523 – Standard test method for specular gloss, 1999.
http://www.coleparmer.com10. Available at , accessed August 2006. 11. J. Arney, L. Ye, and S. Banach. Interpretation of Gloss Meter
Measurements. submitted to J. Imag. Sci. & Technol. (2005). 12. F. Nicodemus. Reflectance Nonmenclature and Directional Reflectance
and Emissivity. Appl. Opt., vol. 9, pp. 1474-1475 (1970). 13. J. Stover. Optical Scattering: Measurements and Analysis. McGraw-Hill,
New York (1990). 14. Available at http://www.schmitt-ind.com/pdf/scatter1.pdf, accessed August
2006. 15. J. Stover and M. Bernt. Measurement and Analysis of Scatter from Rough
Surfaces. SPIE Stray Rad. in Opt. Syst. III, vol. 2260, pp. 40-49 (1994).
58
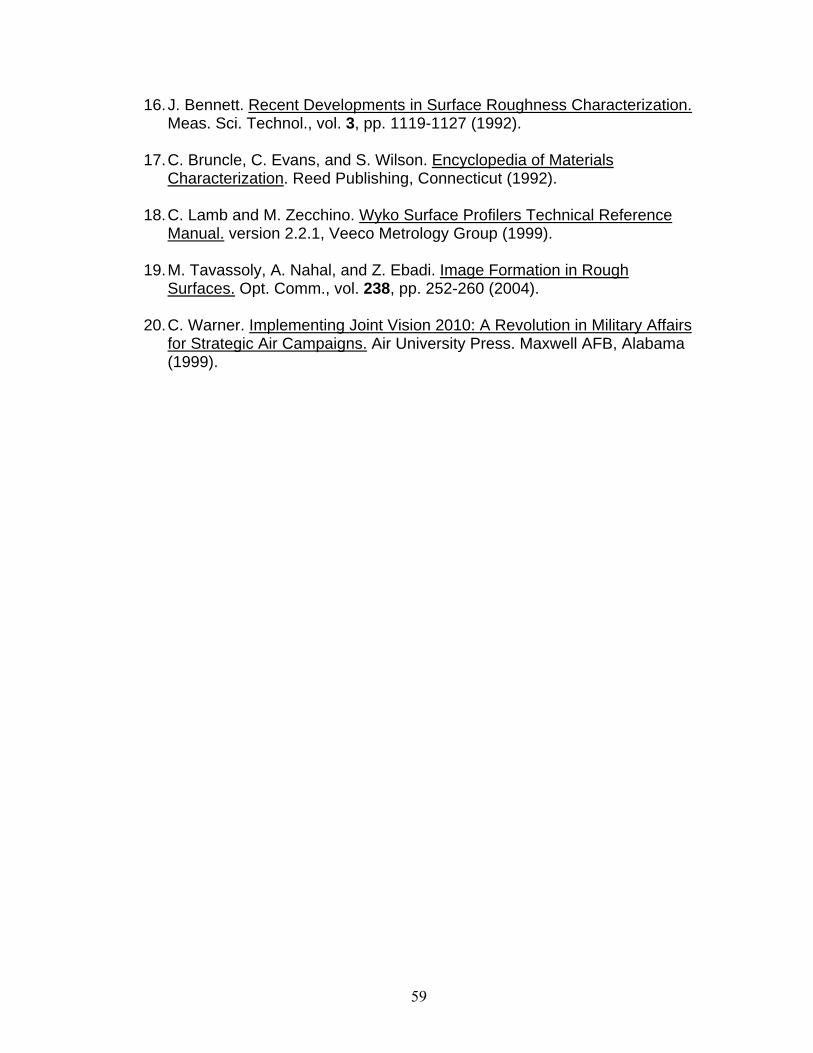
16. J. Bennett. Recent Developments in Surface Roughness Characterization. Meas. Sci. Technol., vol. 3, pp. 1119-1127 (1992).
17. C. Bruncle, C. Evans, and S. Wilson. Encyclopedia of Materials
Characterization. Reed Publishing, Connecticut (1992). 18. C. Lamb and M. Zecchino. Wyko Surface Profilers Technical Reference
Manual. version 2.2.1, Veeco Metrology Group (1999). 19. M. Tavassoly, A. Nahal, and Z. Ebadi. Image Formation in Rough
Surfaces. Opt. Comm., vol. 238, pp. 252-260 (2004). 20. C. Warner. Implementing Joint Vision 2010: A Revolution in Military Affairs
for Strategic Air Campaigns. Air University Press. Maxwell AFB, Alabama (1999).
59

LIST OF ABBREVIATIONS
Pigment Volume Concentration PVC Bidirectional Reflectance Distribution Function BRDF
Probability Density Function PDF Design of Experiments DOE
American Society of Testing and Materials ASTM Methyl Ethyl Ketone MEK
High Volume Low Pressure HVLP Revolutions Per Minute RPM
Scanning Electron Microscopy SEM Atomic Force Microscopy AFM
Vertical Scanning Interferometry VSI Phase Shifting Interferometry PSI
Root Mean Square RMS
60
Recommended