Agriculture and Agribusiness in South Africa:
Prospects and Challenges
John Purchase
Business France
23 February 2015

Content for today…….
• Introduction
• SA Agriculture
• SA Agribusiness
• Prospects & Challenges

Score 0-100, 100=best environment
Best performanceGood performanceModerate performance
Needs improvement
Global Food Security Index
Source: Economist Intelligence Unit/Du Pont
http://foodsecurityindex.eiu.com.

Components of Food Security
FOOD UTILISATION• Nutritional Value• Social value • Food safety
FOOD ACCESS• Affordability• Allocation• Preference
FOOD AVAILABILITY• Production• Distribution
• Exchange/trade
Complex concept:
Difficult to measure
and evaluate.
Stability over TIME
Food Security
Purchasing power
key to access

Demographics…..

FAO Food Price Index
Source: FAO, 2015

FAO Commodity Price indeces
Source: FAO, 2015

• SA GDP growth for 2014: estimate 1,4%
• SA GDP growth for 2015: IMF forecast 2,1 %
• Further weakening of the Rand (Trade deficit, etc.)
• Global GDP: 3.5%
• Growth inhibitors:
- Electricity crisis (Will continue for at least 3 years).
- Labour relations
- Skills factor/Unemployment
- Policy uncertainty
- Poor service delivery
- Transport infrastructural constraints, etc.
• Growth enhancers - various
Economic Outlook for South Africa


An Achilles heel: Unemployment
Source: StatsSA, 2015

BER Business Confidence Index

30
35
40
45
50
55
60
65
70
1st
2n
d3
rd 4th 1st
2n
d3
rd 4th 1st
2n
d3
rd 4th 1st
2n
d3
rd 4th 1st
2n
d3
rd 4th 1st
2n
d3
rd 4th 1st
2n
d3
rd 4th 1st
2n
d3
rd 4th 1st
2n
d3
rd 4th 1st
2n
d3
rd 4th 1st
2n
d3
rd 4th 1st
2n
d3
rd 4th 1st
2n
d3
rd 4th 1st
2n
d3
rd 4th
2001 2002 2003 2004 2005 2006 2007 2008 2009 2010 2011 2012 2013 2014
Agbiz/IDC Agribusiness Confidence Index

High positive correlation between confidence index and performance of sector in the economy -Good leading indicator
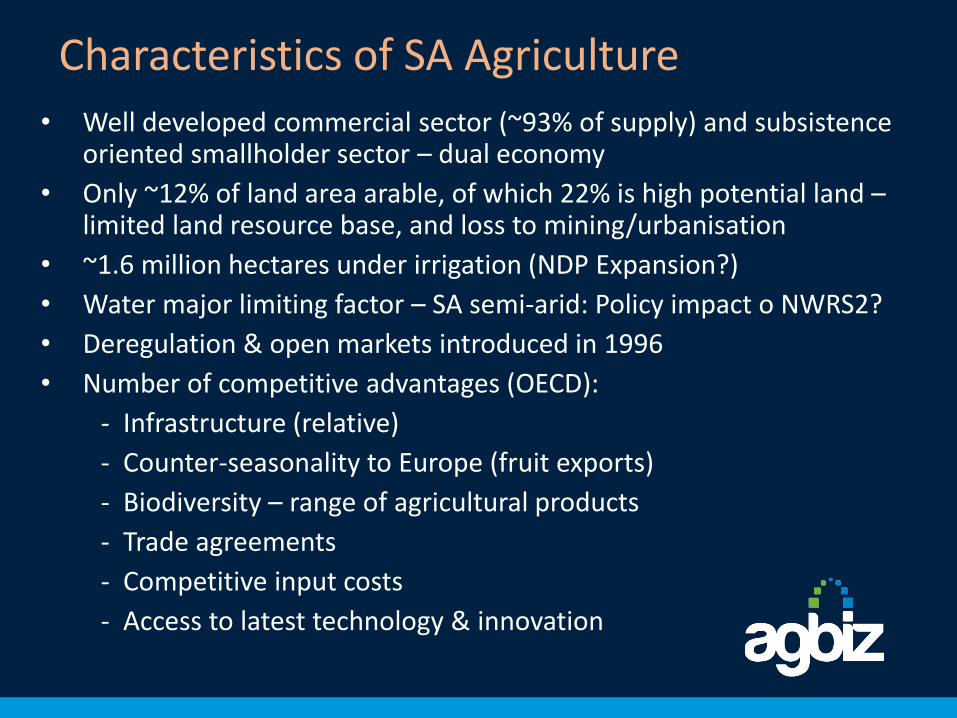
Characteristics of SA Agriculture
• Well developed commercial sector (~93% of supply) and subsistence oriented smallholder sector – dual economy
• Only ~12% of land area arable, of which 22% is high potential land –limited land resource base, and loss to mining/urbanisation
• ~1.6 million hectares under irrigation (NDP Expansion?)
• Water major limiting factor – SA semi-arid: Policy impact o NWRS2?
• Deregulation & open markets introduced in 1996
• Number of competitive advantages (OECD):
- Infrastructure (relative)
- Counter-seasonality to Europe (fruit exports)
- Biodiversity – range of agricultural products
- Trade agreements
- Competitive input costs
- Access to latest technology & innovation
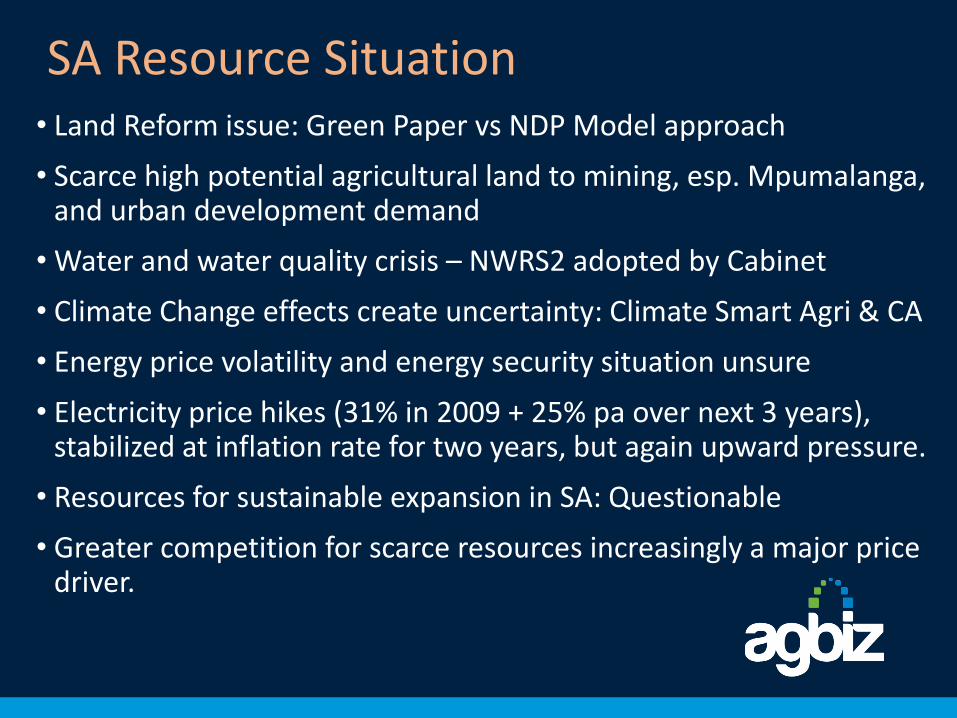
SA Resource Situation• Land Reform issue: Green Paper vs NDP Model approach
• Scarce high potential agricultural land to mining, esp. Mpumalanga, and urban development demand
• Water and water quality crisis – NWRS2 adopted by Cabinet
• Climate Change effects create uncertainty: Climate Smart Agri & CA
• Energy price volatility and energy security situation unsure
• Electricity price hikes (31% in 2009 + 25% pa over next 3 years), stabilized at inflation rate for two years, but again upward pressure.
• Resources for sustainable expansion in SA: Questionable
• Greater competition for scarce resources increasingly a major price driver.

Contribution of Primary Agriculture to GDP(Source: StatsSA)
%
2
3
4
5
94 95 96 97 98 99 00 01 02 03 04 05 06 07 08 09 10 11 12 13
Source: StatsSA
Graph: Agbiz
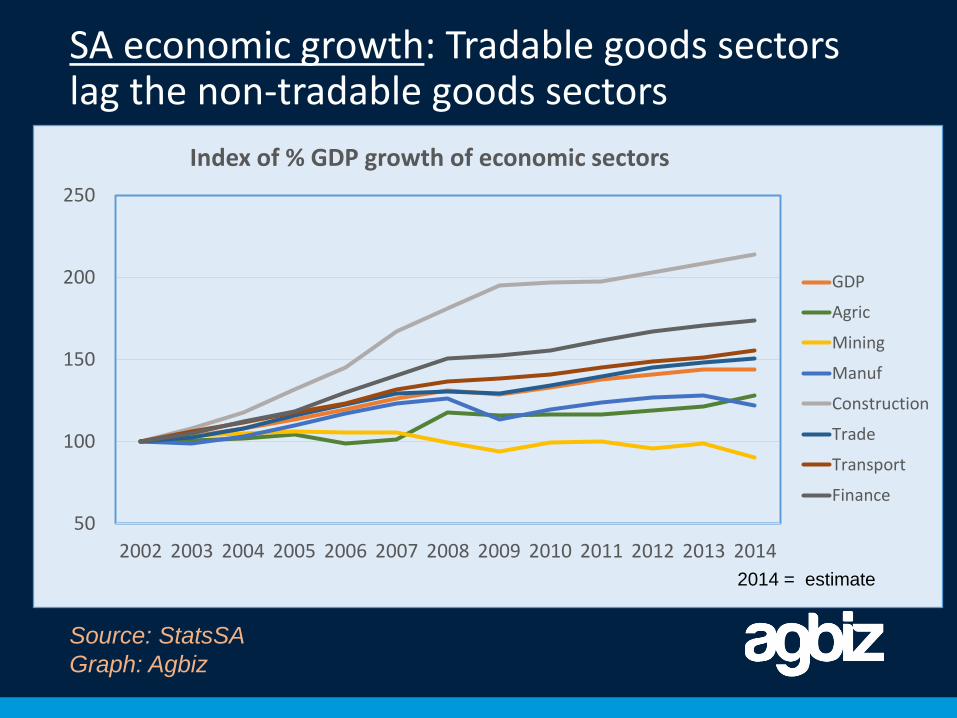
SA economic growth: Tradable goods sectors lag the non-tradable goods sectors
Source: StatsSA
Graph: Agbiz
50
100
150
200
250
2002 2003 2004 2005 2006 2007 2008 2009 2010 2011 2012 2013 2014
Index of % GDP growth of economic sectors
GDP
Agric
Mining
Manuf
Construction
Trade
Transport
Finance
2014 = estimate

South AfricaGhana
Tanzania
Source: UNIDO, 2012

Germany: The Melander family of BargteheideFood expenditure for one week: $500.07
Source: Peter Menzel www.menzelphoto.com
Hungry Planet: What the World Eats

USA: The Revis family of North CarolinaFood expenditure for one week $341.98
Source: Peter Menzel www.menzelphoto.com
Hungry Planet: What the World Eats

Egypt: The Ahmed family of CairoFood expenditure for one week: $68.53
Source: Peter Menzel www.menzelphoto.com
Hungry Planet: What the World Eats

Chad: The Aboubakar family of Breidjing CampFood expenditure for one week: $1.23
Source: Peter Menzel www.menzelphoto.com
Hungry Planet: What the World Eats

Inflation
Source: AMT, Feb 2015

Exchange rate
Source: AMT, Dec 2014
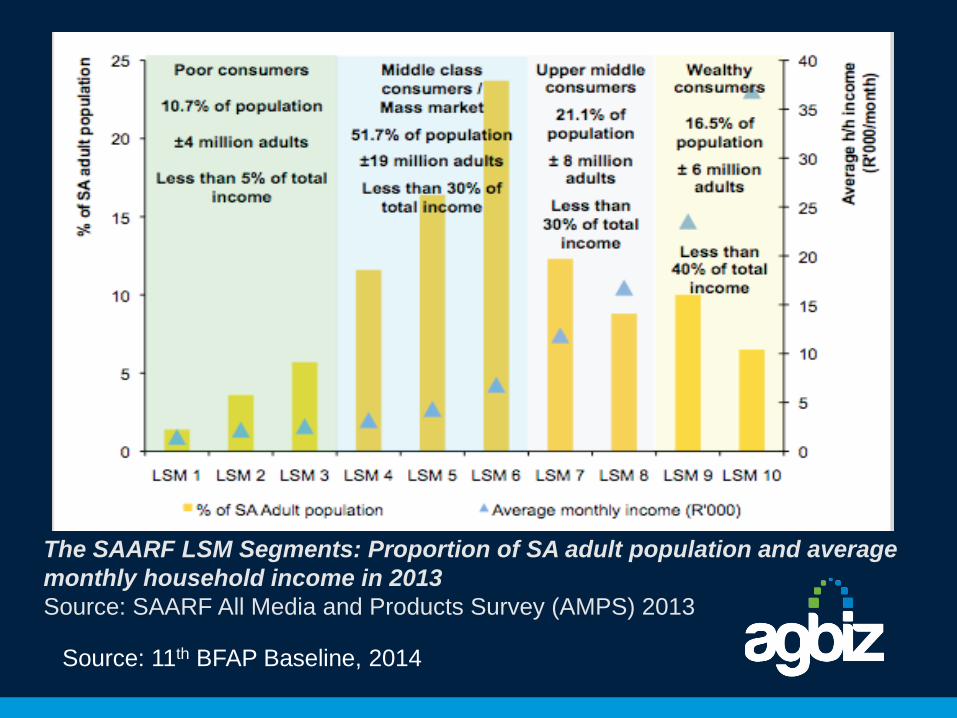
The SAARF LSM Segments: Proportion of SA adult population and average
monthly household income in 2013
Source: SAARF All Media and Products Survey (AMPS) 2013
Source: 11th BFAP Baseline, 2014

Figure 13.2: LSM class mobility: All adults for the period 2004 to 2013
Source: SAARF All Media and Products Surveys (AMPS) 2004 to 2013
Source: 11th BFAP Baseline, 2014

Food Consumption: Growth 2012 to 2020
Source: BFAP, 2012

Content for today…….
• Introduction
• SA Agriculture
• SA Agribusiness
• Prospects & Challenges

Commercial Agric Census 2007
Indicator 1993 2002 2007
Farming units 57 980 45 818 39 982
Paid employees 1 093 265 940 820 796 806
Ratio between Farming Debt and GFI (%)
78,0 57,9 46,6
Source: StatsSA

Performance of Sector
0
20000000
40000000
60000000
80000000
100000000
120000000
140000000
160000000
180000000
200000000
2001/02 2002/03 2003/04 2004/05 2005/06 2006/07 2007/08 2008/09 2009/10 2010/11 2011/12 2012/13
Ra
nd
X
1 0
00
00
0
Seasons
Gross and Nett Farming Income
Gross Farm Income Nett Farm Income
Source: DAFF, 2014
Graph: Agbiz.

Performance of SectorGross Value of Production in R million
0
10000
20000
30000
40000
50000
60000
70000
80000
90000
2001/02 2002/03 2003/04 2004/05 2005/06 2006/07 2007/08 2008/09 2009/10 2010/11 2011/12 2012/13
Field Crops Animal Production Horticulture
R'm
illio
n
Source: DAFF, 2014
Graph: Agbiz.

Real gross income of the agricultural sector
Source: 11th BFAP Baseline, 2014

Source: 11th BFAP Baseline, 2014
Real intermediate input expenditure

Gross Capital Formation and Net Farm Income: 1971-2012
Graph: BFAP, 2014
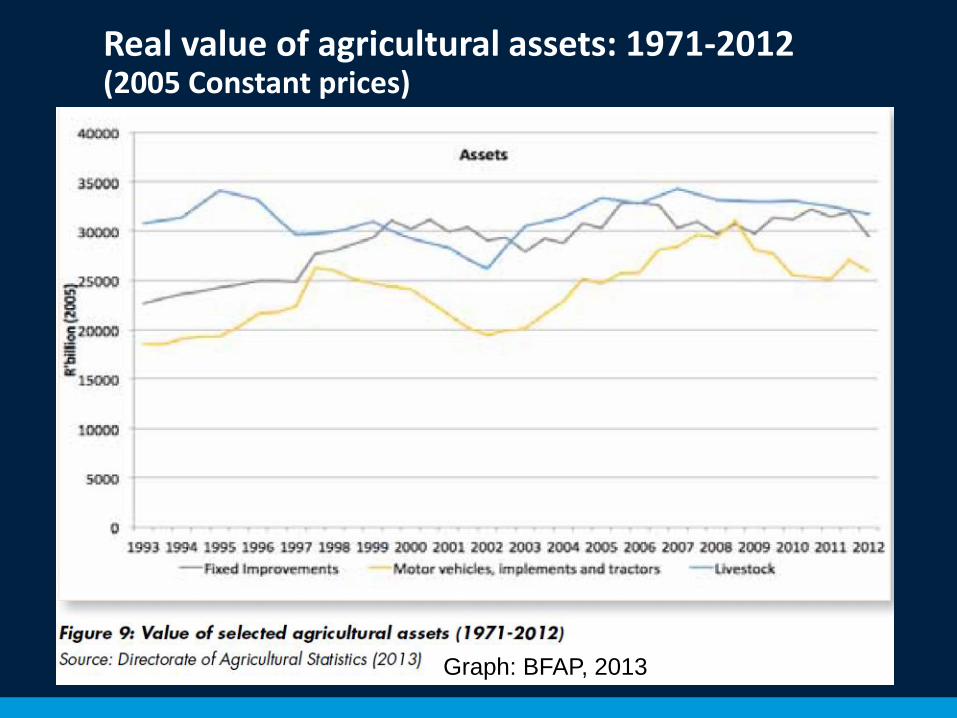
Real value of agricultural assets: 1971-2012 (2005 Constant prices)
Graph: BFAP, 2013
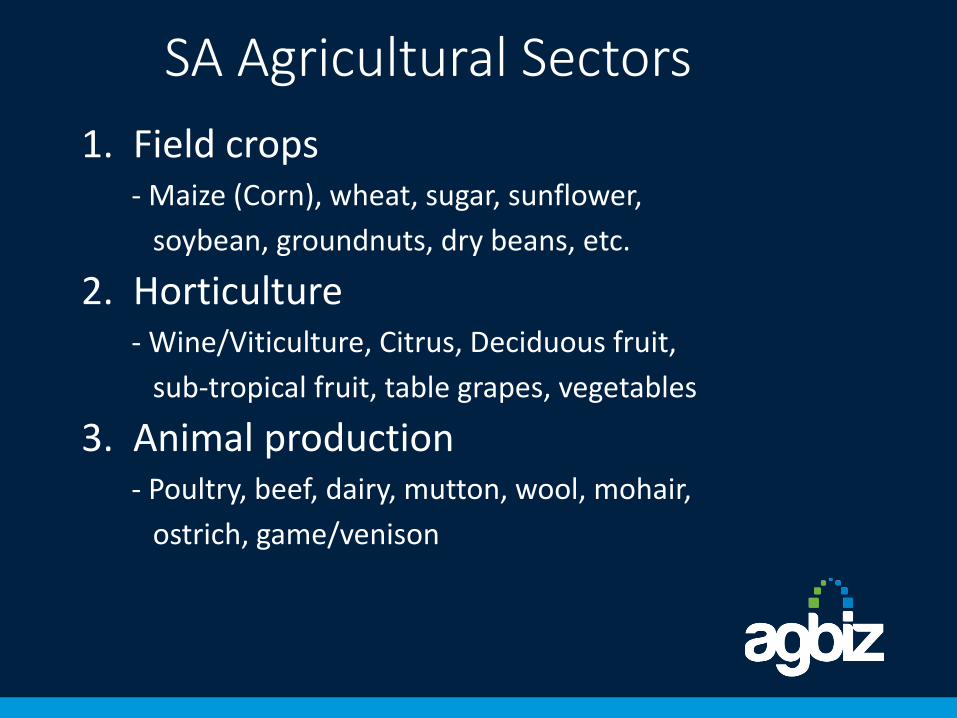
SA Agricultural Sectors
1. Field crops- Maize (Corn), wheat, sugar, sunflower,
soybean, groundnuts, dry beans, etc.
2. Horticulture- Wine/Viticulture, Citrus, Deciduous fruit,
sub-tropical fruit, table grapes, vegetables
3. Animal production- Poultry, beef, dairy, mutton, wool, mohair,
ostrich, game/venison

Real gross value of field crops
Source: 11th BFAP Baseline, 2014
Source: 11th BFAP Baseline, 2014
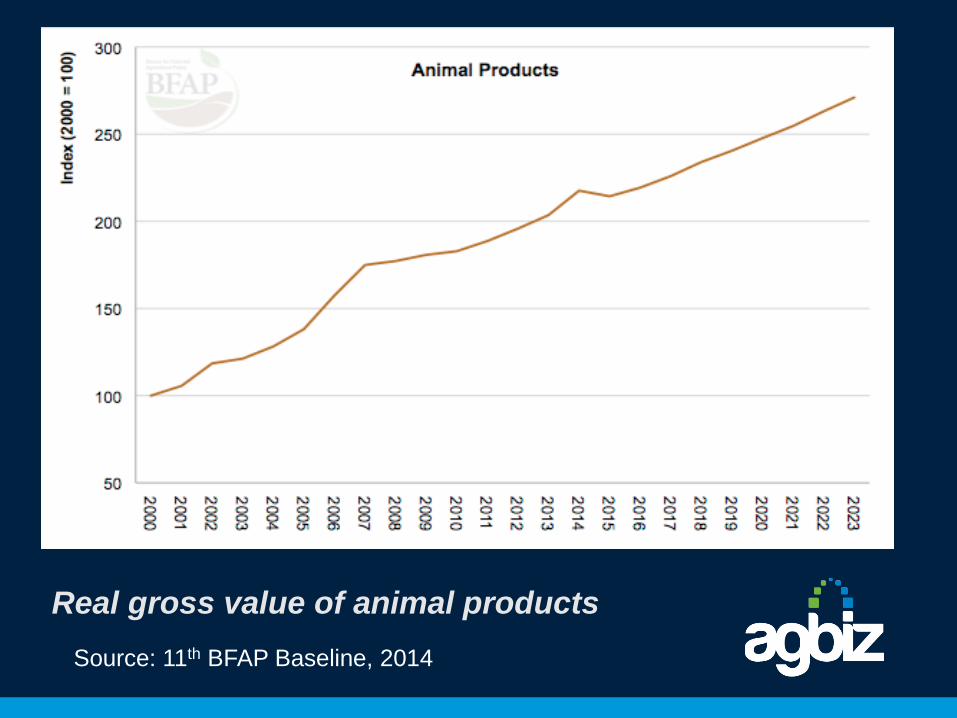
Real gross value of animal products

Source: 11th BFAP Baseline, 2014
Real gross income of citrus, table grapes, apples and pears

Corn11% Citrus
4%
Deciduous fruit7%
Vegetables6%
Potatoes3%
Poultry18%Sugar cane
4%
Eggs5%
Cattle11%
Sheep3%
Fresh milk7%
Wine3%
Others18%
Gross Value by Commodities

Real net farm income
Source: 11th BFAP Baseline, 2014

Field crops
• Maize – major staple, net exports, ~85% GM
• Wheat – also staple food, net imports (~40% of demand)
• Sorghum – declining significance (Biofuel designated?)
• Soya – growing importance, cake imports, ~90% GM
• Sunflower – growing importance, S/D in balance
• Groundnuts – net exports, but declining
• Dry beans – net imports, mostly from China

Source: 11th BFAP Baseline, 2014
Source: 11th BFAP Baseline, 2014

Source: Grain SA website, 18 February 2015

Source: Grain SA website, 18 February 2015
1 300
1 500
1 700
1 900
2 100
2 300
2 500
2 700
2 900
3 100
3 300
3 500
3 700
3 900
4 100
4 300
1-O
ct-
12
21
-Oct-
12
10
-Nov-1
2
30
-Nov-1
2
20
-Dec-1
2
9-J
an-1
3
29
-Jan
-13
18
-Fe
b-1
3
10
-Mar-
13
30
-Mar-
13
19
-Apr-
13
9-M
ay-1
3
29
-May-1
3
18
-Jun
-13
8-J
ul-1
3
28
-Jul-
13
17
-Aug
-13
6-S
ep-1
3
26
-Sep
-13
16
-Oct-
13
5-N
ov-1
3
25
-Nov-1
3
15
-Dec-1
3
4-J
an-1
4
24
-Jan
-14
13
-Fe
b-1
4
5-M
ar-
14
25
-Mar-
14
14
-Apr-
14
4-M
ay-1
4
24
-May-1
4
13
-Jun
-14
3-J
ul-1
4
23
-Jul-
14
12
-Aug
-14
1-S
ep-1
4
21
-Sep
-14
11
-Oct-
14
31
-Oct-
14
20
-Nov-1
4
10
-Dec-1
4
30
-Dec-1
4
19
-Jan
-15
8-F
eb
-15
28
-Fe
b-1
5
R/ton
Datum/Date
PRYSE VAN GEELMIELIES GELEWER IN RANDFONTEINPRICES OF YELLOW MAIZE DELIVERED IN RANDFONTEIN
ARG Invoerpariteit+ / ARG Import
VSA Invoerpariteit / USA Import
VSA Uitvoerpariteit / USA Export
Safex YM

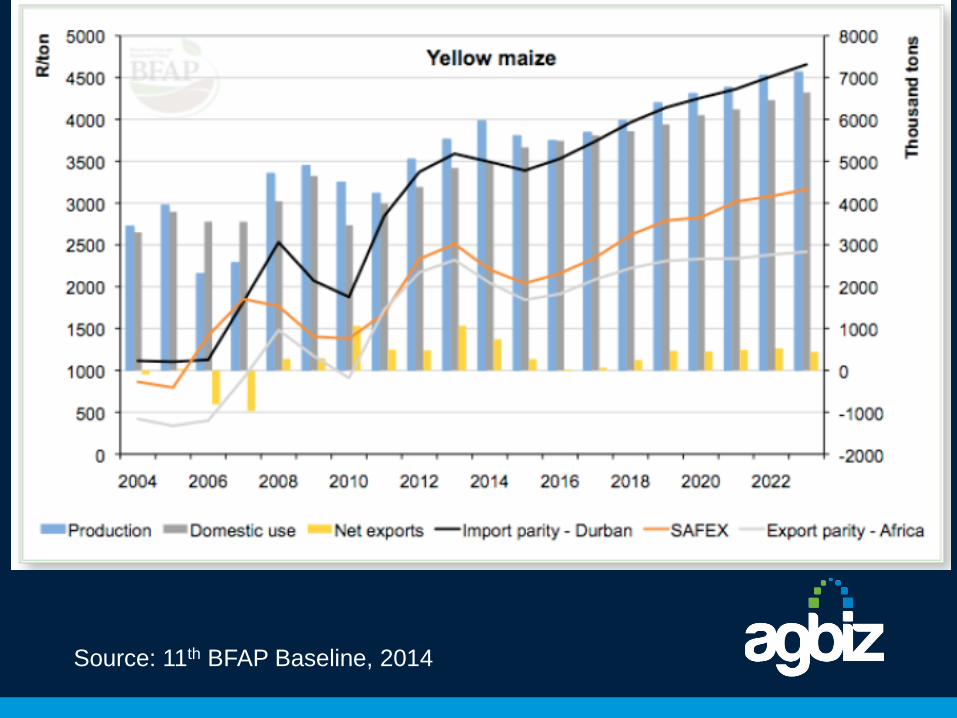
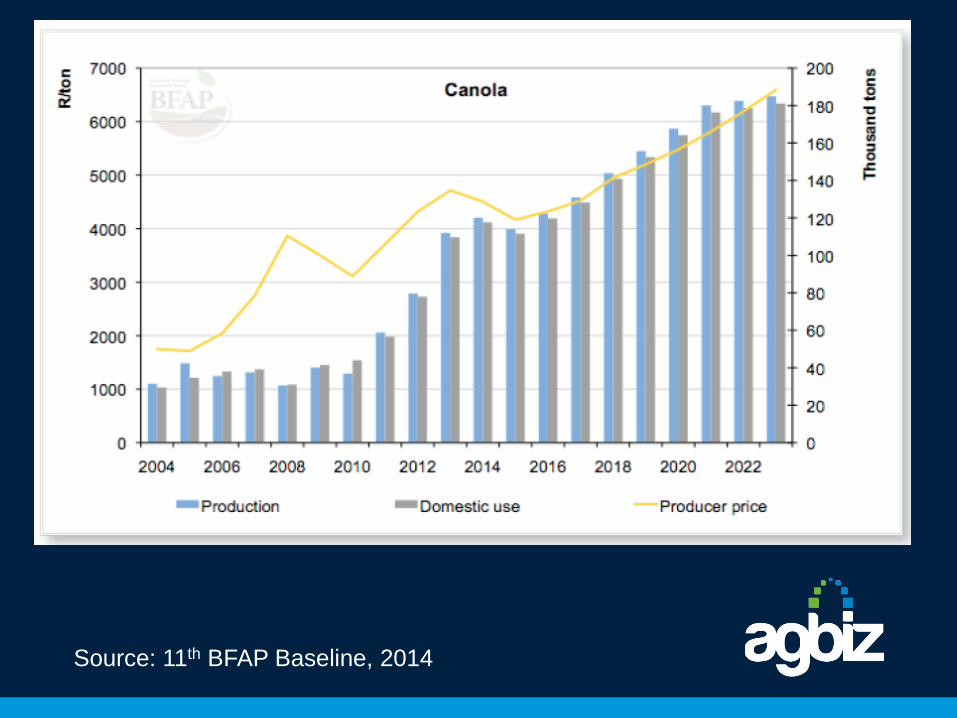
Source: 11th BFAP Baseline, 2014

Source: 11th BFAP Baseline, 2014

Source: 11th BFAP Baseline, 2014

CRUSHING CAPACITY 2012
• Wilmar Continental 192 000
• Majesty 156 000
• Gauteng 108 000
• Nedan 96 000
• Drak 48 000
• TOTAL 600 000
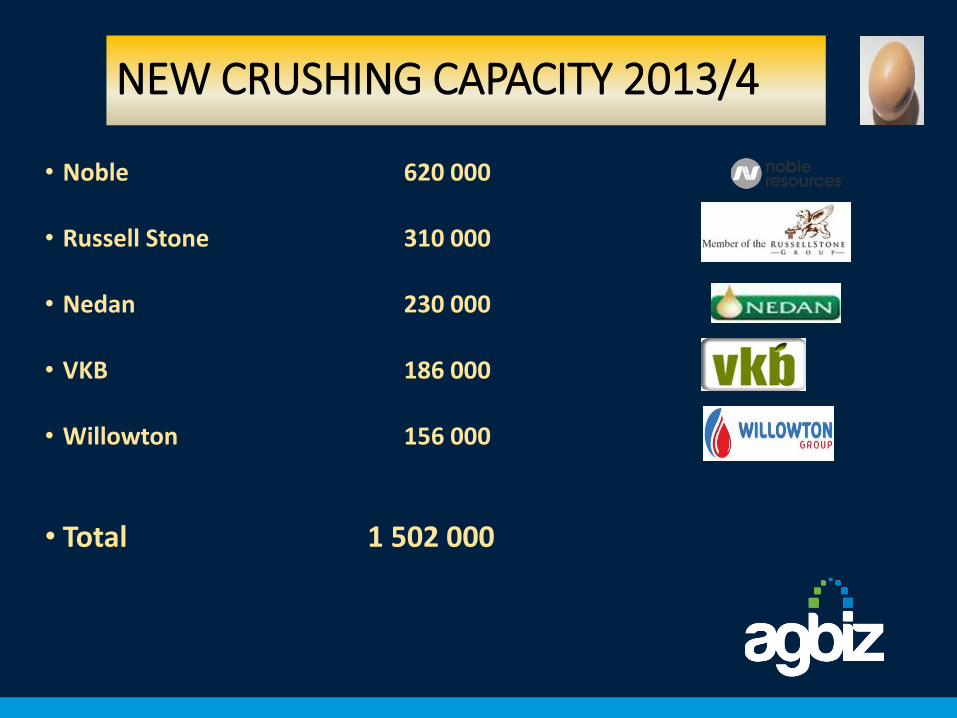
NEW CRUSHING CAPACITY 2013/4
• Noble 620 000
• Russell Stone 310 000
• Nedan 230 000
• VKB 186 000
• Willowton 156 000
• Total 1 502 000

TOTAL CRUSHING CAPACITY 2014
• Noble 620 000
• Nedan 326 000
• Russell Stone 310 000
• Wilmar Continental 192 000
• VKB 186 000
• Willowton 156 000
• Majesty 156 000
• Gauteng 108 000
• Drak 48 000
• Total 2 102 000
Source: 11th BFAP Baseline, 2014

Horticulture
•Viticulture & Wine – major export industry
•Citrus – SA’s biggest ag-export (~R7bn), growing but….
•Deciduous fruit – major net exports
•Table grapes – major net exports
•Sub-tropical fruit – net exports
•Vegetables – S/D balance, some imports/exports

Horticulture2010 2011 2012
Gross income from horticulture (R bn) R31.39 R31.22 R40.18
Exports (2012):
Citrus: R7.068 billionWine: R5.494 billionTable grapes: R3.395 billionApples & Pears: R3.337 billion

Source: 11th BFAP Baseline, 2014

Source: 11th BFAP Baseline, 2014

Source: 11th BFAP Baseline, 2014

Source: 11th BFAP Baseline, 2014

Source: 11th BFAP Baseline, 2014

Animal Production
2010 2011 2012
Gross income from animals (Rbn) R58.4 R61.0 R76.3
1. Poultry
2. Beef
3. Mutton & Wool
4. Pork
5. Dairy
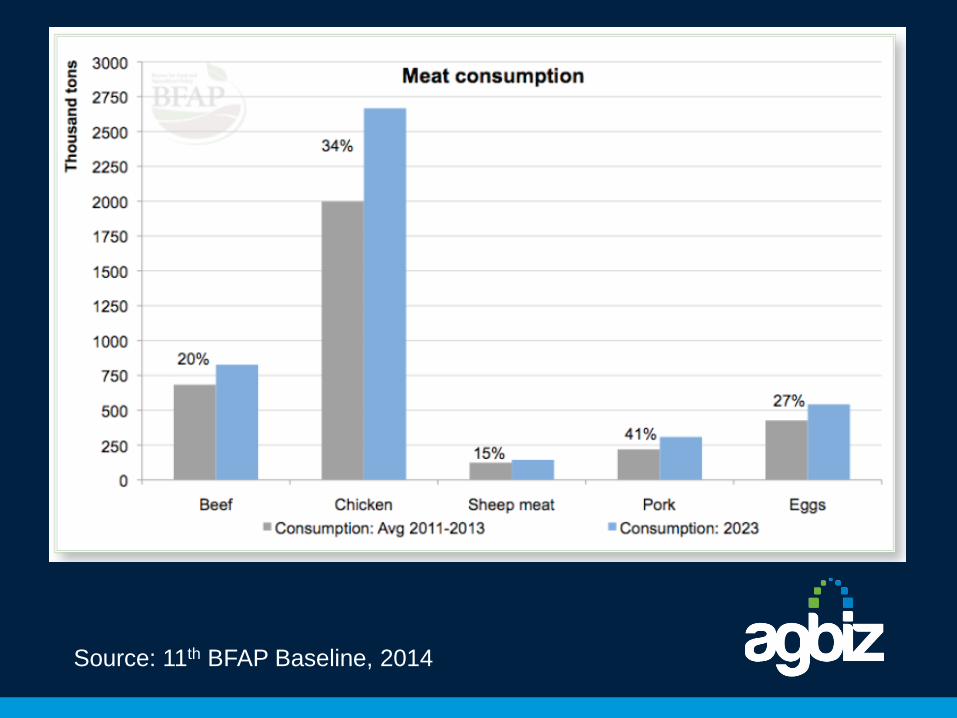
Source: 11th BFAP Baseline, 2014

Source: 11th BFAP Baseline, 2014

Source: 11th BFAP Baseline, 2014

Source: 11th BFAP Baseline, 2014

Source: 11th BFAP Baseline, 2014
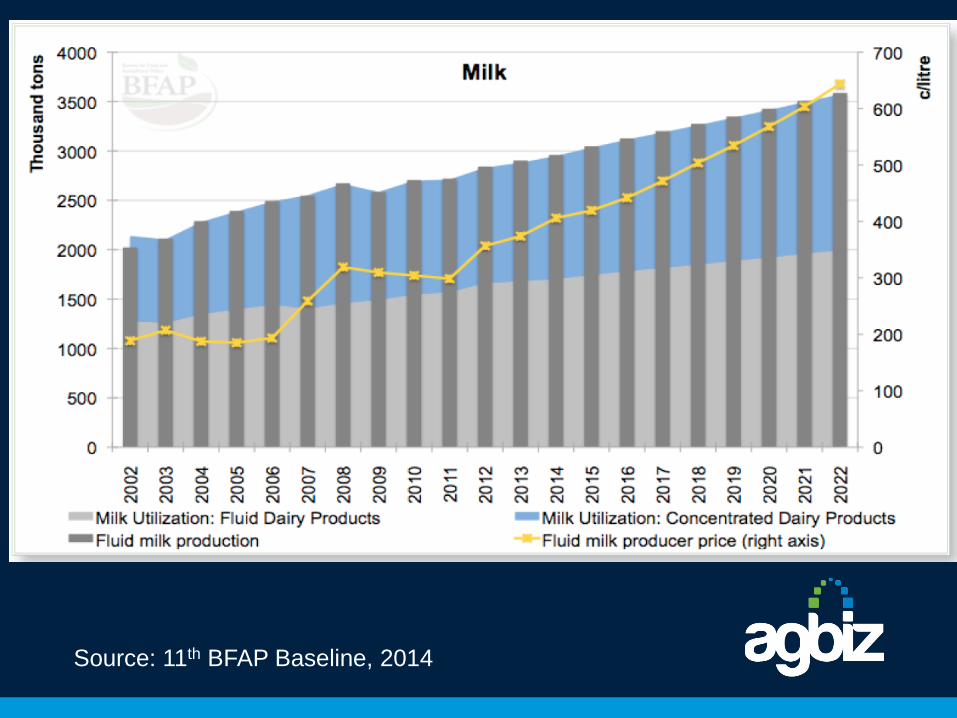
Source: 11th BFAP Baseline, 2014

Content for today….• Introduction
• SA Agriculture
• SA Agribusiness
• Prospects & Challenges
SA Agribusiness•Strong input sector: Seed, fertilizer, crop protection and
veterinary chemicals, animal feed, packaging, agricultural machinery, fuel, etc. (Technology-based)
•Financial sector: Major banks, DFI’s, insurance companies, auditors, agribusinesses, etc.,
•Storage, trade and agro-logistics
•Agro-processing and packaging
•Retail Sector

Real agriculture debt
Source: 11th BFAP Baseline, 2014
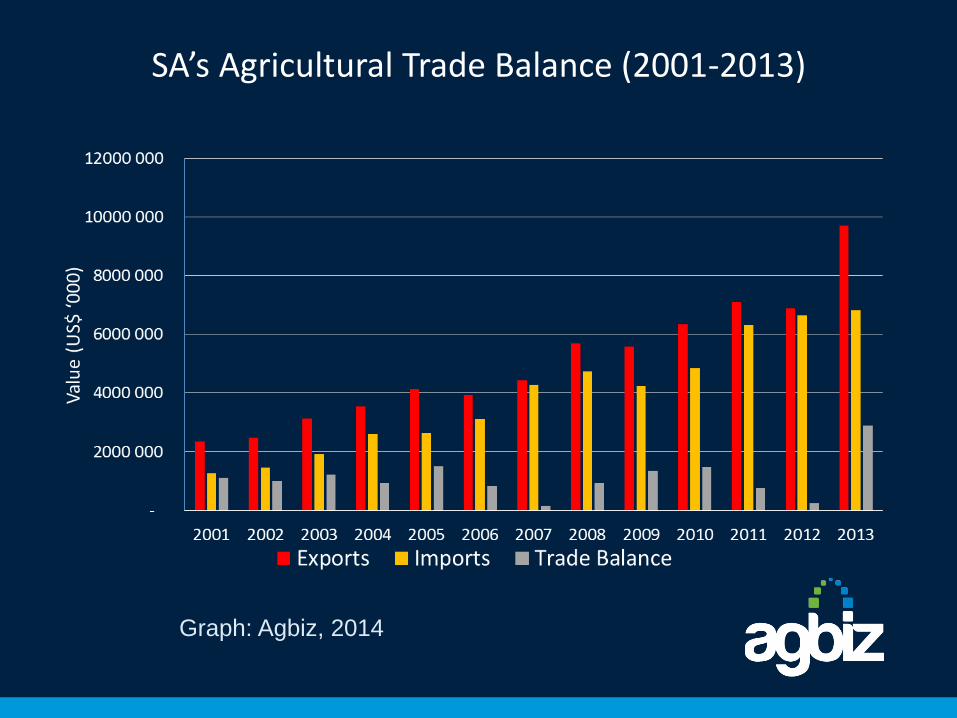
SA’s Agricultural Trade Balance (2001-2013)
Graph: Agbiz, 2014

SA’s export markets for agro-processed products
Africa is driving most of SA’s agricultural export growth
107% export growth
between 2012-2013
Source: ITC (2014)
Graph: Agbiz, 2014
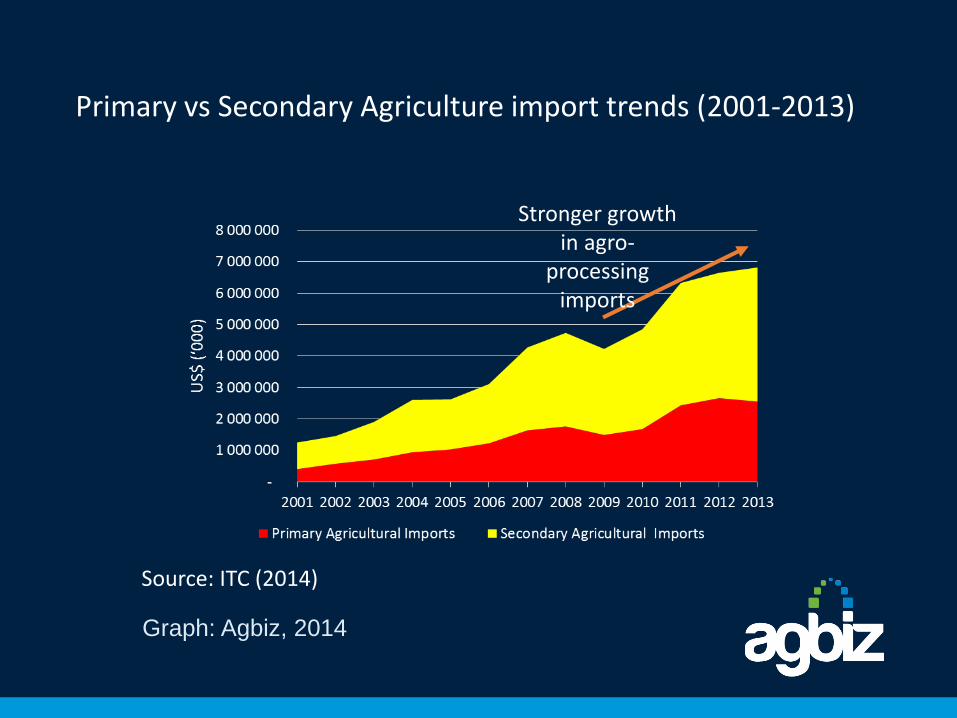
Primary vs Secondary Agriculture import trends (2001-2013)
Stronger growth in agro-
processing imports
Source: ITC (2014)
Graph: Agbiz, 2014

-100 000
-50 000
-
50 000
100 000
150 000
200 000
250 000
2010 2011 2012 2013 2014
Valu
e o
f tr
ade (
US
$'0
00
)South Africa's agricultural trade balance with France (2010-2014)
SA exports to France: All agricultural products SA imports to France: All agricultural products SA's agricultural trade balance
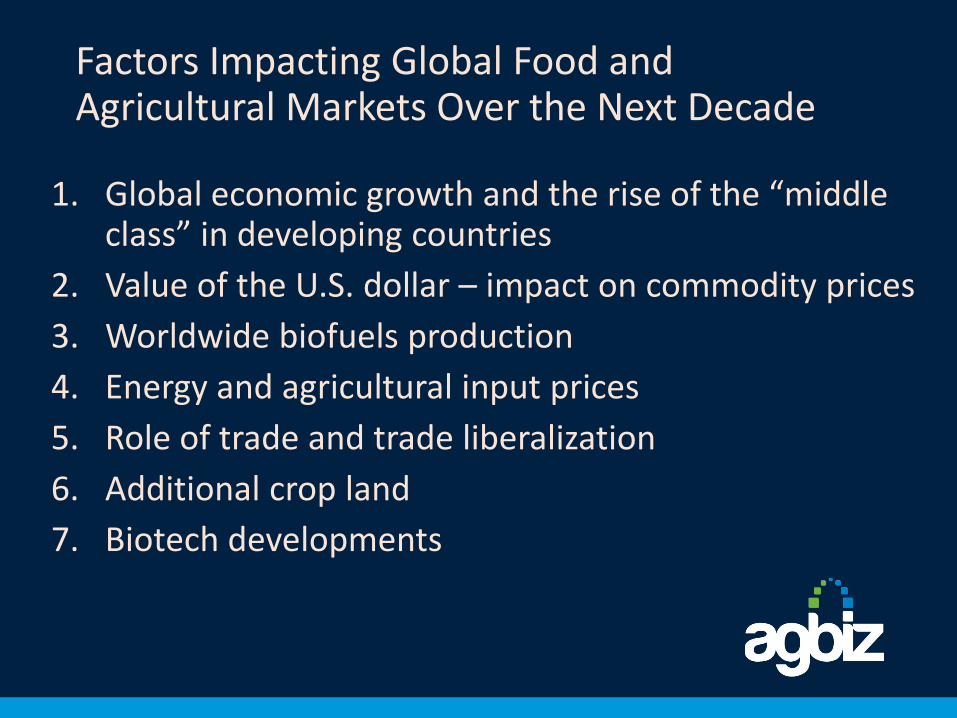
1. Global economic growth and the rise of the “middle class” in developing countries
2. Value of the U.S. dollar – impact on commodity prices
3. Worldwide biofuels production
4. Energy and agricultural input prices
5. Role of trade and trade liberalization
6. Additional crop land
7. Biotech developments
Factors Impacting Global Food and Agricultural Markets Over the Next Decade
Challenges : Government
- New Growth Path & NDP: Job creation, Shared Growth, Green Growth
- Food security
- Empowerment of PDI’s, e.g. AgriBEE, EE, Land Reform, etc.
- Land Reform & Rural Development (NDP: Chapter 6)
- Industrial Policy Action Plan II: Agro-processing focus area (6th Version)
- Competitive environment (Competition Act)
- Sustainable resource management, e.g. Climate Change, water
quality & quantity, land use, etc.
- African development.

Challenges : Private Sector
- Profitability and competitiveness
- Transparent and reliable markets (Market Integrity!)
- Engage Government ito enabling policy environment:
Create confidence for long term investment
- Need for inclusive Strategic Framework/Plan (IGDP + APAP)
- Sustainable & predictable transformation
- Institutional and value chain support (R&D, SPS matters,
resource base management, trade facilitation, training
& skills development, crop estimates, agro-logistics, Act
36 of 1947, etc.)
- African opportunities

Overall Prospects
• Much greater food security awareness, both globally and locally – very positive. Priority for G20, OECD, FAO, etc.
• Government engagement with Private Sector needs to improve.
• Vision 2030 awareness of the need to support both commercial and developing agriculture. Better implementation NB!
• Substantial markets: locally, regionally, globally, and especially to the East. Need market development, though! Typical PPP.
• General commodity and agribusiness infrastructure is good basis – build on this & other strong institutional capacity.
• New technology/expertise through especially multinationals.
• African opportunities

Conclusion
• Relatively healthy and robust agro-food industry
• Relatively technologically advanced, globally competitive
• Challenges: Investment environment, Agro-logistics, water availability and quality, environmental sustainability, R&D, crime and security, labour relations & legislation, land reform, climate change, trade agreements, sustainable transformation, etc.
• Opportunities: Growing population, consumer spending trends, new markets (especially to Africa and the East), etc.
• Major contributor to Food Security, growth and employment in RSA.
• However, we live in uncertain times – many risks and variables, some controllable, others not or less so. We take our agro-food system far too much for granted in South Africa. It is a national asset all should nurture and cherish.
Recommended