Prepared for:
Client Contacts:Liam SalterMonika Fung
TNS Consultants:Anne WoodhamsUmang PabaruVincent Kwong
J67695 - 25 May 2007
Air Quality and Climate Change Study
WWF Hong Kong
Page 2
Contents
Page
Background 4
Objectives 5
Research Methodology 6
Respondent Profiles 7
General Public’s Concern towards Environmental Problems 14
General Public’s Awareness and Knowledge of Air Pollution 19
Relationship between Air Pollution and Climate Change 24
Responsibility of Different Parties towards Environmental Problems 30
Evaluation of Government Offices 35
Appendix 40

Page 3
Background
Objectives
Research Methodology

Page 4
� In recent years, the issue of Hong Kong’s air quality is of increasing concern because
air pollution has become visually more evident.
� Concentrations of harmful pollutants in the air of Hong Kong have increased stemming
from Guangdong’s economic activities and road-vehicle emissions.
� Despite the fact that greater emphasis is placed on tackling air pollution including the
Policy Address, such efforts are not significant enough to tackle the heart of the issue
yet.
� Therefore, WWF HK is keen on overcoming this political inertia through understanding
the opinions and attitudes of key target groups in order to design the appropriate
messages to encourage their participation in improving Hong Kong’s air quality.
Background

Page 5
� The Overall Research Objective:
� To acquire the opinions and attitudes of both the general public and specific target groups towards air pollution in Hong Kong
� Specific Research Objectives:
� Determine the public’s understanding of the health impacts of air pollution
� Investigate the public’s beliefs on the sources of and solutions to pollution
� Understand public awareness and expectation of where the responsibility lies
� Understand the possible actions or efforts of the public in addressing/solving the
issues
� Understand the sources from which the public seeks relevant information about
air pollution and climate change
Research Objectives

Page 6
� Methodology
� Online questionnaire using TNS Access Panel
� Target Respondents
� Males / Females, aged 15 – 64 years
� Sample Size
� Total n = 1003
� Interview Length
� Approx. 15 minutes
� Survey Period
� 19 – 26 April, 2007
Methodology

Page 7
Respondent Profiles

Page 8
Respondent Profiles
133646955 – 64 years old
24613611035 – 44 years old
23612011645 – 54 years old
1003
209
179
Total
472
92
85
Male Female
11725 – 34 years old
531
94
Total
15 – 24 years old

Page 9
Age and Gender Distribution in Hong Kong (Mid-2006)
52.23 654 20047.83 340 300Total
0.959 700 0.430 200 ≧≧≧≧ 85
1.066 800 0.746 400 80 - 84
1.498 200 1.284 900 75 - 79
1.7117 100 1.6115 000 70 - 74
1.7116 000 1.8124 800 65 - 69
1.7117 900 1.9129 700 60 - 64
3.1216 300 3.2221 400 55 - 59
4.0276 400 3.8265 500 50 - 54
5.0349 700 4.8332 600 45 - 49
5.5385 300 4.5312 800 40 - 44
5.0353 000 3.7258 700 35 - 39
4.6319 500 3.5243 300 30 - 34
3.7256 800 3.2225 600 25 - 29
3.4238 700 3.2224 100 20 - 24
3.1216 400 3.2226 700 15 - 19
2.9206 400 3.1219 300 10 - 14
2.2153 000 2.3164 000 5 - 9
1.5107 000 1.6115 300 0 - 4
%Number %Number
FemaleMaleAge
Gender
* Source: Hong Kong Monthly Digest of Statistics (January 2007),
The Census and Statistics Department

Page 10
Respondent Profiles
Monthly Household Income (Unweighted)
8%
25%
21%
15%
7%
24%
HKD 9.999K or below / No IncomeHKD 10 - 19.999KHKD 20 - 29.999KHKD 30 - 49.999KHKD 50 - 79.999KHKD 80K or above
Monthly Household Income (Weighted)
29%
15%
3%7%
28%
18%
HKD 9.999K or below / No IncomeHKD 10 - 19.999KHKD 20 - 29.999KHKD 30 - 49.999KHKD 50 - 79.999KHKD 80K or above
Data is weighted so that the monthly household income follows the actual household income distribution in the Hong Kong population.

Page 11
Monthly Household Income in Hong Kong (2006 Q3)
100.0%2 322 100Total
10.1%233 400≧≧≧≧ 50,000
5.2%119 90040,000 - 49,999
9.9%229 30030,000 - 39,999
7.2%168 20025,000 - 29,999
10.6%247 30020,000 - 24,999
12.4%288 20015,000 - 19,999
16.0%372 00010,000 - 14,999
7.6%175 7008,000 - 9,999
7.2%167 4006,000 - 7,999
5.9%136 1004,000 - 5,999
7.9%184 600< 4,000
%Number of households
TotalMonthly household income (HKD)

Page 12
Respondent Profiles
11%
11%
12%
6%
7%
53%
Working Full Time - Employee
Working Full Time - Self Employed
Working Part Time
Unemployed/retired
Student
Housewife
12%
23%
65%
Business Sector
Non-Business Sector
Others
� Transportation
� Trading
� Service: Hotel & Tourism
� Service: Catering
� Retail
� Media
� Marketing & PR
� Manufacturing
� Logistics
� Insurance
� Health & Beauty
� Business Analysis / Development
� Banking & Finance
� Airline
� Admin/ Clerical
� Accounting
� IT
Occupation (Weighted)The following industries are defined as “Business Sector”:
The following industries are defined as “Non-Business Sector”:
� University Academics
� Medical / Pharmaceutical
� Legal
� Government
� Engineering
� Arts and Entertainment
� Education

Page 13
Respondent Profiles
Education Level (Weighted)
6%
29%
6%
9%
39%
11%Primary Education Secondary Education (F. 5)
Secondary Education (F. 7) Undergraduate
Postgraduate or above Others

Page 14
General Public’s Concerntowards Environmental Problems

Page 15
Concern towards Environmental Issues
2%
3%
6%
13%
13%
19%
20%
26%
38%
43%
33%
45%
45%
52%
47%
59%
49%
52%
41%
34%
27%
26%2%
1%
1%
1%
2%
Outdoor air pollution
Climate change
Water availability
Indoor air pollution
Loss or degradation of green
areas
Marine pollution
Beach water quality
Not concernedat all 1 Not very concerned 2 Some what concerned 3 Very concerned 4
76%
83%
85%
86%
86%
92%
96%
Somewhat + Very
concernedAre you concerned about the following issues?
More than 9 out of 10 Hong Kong residents are concerned about outdoor air pollution and climate change.
These two environmental issues are ranked the top two among all other environmental issues listed in the survey.
More than 50% of respondents are very concerned about water availability.
Source: Q1Base (Weighted): All respondents (n=1003)

Page 16
Business Sectors’ Concern
8%
10%
18%
18%
27%
36%
42%
35%
44%
45%
53%
45%
62%
49%
56%
45%
36%
28%
27%1%
1%
1%
1%
1%8%
2%Outdoor air pollution
Climate change
Water availability
Indoor air pollution
Loss or degradation of green
areas
Marine pollution
Beach water quality
Not concernedat all 1 Not very concerned 2 Some what concerned 3 Very concerned 4
72% (76%)
81% (83%)
81% (85%)
89% (86%)
91% (86%)
92% (92%)
98% (96%)
Somewhat + Very
concernedAre you concerned about the following issues?
Nearly all respondents working in business sectors are concerned about outdoor air pollution.
More than 90% of them are concerned about climate change.
Respondents are concerned about outdoor air pollution and climate change more than other environmental issues.
Source: Q1Base (Weighted): Respondents working in business sectors (n=430)
* Percentages of total respondents who
are somewhat or very concerned with the
issues are shown in brackets.

Page 17
Climate Change in Hong Kong
36% 46% 14% 5%Hong Kong
Strongly disagree 1
Somewhat disagree 2
Somewhat agree 3
Strongly agree 4
82% of respondents disagree that Hong Kong is quite safe from the impact of climate change.
However, this percentage is smaller than the world average in 2006 in which 90% of people believe that global warming is serious.
Source: Q14BBase (Weighted): All respondents (n=1003)
Hong Kong is quite safe from the impact of climate change.
65% 25% 2%3%World average (2006)
Very serious
Somewhat serious
Not very serious
Not at all serious
How serious do you consider global warming to be? *
* Source: Globe Scan Poll: Global Views on Climate Change
Strongly/somewhat disagree 82%
Very/somewhat serious 90%

Page 18
Climate Change in Hong Kong
36% 46% 14% 5%Hong Kong
Strongly disagree 1
Somewhat disagree 2
Somewhat agree 3
Strongly agree 4
More female respondents disagree that Hong Kong is quite safe from the impact of climate change compared with male respondents.
More middle-aged respondents have the same belief compared with younger or older respondents.
Source: Q14B
Hong Kong is quite safe from the impact of climate change.
Strongly/Somewhat disagree 82%
85%
78%
0% 10% 20% 30% 40% 50% 60% 70% 80% 90% 100%
Female
Male
79%77%
88%
83%
78%
60%
65%
70%
75%
80%
85%
90%
95%
100%
15-24 25-34 35-44 45-54 55-64
Age
Bottom 2
Boxes %
Bottom 2 Boxes %
Base (Weighted) * : Male (n=472); Female (n=531); Age 15-24 (n=180); 25-34 (n=209); 35-44 (n=247); 45-54 (n=236); 55-64 (n=133)
* Sum of number of respondents from different age groups is 1005 which is different from all respondents (1003) due to round-off error after
data is weighted.

Page 19
General Public’s Awareness and Knowledgeof Air Pollution

Page 20
Impacts on Health on From Outdoor Air Pollution
7% 58%35%Total
No impact at all 1
Little impact 2
Moderate impact 3
Very serious impact 4
More than 9 in 10 Hong Kong residents believe that they suffer from outdoor air pollution.
Nearly 60% of respondents believe that they suffer very serious impact from the poor air quality.
Moderate/Veryserious impact
93%
To what extent do you think outdoor air pollution impacts your health?
Source: Q2Base (Weighted): All respondents (n=1003)
Page 21
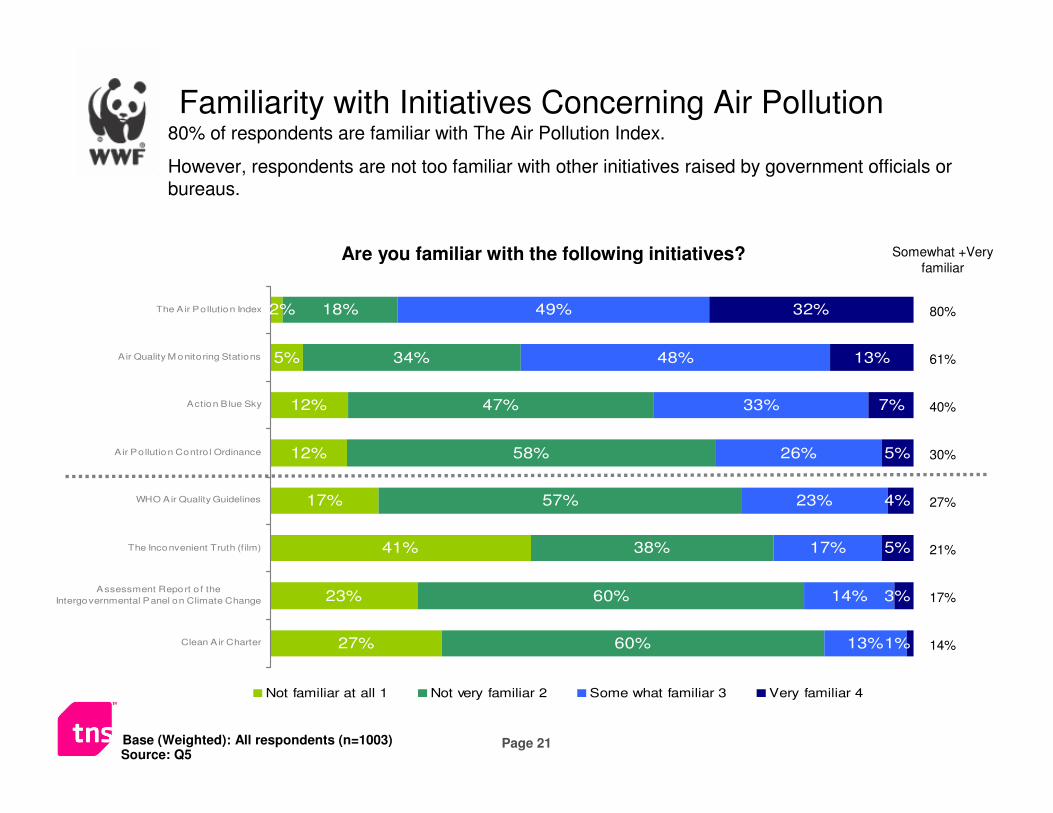
Familiarity with Initiatives Concerning Air Pollution
5%
12%
12%
17%
41%
23%
27%
18%
34%
47%
58%
57%
38%
60%
60%
49%
48%
33%
26%
23%
17%
14%
13%
32%
13%
7%
5%
4%
5%
3%
1%
2%The A ir Pollution Index
Air Quality M onitoring Stations
Action B lue Sky
Air Pollution Contro l Ordinance
WHO Air Quality Guidelines
The Inconvenient Truth (film)
Assessment Report o f the
Intergovernmental Panel on Climate Change
Clean A ir Charter
Not familiar at all 1 Not very familiar 2 Some what familiar 3 Very familiar 4
17%
14%
21%
27%
30%
40%
61%
80%
Somewhat +Very
familiarAre you familiar with the following initiatives?
80% of respondents are familiar with The Air Pollution Index.
However, respondents are not too familiar with other initiatives raised by government officials or bureaus.
Source: Q5Base (Weighted): All respondents (n=1003)
Page 22
Consequences of Air Pollution
9%
23%
29%
36%
25%
39%
43%
46%
50%
57%
47%
37%
72%
55%
51%
46%
38%
18%
19%
17%
4%
3%
1%
1%
2%
1%11%
7%
6%
6%
2%Impacts negatively on health
Affects HK's tourism negatively
Damages the image of HK
Imposes signif icant environmental
clean up costs
Decreases HK's competitiveness
among other Asian destinations
Results in low er productivity
Turns aw ay foreign direct investment
from HK
Decreases people's incentive to have
children
Strongly disagree 1 Somewhat disagree 2 Somewhat agree 3 Strongly agree 4
66%
54%
74%
88%
92%
94%
94%
97%
Somewhat +
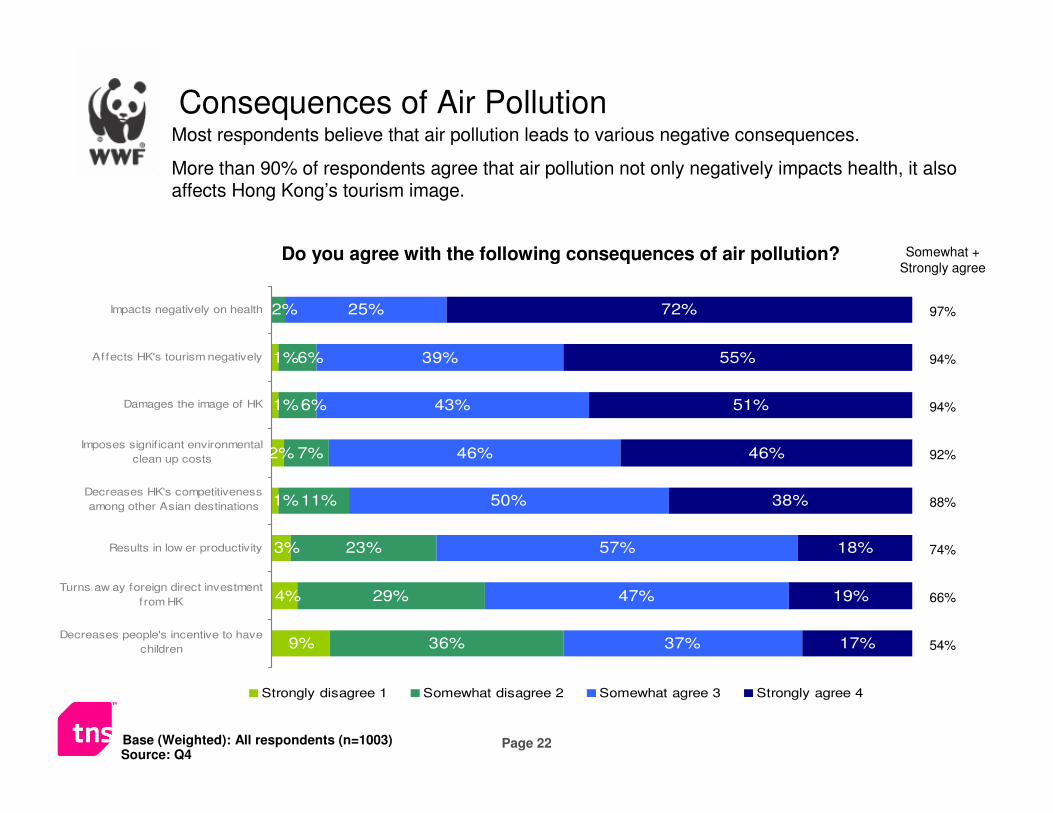
Strongly agreeDo you agree with the following consequences of air pollution?
Most respondents believe that air pollution leads to various negative consequences.
More than 90% of respondents agree that air pollution not only negatively impacts health, it also affects Hong Kong’s tourism image.
Source: Q4Base (Weighted): All respondents (n=1003)

Page 23
Usefulness of Information about Air Pollution
7%
25%
25%
28%
47%
55%
50%
51%
49%
39%
51%
46%
32%
35%
33%
25%
33%
19%
3%
2%
1%
1%
1%
1% 15%
14%
11%
The human health effects of air
pollution
The environmental impacts of our
lifestyle choices
What individuals can do to reduce air
pollution
The types of pollutants causing poor
air quality
The major polluters in the area
What governments are doing to
address air pollution
International health guidelines
concerning air quality
Not useful at all 1 Not very useful 2 Somewhat useful 3 Very useful 4
71%
72%
74%
84%
85%
88%
93%
Somewhat + Very
useful
Would the following information about air pollution be useful for you to know?
Source: Q6Base (Weighted): All respondents (n=1003)
Most respondents believe that information concerning human health effects of air pollution will be somewhat or very useful for them to know.
Information concerning individuals’ actions will be more useful for respondents to know compared with other information such as type of pollutants causing air pollution, major air polluters, and so on.

Page 24
Relationship between Air Pollution and Climate Change

Page 25
Concern towards Environmental Issues
38%
43%
59%
49%2% 6%
3%Outdoor air pollution
Climate change
Not concernedat all 1 Not very concerned 2 Somewhat concerned 3 Very concerned 4
Source: Q1Base (Weighted): All respondents (n=1003)
Are you concerned about the following issues?
59% of respondents are very concerned with outdoor air pollution. However, only 49% of respondents are very concerned with climate change.
The level of concern of outdoor air pollution is higher than that of climate change. There is greater urgency for outdoor air pollution.
92%
96%
Somewhat + Very
concerned

Page 26
Issues Recalled Concerning Climate Change & Global Warming
10%None
3%Others
3%Pollution (unspecified)
3%Electricity consumption
3%Extinction of human beings13%None
3%Pollution to the environment3%Others
3%Disease/ health problems3%Extinction of animals/ plants
4%Thinning of the ozone layer3%Change in ecosystem
4%Extinction of animals/ plants4%Pollution to the environment
4%Air pollution (e.g. increasing emission of carbon dioxide)5%Iceberg melting, raising the water line and submerge
many areas
6%No winter/ shorten the winter time6%Natural disasters (e.g. tsunami, flooding, drought,
earthquake, etc.)
6%The world comes to the end7%The world comes to the end
6%Greenhouse Effect 8%Disease/ health problems
9%Natural disasters (e.g. tsunami, flooding, drought,
earthquake, etc.)10%Air pollution (e.g. increasing emission of carbon dioxide)
9%Abnormal weather conditions14%Greenhouse Effect
22%Iceberg melting, raising the water line and submerge
many areas19%Abnormal weather conditions
24%Global Warming / Temperature increase31%Global Warming / Temperature increase
1003Sample Size1003Sample Size
Climate Change Global Warming
More than 30% of respondents spontaneously relate climate change with global warming.
However, a low percentage of respondents spontaneously recall air pollution when discussing climate change or global warming.
* Spontaneous mentions.
** Percentages less than 3% are not shown.Source: Q11, Q12Base (Weighted): All respondents (n=1003)
What comes to your mind when you hear about the following environmental problems? *
Page 27
Sectors **Education **Age *Gender
7%4%5%4%4%5%3%4%6%4%5%4%Global Warming
11%8%8%12%15%14%8%9%6%13%7%10%Climate Change
1504302966461332362472091805314721003Sample Size *
(Weighted)
Non-
business
sector
Business
sector
University
or above
F.7 or
below55-6445-5435-44 25-3415-24 FemaleMaleTotal
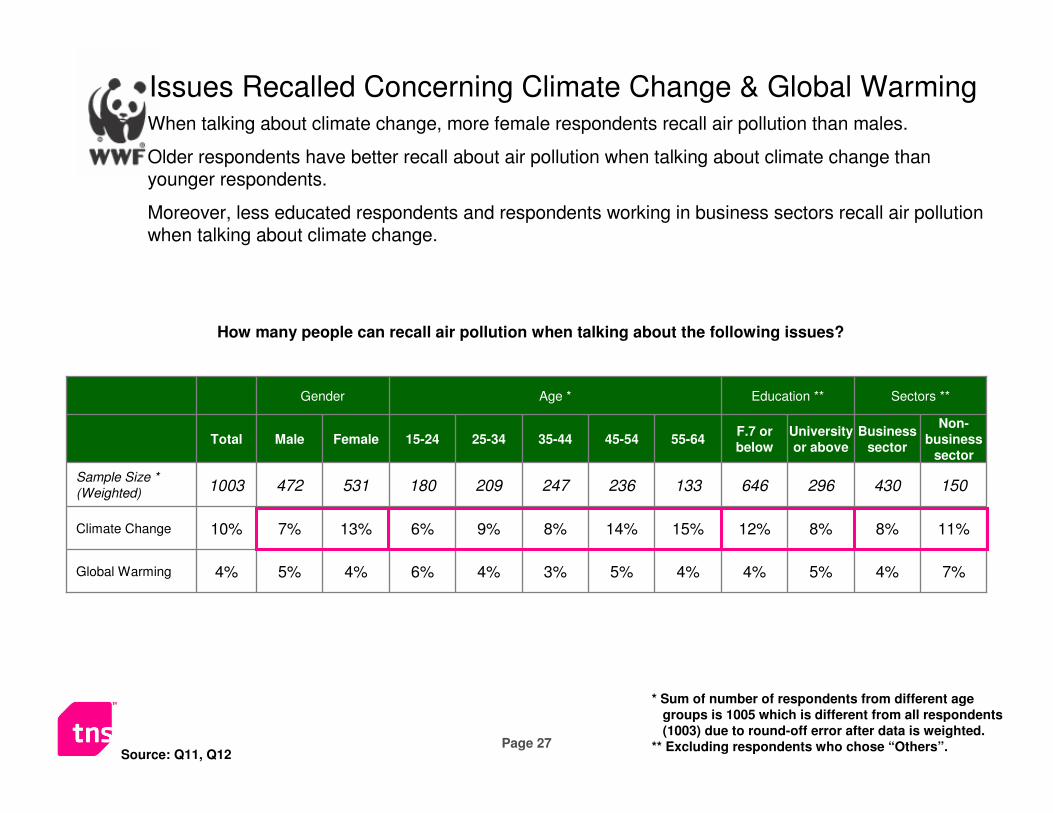
How many people can recall air pollution when talking about the following issues?
* Sum of number of respondents from different age
groups is 1005 which is different from all respondents
(1003) due to round-off error after data is weighted.
** Excluding respondents who chose “Others”.Source: Q11, Q12
Issues Recalled Concerning Climate Change & Global WarmingWhen talking about climate change, more female respondents recall air pollution than males.
Older respondents have better recall about air pollution when talking about climate change than younger respondents.
Moreover, less educated respondents and respondents working in business sectors recall air pollution when talking about climate change.

Page 28* Sum of number of respondents from different age groups is 1005 which is different from all respondents (1003) due to round-off error after
data is weighted.
Although respondents are not familiar with initiatives concerning air pollution and cannot spontaneously recall air pollution with climate change or global warming, 78% of respondents are clear that air pollution and climate change are related when asked.
Middle-aged and older respondents tend to believe that air pollution and climate change are not separate issues. Also, respondents with higher monthly household income have a stronger belief that these two issues are not separate.
40% 38% 16% 6%
Strongly disagree 1
Somewhat disagree 2
Somewhat agree 3
Strongly agree 4
Air pollution and climate change are separate issues.
74%75%
82%
78% 78%
60%
65%
70%
75%
80%
85%
90%
95%
100%
15-24 25-34 35-44 45-54 55-64
Age
Bottom 2
Boxes %
77% 77%79%
76%
80%
88%
60%
65%
70%
75%
80%
85%
90%
95%
100%
9.999K or
below / No
Income
10 - 19.999K 20 - 29.999K 30 - 49.999K 50 - 79.999K 80K or above
Monthly Household Income (HKD)
Bottom 2
Boxes %
Strongly/somewhat disagree 78%
Relationship between Air Pollution and Climate Change
Source: Q14A
Base (Weighted) * : Age 15-24 (n=180); 25-34 (n=209); 35-44 (n=247); 45-54 (n=236); 55-64 (n=133); Monthly Household income HK
9.999K or below/ No income (n=291); 10-19.999K (n=281); 20-29.999K (n=181); 30-49.999K (n=150); 50-79.999K (n=68); 80K or above (n=32)

Page 29
Contributing Factors to Air Pollution and Climate Change
7%
9%
14%
4%
44%
23%
52%
52%
27%
35%
29%
36%
48%
34%
30%
41%
61%
63%
13%
26%
5%
4%
28%
3%
1%
1%
8%
3%Road vehicles
Manufacturing
industries in Pearl
River Delta
Local manufacturing
industries
Power generation
Ferries, vessels and
ships
Aircrafts
Incinerators
42%
39%
40%
34%
36%
41%
45%
31%
54%
63%
59%
13%
13%
61%
4%
1%
1%
1%
3%
1%
5%
3%
5%
8%
Vehicle emissions
Factory emissions
Power plant
emissions
Ocean vessel
emissions
Aircraft emissions
Deforestation
Least contributing factor 1 Small contributing factor 2Large contributing factor 3 Largest contributing factor 4
91%
58%
54%
95%
96%
94%
Large + largest
factorAir Pollution Climate Change
69%
34%
39%
74%
49%
91%
96%
Large + largest
factor
Most respondents believe that road vehicles, factories, and power plant emissions are major contributing factors to both air pollution and climate change.
Respondents believe that deforestation plays a very large contributing factor in climate change.
Source: Q3, Q13Base (Weighted): All respondents (n=1003)

Page 30
Responsibility of Different Partiestowards Environmental Problems

Page 31
Effective Measures83% of respondents believe that government regulations and enforcement for companies are more effective in reducing air pollution.
Only 48% of respondents believe that voluntary actions by companies are effective.
* Respondents are allowed to give multiple answers.
Source: Q8Base (Weighted): All respondents (n=1003)
60%
48%
52%
83%
0% 10% 20% 30% 40% 50% 60% 70% 80% 90% 100%
Voluntary actions by individuals
Voluntary actions by companies
Government regulations and
enforcement for individuals
Government regulations and
enforcement for companies
What approach(es) do you think would be effective in reducing air pollution?

Page 32
* Respondents are allowed to give multiple answers.
58%
51%
55%
86%
0% 10% 20% 30% 40% 50% 60% 70% 80% 90% 100%
Voluntary actions by individuals
Voluntary actions by companies
Government regulations and
enforcement for individuals
Government regulations and
enforcement for companies
What approach(es) do you think would be effective in reducing air pollution?
Effective Measures Considered by Business SectorsRespondents working in business sectors have similar beliefs with all respondents when talking about which measures are considered to be effective in reducing air pollution.
(83%)
(52%)
(48%)
(60%)
Source: Q8Base (Weighted): Respondents working in business sectors (n=430) * Percentages in brackets reflect the opinions by all
respondents (n=1003) in the previous page.

Page 33
Responsibility for Improving Air Quality
4%
4%
8%
20%
20%
34%
36%
11%
35%
44%
45%
39%
50%
44%
46%
42%
61%
52%
47%
40%
29%
20%
15%
47%
4%
2%
2%
2%
HKSAR Government
Urban road transport operators
Power companies
Central Chinese Government
Legislative Council
Vessels/ ship operators
NGO's e.g. WWF, Friends of
the Earth, etc..
General public
No responsibility 1 Little responsibility 2 Great responsibility 3 Greatest responsibility 4
61%
89%
79%
79%
64%
92%
96%
96%
Great + greatest
responsibilityWho have responsibility for improving air quality?
Nearly all respondents believe that the HKSAR Government and urban road transport operators bear a great responsibility for improving air quality. Nearly 90% of them believe that the general public also bears a great responsibility for it.
They believe that NGOs have less responsibility compared with other parties.
Source: Q7Base (Weighted): All respondents (n=1003)

Page 34
Responsibility for Tackling Climate Change
7%
8%
6%
21%
22%
33%
33%
13%
36%
45%
45%
37%
49%
49%
46%
45%
57%
47%
49%
40%
27%
17%
17%
42%
5%
2%
2%
HKSAR Government
Urban road transport operators
Power companies
Central Chinese Government
Legislative Council
Vessels/ ship operators
NGO's e.g. WWF, Friends of the
Earth, etc..
General public
No responsibility 1 Little responsibility 2 Great responsibility 3 Greatest responsibility 4
62%
87%
66%
76%
77%
94%
92%
92%
Great + greatest
responsibilityWho has responsibility for tackling climate change?
A similar trend is observed when discussing the responsibility for tackling climate change, with the HKSAR government being one of the parties which bears most of the responsibility and NGOs bearing less responsibility compared with others.
Source: Q15Base (Weighted): All respondents (n=1003)

Page 35
Evaluation of Government Offices

Page 36
Responsibility among Government Offices
4%
19%
22%
24%
38%
26%
36%
45%
44%
50%
46%
71%
60%
34%
31%
24%
14%2%
2%
2%
2%
2%Environmental Protection
Department
Environment, Transport and
Works Bureau
Food and Environmental
Hygiene Department
Chief Executive Office
Health, Welfare and Food
Bureau
Marine Department
No responsibility 1 Little responsibility 2 Great responsibility 3 Greatest responsibility 4
60%
73%
76%
79%
96%
98%
Great + Greatest
responsibilityWhich Government offices have responsibility for improving air quality?
35% 61%4%
Nearly all respondents (who agree that the HKSAR Government bears a great/the greatest responsibility for improving air quality) believe that among the government offices, the Environmental Protection Department and Environment, Transport and Works Bureau bears a great/the greatest responsibility for improving air quality.
HKSAR Government
Source: Q1Base (Weighted): Respondents who believe that HKSAR Government bears great/greatest responsibility for improving air quality (n=959)

Page 37
36% 57%7%HKSAR Government
No responsibility 1
Little responsibility 2
Great responsibility 3
Greatest responsibility 4
Satisfaction Level towards Government’s Actions
24% 51% 20% 5%Total
Strongly disagree 1
Somewhat disagree 2
Somewhat agree 3
Strongly agree 4
I am satisfied with the level of action the Hong Kong government takes about climate change.
3 out of 4 of Hong Kong locals are very or somewhat unsatisfied with the level of action the HKSAR government takes about climate change while 92% of respondents believe that the HKSAR Government has a great/ the greatest responsibility.
Only 5% of total respondents are very satisfied with the HKSAR Government’s actions.
Who have responsibility for tackling climate change?
Source: Q14D, Q15ABase (Weighted): All respondents (n=1003)

Page 38
Satisfaction Level towards Government’s ActionsMiddle-aged respondents tend to be less satisfied with the level of the HKSAR Government’s action about climate change.
Respondents from higher income groups also have lower satisfaction towards the HKSAR Government’s action.
70%
76%
81%
77%
66%
60%
65%
70%
75%
80%
85%
90%
95%
100%
15-24 25-34 35-44 45-54 55-64
Age
Bottom 2
Boxes %
70%72%
78%
81%
86%
83%
60%
65%
70%
75%
80%
85%
90%
95%
100%
9.999K or
below / No
Income
10 - 19.999K 20 - 29.999K 30 - 49.999K 50 - 79.999K 80K or above
Monthly Household Income (HKD)
Bottom 2
Boxes %
24% 51% 20% 5%Total
Strongly disagree 1
Somewhat disagree 2
Somewhat agree 3
Strongly agree 4
I am satisfied with the level of action the Hong Kong government takes about climate change.
Source: Q14D
Base (Weighted) * : Age 15-24 (n=180); 25-34 (n=209); 35-44 (n=247); 45-54 (n=236); 55-64 (n=133); Monthly Household income HK
9.999K or below/ No income (n=291); 10-19.999K (n=281); 20-29.999K (n=181); 30-49.999K (n=150); 50-79.999K (n=68); 80K or above (n=32)
Strongly/Somewhat disagree 75%
* Sum of number of respondents from different age groups is 1005 which is different from all respondents (1003) due to round-off error after
data is weighted.
Page 39
Possible Government Policies
19%
24%
50%
43%
43%
38%
42%
45%
54%
48%
23%
48%
48%
51%
46%
43%
25%
27%
8%
2%
2%
1%
1%
1%
1%
1%
20%
11%
11%
11%
9%
8%Set more stringent fuel and emission standards
forlocal Power companies
Get o ld, high emissions vehicles off the road
e.g. all pre-Euro and Euro-I vehicles
Support Hong Kong factories in the Pearl river
delta to reduce emissions
Declare a low-emissions zone in heavily
po lluted areas to restrict the most po lluting
vehicles
Subsidise renewable energy development
Introduce fuel and emission standards
formarine vessels
Launch large-scale public campaign to promote
energy efficiency
Increase price of electricity to discourage waste
Not effective at all1 Not very effective2 Somewhat effective3 Very effective4
75%
31%
79%
88%
88%
88%
91%
91%
Somewhat + Very
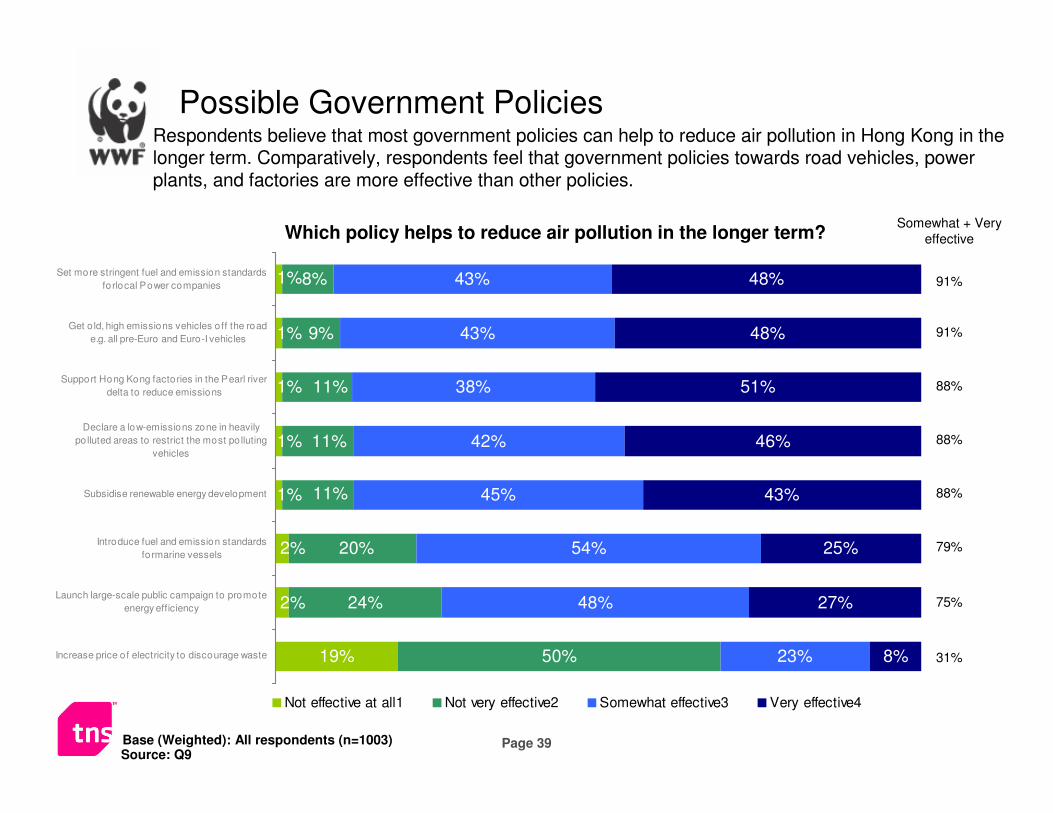
effectiveWhich policy helps to reduce air pollution in the longer term?
Respondents believe that most government policies can help to reduce air pollution in Hong Kong in the longer term. Comparatively, respondents feel that government policies towards road vehicles, power plants, and factories are more effective than other policies.
Source: Q9Base (Weighted): All respondents (n=1003)

Page 40
Appendix 1
Online methodology: background and FAQs

Page 42
What advantages do well managed online access panels offer?
� High quality research, delivering better research outcomes
� Reliable and robust surveys, replicable over time
� Fast turnaround, with real-time reporting
� Most cost effective methodology
� Excellent response rates
� Preferred by a large majority of respondents
� No interviewer bias (ideal for sensitive topics)
� Multi-media capabilities
� Large available samples, pre-screened on a wide range of lifestyle, health and consumer topics
Overall, the most effective and efficient methodology

Page 43
6thdimensionTM
Better research
outcomes
Consistent evidence that 6D online studies produce better data and insights
� More accurate market share data
� More realistic intentions to purchase
� More honest answers on sensitive subjects
� Fewer “politically correct” responses
� More detailed open-ended responses
� Better discrimination in brand disposition, imagery, etc
� More accurate recognition (ads, products), using high quality stimulus

Page 44
How is the panel recruited ?
� The panel is recruited by a combination of methods, to ensure broad coverage of the on-line population
� Electronic direct marketing campaigns, using mainstream databases and communities
� we avoid special interest communities unless we are looking for a specific demographic or target (eg. mothers with young children)
� Respondents from random Face-to-Face or CATI surveys are invited to join
� Above-The-Line advertising (usually press)
� Referrals from existing members

Page 45
Is the panel representative ?
� The panel is designed to produce representative samples of the online population in the geographic areas we cover
� The achieved samples are controlled to match the target market by:
� Sampling (the invites sent out)
� Screening questions
� Quotas
� In Emerging Markets, our panels are not designed to represent the total population
� In highly developed internet markets, and for specific target groups (eg. MP3 users), the on-line population may be highly representative of the total

Page 46
Do people respond differently on-line ?
� On many measures, on-line responses are very similar to other methods
� But there can be some important differences in online responses. Typically …
� They are more considered (more detailed responses)
� They are more candid
� They can be more critical
� Responses can differ by survey subject
� Responses can differ for sensitive questions / “politically correct” topics

Page 47
The End
Recommended