Efficacy of the Responsive ClassroomApproach: Results From a 3-Year,
Longitudinal Randomized Controlled Trial
Sara E. Rimm-KaufmanRoss A. A. LarsenAlison E. Baroody
University of VirginiaTimothy W. Curby
George Mason UniversityMichelle Ko
Julia B. ThomasEileen G. Merritt
University of VirginiaTashia Abry
Arizona State UniversityJamie DeCoster
University of Virginia
This randomized controlled field trial examined the efficacy of theResponsive Classroom (RC) approach on student achievement. Schools(n = 24) were randomized into intervention and control conditions; 2,904children were studied from end of second to fifth grade. Students at schoolsassigned to the RC condition did not outperform students at schools assignedto the control condition in math or reading achievement. Use of RC practicesmediated the relation between treatment assignment and improved mathand reading achievement. Effect sizes (ES) were calculated as standardizedcoefficients. ES relations between use of RC practices and achievement were.26 for math and .30 for reading. The RC practices and math achievementrelation was greater for students with low initial math achievement (ES =.89). Results emphasize fidelity of implementation.
KEYWORDS: Responsive Classroom, fidelity of implementation, mathematics,reading, social and emotional learning
Social and emotional learning (SEL) interventions are designed to teachstudents social and emotional skills considered foundational to academic
learning in school and beyond (Durlak, Weissberg, Dymnicki, Taylor, &
American Educational Research Journal
Month XXXX, Vol. XX, No. X, pp. 1–37
DOI: 10.3102/0002831214523821
� 2014 AERA. http://aerj.aera.net
by guest on February 19, 2015http://aerj.aera.netDownloaded from

Schellinger, 2011). Universal school-based SEL programs that teachersdeliver to students in classrooms have been viewed as levers for creatingschool improvement. SEL skills have been included into state learning stand-ards (Dusenbury, Zadrazil, Mart, & Weissberg, 2011). There have been recentefforts to include the Academic, Social and Emotional Learning Act (HR 1875,2013) in revisions of the Elementary and Secondary Education Act.
Although research on SEL interventions has accumulated in past decades(e.g., Durlak et al., 2011; Social and Character Development ResearchConsortium [SACD], 2010), many SEL interventions have not been subject
SARA E. RIMM-KAUFMAN is a professor at the University of Virginia in the Curry School ofEducation and the Center for Advanced Study of Teaching and Learning, 350 Old IvyWay, Suite 300, Charlottesville, VA 22903; e-mail: [email protected]. She conductsresearch on elementary school and classroom teaching practices and experiencesthat support students’ engagement in learning, development of self-control, andsocial and emotional skills.
ROSS A. A. LARSEN is an assistant professor at Virginia Commonwealth University in theDepartment of Foundations of Education. His research interests include multilevelclustering, latent growth curve modeling with parallel processes, Monte Carlo simu-lations, and Bayesian statistics.
ALISON E. BAROODY is an assistant professor at San Francisco State University in theDepartment of Child and Adolescent Development. She conducts research on child-ren’s interest and engagement in learning, multimethod measurement approaches ofassessment, and early childhood and elementary school educational interventions.
TIMOTHY W. CURBY is an assistant professor at George Mason University in theDepartment of Applied Developmental Psychology. His work focuses on the roleof teacher-student interactions in promoting young children’s development, particu-larly in relation to their social-emotional development.
MICHELLE KO is a research associate at University of Virginia in the Center forAdvanced Study of Teaching and Learning. She works on large-scale educationresearch studies as a data manager and data analyst.
JULIA B. THOMAS is a research associate at the University of Virginia in the Center forAdvanced Study of Teaching and Learning. She is the managing director of theUniversity of Virginia Social Development Laboratory where she manages large-scaleeducation research projects.
EILEEN G. MERRITT is an assistant professor at the University of Virginia in the CurrySchool of Education and the Center for Advanced Study of Teaching and Learning.She conducts research on teaching practices in science and mathematics classrooms.
TASHIA ABRY is an assistant research professor at Arizona State University at the T.Denny Sanford School of Social and Family Dynamics. Her research focuses on theimplementation of school-based interventions and the role of the classroom ecologyin shaping early learning and development.
JAMIE DECOSTER is a senior research scientist at University of Virginia in the Center forAdvanced Study of Teaching and Learning. He works primarily as a statistician andmethodologist, and conducts research to determine ways to make the methodsused by scientists more accurate, flexible, and efficient.
Rimm-Kaufman et al.
2 by guest on February 19, 2015http://aerj.aera.netDownloaded from

to rigorous efficacy trials examining their impact on student achievement.As a result, policymakers and school decision makers are left with too littleinformation upon which to make decisions. Decision makers question: Willwe diminish children’s academic achievement if we place increasedemphasis on (and allocate more time toward) children’s social and emo-tional learning? This question is worth asking. Classrooms that provide nur-turance but do not emphasize academic growth fail to produce studentachievement gains (Lee & Smith, 1999; Shouse, 1996). Further, work indevelopmental psychology calls into question the assumption that im-provements in social skills cross over and benefit students’ academic skills(Duncan et al., 2007).
The Responsive Classroom� (RC) approach is a widely used professionaldevelopment intervention comprised of a set of practical teaching strategiesdesigned to support children’s social, academic, and self-regulatory skills.The RC approach is designed to enhance teachers’ capacity to create a caring,well-managed classroom environment characterized by respectful social in-teractions and academically engaging instruction (Northeast Foundation forChildren, 2007, 2009, 2014a). The RC approach was recently endorsed asone of 21 recommended programs by the Collaborative for Academic,Social and Emotional Learning (CASEL, 2013) for its high-quality design, sup-port for implementation, and evidential basis. As a result, school decisionmakers are particularly interested in the extent to which the RC approach re-lates to academic outcomes.
The present study, Responsive Classroom Efficacy Study (RCES), buildsupon existing research (Elliott, 1999; Rimm-Kaufman, Fan, Chiu, & You,2007) and represents the first randomized controlled trial of the approach.We randomized elementary schools to intervention versus control conditionsand followed a cohort of students and their teachers from the end of secondgrade through fifth grade. Three research questions pertaining to studentachievement were addressed:
Research Question 1: What is the impact of the RC approach on students’ readingand math achievement over 3 years?
Research Question 2: To what extent does fidelity of implementation mediate therelation between treatment assignment (intervention vs. control) and readingand math achievement over 3 years?
Research Question 3: To what extent is the mediational relation affected bywhether or not students are qualified for free and reduced priced lunch(FRPL) and by students’ initial achievement?
Recent synthesis work on SEL interventions describes the need for ran-domized controlled trials that examine the impact of SEL interventions onachievement outcomes, attend to issues of fidelity of implementation, and
Efficacy of the Responsive Classroom Approach
3 by guest on February 19, 2015http://aerj.aera.netDownloaded from

consider the moderators of intervention effectiveness (Durlak et al., 2011;Greenberg, 2010). The present study contributes to a critical area of need.
School-Based Social and Emotional Learning
Randomized controlled trials examining links from SEL interventions toachievement outcomes reveal mixed results. A cluster-randomized con-trolled trial on Positive Action, an intervention with explicit lessons onself-concept, self-management, peer social behaviors, and self-improve-ment, produced gains in elementary school math and reading (Hedge’s geffect size [ES] = .50–.72) after 3 years of implementation (Snyder et al.,2009). Findings from the 4Rs (‘‘Reading, Writing, Respect and Resolution’’),a program that integrates SEL skills into language arts instruction, demon-strated the presence of gains in reading and math achievement (measuredby test scores and teacher report) over 2 years of implementation.Findings were evident only for children whose teachers identified themas showing signs of initial behavioral risk (above a clinical cut-off in con-duct problems and aggression) (Jones, Brown, & Aber, 2011). Findingsfrom the Child Development Project, a program designed to promote child-ren’s prosocial skills and give children opportunities to experience related-ness, competency, and autonomy, related to enhanced sense of communityand improved achievement and behavioral outcomes (Battistich, Schaps, &Wilson, 2004), particularly when schools implemented the intervention asintended (Battistich, Solomon, Kim, Watson, & Schaps, 1995). Research onthe Good Behavior Game, a group game designed to decrease disruptivebehaviors, combined with an enriched academic curriculum implementedin first grade showed long-term gains in achievement to the end of highschool (Bradshaw, Zmuda, Kellam, & Ialongo, 2009). The state of researchsuggests positive outcomes are more likely in conditions of high imple-mentation and when outcomes align with the theory of change (SACD,2010). SEL interventions show stronger relations to social than achievementoutcomes (Durlak et al., 2011).
Quasi-experimental research links SEL interventions to student achieve-ment. For instance, findings from a nonrandomized field trial of a multicom-ponent intervention administered to fifth and sixth graders designed to fosterbonding toward school was associated with math and reading achievementgains (Abbott et al., 1998). A quasi-experimental study of the RULER FeelingsWords Curriculum, an intervention designed to teach children how to inter-pret and communicate emotions, demonstrated that fifth and sixth graders inclassrooms using the intervention outperformed students in the controlgroup on language arts grades, albeit a small effect (Brackett, Rivers,Reyes, & Salovey, 2010). A meta-analysis reviewing 213 SEL interventions(including a range of designs) showed a positive contribution of SEL pro-gramming on student behavioral and emotional skills as well as academic
Rimm-Kaufman et al.
4 by guest on February 19, 2015http://aerj.aera.netDownloaded from
performance. Effect sizes (Hedge’s g) were .57 for gains in social and emo-tional skills and .27 for gains in achievement (Durlak et al., 2011).
The Responsive Classroom Approach
The RC approach was developed by the Northeast Foundation forChildren (NEFC); more than 120,000 teachers have been trained in theapproach. According to NEFC (2014a), the RC approach is an ‘‘approachto elementary education that gives teachers the tools they need to be highlyeffective instructors’’ (p. 2). Like many professional development interven-tions, the RC approach continues to develop to match contemporary needs.In this paper, we describe the RC approach based on the version available in2008-2011. The RC approach offers principles including: ‘‘The social curric-ulum is as important as the academic curriculum; How children learn is asimportant as what they learn: Process and content go hand in hand;Knowing the children we teach—individually, culturally, and developmen-tally—is as important as knowing the content we teach’’ (NEFC, 2014b,‘‘Guiding Principles’’). Ten practices emanate from the principles. Teachersand children gather together daily for a Morning Meeting to create a senseof community among teachers and students and instill curiosity about thelearning ahead. Teachers use Academic Choice to structure lessons to pro-vide students autonomy and choice. The practices are described briefly inthe appendix in the online journal and extensively in manuals and books(NEFC, 2007, 2009). Training in the RC approach involves two 1-week work-shops, each lasting 35 hours, typically taken in consecutive summers. In-school coaching follows each workshop.
The RC approach differs from prevalent approaches to SEL. For exam-ple, the RC approach emphasizes how to teach rather than what to teach.Instead of establishing a set curriculum for teaching SEL skills (i.e., thosein RULER or Promoting Alternative Thinking Strategies [PATHS]), the RCapproach embeds modeling of prosocial behavior, collaboration, and self-control into instructional practices. RC practices are designed to align withexisting curricula in the school rather than introducing content with anSEL focus (e.g., in 4Rs).
Figure 1 presents a logic model that describes a theory of change for theRC approach (Knowlton & Phillips, 2008). In theory, training and coachingin the RC approach leads to teacher change (use of RC practices), whichleads to enhanced emotional support, proactive classroom management,and in turn, student motivation and engagement followed by improved stu-dent achievement. Two hallmark characteristics stand out. First, RC practicesare designed to create emotionally supportive classroom relationships. RCpractices are intended to improve teacher-student and peer relationshipswithin classrooms so children develop prosocial skills, cooperate with oneanother, and perceive that their teachers and peers care about them.
Efficacy of the Responsive Classroom Approach
5 by guest on February 19, 2015http://aerj.aera.netDownloaded from

Second, RC practices offer a proactive approach to classroom management.Using RC classroom practices early in the year and early in each day is keyto their use. Teachers set expectations for behavior and learning with thegoal that children will internalize expectations over time, develop self-regu-latory skills, and behave more autonomously.
Small-scale studies suggest the positive contribution of the RC approach.Research examining schoolwide implementation of the RC approach usinga pre-post design showed gains in social skills (d = .34–.41) (Elliott, 1999).A quasi-experimental study compared students at intervention versus controlschools. Teachers’ use of RC practices related positively to teachers’ percep-tion of children’s reading achievement, teachers’ perception of closenesstoward their students, children’s assertiveness, and children’s prosocialbehavior (Rimm-Kaufman & Chiu 2007). Analyses compared student testscores of children at RC versus control schools for three cohorts of elemen-tary school students exposed to the RC approach for 1, 2, and 3 years.Findings showed that the RC approach contributed to the gains in both read-ing and math after controlling for poverty and previous years’ test scores (d =.16–.21 for reading; d = .16–.39 for math; Rimm-Kaufman et al., 2007). Themagnitude of the findings is comparable to those found for SEL interventionsin meta-analytic work (Durlak et al., 2011). The state of existing work indi-cates the need for a randomized controlled trial to assess efficacy. Thus, thefirst research question addressed in the present study asks: What is theimpact of 3 years of the RC approach on student achievement? We hypoth-esize higher achievement among children in intervention than controlschools, demonstrating the positive impact of the RC approach.
Fidelity of Implementation
The RC approach is a fully developed, manualized intervention witha well-documented training process (NEFC, 2007, 2009). Despite efforts to
Interven�on Outcomes
Training Proximal OutcomesTeacher Change Distal Outcomes
ImprovedStudent
Achievement
IncreasedStudent
Mo�va�on andEngagement
EnhancedEmo�onalSupport &Proac�veClassroom
Management
Training andCoaching in the
RC approach
Use of RCPrac�ces inClassrooms
Interven�on
Figure 1. Logic model describing the theory of change for the Responsive Class-
room approach.
Rimm-Kaufman et al.
6 by guest on February 19, 2015http://aerj.aera.netDownloaded from
create consistency among teachers using the RC approach, existing work on fi-delity of implementation on the RC approach (Abry, Rimm-Kaufman, Larsen, &Brewer, 2013) as well as other SEL interventions (Reyes, Brackett, Rivers,Elbertson, & Salovey, 2012) suggests that uptake of the intervention variesacross schools and teachers. The process of adopting SEL interventions involvesa complex process as teachers change their practices and beliefs to align withthe intervention (Evans, 2001; Rimm-Kaufman, Storm, Sawyer, Pianta, & LaParo, 2006). Teachers may receive training but not use the RC practices, adoptsome RC practices but not others, or adopt superficial elements of RC practicesbut disregard underlying principles. Because the RC logic model rests upon theassumption that teachers implement RC practices with fidelity, fidelity of imple-mentation needs to be measured carefully. Century (2010) defines fidelity of im-plementation as ‘‘the extent to which the critical components of an intendedprogram are present when that program is enacted’’ (p. 202). We operationalizefidelity of implementation to the RC approach as frequency and adherence tothe 10 critical RC practices (e.g., Morning Meeting, Academic Choice,Interactive Modeling, etc. as described in the appendix in the online journal).
Two challenges stand out in relation to measuring fidelity in the RCapproach. First, the RC approach is designed to modify how teachers interactwith students in their classrooms instead of what students are learning. ManySEL interventions are comprised of a sequenced curriculum (CASEL, 2013),and measuring fidelity involves assessing the presence/absence of curricularactivities and time spent delivering content (Bickman et al., 2009). In contrast,measuring fidelity of the RC approach requires assessment of the frequency ofuse of RC practices (e.g., Do teachers use Morning Meeting once a day, oncea week, or once a month?) as well as the extent to which implementation ad-heres to RC principles and practices (e.g., Do teachers provide studentschoices about what kind of work to do and/or how to do the work?)
The RC approach presents yet another challenge in measuring fidelity(Cordray & Pion, 2006). RC practices were derived from well-known educa-tional and developmental theories (e.g., Piaget, Vygotsky, Dewey), andtherefore, some RC practices resemble teaching practices used in classroomsby teachers who have not been trained in the RC approach. Further, theintervention is described and characterized in a series of books publishedand distributed widely by NEFC, resulting in widespread adoption of inter-vention components (e.g., Denton, 2005; Denton & Kriete, 2000; Kriete,2002). RC practices share common qualities with what is considered typicalelementary school practices. Many teachers use a class meeting to start theschool day, and features of those class meetings (e.g., student sharing, fungroup activities) resemble the RC Morning Meeting. Many teachers incorpo-rate differentiated instruction into their classrooms, a practice that sharescommon elements with Academic Choice. To address this issue, we assesseduse of RC practices in both intervention and control schools using measuresfree from RC terminology. The measures of RC practices reflect fidelity of
Efficacy of the Responsive Classroom Approach
7 by guest on February 19, 2015http://aerj.aera.netDownloaded from
implementation in intervention schools and use of practices that resembleRC practices in the control condition. (We use the terms fidelity and use ofRC practices interchangeably.)
Thus, the second research question addressed examines fidelity of im-plementation. To what degree does teachers’ fidelity of implementation (inthird, fourth, and fifth grade) mediate the relation between assignment tothe RC condition and fifth-grade achievement? We hypothesized that teach-ers’ fidelity of implementation will mediate the relation between the RCapproach and reading and mathematics achievement.
Student Subgroups
SEL interventions may not relate equivalently to outcomes for all stu-dents. Some students come to school with more advanced academic skillsthan others (Li-Grining, Votruba-Drzal, Maldonado-Carreno, & Haas, 2010).To understand the extent to which findings about teachers’ use of RC prac-tices can be generalized, research needs to examine for whom the interven-tion is effective (Bloom & Michalopoulos, 2010). The present study examinespotential moderated mediation effects,1 testing the extent to which use of RCpractices mediates the relation between RC training and achievement morefor some children compared to others. Poverty (eligibility for FRPL) and lowinitial achievement (performance below 25th percentile in math achieve-ment at the end of second grade) were potential moderators.
Students living in poverty tend to show lower achievement than theirnon-poor counterparts, an association that has been attributed to less predict-able living situations and reduced access to social, material, and learning re-sources at home (Gershoff, Aber, Raver, & Lennon, 2007; Yoshikawa, Aber,& Beardslee, 2012). Links between poverty and lower student achievementraise questions about the degree to which supportive classroom experiencescan partially ameliorate risk associated with poverty. Emotionally and instruc-tionally supportive school experiences appear to be particularly important forchildren from poor families (Crosnoe et al., 2010; Hughes & Kwok, 2007).
Low-achieving children are the focus of national efforts to decrease theachievement gap, and there is a critical need for improved understanding ofthe instructional practices that support learning for children low in mathachievement (National Mathematics Advisory Panel, 2008). Although lowachievement in early elementary school tends to persist into the middle andupper elementary school grades (Claessens, Duncan, & Engel, 2009), students’course of achievement is not firmly established and classroom experiences canshift students toward more positive growth trajectories. Exposure to high-qualityclassroom environments characterized by social and emotional supportiveness(Pianta, Belsky, Vandergrift, Houts, & Morrison, 2008), nonconflictual relation-ships with teachers, and instruction requiring analysis and inference partiallyoffsets the effects of initial low achievement (Crosnoe et al., 2010).
Rimm-Kaufman et al.
8 by guest on February 19, 2015http://aerj.aera.netDownloaded from

Efforts to improve schooling for poor and low-achieving childrendemand research that examines whether teaching practices such as RC prac-tices are more efficacious for some children than others. The third researchquestion asks: To what extent is the mediated relation (i.e., RC condition tofifth-grade achievement via fidelity of implementation) moderated by childcharacteristics? We hypothesize that the mediated path will be stronger forchildren who qualify for FRPL and children with low initial achievement.
Other Contributing Factors
Existing research directs attention to other attributes of students, teach-ers, and schools that need to be considered as potential covariates in predict-ing achievement. Student gender is often linked to math and readingachievement (Robinson & Lubienski, 2011). Student poverty (Votruba-Drzal, 2006) and English language learner (ELL) status (Kieffer, 2008) neededto be considered given their relation to achievement. We also included testform administered (plain English versus standard) as a potential covariate.Student initial achievement was an important covariate to include becauseof the relative stability in achievement from third to fifth grade (Claessenset al., 2009); math achievement at the end of second grade served as a proxyfor initial student achievement.
There are teacher- and school-level features that contribute to studentachievement (Bradshaw, Mitchell, & Leaf, 2010) and warrant considerationas covariates. Teaching draws upon teachers’ experiences and educationalbackground; teachers’ years of experience and educational attainmentwere selected to represent the presence of these resources (Crosnoe &Cooper, 2010). Further, school-level poverty and student achievement(aggregated to the school level) were included because of theory and empir-ical work linking these variables to student performance (Conduct ProblemsPrevention Research Group, 2010; Raver, 2012).
Method
Participants
This study included 24 elementary schools in a large ethnically andsocioeconomically diverse school district located in a mid-Atlantic state.District policy required all elementary schools to select an approach to fosterSEL or behavioral learning, a policy implemented over a 3-year period.When the district was invited to participate, 24 elementary schools had notmade selections and/or initiated formal training and were willing to partici-pate in a randomized controlled trial of the RC approach. Centralized districtadministrators collaborated with the research team to invite school principalsto participate in the study; 100% of the schools invited agreed to participate.
Efficacy of the Responsive Classroom Approach
9 by guest on February 19, 2015http://aerj.aera.netDownloaded from
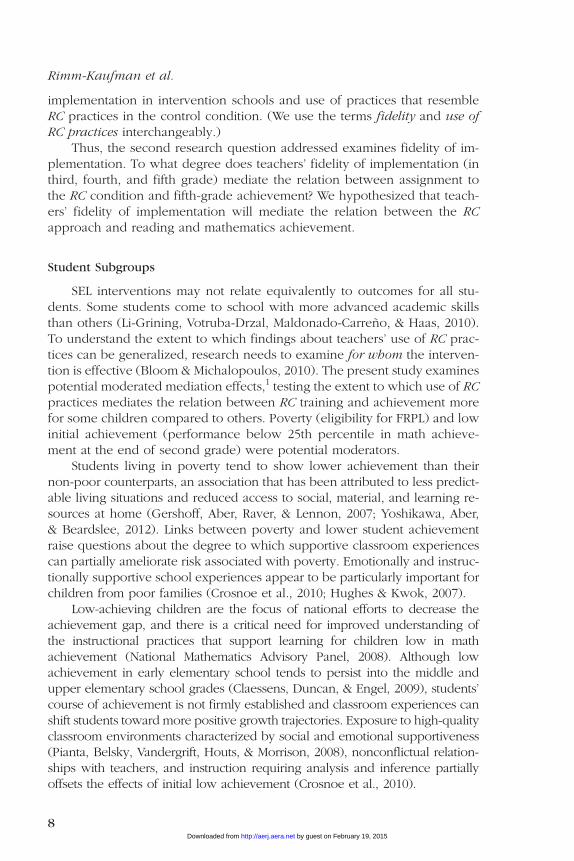
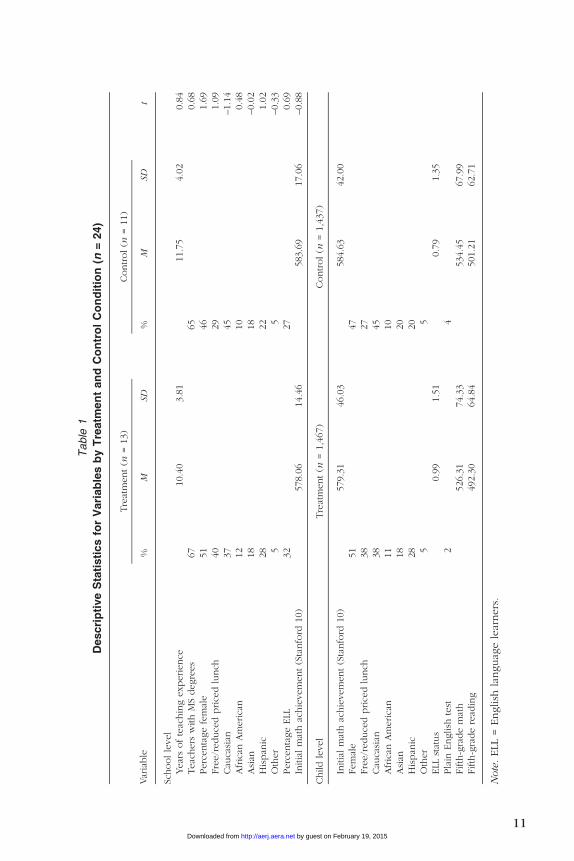
Schools were assigned randomly to intervention or waitlist control condi-tion. The methodologist generated random numbers for each of the 24 schoolsusing the random number function in Excel. The random number values as-signed to the schools were sorted; the top 12 schools were assigned to the treat-ment condition and the bottom 12 schools were assigned to the controlcondition. Tests were conducted to ensure treatment and control schoolswere comparable (on gender, FRPL, ethnic composition, ELL status). After ran-dom assignment, it became apparent from an informational survey that 2schools in the control condition had received low-level exposure to the RCintervention. In each school, the principal reported that one of the third-,fourth-, or fifth-grade teachers (\15% of sampled teachers at each school)had received a 1-week RC training. For example, at one school, the principaland some teachers acquired two NEFC-published books and used them toself-teach RC practices. Because of the low-level contamination, one of thetwo schools was selected at random and placed into the intervention condition,resulting in 13 intervention and 11 control schools. Control schools wereexempt from the district policy requiring selection of an SEL or behavioral learn-ing approach for the study duration. Student initial math achievement (Stanford10) was gathered after randomization. There were no statistically significant dif-ferences between treatment and control schools on gender, FRPL, ethnic com-position, ELL status, and student initial math achievement based onindependent t tests and logistic regressions at baseline. See Table 1.
Teacher participants (n = 276) were third-, fourth-, and fifth-grade teach-ers during the years of 2008–2009, 2009–2010, and 2010–2011, respectively.Teachers (95 third, 92 fourth, and 89 fifth) were primarily female (n = 248;90%) and had, on average, 10 years of experience (range, 1–38). Teacherswere mostly Caucasian (n = 232; 84%) with other ethnic groups represented(11 [4%] African American, 6 [2%] Asian, 10 [4%] Hispanic, and 17 [6%] Other).
All second graders attending the 24 study schools in spring 2008 wereenrolled in the study. Students entering third grade in 2008–2009, fourth gradein 2009–2010, and fifth grade in 2010–2011 at the 24 schools were included asparticipants. Two rationales guided student participant decisions: (1)Randomization occurred at the school level, and thus, our model includedtypical patterns of school transience (including exit and entrance) to improveecological validity; (2) school-level clustering reduced statistical power, and tocompensate, full information maximum likelihood (FIML) techniques wereused to handle missing data. (Additional information about missing data,school-level sampling, and analysis can be found in the analytic approach sec-tion.) In the final sample of students (n = 2,904) 1,422 (49%) were female and929 (32%) were eligible for FRPL. The sample was ethnically diverse (1,191[41%] Caucasian, 319 [11%] African American, 552 [19%] Asian, 697 [24%]Hispanic, 145 [5%] other). Schools identified 813 (28%) as ELL. See Table 1for description by treatment condition.
Rimm-Kaufman et al.
10 by guest on February 19, 2015http://aerj.aera.netDownloaded from
Table
1
Descri
pti
ve
Sta
tisti
cs
for
Vari
ab
les
by
Tre
atm
en
tan
dC
on
tro
lC
on
dit
ion
(n=
24)
Var
iable
Tre
atm
ent(n
=13)
Control(n
=11)
%M
SD%
MSD
t
Schoolle
vel
Year
softe
achin
gexperience
10.4
03.8
111.7
54.0
20.8
4Teac
hers
with
MS
degre
es
67
65
0.6
8Perc
enta
ge
fem
ale
51
46
1.6
9Fre
e/r
educe
dprice
dlu
nch
40
29
1.0
9Cau
casi
an37
45
–1.1
4Afr
ican
Am
erica
n12
10
0.4
8Asi
an18
18
–0.0
2H
ispan
ic28
22
1.0
2O
ther
55
–0.3
3Perc
enta
ge
ELL
32
27
0.6
9In
itia
lm
ath
achie
vem
ent(S
tanfo
rd10)
578.0
614.4
6583.6
917.0
6–0.8
8
Child
level
Tre
atm
ent(n
=1,4
67)
Control(n
=1,4
37)
Initia
lm
ath
achie
vem
ent(S
tanfo
rd10)
579.3
146.0
3584.6
342.0
0Fem
ale
51
47
Fre
e/r
educe
dprice
dlu
nch
38
27
Cau
casi
an38
45
Afr
ican
Am
erica
n11
10
Asi
an18
20
His
pan
ic28
20
Oth
er
55
ELL
stat
us
0.9
91.5
10.7
91.3
5Pla
inEnglish
test
24
Fifth
-gra
de
mat
h526.3
174.3
3534.4
567.9
9Fifth
-gra
de
read
ing
492.3
064.8
4501.2
162.7
1
Note
.ELL
=English
languag
ele
arners
.
11 by guest on February 19, 2015http://aerj.aera.netDownloaded from

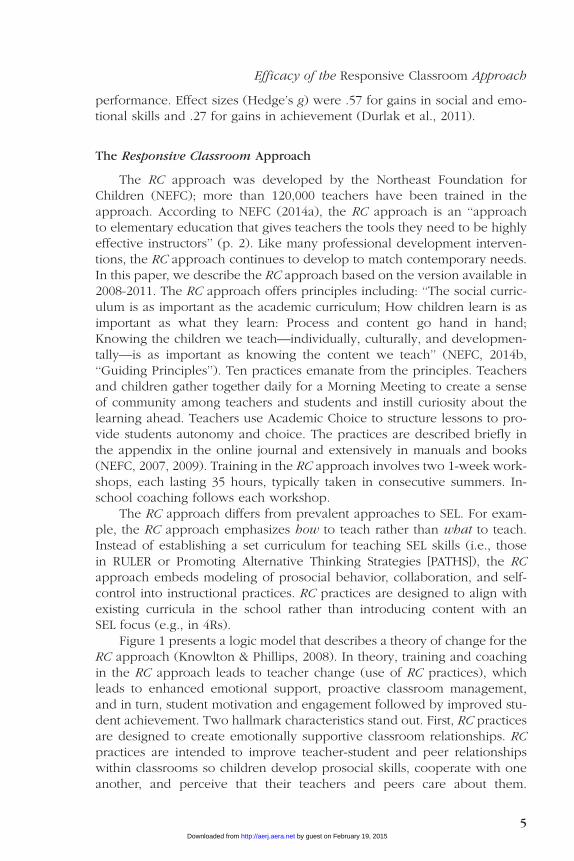
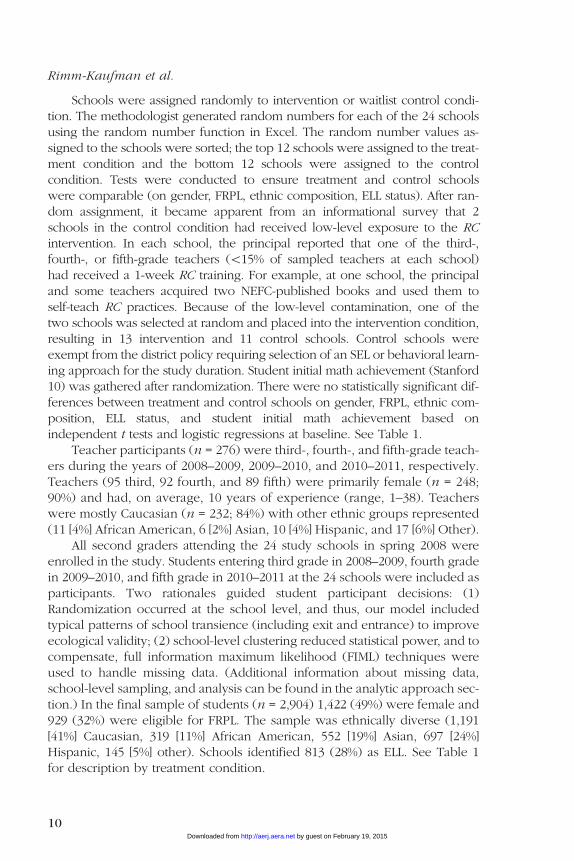
Figure 2 describes the pattern of students’ entrance and attrition from thesample from 2008 to 2011. The magnitude of student attrition (intervention, n= 395; control, n = 350) and student entrance (intervention, n = 527; control, n= 444) was comparable (p . .05) between intervention and control conditionsbetween end of second and fifth grades. Students (n = 109) in French andSpanish immersion classrooms were present only in the intervention groupand were excluded from analyses. Logistic regressions conducted to examinedifferential entrance and attrition between intervention and control conditionsby gender, FRPL, ethnicity, and ELL showed no statistically significant differen-ces between intervention and control schools (p . .10).
Intervention
Third-, fourth-, and fifth-grade teachers in the intervention conditionreceived training in the RC approach, involving two 1-week long trainingsessions, RC 1 and RC 2, delivered in two consecutive summers. Third-
Randomized: 24 Schools
Allocated to Control Condition11 Schools
993 Students
Allocated to the RC Intervention13 Schools
1049 Students
Students Exiting Intervention Schools395 Students
(29.10% of Analysis Sample)Students Entering Intervention Schools
527 Students (35.92% of Analysis Sample)
Students Exiting Control Schools350 Students
(24.36% of Analysis Sample)Students Entering Control Schools
444 Students(30.89% of Analysis Sample)
Analysis Sample 11 Schools
1437 Students
Excluded from Analysis: None
Analysis Sample 13 Schools
1467 Students
Excluded from Analysis:109 Students in French & Spanish
Immersion Classes
Follow-Up
Analysis
Allocation
Figure 2. Research design and attrition/addition flow through the Responsive
Classroom Efficacy Study.
Note. All students were included in the final analysis in keeping with the school-level
analysis.
Rimm-Kaufman et al.
12 by guest on February 19, 2015http://aerj.aera.netDownloaded from
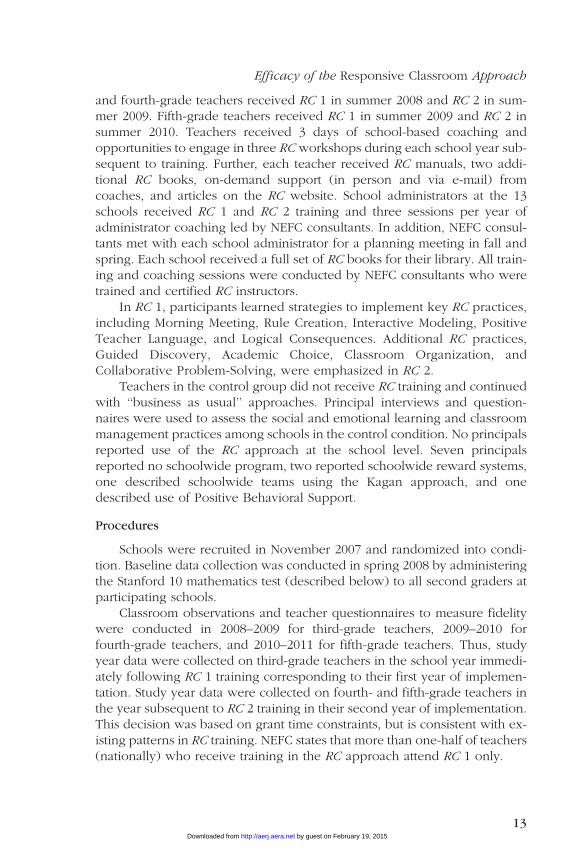
and fourth-grade teachers received RC 1 in summer 2008 and RC 2 in sum-mer 2009. Fifth-grade teachers received RC 1 in summer 2009 and RC 2 insummer 2010. Teachers received 3 days of school-based coaching andopportunities to engage in three RC workshops during each school year sub-sequent to training. Further, each teacher received RC manuals, two addi-tional RC books, on-demand support (in person and via e-mail) fromcoaches, and articles on the RC website. School administrators at the 13schools received RC 1 and RC 2 training and three sessions per year ofadministrator coaching led by NEFC consultants. In addition, NEFC consul-tants met with each school administrator for a planning meeting in fall andspring. Each school received a full set of RC books for their library. All train-ing and coaching sessions were conducted by NEFC consultants who weretrained and certified RC instructors.
In RC 1, participants learned strategies to implement key RC practices,including Morning Meeting, Rule Creation, Interactive Modeling, PositiveTeacher Language, and Logical Consequences. Additional RC practices,Guided Discovery, Academic Choice, Classroom Organization, andCollaborative Problem-Solving, were emphasized in RC 2.
Teachers in the control group did not receive RC training and continuedwith ‘‘business as usual’’ approaches. Principal interviews and question-naires were used to assess the social and emotional learning and classroommanagement practices among schools in the control condition. No principalsreported use of the RC approach at the school level. Seven principalsreported no schoolwide program, two reported schoolwide reward systems,one described schoolwide teams using the Kagan approach, and onedescribed use of Positive Behavioral Support.
Procedures
Schools were recruited in November 2007 and randomized into condi-tion. Baseline data collection was conducted in spring 2008 by administeringthe Stanford 10 mathematics test (described below) to all second graders atparticipating schools.
Classroom observations and teacher questionnaires to measure fidelitywere conducted in 2008–2009 for third-grade teachers, 2009–2010 forfourth-grade teachers, and 2010–2011 for fifth-grade teachers. Thus, studyyear data were collected on third-grade teachers in the school year immedi-ately following RC 1 training corresponding to their first year of implemen-tation. Study year data were collected on fourth- and fifth-grade teachers inthe year subsequent to RC 2 training in their second year of implementation.This decision was based on grant time constraints, but is consistent with ex-isting patterns in RC training. NEFC states that more than one-half of teachers(nationally) who receive training in the RC approach attend RC 1 only.
Efficacy of the Responsive Classroom Approach
13 by guest on February 19, 2015http://aerj.aera.netDownloaded from

Five classroom observations were conducted throughout the school yearfor each teacher to measure observed fidelity of implementation. For eachteacher, two observations were conducted during the first hour in the morn-ing and three observations were conducted for one hour during math les-sons. Observations were scheduled following a set of decision rules toensure evenness over the year and across schools and assignment condition.Observations corresponded to three windows (window 1: late September tolate November; window 2: late November to mid February; and window 3:late February to late April). Morning observations were conducted in two ofthe three windows with no more than two-thirds of the teachers at eachschool receiving a morning observation per window. Math observationswere conducted in each of the three windows. Research assistants con-ducted videotaping (for work beyond the scope of this article) and rated fi-delity of implementation using the Classroom Practices ObservationalMeasure (described below) for the full 60-minute observations. In April ofeach year, teachers were surveyed to gather information on teachers’ yearsof experience, teachers’ level of education, and two teacher-report measuresof fidelity of implementation, the Classroom Practices Teacher Survey andClassroom Practices Frequency Survey (described below). Teachers received$100 upon completion.
In May 2011, all students present in the fifth grade at the 24 schools weregiven the fifth-grade state standardized test, the Standards of Learning(Virginia Department of Education [VDOE], 2010). Students who were notEnglish proficient took the plain English math assessment, an equivalent,alternative form of the Standards of Learning math test. Student demographicand standardized test score data were gathered from school records.
Measures
School assignment to treatment condition (intervention vs. control) wasthe key independent variable. Fidelity, aggregated to the school level, wasassessed as a potential mediator. Student math and reading achievementin fifth grade were assessed as outcome variables. Students’ FRPL statusand initial achievement were included as focal variables in analyses testingfor moderated mediation. Child-level covariates included student demo-graphic characteristics (gender, FRPL, ethnicity, ELL), test form (plainEnglish vs. standard), and initial achievement. Four variables were aggre-gated to the school level and treated as covariates: teacher years of experi-ence, teacher education, student FRPL, and initial math achievement.
Fidelity of Implementation
Observed fidelity of implementation. The Classroom PracticesObservation Measure (CPOM) is a manualized observational measure ofteachers’ use of RC practices (fidelity) developed by the research team
Rimm-Kaufman et al.
14 by guest on February 19, 2015http://aerj.aera.netDownloaded from
with feedback from NEFC (Abry, Brewer, Nathanson, Sawyer, & Rimm-Kaufman, 2010). Raters observed and assessed teachers’ use of RC practicesduring a 60-minute period. Teachers were rated on 16 items during themorning observation (a = .87) and a subset of 10 items during math instruc-tion (a = .65). (The six Morning Meeting items were relevant to morning ob-servations only.) Each item was written without RC language so items could berated by research assistants with no knowledge of the RC approach and couldbe used in control and intervention classrooms. Internal consistency was com-parable in intervention and control conditions. CPOM was coded live, on siteusing the 3-point Likert scale (1 = not at all characteristic, 2 = moderately char-acteristic, 3 = very characteristic). The manual includes descriptions and exam-ples of practices that exemplify values of 1, 2, or 3 for each item. One exampleitem is, ‘‘Three to five general, positively worded rules are posted in the class-room.’’ The observer rating was based on three criteria: (a) number of rules (3to 5 vs. less or more), (b) generalness of rules (‘‘Be respectful’’ not ‘‘No talkingduring silent reading’’), and (c) rule positivity (‘‘Take turns’’ not ‘‘Don’t yell’’).The observer coded 1 if there were no rules posted or if posted rules metone of the three criteria; 2 if two of the three criteria were met; and 3 if all cri-teria were met. Other items were: ‘‘Teacher asks questions or makes statementsthat invite students to remember expected behaviors’’ and ‘‘Students make indi-vidualized choices related to an academic lesson or goal.’’ CPOM scores werecomputed as the mean of all items across five observations.
Two-day CPOM trainings were conducted by research assistants follow-ing a written protocol. Initial reliability was established using eight 60-min-ute master-coded videos, at minimum. Each coder exceeded 80% exactagreement on eight 1-hour segments prior to initiating data collection (val-ues were 84%, 80%, and 84% exact match for year 1, 2, and 3, respectively).Ongoing monthly drift meetings were conducted for calibration. Each coderviewed and individually coded a 60-minute classroom observation videoprior to the meeting. Codes brought to meetings were used to calculate per-centage agreement, resulting in an average of 85% exact match betweencoders and master coders over 3 years.
Teacher reported fidelity of implementation. Teachers reported on theirfidelity of implementation using two measures. The Classroom PracticesTeacher Survey (CPTS; Nathanson, Sawyer, & Rimm-Kaufman, 2007a) isa 46-item measure assessing adherence to RC practices (a = .91). CPTS itemsdid not contain any RC terminology, and internal consistency was compara-ble in intervention and control conditions. Teachers rated each item on a 5-point Likert scale (1 = not at all characteristic, 2 = a little bit characteristic, 3= moderately characteristic, 4 = very characteristic, 5 = extremely character-istic). Examples include: ‘‘In the morning we have a class meeting where wesit in a circle facing one another’’ and ‘‘When introducing new materials, Iask students to demonstrate ideas for how to use and care for the materials.’’CPTS composite scores were computed as means of the 46 items.
Efficacy of the Responsive Classroom Approach
15 by guest on February 19, 2015http://aerj.aera.netDownloaded from
The Classroom Practices Frequency Scale (CPFS; Nathanson et al.,2007b) is an 11-item measure assessing teachers’ perceived frequency ofuse of RC practices over the course of the school year (a = .88). Internal con-sistency was comparable in intervention and control conditions. Items wererated on an 8-point scale ranging from 1 = almost never used the practice, 2 =1 3 per month, 3 = 2–4 3 per month, 4 = 1 3 per week, 5 = 2–3 3 per week,6 = 4 3 per week, 7 = 1 3 per day, 8 = used the practice more than oncea day. Items did not use RC terminology. Items include: ‘‘When a rule or pro-cedure is introduced, I asked students to model what following the rule orprocedure looks like’’ and ‘‘I provide opportunities for students to choosehow to do work, what kind of work to do, or both.’’ Mean values were com-puted for the 11 items.
Fidelity factor score. Confirmatory factor analysis was used to combinethe three fidelity measures (CPOM, CPTS, and CPFS) into a single fidelity var-iable that weighted each measure differentially according to its contributionto a single underlying latent variable. Resulting factor loadings exceeded .90.Cronbach’s alpha for the factor score equaled .94 and indicated unidimen-sionality. Factor scores were used in subsequent fidelity analyses.
Student Achievement Outcomes
Fifth-grade achievement. The paper version of the state standardizedtest, the Standard of Learning (SOL), was used to assess mathematics andreading achievement in May of students’ fifth-grade year (VDOE, 2008).The mathematics test comprised of 50 multiple choice items (a = .88) tap-ping students’ procedural knowledge and conceptual understanding offour skill categories: (a) number and number sense, (b) computation andestimation, (c) measurement and geometry, and (d) probability, statistics,patterns, functions, and algebra (VDOE, 2010). The reading test is comprisedof 40 multiple choice items (a = .85–.87) to measure two skills: (a) students’reading and print material comprehension and (b) use of word analysis strat-egies and information resources. A state data team summed the number ofcorrect items, converted the value to a scaled score (ranging from 0 to600), and transmitted data to the district. The research team garnered scoresfrom the district.
VDOE (2008) describes test development, calibration, and validity. Testitems were developed through collaboration among Virginia educators,VDOE, Educational Testing Service, Pearson, and content experts basedupon test blueprints. Calibration was established using Rasch modelingand the Partial Credit model. Test validity was established by gatheringempirical evidence supporting the face validity, intrinsic rational validity,content validity, and construct validity. VDOE (2008) offers the standardand plain English versions for math.
Rimm-Kaufman et al.
16 by guest on February 19, 2015http://aerj.aera.netDownloaded from

Covariates and Variables for Moderated Mediation
Student characteristics. Baseline student math achievement was gath-ered using the Stanford 10 abbreviated mathematics test (HarcourtEducational Measurement, 2003). Gender, FRPL, ethnicity, ELL status, andtest form administered (regularly or plain English version of the math SOLtest) were gathered from district data. Gender was coded as 1 = female,0 = male. Qualification for FRPL (1 = yes, 0 = no) was defined as $40,793for a family of four, roughly below 180% of the federal poverty guideline.Ethnicity was based upon parent report of ethnicity upon student matricula-tion. ELL status was based on a district-developed scale and cutpoint: stu-dents were assigned a value of 1 if they were receiving ELL services anda value of 0 if they were not receiving ELL services.
Students completed the plain English math version of the mathematicstest if the student’s teacher designated that the student had a learning disabil-ity or limited English proficiency. The plain English math version used thesame scoring system as the SOL and was designed to be equivalent to stan-dard math assessment (VDOE, 2008). Test form data were garnered from thedistrict and coded 1 = plain English, 0 = standard form.
Baseline student math achievement, gender, FRPL, ethnicity, ELL, andtest form were included as student covariates. FRPL and low initial mathachievement were used in moderated mediation analyses. The cutoff forlow initial math achievement was below the 25th percentile on theStanford 10, a decision reflecting review of comparable decisions (Baker,Gersten, & Lee, 2002).
School-level covariates. Data on teacher characteristics (years of teachingexperience, level of education) were gathered in a teacher survey. Years ofteaching experience referred to total years of teaching experience; level ofeducation was coded as 1 = master’s degrees or higher. Years teaching expe-rience and level of education were averaged across study years and aggre-gated to the school level for analysis. School characteristics were gatheredfrom school record data and included gender, percentage of students eligiblefor FRPL, school ethnic composition, and percentage of ELL students.School-level achievement at baseline was based upon the Stanford 10 math-ematics test aggregated up to the school level.
Analytic Approach
Structural equation modeling (SEM) analyses were conducted to test the(a) main effect of treatment on outcomes, (b) the mediated effect of treat-ment on outcomes through fidelity, and (c) moderated mediation, examin-ing the extent to which the mediated effect of treatment on outcomesthrough fidelity varies with students’ eligibility for FRPL and initial abilitylevel. Analyses were conducted using Mplus 6.12 (Muthen & Muthen,1998–2010) using a maximum likelihood estimator with TYPE=COMPLEX
Efficacy of the Responsive Classroom Approach
17 by guest on February 19, 2015http://aerj.aera.netDownloaded from
to control for clustering. Clustering was conducted at the school level, cor-responding to the level of randomization and consistent with Murray,Hannan, and Baker (1996). A Monte Carlo integration estimator was usedto achieve convergence. (Note that this estimator does not produce tradi-tional fit statistics.) Initially, math and reading achievement outcomes wereincluded in the same model but the model did not converge. Therefore, sep-arate models were conducted for each outcome. Ethnicity variables wereincluded in SEM analyses but results are not reported in accordance withthe district memorandum of agreement.
The decision to analyze fidelity of implementation data at the school levelinstead of the teacher level requires further explanation. Data were gatheredon students over 3 years. The classroom composition changed over the 3years; students nested in one classroom in third grade were often scatteredamong various classrooms in fourth grade and a different set of classroomsin fifth grade. Such nesting is difficult to model. In addition, some of theschools had students move among classrooms for reading, math, and othersubjects, and therefore, students were exposed to two, three, or four teacherson any given day. For example, students may have been exposed to low levelof RC practices in the morning in one classroom but a higher level of RC prac-tices later in the day in another classroom. We were unable to gather data onwhich children were exposed to which teacher and for how long within eachyear. Thus, we aggregated fidelity to school level because it matched the levelof randomization and addressed changes in the nesting structure across the 3years and across typical schools days. Findings can be interpreted in relationto what schools comparable to those sampled could expect from adoptingand implementing the RC approach over a 3-year period.
SEM assumes normality of the endogenous variables, linear relationsbetween variables, independence of observations, and independent exoge-nous variables. Data were examined using histograms, bivariate correlationtables, QQ-plots, variance inflation factors, and other methods. The data metassumptions of normality, linearity, and independent exogenous variables.
As depicted in Figure 2, students entered and exited the 24 study schoolsover the 3 years. Student attrition from third to fifth grade was considerablewith missing data of approximately 30% for both the fifth-grade math andreading achievement. As mentioned previously, there was no relationbetween any of the covariates/outcomes and missing data at the schoollevel. Thus, the data were considered to be missing at random (MAR).Traditional missing data techniques such as listwise deletion, pairwise dele-tion, or mean imputation have been shown to have lower power and morebias of the parameters in the presence of MAR data (Allison, 2002; Enders &Bandalos, 2001; Schafer & Graham, 2002). Thus, missing data in this modelwere handled through FIML. FIML uses all available data to estimate param-eters and thus leads to unbiased parameter and standard error estimates(Little & Rubin, 1987).
Rimm-Kaufman et al.
18 by guest on February 19, 2015http://aerj.aera.netDownloaded from
We observed substantial ceiling effects for the outcomes; 23.7% of thestudents scored the maximum math score, 5.9% scored the maximum read-ing score. Thus, outcomes showing ceiling effects were treated as censoredvariables (Klein & Moeschberger, 1997), a process involving the treatment ofmaximum scores as lower bounds for students’ true latent score. Thisapproach to accounting for censored outcomes leads to less biased estimates(Long, 1997).
Standardized coefficients were calculated based on the unstandardizedcoefficients emanating from MPlus output in order to present a coefficientindicating effect size. In the case of a continuous covariate the following for-mula was used:
b ¼ ðSX BrawÞ=Sy
SX is the estimated standard deviation (SD) of the continuous covariate, Braw
is the raw coefficient produced by Mplus, and Sy is the SD of the predictedvariable. The standardized coefficient is interpreted as the expected numberof SDs that y (the outcome) would increase with a one SD increase in x (thecontinuous predictor). The following formula was used for categoricalcovariates:
b ¼ Braw=Sy
The second formula lacks SX in the numerator because categorical covariatesdo not have meaningful SDs. The standardized coefficient in this case can beinterpreted as the expected number of SDs that y (the outcome) wouldincrease as x (the categorical predictor) increases from 0 to 1 (i.e., from con-trol to treatment condition). Standardized coefficients for indirect effectswere calculated by multiplying standardized coefficient of the treatment tofidelity path by the standardized coefficient of the fidelity to outcome path.
Results
Descriptive Statistics
Table 1 presents the means and SDs for all independent and dependentvariables and covariates for intervention and control schools at the schooland child levels. Table 2 shows school-level correlation coefficients. The cor-relation between treatment assignment and the fidelity of implementationfactor was very high (r = .91, p \ .01). Fifth-grade reading and math scoreswere correlated (r = .53, p \ .01). Initial achievement levels (aggregated tothe school level) correlated positively with fifth-grade achievement for read-ing (r = .78, p \ .01) and math (r = .50, p \ .05). Higher concentration ofstudents at the school eligible for FRPL related to lower initial achievement(r = –.75, p \ .01), fifth-grade math (r = –.65, p \ .01), and reading achieve-ment (r = –.89, p \ .01).
Efficacy of the Responsive Classroom Approach
19 by guest on February 19, 2015http://aerj.aera.netDownloaded from
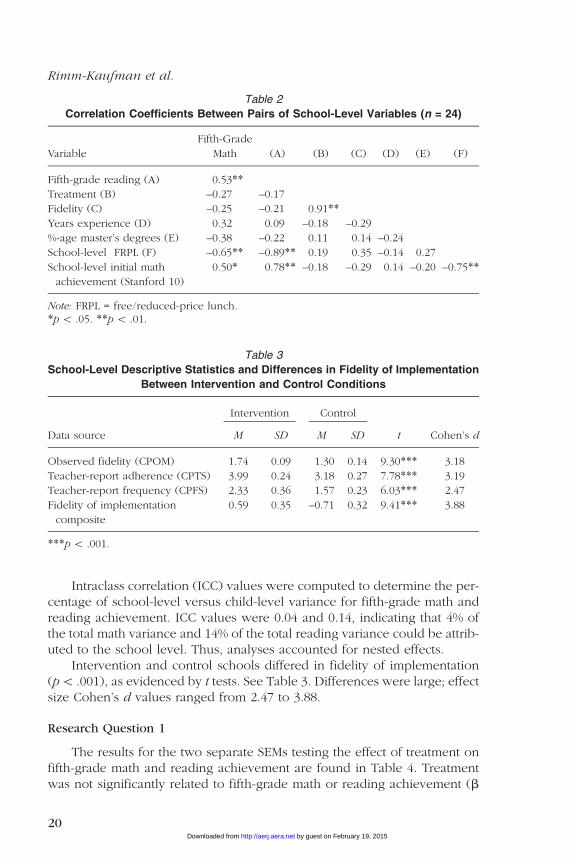
Intraclass correlation (ICC) values were computed to determine the per-centage of school-level versus child-level variance for fifth-grade math andreading achievement. ICC values were 0.04 and 0.14, indicating that 4% ofthe total math variance and 14% of the total reading variance could be attrib-uted to the school level. Thus, analyses accounted for nested effects.
Intervention and control schools differed in fidelity of implementation(p\ .001), as evidenced by t tests. See Table 3. Differences were large; effectsize Cohen’s d values ranged from 2.47 to 3.88.
Research Question 1
The results for the two separate SEMs testing the effect of treatment onfifth-grade math and reading achievement are found in Table 4. Treatmentwas not significantly related to fifth-grade math or reading achievement (b
Table 3
School-Level Descriptive Statistics and Differences in Fidelity of Implementation
Between Intervention and Control Conditions
Intervention Control
Data source M SD M SD t Cohen’s d
Observed fidelity (CPOM) 1.74 0.09 1.30 0.14 9.30*** 3.18
Teacher-report adherence (CPTS) 3.99 0.24 3.18 0.27 7.78*** 3.19
Teacher-report frequency (CPFS) 2.33 0.36 1.57 0.23 6.03*** 2.47
Fidelity of implementation
composite
0.59 0.35 –0.71 0.32 9.41*** 3.88
***p \ .001.
Table 2
Correlation Coefficients Between Pairs of School-Level Variables (n = 24)
Variable
Fifth-Grade
Math (A) (B) (C) (D) (E) (F)
Fifth-grade reading (A) 0.53**
Treatment (B) –0.27 –0.17
Fidelity (C) –0.25 –0.21 0.91**
Years experience (D) 0.32 0.09 –0.18 –0.29
%-age master’s degrees (E) –0.38 –0.22 0.11 0.14 –0.24
School-level FRPL (F) –0.65** –0.89** 0.19 0.35 –0.14 0.27
School-level initial math
achievement (Stanford 10)
0.50* 0.78** –0.18 –0.29 0.14 –0.20 –0.75**
Note: FRPL = free/reduced-price lunch.*p \ .05. **p \ .01.
Rimm-Kaufman et al.
20 by guest on February 19, 2015http://aerj.aera.netDownloaded from

= –.13 for math, b = –.06 for reading). Girls had significantly higher math andreading achievement scores than boys. FRPL eligibility was associated nega-tively to math and reading achievement. Both ELL status and completion ofthe plain English test related negatively to math and reading. Initial mathachievement related positively to fifth-grade math and reading. The modelsaccounted for a substantial portion of the variance in achievement outcomes(R2 = .35 for math, R2 =.45 for reading).
Research Question 2
SEM analyses were conducted to examine the extent to which fidelity ofimplementation (use of RC practices) mediated the relation between assign-ment to the RC approach condition and achievement outcomes. The samechild- and school-level covariates described in Table 4 were included inmodels described in Table 5. Fidelity was positively related to fifth-grademath and reading (b = .26, p \ .01; b = .30, p \ .01, respectively).Treatment related positively to fidelity (b = 1.73, p \ .01). School-level per-centage FRPL related positively, and teachers’ years of experience relatednegatively to fidelity.
The direct effect of random assignment to treatment was negative forboth outcomes (b = –.60, p \ .01 for math; b = –.58, p \ .01 for reading),
Table 4
Main Effect Model of Treatment on Fifth-Grade Math and Reading Achievement
Math Achievement Reading Achievement
Variable Name B SE b B SE b
Child level
Gender (female) 11.63** 4.43 0.16 14.24** 2.50 0.22
Free/reduced price lunch –11.16* 4.37 –0.16 –11.96** 3.80 –0.19
ELL status –5.07* 2.21 –0.10 –7.57** 1.59 –0.17
Plain English test –40.21** 11.75 –0.56 –28.81** 9.75 –0.45
Initial math achievement 1.10** 0.11 0.63 0.76** 0.05 0.49
School level
Treatment status –9.48 6.19 –0.13 –3.95 4.77 –0.06
Years of experience 0.79 1.02 0.04 –0.32 0.55 –0.02
Percentage of master’s degrees –14.06 21.90 –0.03 –6.59 16.78 –0.01
Percentage FRPL (school level) –0.20 0.18 –0.07 –0.23 0.15 –0.08
Initial math achievement
(school level)
–0.26 0.32 –0.06 0.70** 0.24 0.17
Note. R2 = 0.35 for math achievement. R2 = 0.45 for reading achievement. Child-level initialmath achievement is group-mean centered. ELL = English language learner.*p \ .05. **p \ .01.
Efficacy of the Responsive Classroom Approach
21 by guest on February 19, 2015http://aerj.aera.netDownloaded from
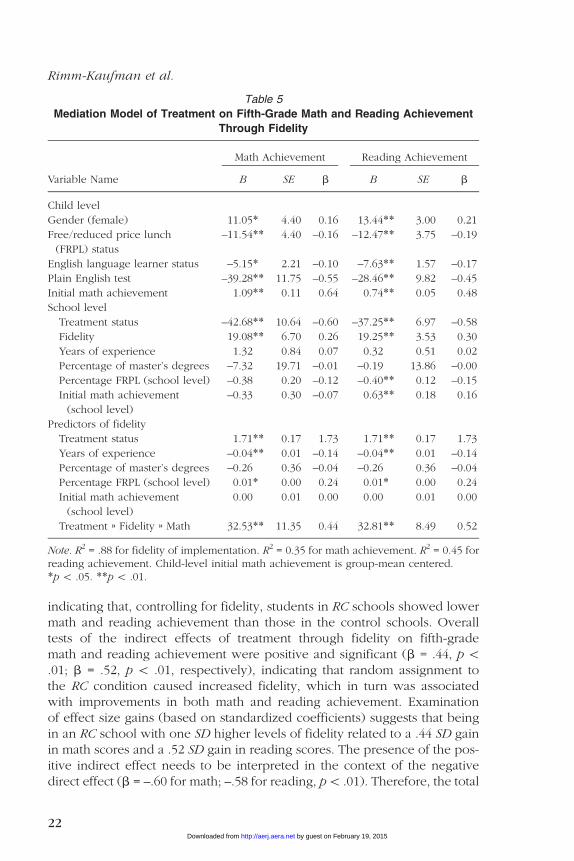
indicating that, controlling for fidelity, students in RC schools showed lowermath and reading achievement than those in the control schools. Overalltests of the indirect effects of treatment through fidelity on fifth-grademath and reading achievement were positive and significant (b = .44, p \.01; b = .52, p \ .01, respectively), indicating that random assignment tothe RC condition caused increased fidelity, which in turn was associatedwith improvements in both math and reading achievement. Examinationof effect size gains (based on standardized coefficients) suggests that beingin an RC school with one SD higher levels of fidelity related to a .44 SD gainin math scores and a .52 SD gain in reading scores. The presence of the pos-itive indirect effect needs to be interpreted in the context of the negativedirect effect (b = –.60 for math; –.58 for reading, p\ .01). Therefore, the total
Table 5
Mediation Model of Treatment on Fifth-Grade Math and Reading Achievement
Through Fidelity
Math Achievement Reading Achievement
Variable Name B SE b B SE b
Child level
Gender (female) 11.05* 4.40 0.16 13.44** 3.00 0.21
Free/reduced price lunch
(FRPL) status
–11.54** 4.40 –0.16 –12.47** 3.75 –0.19
English language learner status –5.15* 2.21 –0.10 –7.63** 1.57 –0.17
Plain English test –39.28** 11.75 –0.55 –28.46** 9.82 –0.45
Initial math achievement 1.09** 0.11 0.64 0.74** 0.05 0.48
School level
Treatment status –42.68** 10.64 –0.60 –37.25** 6.97 –0.58
Fidelity 19.08** 6.70 0.26 19.25** 3.53 0.30
Years of experience 1.32 0.84 0.07 0.32 0.51 0.02
Percentage of master’s degrees –7.32 19.71 –0.01 –0.19 13.86 –0.00
Percentage FRPL (school level) –0.38 0.20 –0.12 –0.40** 0.12 –0.15
Initial math achievement
(school level)
–0.33 0.30 –0.07 0.63** 0.18 0.16
Predictors of fidelity
Treatment status 1.71** 0.17 1.73 1.71** 0.17 1.73
Years of experience –0.04** 0.01 –0.14 –0.04** 0.01 –0.14
Percentage of master’s degrees –0.26 0.36 –0.04 –0.26 0.36 –0.04
Percentage FRPL (school level) 0.01* 0.00 0.24 0.01* 0.00 0.24
Initial math achievement
(school level)
0.00 0.01 0.00 0.00 0.01 0.00
Treatment » Fidelity » Math 32.53** 11.35 0.44 32.81** 8.49 0.52
Note. R2 = .88 for fidelity of implementation. R2 = 0.35 for math achievement. R2 = 0.45 forreading achievement. Child-level initial math achievement is group-mean centered.*p \ .05. **p \ .01.
Rimm-Kaufman et al.
22 by guest on February 19, 2015http://aerj.aera.netDownloaded from
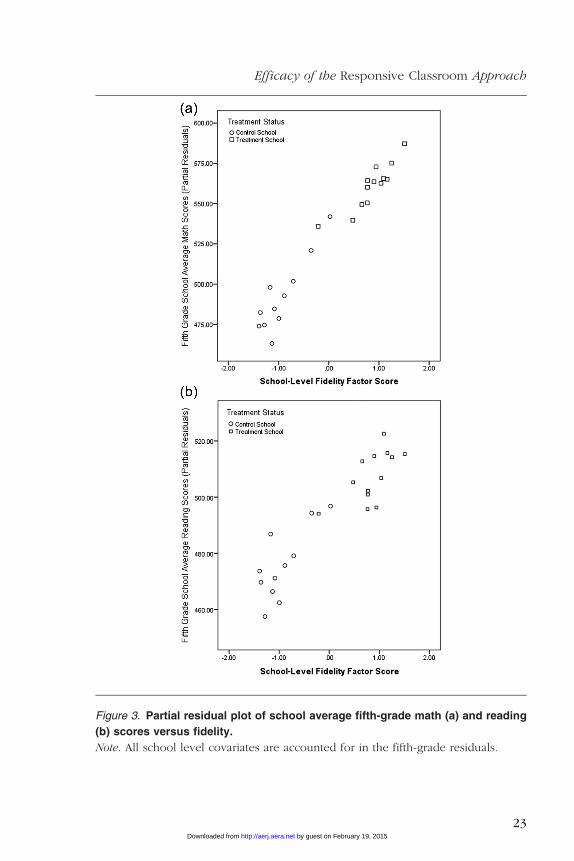
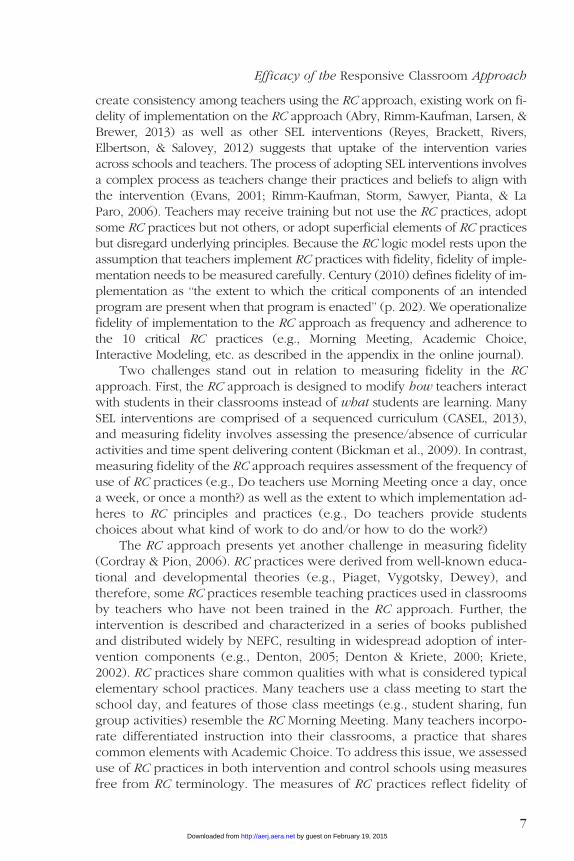
Figure 3. Partial residual plot of school average fifth-grade math (a) and reading
(b) scores versus fidelity.
Note. All school level covariates are accounted for in the fifth-grade residuals.
Efficacy of the Responsive Classroom Approach
23 by guest on February 19, 2015http://aerj.aera.netDownloaded from

effects of random assignment (indirect effects of treatment plus the directeffect of treatments) are small and nonsignificant for both outcomes.
Partial residual plots (Larsen & McCleary, 1972) were created to displayresults graphically. Figure 3 shows partial residual plots for fifth-gradeachievement and fidelity. The figure shows that all intervention schoolsexcept one showed higher fidelity and fifth-grade math and reading achieve-ment compared to control schools, after controlling for covariates.
Research Question 3
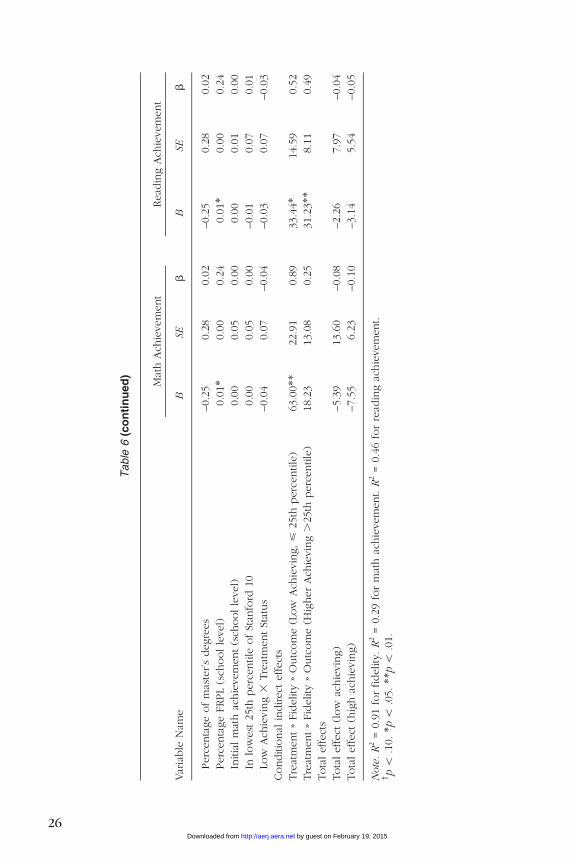
Analyses were conducted to test the possibility of moderated mediation,such that the relation between treatment, fidelity, and the outcomes differeddepending on students’ eligibility for FRPL and students’ initial mathachievement (\25th percentile). Separate SEM models were conducted foreach potential moderator for math and reading. Models allowed the pathsfrom treatment status to fidelity, treatment status to achievement, and fidelityto achievement to vary depending on the moderators. Results showed nosignificant moderation effects for FRPL for either outcome. Initial achieve-ment showed significant moderated mediation in relation to math achieve-ment. The relation between fidelity and math achievement was strongerfor students with low initial achievement. As a result, the overall mediation(RC to fidelity to math achievement) was significant for low-achieving stu-dents but not higher achieving students. Examination of effect size gains(based on standardized coefficients) suggests that being in an RC schoolwith one SD higher levels of RC fidelity related to a .89 SD gain in mathscores for students low in initial achievement but only a .25 SD gain inmath scores for students higher in initial achievement. Initial achievementdid not moderate any of the paths in the model predicting reading achieve-ment. See Table 6.
Discussion
We discuss findings from a clustered randomized controlled trial on theRC approach and achievement in relation to three foci: (a) the impact of theRC approach over 3 years on students’ reading and math achievement, (b)the extent to which fidelity of implementation mediated the relations oftreatment assignment (intervention vs. control) with reading and mathachievement, and (c) the extent to which paths in the mediation modelswere moderated by FRPL status and low initial math achievement.
Impact of the RC Approach
Random assignment to intervention versus control schools did notimpact student achievement outcomes. Although the result was counter toour hypothesis, other RCT results linking SEL interventions to SEL outcomes
Rimm-Kaufman et al.
24 by guest on February 19, 2015http://aerj.aera.netDownloaded from
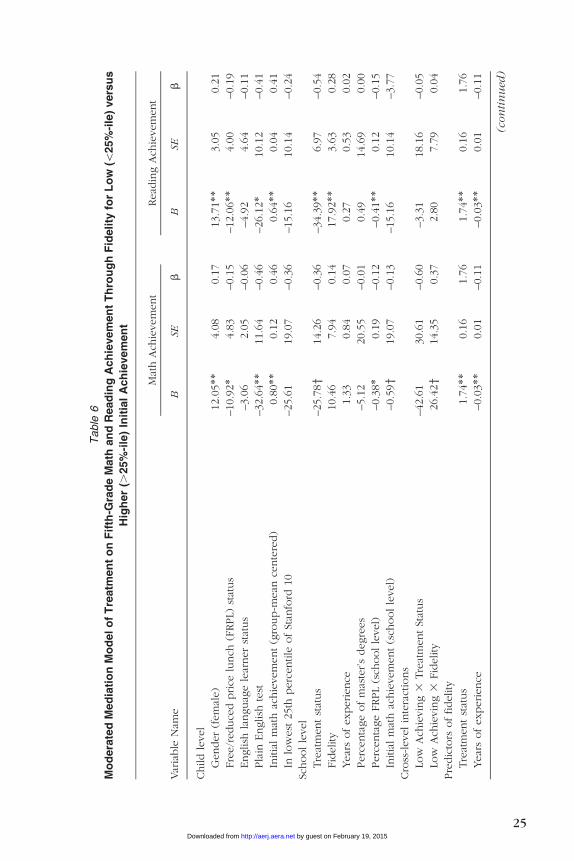
Table
6
Mo
dera
ted
Med
iati
on
Mo
del
of
Tre
atm
en
to
nF
ifth
-Gra
de
Math
an
dR
ead
ing
Ach
ievem
en
tT
hro
ug
hF
ideli
tyfo
rL
ow
(\25%
-ile
)vers
us
Hig
her
(.25%
-ile
)In
itia
lA
ch
ievem
en
t
Mat
hAch
ievem
ent
Read
ing
Ach
ievem
ent
Var
iable
Nam
eB
SEb
BSE
b
Child
level
Gender
(fem
ale)
12.0
5**
4.0
80.1
713.7
1**
3.0
50.2
1
Fre
e/r
educe
dprice
lunch
(FRPL)
stat
us
–10.9
2*
4.8
3–0.1
5–12.0
6**
4.0
0–0.1
9
English
languag
ele
arner
stat
us
–3.0
62.0
5–0.0
6–4.9
24.6
4–0.1
1
Pla
inEnglish
test
–32.6
4**
11.6
4–0.4
6–26.1
2*
10.1
2–0.4
1
Initia
lm
ath
achie
vem
ent(g
roup-m
ean
cente
red)
0.8
0**
0.1
20.4
60.6
4**
0.0
40.4
1
Inlo
west
25th
perc
entile
ofSt
anfo
rd10
–25.6
119.0
7–0.3
6–15.1
610.1
4–0.2
4
Schoolle
vel
Tre
atm
entst
atus
–25.7
8y
14.2
6–0.3
6–34.3
9**
6.9
7–0.5
4
Fid
elity
10.4
67.9
40.1
417.9
2**
3.6
30.2
8
Year
sofexperience
1.3
30.8
40.0
70.2
70.5
30.0
2
Perc
enta
ge
ofm
aste
r’s
degre
es
–5.1
220.5
5–0.0
10.4
914.6
90.0
0
Perc
enta
ge
FRPL
(sch
oolle
vel)
–0.3
8*
0.1
9–0.1
2–0.4
1**
0.1
2–0.1
5
Initia
lm
ath
achie
vem
ent(s
choolle
vel)
–0.5
9y
19.0
7–0.1
3–15.1
610.1
4–3.7
7
Cro
ss-levelin
tera
ctio
ns
Low
Ach
ievin
g3
Tre
atm
entSt
atus
–42.6
130.6
1–0.6
0–3.3
118.1
6–0.0
5
Low
Ach
ievin
g3
Fid
elity
26.4
2y
14.3
50.3
72.8
07.7
90.0
4
Pre
dic
tors
offidelity
Tre
atm
entst
atus
1.7
4**
0.1
61.7
61.7
4**
0.1
61.7
6
Year
sofexperience
–0.0
3**
0.0
1–0.1
1–0.0
3**
0.0
1–0.1
1
(con
tin
ued
)
25 by guest on February 19, 2015http://aerj.aera.netDownloaded from
Table
6(c
on
tin
ued
)
Mat
hAch
ievem
ent
Read
ing
Ach
ievem
ent
Var
iable
Nam
eB
SEb
BSE
b
Perc
enta
ge
ofm
aste
r’s
degre
es
–0.2
50.2
80.0
2–0.2
50.2
80.0
2
Perc
enta
ge
FRPL
(sch
oolle
vel)
0.0
1*
0.0
00.2
40.0
1*
0.0
00.2
4
Initia
lm
ath
achie
vem
ent(s
choolle
vel)
0.0
00.0
50.0
00.0
00.0
10.0
0
Inlo
west
25th
perc
entile
ofSt
anfo
rd10
0.0
00.0
50.0
0–0.0
10.0
70.0
1
Low
Ach
ievin
g3
Tre
atm
entSt
atus
–0.0
40.0
7–0.0
4–0.0
30.0
7–0.0
3
Conditio
nal
indirect
effect
s
Tre
atm
ent»
Fid
elity
»O
utc
om
e(L
ow
Ach
ievin
g,
<25th
perc
entile
)63.0
0**
22.9
10.8
933.4
4*
14.5
90.5
2
Tre
atm
ent»
Fid
elity
»O
utc
om
e(H
igher
Ach
ievin
g.
25th
perc
entile
)18.2
313.0
80.2
531.2
3**
8.1
10.4
9
Tota
leffect
s
Tota
leffect
(low
achie
vin
g)
–5.3
913.6
0–0.0
8–2.2
67.9
7–0.0
4
Tota
leffect
(hig
hac
hie
vin
g)
–7.5
56.2
3–0.1
0–3.1
45.5
4–0.0
5
Note
.R
2=
0.9
1fo
rfidelity
.R
2=
0.2
9fo
rm
ath
achie
vem
ent.
R2
=0.4
6fo
rre
adin
gac
hie
vem
ent.
yp
\.1
0.*p
\.0
5.**p
\.0
1.
26 by guest on February 19, 2015http://aerj.aera.netDownloaded from

are comparably lackluster (SACD, 2010). Several explanations are plausible.Treatment was randomized at the school level, and thus, analyses were alsoconducted at the school level. The a priori power analysis suggested suffi-cient statistical power to detect small to medium effects (.85 assuming ICCvalues of .10); however, this number of schools was far from ideal. Thereal effect size could be smaller than anticipated and the study conductedhere may have lacked sufficient statistical power to detect effects. Second,other constructs believed to be integral to our logic model (e.g., studentmotivation and engagement) may not adequately translate into outcomesmeasured by state standardized achievement tests (Duckworth, Quinn, &Tsukayama, 2012). A third reason pertains to fidelity of implementation ofthe RC approach. We describe this point carefully because the explanationis consistent with accumulated research pointing to the importance ofhigh-quality implementation of SEL interventions for predicting child out-comes (Domitrovich et al., 2008) and also because this point has the greatestrelevance for practitioners making decisions about use of the RC approach.
Role of Fidelity of Implementation
Training in the RC approach produced large changes in teacher practi-ces. Measures of both frequency and adherence to the RC approach indicatethe presence of treatment differentiation between intervention and controlschools (effect size d values: 2.47–3.88). We used teacher-report and obser-vational fidelity measures to determine whether the intervention was deliv-ered and to assess the quality of that delivery (O’Donnell, 2008). Fidelityresults were consistent with the program logic model, permitting us to inves-tigate fidelity as a mechanism for explaining potential outcomes. An impor-tant nuance emerged from fidelity analyses. Results revealed evidence ofhigh but variable intervention uptake among intervention schools and lowbut variable RC practices in control schools. It is not surprising that RC prac-tices were present in control schools given the common origins between RCpractices and ‘‘best practices’’ in teaching and intervention diffusion(Hulleman & Cordray, 2009).
Receiving the RC training produced gains in RC practices, which in turnwas associated with improvements in both math and reading achievement.The effect size (based on standardized coefficients) between use of RC prac-tices and student achievement was .26 and .30 for math and reading, respec-tively. Findings from the Durlak et al. (2011) meta-analysis report effect sizes(Hedge’s g) of .27 for SEL interventions on achievement and describe lowereffect sizes in the presence of fidelity problems. Results from a meta-analysisof 76 meta-analytic papers on educational interventions give benchmark ef-fects for the elementary grades ranging from .22 to .23 (Hill, Bloom, Black, &Lipsey, 2008). The effect size values for the association from RC practices to
Efficacy of the Responsive Classroom Approach
27 by guest on February 19, 2015http://aerj.aera.netDownloaded from
achievement are comparable to those for SEL and other educational inter-ventions for this age group.
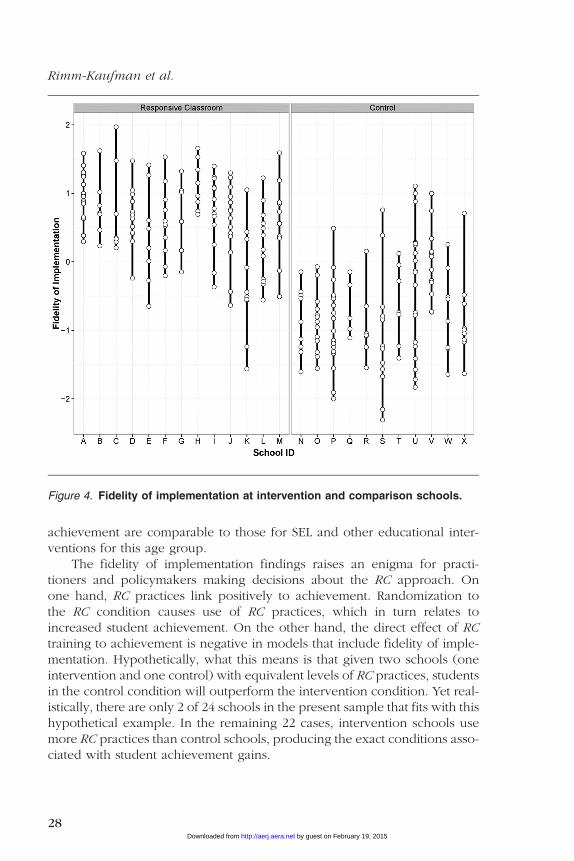
The fidelity of implementation findings raises an enigma for practi-tioners and policymakers making decisions about the RC approach. Onone hand, RC practices link positively to achievement. Randomization tothe RC condition causes use of RC practices, which in turn relates toincreased student achievement. On the other hand, the direct effect of RCtraining to achievement is negative in models that include fidelity of imple-mentation. Hypothetically, what this means is that given two schools (oneintervention and one control) with equivalent levels of RC practices, studentsin the control condition will outperform the intervention condition. Yet real-istically, there are only 2 of 24 schools in the present sample that fits with thishypothetical example. In the remaining 22 cases, intervention schools usemore RC practices than control schools, producing the exact conditions asso-ciated with student achievement gains.
Figure 4. Fidelity of implementation at intervention and comparison schools.
Rimm-Kaufman et al.
28 by guest on February 19, 2015http://aerj.aera.netDownloaded from
The enigma here stems from the common problem of treatment hetero-geneity in cluster randomized controlled trials (Cook, 2005). Schools vary intheir use of RC practices, as shown in Figure 4. Such variability calls attentionto factors that predict successful uptake of RC practices. As one example,mixed-methods research from RCES shows the importance of school leader-ship. Teachers’ perception of their principals’ ‘‘buy-in’’ to the interventionrelated to teachers’ use of RC practices. Teachers questioned using the RC prac-tices if they thought their principals adopted the approach to acquire funds orprestige. Also, teachers used fewer practices if their principals adopted pro-grams that conflicted with RC principles but used more practices if their princi-pal made structural accommodations to engender their use (Wanless, Patton,Rimm-Kaufman, & Deutsch, 2013). Other SEL work (e.g., PATHS) shows theimportance of administrative support in predicting higher quality of implemen-tation of the intervention (Ransford, Greenberg, Domitrovich, Small, &Jacobson, 2009). Schools are social systems in which leadership decisions influ-ence teachers, students, and psychological experiences within the school (Bryk,Sebring, Allensworth, Easton, & Luppescu, 2010). Administrators who conveyclear support for the RC approach and indicate commitment to long-term adop-tion may enhance teachers’ use of RC practices.
Other factors are likely to be important predictors of uptake of the RCapproach. Teachers’ psychological state (e.g., burnout, self-efficacy) andtheir perceived value of the program have been implicated in schoolwideSEL adoption (Brackett, Reyes, Rivers, Elbertson, & Salovey, 2011;Ransford et al., 2009). Effective coaching supports implementation of SELpractices (Ransford et al., 2009). Teachers’ and administrators’ comfort, com-mitment, and culture to SEL (Brackett et al., 2011) and organizational healthof the school community (Bradshaw, Koth, Thornton, & Leaf, 2009) relatedto higher implementation of practices or moderate the link between teach-ers’ psychological characteristics and use of practices. Teachers’ advice net-works (i.e., access to intervention expertise, conversation with otherteachers about practices, pressure from other teachers, common sources ofmentorship among teachers) contribute to the adoption of new practices(Frank, Zhao, & Borman, 2004; Neal, Neal, Atkins, Henry, & Frazier, 2011).
Assignment to the intervention condition without use of RC practices re-lates lower student achievement, a finding requiring explanation. One pos-sibility is that learning the RC practices disrupted typical high-qualityinstruction used before training in the RC approach. Critics of the RCapproach suggest that time spent engaged in RC practices (e.g., MorningMeeting, which can take 20 minutes per day) detracts from instructionaltime. In contrast, developers of the RC approach suggest that time allocatedto RC practices has benefits later in the day and year (Denton & Kriete,2000). Other analyses on this data set examined the RC approach and qualityand quantity of math instruction. RC and comparison schools did not differin the amount of time spent in math instruction on three typical days during
Efficacy of the Responsive Classroom Approach
29 by guest on February 19, 2015http://aerj.aera.netDownloaded from

the year and third-grade math teachers at RC schools showed improved, notdiminished, inquiry-based math instruction (Ottmar, Rimm-Kaufman, Berry,& Larsen, 2013). Although limited to math only, existing results on a subsetof teachers in RCES do not show reduced time or quality.
Another possibility is that there are attributes of the schools that predictboth decreased uptake of the intervention and lower student achievement.For example, if school leaders lack leadership skills, teacher may have diffi-culty creating priorities in the face of competing demands on their time. Inturn, poor leadership may lead to both low intervention uptake and lowachievement. It is not possible to determine the direction of causality—poorleadership may produce low RC implementation and low achievement or itmay be harder to implement RC practices and lead effectively in conditionswith very low student achievement.
Other explanations are also plausible. Within a single school, someteachers may show more uptake of the intervention than others. The positiveindirect path would be due to the teachers who uptake the interventionmore and the negative direct effects would be due to teachers who do notuse RC practices. Yet another explanation is that the RC approach hasboth positive and negative components. The positive components may bewell represented in the fidelity measure while the negative componentswere not. Further research using mixed-methods approaches will helpexplain these findings.
Subgroup Analysis
Findings showed that the relations among treatment assignment, fidelityof implementation, and reading and math achievement were equivalentregardless of whether students qualified for FRPL or not. This finding is evi-dent after controlling for the poverty composition of the school. Replicationof the work is needed to understand the generalizability of findings to otherschools in different settings (e.g., extremely high poverty schools).
Enrollment at an RC school with high implementation conveyed greateradvantages to students’ math achievement if students were initially in thebottom math achievement quartile. The differential contribution of RC prac-tices draws attention to two possible mechanisms—student skill develop-ment and teacher capacity. In relation to student skills, the RC approach isdesigned to improve students’ self-regulatory and attentional skills, skillsthat may undergird student math achievement (Duncan et al., 2007;Li-Grining et al., 2010). Pertaining to teachers’ capacity, the RC approachis designed to improve a teacher’s ability to understand and meet students’individual needs. One RC principle states ‘‘Knowing the children weteach—individually, culturally, and developmentally—is as important asknowing the content we teach’’ (NEFC, 2007, p. 3). Various RC practices
Rimm-Kaufman et al.
30 by guest on February 19, 2015http://aerj.aera.netDownloaded from
such as Teacher Language and Academic Choice may improve teachers’capacity to work with low-achieving students.
Limitations
Several limitations require mention. First, the quality of results may belimited by the selected outcome measure. The state standardized achieve-ment test has been criticized because of the presence of ceiling effectsand because reliability is higher near policy-relevant cut-points (e.g., thosedefining proficiency) compared to other points in the scale (May, Perez-Johnson, Haimson, Sattar, & Gleason, 2009). Further, the math standardizedachievement tests, although critical to policy decisions, tap proceduralunderstanding and test-taking ability, not conceptual understanding of math-ematics. Statistical approaches, such as censored data techniques, were usedto compensate for some test limitations. Second, timing and resource con-straints influenced data collection decisions. Because of timing constraints,third-grade teachers were observed in their first year of implementation (afterRC 1) whereas fourth- and fifth-grade teachers were observed in their secondyear of implementation (after RC 2). Although not ideal, NEFC states thatmany teachers trained in the RC approach only attend RC 1. Because of pro-ject priorities, math scores were used as indicators of low initial achievementand 60% of the observational fidelity measures were gathered during mathinstruction; thus, findings may be more precise for math than reading effects.This limitation must be considered in interpreting the RC practices to achieve-ment link for students with low initial math achievement. However, this con-cern is partially ameliorated in that 40% of the observational measures and allof the teacher-report measures of fidelity of implementation were not gath-ered during math instruction. Third, adopting interventions such as the RCapproach involves a long process of teacher change ranging from 3 to 5 years.Data collected in the present study were gathered during teachers’ first andsecond years of RC implementation, early in the process of RC adoption.
Implications and Future Directions
This study is among the few randomized controlled trials examining theeffect of SEL interventions on student achievement. Findings indicate thatstudent gains hinge on actual use of recommended classroom practices.This study considered a question school administrators and teachers ask:Will we diminish children’s academic achievement if we place increasedemphasis on (and allocate more time toward) children’s social and emo-tional learning? Findings show that using the RC approach did not diminishachievement, and if the RC practices were used as intended, studentsshowed achievement gains. Further, use of RC practices was linked toenhanced achievement in children who were initially low in math
Efficacy of the Responsive Classroom Approach
31 by guest on February 19, 2015http://aerj.aera.netDownloaded from

achievement, a point in need of replication given that the findings do notpermit causal inference.
Results direct attention toward next steps. Treatment heterogeneityamong the schools suggests the importance of examining teacher-level im-plementation in future work. Mixed-methods and qualitative work isneeded. For instance, findings raise important questions about the supportsand barriers that predict teacher and school implementation of RC practicesas well as questions about the process of teacher change involved as teach-ers implement the RC approach. Yet another needed step is work that con-siders students’ exposure to RC practices. For instance, do the contributionsof RC practices become more pronounced after 2 or 3 years of student expo-sure to RC compared to after only a single year? Do some students find RCpractices more engaging than others and thus participate more actively andbenefit more substantially compared to other students? Training in the RCapproach appears to be very effective in producing teacher change. Otherinterventions that prove less effective at creating teacher change may con-sider referring to the NEFC training model. Following students into middleand high school years and expanding outcomes to include social and emo-tional constructs may provide insight into potential enduring contributionsof RC practices.
Notes
The research reported here was supported by the Institute of Education Sciences,U.S. Department of Education, through Grants R305A070063, R305B060009, andR305B040049 to the University of Virginia. The opinions expressed are those of the au-thors and do not represent views of the U.S. Department of Education. We gratefullyacknowledge the contributions of Robert Berry, Gretchen Bukowick, Claire Cameron,Nikki Fedoravicius, Tom Fruscello, Roxann Kriete, Abigail Moncrief, Kerry O’Grady,Erin Ottmar, Christine Patton, Jennifer Williams, and the administrators, research and eval-uation staff, teachers, and students in our collaborating school district.
1A moderator variable is a variable (or condition) that changes the associationbetween an independent variable and a dependent variable. A mediator variable is a thirdvariable that explains the mechanism underlying the relation between an independentand a dependent variable. Moderated mediation occurs when a mediation effect differsdepending on the level of the moderator variable (e.g., eligibility for free/reduced pricelunch) (Fairchild & McQuillin, 2010).
References
Abbott, R. D., O’Donnell, J., Hawkins, J. D., Hill, K. G., Kosterman, R., & Catalano, R.F. (1998). Changing teaching practices to promote achievement and bonding toschool. American Journal of Orthopsychiatry, 68(4), 542–552.
Abry, T., Brewer, A. J., Nathanson, L., Sawyer, B., & Rimm-Kaufman, S. E. (2010).Classroom Practices Observation Measure. Unpublished measure, University ofVirginia, Charlottesville, VA.
Abry, T., Rimm-Kaufman, S. E., Larsen, R. A. A., & Brewer, A. J. (2013). The influenceof fidelity of implementation on teacher-student interaction quality in the
Rimm-Kaufman et al.
32 by guest on February 19, 2015http://aerj.aera.netDownloaded from
context of a randomized controlled trial of the Responsive Classroom approach.Journal of School Psychology, 51, 437–453. doi:http://dx.doi.org/10/1016/j.jsp.2013.03.001
Allison, P. D. (2002). Missing data: Quantitative applications in the social sciences.British Journal of Mathematical and Statistical Psychology, 55(1), 193–196.
Baker, S., Gersten, R., & Lee, D. (2002). A synthesis of empirical research on teachingmathematics to low-achieving students. Elementary School Journal, 103(1), 51–73.
Battistich, V., Schaps, E., & Wilson, N. (2004). Effects of an elementary school inter-vention on students’ ‘‘connectedness’’ to school and social adjustment duringmiddle school. The Journal of Primary Prevention, 24(3), 243–262.
Battistich, V., Solomon, D., Kim, D., Watson, M., & Schaps, E. (1995). Schools as com-munities, poverty levels of student populations, and students’ attitudes, motives,and performance: A multilevel analysis. American Educational ResearchJournal, 32(3), 627–658.
Bickman, L., Riemer, M., Brown, J. L., Jones, S. M., Flay, B. R., Li, K. K., & . . . Massetti,G. (2009). Approaches to measuring implementation fidelity in school-basedprogram evaluations. Journal of Research in Character Education, 7(2), 75–101.
Bloom, H. S., & Michalopoulos, C. (2010). When is the story in the subgroups?Prevention Science, 1–10.
Brackett, M. A., Reyes, M. R., Rivers, S. E., Elbertson, N. A., & Salovey, P. (2011).Assessing teachers’ beliefs about social and emotional learning. Journal ofPsychoeducational Assessment. Advance online publication. doi:10.1177/0734282911424879
Brackett, M. A., Rivers, S. E., Reyes, M. R., & Salovey, P. (2010). Enhancing academicperformance and social and emotional competence with the RULER feelingwords curriculum. Learning and Individual Differences, 22, 218–224.
Bradshaw, C. P., Koth, C. W., Thornton, L. A., & Leaf, P. J. (2009). Altering school cli-mate through school-wide positive behavioral interventions and supports:Findings from a group-randomized effectiveness trial. Prevention Science,10(2), 100–115.
Bradshaw, C. P., Mitchell, M. M., & Leaf, P. J. (2010). Examining the effects of school-wide positive behavioral interventions and supports on student outcomes resultsfrom a randomized controlled effectiveness trial in elementary schools. Journalof Positive Behavior Interventions, 12(3), 133–148.
Bradshaw, C. P., Zmuda, J. H., Kellam, S. G., & Ialongo, N. S. (2009). Longitudinalimpact of two universal preventive interventions in first grade on educationaloutcomes in high school. Journal of Educational Psychology, 101(4), 926–937.doi:10.1037/a0016586
Bryk, A. S., Sebring, P. B., Allensworth, E., Easton, J. Q., & Luppescu, S. (2010).Organizing schools for improvement: Lessons from Chicago. Chicago, IL:University of Chicago Press.
Century, J. (2010). A framework for measuring fidelity of implementation: A founda-tion for shared language and accumulation of knowledge. The AmericanJournal of Evaluation, 31(2), 199–218. doi:10.1177/1098214010366173
Claessens, A., Duncan, G., & Engel, M. (2009). Kindergarten skills and fifth-gradeachievement: Evidence from the ECLS-K. Economics of Education Review,28(4), 415–427.
Collaborative for Academic Social and Emotional Learning (CASEL). (2013). CASELguide: Effective social and emotional learning programs. Retrieved fromwww.casel.org/guide.
Efficacy of the Responsive Classroom Approach
33 by guest on February 19, 2015http://aerj.aera.netDownloaded from

Conduct Problems Prevention Research Group. (2010). The effects of a multiyear uni-versal social-emotional learning program: The role of student and school char-acteristics. Journal of Consulting and Clinical Psychology, 78(2), 156–168.
Cook, T. D. (2005). Emergent principles for the design, implementation, and analysisof cluster-based experiments in social science. The Annals of the AmericanAcademy of Political and Social Science, 599(1), 176–198.
Cordray, D. S., & Pion, G. M. (Eds.). (2006). Treatment strength and integrity: Modelsand methods. Washington, DC: American Psychological Association.
Crosnoe, R., & Cooper, C. E. (2010). Economically disadvantaged children’s transi-tions into elementary school: Linking family processes, school contexts, andeducational policy. American Educational Research Journal, 47(2), 258–291.
Crosnoe, R., Morrison, F., Burchinal, M., Pianta, R., Keating, D., Friedman, S. L., &Clarke-Stewart, K. A. (2010). Instruction, teacher-student relations, and mathachievement trajectories in elementary school. Journal of EducationalPsychology, 102(2), 407–417. doi:10.1037/a0017762
Denton, P. (2005). Learning through academic choice. Turner Falls, MA: NortheastFoundation for Children.
Denton, P., & Kriete, R. (2000). The first six weeks of school. Turner Falls, MA:Northeast Foundation for Children.
Domitrovich, C. E., Bradshaw, C. P., Poduska, J. M., Hoagwood, K., Buckley, J. A.,Olin, S., & . . . Ialongo, N. S. (2008). Maximizing the implementation qualityof evidence-based preventive interventions in schools: A conceptual framework.Advances in School Mental Health Promotion, 1(3), 6–28.
Duckworth, A. L., Quinn, P. D., & Tsukayama, E. (2012). What No Child Left Behindleaves behind: The roles of IQ and self-control in predicting standardizedachievement test scores and report card grades. Journal of EducationalPsychology, 104(2), 439–451.
Duncan, G. J., Dowsett, C. J., Claessens, A., Magnuson, K., Huston, A. C., Klebanov,P., & . . . Brooks-Gunn, J. (2007). School readiness and later achievement.Developmental Psychology, 43(6), 1428–1446.
Durlak, J. A., Weissberg, R. P., Dymnicki, A. B., Taylor, R. D., & Schellinger, K. B.(2011). The impact of enhancing students’ social and emotional learning: Ameta-analysis of school-based universal interventions on social and emotionallearning. Child Development, 82(1), 405–432. doi:10.1111/j.1467-8624.2010.01564.x
Dusenbury, L., Zadrazil, J., Mart, A., & Weissberg, R. (2011). State learning standardsto advance social and emotional learning: The state scan of social and emo-tional learning standards, preschool through high school. Retrieved fromhttp://casel.org/wp-content/uploads/Forum-Brief-on-the-State-Scan-5-10-2011.pdf.
Elliott, S. N. (1999). A multi-year evaluation of the Responsive Classroom approach:Its effectiveness and acceptability in promoting social and academic compe-tence. Retrieved from http://www.responsiveclassroom.org/PDF_files/final_report.pdf.
Enders, C. K., & Bandalos, D. L. (2001). The relative performance of full informationmaximum likelihood estimation for missing data in structural equation models.Structural Equation Modeling, 8(3), 430–457.
Evans, R. (2001). The human side of school change. San Francisco, CA: Jossey-Bass.Fairchild, A. J., & McQuillin, S. D. (2010). Evaluating mediation and moderation
effects in school psychology: A presentation of methods and review of currentpractice. Journal of School Psychology, 48(1), 53–84.
Rimm-Kaufman et al.
34 by guest on February 19, 2015http://aerj.aera.netDownloaded from

Frank, K. A., Zhao, Y., & Borman, K. (2004). Social capital and the diffusion of inno-vations within organizations: The case of computer technology in schools.Sociology of Education, 77, 148–171.
Gershoff, E. T., Aber, J. L., Raver, C. C., & Lennon, M. C. (2007). Income is notenough: Incorporating material hardship into models of income associationswith parenting and child development. Child Development, 78(1), 70–95.
Greenberg, M. T. (2010). School-based prevention: current status and future chal-lenges. Effective Education, 2(1), 27–52.
Harcourt Educational Measurement (2003). Stanford Achievement Test Series, TenthEdition, Primary 2. New York: Harcourt Inc.
Hill, C. J., Bloom, H. S., Black, A. R., & Lipsey, M. W. (2008). Empirical benchmarksfor interpreting effect sizes in research. Child Development Perspectives, 2(3),172–177.
Hughes, J., & Kwok, O. M. (2007). Influence of student-teacher and parent-teacherrelationships on lower achieving readers’ engagement and achievement in theprimary grades. Journal of Educational Psychology, 99(1), 39–51. doi:10.1037/0022-0663.99.1.39
Hulleman, C., & Cordray, D. S. (2009). Moving from the lab to the field: The role offidelity and achieved relative intervention strength. Journal of Research onEducational Effectiveness, 2(1), 88–110.
Jones, S. M., Brown, J. L., & Aber, J. (2011). Two-year impacts of a universal school-based social-emotional and literacy intervention: An Experiment in translationaldevelopmental research. Child Development, 82, 533–554.
Kieffer, M. J. (2008). Catching up or falling behind? Initial English proficiency, con-centrated poverty, and the reading growth of language minority learners inthe United States. Journal of Educational Psychology, 100(4), 851–868.
Klein, J., & Moeschberger, M. (1997). Survival analysis: Techniques for censored andtruncated regression. New York, NY: Springer-Verlag.
Knowlton, L. W., & Phillips, C. C. (2008). The logic model guidebook: Better strategiesfor great results. Thousand Oaks, CA: Sage.
Kriete, R. (2002). The Morning Meeting book. Turner Falls, MA: Northeast Foundationfor Children.
Larsen, W. A., & McCleary, S. J. (1972). The use of partial residual plots in regressionanalysis. Technometrics, 14(3), 781–790.
Lee, V., & Smith, J. B. (1999). Social support and achievement for young adolescentsin Chicago: The role of school academic press. American Educational ResearchJournal, 36, 907–945.
Li-Grining, C. P., Votruba-Drzal, E., Maldonado-Carreno, C., & Haas, K. (2010).Children’s early approaches to learning and academic trajectories through fifthgrade. Developmental Psychology, 46(5), 1062–1077. doi:10.1037/a0020066
Little, R. J. A., & Rubin, D. (1987). Statistical analysis with incomplete data. NewYork, NY: John Wiley & Sons.
Long, J. S. (1997). Regression models for categorical and limited dependent variables(Vol. 7). Thousand Oaks, CA: Sage.
May, H., Perez-Johnson, I., Haimson, J., Sattar, S., & Gleason, P. (2009). Using state testsin education experiments: A discussion of the issues (NCEE 2009-013). Washington,DC: National Center for Education Evaluation and Regional Assistance.
Murray, D. M., Hannan, P. J., & Baker, W. L. (1996). A Monte Carlo study of alternativeresponses to intraclass correlation in community trials: Is it ever possible to avoidCornfield’s penalties? Evaluation Review, 20(3), 313–337.
Muthen, L., & Muthen, B. (1998–2010). Mplus user’s guide (6th ed.). Los Angeles, CA:Muthen and Muthen.
Efficacy of the Responsive Classroom Approach
35 by guest on February 19, 2015http://aerj.aera.netDownloaded from

Nathanson, L., Sawyer, B., & Rimm-Kaufman, S.E. (2007a). Classroom Practices TeacherSurvey. Unpublished instrument, University of Virginia, Charlottesville, VA.
Nathanson, L., Sawyer, B., & Rimm-Kaufman, S.E. (2007b). Classroom PracticesFrequency Survey. Unpublished instrument, University of Virginia,Charlottesville, VA.
National Mathematics Advisory Panel. (2008). Foundations for success: The final reportof the National Mathematics Advisory Panel. Washington, DC: U.S. Department ofEducation.
Neal, J. W., Neal, Z. P., Atkins, M. S., Henry, D. B., & Frazier, S. L. (2011). Channels ofchange: Contrasting network mechanisms in the use of interventions. AmericanJournal of Community Psychology, 47, 277–286.
Northeast Foundation for Children. (2007). Responsive classroom: Level 1 resourcebook. Turners Falls, MA: Northeast Foundation for Children.
Northeast Foundation for Children. (2009). Responsive classroom: Level 2 resourcebook. Turners Falls, MA: Northeast Foundation for Children.
Northeast Foundation for Children (2014a). Good teaching changes the future.Retrieved February 12, 2014 from: http://www.responsiveclassroom.org/sites/default/files/pdf_files/RC_approach_White_paper.pdf
Northeast Foundation for Children (2014b). Principles and practices of responsiveclassroom. Retrieved February 12, 2014 from: http://www.responsiveclassroom.org/principles-and-practices-responsive-classroom
O’Donnell, C. L. (2008). Defining, conceptualizing, and measuring fidelity of imple-mentation and its relationship to outcomes in K–12 curriculum interventionresearch. Review of Educational Research, 78(1), 33–84.
Ottmar, E. R., Rimm-Kaufman, S. E, Berry, R. Q., & Larsen, R. A. A. (2013). Resultsfrom a randomized controlled trial: Does the Responsive Classroom approachimpact the use of standards-based mathematics teaching practices? ElementarySchool Journal, 113(3), 434–457. doi:10.1086/668810
Pianta, R. C., Belsky, J., Vandergrift, N., Houts, R., & Morrison, F. J. (2008). Classroomeffects on children’s achievement trajectories in elementary school. AmericanEducational Research Journal, 45(2), 365–397.
Ransford, C. R., Greenberg, M. T., Domitrovich, C. E., Small, M., & Jacobson, L.(2009). The role of teachers’ psychological experiences and perceptions of cur-riculum supports on the implementation of a social and emotional learning cur-riculum. School Psychology Review, 38(4), 510–532.
Raver, C. C. (2012). Low-income children’s self-regulation in the classroom: Scientificinquiry for social change. American Psychologist, 67(8), 681–689. doi:10.1037/a0030085
Reyes, M. R., Brackett, M. A., Rivers, S. E., Elbertson, N. A., & Salovey, P. (2012). Theinteraction effects of program training, dosage, and implementation quality ontargeted student outcomes for the RULER approach to social and emotionallearning. School Psychology Review, 41(1), 82–99.
Rimm-Kaufman, S. E., & Chiu, Y. I. (2007). Promoting social and academic compe-tence in the classroom: An intervention study examining the contribution ofthe Responsive Classroom approach. Psychology in the Schools, 44(4), 397–413.
Rimm-Kaufman, S. E., Fan, X., Chiu, Y. I., & You, W. (2007). The contribution of theResponsive Classroom approach on children’s academic achievement: Resultsfrom a three year longitudinal study. Journal of School Psychology, 45, 401–421.
Rimm-Kaufman, S. E., Storm, M. D., Sawyer, B. E., Pianta, R. C., & La Paro, K. M.(2006). The Teacher Belief Q-Sort: A measure of teachers’ priorities and beliefsin relation to disciplinary practices, teaching practices, and beliefs about chil-dren. Journal of School Psychology, 44, 141–165.
Rimm-Kaufman et al.
36 by guest on February 19, 2015http://aerj.aera.netDownloaded from
Robinson, J. P., & Lubienski, S. T. (2011). The development of gender achievement gapsin mathematics and reading during elementary and middle school: Examining directcognitive assessments and teacher ratings. American Educational Research Journal,48(2), 268–302.
Schafer, J. L., & Graham, J. W. (2002). Missing data: Our view of the state of the art.Psychological Methods, 7(2), 147–177.
Shouse, R. C. (1996). Academic press and sense of community: Conflict, congruence, andimplications for student achievement. Social Psychology of Education, 1(1), 47–68.
Snyder, F., Flay, B., Vuchinich, S., Acock, A., Washburn, I., Beets, M., & Li, K. K.(2009). Impact of a social-emotional and character development program onschool-level indicators of academic achievement, absenteeism, and disciplinaryoutcomes: A matched-pair, cluster-randomized, controlled trial. Journal ofResearch on Educational Effectiveness, 3, 26–55.
Social and Character Development Research Consortium. (2010). Efficacy of school-wide programs to promote social and character development and reduce prob-lem behavior in elementary school children (NCER 2011–2001). Washington,DC: National Center for Education Research, Institute of Education Sciences,U.S. Department of Education.
Virginia Department of Education. (2008). Virginia standards of learning technicalreport: 2008-2009 administration cycle. Retrieved from http://www.doe.virgi-nia.gov/testing/test_administration/technical_reports/sol_technical_re-port_2008-09_administration_cycle.pdf.
Virginia Department of Education. (2010). Virginia standards of learning assessment:Test blueprint, grade 4 mathematics. Retrieved from http://www.doe.virginia.gov/testing/sol/blueprints/mathematics_blueprints/2009/blueprint_math4%20.pdf.
Votruba-Drzal, E. (2006). Economic disparities in middle childhood development:Does income matter? Developmental Psychology, 42(6), 1154–1167.doi:10.1037/0012-1649.42.6.1154
Wanless, S. B., Patton, C. S., Rimm-Kaufman, S. E., & Deutsch, N. L. (2013). Setting-level influences on implementation of the Responsive Classroom approach.Prevention Science, 14(1), 40–51. doi:10.1007/s11121-012-0294-1
Yoshikawa, H., Aber, J. L., & Beardslee, W. R. (2012). The effects of poverty on themental, emotional, and behavioral health of children and youth: Implicationsfor prevention. American Psychologist, 67(4), 272–284. doi: 10.1037/a0028015
Manuscript received January 2, 2013Final revision received September 5, 2013
Accepted November 2, 2013
Efficacy of the Responsive Classroom Approach
37 by guest on February 19, 2015http://aerj.aera.netDownloaded from
Recommended