This Desk Note is not intended to be broadly distributed. The information contained in this Note is provided by PAC Partners to Wholesale Investors only.
AMERICAN PATRIOT OIL & GAS LTD (AOW) Date: 14 August 2018 Desk research analyst:
Lawrence Grech
Price: $0.025/Share Market Cap: $14.0m
*Post rights issue
Daily Liquidity
3mth av. 1.0mil sh.
Scenario / Valn A$/sh. Risked Unrisked
US$60/bbl; low prodn $0.035 $0.044
US$70bbl, base prodn $0.058 $0.073 * 7-yr production DCF @ 10% real disc. rate
Converting acquired Texan proven oil reserves to cashflow, growth and potentially dividends
American Patriot Oil & Gas Limited (AOW:ASX) is an ASX-listed oil & gas operator of conventional onshore oil & gas fields. Its focus is onshore Southern & Eastern Texas due to its low-cost and many field revamp opportunities.
• Recent achievements include commitments to acquire three properties for half the Proven Reserves’ Present Value and securing US$17m in debt providers support, that lends material support to AOW’s strategy.
• AOW’s Proven Reserves (P1) rises to 5.3mm bbl oil equivalent (mm boe) with a current EV of just A$5.04/boe and 7.03 mm boe (oil 82%) of 2P Reserves A$3.79/boe. We see upside in the market’s value of reserves.
• With modest capex and relatively low-risk well reactivations, sales of ~550boe/d could rise to ~740boe/d later in CY19 to service debt and see free-cashflow for more growth. Ability to expand operations or pay dividends by FY20.
• These assets provide critical mass for AOW to grow by aggregating nearby under-performing fields efficiently.
Desk Recommendation – Speculative Buy. As AOW achieves sales and rising cashflow milestones over coming quarters, we see increasing market value of its Reserves and reduction of its debt position. We see tailwinds for AOW with resilient US oil prices and upside for under-priced gas plus a re-rating of Texas conventional production acreage.
We have scenario tested AOW’s expected production and cashflow analysis and see an unrisked valuation of $0.044/share, though with project risking the adjusted valuation is $0.035/share for our lower case at US$60/bbl with 5% lower output and higher costs. At AOW’s expected output & costs at US$70/bbl oil price this valuation rises to $0.073/share unrisked and $0.058/share after applying a projects risk factor of 20%.
Risks include oil prices, well reactivation delays or oil field underperformance but this can be partly mitigated by oil hedging up to 70% oil output and its spread of properties and large well numbers with a relatively short lead-time for remedial action.
Corporate acquisitions event leads to transformational change
A transformational US$20.5m deal to aggregate US production assets – with two stage capital raising of A$7.2m. The company expects it could generate at US$60/bbl oil around US$10m-plus pa in cash flow from mid-2019, be debt free in 4 years and generate free cash for growth, if deals become available and/or for dividends
• In July18 AOW’s placement raised A$4.2m and has announced an identically-priced underwritten 1:3.57 non-
renounceable rights issue at $0.025/share to raise $3m. Attaching to these Rights, shareholders also receive 1
option for 2 shares subscribed – with $0.045 exercise price, expiring 20Sep19. This option series is listed for trading.
• The issue closing date: 27th August 2018, record date for entitlements was the 8th August.
• The issue is fully underwritten by the major shareholders of the company and Capital Investments Pty Ltd.
DISCLOSURE: IMPORTANT
PAC Partners has been engaged by and receives fees from American Patriot Limited (AOW:ASX) to provide research services. In
addition, PAC Partners and/or its advisors received a fee of 4.0% plus GST on all amounts raised by PAC Partners via the July 2018
placement Offer in American Patriot Oil & Gas Limited. In addition, PAC Partners and its representatives (as defined in the Corporations
Act 2001) may have existing shares and option holdings in the Company and may also apply for shares in the current rights issue. PAC
Partners may seek in future to provide additional services to American Patriot Oil & Gas Ltd. See further details in disclaimer at end of
this note.
This Desk Note is not intended to be broadly distributed. The information contained in this Note is provided by PAC Partners to
Wholesale Investors only. Retail investor and third-party recipients should not rely, directly or indirectly, on this report. Users of this
Desk Note should not act on any content or recommendation without first seeking professional advice. Whilst the report has been
prepared with all reasonable care from sources which we believe are reliable, no responsibility or liability is accepted by PAC Partners,
for any errors or omissions or misstatements however caused.
PAC Partners Desk Note American Patriot Ltd (AOW)
2
COMPANY PROFILE
American Patriot Oil & Gas Ltd (AOW) is an Australian ASX-listed oil & gas production group headed by CEO Alexis Clark. Headquartered in Melbourne, with an U.S. office in Denver, Colorado, it is focused on acquiring at discounted prices underperforming conventional oilfields in Texas and Gulf Coast region with Proven Reserves. AOW then boosts profitability by using new technology to lower costs and by performing workovers, infill drilling and otherwise extracting profitability from overlooked assets. The CEO is re-locating to Houston once the most recent Texas acquisitions are concluded.
Acquisition-driven growth – AOW is currently finalising a transformational US$20.5m acquisition of 3 conventional oil & gas assets with Proven Developed Reserves (PDP) with significant upside potential via infill drilling of Proven Developed Non-producing (PDNP) and Proven Undeveloped Reserves (PUD). The value-add is skewed to production, efficiencies and monetisation, rather than exploration or commodity price leverage as it intends to hedge ~70% of output to reduce revenue volatility.
The company expects it could generate at US$60/bbl oil ~US$10m-plus pa in cash flow from 2019, be debt free in 4 years and generate free cash for growth and/or for dividends.
AOW’s exit plan is to build a regionally focussed profitable production to around 3,000 boe/d. or 1 million boe pa to generate strong shareholder returns. The value, if not realised by its ASX listing, may be unlocked by either a re-listing on the NASDAQ/NYSE Small companies exchange or sale to a US mid-cap oil company or Private Equity fund who are currently active asset acquirers – particularly if the scale and operating parameters are right.
Strategy – Why Mature Texas Coast Fields Are Attractive
US petroleum growth is a shale phenomenon – lopsided capex is creating congestion
US shale-sourced oil &
gas production is
booming
Shale attracts most
capital and activity
Big capital attracted to
shale basins for big
reserves & output lift
Conventional plays have
been neglected
However, shale growth is
stalling for now. Will
some capital be re-
deployed to other plays?
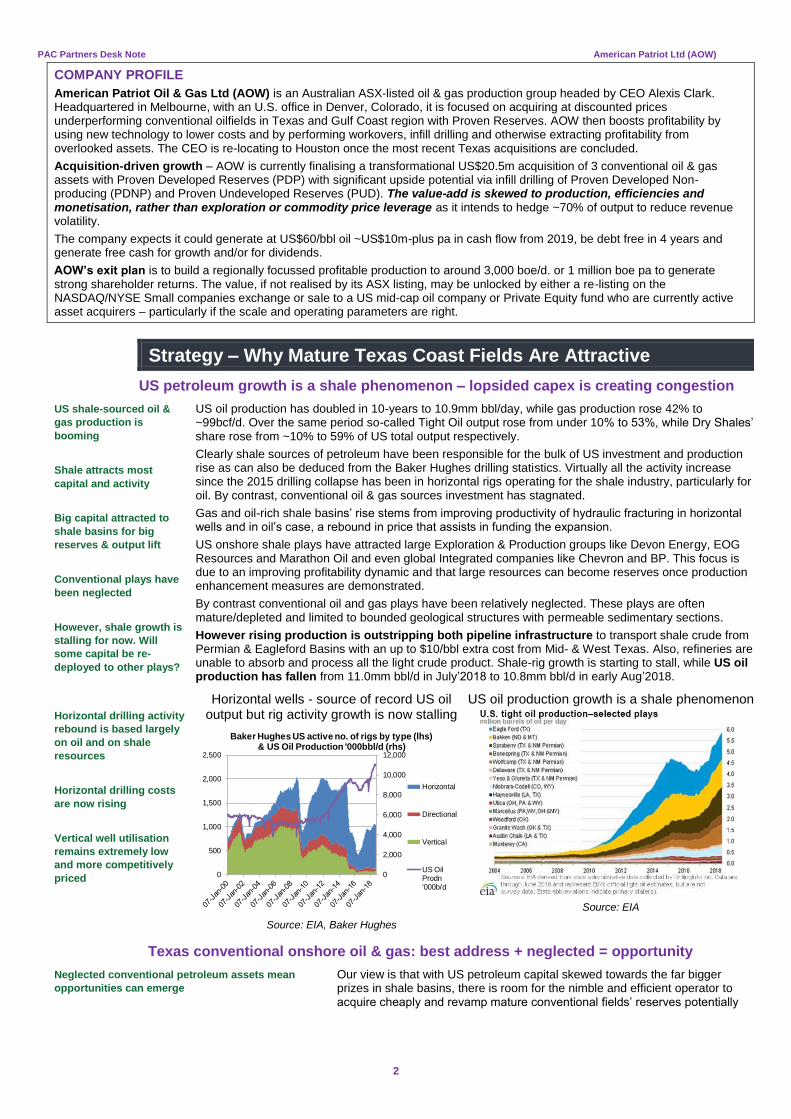
US oil production has doubled in 10-years to 10.9mm bbl/day, while gas production rose 42% to ~99bcf/d. Over the same period so-called Tight Oil output rose from under 10% to 53%, while Dry Shales’ share rose from ~10% to 59% of US total output respectively.
Clearly shale sources of petroleum have been responsible for the bulk of US investment and production rise as can also be deduced from the Baker Hughes drilling statistics. Virtually all the activity increase since the 2015 drilling collapse has been in horizontal rigs operating for the shale industry, particularly for oil. By contrast, conventional oil & gas sources investment has stagnated.
Gas and oil-rich shale basins’ rise stems from improving productivity of hydraulic fracturing in horizontal wells and in oil’s case, a rebound in price that assists in funding the expansion.
US onshore shale plays have attracted large Exploration & Production groups like Devon Energy, EOG Resources and Marathon Oil and even global Integrated companies like Chevron and BP. This focus is due to an improving profitability dynamic and that large resources can become reserves once production enhancement measures are demonstrated.
By contrast conventional oil and gas plays have been relatively neglected. These plays are often mature/depleted and limited to bounded geological structures with permeable sedimentary sections.
However rising production is outstripping both pipeline infrastructure to transport shale crude from Permian & Eagleford Basins with an up to $10/bbl extra cost from Mid- & West Texas. Also, refineries are unable to absorb and process all the light crude product. Shale-rig growth is starting to stall, while US oil production has fallen from 11.0mm bbl/d in July’2018 to 10.8mm bbl/d in early Aug’2018.
Horizontal drilling activity
rebound is based largely
on oil and on shale
resources
Horizontal drilling costs
are now rising
Vertical well utilisation
remains extremely low
and more competitively
priced
Horizontal wells - source of record US oil output but rig activity growth is now stalling
0
2,000
4,000
6,000
8,000
10,000
12,000
0
500
1,000
1,500
2,000
2,500
Baker Hughes US active no. of rigs by type (lhs)& US Oil Production '000bbl/d (rhs)
Horizontal
Directional
Vertical
US OilProdn'000b/d
Source: EIA, Baker Hughes
US oil production growth is a shale phenomenon
Source: EIA
Texas conventional onshore oil & gas: best address + neglected = opportunity
Neglected conventional petroleum assets mean
opportunities can emerge
Our view is that with US petroleum capital skewed towards the far bigger prizes in shale basins, there is room for the nimble and efficient operator to acquire cheaply and revamp mature conventional fields’ reserves potentially
PAC Partners Desk Note American Patriot Ltd (AOW)
3
AOW has potential to capture this theme via its
acquisitions in Texas’ Gulf Coast, East Texas and
Louisiana Gulf Coast.
AOW’s assets and proposed acquisitions largely
avoid the infrastructure bottlenecks of Mid- and
Western Texas from the rapid rise of shale oil
production.
Conventional oil production has better balance of
refining products and attracts a significant premium
to shale crude oils.
Our conclusion is that with limits to growth rate of oil from shale being encountered, marginal capital will tend to migrate to other opportunities including conventional plays to enhance value, so long as oil prices remain firm. We examine oil prices on p.4.
very profitably. While fields are likely to require remedial action, the gains are more easily banked if there are other advantages not fully priced into mature assets pricing.
American Patriot Oil & Gas (AOW) caught our attention as potentially capturing this type of mis-pricing opportunity via its three assets acquisition in onshore Southern Texas. They reported that the US20.5m total deal was independently assessed at US$48m for the Proven (P1) Developed and Undeveloped Reserves of 4.75mm boe (~80% oil) or just US$4.31/boe. This is highly promising particularly when the context of location and field characteristics are reviewed. These include:
Location – Onshore Southern Texas has advantages of:
• Many decades of production (i.e. data) and mature fields (i.e. asset opportunities) in well understood plays, that often can be refined by newer technology to expand reserves.
• Highly experienced workforce and service company coverage are great project enablers. Workovers, recompletions and vertical well services are readily available and costs rising far more slowly than more competitively bid horizontal and multi-frac services.
• Infrastructure network of oil and gas field processing and pipelines are readily accessible, fully depreciated and due to production declines are generally under-utilised. This contrasts with Mid- and Western Texas shale producers’ pipelines are at limits and is now stalling rig activity growth.
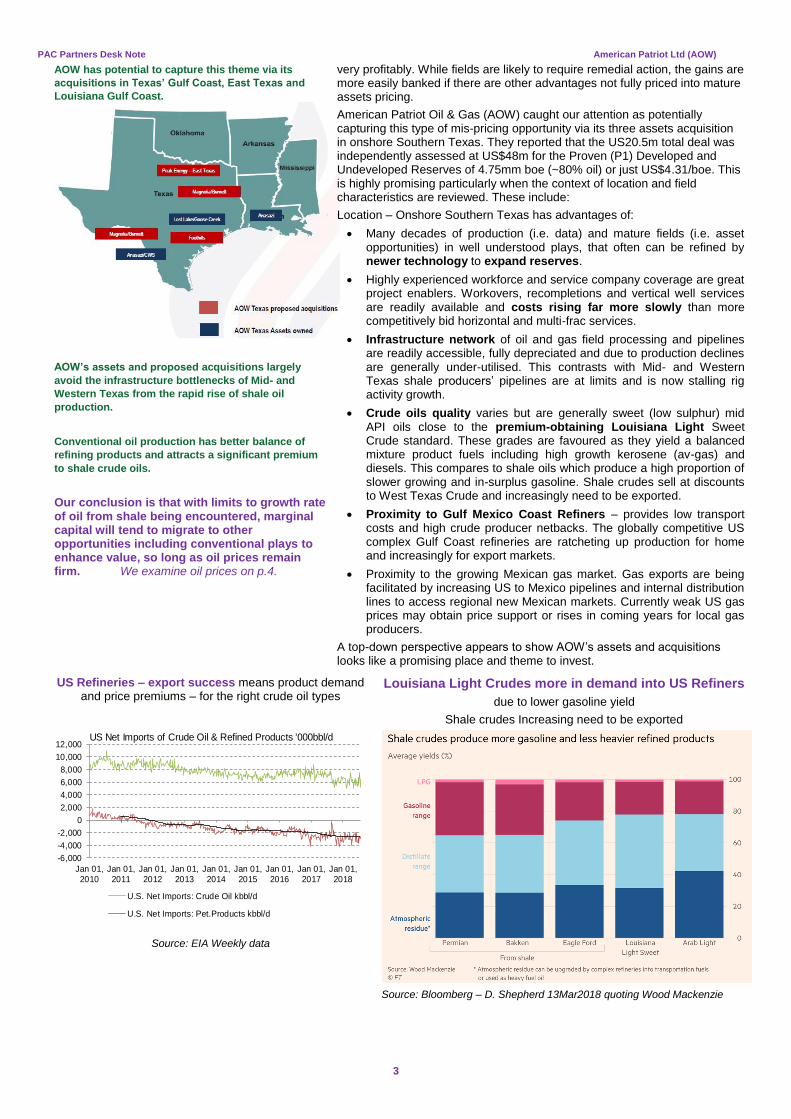
• Crude oils quality varies but are generally sweet (low sulphur) mid API oils close to the premium-obtaining Louisiana Light Sweet Crude standard. These grades are favoured as they yield a balanced mixture product fuels including high growth kerosene (av-gas) and diesels. This compares to shale oils which produce a high proportion of slower growing and in-surplus gasoline. Shale crudes sell at discounts to West Texas Crude and increasingly need to be exported.
• Proximity to Gulf Mexico Coast Refiners – provides low transport costs and high crude producer netbacks. The globally competitive US complex Gulf Coast refineries are ratcheting up production for home and increasingly for export markets.
• Proximity to the growing Mexican gas market. Gas exports are being facilitated by increasing US to Mexico pipelines and internal distribution lines to access regional new Mexican markets. Currently weak US gas prices may obtain price support or rises in coming years for local gas producers.
A top-down perspective appears to show AOW’s assets and acquisitions looks like a promising place and theme to invest.
US Refineries – export success means product demand and price premiums – for the right crude oil types
-6,000
-4,000
-2,000
0
2,000
4,000
6,000
8,000
10,000
12,000
Jan 01,
2010
Jan 01,
2011
Jan 01,
2012
Jan 01,
2013
Jan 01,
2014
Jan 01,
2015
Jan 01,
2016
Jan 01,
2017
Jan 01,
2018
US Net Imports of Crude Oil & Refined Products '000bbl/d
U.S. Net Imports: Crude Oil kbbl/d
U.S. Net Imports: Pet.Products kbbl/d
Source: EIA Weekly data
Louisiana Light Crudes more in demand into US Refiners
due to lower gasoline yield
Shale crudes Increasing need to be exported
Source: Bloomberg – D. Shepherd 13Mar2018 quoting Wood Mackenzie
PAC Partners Desk Note American Patriot Ltd (AOW)
4
Strong oil price assists in conversion of mature resources to enhanced cashflows
Mature & declining fields
suffer unit cost pressures
Negative oil price moves
can accelerate declines
Rising oil prices provide
leveraged upside to
mature fields economic
reserves and fundability
A key success factor for AOW going forward is a reasonably robust oil price, which we examine below.
A disadvantage of mature oil and gas fields is that as production falls, fixed-cost cover falls quickly, and unit costs rise, ultimately resulting in wells being shut-in to avoid cash losses. The 2015 oil price fall precipitated reduced field development and maintenance spending resulting in falling well productivity. Oil price falls accelerate the earnings margin contraction, despite falls in operating and drilling costs.
The recovery in oil prices expands the cashflow margins of remaining producing wells and improve economics of well interventions like work-overs and re-development initiatives like re-completions and in-fill drilling. Perceived sustainable higher oil prices also see the annual dynamic calculation of reserves likely increase the ability to raise debt and equity to fund production expansion plans.
Oil price appears likely to
be supportive to AOW We have a positive view of oil prices overall sustainability going forward, though with inevitable volatility. US domestic gas prices look cheap and potentially have upside.
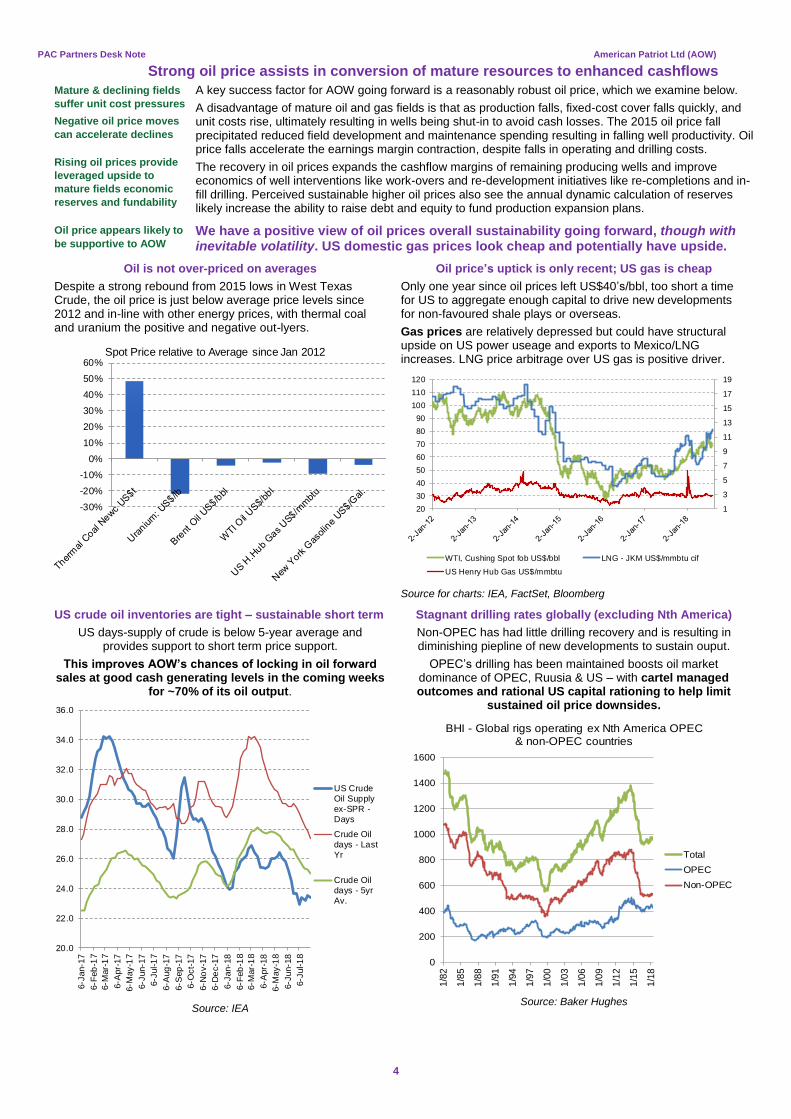
Oil is not over-priced on averages
Despite a strong rebound from 2015 lows in West Texas Crude, the oil price is just below average price levels since 2012 and in-line with other energy prices, with thermal coal and uranium the positive and negative out-lyers.
-30%
-20%
-10%
0%
10%
20%
30%
40%
50%
60%Spot Price relative to Average since Jan 2012
Oil price’s uptick is only recent; US gas is cheap
Only one year since oil prices left US$40’s/bbl, too short a time for US to aggregate enough capital to drive new developments for non-favoured shale plays or overseas.
Gas prices are relatively depressed but could have structural upside on US power useage and exports to Mexico/LNG increases. LNG price arbitrage over US gas is positive driver.
1
3
5
7
9
11
13
15
17
19
20
30
40
50
60
70
80
90
100
110
120
WTI, Cushing Spot fob US$/bbl LNG - JKM US$/mmbtu cif
US Henry Hub Gas US$/mmbtu
Source for charts: IEA, FactSet, Bloomberg
US crude oil inventories are tight – sustainable short term
US days-supply of crude is below 5-year average and provides support to short term price support.
This improves AOW’s chances of locking in oil forward sales at good cash generating levels in the coming weeks
for ~70% of its oil output.
20.0
22.0
24.0
26.0
28.0
30.0
32.0
34.0
36.0
6-J
an-1
7
6-F
eb
-17
6-M
ar-
17
6-A
pr-
17
6-M
ay-1
7
6-J
un-1
7
6-J
ul-1
7
6-A
ug
-17
6-S
ep
-17
6-O
ct-
17
6-N
ov-1
7
6-D
ec-1
7
6-J
an-1
8
6-F
eb
-18
6-M
ar-
18
6-A
pr-
18
6-M
ay-1
8
6-J
un-1
8
6-J
ul-1
8
US Crude
Oil Supply
ex-SPR -
Days
Crude Oil
days - Last
Yr
Crude Oil
days - 5yr
Av.
Source: IEA
Stagnant drilling rates globally (excluding Nth America)
Non-OPEC has had little drilling recovery and is resulting in diminishing piepline of new developments to sustain ouput.
OPEC’s drilling has been maintained boosts oil market dominance of OPEC, Ruusia & US – with cartel managed outcomes and rational US capital rationing to help limit
sustained oil price downsides.
0
200
400
600
800
1000
1200
1400
1600
1/8
2
1/8
5
1/8
8
1/9
1
1/9
4
1/9
7
1/0
0
1/0
3
1/0
6
1/0
9
1/1
2
1/1
5
1/1
8
BHI - Global rigs operating ex Nth America OPEC & non-OPEC countries
Total
OPEC
Non-OPEC
Source: Baker Hughes
PAC Partners Desk Note American Patriot Ltd (AOW)
5
Company Profile – Capital, Cash and ownership
Capital Structure – current and estimated post-rights issue
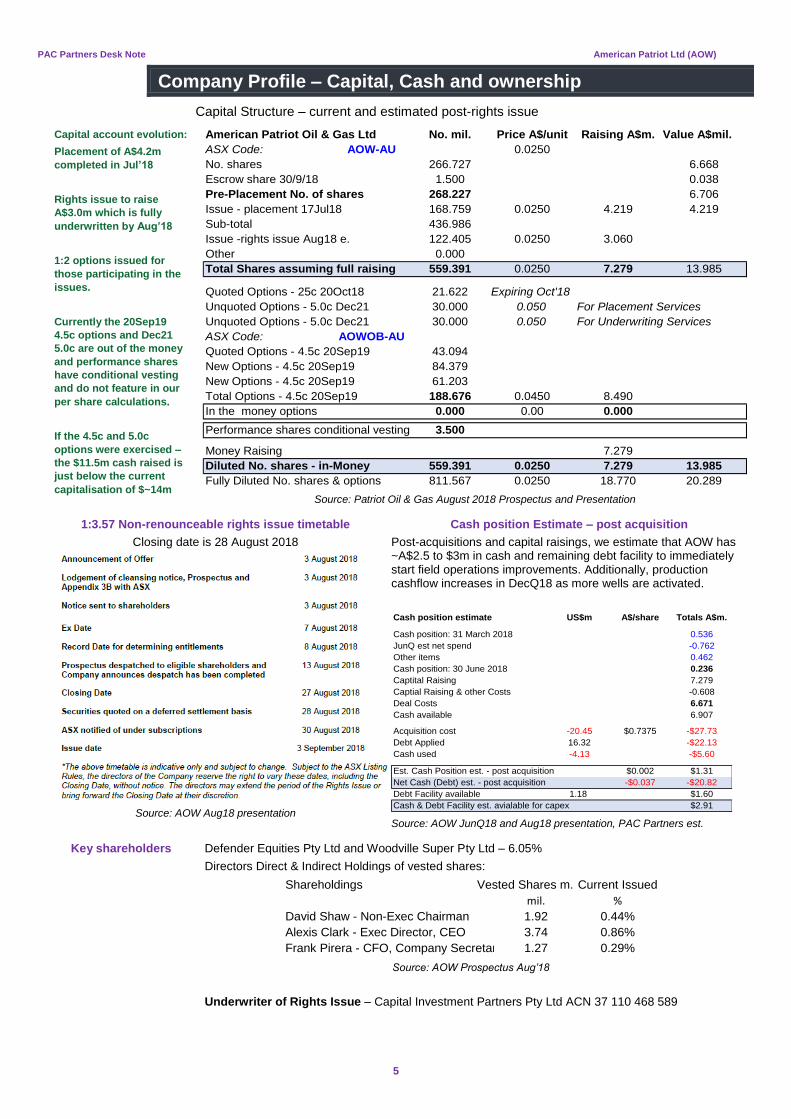
Capital account evolution:
Placement of A$4.2m
completed in Jul’18
Rights issue to raise
A$3.0m which is fully
underwritten by Aug’18
1:2 options issued for
those participating in the
issues.
Currently the 20Sep19
4.5c options and Dec21
5.0c are out of the money
and performance shares
have conditional vesting
and do not feature in our
per share calculations.
If the 4.5c and 5.0c
options were exercised –
the $11.5m cash raised is
just below the current
capitalisation of $~14m
American Patriot Oil & Gas Ltd No. mil. Price A$/unit Raising A$m. Value A$mil.
ASX Code: AOW-AU 0.0250
No. shares 266.727 6.668
Escrow share 30/9/18 1.500 0.038
Pre-Placement No. of shares 268.227 6.706
Issue - placement 17Jul18 168.759 0.0250 4.219 4.219
Sub-total 436.986
Issue -rights issue Aug18 e. 122.405 0.0250 3.060
Other 0.000
Total Shares assuming full raising 559.391 0.0250 7.279 13.985
Quoted Options - 25c 20Oct18 21.622 Expiring Oct'18
Unquoted Options - 5.0c Dec21 30.000 0.050 For Placement Services
Unquoted Options - 5.0c Dec21 30.000 0.050 For Underwriting Services
ASX Code: AOWOB-AU
Quoted Options - 4.5c 20Sep19 43.094
New Options - 4.5c 20Sep19 84.379
New Options - 4.5c 20Sep19 61.203
Total Options - 4.5c 20Sep19 188.676 0.0450 8.490
In the money options 0.000 0.00 0.000
Performance shares conditional vesting 3.500
Money Raising 7.279
Diluted No. shares - in-Money 559.391 0.0250 7.279 13.985
Fully Diluted No. shares & options 811.567 0.0250 18.770 20.289 Source: Patriot Oil & Gas August 2018 Prospectus and Presentation
1:3.57 Non-renounceable rights issue timetable
Closing date is 28 August 2018
Source: AOW Aug18 presentation
Cash position Estimate – post acquisition
Post-acquisitions and capital raisings, we estimate that AOW has ~A$2.5 to $3m in cash and remaining debt facility to immediately start field operations improvements. Additionally, production cashflow increases in DecQ18 as more wells are activated.
Cash position estimate US$m A$/share Totals A$m.
Cash position: 31 March 2018 0.536
JunQ est net spend -0.762
Other items 0.462
Cash position: 30 June 2018 0.236
Captital Raising 7.279
Captial Raising & other Costs -0.608
Deal Costs 6.671
Cash available 6.907
Acquisition cost -20.45 $0.7375 -$27.73
Debt Applied 16.32 -$22.13
Cash used -4.13 -$5.60
Est. Cash Position est. - post acquisition $0.002 $1.31
Net Cash (Debt) est. - post acquisition -$0.037 -$20.82
Debt Facility available 1.18 $1.60
Cash & Debt Facility est. avialable for capex $2.91 Source: AOW JunQ18 and Aug18 presentation, PAC Partners est.
Key shareholders
Defender Equities Pty Ltd and Woodville Super Pty Ltd – 6.05%
Directors Direct & Indirect Holdings of vested shares:
Shareholdings Vested Shares m. Current Issued
mil. %
David Shaw - Non-Exec Chairman 1.92 0.44%
Alexis Clark - Exec Director, CEO 3.74 0.86%
Frank Pirera - CFO, Company Secretary 1.27 0.29%
Source: AOW Prospectus Aug’18
Underwriter of Rights Issue – Capital Investment Partners Pty Ltd ACN 37 110 468 589
PAC Partners Desk Note American Patriot Ltd (AOW)
6
Company Profile – Assets and Acquisitions
Acquisition of Foothills Resources Inc, Magnolia/Burnett and Peak Energy assets
AOW has signed two separate acquisition deals of the Foothills assets and Magnolia & Burnett Assets for US18m that have the capability to double calendar-2019 EBITDA. To this is added US$2.2m for the previously announced Peak Energy transaction for total deals worth US$20.45m. These deals are transformational.
Profile of the assets being acquired by AOW
American Patriot O&G Equity Operator
Acquisition
Price EV/1P EV/2P
PDP DCF
(10% real)
Total DCF
(10% real)
Acquisitions % US$m. US$/boe US$/boe US$m. US$m.
Foothills 100% AOW 15.000 $5.27 $3.27 23.510 32.914
Peak Energy 100% AOW 2.250 $2.62 $2.62 3.068 5.540
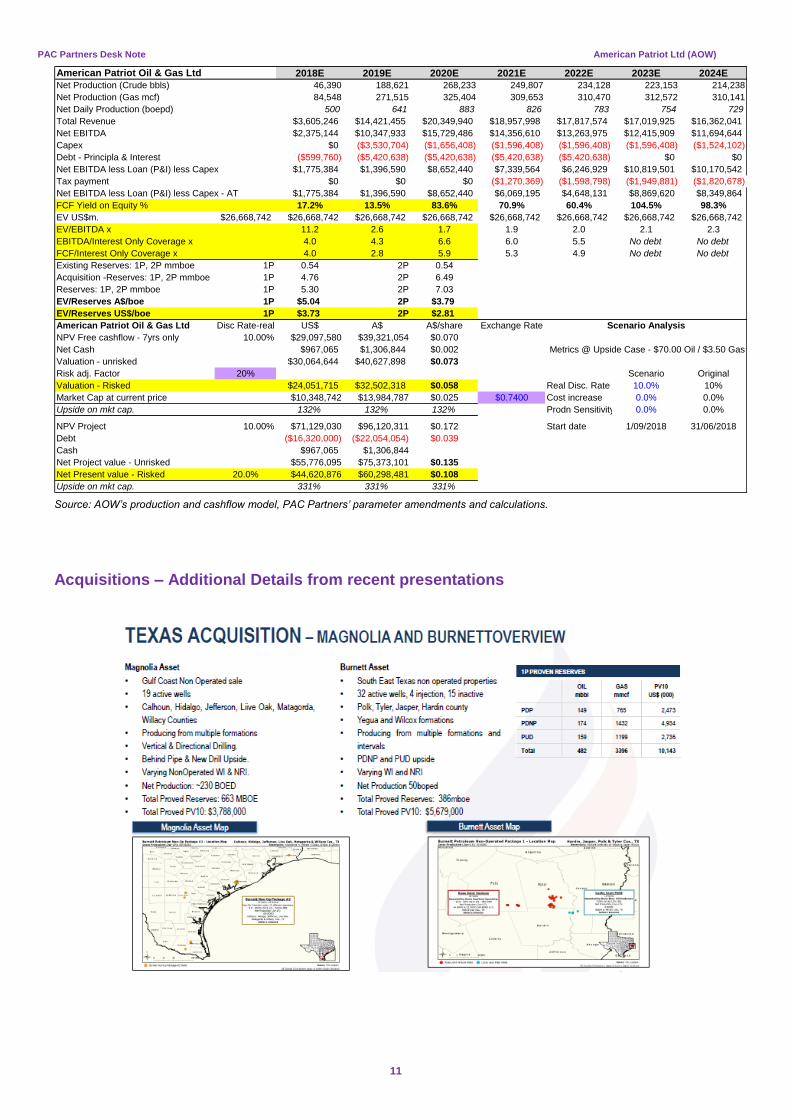
Magnolia & Burnett 5.9%-30.9%; Davis 3.200 $3.05 $3.05 2.473 10.143
Acquisitions Total 20.450 $4.30 $3.15 29.051 48.597
American Patriot O&G
Oil PDP
1P
Gas PDP
1P
Total PDP
1P Total - 1P Total - 2P Oil Prodn Gas Prodn
Initial
Productn
Wells
producing
Acquisitions m bbl mmcf m boe m boe m boe bopd mmcf/d boe/d #
Foothills 2,123.0 0.0 2,123.0 2,848.0 4,585.0 300.0 300.0 62.0
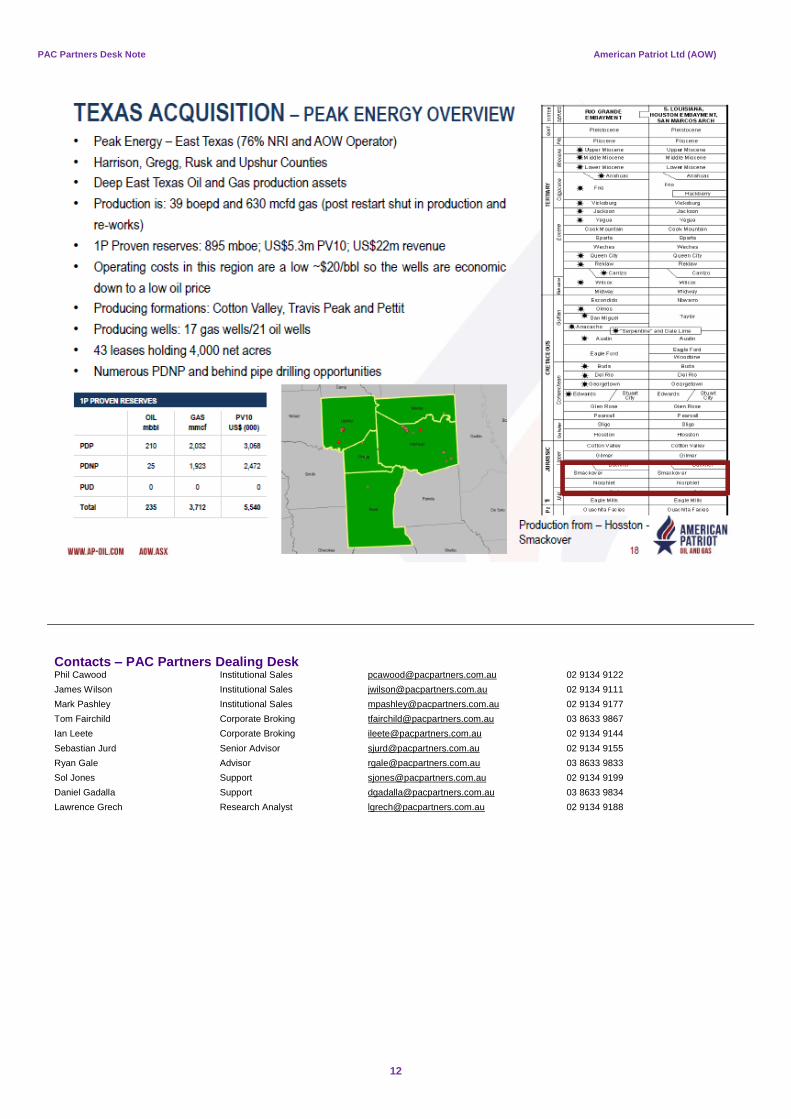
Peak Energy 213.0 1,846.0 520.7 859.8 859.8 39.0 630.0 144.0 38.0
Magnolia & Burnett 149.0 765.0 276.5 1,048.0 1,048.0 106.0 106.0 51.0
Acquisitions Total 2,485.0 2,611.0 2,920.2 4,755.8 6,492.8 445.0 630.0 550.0 151.0 Source: AOW Placement announcement and Aug18 Presentation
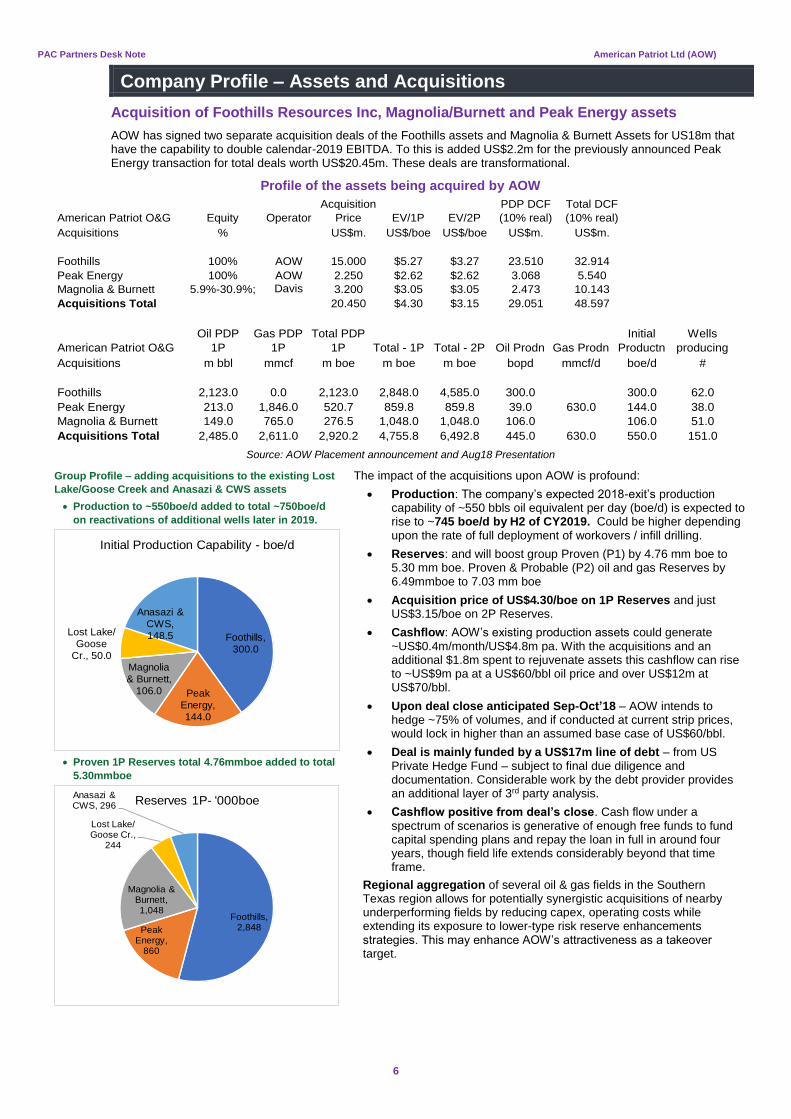
Group Profile – adding acquisitions to the existing Lost
Lake/Goose Creek and Anasazi & CWS assets
• Production to ~550boe/d added to total ~750boe/d
on reactivations of additional wells later in 2019.
Foothills,
300.0
Peak
Energy,
144.0
Magnolia
& Burnett,
106.0
Lost Lake/
Goose
Cr., 50.0
Anasazi &
CWS,
148.5
Initial Production Capability - boe/d
• Proven 1P Reserves total 4.76mmboe added to total
5.30mmboe
Foothills, 2,848Peak
Energy, 860
Magnolia & Burnett, 1,048
Lost Lake/ Goose Cr.,
244
Anasazi & CWS, 296 Reserves 1P- '000boe
The impact of the acquisitions upon AOW is profound:
• Production: The company’s expected 2018-exit’s production capability of ~550 bbls oil equivalent per day (boe/d) is expected to rise to ~745 boe/d by H2 of CY2019. Could be higher depending upon the rate of full deployment of workovers / infill drilling.
• Reserves: and will boost group Proven (P1) by 4.76 mm boe to 5.30 mm boe. Proven & Probable (P2) oil and gas Reserves by 6.49mmboe to 7.03 mm boe
• Acquisition price of US$4.30/boe on 1P Reserves and just US$3.15/boe on 2P Reserves.
• Cashflow: AOW’s existing production assets could generate ~US$0.4m/month/US$4.8m pa. With the acquisitions and an additional $1.8m spent to rejuvenate assets this cashflow can rise to ~US$9m pa at a US$60/bbl oil price and over US$12m at US$70/bbl.
• Upon deal close anticipated Sep-Oct’18 – AOW intends to hedge ~75% of volumes, and if conducted at current strip prices, would lock in higher than an assumed base case of US$60/bbl.
• Deal is mainly funded by a US$17m line of debt – from US Private Hedge Fund – subject to final due diligence and documentation. Considerable work by the debt provider provides an additional layer of 3rd party analysis.
• Cashflow positive from deal’s close. Cash flow under a spectrum of scenarios is generative of enough free funds to fund capital spending plans and repay the loan in full in around four years, though field life extends considerably beyond that time frame.
Regional aggregation of several oil & gas fields in the Southern Texas region allows for potentially synergistic acquisitions of nearby underperforming fields by reducing capex, operating costs while extending its exposure to lower-type risk reserve enhancements strategies. This may enhance AOW’s attractiveness as a takeover target.
PAC Partners Desk Note American Patriot Ltd (AOW)
7
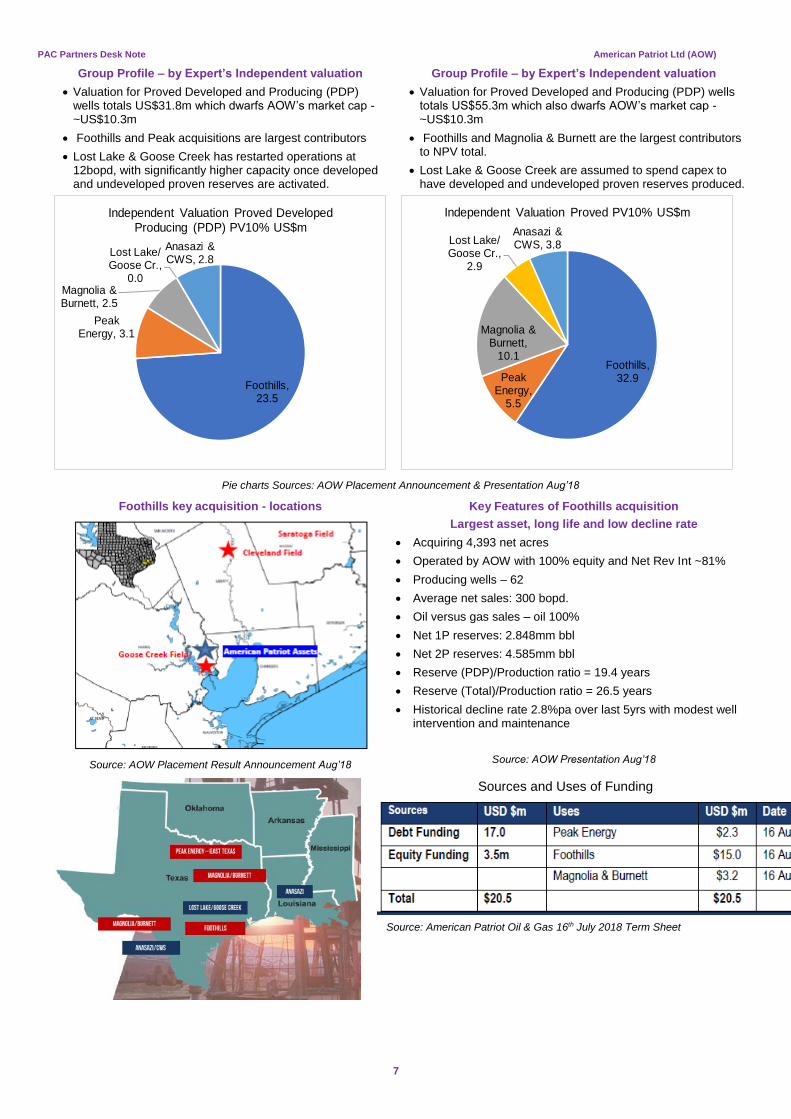
Group Profile – by Expert’s Independent valuation
• Valuation for Proved Developed and Producing (PDP) wells totals US$31.8m which dwarfs AOW’s market cap - ~US$10.3m
• Foothills and Peak acquisitions are largest contributors
• Lost Lake & Goose Creek has restarted operations at 12bopd, with significantly higher capacity once developed and undeveloped proven reserves are activated.
Foothills, 23.5
Peak Energy, 3.1
Magnolia & Burnett, 2.5
Lost Lake/ Goose Cr.,
0.0
Anasazi & CWS, 2.8
Independent Valuation Proved Developed
Producing (PDP) PV10% US$m
Group Profile – by Expert’s Independent valuation
• Valuation for Proved Developed and Producing (PDP) wells totals US$55.3m which also dwarfs AOW’s market cap - ~US$10.3m
• Foothills and Magnolia & Burnett are the largest contributors to NPV total.
• Lost Lake & Goose Creek are assumed to spend capex to have developed and undeveloped proven reserves produced.
Foothills, 32.9Peak
Energy, 5.5
Magnolia & Burnett,
10.1
Lost Lake/ Goose Cr.,
2.9
Anasazi & CWS, 3.8
Independent Valuation Proved PV10% US$m
Pie charts Sources: AOW Placement Announcement & Presentation Aug’18
Foothills key acquisition - locations
Source: AOW Placement Result Announcement Aug’18
Key Features of Foothills acquisition
Largest asset, long life and low decline rate
• Acquiring 4,393 net acres
• Operated by AOW with 100% equity and Net Rev Int ~81%
• Producing wells – 62
• Average net sales: 300 bopd.
• Oil versus gas sales – oil 100%
• Net 1P reserves: 2.848mm bbl
• Net 2P reserves: 4.585mm bbl
• Reserve (PDP)/Production ratio = 19.4 years
• Reserve (Total)/Production ratio = 26.5 years
• Historical decline rate 2.8%pa over last 5yrs with modest well intervention and maintenance
Source: AOW Presentation Aug’18
Sources and Uses of Funding
Source: American Patriot Oil & Gas 16th July 2018 Term Sheet
PAC Partners Desk Note American Patriot Ltd (AOW)
8
Management Team – the key success factor for the operations scale-up
AOW starts with a small core of experienced executives located in Australia and the US with the primary responsibility for identifying asset opportunities and building both an operations capability and cashflow producing base.
The Board and key staff have significant E&P experience with proven deal origination and execution capabilities and drive to grow a significant oil and gas business. They have reviewed and analysed multiple transactions with a guiding thorough due diligence methodology. AOW will be looking to open an office in Houston post closing of these transactions and the CEO will re-locate to be based in Houston.
The past year’s acquisitions of oil and gas field operating companies comes with experienced operators and staff. AOW’s plan is to keep the management team lean, nimble and a few additional staff including added to reservoir specialists. A potential upside is merging the skills bases of the various acquisitions to boost efficiency and production rates across the growing portfolio of assets.
AOW’s Board and Staff
Mr. David Shaw- Non-Executive Chairman
David Shaw is a Melbourne University law graduate and is currently a practicing solicitor with his own firm Campbell & Shaw Lawyers. David is a director on several private company boards and advisory boards. David has a long history with the Australian Football League (AFL) and was the Essendon Football Club President from 1992 to 2002. In addition, David was the former Commissioner of the AFL. David is a non-executive chairman of Ambassador Oil and Gas Limited. David is classified as an independent Director.
Alexis Clark – CEO
Prior to his employment with the Company, Mr. Clark was a Consultant to the Oil & Gas Industry. Mr. Clark was employed as an Oil & Gas Analyst at Paterson’s Securities responsible for coverage of small-mid cap oil & gas companies and has previously worked as an Energy Analyst at Merrill Lynch covering large and medium cap energy companies; and more recently Shaw Stockbroking where he covered a basket of mid-cap oil and gas companies. In addition to this, Mr. Clark has over 10 years of experience in the Institutional banking and finance sector where he has held positions at Westpac Institutional Bank, GE Capital and ANZ Banking Group, responsible for the origination and execution of transactions across the Energy & Resources and Infrastructure client base.
Frank Pirera – CFO
Mr. Pirera is a graduate of Monash University where he obtained a Bachelor of Business (Accounting) and is a Fellow of the Certified Practicing Accountants with more than 30 years of experience in public practice. Mr. Pirera has a wealth of experience in financial control and management and strategic planning having advised numerous public and private companies throughout his career.
Nicholas Melosi – COO
Over a decade of experience in the oil and gas industry and is a geology graduate of Southern Illinois University. Prior to working with American Patriot Oil and Gas, Mr. Melosi was employed by and consulted with large and medium cap companies such as Marathon Oil and Gas, Sanchez Oil and Gas, Carrizo Oil and gas and BHP Billiton. He is an Operations, development and Acquisitions geologist with operations/development experience in over 250 horizontal wells across US plays. Developed multiple developmental/engineering driven drilling projects, has performed reserve analysis on multiple acquisitions and has been involved with multiple workover projects.
American Patriot Office Staff – US
Jamie Davis – Current Acquisitions/Operations Accountant, 10+ Years in accounting services
Personnel to come with acquisitions
Foothills – Foothills Field Personnel have been with the company for 5+ Years
Noel Putscher – is responsible for overseeing daily Operations at Foothills Resources, Inc. and has over 30 years of Industry experience with much of his time spent managing, supervising and performing operational functions in the upstream oil and gas business.
Matt Murphy –has been the Field Manager of the Goose Creek and Saratoga fields for Foothills Resources, Inc. since 2012. He oversees production from the fields and manages lease operating expenses. He also supervises company and contract lease operators, as well as third party workover rigs and other service companies.
Wrenn Wright and Joseph Grimm – are Lease Operators at Foothills’ Goose Creek field. Their duties include inspecting, managing and maintaining tank batteries, on/off shore crude oil and disposal wells, and field equipment.
Martin Chavez – has been a part-time contract Lease Operator at Foothills’ Goose Creek field since 2016 and performs similar duties as Foothills’ lease operators on weekend days. From 2014 – 2016, he was a Lease Operator for Siempre Energy, a company that previously operated production in the Goose Creek field.
Sara Garcia – Ms. Garcia has been a part-time contract Production Assistant for Foothills since 2015. Her duties include data entry for Foothills’ gauging and run ticket software and the preparation of various production-related reports, including daily production reports by lease, monthly well test allocation reports, and monthly Texas Railroad Commission production reports.
PAC Partners Desk Note American Patriot Ltd (AOW)
9
Peak – Peak Field Personnel have been with the company for 5+ Years
Gregg Gee – Field Supervisor - began his oilfield career selling and repairing production equipment and has spent the last 30+ years involved in virtually every aspect of oil and gas field operation. Workovers, recompletions, fishing jobs, production management on wells from south and west Texas to Oklahoma, Kansas, Arkansas, Louisiana and Mississippi.
Gwenda Gee – Pumper 1 - 11 years as a self-employed contractor in the oil and gas fields of East Texas. She has been operating and maintaining compressors, pumping (rod pump and electric submersible pump) wells, flowing wells and is also experienced in gathering systems, pipeline systems and the reporting involved with all aspects of daily operation.
Clinton Brice – Pumper 2 - began his oilfield career as a commercial diver doing subsea platform and underwater welding. later moved into the coiled tubing and then contract lease operations side of the oilfields.
Richard Coe – (Downhole Engineer – Contract)
Workover/Re-Completions Contractors
EOS - Jess Moore (Owner) – Has been with EOS Well Service since 1997 and working in the Goose Creek field since 2001 as the tool pusher. Jess knows these wells more than anyone.
Innovative - Marty Salinas (Tool Pusher) – started from floor hand and worked up to Tool Pusher. Gaining skills / experience include work over rig completions, wireline, H2S, mechanical trouble shooting rigs. Managed several rigs and crews as Field Supervisor.
Scenarios valuations
Scenario basis for valuing American Patriot Oil & Gas Ltd dd
Important Disclaimer - our scoping valuation is based upon AOW’s field model which we have reviewed. PAC Partners have not visited and inspected the company’s assets.
We examine two scenarios to review three key aspects of AOW post-acquisition of the three key deals outlined above.
The EV/EBITDA, Interest Coverage and NPV Valuations of our favoured (more conservative) of next 7-years of cashflows.
To the latter we apply an implementation discount to valuation – which would shrink, and value would rise if production/cashflow performance is met.
Two scenarios chosen are:
1. Lower output/higher costs Mid Case Price (US$60/bbl) Scenario
2. Hi-Case Price (US$70/bbl) with Management Production & Costs Scenario
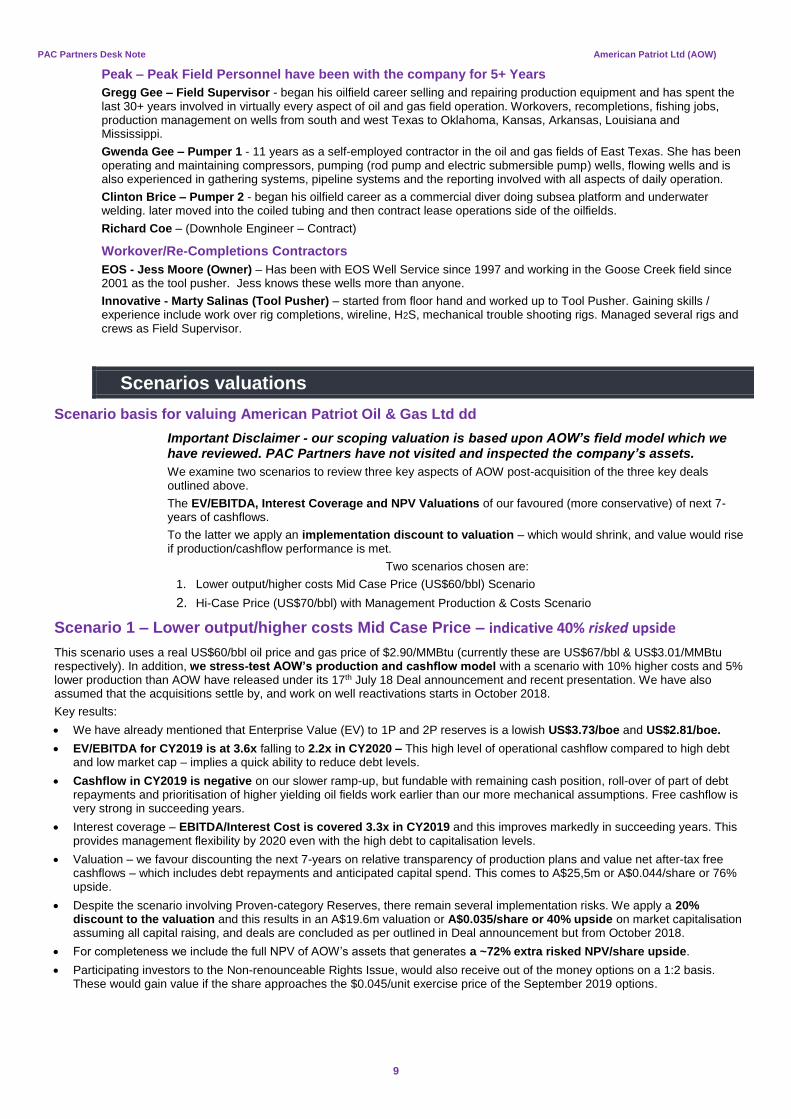
Scenario 1 – Lower output/higher costs Mid Case Price – indicative 40% risked upside
This scenario uses a real US$60/bbl oil price and gas price of $2.90/MMBtu (currently these are US$67/bbl & US$3.01/MMBtu respectively). In addition, we stress-test AOW’s production and cashflow model with a scenario with 10% higher costs and 5% lower production than AOW have released under its 17th July 18 Deal announcement and recent presentation. We have also assumed that the acquisitions settle by, and work on well reactivations starts in October 2018.
Key results:
• We have already mentioned that Enterprise Value (EV) to 1P and 2P reserves is a lowish US$3.73/boe and US$2.81/boe.
• EV/EBITDA for CY2019 is at 3.6x falling to 2.2x in CY2020 – This high level of operational cashflow compared to high debt and low market cap – implies a quick ability to reduce debt levels.
• Cashflow in CY2019 is negative on our slower ramp-up, but fundable with remaining cash position, roll-over of part of debt repayments and prioritisation of higher yielding oil fields work earlier than our more mechanical assumptions. Free cashflow is very strong in succeeding years.
• Interest coverage – EBITDA/Interest Cost is covered 3.3x in CY2019 and this improves markedly in succeeding years. This provides management flexibility by 2020 even with the high debt to capitalisation levels.
• Valuation – we favour discounting the next 7-years on relative transparency of production plans and value net after-tax free cashflows – which includes debt repayments and anticipated capital spend. This comes to A$25,5m or A$0.044/share or 76% upside.
• Despite the scenario involving Proven-category Reserves, there remain several implementation risks. We apply a 20% discount to the valuation and this results in an A$19.6m valuation or A$0.035/share or 40% upside on market capitalisation assuming all capital raising, and deals are concluded as per outlined in Deal announcement but from October 2018.
• For completeness we include the full NPV of AOW’s assets that generates a ~72% extra risked NPV/share upside.
• Participating investors to the Non-renounceable Rights Issue, would also receive out of the money options on a 1:2 basis. These would gain value if the share approaches the $0.045/unit exercise price of the September 2019 options.
PAC Partners Desk Note American Patriot Ltd (AOW)
10
American Patriot Oil & Gas Ltd 2018E 2019E 2020E 2021E 2022E 2023E 2024E
Net Production (Crude bbls) 46,390 182,845 254,486 236,991 222,015 211,474 203,009
Net Production (Gas mcf) 84,548 267,507 312,783 295,964 295,583 296,453 293,399
Net Daily Production (boepd) 500 623 840 784 743 715 690
Total Revenue $3,090,617 $12,004,760 $16,586,066 $15,444,425 $14,502,158 $13,837,902 $13,297,689
Net EBITDA $1,852,380 $7,964,756 $12,089,120 $10,940,892 $10,024,369 $9,291,858 $8,670,981
Capex $0 ($3,655,704) ($1,806,408) ($1,746,408) ($1,746,408) ($1,746,408) ($1,674,102)
Debt - Principla & Interest ($599,760) ($5,420,638) ($5,420,638) ($5,420,638) ($5,420,638) $0 $0
Net EBITDA less Loan (P&I) less Capex $1,252,620 ($1,111,586) $4,862,074 $3,773,846 $2,857,322 $7,545,450 $6,996,879
Tax payment $0 $0 $0 $0 ($1,279) ($1,278,392) ($1,171,155)
Net EBITDA less Loan (P&I) less Capex - AT $1,252,620 ($1,111,586) $4,862,074 $3,773,846 $2,856,043 $6,267,058 $5,825,724
FCF Yield on Equity % 12.1% -10.7% 47.0% 36.5% 27.6% 72.9% 67.6%
EV US$m. $26,668,742 $26,668,742 $26,668,742 $26,668,742 $26,668,742 $26,668,742 $26,668,742 $26,668,742
EV/EBITDA x 14.4 3.3 2.2 2.4 2.7 2.9 3.1
EBITDA/Interest Only Coverage x 3.1 3.3 5.0 4.6 4.2 No debt No debt
FCF/Interest Only Coverage x 3.1 1.8 4.3 3.8 3.5 No debt No debt
Existing Reserves: 1P, 2P mmboe 1P 0.54 2P 0.54
Acquisition -Reserves: 1P, 2P mmboe 1P 4.76 2P 6.49
Reserves: 1P, 2P mmboe 1P 5.30 2P 7.03
EV/Reserves A$/boe 1P $5.04 2P $3.79
EV/Reserves US$/boe 1P $3.73 2P $2.81
American Patriot Oil & Gas Ltd Disc Rate-real US$ A$ A$/share Exchange Rate Scenario Analysis
NPV Free cashflow - 7yrs only 10.00% $17,197,070 $23,239,284 $0.042
Net Cash $967,065 $1,306,844 $0.002 Metrics @ Base Case - $60.00 Oil / $2.90 Gas
Valuation - unrisked $18,164,134 $24,546,128 $0.044
Risk adj. Factor 20% Scenario Original
Valuation - Risked $14,531,308 $19,636,902 $0.035 Real Disc. Rate 10.0% 10%
Market Cap at current price $10,348,742 $13,984,787 $0.025 $0.7400 Cost increase 10.0% 0.0%
Upside on mkt cap. 40% 40% 40% Prodn Sensitivity -5.0% 0.0%
NPV Project 10.00% $47,018,798 $63,538,916 $0.114 Start date 1/09/2018 31/06/2018
Debt ($16,320,000) ($22,054,054) $0.039
Cash $967,065 $1,306,844
Net Project value - Unrisked $31,665,863 $42,791,706 $0.076
Net Present value - Risked 20.0% $25,332,690 $34,233,365 $0.061
Upside on mkt cap. 145% 145% 145% Source: AOW’s production and cashflow model, PAC Partners’ parameter amendments and calculations.
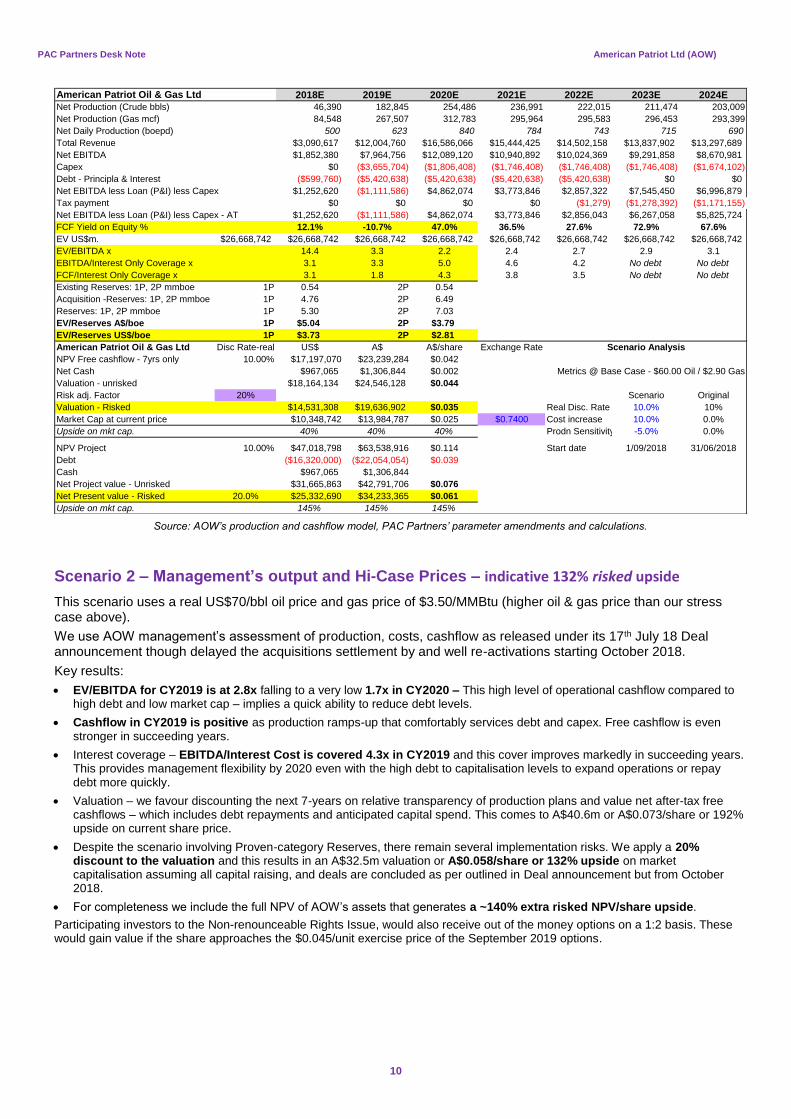
Scenario 2 – Management’s output and Hi-Case Prices – indicative 132% risked upside
This scenario uses a real US$70/bbl oil price and gas price of $3.50/MMBtu (higher oil & gas price than our stress case above).
We use AOW management’s assessment of production, costs, cashflow as released under its 17th July 18 Deal announcement though delayed the acquisitions settlement by and well re-activations starting October 2018.
Key results:
• EV/EBITDA for CY2019 is at 2.8x falling to a very low 1.7x in CY2020 – This high level of operational cashflow compared to high debt and low market cap – implies a quick ability to reduce debt levels.
• Cashflow in CY2019 is positive as production ramps-up that comfortably services debt and capex. Free cashflow is even stronger in succeeding years.
• Interest coverage – EBITDA/Interest Cost is covered 4.3x in CY2019 and this cover improves markedly in succeeding years. This provides management flexibility by 2020 even with the high debt to capitalisation levels to expand operations or repay debt more quickly.
• Valuation – we favour discounting the next 7-years on relative transparency of production plans and value net after-tax free cashflows – which includes debt repayments and anticipated capital spend. This comes to A$40.6m or A$0.073/share or 192% upside on current share price.
• Despite the scenario involving Proven-category Reserves, there remain several implementation risks. We apply a 20% discount to the valuation and this results in an A$32.5m valuation or A$0.058/share or 132% upside on market capitalisation assuming all capital raising, and deals are concluded as per outlined in Deal announcement but from October 2018.
• For completeness we include the full NPV of AOW’s assets that generates a ~140% extra risked NPV/share upside.
Participating investors to the Non-renounceable Rights Issue, would also receive out of the money options on a 1:2 basis. These would gain value if the share approaches the $0.045/unit exercise price of the September 2019 options.
PAC Partners Desk Note American Patriot Ltd (AOW)
11
American Patriot Oil & Gas Ltd 2018E 2019E 2020E 2021E 2022E 2023E 2024E
Net Production (Crude bbls) 46,390 188,621 268,233 249,807 234,128 223,153 214,238
Net Production (Gas mcf) 84,548 271,515 325,404 309,653 310,470 312,572 310,141
Net Daily Production (boepd) 500 641 883 826 783 754 729
Total Revenue $3,605,246 $14,421,455 $20,349,940 $18,957,998 $17,817,574 $17,019,925 $16,362,041
Net EBITDA $2,375,144 $10,347,933 $15,729,486 $14,356,610 $13,263,975 $12,415,909 $11,694,644
Capex $0 ($3,530,704) ($1,656,408) ($1,596,408) ($1,596,408) ($1,596,408) ($1,524,102)
Debt - Principla & Interest ($599,760) ($5,420,638) ($5,420,638) ($5,420,638) ($5,420,638) $0 $0
Net EBITDA less Loan (P&I) less Capex $1,775,384 $1,396,590 $8,652,440 $7,339,564 $6,246,929 $10,819,501 $10,170,542
Tax payment $0 $0 $0 ($1,270,369) ($1,598,798) ($1,949,881) ($1,820,678)
Net EBITDA less Loan (P&I) less Capex - AT $1,775,384 $1,396,590 $8,652,440 $6,069,195 $4,648,131 $8,869,620 $8,349,864
FCF Yield on Equity % 17.2% 13.5% 83.6% 70.9% 60.4% 104.5% 98.3%
EV US$m. $26,668,742 $26,668,742 $26,668,742 $26,668,742 $26,668,742 $26,668,742 $26,668,742 $26,668,742
EV/EBITDA x 11.2 2.6 1.7 1.9 2.0 2.1 2.3
EBITDA/Interest Only Coverage x 4.0 4.3 6.6 6.0 5.5 No debt No debt
FCF/Interest Only Coverage x 4.0 2.8 5.9 5.3 4.9 No debt No debt
Existing Reserves: 1P, 2P mmboe 1P 0.54 2P 0.54
Acquisition -Reserves: 1P, 2P mmboe 1P 4.76 2P 6.49
Reserves: 1P, 2P mmboe 1P 5.30 2P 7.03
EV/Reserves A$/boe 1P $5.04 2P $3.79
EV/Reserves US$/boe 1P $3.73 2P $2.81
American Patriot Oil & Gas Ltd Disc Rate-real US$ A$ A$/share Exchange Rate Scenario Analysis
NPV Free cashflow - 7yrs only 10.00% $29,097,580 $39,321,054 $0.070
Net Cash $967,065 $1,306,844 $0.002 Metrics @ Upside Case - $70.00 Oil / $3.50 Gas
Valuation - unrisked $30,064,644 $40,627,898 $0.073
Risk adj. Factor 20% Scenario Original
Valuation - Risked $24,051,715 $32,502,318 $0.058 Real Disc. Rate 10.0% 10%
Market Cap at current price $10,348,742 $13,984,787 $0.025 $0.7400 Cost increase 0.0% 0.0%
Upside on mkt cap. 132% 132% 132% Prodn Sensitivity 0.0% 0.0%
NPV Project 10.00% $71,129,030 $96,120,311 $0.172 Start date 1/09/2018 31/06/2018
Debt ($16,320,000) ($22,054,054) $0.039
Cash $967,065 $1,306,844
Net Project value - Unrisked $55,776,095 $75,373,101 $0.135
Net Present value - Risked 20.0% $44,620,876 $60,298,481 $0.108
Upside on mkt cap. 331% 331% 331% Source: AOW’s production and cashflow model, PAC Partners’ parameter amendments and calculations.
Acquisitions – Additional Details from recent presentations
PAC Partners Desk Note American Patriot Ltd (AOW)
12
Contacts – PAC Partners Dealing Desk Phil Cawood Institutional Sales [email protected] 02 9134 9122
James Wilson Institutional Sales [email protected] 02 9134 9111
Mark Pashley Institutional Sales [email protected] 02 9134 9177
Tom Fairchild Corporate Broking [email protected] 03 8633 9867
Ian Leete Corporate Broking [email protected] 02 9134 9144
Sebastian Jurd Senior Advisor [email protected] 02 9134 9155
Ryan Gale Advisor [email protected] 03 8633 9833
Sol Jones Support [email protected] 02 9134 9199
Daniel Gadalla Support [email protected] 03 8633 9834
Lawrence Grech Research Analyst [email protected] 02 9134 9188
PAC Partners Desk Note American Patriot Ltd (AOW)
13
DISCLAIMER AND DISCLOSURE - IMPORTANT – Please read carefully
PAC Partners Securities Pty Ltd. (“PAC Partners” or “PAC” or “PPS”) is a Corporate Authorised Representative of PAC Asset Management Pty Ltd holder of an Australian Financial Services Licence (AFSL No. 335 374).
PAC Partners has been engaged by and receives fees from American Patriot Limited (AOW:ASX) to provide research services. In
addition, PAC Partners and/or its advisors received a fee of 4.0% plus GST on all amounts raised by PAC Partners via the July 2018
placement Offer in American Patriot Oil & Gas Limited. In addition, PAC Partners and its representatives (as defined in the Corporations
Act 2001) may have existing shares and option holdings in the Company and may also apply for shares in the current rights issue. PAC
Partners may seek in future to provide additional services to American Patriot Oil & Gas Ltd.
This Desk Note is not intended to be broadly distributed. The information contained in this Note is provided by PAC Partners to Wholesale Investors only. Retail investor and third-party recipients should not rely, directly or indirectly, on this report. Users of this Desk Note should not act on any content or recommendation without first seeking professional advice. Whilst the report has been prepared with all reasonable care from sources which we believe are reliable, no responsibility or liability is accepted by PAC Partners, for any errors or omissions or misstatements however caused.
The Author is conflicted by reason of him being associated with the Dealing Desk (described below) in the provision of financial services to the entity, which is the subject of the Desk Note, and to potential investors in that entity. Also, the Author is not independently supervised, as he reports into the aforementioned Dealing Desk, and his remuneration may in part be related to the revenues of that Desk, which may include corporate finance fees arising from transactions involving the entity that is the subject of the Desk Note.
This Dealing Desk Note embodies facts, findings and conclusions but not opinions or recommendations.
The information provided here is general in character and is not specific to any particular investor’s financial circumstances and needs, investment objectives or risk tolerance. This general information is however identified for investors who have substantial experience in investing in volatile securities markets and who appreciate and tolerate the high level of risk and volatility inherent in investing in market priced financial products and are able to assess for themselves the merits, value and risks of a security and their information needs in relation to it.
Markets often move in unexpected and unpredictable ways at times that cannot reasonably be anticipated. Investors can lose money investing in securities. The views expressed are speculative and are often time sensitive. Before investing in securities, investors should obtain an opinion or recommendation from a licensed securities adviser to whom they should fully disclose all their relevant financial circumstances and needs, investment objectives and tolerance for risk to ensure that a particular investment opportunity is in fact appropriate to the investor.
PAC has made every effort to ensure the reliability of the facts and findings identified herein. Our Desk Note is based on information known to us or which was obtained from sources which we believed to be reliable and accurate at the time of publication. Given the inherent risks in investing in the securities markets our findings and conclusions may not always prove to be correct.
The Desk Note is prepared for general information only, and as such, the specific needs, investment objectives or financial situation of any particular reader have not been taken into consideration. Individuals should therefore discuss, with their adviser the merits of the Analysis for their own specific circumstances and realize that not all investments will be appropriate for all readers.
To the extent permitted by law PAC Partners Securities and its employees, agents and authorised representatives exclude all liability for any loss or damage (including indirect, special or consequential loss or damage) arising from the use of, or reliance on, any information, view or recommendation (the information) whether or not caused by any negligent act or omission. If the law prohibits the exclusion of such liability, PAC Partners hereby limits its liability, to the extent permitted by law, to the re-supply of the information or the cost of the said re-supply.
Disclosure: PAC Partners Securities and/or its associates within the meaning of Chapter 7 of the Corporations Law may:
• hold securities in the entity discussed and commented on in this Desk Note;
• buy and sell securities in the entity that is discussed and commented on in this Desk Note before or after publication;
• receive commission from clients for dealing in securities in the entity that is discussed and commented on in this Desk Note and its representatives and analysts may directly share in that commission;
• receive fees, commissions and payments including placement fees from the entity that is discussed and commented on in this Desk Note;
• receive corporate advisory fees, payments, and commission from the entity that is discussed and commented upon in this Desk Note.
For more information about PAC Partners please visit www.pacpartners.com.au
If you would like to be removed from this distribution list please click here: UNSUBSCRIBE.
If you would like to update your details please click here: MODIFY.
Recommended