
AN ASSESSMENT OF RAIN-FED CROP PRODUCTION POTENTIAL IN SOUTH
AFRICA'S NEIGHBORING COUNTRIES
EXECUTIVE SUMMARY
South Africa uses 60% of its scarce water resources on irrigation, a substantial portion of which is
used to irrigate crops which are regarded internationally as rain-fed crops. The question is
therefore being asked about the extent of alternative production areas in southern Africa
(particularly in selected neighboring countries) for the range of crops which are presently produced
sub-optimally under irrigation in South Africa.
The objective of this study is therefore to provide an answer to this question with adequate
confidence to allow the rational pursuit of this concept which could have far-reaching mutual
benefit for southern African countries.
The countries that were considered are Mozambique, Zimbabwe, Malawi and Zambia.
The assessment was based on a broad (“desk-top”) regional evaluation of soils, topography and
climate, which were, in turn, used to define and demarcate agro-ecological zones in which a range
of crops can be grown commercially under rain-fed conditions.
The study used two main characterization systems to define the agro-ecological zones, namely the
climate-based Koppen-Geiger Climate System (KGCS) (ref. 16) and the US Department of
Agriculture‟s, Natural Resources Conservation Service - Land Classification System (LCS) (ref. 9).
The estimation of crop production areas within the agro-ecological zones was then refined by the
exclusion of reserve land, areas of high population (urban and peri-urban environments) and areas
of unsuitable topography for crop production. These exclusions are referred to as the “principal
exclusions”.
A provision was then made for secondary exclusions which include areas committed to alternative
land-use such as rangeland and afforestation and scattered areas of unsuitable soils such as
wetlands, riverine areas and eroded areas.
This broad assessment revealed that the four target countries possess a net area of about
26,6 million ha of high-potential rain-fed cropping land (referred to as “Premium” land use potential)
with the following breakdown per country:
Zambia 11,1 million ha
Mozambique 8,8 million ha
Zimbabwe 6,3 million ha
Malawi 0,4 million ha
The rain-fed crop production potential includes a wide range of summer field crops such as maize
soybean, dry bean, groundnuts and sorghum which are adapted to parts of all four of the target
countries and winter rain-fed field crops such as wheat, barley and dry pea which can be grown
extensively in all the countries except Mozambique.

The selected neighbouring countries therefore display a rich potential for rain-fed crop production
and, in the context of the SADC countries as a whole, provide a highly significant opportunity for
agricultural development in the region and an opportunity to substitute high-potential rain-fed crop
production for expensive and water-inefficient irrigation of annual field crops in South Africa.
The four countries experience a number of major socio-economic constraints to the exploitation of
this excellent potential. The constraints include land tenure issues (the majority of the high
potential rain-fed cropping area is occupied by subsistence farmers on communally owned land),
population (the high rural population spread presents a challenge to commercialisation of
agriculture), present land use (widespread subsistence farming), poor or lacking infrastructure and
poor agricultural support services., However the constraints are not considered insurmountable.
With the appropriate vision, investment and support from the governments of the respective
countries there are significant opportunities for extensive commercial agricultural development
which could involve and benefit local farmers and their communities. The recent examples of
South African farmers operating successfully in Mozambique and Zambia, with full government
backing, have shown that these constraints can be overcome.
Whilst the principal objective of this study is to identify areas that are suited to rain-fed crop
production, the existence of a considerable network of largely „un-tapped‟ surface water resources,
especially in Zambia and Mozambique is highlighted. There is therefore an opportunity for
expanded utilisation of the water resources in these countries for irrigation where there is a higher
irrigation potential, in terms of both soils and climate, than exists for many of the irrigation areas of
South Africa.
AN ASSESSMENT OF RAIN-FED CROP PRODUCTION POTENTIAL
IN SOUTH AFRICA'S NEIGHBORING COUNTRIES
TABLE OF CONTENTS
Page
1 INTRODUCTION ................................................................................................................... 1
2 METHODOLOGY .................................................................................................................. 1
3 PRESENT AGRICULTURAL PROFILE IN THE SELECTED COUNTRIES .......................... 2
3.1 MOZAMBIQUE ............................................................................................................. 2
3.2 ZAMBIA........................................................................................................................ 3
3.3 MALAWI ....................................................................................................................... 3
3.4 ZIMBABWE .................................................................................................................. 4
4 CLIMATE CLASSIFICATION ................................................................................................ 4
4.1 INTRODUCTION .......................................................................................................... 4
4.2 ZONE CODING ............................................................................................................ 5
5 SOIL AND LAND USE MAPPING ......................................................................................... 8
5.1 INTRODUCTION .......................................................................................................... 8
5.2 THE USDA LAND CLASSIFICATION SYSTEM (LCS) ................................................ 8
5.3 AREAS EXCLUDED FROM THE LAND CLASSES IN THE STUDY AREA .............. 10
5.3.1 Principal exclusions ........................................................................................ 10
6 COMBINED SUITABILITY ANALYSIS ................................................................................ 14
6.1 PREMIUM LAND USE POTENTIAL AND POPULATION OVERLAY ........................ 14
6.2 AGRO-ECOLOGICAL ZONES BASED ON “PREMIUM” LAND-USE POTENTIAL, CLIMATIC ZONES AND PRIMARY EXCLUSIONS ................................................... 14
6.3 SECONDARY EXCLUSIONS ..................................................................................... 14
6.4 NET HIGH-POTENTIAL CROPPING AREAS (km2) .................................................. 15
7 CROP SUITABILITY ........................................................................................................... 17
8 CONSTRAINTS TO THE DEVELOPMENT OF THE EXTENSIVE RAIN-FED CROPPING
POTENTIAL ........................................................................................................................ 21
9 IRRIGATION........................................................................................................................ 21
10 CONCLUSIONS .................................................................................................................. 22
APPENDICES

Appendix A Notes on Mapping
Appendix B Eswaran‟s definitions of Land Quality
Appendix C Climate Information
Appendix D References
Crop Production Potential Final
March 2010 1
1 INTRODUCTION
South Africa uses about 60% of its scarce water resources on irrigation, a substantial
portion of which is used to irrigate crops which are regarded internationally as rain-fed
crops. The question is therefore being asked about the extent of alternative production
areas in southern Africa (particularly in selected neighbouring countries) for the range of
crops which are presently produced sub-optimally under irrigation in South Africa.
The objective of this study is to provide an answer to this question with adequate
confidence to allow the rational pursuit of this concept which could have far-reaching
mutual benefit for southern African countries. The countries that were considered are
Mozambique, Zimbabwe, Malawi and Zambia.
2 METHODOLOGY
The assessment was based on a broad (“desk-top”) regional evaluation of soils,
topography and climate, which were, in turn, used to define and demarcate agro-
ecological zones in which a range of crops can be grown commercially under rain-fed
conditions.
The study used two main characterization systems to define the agro-ecological zones,
namely the climate-based Koppen-Geiger Climate System (KGCS) (ref. 16) and the US
Department of Agriculture‟s, Natural Resources Conservation Service - Land
Classification System (LCS) (ref. 9). The estimation of crop production areas within the
agro-ecological zones was then refined by the exclusion of reserve land, areas of high
population (urban and peri-urban environments) and areas of unsuitable topography for
crop production. These exclusions are referred to as the “principal exclusions”.
A provision was then made for secondary exclusions which include areas committed to
alternative land-use such as rangeland and afforestation and scattered areas of
unsuitable soils such as wetlands, riverine areas and eroded areas.
Agro-ecological zones are shown and the area (km2) estimated. Each zone includes crop
types which are grouped into the categories of “Summer rain-fed field crops” (maize,
sorghum, soybean, groundnut, dry-bean and cotton), “Winter rain-fed field crops” (wheat,
barley and dry-pea), “Sub-tropical fruits and nuts” (usually requiring at least
supplementary irrigation) and perennial field crops (sugarcane) which may be grown
under rain-fed or irrigated conditions, but where full irrigation is most common.
The study also addresses key constraints that would have to be addressed in each
country if the sustainable implementation of the concept is to be achieved. Such
constraints include present socio-economic circumstances, land tenure and infrastructure.

Crop Production Potential Final
March 2010 2
3 PRESENT AGRICULTURAL PROFILE IN THE SELECTED COUNTRIES
3.1 MOZAMBIQUE
Mozambican agriculture is characterized by smallholdings. Of the 3.6 million families in
Mozambique, 87% are dependent on agriculture for their livelihoods; 98% of these
families have no formal land titles. The average size of a holding is 1.24 ha and the
predominant farming system is based on the rain-fed production of cereals and tubers.
These smallholdings are farmed using manual labour and hand tools with only minimal
use of chemical inputs, animal traction, farm machinery, and tools that are more
sophisticated. Any inputs that are used are mostly acquired through the informal
economy. This type of farming system imposes physical limits on the area that can be
cultivated and the yields that can be generated; a natural limit is therefore also imposed
on the total quantity of food that can be produced for self-consumption and/or for sale.
Over 80% of the total area of cultivated land is used for the production of staple food
crops; maize and cassava are the staples produced by the overwhelming majority of
holdings, with maize, cassava and cowpeas comprising 60% of the total cultivated land.
Cereals (maize, sorghum, rice and millet) account for 46% of the total area cultivated,
cassava for 17%, beans for 11%, and oilseeds for 9%. Horticulture is produced on only
5% of the land and cash crops (sugar cane, cotton, tea, oilseeds, tobacco) are cultivated
on just 6%. In addition, 40% of all households make use of indigenous plants and herbs
for food and/or medicinal purposes.
The family agriculture system is characterized by a family labour force and low levels of
mechanization. In addition productivity, per hectare, is low. Hence, the potential for
agricultural growth is significant.
The social division of labour in agriculture involves the whole family. There is usually little
use of labour from outside the household. Women are the basis of agricultural production;
they are responsible for land preparation, digging, weeding and harvesting. They help to
transport, store and market surplus production.
As a result of the civil war the main infrastructure has been destroyed and is in the
process of reconstruction. The rural population, therefore, has "limited" access to
markets. Alternative off-farm income sources are, for instance, seasonal labour and, in
declining order, other forms of wage labour, fishing trade, and sale of farm products. One
would expect that the off-farm income is low, but an FAO focus study on rural non-farm
income in developing countries [3] points out the importance of non-rural income, which
accounts for up to 25% of the total farm income.
Commercial agriculture is extremely limited at present, particularly in the context of the
vast agricultural potential of the country. Exceptions include concession areas that have
been made available to expatriate farming initiatives, irrigation projects (particularly in the
south on the Maputo River where rice and vegetables are grown on a semi-commercial
basis - ref. 5, 9, 11, 22 and 24).
Crop Production Potential Final
March 2010 3
3.2 ZAMBIA
Although Zambia has a relatively high urban population, approximately 45% of the total
population (4.6 million people) are poor people in rural areas. Of the 950 000 rural
households, 97% are involved in subsistence crop production. Most of the arable land is
under a traditional/communal tenure system. Cultivation rights (rather than land
ownership) are granted by the chief through the village headman. Small-scale farmers
account for a large share of the maize crop (more than 60% of Zambia‟s cultivated area).
There is a trend of increasing numbers of households in the small-scale subsistence
category while the number of medium- and large-scale farmers has remained unchanged.
Nevertheless Zambia boasts a far higher degree of commercial crop production than
Mozambique and Malawi. Commercial agricultural production has a large export-
orientated component.
Growth in the small-scale agriculture sector could potentially impact on poverty reduction
and national economic growth. This assumption is based on the strong linkages between
agriculture and poor people‟s livelihoods in Zambia, provided that sufficient numbers of
the rural poor are actually able to access the benefits of agricultural commercialisation.
There would appear to be opportunities for small-scale farmers to diversify from maize
into more marketable crops, and this is confirmed by a pattern of declining maize
production. Commercial agricultural production in Zambia is focussed mainly on maize,
soybean, coffee, tobacco, fresh flowers, fresh vegetables, cotton lint and sugar.
Production areas (commercial and subsistence) for 2001 were estimated at 600 000 ha
maize, 165 000 ha cassava, 135 000 ha groundnut, 50 000 ha cotton, 38 000 ha
sorghum, 17 000 ha sugarcane, 13 000 ha soybean and 12 000 ha wheat (ref. 17 and 24).
3.3 MALAWI
Malawian agriculture is also characterized by smallholdings. In 2000 the agricultural
population was estimated to be 11 million people, with 85% of the total population living in
rural areas. Malawi is one of the most densely populated countries in sub-Saharan Africa.
Population density rises from 46 persons/km2 in the northern region to 144/km2 in the
south, with the most populated districts such as the Shire Highlands in the south
containing over 265 persons/km2. July 2006 population was estimated at 13,0 million and
the growth rate 2.38%/annum.
Most of the arable land is under a traditional/communal tenure system. Cultivation rights,
rather than ownership, are granted by the chief through the village headman. By the late
1980s over 56% of households were on holdings of less than 1 ha, and a further 20% on
1.0-1.5 ha. Rain-fed agriculture predominates, dependant on a single rainy season
between November and April. Only 10 000 ha of land is currently irrigated, 5% of the
potential irrigated area, largely on sugar estates. Other irrigated crops include rice and
vegetables.
Maize is the main staple of the Malawian diet, covering 76% of smallholder farmland.
Other food crops include rice, sorghum and millet. Legumes, beans, pigeon pea and
groundnuts are traditionally grown by smallholders.

Crop Production Potential Final
March 2010 4
The area planted to cassava, often intercropped with maize, has increased sharply over
the past 10 years particularly in the densely populated southern areas. Tobacco is the
dominant cash crop, providing 71% of export earning from both the large-scale and small-
scale farming sectors. Other cash crops include cotton, sugar, tea and coffee (ref. 2, 10
and 15).
3.4 ZIMBABWE
The Zimbabwean agricultural industry has, as is well known, undergone massive change
since 2000 as a result of a government decision to confiscate land from “White”
commercial farmers. This policy together with the overall collapse of the Zimbabwean
economy has, over the last ten years, resulted in a dramatic decline in production of both
small-scale and commercial agricultural production in the country. For the purposes of
this study the production “picture” in Zimbabwe in 2000 is outlined as a measure of the
agricultural potential of Zimbabwe. In that year, the farming industry consisted of about
700 000 small scale farmers on nearly 20 million hectares (28 ha average farm size). The
main crops grown were maize (60% of national consumption), cotton (85% of national
production) beans, groundnuts and sorghum.
In 2000 there were about 5 500 large-scale commercial farmers, occupying about 8 million
hectares of land, employing 350 000 workers. The main crops grown included flue cured
tobacco (250 000 t/a), maize (1 000 000 t/a for grain and the livestock industry), sugar
(600 000 t/a), horticultural crops and a wide range of other grain crops.
Rain-fed agriculture predominates, dependant on a single rainy season between
November and April. About 175 000 ha of land was irrigated in 2000 largely on sugar
estates, orchard estates, vegetable farms and tobacco farms. The irrigation potential of
Zimbabwe is estimated at about 350 000 ha in terms of available (developed water
resources and favourably positioned irrigable soils).
4 CLIMATE CLASSIFICATION
4.1 INTRODUCTION
The Koppen Climate Classification system (as amended and improved over time and now
commonly known as the Koppen-Geiger Climate System (KGCS) (ref. 16) is an empirical
system that divides the Earth into a number of climatic zones (six in total) based on the
concept that „native‟ vegetation is the best expression of climate. The system also
considers average annual and monthly temperatures and rainfall - and its seasonality.
Thus vegetation distribution combined with this basic meteorological data defines the
several climatic zones and sub-zones (see Appendix C).
At the „world scale‟ it can be appreciated that anomalies will occur, and that
approximations of zonal boundaries cannot be avoided. The presence of mountains,
proximity to large bodies of water, altitude, movement of air masses, ocean currents etc
strongly influence climate and introduce complexities that result in local differences to
regional zones. However, the KCGS effectively integrates such sub-regional differences

Crop Production Potential Final
March 2010 5
by incorporating the existing vegetation as the primary indicator, with temperature and
rainfall influencing the groupings.
As the detail of a study increases (with mapping scale decreasing), local influences
become more pronounced and other systems, better suited to local and sub-regional
planning, would be more appropriate. Examples would be the Land Type mapping of
South Africa, with soil surveys at 1:50 000 and mapping at 1:250 000 and land capability
mapping for local planning at 1:10 000 to 1:25 000. However, at national and continental
scales and taking cognizance of the extremely limited information and data available on
the target countries, the KGCS is effective and gives satisfactory results.
It should be noted that the KGCS has recently been incorporated into the irrigation and
water planning computer program - SAPWAT (ref. 22).
For this study, where local knowledge has identified areas that could be classified
differently from a standard grouping, a change has been incorporated into the mapping.
An example is the Zambezi Valley (in Zimbabwe) where the „local‟ climate of the valley is
decidedly different from the areas north and south. Other anomalies obviously exist, and
not all have been identified or incorporated.
4.2 ZONE CODING
The KGCS employs a shorthand code of three letters designating climatic groups. There
are six major groups, a sub-group for precipitation characteristics and a sub-group for
temperature characteristics. The sub-groups are introduced particularly to identify
seasonal differences.
Table 1 defines each of the groupings. It should be noted that only major groups A, B and
C are represented in the study area.
Figure 1 shows the spatial distribution of the various groupings found in the study area.
An examination of the table and figure shows that only five Koppen climate groupings
occur in the area, namely Aw, BSh, Bwh, Cfb and Cwa.
In terms of rain-fed cropping, the Zone of principal interest is Zone C. This zone has an
average temperature above 10°C in the warmest months and a coldest month average
between 0°C and 18°C.The sub-groupings are: Cfb (mild humid climate with sufficient rain
in all seasons and a mean monthly temperature of the warmest month below 22°C) and
Cwa (mild humid climate with a dry winter season and a mean monthly temperature of the
warmest month being more than 22°C). Most of the principal annual crops applicable to
this region can be grown under those conditions and these two climatic groupings
together cover most of the study area;
Group A is also relevant from a rain-fed cropping perspective, as it defines a tropical
savannah type climate with constant high temperatures, and where all 12 months of the
year have average temperatures of over 18°C. Sub-group Aw is dominant in the coastal
areas of Mozambique where the average annual rainfall is generally high – exceeding
annual evaporation. However there is a strongly developed (albeit short) dry season with
at least one month having less than 60 mm rainfall.

Crop Production Potential Final
March 2010 6
Table 1 Koppen Geiger Climatic Zones for selected countries
KOPPEN-GEIGER CLIMATIC ZONES - SOUTHERN AFRICA
`
Climatic zones
Group characteristics Ave T
all months
Ave T all
max
T all
min
No. months T ave > 10°C
Area covered by each climatic group per country
Major group Precipitation sub-
group Temperature
sub-group Malawi Mozambique Zambia Zimbabwe
(°C) (°C) (°C) No. (km2) (km
2) (km
2) (km
2)
Aw A Wet-Dry Tropical climate ; Pttn > PET w Dry winters Temp range > 18 12 9 300 441 000 88 262 0
Savanna biome Wet summers >250 mm total 16°C 7% 56% 12% 0%
No cold season All months < 250 mm/month
Bwh B Dry climate
PET > Pttn
Dry climate
Steppe Biome PET >
Pttn
w Dry winters h Hot year round > 18 > 4 0 37,507 0 8,532
Wet summers 0% 5% 0% 3%
BSh B S Semi arid h Hot year round > 18 > 4 6 398 121 000 43 331 127 000
200-750 mm rain > 0 7% 14% 7% 39%
Cfb C Mild, humid climate f Some pptn in all months b
Warm summers < 22 > 0 > 4 5 718 35 861 22 037 131 000
Short dry season 6% 5% 3% 29%
Cwa C Mild, humid climate w Dry winters a Hot summers > 22 > 0 > 4 73 000 137 000 573 000 125 000
Wet summers; 50% Pttn 79% 19% 78% 29%
in warmest 6 months
94 416
772 368
726 630
391 532

Crop Production Potential Final
March 2010 7
Figure 1 Classification of climate in selected countries
Group B, which does not provide sustainable rain-fed cropping conditions, comprises arid
and semi-rid areas where precipitation is less than potential evapotranspiration. Sub-
group BWh occurs in southern Zimbabwe and in the south-western region of
Mozambique. BSh occurs in the south-west of Zambia, western Zimbabwe and southern
and central Mozambique.

Crop Production Potential Final
March 2010 8
5 SOIL AND LAND USE MAPPING
5.1 INTRODUCTION
Relatively detailed soil mapping, at scales of 1:1 million or greater, has been carried out
on an ad hoc basis over most of the study area (some 2 000 000 km2). Some isolated
mapping, particularly as the basis for agricultural development, has been carried out at the
detailed scales of 1:10 000 and up to 1:2 000. However, the pedological systems used in
all four countries have differed considerably. To consolidate these maps would require
significant input from pedologists.
For this specific exercise of determining the cropping potential of the four countries, it was
necessary to adopt a common soil identification approach. Scale is important as the
larger the scale the more soil types appear, and the complexity of analysis dramatically
increases. Too small a scale results in a reduction of usefulness of the maps and data.
During the 1990s, the United States Department of Agriculture (USDA) undertook an
exercise to accumulate soil survey data to produce a world soils map, based on the twelve
principal taxonomic units of the USDA pedological system. The data base incorporated a
variety of soil surveys carried out over time and employing many different classification
systems. The soils of Africa were mapped at a scale of 1:12 million.
The 1:12 million mapping – which covers the four-country study area, was considered to
be the best available map for the detail required for this study. Unfortunately, the USDA
Soil Taxonomy system is not widely used in southern Africa or well understood by
agronomists in this region. Correlation with the South African Soil Taxonomic System is
not straightforward, and no attempt is made in this report to match the systems. The
USDA system has, however, been adapted and expanded from a “Soil Types” to a “Land
Capability” type system or “Agro-Ecological” zoning system. This can then be related to
cropping potential. The expansion of the USDA pedology system has been effectively
carried out by Eswaran et.al. (ref. 9) and this approach has been adopted in this study to
classify the arable potential of the soils in the target countries.
5.2 THE USDA LAND CLASSIFICATION SYSTEM (LCS)
In 1996, under the auspices of the World Soil Resources Survey Division, USDA Natural
Resources Conservation Service, an important publication authored by Eswaran et al,
(ref. 9) related the 1:12 million soils maps to a „Soil Quality‟ maps. This identified soil
areas with similar potentials for sustainable development, and had the effect of converting
the pedology map into a readily understandable Land Capability map.
Eswaran identified five land classes, and whilst accepting that the mapping scale was
relatively small, it was considered that the classes so identified were reasonably accurate
when the results were compared to individual maps of greater detail.
The five classes are: Premium land, High potential land, Medium potential land, Low
potential land and areas which are defined as Unsustainable land. The LSC classes are
described in Table 2, their distribution in the study area is shown in Figure 2 and the
estimated area (ha) of each class in the four countries is given in Table 3.
Crop Production Potential Final
March 2010 9
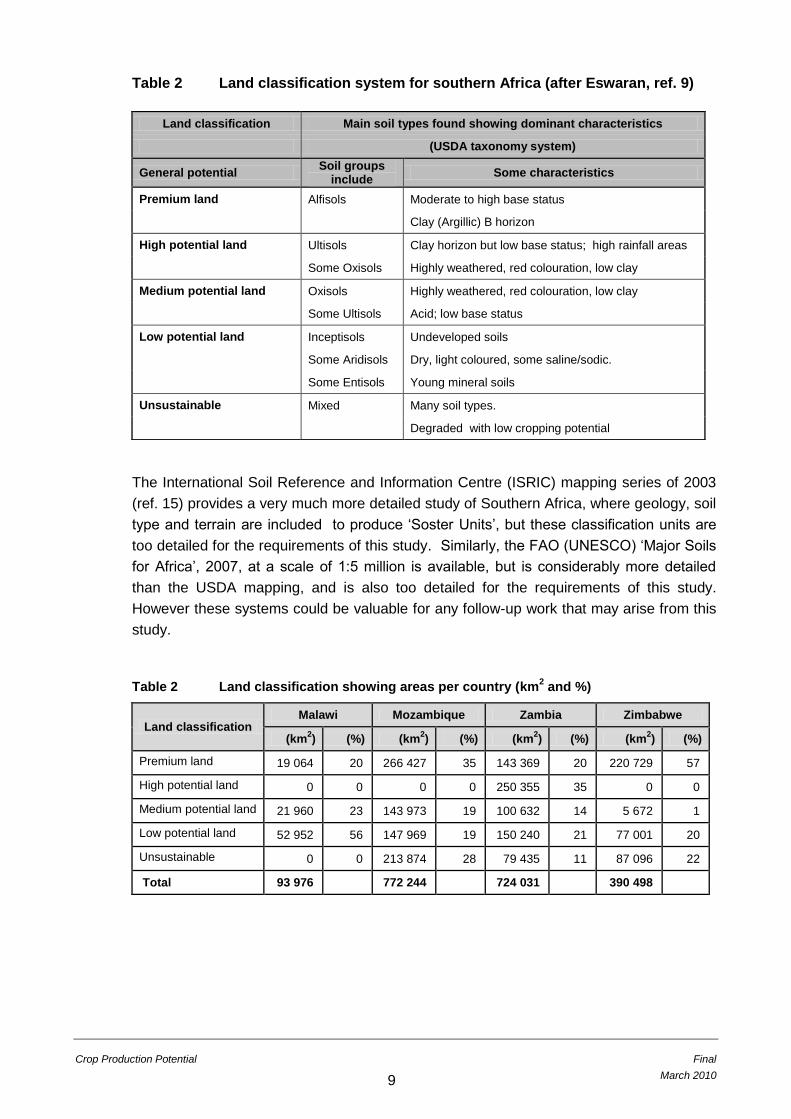
Table 2 Land classification system for southern Africa (after Eswaran, ref. 9)
The International Soil Reference and Information Centre (ISRIC) mapping series of 2003
(ref. 15) provides a very much more detailed study of Southern Africa, where geology, soil
type and terrain are included to produce „Soster Units‟, but these classification units are
too detailed for the requirements of this study. Similarly, the FAO (UNESCO) „Major Soils
for Africa‟, 2007, at a scale of 1:5 million is available, but is considerably more detailed
than the USDA mapping, and is also too detailed for the requirements of this study.
However these systems could be valuable for any follow-up work that may arise from this
study.
Table 2 Land classification showing areas per country (km2 and %)
Land classification Malawi Mozambique Zambia Zimbabwe
(km2) (%) (km
2) (%) (km
2) (%) (km
2) (%)
Premium land 19 064 20 266 427 35 143 369 20 220 729 57
High potential land 0 0 0 0 250 355 35 0 0
Medium potential land 21 960 23 143 973 19 100 632 14 5 672 1
Low potential land 52 952 56 147 969 19 150 240 21 77 001 20
Unsustainable 0 0 213 874 28 79 435 11 87 096 22
Total 93 976 772 244 724 031 390 498
Land classification Main soil types found showing dominant characteristics
(USDA taxonomy system)
General potential Soil groups
include Some characteristics
Premium land Alfisols Moderate to high base status
Clay (Argillic) B horizon
High potential land Ultisols Clay horizon but low base status; high rainfall areas
Some Oxisols Highly weathered, red colouration, low clay
Medium potential land Oxisols Highly weathered, red colouration, low clay
Some Ultisols Acid; low base status
Low potential land Inceptisols Undeveloped soils
Some Aridisols Dry, light coloured, some saline/sodic.
Some Entisols Young mineral soils
Unsustainable Mixed Many soil types.
Degraded with low cropping potential
Crop Production Potential Final
March 2010 10
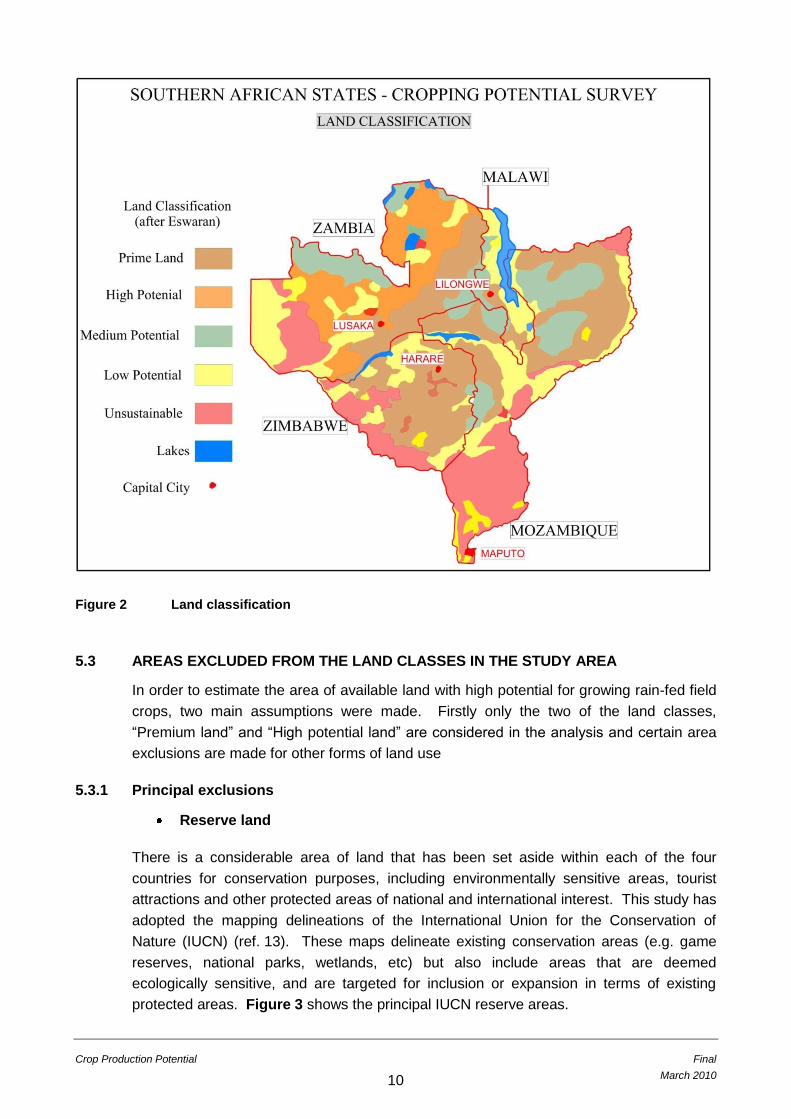
Figure 2 Land classification
5.3 AREAS EXCLUDED FROM THE LAND CLASSES IN THE STUDY AREA
In order to estimate the area of available land with high potential for growing rain-fed field
crops, two main assumptions were made. Firstly only the two of the land classes,
“Premium land” and “High potential land” are considered in the analysis and certain area
exclusions are made for other forms of land use
5.3.1 Principal exclusions
Reserve land
There is a considerable area of land that has been set aside within each of the four
countries for conservation purposes, including environmentally sensitive areas, tourist
attractions and other protected areas of national and international interest. This study has
adopted the mapping delineations of the International Union for the Conservation of
Nature (IUCN) (ref. 13). These maps delineate existing conservation areas (e.g. game
reserves, national parks, wetlands, etc) but also include areas that are deemed
ecologically sensitive, and are targeted for inclusion or expansion in terms of existing
protected areas. Figure 3 shows the principal IUCN reserve areas.
Crop Production Potential Final
March 2010 11
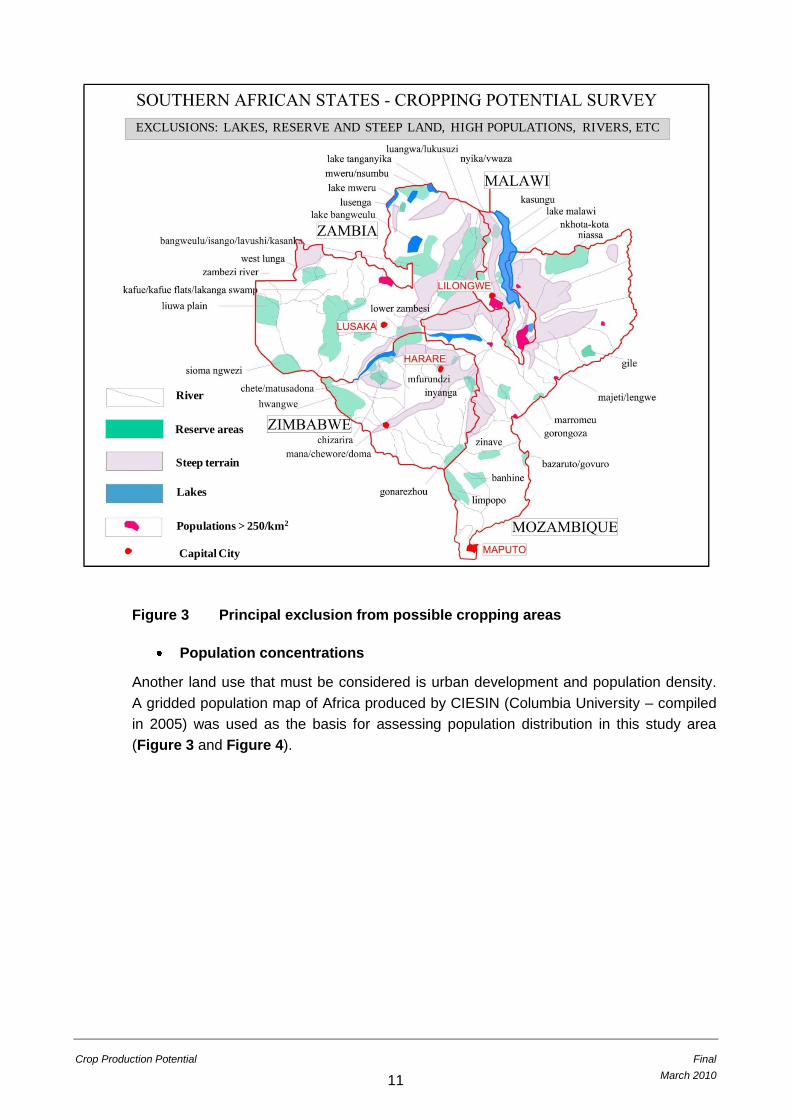
Figure 3 Principal exclusion from possible cropping areas
Population concentrations
Another land use that must be considered is urban development and population density.
A gridded population map of Africa produced by CIESIN (Columbia University – compiled
in 2005) was used as the basis for assessing population distribution in this study area
(Figure 3 and Figure 4).
EXCLUSIONS: LAKES, RESERVE AND STEEP LAND, HIGH POPULATIONS, RIVERS, ETC
Populations > 250/km2
Lakes
Steep terrain
Reserve areas
River
Capital City
Crop Production Potential Final
March 2010 12
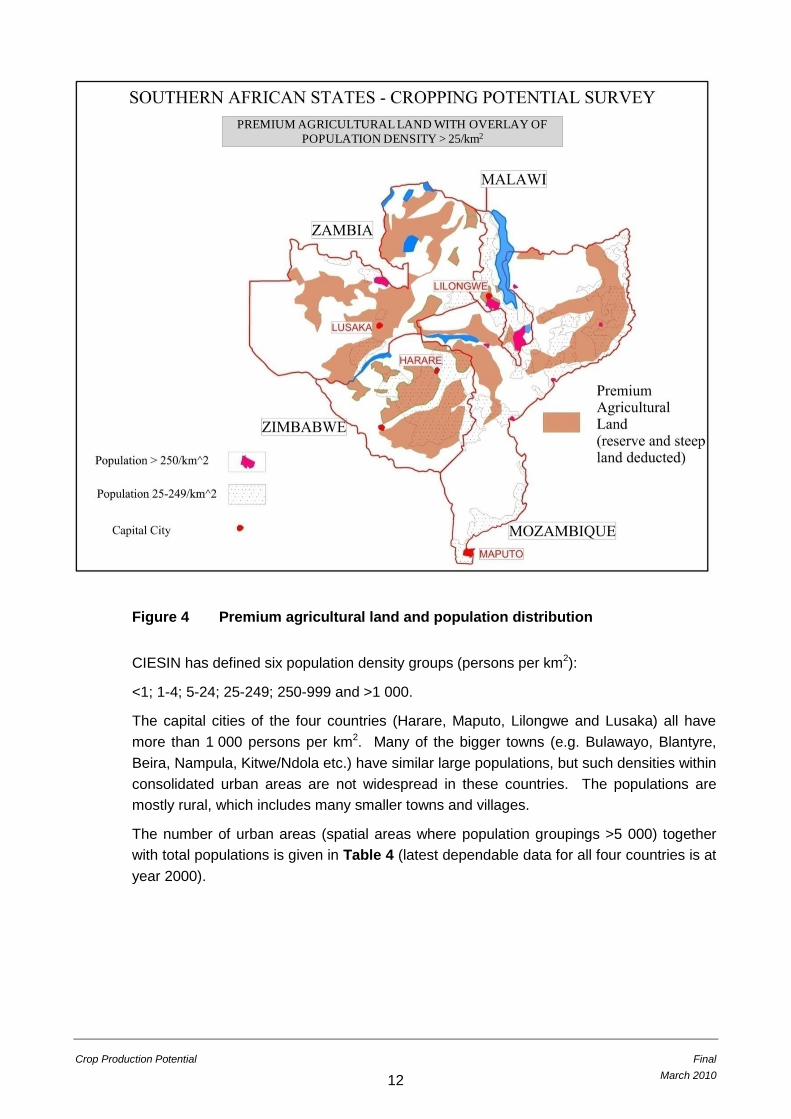
Figure 4 Premium agricultural land and population distribution
CIESIN has defined six population density groups (persons per km2):
<1; 1-4; 5-24; 25-249; 250-999 and >1 000.
The capital cities of the four countries (Harare, Maputo, Lilongwe and Lusaka) all have
more than 1 000 persons per km2. Many of the bigger towns (e.g. Bulawayo, Blantyre,
Beira, Nampula, Kitwe/Ndola etc.) have similar large populations, but such densities within
consolidated urban areas are not widespread in these countries. The populations are
mostly rural, which includes many smaller towns and villages.
The number of urban areas (spatial areas where population groupings >5 000) together
with total populations is given in Table 4 (latest dependable data for all four countries is at
year 2000).
PREMIUM AGRICULTURAL LAND WITH OVERLAY OF
POPULATION DENSITY > 25/km2

Crop Production Potential Final
March 2010 13
Table 4: Population details for four southern African countries
Country Number of urban
areas Population (2000)
Country area
(km2)
Malawi 31 11 308 000 94 958
Mozambique 69 18 292 000 777 123
Zambia 35 10 421 000 745 317
Zimbabwe 23 12 627 000 389 055
The large majority of land in Zambia (>80%) has an average population in the CIESIN
grouping 5-24 people/km2. Zimbabwe has approximately equal areas of 5-24 and 25-249
people/km2. Mozambique has 45% of 5-24 people/km2, 35% 5-24 people/km2 and 20%
25-249 people/km2. Malawi has by far the highest density of people over their area, with
88% 25-249 people/km2, 7% 1-4 people/km2 (in the mountainous areas) and 5% 250-999
people/km2.
It can be seen that a very small percentage of the study area has population densities in
the groupings larger than 249 people/km2.
The CIESIN map shows that in some areas – particularly Malawi (as a whole), the
Zimbabwe highveld and the Mozambique coastal areas are densely populated. Other
areas, including northern and central Zambia and the Mozambique interior, have low
populations.
Whilst population density is important in respect of availability of land for cropping
purposes, it is also important in terms of land tenure, land occupation patterns and labour
availability. In general, small numbers of people would indicate that a relatively large area
is available for cropping. However, at the scale of mapping used for this study, population
distribution (apart from towns and cities) is not considered to have a significant influence
on demarcating agricultural land use, and is only shown as an overlay to indicate
population pressure on the land.
Topography
The soil types and their availability for cropping are strongly influenced by topography.
Land with slopes above 8% is usually excluded from row-crop agriculture. Malawi and
Mozambique are especially penalized in terms of slope. Zambia and Zimbabwe benefit
from their extensive plateau areas and are mainly affected by their escarpments
bracketing major river valleys. Much of the steeper land is forested, either indigenous
(including dense bush) or under plantation. More of this land is expected to be planted to
commercial forests in future.
Allied to topography, but also a factor on its own, is soil depth. In Africa in general, it has
been estimated that more than 50% of the soils are problematic in terms of effective depth
for intensive crop production (Eswaran) (ref. 9).

Crop Production Potential Final
March 2010 14
A soil map at the scale used in this study will not usually be able to discriminate against
steepness of slope in the pedology groupings. A broad delineation of steep and or broken
terrain has therefore been mapped for removal from the high-potential cropping areas.
The identification and delineation of these areas has been sourced from a number of
topographic maps, principal amongst which are the ISRIC depository of Africa maps at
Wageningen in the Netherlands and Wikipedia relief maps (internet).
Crops such as tea, coffee, orchard crops and some food security crops could be grown in
these “excluded” areas, but for commercial-scale growing of grains and other field crops,
these areas would be unsuitable. The areas excluded, based on topography, are shown
in Figure 3.
6 COMBINED SUITABILITY ANALYSIS
6.1 PREMIUM LAND USE POTENTIAL AND POPULATION OVERLAY
Figure 4 shows a combination of the Premium and High potential land-use classes which
have been combined, and for the purposes of this study, have been termed the “Premium
agricultural land-use” class. The “Premium” land-use class, in turn, overlays the
population grouping 25 to 249 persons per km2. This grouping is considered to be
significant in that it indicates some pressure on the land (but not excessive), but also
indicates the availability of labour and probably some usable infrastructure.
6.2 AGRO-ECOLOGICAL ZONES BASED ON “PREMIUM” LAND-USE POTENTIAL,
CLIMATIC ZONES AND PRIMARY EXCLUSIONS
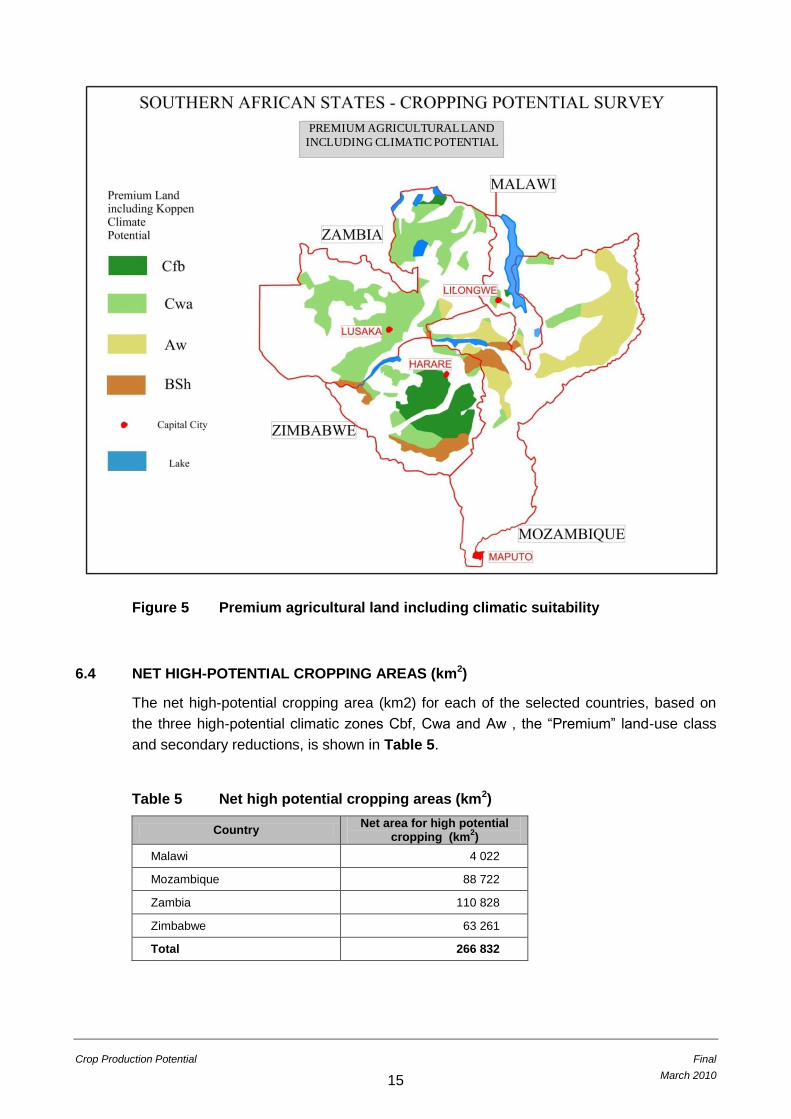
Figure 5 shows the combination of (a) the Premium land-use class, (b) the climatic zones
that are suitable for rain-fed crop production (Cfb, Cwa and Aw optimal and BSh sub-
optimal) and (c) the primary exclusions that are described above. The result is four agro-
ecological zones, three of which are optimal and one sub-optimal for rain-fed crop
production.
6.3 SECONDARY EXCLUSIONS
Secondary exclusions from the high-potential crop production areas are discussed here
because they cannot be incorporated into the above GIS component of the analysis as
they can only be quantified on a percentage-of-land-area basis.
The secondary exclusions contain such items as: small towns, villages and various
infrastructure, heavily populated rural areas, afforestation, scattered areas of broken land
and rocky outcrops, badly eroded (degraded) areas, local wetlands, streams and rivers,
saline and sodic areas, drainage-ways, flood plains, dams, roads and other servitudes,
land established for grazing and rangelands and forests.
For the purposes of this study the secondary exclusions have been estimated at 50% of
the Premium land-use class. This is an arbitrary estimate based on experience and a
wide range of practical evidence in southern Africa.
Crop Production Potential Final
March 2010 15
Figure 5 Premium agricultural land including climatic suitability
6.4 NET HIGH-POTENTIAL CROPPING AREAS (km2)
The net high-potential cropping area (km2) for each of the selected countries, based on
the three high-potential climatic zones Cbf, Cwa and Aw , the “Premium” land-use class
and secondary reductions, is shown in Table 5.
Table 5 Net high potential cropping areas (km2)
Country Net area for high potential
cropping (km2)
Malawi 4 022
Mozambique 88 722
Zambia 110 828
Zimbabwe 63 261
Total 266 832
PREMIUM AGRICULTURAL LAND
INCLUDING CLIMATIC POTENTIAL

Crop Production Potential Final
March 2010 16
The total net area of 266 832 km2 (26,6 million ha) of high-potential cropping area,
constitutes about 13% of the total land area of the four countries. This compares with
about 3,2 million ha (3.0%) for South Africa.
The net area (km2) of high-potential cropping area for each of the main climatic zones is
shown in Table 6. The table includes the area (km2) of high potential before the
secondary exclusions are deducted.
Table 6 Net high potential cropping areas (km2) for each of the high potential
climatic zones
Country
Secondary reduction of
Premium land area (%)
Climatic zones
Total
Aw Cfb Cwa
Malawi
0 3 437 476 4 129 8 042
50 1 719 238 2 065 4 022
Mozambique
0 157 480 0 19 964 177 444
50 78 740 0 9 982 88 722
Zambia
0 3 372 3 723 214 559 221 654
50 1 686 1 862 107 280 110 828
Zimbabwe
0 0 84 982 41 539 126 521
50 0 42 491 20 770 63 261
Total 0 164 289 89 181 280 191 533 661
50 82 145 44 591 140 096 266 832
Expressed in hectares, the countries possess the following areas of high-potential
cropping land:
Zambia 11,1 million ha
Mozambique 8,8 million ha
Zimbabwe 6,3 million ha
Malawi 0,4 million ha
Clearly, the study area has a rich potential for rain-fed crop production and, in the context
of the SADC countries as a whole, provides a highly significant opportunity for agricultural
development in the region and an opportunity to substitute high-potential rain-fed crop
production for expensive and water-inefficient irrigation of annual field crops in South
Africa.

Crop Production Potential Final
March 2010 17
7 CROP SUITABILITY
A range of crops has been considered for their suitability to the climatic zones defined
above. The crops have been grouped into the following broad categories:
(1) Summer annual crops which include maize, soybean, groundnuts, cotton and
sorghum. Of these, maize and groundnuts are the most widely grown under
irrigation in South Africa;
(2) Winter annual crops which include wheat, barley and dry pea. Of these, wheat is
the most widely grown under irrigation in South Africa;
(3) Perennial sub-tropical fruit and nuts and sugarcane. Most of these crops are grown
under irrigation in South Africa
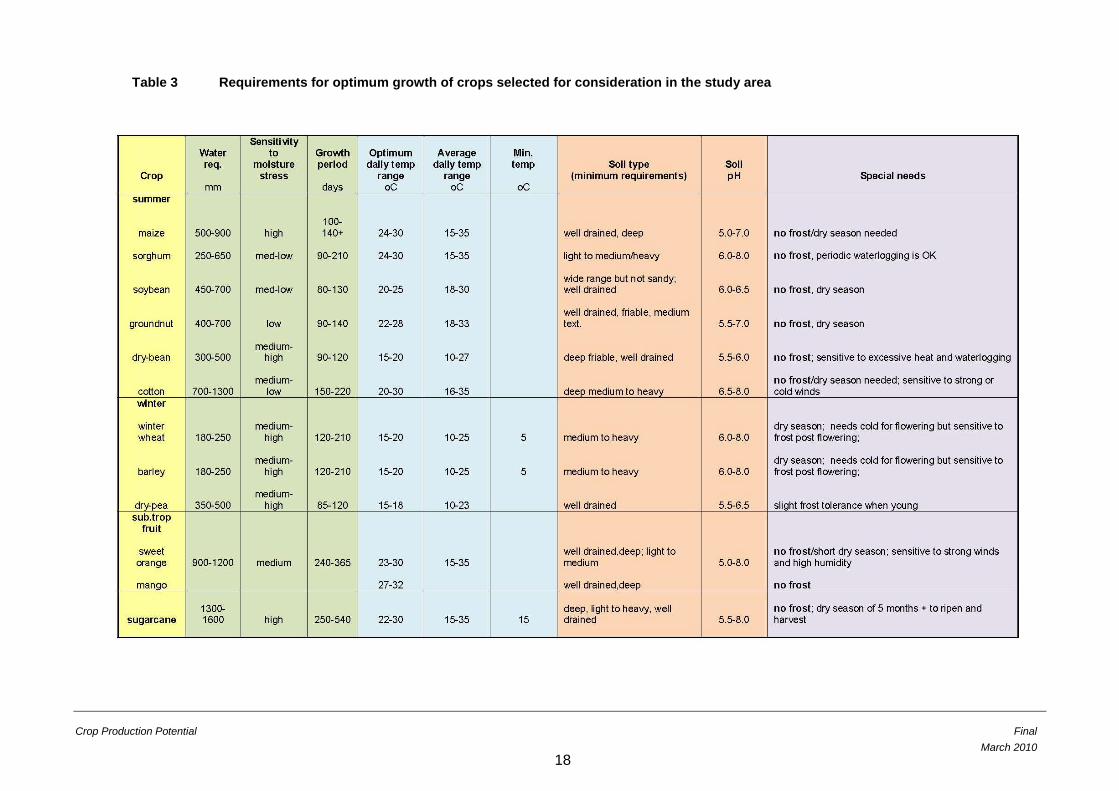
Table 7 lists these crops and describes the climatic and soil conditions that are required
for their optimum production. A suitability matrix between crops, climate and soil is
derived from the data contained in this table.
Table 8 shows the adaptability of these crops to the selected high-potential climatic
zones. Adaptability is described in terms of four categories; “Suitable”, “Marginal”, “Not
Suited” and “Suitable under Irrigation” It should be noted that all crops would probably
benefit from supplementary irrigation, especially where rain is concentrated in a limited
number of months. However, rain-fed agriculture is commonly practiced in the Cwa and
Cfb areas, as the rain mostly is derived from the Inter-Tropical Convergence Zone
influence which (with the obvious exception of drought years) is a relatively reliable rain
bearing system.
However, in respect of cotton and sugarcane, excellent growing areas do exist but
irrigation is essential – not the least because they have a long growing period and are
„inter-seasonal‟.
Table 9 lists those crops that are well adapted to the high-potential climatic zones of each
country and quantifies the area available on high-potential soils for their production. The
crops considered in the table are summer annual crops, winter annual crops and
sugarcane.
It should be noted that winter cropping is made viable in the “suitable‟ areas through
specialized cropping practices as the area is dominated by long dry periods and/or where
temperatures may not be low enough for flowering or frosts may occur after flowering. For
example, early planting of short season wheat and barley varieties is practiced where soil
moisture levels from the previous rainy season are high enough.
Crop Production Potential Final
March 2010
18
Table 3 Requirements for optimum growth of crops selected for consideration in the study area

Crop Production Potential Final
March 2010
19
Table 8 Crop adaptability to the high-potential climate zones of the study area
Koppen
Geiger
climate
groups
Annual crops Perennial crops
Summer Winter Sub-tropical fruit Plantation
maize sorghum soybean groundnut dry-bean cotton wheat barley dry-pea orange mango sugarcane
Cwa suitable suitable suitable suitable suitable not suited not suited not suited not suited suit.+ irrig. not suited marginal
Cfb suitable suitable suitable suitable suitable not suited suitable suitable suitable suitable not suited not suited
Aw suitable suitable marginal marginal marginal marginal not suited not suited not suited not suited suitable suit.+ irrig.
BSh not suited marginal not suited not suited not suited suit.+ irrig. suit.+ irrig. suit.+ irrig. suit.+ irrig. not suited suit.+ irrig. suit.+ irrig.
Bwh not suited marginal not suited not suited not suited suit.+ irrig. not suited not suited not suited not suited suit.+ irrig. suit.+ irrig.
suitable grown as an 'out of season' crop in Spring or Autumn

Crop Production Potential Final
March 2010 20
Table 9 The adaptability and area (km2) of summer annual crops winter annual
crops and sugarcane in the high-potential climatic zones in each of the
countries in the study area
Country
Cwa Cfb Aw BSh
Total (km2)
(km2) / suitable crops
Malawi 2 065 238 1 719 474 4 496
maize maize maize Cotton
sorghum sorghum sorghum Wheat
soybean soybean sugarcane Barley
groundnut groundnut dry-pea
dry-bean dry-bean Sugarcane
wheat
barley
dry pea
Mozambique 9 982 0 78 740 6 546 95 268
maize maize Cotton
sorghum sorghum Wheat
soybean sugarcane Barley
groundnut dry-pea
dry-bean Sugarcane
Zambia 107 280 1 862 1 686 2 735 113 563
maize maize maize Cotton
sorghum sorghum sorghum Wheat
soybean soybean sugarcane Barley
groundnut groundnut dry-pea
dry-bean dry-bean Sugarcane
wheat
barley
dry pea
Zimbabwe 20 770 42 491 0 13 539 76 800
maize maize Cotton
sorghum sorghum Wheat
soybean soybean Barley
groundnut groundnut dry-pea
dry-bean dry-bean Sugarcane
wheat
barley
dry-pea
Total 140 097 44 591 82 145 23 294 290 127
Notes: requires significant irrigation
summer crop
winter crop
Crop Production Potential Final
March 2010 21
8 CONSTRAINTS TO THE DEVELOPMENT OF THE EXTENSIVE RAIN-FED
CROPPING POTENTIAL
The socio-economic constraints to the development of the extensive rain-fed cropping
potential that exists in the selected neighbouring countries, though not insurmountable,
should not be underestimated. Of particular importance is:
The communal land tenure system that exists throughout the study area and the
wide-spread population sprawl that mitigates against large-scale commercial crop
production. This can to some extent be overcome through joint-venture
arrangements between local communities and commercial operators or land
leasing from the government/communities (particularly in low-population areas)
The poor infrastructure (or lack of infrastructure in some areas) with respect to
roads, power supply, storage facilities and agricultural support infrastructure and
services such as input supplies, transport, operating credit facilities, mechanical
equipment maintenance etc, places a special challenge on any commercial
agricultural development initiative. However, South African farmers operating in
countries like Mozambique and Zambia, with full government backing, have
shown that these constraint can be overcome, but at a substantial cost.
The lack of a supportive political environment in Zimbabwe does, for the
foreseeable future, place a serious constraint on commercial investment of any
meaningful scale. The lack of any security of land tenure implies no financial
backing from banks for infrastructure development and production loans which
effectively stifles commercial agricultural development. However, the situation in
Mozambique and Zambia is far more positive with many examples of agricultural
commercialisation emerging.
9 IRRIGATION
Whilst the principal objective of this study is to identify areas that are suited to rain-fed
crop production, the existence of a considerable network of largely „un-tapped‟ surface
water resources (streams and rivers), especially in Zambia and Mozambique must, be
noted.
Table 10 indicates the low level of exploitation of water resources for irrigation in the four
study countries. Figures are for 2004 (ref. 8).
There is clearly an opportunity for expanded utilisation of the water resources in these
countries for irrigation where there is a higher irrigation potential, in terms of both soils and
climate, than exists for many of the irrigated areas of South Africa.

Crop Production Potential Final
March 2010 22
Table 10: Irrigated land and water consumption
Country Irrigated land
(2004) as a % of cultivated land
Annual water consumption as a %
of total water resources
Estimated irrigation demand
(million m3/annum)
Malawi 1.7 2.0 1 820
Mozambique 4.0 1.0 3 000
Zambia 0.9 1.0 1 580
Zimbabwe 7.0 5.0 4 980
10 CONCLUSIONS
The key conclusions drawn from this study are summarised as follows:
The four countries possess about 26,6 million ha of high-potential cropping land:
o Zambia 11,1 million ha
o Mozambique 8,8 million ha
o Zimbabwe 6,3 million ha
o Malawi 0,4 million ha
The rain-fed crop production potential includes a wide range of summer field
crops such as maize soybean, dry bean, groundnuts and sorghum which are
adapted to parts of all four of the target countries and winter rain-fed field crops
such as wheat, barley and dry pea which can be grown extensively in all the
countries except Mozambique.
The study area therefore displays a rich potential for rain-fed crop production
and, in the context of the SADC countries as a whole, provides a highly
significant opportunity for agricultural development in the region and an
opportunity to substitute high-potential rain-fed crop production for expensive and
water-inefficient irrigation of annual field crops in South Africa.
The four countries experience a number of major socio-economic constraints to
the exploitation of this excellent potential. The constraints include land tenure
issues (the majority of the high potential rain-fed cropping area is occupied by
subsistence farmers on communally owned land), population (the high rural
population spread presents a challenge to commercialisation of agriculture),
present land use (widespread subsistence farming), poor or lacking infrastructure
and poor agricultural support services., However the constraints are not
considered insurmountable. With the appropriate vision, investment and support
from the governments of the respective countries there are significant
opportunities for extensive commercial agricultural development which could
involve and benefit local farmers and their communities. The recent examples of
South African farmers operating successfully in Mozambique and Zambia, with
full government backing, have shown that these constraints can be overcome.

Crop Production Potential Final
March 2010 23
Whilst the principal objective of this study is to identify areas that are suited to
rain-fed crop production, the existence of a considerable network of largely „un-
tapped‟ surface water resources, especially in Zambia and Mozambique, is
highlighted. There is therefore an opportunity for expanded utilisation of the
water resources in these countries for irrigation where there is a higher irrigation
potential, in terms of both soils and climate, than exists for many of the irrigated
areas of South Africa.
APPENDIX A
Notes on Mapping
Notes on mapping
The maps used in this report are derived from maps published by:
Melbourne University (Koppen Geiger Map Of Africa)
USDA (Hari Eswaran report of 1996 showing soils and land quality maps)
CIESIN, Columbia University (Africa: Population Density, 2000)
The maps were all published on A4 sized paper, and were subsequently copied and adjusted to
show the Southern Africa Region in more detail. The polygons on the maps were abstracted
and re-drawn in CAD. The scale of the original maps was in the order of 1:35 000 000. It must
be noted, therefore, that the maps published in this document will have lost some accuracy in
the abstraction process. The maps shown in this report are approximately 1:12 500 000,
approximately three times larger than the original mapping.

APPENDIX B
Eswaran‟s definitions of Land Quality
Premium land
Within the study area, this land type mainly comprises Alfisols with some Ultisols – which are
not as fertile as the Alfisols as they are more weathered and acidic. Alfisols comprise relatively
young, deep, permeable soils (generally without impermeable horizons) with loamy to clayey
textures and good tilth characteristics. They usually have an adequate supply of nutrients.
Lands are mostly level to gently undulating. Water holding capacity is more than 150 mm/m.
Cropping performance is generally good, and they respond well to good management. They
have high resilience to degradation and can readily be brought back to previous productivity
levels.
High potential land
Mostly Oxisol soils of low activity, highly weathered, crumbly and eluviated, having no argillic
(clay rich) horizon. They have distinctly red-coloured subsurface horizon. Also intermixed with
Ultisols, which have an argillic horizon, but with low base saturation, often very acidic. These
soil types have some minor limitations. These may include, for example, root restricting
horizons (often laterite) and sandy or gravelly layers.
They have the potential to be highly productive with proper management – but where this is
sub-optimal and inputs are limited, they can be severely stressed. Their resilience is less than
the Prime Lands, and so can be permanently damaged with mismanagement
Medium and Low potential lands
These lands have major constraints for low-input agriculture. There are high risks for resource-
poor farmers, and the probability of crop failure is high. Soil limitations include some of the
following – low organic matter, impermeable layers, surface crusting, acidity or salinity, low
water holding capacity, shallow depths. The phosphate fixing characteristics of the more acid
soils can be severe. They often have high water and wind erosion risks. Soil types include
Aridisols (dry soils, with light coloured surface horizons that may be saline or sodic), Inceptisols
(young soils of low fertility), Entisols (light soils having minimal profile development, often
shallow and with low clay content and low water-holding capacity) and vertisols. The latter are
included due to the difficulties of their management (heavy, black swelling clays)
Unsustainable
These lands are considered very fragile in terms of agricultural development and are easily
degraded. They are not productive and do not respond well to management. They require very
high investments in order to make them productive (eg intensive drip irrigation, wind breaks etc).
They include some saline, sodic and waterlogged areas. Soils included are aridisols, entisols
inceptisols, vertisols and Oxisols – but all have been „downgraded‟ by severe climatic or erosive
influences.

APPENDIX C
Climate Information

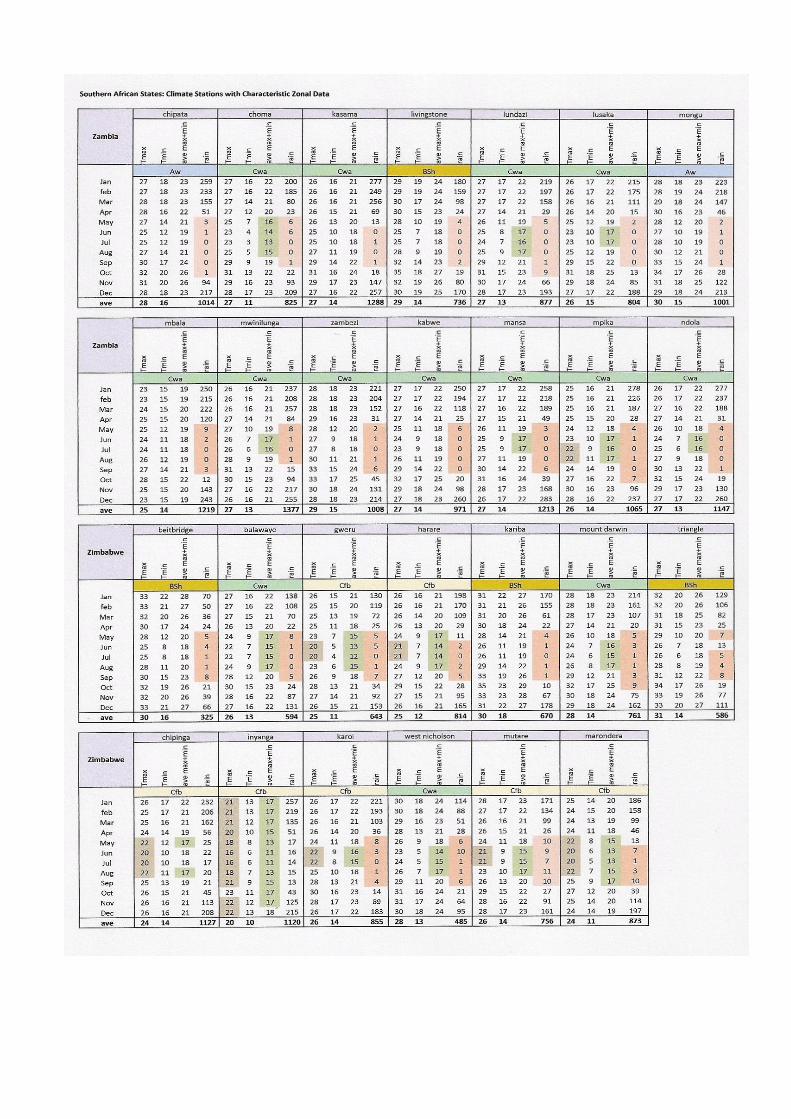
Meteorological data
Temperature and rainfall data from a number of weather stations within the study area was
compiled (see table on next page) by way of a further check on the validity of the Koppen-
Geiger system and to indicate the rainfall quantities available during the planting season.
These stations were chosen to represent, where possible, the several climatic zones in the
area. The coverage is not comprehensive, however, as the stations with reliable long term data
are limited. The choice of station was also made in an effort to achieve a spatially widespread
network. The figure below shows the Koppen-Geiger climate zones together with the spread of
meteorological stations. The majority of zones comply with the parameters set by the system‟s
guidelines.
Meterological stations showing Characteristic zonal data
Climate Variability
Climate variability concerns seasonal and annual variations in temperature and rainfall patterns
within and between regions. Many factors come into play; important in this region are the wind
circulation systems, seasonal pressure systems, the ITCZ and the strength and timing of its
southward progression, sea temperatures – and especially the cyclical El Niño Southern
Oscillation (ENSO) phenomenon.
Droughts and flooding, especially of major river flood plains, are common; southern Africa is
characterized by considerable climatic variation, both spatially and temporally and this affects
both low and high rainfall areas, more especially the latter.
This can be seen to add a degree of uncertainty to „dry-land‟ farming. However, farming
practice throughout the world accepts weather-related risk as normal.
The figure below gives an indication of the long-term variability of rainfall in the study area (data
records from over 80 years). The wide variation will have affected the natural vegetation and so
influenced the Koppen approach to climatic zoning. However, this relatively short timescale (in
comparison to global changes) may well not represent an equilibrium state.
The agro-ecological zones – which include the effects of other factors such as temperature
fluctuations, soils etc, are an integration of these influences and crop suitability, for any
particular area - are influenced by a combination of these limitations.
Most of the summer annual crops of commercial importance require between 500-700 mm of
moisture; winter crops about half this amount. Considering the long-term average rainfall
figures, it can be seen that most of the study area receives more than 600 mm, which can be
considered a positive indicator for expanded commercial cropping. However, the temporal
distribution of this rain has not been assessed. This may be problematical in some areas –
particularly in regard to the affect of moisture stress on crop sensitive growth periods.


APPENDIX D
References
1. AGRHYMET Network, (2001). Information Center, FAO Rome. http://www.agrhymet .
2. Agriculture and Food – Country profile – Malawi. World resource Institute website.
3. Aquastat – FAO Information System on Water and Agriculture,
www.fao.org/nr/water/aquastat/dbases.
4. Archive of Soil Maps (EuDASM) - Soil Maps of Africa. EUR 21657 EN, 386 pp.
5. Bowen, Merle L. 2000. The State Against Peasantry. Rural Struggles in Colonial and
Postcolonial Mozambique. Charlottesville, VA: University Press of Virginia.
6. Bot AJ, Nachtergaele FO and Young A, (2000). Land Resource Potential and
Constraints at Regional and Country Levels. FAO 90, Rome.
7. Brady N and Weil RR, (1999). The Nature and Property of soils. Twelfth Edition,
Prentice Hall International.
8. Chenje M and Johnson P (edit.). (1996). Water in Southern Africa (Report by SADC,
IUCN and SARDC), ISBN 0-7974-1672-2
9. Eswaran H et al, (1996). An Assessment of the Soil Resources of Africa in Relation to
Productivity, USDA Natural Resources Conservation Service, Washington DC.
10. FAO, 2005/2006. Database – Malawi (website http://apps.fao.org/)
11. FAO/UNESCO Soil Map of the World for Africa; Grid Version, UNEP/Grid-Geneva.
12. FitzPatrick EA, (1983). Soils, Their Formation, Classification and Distribution, Longmans
Group Ltd. ISBN 0-582-30116-5
13. Green MJB and Paine J, (1997). State of the worlds protected areas at the end of the
twentieth century, IUCN Commission on Protected Areas Symposium, Albany, Australia.
14. ISRIC depository of Africa maps at Wageningen in the Netherlands and Wikipedia relief
maps (internet).
15. National Statistical Office, 2000. GoM, Lilongwe, Malawi
16. Peel, MC et al, (2007), Updated World Map of the Koppen-Geiger Climate Classification.
Hydrology and Earth System Sciences, 11. 1633-1644, Copernicus Publications.
17. SEEPA, 2006. Climate change and African agriculture- Zambia. Policy note No.39.
18. Selvaradjou SK, Montanarella L, Spaargaren O and Dent D, (2005). European Digital
19. Smith M, Climwat for Cropwat, (1993). FAO Irrigation and Drainage Paper 49, FAO
Rome.
20. The World Bank. 2000. World Development Report 2000/2001. Attacking Poverty.
New York, N.Y.: Oxford University Press. The complete report is available on-line:
http://worldbank.org/poverty/wdrpoverty/report/
21. UN System in Mozambique. 2000. Mozambique: District Development Profiles.
http://www.unsystmmoz.org/
22. Van Heerden PS, Crosby CT et al, (2009). Integrating and upgrading of Sapwat and
Planwat, Water Research Commission report no TT391/08.
23. Westerink RM, 1995. Potential rainfed crop production and land suitability for
Mozambique. Nota tecnica No. 7. Do Instituto Nacional de Investigacao Agronomica.
24. Zulu, B. et.al. 2007. Smallholder household maize production and marketing behavior
in Zambia and its influence on policy. Department of agricultural Economics, Michigan
State University. http://www.aec.msu.edu/fs2/zambia/wp_22.pdf
Recommended