An Empirical Investigation of the Characteristics of Firms Adopting
Enterprise Risk Management
Donald Pagach
Professor of Accounting
Richard Warr* Associate Professor of Finance
August 2007
College of Management North Carolina State University
Box 7229 Raleigh, NC 27695-7229
The authors gratefully acknowledge support from the Enterprise Risk Management Initiative at North Carolina State University. * Contact author: 919 513 4646, [email protected]

An Empirical Investigation of the Characteristics of Firms Adopting
Enterprise Risk Management
Abstract
We use a hazard model to examine the factors that influence firm level adoption
of enterprise risk management (ERM). We find that firms that are more levered, have
more volatile earnings and have exhibited poorer stock market performance are more
likely to initiate an ERM program. When the value of the CEO’s option and stock
portfolio is increasing in stock volatility, the firm is also more likely to adopt ERM. Our
results suggest that ERM is being used for reasons beyond basic risk management. These
other reasons include offsetting CEO risk taking incentives and seeking improved
operating performance.
JEL Classification Codes: G32.
Key Words: Enterprise Risk Management, Chief Risk Officer, Hazard Model
1
1 Introduction
The growing implementation of Enterprise Risk Management (ERM) programs is
receiving increasing attention in the literature. In most cases research has focused on the
process of ERM and it potential gains. For example, Nocco and Stulz (2006) argue that
the pure efficient capital market view that a firm should not expend resources on
managing idiosyncratic risk is not reasonable in a world with market frictions. They
argue that an integrated, holistic, approach to risk management can create shareholder
value. These authors are not the first to argue for managing risk at the enterprise level,
and to date there have been numerous papers that discuss the broad concept of Enterprise
Risk Management (see for example Beasley et. al., 2005). There has, however, been a
lack of empirical studies examining the types of firms that actually implement ERM.
In this paper we examine factors that have been hypothesized to be drivers of
ERM implementation. Our goal is to shed light on whether firms are engaging in ERM
with the goal of value maximization or whether other incentives are driving the
implementation decision. Our work is related to Liebenberg and Hoyt (2003) who use a
logistic model to examine the particular characteristics of firms adopting ERM.1
Liebenberg and Hoyt find that size and leverage are both related to the decision to
implement ERM, however, many of the other factors in their regression model are
insignificant. Their insignificant results is likely due to a small sample (n=26), and the
logistic model used. In this application, a logistic model is not necessarily the best way
to test a one-time event that can be made through time. We improve upon the method of
1 In another related study, Beasley, Pagach and Warr (2007) examine the impact of ERM implementation on short-term stock returns and find that firm specific characteristics are important determinants of the stock market reaction to ERM adoption.

2
Liebenberg and Hoyt (2003) in three ways. First we use a larger sample of ERM
adopters. Second, we measure a wider range of variables, including the stock and option
holdings of managers. And third, we use a Cox proportional hazard model to measure
the importance of the variables in the regression analysis. The hazard model allows us to
examine a large sample of companies, of which only a proportion choose to adopt ERM,
and generates more reliable standard errors than a logit model.
The existing risk management literature suggests a range of factors that might
influence the decision to employ risk management. However as ERM is a broader
process and one that is less well defined than traditional hedging, it is not clear whether
that these factors will also influence ERM adoption. For example, one could argue that
ERM is adopted by poorly performing firms that are seeking to window dress their
management strategy, or by firms that are implementing ERM to be consistent with
industry standards or competitors. In such cases, one would expect many of the factors
found to impact derivative hedging to be insignificant for ERM adopters.
The factors that we examine cover a broad range of variables that measure
financial, asset, market and managerial characteristics. Financial characteristics
represent indirect measures of the likelihood of financial distress. Firms that face greater
risk of financial distress and the implicit and explicit costs contained therein may benefit
from ERM when ERM reduces the chance of costly lower tail earnings and cash flow
outcomes. Asset characteristics measure the potential costs of financial distress. For
example, firms with growth options will benefit from ERM if it reduces the probability
that they may be unable to pursue potentially profitable future projects because financial
distress reduces liquidity. Market characteristics measure the potential costs associated
3
with volatile security performance. Firms will benefit from ERM if it reduces the
volatility of stock returns which in turn reduces the firm’s cost of capital. Finally
managerial characteristics measure the degree to which the CEO’s stock and option based
compensation encourages risk taking or risk avoiding behavior. Firms whose CEOs have
high levels of option based compensation will benefit from ERM if it reduces manager’s
incentives to take on excessively risky projects.
As a preview of our results we find that firms that have greater risk of financial
distress, i.e. those with more leverage, less financial slack and more volatile earnings and
stock prices are more likely to adopt ERM, as proxied by hiring a Chief Risk Officer
(CRO). We find that firms with more opaque assets and more growth options are less
likely to hire a CRO, a result that is counter to a risk management hypothesis, but may
reflect a preoccupation with ERM in firms that have lower quality growth options and are
trying to create value by focusing more attention on business opportunities currently in
place, and believing that ERM will boost the bottom line (a commonly touted claim by
ERM proponents). This conjecture is supported by our finding that firms that have seen
recent poor stock price performance are more likely to hire CROs. These firms may
believe that ERM will help avoid future poor performance.
Finally, we find that firms with CEOs that have incentives to take risk, based on
option compensation, are also more likely to hire a CRO. This result appears
counterintuitive, but is consistent with boards making the CRO appointment to provide a
control against the CEO’s risk taking incentives.

4
Our paper proceeds as follows; Section 2 presents a literature review and develops
our hypothesis. Section 3 presents the data. Section 4 presents the univariate results and
Section 5 presents the multivariate hazard model results. Section 6 concludes.
2 Literature Review and hypothesis development
Risk management has evolved from a narrow, insurance based view to a holistic;
all risk encompassing view, commonly termed Enterprise Risk Management (ERM).2
The benefits and costs of ERM are subject to debate,3 although recent work by Nocco and
Stultz (2006) argues that ERM is beneficial to most firms because it allows them to
manage risks in a manner that avoids costly left tale outcomes. 4 These authors argue that
the frictionless capital market view that any expense incurred to reduce idiosyncratic risk
must be a negative NPV project is inconsistent with a world in which numerous market
frictions and imperfections exist. Stulz (1996, 2003) and Nocco and Stultz (2006) then
present arguments under which risk management activities could be value increasing for
shareholders when agency costs and market imperfections interfere with the operation of
perfect capital markets.
ERM can be value creating if at the most basic level, the goal of ERM is to reduce
the probability of large negative cash flows through the coordination of offsetting risks
across the enterprise and to ensure that no single project risk will have an adverse effect
on the overall firm. ERM will have its greatest effect on earnings by reducing their
2 See Tufano, (1996); Liebenberg and Hoyt, (2003); Beasley et. al. (2005); and Slywotzky and Dzik (2005) for discussions of the development and adoption of ERM. 3 Beasley, Pagach and Warr (2007) find no significant stock price reaction (positive or negative) to ERM adoption. 4 Lin, Pantzalis and Park (2007) find that corporate use of derivates reduces asymmetric information

5
variability through controls on the risk of cost centers and revenue sources. In reality, it
is downside risk that the firm most seeks to avoid, and a goal of ERM is to reduce the
likelihood that multiple negative events will occur simultaneously. Stulz (1996, 2003)
recognizes this issue and argues that any potential value creation role for risk
management is in the reduction or elimination of “costly lower-tail outcomes.” He
defines lower tail outcomes as the negative consequences that result from severe declines
in cash flows. Thus, a risk management program that reduces the likelihood of lower tail
outcomes could have a positive net present value. But, as Stulz (1996, 2003) points out,
it is only firms that face these lower tail outcomes that will benefit from ERM, while
other firms will see no benefit and could destroy value by spending corporate resources
on risk management.
Lower tail outcomes have direct and indirect costs. For example, events such as
bankruptcy and financial distress involve direct outlays to creditors, lawyers and courts.
Indirect costs include the inability to pursue profitable growth options, the loss of
customer confidence, and the inability to realize the full value of intangible assets upon
liquidation. A decline in debt ratings and the resulting increase in borrowing costs can
also be costly for shareholders.
Managers who own stock in their company will have an undiversified equity
portfolio and will bear a greater proportion of the cost of a lower tail event than a fully
diversified shareholder. In an efficient labor market, these managers will demand higher
compensation for bearing this idiosyncratic risk. Other stakeholders, such as suppliers,
may be reluctant to enter into long term contracts with the firm if the potential for future
payment is uncertain. All of these problems can result from the possibility of costly
6
lower tail outcomes and represent value creating opportunities for a risk management
program that can minimize such outcomes.
In this study we aim to conduct a wide ranging examination of the determinants of
implementing an ERM program as proxied by Chief Risk Officer hiring. Because
corporations disclose only minimal details of their risk management programs (Tufano,
1996), our focus on hiring announcements of senior risk officers measure the
characteristics of firm’s signaling an enterprise risk management process. There are good
reasons to believe that CRO hiring coincides with the decision to follow an ERM
program. For example, The Economist Intelligence Unit, (2005) reports that many
organizations appoint a member of the senior executive team, often referred to as the
chief risk officer or CRO, to oversee the enterprise’s risk management process. Walker,
et. al. (2002) notes that because of its scope and impact, ERM requires strong support
from senior management. Beasley et al. (2005) show that the presence of a CRO is
associated with a greater stage of ERM adoption.
Our study examines firm-specific variables that reflect the likelihood and cost of a
firm experiencing a lower-tailed event either through increasing the chance of financial
distress or increasing the costs associated with such distress. We also attempt to shed
light on the impact of managerial incentives on ERM implementation.
The variables we examine are grouped in to four broad categories. The first;
financial characteristics, represent indirect measures of the likelihood of financial
distress. Firms that face greater risk of financial distress and the implicit and explicit
costs contained therein may benefit from ERM. These variables include leverage,
financial slack (measured as cash as a percentage of assets) and earnings volatility. We

7
hypothesize that firms with more leverage and less financial slack will be more likely to
implement ERM. Firms with greater earnings volatility are more likely to experience
lower tail earnings outcomes.
The second category measures asset characteristics and proxies for the potential
costs of financial distress - for example the inability to pursue risky but profitable future
projects. These variables include, asset opacity, Research and Development intensity and
growth options. We hypothesize that firms with more opaque assets, greater R&D
expense and more growth options are more likely to benefit from ERM.
The third category measures market performance and the volatility of the firm’s
stock returns. We hypothesize that firms with more volatile stock prices are more likely
to benefit from ERM. Furthermore, firms that have seen poor stock performance in
recent periods may implement ERM as a means to convince investors that they are
addressing operational issues in order to avoid future poor performance.
The final category measures managerial incentives to protect their own
undiversified investment portfolios, or the degree to which their incentives are aligned
with those of investors. We compute the partial derivatives of the CEO’s stock and
option holdings with respect to the stock volatility and the stock price (as in Rogers,
2002). The ratio of these measures captures the risk taking incentives of the CEO. We
hypothesize that those CEOs who have compensation portfolios that are more sensitive to
volatility (such as close to the money options) will avoid ERM and programs that might
try to reduce risk.
Our remaining variables control for industry membership, operating segments and
institutional ownership.

8
3 Data
Our study starts with 138 announcements of senior risk officer appointments
made from 1992-2004 for which we are able to obtain all the necessary data for our tests.
Announcements are obtained by searching the business library of LEXIS-NEXIS for
announcements containing the words “announced”, “named”, or “appointed”, in
conjunction with position descriptions of “chief risk officer” or “risk management”.
Only announcements for publicly traded companies were retained and in the case of
multiple announcements for the same company we selected only the first announcement
on the assumption that this represented the initiation of the risk management program.
By starting our search in 1992, we hope to capture the first appointment of a Chief
Risk Officer; however, it is possible that some appointments, although being the first
announcements, are not actually the first appointments. These announcements will add
noise to our sample and reduce the power of our tests.
We collect data for all firms listed in Compustat from 1992 to 2004. We
supplement the data with stock price data from CRSP and 13-F ownership data. In a
subset of tests we include a variable to measure the sensitivity of the CEO’s
compensation to the volatility of the stock price. The data for these variables comes from
ExecuComp, but is only available for the S&P 1500 firms, and reduces the number of
CRO hire firms in our sub sample to 69. The full data set is an unbalanced panel in
which CRO hirings are indicated by a dummy variable that takes the value 1 in the year
that they are made, and zero otherwise.
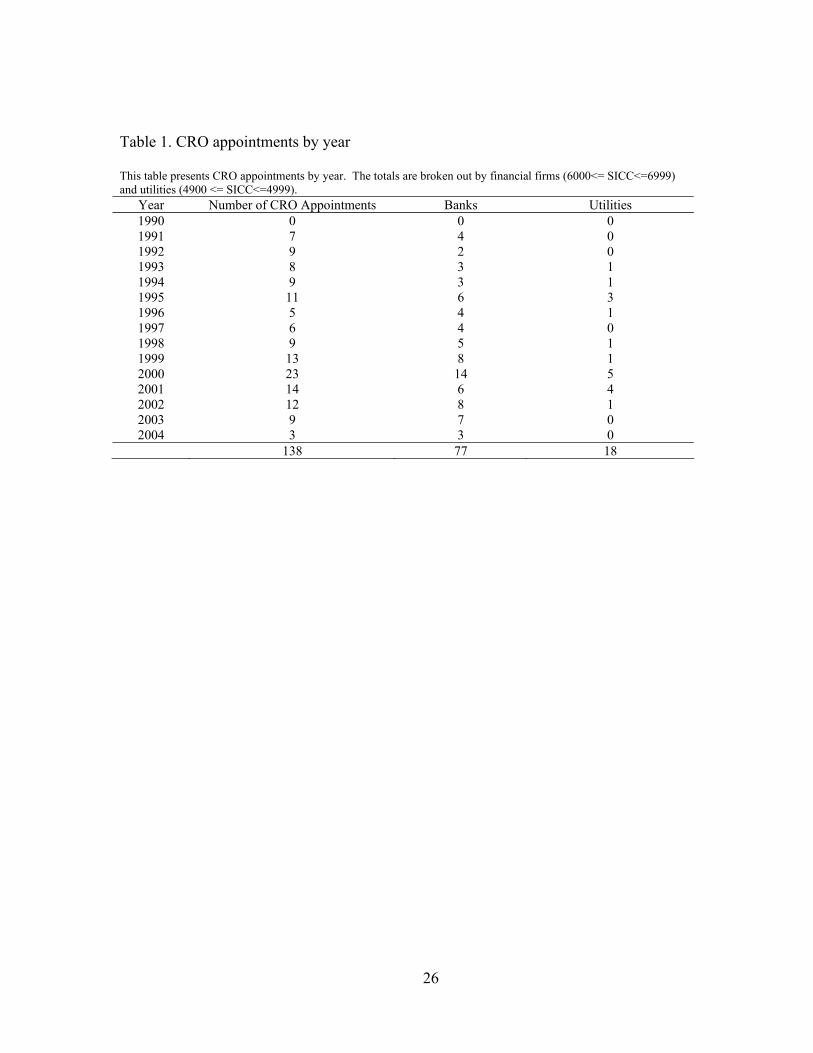
Table 1 presents the distribution of the announcements through time as well as the
distribution across industries. Most CRO hires tend to be in the later part of the sample

9
period, clustered around 1999 through 2002. A substantial portion of the appointments
are located in the financial and utility industries. These are defined in our sample as
having SIC codes in the 6000s for financial firms and in the 4900s for utilities.
The variables being examined are those that appear later in out multivariate
analysis. These variables are either hypothesized determinants of the CRO hire decision
or they represent control variables. In detail, these variables are grouped together and
defined as follows:5
3.1 Financial Characteristics
3.1.1 Leverage
Firms with greater leverage are more likely to suffer from financial distress than
firms with low leverage.
Leverage= Total liabilities/Total Assets = (d6 – d60)/d6 (1)
3.1.2 Cash ratio
Cash Ratio measures the amount of highly liquid assets that the firm has on hand
that could be used to make up a short fall in operating cash flows.
Cash Ratio = Cash and marketable securities/Total Assets = d1/d6 (2)
3.1.3 Earnings volatility
Firms with more volatile earnings are more likely to benefit from ERM if the goal
of ERM is to smooth earnings. Smooth earnings reduce the probability of experiencing a
lower tail earnings outcome and the costs associated with missing earnings targets and
5 Where applicable, the Compustat data items (d#) used to compute the variables are shown.

10
violating debt covenants. SDNI is the standard deviation of the error term from a
regression of the firm’s quarterly earnings on the prior quarter’s earnings. This
regression is run for eight quarters.
3.1.4 Size
We control for size using the log of the market value of equity of the firm at the
fiscal year end prior to the CRO hire announcement.
3.2 Asset Characteristics
Asset characteristics measure the potential costs of financial distress, and proxy
for the potential unrecoverable losses that may be incurred in financial distress.
3.2.1 Opacity
Firms that have opaque assets may have difficulty selling these assets at purchase
cost to avert financial distress, as opaque assets are associated with more information
asymmetry thus and thus are more likely to be undervalued. Opacity is computed as:
Opacity = Intangibles/ Total Assets = d33/d6 (3)
3.2.2 Growth options
Firms with growth options have much of the firm’s value tied to future, and as
yet, unrealized cash flows. Because of the uncertain nature of the payoff from such
expenditures, the value of these investments are unlikely to be fully realized in
bankruptcy, thus ERM may be favored by firms with higher growth options. We proxy
for growth options using market-to-book (MB) and Research and Development expense.
These variables are computed as:

11
MB = Market Value of Equity/ Book Value of Equity = (d199*d25)/d60 (4)
RD = Research and Development Expense / Total Assets = d46/d6 (5)
3.3 Market Characteristics
Market characteristics measure the volatility of the firm and the stock price
performance. SDRET is the standard deviation of the firm’s daily returns over the year
prior to the hiring of the CRO.
Firms that have had dramatic changes in shareholder value, in particular, declines
in value, may feel pressure to convey to shareholders through ERM initiation that they
are doing something to prevent future occurrences. We compute the value change (Value
Change) as the percentage change in market value of the firm over the year prior to the
hiring of the CRO.
3.4 Managerial incentives
Executive share and option based compensation can affect the incentives of
executives in terms of their risk preferences. CEOs that have a large proportion of option
based compensation are more likely to prefer strategies that increase the volatility of the
firm’s stock – thus increasing the value of their option holdings. Alternatively, CEOs
with larger stock holdings hold undiversified portfolios which are overweighted in their
company’s stock. These CEOs may prefer strategies that reduce overall stock
idiosyncratic risk. The distinction between option and stock compensation is further
complicated by the degree to which the option portfolio is in the money. Very in the
money options provide much more stock-like incentives compared to at the money or
12
underwater options. Therefore, measuring option and stock based compensation requires
more than just summing the value of the CEO’s holdings.
We use the approach of Rogers (2002) who builds upon Core and Guay (2002).
Rogers computes a proxy that incorporates CEO incentives to increase risk relative to
incentives to increase stock price. This proxy combines the partial derivative of the
dividend adjusted Black-Scholes equation with respect to the standard deviation of stock
returns and the partial derivative of the Black Scholes equation with respect to the level
of the stock price. The first measure, Vega, measures the incentive to take risk and the
second measure, Delta, measures the incentive to increase stock price. We compute Vega
and Delta for each CEO’s stock and option portfolio and use the ratio (as in Rogers,
2002) of the two variables – Vega to Delta as our proxy for the CEO’s risk taking
incentives. The full details of the computation of Vega and Delta are contained in the
appendix.
3.5 Controls
Firms with more operating segments (Numseg) are likely to be able to diversify
operating and financial risks within the firm. Firm’s with greater institutional ownership
may have greater pressure to install controls associated with ERM. We measure
institutional ownership as the percentage of the firm’s stock held by institutional
investors as recorded in 13-F filings. This variable is designated as PINST. The number
of institutional investors is designated as NINST. Finally, we control for industry
membership – specifically whether the firm is a financial firm or a utility and firm size.

13
4 Univariate Results
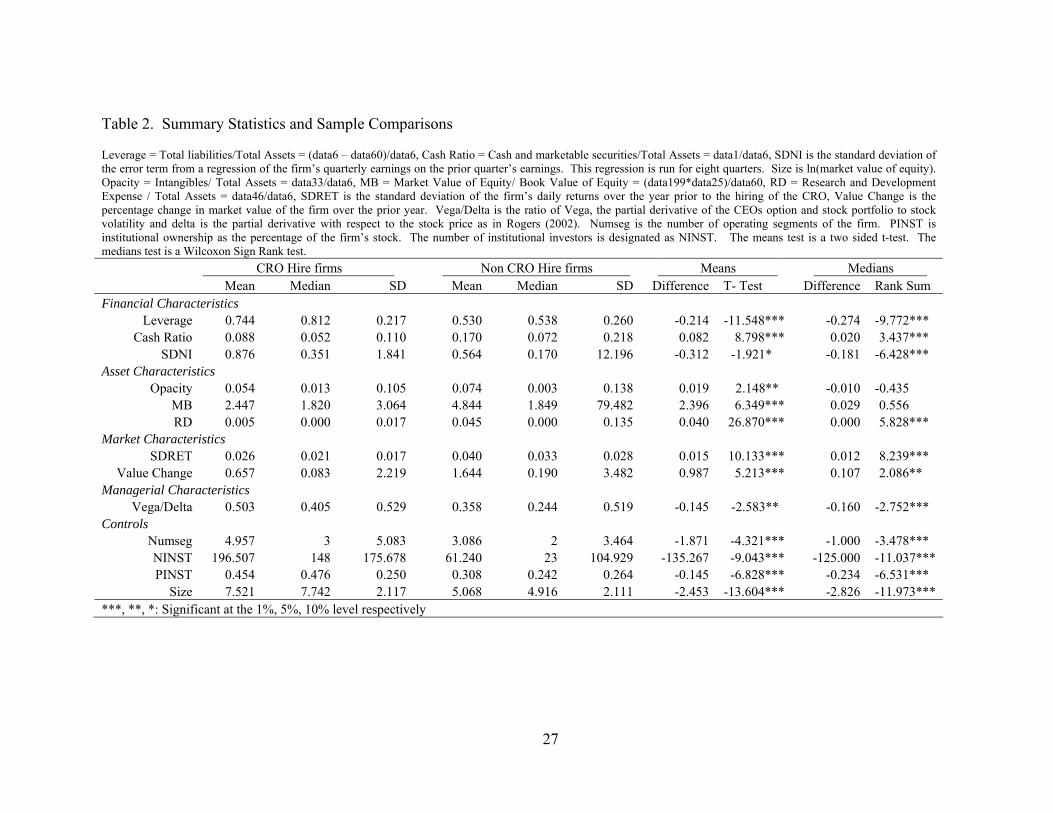
Table 2 presents summary statistics for the main variables. In addition to
providing means and medians of the CRO sample and the sample as a whole, the table
presents results of tests of the means (t-tests) and medians (sign-rank tests). Note that
CRO firms are in the main sample until the year in which they hire a CRO.
The CRO hiring firms tend to have more volatile earnings and tend to be larger,
more levered and have lower cash ratios than the non-hiring firms. These results are to
be expected in that CRO hires tend to be more prevalent among financial firms. CRO
hiring firms tend to be less opaque than non-hiring firms in that they have lower Opacity,
Market-to-Book and Research and Development expenses. These findings are counter to
our hypothesis that firms with more opaque assets and more growth options will tend to
try and protect those future revenue sources through risk management. These results are
most likely being heavily influenced by large number of financial firms in the hiring
sample. The multivariate results will allow us to separate out these affects after
controlling for industry. CRO hiring firms tend to have less volatile stock prices. The
hiring firms have also seen poorer stock performance in the period before the hiring
announcement.
In examining compensation, Vega to Delta for the hiring firms is higher than for
the non-hiring firms, which is a result that runs counter to our expectation that firms with
volatility preferring CEOs will not choose ERM. Finally we find that the hiring firms
have more segments and more institutional ownership than the non-hiring firms, but
again these results may be picking up other effects, such as size.
14
In Table 3 we examine correlations between our key variables. Somewhat
unsurprisingly, size is correlated with many of the other variables in manners which
might be expected. For example, larger firms tend to have less earnings and stock
volatility (SDNI and SDRET). Vega to Delta shows little correlation with most of the
other variables of interest.
5 Multivariate determinants of CRO hiring announcements
In this section we focus on the multivariate determinants of the CRO hire
decision. An important contribution of this paper is the econometric approach that we
use to model the relation between the CRO appointment decision and firm characteristics.
Typically, binary decisions of this type are modeled using a “static model”, so called by
Shumway (2001), in which a logit regression is run on a data set that is comprised of the
dates on which CROs are hired. On each of these dates, a “hire” dummy variable is
created and coded 1 for the firms that have hires, while the other non-hire firms are coded
zero. This approach ignores information contained in the time periods on which there are
no CRO hires, and is the approach used by Liebenberg and Hoyt (2003).
An alternative approach is to use the full time series of data, including those
periods during which no hiring event occurs. For the periods with no hirings, the
dependent binary variable is zero for every firm in the data set. The data set is not a
traditional panel data set but more correctly termed an event history data set, which
reduces in observations each time a firm hires a CRO and thus exits from the data set.
This approach has been used by other authors including Pagano, Panetta and Zingales
15
(1998) to model the IPO decision and Denis, Denis and Sarin (1997) to model executive
turnover.6
Using a logit model to estimate the parameters of an event history data set will
produce incorrect test statistics because of the assumption that all the observations for a
firm are independent. To see this lack of independence, consider that an event on day t=1
can only be preceded by a non event on day t=-1. A hazard model overcomes this
problem, and can incorporate the impact of time on the hiring decision. Hazard models,
commonly used in medical research, model an event (in this case a CRO hire) as a
function of the determinants of the event. The hazard model approach takes account of
the evolution of a firm’s characteristics and computes a hazard ratio of the firm hiring a
CRO, whether or not the firm actually hires. The parameter estimates of the hazard
model should be similar to those of the logit model (using a full event history data set),
but the hazard model produces superior test statistics.
We use a Cox proportional hazard function to estimate equation 6. The Cox
model is a semi parametric model in which the likelihood of the event is not related to
elapsed time. The hazard model takes into account the evolution of the firm’s
characteristics and computes a hazard (or likelihood) ratio of the firm hiring a CRO,
whether or not the firm actually announces a hire. We estimate the following hazard
model:
CROHIREit = f(Financial Characteristicsit, Asset Characteristicsit, Market
Characteristicsit, Managerial Characteristicsit, Controls) + eit (6)
6 In addition to those cited, several other authors use hazard models in finance research, for example Johnson (2004), Ongena and Smith (2001) , McQueen and Thorley (1994), Deshmukh (2003) and Danielsen, Van Ness and Warr (2007).

16
The subscript i represents each firm in the data set that could have a CRO hiring
announcement, but has not yet had one. The subscript t represents every year from 1992
to 2005. The dependent variable, CROHIRE is a binary variable that takes the value of 1
if the firm announces the appointment of a CRO, and zero otherwise. For the years prior
to a CRO hiring, CROHIRE=0. Once a CRO is hired, the observation drops out of the
data set. Therefore, a firm can have a maximum of one observation with CROHIRE=1.
The independent variables are estimated as of the beginning of the fiscal year in
which the CRO is hired.
5.1 Hazard Model Results
Table 4 presents the results of our basic hazard model estimation. Interpreting the
economic significance of the coefficients requires estimating the increase in the
likelihood of the event, in this case a CRO hire, given a change in the independent
variable of interest. Commonly, standardized hazard ratios are computed by calculating
the effect of a one standard deviation shift for each independent variable. However,
several of the variables in our study are right-tail skewed, and consequently have large
standard deviations, which may make cross-sectional comparisons misleading. We
therefore closely follow the approach of Danielsen, Van Ness and Warr (2007) and
consider a change in each right-hand-side variable equal to 10% of the variable’s mean
value. This measure is referred to as a 10%-of-mean-standardized hazard ratio to avoid
confusion with a ratio based on standard deviations. Because hazard ratios are easier to
interpret when the coefficient estimates are positive, we use the absolute value of each

17
coefficient to estimate our 10%-of-mean-standardized hazard ratio. The 10%-of-mean-
standardized hazard ratio (Std HR) is computed as:
meancoefeHRStd ××=
1.0 (7)
Table 4 presents our base model for the full sample. The first column “HR” is the
hazard ratio, the second “Coef” is the coefficient and the third column “Std HR” is the
“10%-of-mean-standardized hazard ratio”. The last column of the table labeled “mean”
is the mean of the variable and is used in the computation of the “Std HR” column.
We find that leverage and size are positively related to the likelihood of hiring a
CRO. A 10% increase in leverage will result in a 7.8% increase in the likelihood of a
hire.7 This result is consistent with firms that are more levered are at a greater risk of
financial distress. The economic significance of the size variable is particularly large,
indicating a 10% increase in size will increase the likelihood of a hire by 27%.
Furthermore, for the standard deviation of earnings, SDNI, a 10% increase will result in a
4.7% increase in the likelihood of a hire. We find no relation for the Cash Ratio variable.
Of the variables that proxy for the asset characteristics, RD and MB are both
significant and negative (the HR is less than 1, resulting in a negative coefficient which is
the log of HR).8 This result is counter to our hypothesis that firms with more growth
options and RD investments will seek to protect these through ERM. It is possible that
higher growth firms are less concerned with ERM because they are focusing on growth
opportunities. Conversely, stable and mature growth firms are looking to improvements
(through ERM) in their day-to-day management of operations.
7 This magnitude is obtained from the Std HR value of 1.078 which implies that an increase of the mean of the independent variable by 10% will increase the hazard likelihood l.078 times or 7.8%. 8 For example, a 10% decline in R&D will result in a 1.9% increase in the probability of hiring a CRO.
18
The market variables, volatility of returns and Value Change are both significant.
First SDRET, the volatility of returns in the year prior to ERM implementation, has a Std
HR of 1.143 indicating that a 10% increase in volatility will result in a 14% increase in
the likelihood of a CRO hire. This result is consistent with the hypothesis that firms
implement ERM to control stock volatility. The Value Change variable is negative and
the significant, indicating that the probability of a hire is negatively related to recent price
performance of the firm. We interpret this result as evidence of that firms try to make
amends after a period of poor performance by implementing ERM to try and avoid
repeating the poor performance in the future.
We find that the number of segments is positively related to the likelihood of a
CRO hire. This result is inconsistent with our expectations, as we would expect more
diversified firms to have less need for ERM as these firms are naturally hedged. A
possible explanation is that multi-segment firms have a greater need for understanding of
how the risks for each segment correspond. Both of the institutional ownership variables
are insignificant. Finally, both the financial firm and utility firm dummy variables are
positive and highly significant consistent with a preference among these firms for
implementing ERM.
5.2 CEO incentives
In Table 5 we explore the effect of CEO compensation on the CRO hire decision.
As we stated earlier, data on CEO compensation is only available for a sub set of our
firms, and hence we have a reduced sample size. We measure CEO incentives using the
ratio of Vega to Delta, as in Rogers (2002). A higher value of this ratio indicates that the
value of the manager’s compensation is more sensitive to stock volatility. In Table 5, the

19
coefficient on Vega to Delta is positive and significant indicating that as CEOs
compensation packages become more sensitive to stock volatility, the likelihood of hiring
a CRO increases. This result appears to be at odds with the incentives of a CEO to
maximize his/her own personal wealth, as one would expect a rational CEO who has
much of his/her compensation in the form of at the money options to prefer that the firm
be more risky. However, it is generally not the CEO that makes the decision to
implement ERM; indeed it is the board of directors that usually leads this initiative (Lam,
2001). Thus a possible explanation for this result is that the board recognizes that the
CEO has an incentive to increase risk and therefore by implementing a risk management
program controls the risk that is expected to be taken on by the CEO. From the board’s
point of view this is a rational strategy – to effectively encourage risk taking by the CEO
and at the same time implement a program to actively manage, coordinate and understand
these risks.
5.3 Industry sub samples
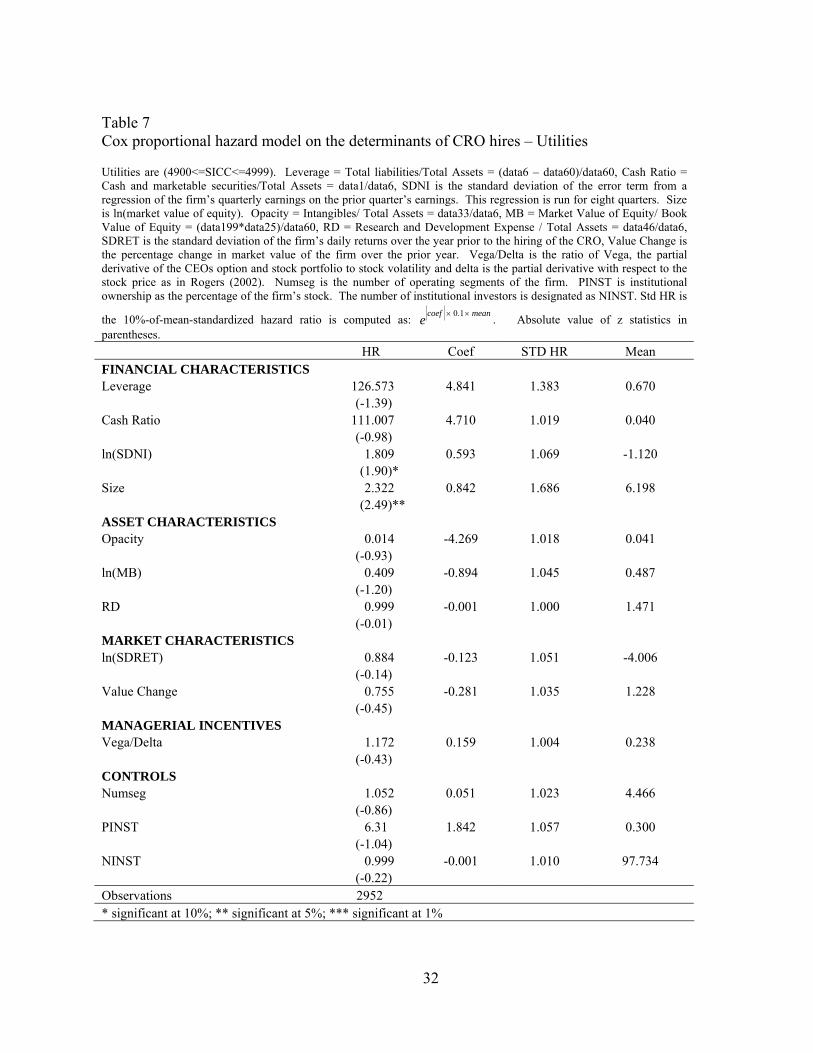
Tables 6 and 7 repeat the analysis from Table 5 for the two main industry sub
samples. Table 6 examines financial firms and shows the coefficients on earnings
volatility, size, number of institutions, and vega to delta are positive and significant,
consistent with the main results from Table 4 and 5. In Table 7 we examine the utility
industry and find that only size and earnings volatility remain significant.

20
6 Conclusion
We use a hazard model to examine the determinants of the firm’s decision to
adopt enterprise risk management (ERM) which we proxy for with the hiring of a Chief
Risk Officer (CRO). The hazard model generates reliable test statistics when a time-
series panel data set is used. This approach, coupled with a larger sample, and more
explanatory variables, represents an important contribution over previous work in this
area.
Our findings indicate that firms adopting ERM are doing so for some reasons that
are consistent with the hypothesized benefits of ERM. For example we find that firms
appear to implement ERM when they are more volatile, have greater earnings volatility
and greater leverage.
We also find evidence consistent with firms implementing ERM for what might
be considered to be non-risk management reasons. For example, we find some evidence
that firms that have seen recent poor stock performance are more likely to hire CROs – a
result consistent with firms trying to demonstrate a credible response to a period of poor
performance. We also find that firms that hire CROs tend to be less opaque and have
fewer growth options. We suspect that this result may be due to ERM being favored by
more stable firms, who, in the absence of high growth projects, implement ERM in the
belief that it will boost their bottom line.
Other authors find a direct relation between CEO risk taking incentives (option
versus stock compensation) and hedging activity. This relation is normally negative in
that the more risk taking incentives that the CEO has, the less likely the firm is to hedge.
We find such a relation, but in our tests, the correlation is positive as we find that the

21
likelihood of ERM adoption is increasing in the risk taking incentives of the CEO. A
possible explanation for this result is that boards are implementing ERM to offset the risk
taking incentives that they have granted to the CEO. This explanation is consistent with
ERM being implemented at the direction of the board, whereas day to day hedging may
be driven more by management.
22
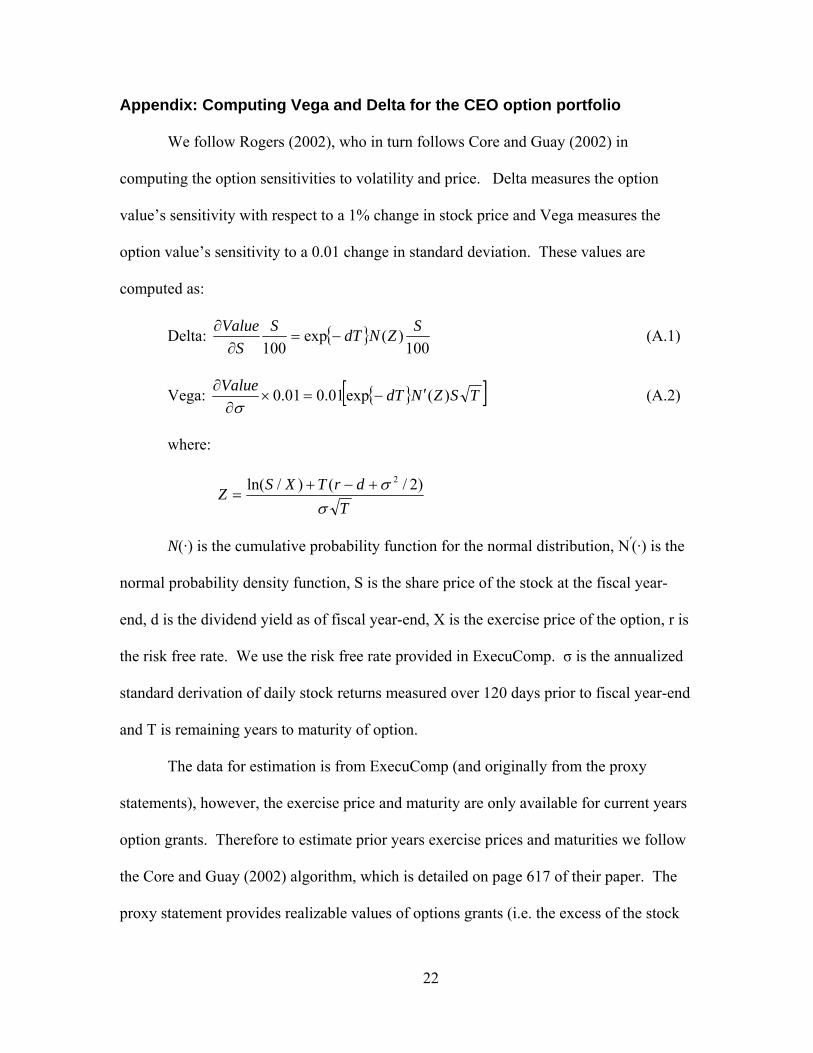
Appendix: Computing Vega and Delta for the CEO option portfolio
We follow Rogers (2002), who in turn follows Core and Guay (2002) in
computing the option sensitivities to volatility and price. Delta measures the option
value’s sensitivity with respect to a 1% change in stock price and Vega measures the
option value’s sensitivity to a 0.01 change in standard deviation. These values are
computed as:
Delta: { }100
)(exp100
SZNdTSS
Value−=
∂∂ (A.1)
Vega: { }[ ]TSZNdTValue )(exp01.001.0 ′−=×∂
∂σ
(A.2)
where:
TdrTXSZ
σσ )2/()/ln( 2+−+
=
N(·) is the cumulative probability function for the normal distribution, N′(·) is the
normal probability density function, S is the share price of the stock at the fiscal year-
end, d is the dividend yield as of fiscal year-end, X is the exercise price of the option, r is
the risk free rate. We use the risk free rate provided in ExecuComp. σ is the annualized
standard derivation of daily stock returns measured over 120 days prior to fiscal year-end
and T is remaining years to maturity of option.
The data for estimation is from ExecuComp (and originally from the proxy
statements), however, the exercise price and maturity are only available for current years
option grants. Therefore to estimate prior years exercise prices and maturities we follow
the Core and Guay (2002) algorithm, which is detailed on page 617 of their paper. The
proxy statement provides realizable values of options grants (i.e. the excess of the stock

23
price over the exercise price). Because X and T are computed separately for new options,
the number and fiscal year-end realizable value of new options must be deducted from
the number and realizable value of unexercisable options. Dividing unexercisable
(excluding new grants) and exercisable realized values by the number of unexercisable
and exercisable options held by the executive, respectively, yields estimates of, on
average, how far each of the groups of options are in the money. Subtracting this number
from the stock price yields the average exercise price. The exercise price is computed for
exercisable and unexercisable options. The time to maturity for the exercisable options is
the maturity of the new grants less one year (or nine years if no new grant is made). For
the unexercisable options, the time to maturity is the maturity of the new grants less three
years (or six years if no grant is made).

24
References
Beasley, M.S., R. Clune, and D. R. Hermanson, (2005). Enterprise risk management: An empirical analysis of factors associated with the extent of implementation. Journal of Accounting and Public Policy, 24 (6), 521-531.
Beasley, M., D. Pagach and R. Warr (2007). The information conveyed in hiring
announcements of senior executives overseeing enterprise-wide risk management processes. Journal of Accounting, Auditing and Finance, forthcoming.
Core, J., and W. Guay, (2002). Estimating the value of employee stock option portfolios
and their sensitivities to price and volatility. Journal of Accounting Research, 40, 613-630.
Danielsen, D., B. Van Ness and R Warr (2007). Reassessing the impact of option
introductions on market quality: A less restrictive test for event-date effects. Journal of Financial and Quantitative Analysis, forthcoming.
Denis, D. J., D. K. Denis and A. Sarin. (1997). Agency problems, equity ownership, and
corporate diversification. Journal of Finance, 52, 135-160. Deshmukh, S. (2003). Dividend initiations and asymmetric information: A hazard model.
Financial Review, 38, 351-368. Economist Intelligence Unit. (2005). The evolving role of the CRO, The Economist
Intelligence Unit, London/New York/Hong Kong (May). Johnson, T. C. (2004). Forecast dispersion and the cross section of expected returns.
Journal of Finance, 59, 1957-1978. Lam, J. (2001). The CRO is here to stay. Risk Management, 48 (4) (April), 16-22. Liebenberg, A., and R. Hoyt. (2003). The determinants of enterprise risk management:
Evidence from the appointment of chief risk officers. Risk Management and Insurance Review 6 (1), 37-52.
Lin, J., C. Pantzalis and J. Park. (2007). Corporate use of derivatives and excess value of
diversification. Journal of Banking & Finance, 31, 3, 889-913. McQueen, G. and S. Thorley. (1994). Bubbles, stock returns, and duration dependence.
Journal of Financial and Quantitative Analysis, 29, 379-401. Nocco., B. W. and R. Stulz (2006). Enterprise risk management: Theory and practice.
Ohio State University working paper

25
Onega S. and D. Smith. (2001). The duration of bank relationships. Journal of Financial Economics, 61, 449-475.
Pagano, M., F. Panetta and L. Zingales. (1998) Why do companies go public? An
empirical analysis. Journal of Finance, 53, 27-64. Rogers, D. A., (2002). Does executive portfolio structure affect risk management? CEO
risk-taking incentives and corporate derivatives usage. Journal of Banking and Finance, 26, 271-295
Shumway, T. (2001). Forecasting bankruptcy more accurately: A simple hazard model.
Journal of Business, 74, 101-124. Slywotzky, A.J. and J. Drzik. (2005). Countering the biggest risk of all, Harvard
Business Review, (April), 78-88. Stulz, R. (1996). Rethinking risk management, Journal of Applied Corporate Finance, 9,
3, 8 Stulz, R. (2003). Rethinking risk management, The Revolution in Corporate Finance, 4th
Edition, Blackwell Publishing, 367-384. Walker, P.L., (2003). “ERM in practice,” Internal Auditor, (August), 51-55.
Tufano, P., (1996). Who manages risk? An empirical examination of risk management practices in the gold mining industry. Journal of Finance, 51 (4), 1097-1137.
26
Table 1. CRO appointments by year This table presents CRO appointments by year. The totals are broken out by financial firms (6000<= SICC<=6999) and utilities (4900 <= SICC<=4999).
Year Number of CRO Appointments Banks Utilities 1990 0 0 0 1991 7 4 0 1992 9 2 0 1993 8 3 1 1994 9 3 1 1995 11 6 3 1996 5 4 1 1997 6 4 0 1998 9 5 1 1999 13 8 1 2000 23 14 5 2001 14 6 4 2002 12 8 1 2003 9 7 0 2004 3 3 0
138 77 18
27
Table 2. Summary Statistics and Sample Comparisons Leverage = Total liabilities/Total Assets = (data6 – data60)/data6, Cash Ratio = Cash and marketable securities/Total Assets = data1/data6, SDNI is the standard deviation of the error term from a regression of the firm’s quarterly earnings on the prior quarter’s earnings. This regression is run for eight quarters. Size is ln(market value of equity). Opacity = Intangibles/ Total Assets = data33/data6, MB = Market Value of Equity/ Book Value of Equity = (data199*data25)/data60, RD = Research and Development Expense / Total Assets = data46/data6, SDRET is the standard deviation of the firm’s daily returns over the year prior to the hiring of the CRO, Value Change is the percentage change in market value of the firm over the prior year. Vega/Delta is the ratio of Vega, the partial derivative of the CEOs option and stock portfolio to stock volatility and delta is the partial derivative with respect to the stock price as in Rogers (2002). Numseg is the number of operating segments of the firm. PINST is institutional ownership as the percentage of the firm’s stock. The number of institutional investors is designated as NINST. The means test is a two sided t-test. The medians test is a Wilcoxon Sign Rank test. CRO Hire firms Non CRO Hire firms Means Medians
Mean Median SD Mean Median SD Difference T- Test Difference Rank Sum Financial Characteristics
Leverage 0.744 0.812 0.217 0.530 0.538 0.260 -0.214 -11.548*** -0.274 -9.772*** Cash Ratio 0.088 0.052 0.110 0.170 0.072 0.218 0.082 8.798*** 0.020 3.437***
SDNI 0.876 0.351 1.841 0.564 0.170 12.196 -0.312 -1.921* -0.181 -6.428*** Asset Characteristics
Opacity 0.054 0.013 0.105 0.074 0.003 0.138 0.019 2.148** -0.010 -0.435 MB 2.447 1.820 3.064 4.844 1.849 79.482 2.396 6.349*** 0.029 0.556 RD 0.005 0.000 0.017 0.045 0.000 0.135 0.040 26.870*** 0.000 5.828***
Market Characteristics SDRET 0.026 0.021 0.017 0.040 0.033 0.028 0.015 10.133*** 0.012 8.239***
Value Change 0.657 0.083 2.219 1.644 0.190 3.482 0.987 5.213*** 0.107 2.086** Managerial Characteristics
Vega/Delta 0.503 0.405 0.529 0.358 0.244 0.519 -0.145 -2.583** -0.160 -2.752*** Controls
Numseg 4.957 3 5.083 3.086 2 3.464 -1.871 -4.321*** -1.000 -3.478*** NINST 196.507 148 175.678 61.240 23 104.929 -135.267 -9.043*** -125.000 -11.037*** PINST 0.454 0.476 0.250 0.308 0.242 0.264 -0.145 -6.828*** -0.234 -6.531***
Size 7.521 7.742 2.117 5.068 4.916 2.111 -2.453 -13.604*** -2.826 -11.973*** ***, **, *: Significant at the 1%, 5%, 10% level respectively

28
Table 3. Correlations Leverage = Total liabilities/Total Assets = (data6 – data60)/data6, Cash Ratio = Cash and marketable securities/Total Assets = data1/data6, SDNI is the standard deviation of the error term from a regression of the firm’s quarterly earnings on the prior quarter’s earnings. This regression is run for eight quarters. Size is ln(market value of equity). Opacity = Intangibles/ Total Assets = data33/data6, MB = Market Value of Equity/ Book Value of Equity = (data199*data25)/data60, RD = Research and Development Expense / Total Assets = data46/data6, SDRET is the standard deviation of the firm’s daily returns over the year prior to the hiring of the CRO, Value Change is the percentage change in market value of the firm over the prior year. Vega/Delta is the ratio of Vega, the partial derivative of the CEOs option and stock portfolio to stock volatility and delta is the partial derivative with respect to the stock price as in Rogers (2002). Numseg is the number of operating segments of the firm. PINST is institutional ownership as the percentage of the firm’s stock. The number of institutional investors is designated as NINST. P values for significance level of each pair-wise correlation are in parenthesis.
Leverage Cash Ratio SDNI Size Opacity MB RD SDRET
Value Change Vega/Delta Numsegs NINST
Cash Ratio -0.0694 (0.4186)
SDNI 0.1021 0.0020 (0.2334) (0.9812)
Size 0.2471 -0.1246 -0.1790 (0.0035) (0.1453) (0.0357)
Opacity -0.2886 -0.0515 -0.0840 -0.0737 (0.0006) (0.549) (0.3275) (0.3902)
MB 0.1521 0.0875 0.0146 0.1354 0.0698 (0.075) (0.3076) (0.8649) (0.1133) (0.4159)
RD -0.3783 0.3436 -0.0005 -0.2501 0.1357 0.0769 (0.000) (0.000) (0.9952) (0.0031) (0.1125) (0.3697)
SDRET 0.0345 0.1147 0.4405 -0.4478 0.0640 0.1331 0.1927 (0.688) (0.1803) (0.000) (0.000) (0.4558) (0.1195) (0.0236)
Value Change -0.1224 0.2925 -0.0806 -0.0463 -0.0913 0.1320 0.2289 0.0202 (0.1528) (0.0005) (0.3471) (0.5898) (0.2871) (0.1226) (0.0069) (0.8141)
Vega/Delta 0.0093 -0.1740 0.1631 0.1343 -0.0742 -0.0966 -0.1326 -0.1178 -0.1606 (0.9309) (0.1029) (0.1267) (0.2094) (0.4898) (0.3678) (0.2155) (0.2717) (0.1328)
Numseg -0.0605 -0.0904 0.0805 0.3032 0.1639 0.1717 0.0394 0.0358 0.1565 0.1772 (0.4807) (0.2919) (0.3478) (0.0003) (0.0548) (0.044) (0.6465) (0.6766) (0.0668) (0.0967)
NINST 0.3012 -0.1373 -0.1385 0.8046 -0.0939 0.1281 -0.1998 -0.2284 -0.1999 0.0765 0.1450 (0.0003) (0.1084) (0.1053) (0.000) (0.2733) (0.1344) (0.0188) (0.007) (0.0187) (0.4759) (0.0896)
PINST 0.0657 -0.1758 -0.1384 0.4702 0.0638 0.0276 -0.2517 -0.1396 -0.1812 0.0239 0.1144 0.5446 (0.4441) (0.0392) (0.1056) (0.000) (0.4576) (0.7475) (0.0029) (0.1023) (0.0334) (0.824) (0.1814) (0.000)

29
Table 4 Cox proportional hazard model on the determinants of CRO hires - Full Sample Leverage = Total liabilities/Total Assets = (data6 – data60)/data6, Cash Ratio = Cash and marketable securities/Total Assets = data1/data6, SDNI is the standard deviation of the error term from a regression of the firm’s quarterly earnings on the prior quarter’s earnings. This regression is run for eight quarters. Size is ln(market value of equity). Opacity = Intangibles/ Total Assets = data33/data6, MB = Market Value of Equity/ Book Value of Equity = (data199*data25)/data60, RD = Research and Development Expense / Total Assets = data46/data6, SDRET is the standard deviation of the firm’s daily returns over the year prior to the hiring of the CRO, Value Change is the percentage change in market value of the firm over the prior year. Numseg is the number of operating segments of the firm. PINST is institutional ownership as the percentage of the firm’s stock. Financial is a dummy for (6000<=SICC<=6999) and Utility is a dummy for (4900<=SICC<=4999). Std HR is the 10%-of-mean-standardized
hazard ratio is computed as: meancoefe ×× 1.0 .Absolute value of z statistics in parentheses HR Coef Std HR Mean
FINANCIAL CHARACTERISTICS Leverage 4.116 1.415 1.078 0.531 (2.57)** Cash Ratio 1.091 0.087 1.001 0.170 (-0.11) ln(SDNI) 1.305 0.266 1.047 -1.738 (3.85)*** Size 1.607 0.474 1.272 5.072 (6.64)*** ASSET CHARACTERISTICS Opacity 0.634 -0.456 1.003 0.074 (-0.56) ln(MB) 0.764 -0.269 1.019 0.702 (1.75)* RD 0.991 -0.009 1.042 45.103 (1.92)* MARKET CHARACTERISTICS ln(SDRET) 1.481 0.393 1.143 -3.402 (1.70)* Value Change 0.925 -0.078 1.013 1.643 (1.82)* CONTROLS Numseg 0.961 -0.040 1.012 3.089 (1.97)** PINST 1.733 0.550 1.017 0.309 (-1.49) NINST 1.001 0.001 1.006 61.460 (-1.55) Financial 4.139 1.420 1.029 0.203 (5.52)*** Utility 4.508 1.506 1.005 0.036 (4.72)*** Observations 84362 * significant at 10%; ** significant at 5%; *** significant at 1%

30
Table 5. Cox proportional hazard model on the determinants of CRO hires – Including CEO incentives Leverage = Total liabilities/Total Assets = (data6 – data60)/data6, Cash Ratio = Cash and marketable securities/Total Assets = data1/data6, SDNI is the standard deviation of the error term from a regression of the firm’s quarterly earnings on the prior quarter’s earnings. This regression is run for eight quarters. Size is ln(market value of equity). Opacity = Intangibles/ Total Assets = data33/data6, MB = Market Value of Equity/ Book Value of Equity = (data199*data25)/data60, RD = Research and Development Expense / Total Assets = data46/data6, SDRET is the standard deviation of the firm’s daily returns over the year prior to the hiring of the CRO, Value Change is the percentage change in market value of the firm over the prior year. Vega/Delta is the ratio of Vega, the partial derivative of the CEOs option and stock portfolio to stock volatility and delta is the partial derivative with respect to the stock price as in Rogers (2002). Numseg is the number of operating segments of the firm. PINST is institutional ownership as the percentage of the firm’s stock. The number of institutional investors is designated as NINST. Financial is a dummy for (6000<=SICC<=6999) and Utility is a dummy for (4900<=SICC<=4999). Std HR is the
10%-of-mean-standardized hazard ratio is computed as: meancoefe ×× 1.0 . Absolute value of z statistics in parentheses HR Coef Std HR Mean
FINANCIAL CHARACTERISTICS Leverage 4.771 1.563 1.092 0.562 (-1.45) Cash Ratio 0.457 -0.783 1.010 0.128 (-0.58) ln(SDNI) 1.126 0.119 1.016 -1.369 (-0.89) Size 1.841 0.610 1.562 7.313 (3.01)*** ASSET CHARACTERISTICS Opacity 0.126 -2.071 1.020 0.098 (-1.42) ln(MB) 0.810 -0.211 1.020 0.941 (-0.83) RD 0.967 -0.034 1.113 31.898 (2.01)** MARKET CHARACTERISTICS ln(SDRET) 2.170 0.775 1.334 -3.716 (1.77)* Value Change 0.919 -0.084 1.004 0.484 (-0.69) MANAGERIAL INCENTIVES Vega/Delta 1.332 0.287 1.035 -1.190 (1.98)** CONTROLS Numseg 0.970 -0.030 1.014 4.665 (-1.12) PINST 3.071 1.122 1.068 0.589 (-1.59) NINST 1.000 0.000 1.000 182.785 (-0.10) Financial 4.445 1.492 1.021 0.141 (3.35)*** Utility 4.824 1.574 1.009 0.056 (3.43)*** Observations 13966 * significant at 10%; ** significant at 5%; *** significant at 1%

31
Table 6 Cox proportional hazard model on the determinants of CRO hires – Financial Firms Financials are (6000<=SICC<=6999). Leverage = Total liabilities/Total Assets = (data6 – data60)/data60, Cash Ratio = Cash and marketable securities/Total Assets = data1/data6, SDNI is the standard deviation of the error term from a regression of the firm’s quarterly earnings on the prior quarter’s earnings. This regression is run for eight quarters. Size is ln(market value of equity). Opacity = Intangibles/ Total Assets = data33/data6, MB = Market Value of Equity/ Book Value of Equity = (data199*data25)/data60, RD = Research and Development Expense / Total Assets = data46/data6, SDRET is the standard deviation of the firm’s daily returns over the year prior to the hiring of the CRO, Value Change is the percentage change in market value of the firm over the prior year. Vega/Delta is the ratio of Vega, the partial derivative of the CEOs option and stock portfolio to stock volatility and delta is the partial derivative with respect to the stock price as in Rogers (2002). Numseg is the number of operating segments of the firm. PINST is institutional ownership as the percentage of the firm’s stock. The number of institutional investors is designated as NINST. Std HR is
the 10%-of-mean-standardized hazard ratio is computed as: meancoefe ×× 1.0 . Absolute value of z statistics in parentheses.
HR Coef STD HR Mean FINANCIAL CHARACTERISTICS Leverage 2.359 0.858 1.066 0.747 (-1.15) Cash Ratio 1.848 0.614 1.006 0.100 (-0.65) ln(SDNI) 1.28 0.247 1.049 -1.953 (2.70)*** Size 1.576 0.455 1.262 5.124 (4.72)*** ASSET CHARACTERISTICS Opacity 1.294 0.258 1.001 0.025 (-0.18) ln(MB) 0.71 -0.342 1.014 0.418 (-1.50) RD 1.001 0.001 1.000 2.271 (-0.73) MARKET CHARACTERISTICS ln(SDRET) 1.546 0.436 1.178 -3.754 (-1.37) Value Change 0.915 -0.089 1.015 1.654 (-1.53) MANAGERIAL INCENTIVES Vega/Delta 1.608 0.475 1.002 0.051 (2.16)** CONTROLS Numseg 0.929 -0.074 1.018 2.459 (2.56)** PINST 1.217 0.196 1.005 0.261 (-0.36) NINST 1.002 0.002 1.011 54.096 (2.19)** Observations 16972 * significant at 10%; ** significant at 5%; *** significant at 1%
32
Table 7 Cox proportional hazard model on the determinants of CRO hires – Utilities Utilities are (4900<=SICC<=4999). Leverage = Total liabilities/Total Assets = (data6 – data60)/data60, Cash Ratio = Cash and marketable securities/Total Assets = data1/data6, SDNI is the standard deviation of the error term from a regression of the firm’s quarterly earnings on the prior quarter’s earnings. This regression is run for eight quarters. Size is ln(market value of equity). Opacity = Intangibles/ Total Assets = data33/data6, MB = Market Value of Equity/ Book Value of Equity = (data199*data25)/data60, RD = Research and Development Expense / Total Assets = data46/data6, SDRET is the standard deviation of the firm’s daily returns over the year prior to the hiring of the CRO, Value Change is the percentage change in market value of the firm over the prior year. Vega/Delta is the ratio of Vega, the partial derivative of the CEOs option and stock portfolio to stock volatility and delta is the partial derivative with respect to the stock price as in Rogers (2002). Numseg is the number of operating segments of the firm. PINST is institutional ownership as the percentage of the firm’s stock. The number of institutional investors is designated as NINST. Std HR is
the 10%-of-mean-standardized hazard ratio is computed as: meancoefe ×× 1.0 . Absolute value of z statistics in parentheses.
HR Coef STD HR Mean FINANCIAL CHARACTERISTICS Leverage 126.573 4.841 1.383 0.670 (-1.39) Cash Ratio 111.007 4.710 1.019 0.040 (-0.98) ln(SDNI) 1.809 0.593 1.069 -1.120 (1.90)* Size 2.322 0.842 1.686 6.198 (2.49)** ASSET CHARACTERISTICS Opacity 0.014 -4.269 1.018 0.041 (-0.93) ln(MB) 0.409 -0.894 1.045 0.487 (-1.20) RD 0.999 -0.001 1.000 1.471 (-0.01) MARKET CHARACTERISTICS ln(SDRET) 0.884 -0.123 1.051 -4.006 (-0.14) Value Change 0.755 -0.281 1.035 1.228 (-0.45) MANAGERIAL INCENTIVES Vega/Delta 1.172 0.159 1.004 0.238 (-0.43) CONTROLS Numseg 1.052 0.051 1.023 4.466 (-0.86) PINST 6.31 1.842 1.057 0.300 (-1.04) NINST 0.999 -0.001 1.010 97.734 (-0.22) Observations 2952 * significant at 10%; ** significant at 5%; *** significant at 1%
Recommended