REPORT NOVEMBER 2015
An Engine for Growth.2015 Report Card on Canada and Toronto’s Financial Services Sector

An Engine for Growth: 2015 Report Card on Canada’s and Toronto’s Financial Services Sector Michael Burt
Preface
Financial services are a critical component of the Canadian economy. The sector directly accounted for 4.4 per cent of Canadian employment in 2014, at 780,000 jobs, and 6.8 per cent of Canadian GDP. This report discusses the performance of Canada’s financial services sector versus its peers in other countries and versus other sectors within Canada. The metrics considered in the report include the sector’s financial performance, its productivity and innovation performance, and its international trade and investment performance. The report also assesses Toronto’s role in Canada’s financial services sector. This includes examining the sector’s importance to Toronto’s economy, as well as how Toronto compares with other international financial centres.
To cite this report: Burt, Michael. An Engine for Growth: 2015 Report Card on Canada’s and Toronto’s Financial Services Sector. Ottawa: The Conference Board of Canada, 2015.
©2015 The Conference Board of Canada* Published in Canada | All rights reserved | Agreement No. 40063028 | *incorporated as AERiC inc.
An accessible version of this document for the visually impaired is available upon request. Accessibility Officer, The Conference Board of Canada Tel.: 613-526-3280 or 1-866-711-2262 E-mail: [email protected]
®The Conference Board of Canada and the torch logo are registered trademarks of The Conference Board, inc. Forecasts and research often involve numerous assumptions and data sources, and are subject to inherent risks and uncertainties. This information is not intended as specific investment, accounting, legal, or tax advice. The findings and conclusions of this report do not necessarily reflect the views of the external reviewers, advisors, or investors. Any errors or omissions in fact or interpretation remain the sole responsibility of The Conference Board of Canada.

CONTENTS
i EXECUTIVE SUMMARY
Chapter 1 1 introduction
Chapter 2 4 The Financial Performance of Canada’s Financial services sector 5 Revenue Growth 9 Profit Measures 12 Measures of Return 14 Financial Stability Indicators 22 International Comparisons for Insurance
Chapter 3 26 The Productivity and innovation Performance of the Financial services sector 28 International Comparisons of Financial Services Productivity Performance 30 Canadian Comparisons of Financial Services Productivity Performance 31 Financial Services Productivity Performance Across Provinces 31 Innovation Performance
Chapter 4 38 Canada’s Financial sector in a Global Context 40 Building a Global Presence Through Foreign Affiliates 44 Building a Global Presence Through Exports
Chapter 5 47 Toronto’s Role in Canada’s Financial services sector 48 Economic and Fiscal Impacts of the Sector in Toronto 60 The Structure of Toronto’s Sector
Chapter 6 63 Toronto as a Global Financial Centre 68 Employment in Global Financial Centres
Chapter 7 72 Conclusion
Appendix A 76 Bibliography
Appendix B 80 Additional data Tables

AcknowledgementsThe Conference Board of Canada did the research for this report with funding and support from the Toronto Financial Services Alliance (TFSA). In keeping with Conference Board guidelines for financed research, the design and method of research, as well as the content of this report, were determined solely by the Conference Board. The report was written by Michael Burt.
About the Toronto Financial Services Alliance
The Toronto Financial Services Alliance (TFSA) is a unique, public–private partnership dedicated to growing Toronto region’s financial services cluster and building it as a “top ten” global financial services centre. Established in 2001, TFSA is a collaboration involving three levels of government, the financial services industry and academia.
Find Conference Board research at www.e-library.ca.
EXECUTIVE SUMMARY
An Engine for Growth: 2015 Report Card on Canada’s and Toronto’s Financial Services Sector
At a Glance
• Financial services have been a major source of growth for Canada over the past decade, with the sector’s employment, financial results, and international trade and investment performance outpacing the average for all sectors.
• Financial institutions account for one-quarter of the profits generated by Canada’s private sector and have high profit margins. However, returns relative to equity or capital employed are slightly below average.
• Compared with their international peers, Canadian deposit-taking institutions have healthy levels of capital adequacy and liquidity, with high rates of return and low levels of non-performing loans.
• Canada’s financial services sector is innovative; 73.6 per cent of financial services firms had undertaken some form of innovation in the previous year versus 63.5 per cent for all sectors.
• Toronto is an important part of Canada’s financial sector, with the metro area accoutning for 32.3 per cent of national employment.

AN ENGiNE FOR GROwTH2015 Report Card on Canada and Toronto’s Financial services sector
Find Conference Board research at www.e-library.ca. ii
The financial services sector is a critical component of the Canadian economy. The sector directly accounted for 4.4 per cent of Canadian employment in 2014 (at 780,000 jobs) and for 6.8 per cent of Canadian GDP. Also, the sector has been a source of growth for Canada in recent years. For example, sector employment has risen by 15.4 per cent since 2004. Only a handful of sectors—such as mining, oil and gas; health care; and professional services—have experienced stronger growth.
But the sector’s role goes well beyond the jobs it supports and the GdP
it generates. A well-functioning financial services sector is a critical
ingredient in a successful economy, as it links the economy together in
a unique way. Financial services are a necessary input for every single
business across the country and are used by essentially every adult
individual. Only a handful of other sectors, such as telecommunications
or transportation, have the same impact on the day-to-day functioning of
the economy.
Given the importance of the sector, the purpose of this report is
twofold. First, we discuss the performance of Canada’s financial
services sector versus its peers in other countries and versus other
sectors within Canada. The metrics we consider include the sector’s
financial performance, its productivity and innovation performance, and
its international trade and investment performance. The second objective
is to assess Toronto’s role in Canada’s financial services sector. This
includes examining the sector’s importance to Toronto’s economy, as
well as how Toronto compares with other international financial centres.
Executive summary | The Conference Board of Canada
Find Conference Board research at www.e-library.ca. iii
Financial Performance
Financial services experienced revenue growth of 4.3 per cent over
the past decade—above the average of 3.8 per cent for the entire private
sector. Furthermore, this growth occurred despite the fact that the sector
experienced a large decline in revenues during the 2008–09 recession.
within the sector, key sources of revenue growth included the banking,
securities, and life and health insurance industries.
in terms of profitability, financial services stand out in two ways. First,
the sector accounted for 26.3 per cent of the net profits generated by
the private sector in 2014. second, the sector has a very high profit
margin of 19.4 per cent, versus 7.1 per cent for the entire private sector.
Among major sectors, only the real estate and leasing sector has a
higher profit margin. However, the financial services’ high profit margin is
partially attributable to the sector’s high degree of capital intensity. Once
financial services’ profitability is compared relative to its invested capital,
returns are slightly below the average for all sectors. That said, there
is considerable variation within the sector, with property and casualty
insurance, back office operations, and other insurance operations (such
as brokers and independent adjusters) reporting above-average rates or
return on equity (ROE) and capital employed.
when compared with their international peers, Canadian financial
institutions generally also fare well. deposit-taking institutions in
Canada have healthy levels of capital adequacy and liquidity, with high
rates of return and low levels of non-performing loans. This contributes
to Canada consistently being listed as having the soundest financial
system in the world. in fact, Canadian ROE for deposit-taking institutions
is among the highest for countries that contain one or more major
global financial centres. At the same time, non-performing loans as a
share of all loans in Canada are among the lowest for the same group
of countries. Canadian insurance firms also report above-average
ROE, compared with their international peers, despite the challenges
of limited premium growth and the impact of low interest rates on
investment returns.
within the sector, key sources of revenue growth included the banking, securities, and life and health insurance industries.

AN ENGiNE FOR GROwTH2015 Report Card on Canada and Toronto’s Financial services sector
Find Conference Board research at www.e-library.ca. iv
Productivity and Innovation Performance
Although the financial services sector does not score highly on common
measures of innovation, such as research and development spending
or patents, the sector is innovative. For example, according to statistics
Canada’s survey of innovation and Business strategy, 73.6 per cent of
financial services firms had undertaken some form of innovation in the
previous year, versus 63.5 per cent for all sectors. The most common
forms of innovation undertaken by the sector include organizational and
marketing innovations.
within the sector, it is difficult to say which industry is the most
innovative, as each one innovates in different ways. However, banking
tends to take the lead in developing new marketing channels and
promotional strategies, while securities firms are the most likely to
undertake innovations in product design and pricing. Finally, insurance
firms are the most likely to undertake organizational innovation.
Regionally, the most innovative financial services firms are found in
Ontario and British Columbia, while innovation is lowest in Alberta
and Atlantic Canada.
However, the sector’s innovations have only partially translated into
productivity growth. Labour productivity gains in the sector averaged
0.5 per cent per year between 2007 and 2014. This was below the
average of 1.0 per cent over the same period for all sectors in Canada.
As well, labour productivity growth in Canada’s financial services sector
is only moderate when compared with peer countries. Even so, growth
in Canada did outpace some countries that host major global financial
centres, such as the United Kingdom (–1.5 per cent) and Germany
(0.3 per cent). One potential factor may be that Canada already has
an above-average level of productivity, and it is harder to grow from
a high level.
The most common forms of innovation undertaken by the sector include organizational and marketing innovations.
Executive summary | The Conference Board of Canada
Find Conference Board research at www.e-library.ca. v
Trade and Investment Performance
Financial services are a large and growing part of Canada’s international
trade and investment profile. The principle means by which Canadian
financial institutions expand their international footprint is by undertaking
investments to establish foreign affiliates. in fact, 52 per cent of Canada’s
stock of outward foreign direct investments (Fdi) is attributable to the
financial services sector, up from 35 per cent in 2000. At $435 billion in
2014, Canada’s stock of financial services outward Fdi has quadrupled
since 2000, and it is now twice as large as its inward stock. in other
words, Canada is a large and growing net exporter of financial
services capital.
As a result of these investments, Canada’s financial services foreign
affiliate sales have doubled since 2000. They now account for 20 per
cent of Canada’s total foreign affiliate sales, up from 13 per cent in
2000. At $100 billion in 2012, the sector’s foreign affiliate sales are
10 times the size of its exports. However, the sector’s exports have also
grown significantly—tripling since the turn of the century. This growth
is largely driven by “other financial services,” which include items such
as securities issuance and trading, and asset management services.
in fact, financial services is Canada’s largest and fastest-growing
services category internationally.
Toronto’s Role in Canada’s Financial Services Sector
Toronto is the major hub for financial services in Canada. For example,
the metro area accounts for 32.3 per cent of Canada’s financial services
employment and 43 per cent of the sector’s headquarters employment.
As well, the sector has become more concentrated in Toronto over the
past decade. As a result, at 251,375 employees, the sector directly
accounts for 8.1 per cent of the metro area’s employment, and 13.3 per
cent of its GdP. in terms of GdP, only the public services sector is
larger in Toronto.

AN ENGiNE FOR GROwTH2015 Report Card on Canada and Toronto’s Financial services sector
Find Conference Board research at www.e-library.ca. vi
in addition to the direct impacts on Toronto’s economy, the financial
services sector generates secondary (or indirect) impacts, as well as
fiscal impacts. For example, the sector supports another 209,371 indirect
jobs, with 106,290 of those occurring in Toronto and the rest occurring
elsewhere in Canada. Key industries that indirectly benefit Toronto
include consulting, accounting, legal services, and computer services.
As well, Toronto’s financial services sector generated a combined $15.7
billion in fiscal benefits in 2014 for the Canadian, Ontario, and City of
Toronto governments.
Toronto’s role as Canada’s major financial services hub is reinforced
by the results of global rankings such as The Banker magazine’s list
of top global financial centres. The magazine ranks Toronto 7th in the
world, and the Global Financial Centres index (GFCi) ranks Toronto 8th.
Toronto’s ranking in the GFCi improved from 11th, and the improvement
appears to be largely tied to an improved reputation for the city. in fact,
Toronto now ranks 15th among the cities covered in the GFCi in terms
of “reputational advantage.” This means that opinions about Toronto are
significantly stronger than the quantitative data would suggest.

Find Conference Board research at www.e-library.ca.
CHAPTER 1
Introduction
Chapter summary
• Canada’s financial services sector has been a source of growth for the economy over the past decade, and it now directly accounts for 780,000 jobs and 6.8 per cent of GdP in Canada.
• in addition, a well-functioning financial services sector is a critical ingredient in a successful economy. it links the economy together in a unique way.
• Toronto is Canada’s largest and most dominant financial centre. The metro area accounts for one-third of the sector’s employment and more than 40 per cent of its headquarters employment.

AN ENGiNE FOR GROwTH2015 Report Card on Canada and Toronto’s Financial services sector
Find Conference Board research at www.e-library.ca. 2
The financial services sector is a critical component of the Canadian economy. For example, the sector directly accounted for 4.4 per cent of Canadian employment in 2014 (at 780,000 jobs1) and 6.8 per cent of Canadian GDP.2 Furthermore, the sector has been a source of growth for Canada in recent years. For example, sector employment has risen by 15.4 per cent since 2004. Only a handful of sectors—such as mining, oil and gas, health care, and professional services—have experienced stronger growth.
But the sector’s role goes well beyond the jobs it supports and the GdP
it generates. A well-functioning financial services sector is a critical
ingredient in a successful economy. Key functions that the sector
provides which, essentially, all consumers and business require, include
access to credit, transaction processing, and risk management services.
without these services, a modern, dynamic, and resilient economy is
impossible.
Thus, the financial services sector links the economy together in a
unique way. Financial services are a necessary input for every single
business across the country and are essentially used by every adult
individual. Only a handful of other sectors, such as telecommunications
or transportation, have the same impact on the day-to-day functioning
of the economy.
within Canada’s financial services sector, Toronto plays an important
role. This is reflected in the fact that the metro area accounts for 32.3 per
cent of Canada’s financial services employment and 43 per cent of
1 see CANsiM table 282-0008. in this report, the financial services sector is defined as NAiCs 52 unless otherwise noted.
2 see CANsiM table 379-0031.
Chapter 1 | The Conference Board of Canada
Find Conference Board research at www.e-library.ca. 3
headquarters employment. For both measures, these shares are more
than double those of the second-ranked metro area in Canada. Financial
services are also an integral part of Toronto’s economy: the sector
directly accounts for about 1 out of every 12 jobs in the Toronto metro
area. As well, the sector indirectly supports activity in a variety of other
sectors—locally and across Canada.
The depth and diversity of Toronto’s financial sector and its international
success is reflected in its high ranking on international league tables for
financial centres, such as those produced by The Banker, and on the
Global Financial Centres index. As well, among all of the industries that
make up the sector, Toronto accounts for an above-average share of
Canada’s total employment in that industry, except in the case of credit
unions. As such, Toronto remains Canada’s largest and most dominant
financial centre.
This report updates and supplements two previous reports published
by The Conference Board of Canada about Toronto’s financial sector:
Performance and Potential: Toronto’s Financial Services Sector—20143
and Ensuring the Future: Understanding the Importance of Toronto’s
Financial Services Sector.4 The purpose of this report is twofold. First,
we discuss the performance of Canada’s financial services sector versus
its peers in other countries and versus other sectors within Canada.
The metrics we consider include the sector’s financial performance,
its productivity and innovation performance, and its international trade
and investment performance. The second objective of the report is to
update our annual scorecard on the performance of Toronto’s financial
services sector. The scorecard looks at the role of the sector in Toronto’s
economy, as well as at how Toronto compares with other international
financial centres.
3 sutherland, Performance and Potential.
4 Burt, Audet, and sutherland, Ensuring the Future.
The depth and diversity of Toronto’s financial sector and its international success is reflected in its high ranking on international league tables for financial centres.
Find Conference Board research at www.e-library.ca.
CHAPTER 2
The Financial Performance of Canada’s Financial Services Sector
Chapter summary
• Compared with other Canadian sectors, financial services has experienced above-average revenue growth over the past decade, driven by the banking, securities, and life and health insurance industries.
• Financial services account for one-quarter of the profits generated by the private sector in Canada.
• Compared with their international peers, Canadian deposit-taking institutions have healthy levels of capital adequacy and liquidity, with high rates of return and low levels of non-performing loans. This contributes to Canada consistently being listed as having the soundest financial system in the world.
• despite the challenges of limited premium growth and the impact of low interest rates on investment returns, Canadian insurers generate above-average returns compared with their international peers.
Chapter 2 | The Conference Board of Canada
Find Conference Board research at www.e-library.ca. 5
There are many different financial indicators that can be examined to assess the performance of a business or sector.
Common categories for these indicators include the following:
• Profitability (including return on capital employed, profit margins,
and asset turnover)
• Liquidity (including the current ratio, inventory turnover, and
receivables turnover)
• Gearing (including the debt-to-equity ratio, and the interest
coverage ratio)
• Investor ratios (including earnings per share, and dividend yields)
Each of these ratios has different purposes, as well as dissimilar
strengths and weaknesses. For our purposes, we focus on the
profitability metrics when comparing Canada’s financial sector with
other sectors in the Canadian economy, as well as when comparing
individual industries within the sector. Many of the other indicators are
more pertinent to a particular business, such as measuring the riskiness
or the return to investing in that business.
Revenue Growth
The financial services sector is a significant contributor to the revenues
generated by all businesses in Canada. in 2014, the sector accounted
for 9.6 per cent of total private sector1 revenues generated in Canada.
Furthermore, this share has increased over the past decade: in 2004, the
sector’s share of business revenues was 9.1 per cent. Other sectors that
account for a large share of business revenues include manufacturing
(20.4 per cent), wholesale trade (17.4 per cent), retail trade (13.9 per
cent), and construction (8.2 per cent).
1 Note: Private sector revenues exclude government-related activities such as public administration, and much of the health and education sectors.
AN ENGiNE FOR GROwTH2015 Report Card on Canada and Toronto’s Financial services sector
Find Conference Board research at www.e-library.ca. 6
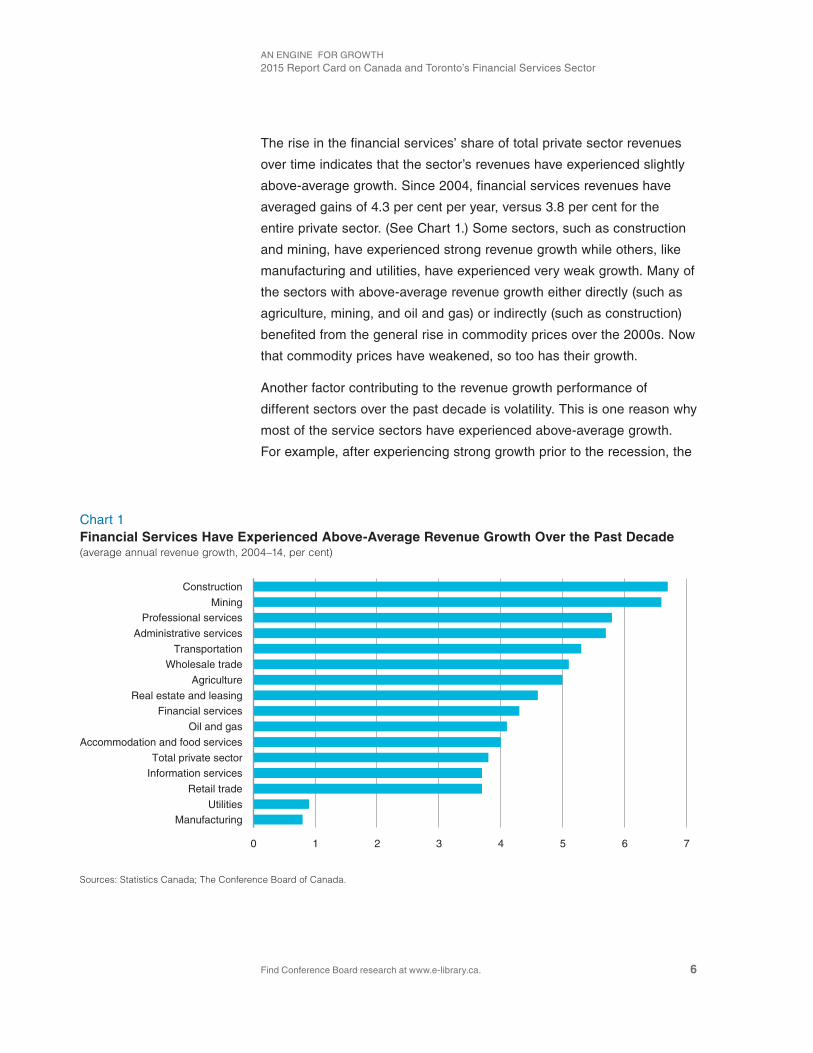
The rise in the financial services’ share of total private sector revenues
over time indicates that the sector’s revenues have experienced slightly
above-average growth. since 2004, financial services revenues have
averaged gains of 4.3 per cent per year, versus 3.8 per cent for the
entire private sector. (see Chart 1.) some sectors, such as construction
and mining, have experienced strong revenue growth while others, like
manufacturing and utilities, have experienced very weak growth. Many of
the sectors with above-average revenue growth either directly (such as
agriculture, mining, and oil and gas) or indirectly (such as construction)
benefited from the general rise in commodity prices over the 2000s. Now
that commodity prices have weakened, so too has their growth.
Another factor contributing to the revenue growth performance of
different sectors over the past decade is volatility. This is one reason why
most of the service sectors have experienced above-average growth.
For example, after experiencing strong growth prior to the recession, the
Chart 1Financial Services Have Experienced Above-Average Revenue Growth Over the Past Decade(average annual revenue growth, 2004–14, per cent)
Sources: Statistics Canada; The Conference Board of Canada.
Construction
MiningProfessional services
Administrative services
TransportationWholesale trade
Agriculture
Real estate and leasingFinancial services
Oil and gas
Accommodation and food services
Total private sectorInformation services
Retail trade
UtilitiesManufacturing
0 1 2 3 4 5 6 7

Chapter 2 | The Conference Board of Canada
Find Conference Board research at www.e-library.ca. 7
financial services sector saw revenues shrink by 7.5 per cent between
2007 and 2009. This was the largest decline in revenues during the
recessionary period among service sectors. Although financial services
revenues have subsequently more than fully recovered from the effects
of the recession, the recession-related decline limited the sector’s
revenue growth over the past decade. in addition, the recessionary dip
in financial services revenues highlights the fact that the sector is more
sensitive to economic conditions than most service industries.
However, nearly all of the goods-producing sectors experienced much
more volatility during the recession. For example, oil and gas, mining,
utilities, and manufacturing all experienced double-digit declines in sales
between 2007 and 2009. Because of the dip in commodity prices during
the recession, the oil and gas and mining sectors saw revenue declines
of 20 per cent. some other service sectors, such as transportation and
wholesale trade, also experienced sizable declines in revenues during
the recession, as they are more closely linked to activity in the goods-
producing sectors.
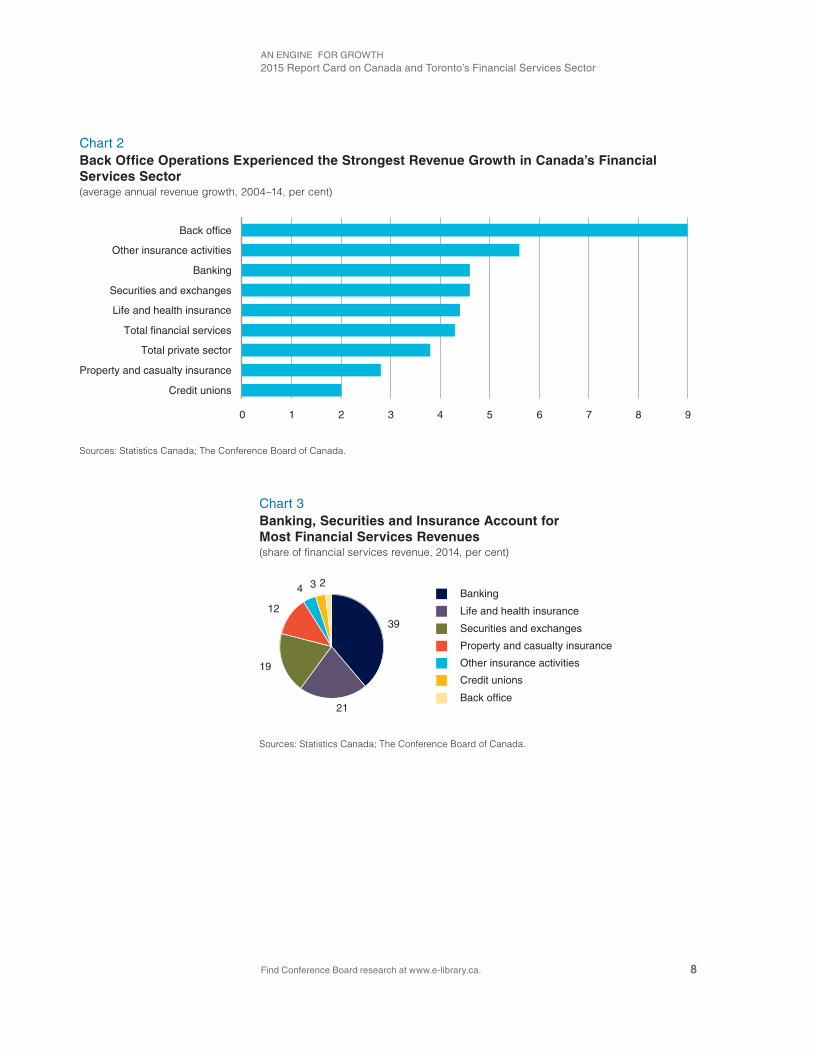
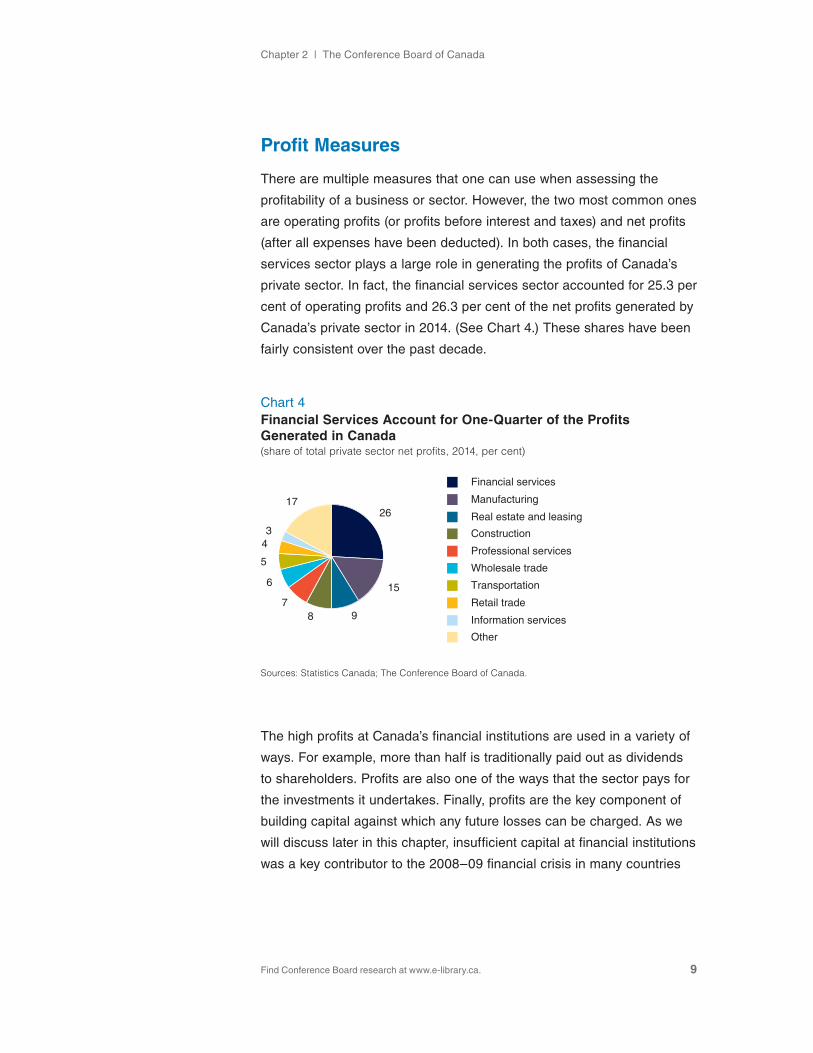
within the broad financial services sector, there are a number of
industries, such as banking, insurance, and securities. Each of these
industries has also experienced different paces of revenue growth over
the past decade. The strongest growth has occurred in the back office
industry, where revenues have risen by an average of 9 per cent per year
since 2004. (see Chart 2.) However, the back office industry accounted
for only a small share of sales, at 1.9 per cent, in 2014. Thus, the strong
back office gains have had a minimal impact on sales growth in the
broad financial services sector. (see Chart 3.)
Among the larger industries within the financial services sector, banking
(4.6 per cent), securities (4.6 per cent), and life and health insurance
(4.4 per cent) have all experienced similar revenue growth over the
past decade. But property and casualty insurance has experienced
weaker growth (2.8 per cent). Over this period, the property and casualty
insurance industry has generally experienced slow, but steady, growth.
This is indicative of a mature industry, with the Canadian market
generally well-insured.
Although financial services revenues have more than fully recovered from the effects of the recession, the recession-related decline limited the sector’s revenue growth over the past decade.
AN ENGiNE FOR GROwTH2015 Report Card on Canada and Toronto’s Financial services sector
Find Conference Board research at www.e-library.ca. 8
Chart 2Back Office Operations Experienced the Strongest Revenue Growth in Canada’s Financial Services Sector(average annual revenue growth, 2004–14, per cent)
Sources: Statistics Canada; The Conference Board of Canada.
Back office
Other insurance activities
Banking
Securities and exchanges
Life and health insurance
Total financial services
Total private sector
Property and casualty insurance
Credit unions
0 1 2 3 4 5 6 7 8 9
Chart 3Banking, Securities and Insurance Account for Most Financial Services Revenues(share of financial services revenue, 2014, per cent)
Sources: Statistics Canada; The Conference Board of Canada.
39
21
19
12
4 3 2Banking
Life and health insurance
Securities and exchanges
Property and casualty insurance
Other insurance activities
Credit unions
Back office
Chapter 2 | The Conference Board of Canada
Find Conference Board research at www.e-library.ca. 9
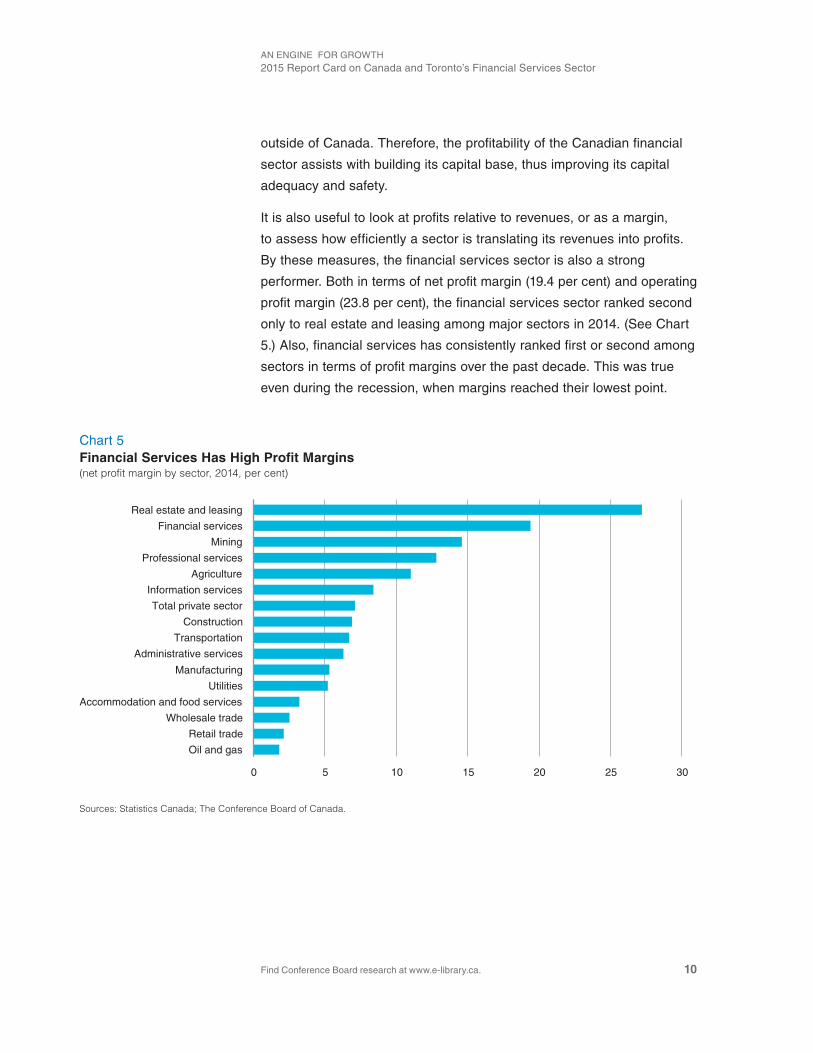
Profit Measures
There are multiple measures that one can use when assessing the
profitability of a business or sector. However, the two most common ones
are operating profits (or profits before interest and taxes) and net profits
(after all expenses have been deducted). in both cases, the financial
services sector plays a large role in generating the profits of Canada’s
private sector. in fact, the financial services sector accounted for 25.3 per
cent of operating profits and 26.3 per cent of the net profits generated by
Canada’s private sector in 2014. (see Chart 4.) These shares have been
fairly consistent over the past decade.
The high profits at Canada’s financial institutions are used in a variety of
ways. For example, more than half is traditionally paid out as dividends
to shareholders. Profits are also one of the ways that the sector pays for
the investments it undertakes. Finally, profits are the key component of
building capital against which any future losses can be charged. As we
will discuss later in this chapter, insufficient capital at financial institutions
was a key contributor to the 2008–09 financial crisis in many countries
Chart 4Financial Services Account for One-Quarter of the Profits Generated in Canada(share of total private sector net profits, 2014, per cent)
Sources: Statistics Canada; The Conference Board of Canada.
26
15
987
6
5
43
17
Financial services
Manufacturing
Real estate and leasing
Construction
Professional services
Wholesale trade
Transportation
Retail trade
Information services
Other
AN ENGiNE FOR GROwTH2015 Report Card on Canada and Toronto’s Financial services sector
Find Conference Board research at www.e-library.ca. 10
outside of Canada. Therefore, the profitability of the Canadian financial
sector assists with building its capital base, thus improving its capital
adequacy and safety.
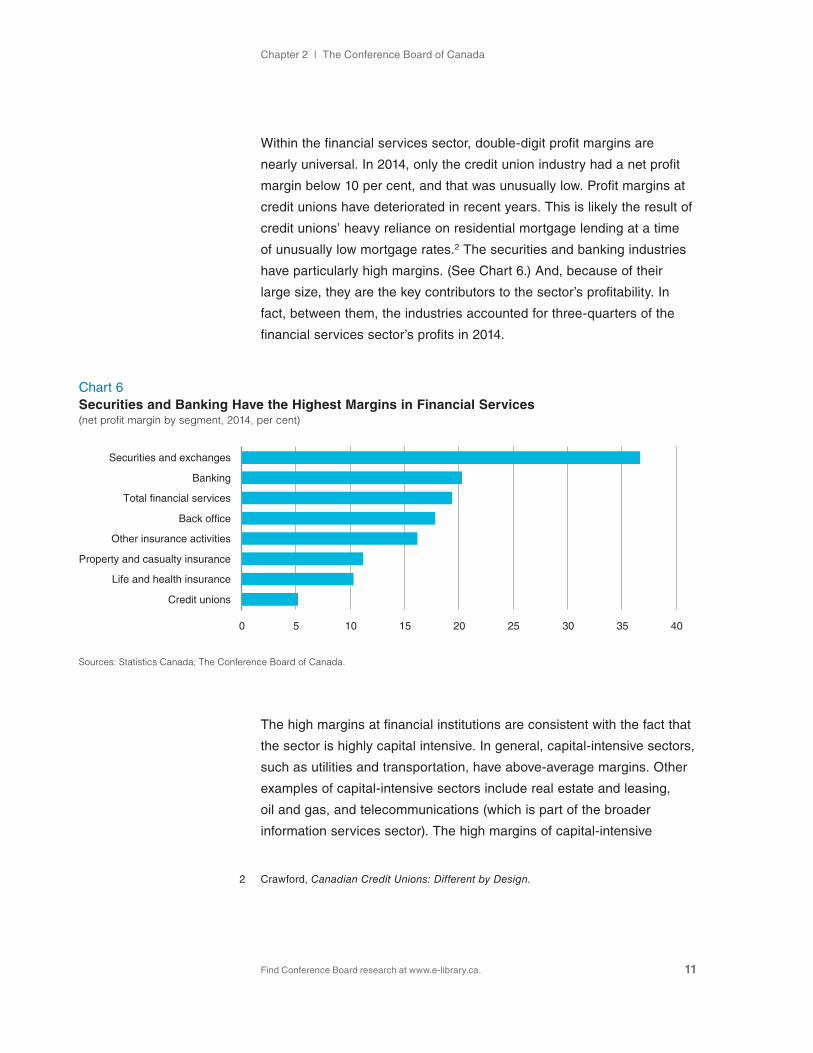
it is also useful to look at profits relative to revenues, or as a margin,
to assess how efficiently a sector is translating its revenues into profits.
By these measures, the financial services sector is also a strong
performer. Both in terms of net profit margin (19.4 per cent) and operating
profit margin (23.8 per cent), the financial services sector ranked second
only to real estate and leasing among major sectors in 2014. (see Chart
5.) Also, financial services has consistently ranked first or second among
sectors in terms of profit margins over the past decade. This was true
even during the recession, when margins reached their lowest point.
Chart 5Financial Services Has High Profit Margins(net profit margin by sector, 2014, per cent)
Sources: Statistics Canada; The Conference Board of Canada.
Real estate and leasing
Financial services
Mining
Professional services
Agriculture
Information services
Total private sector
Construction
Transportation
Administrative services
Manufacturing
Utilities
Accommodation and food services
Wholesale trade
Retail trade
Oil and gas
0 5 10 15 20 25 30
Chapter 2 | The Conference Board of Canada
Find Conference Board research at www.e-library.ca. 11
within the financial services sector, double-digit profit margins are
nearly universal. in 2014, only the credit union industry had a net profit
margin below 10 per cent, and that was unusually low. Profit margins at
credit unions have deteriorated in recent years. This is likely the result of
credit unions’ heavy reliance on residential mortgage lending at a time
of unusually low mortgage rates.2 The securities and banking industries
have particularly high margins. (see Chart 6.) And, because of their
large size, they are the key contributors to the sector’s profitability. in
fact, between them, the industries accounted for three-quarters of the
financial services sector’s profits in 2014.
The high margins at financial institutions are consistent with the fact that
the sector is highly capital intensive. in general, capital-intensive sectors,
such as utilities and transportation, have above-average margins. Other
examples of capital-intensive sectors include real estate and leasing,
oil and gas, and telecommunications (which is part of the broader
information services sector). The high margins of capital-intensive
2 Crawford, Canadian Credit Unions: Different by Design.
Chart 6Securities and Banking Have the Highest Margins in Financial Services (net profit margin by segment, 2014, per cent)
Sources: Statistics Canada; The Conference Board of Canada.
Securities and exchanges
Banking
Total financial services
Back office
Other insurance activities
Property and casualty insurance
Life and health insurance
Credit unions
0 5 10 15 20 25 30 35 40
AN ENGiNE FOR GROwTH2015 Report Card on Canada and Toronto’s Financial services sector
Find Conference Board research at www.e-library.ca. 12
industries reflect the need for these sectors to generate strong cash
flows to cover their large, upfront investments. Although the financial
services sector does not hold large amounts of physical assets, its
capital is often tied up in long-term assets such as loans or illiquid
investments. Because of the correlation between margins and capital
intensity, it is also useful to look at profitability relative to a sector’s
invested capital, which we do in the next section.
Measures of Return
Two common measures of profitability that take into account the capital
structure of a sector are return on equity (ROE) and return on capital
employed (ROCE). The key difference between the two measures is
that ROE looks only at the efficiency of generating profits on equity,
while ROCE considers both debt and equity as a source of capital.
For our purposes, ROE is defined as net profits as a share of equity,
while ROCE is defined as operating profits divided by the sum of
equity and debt.
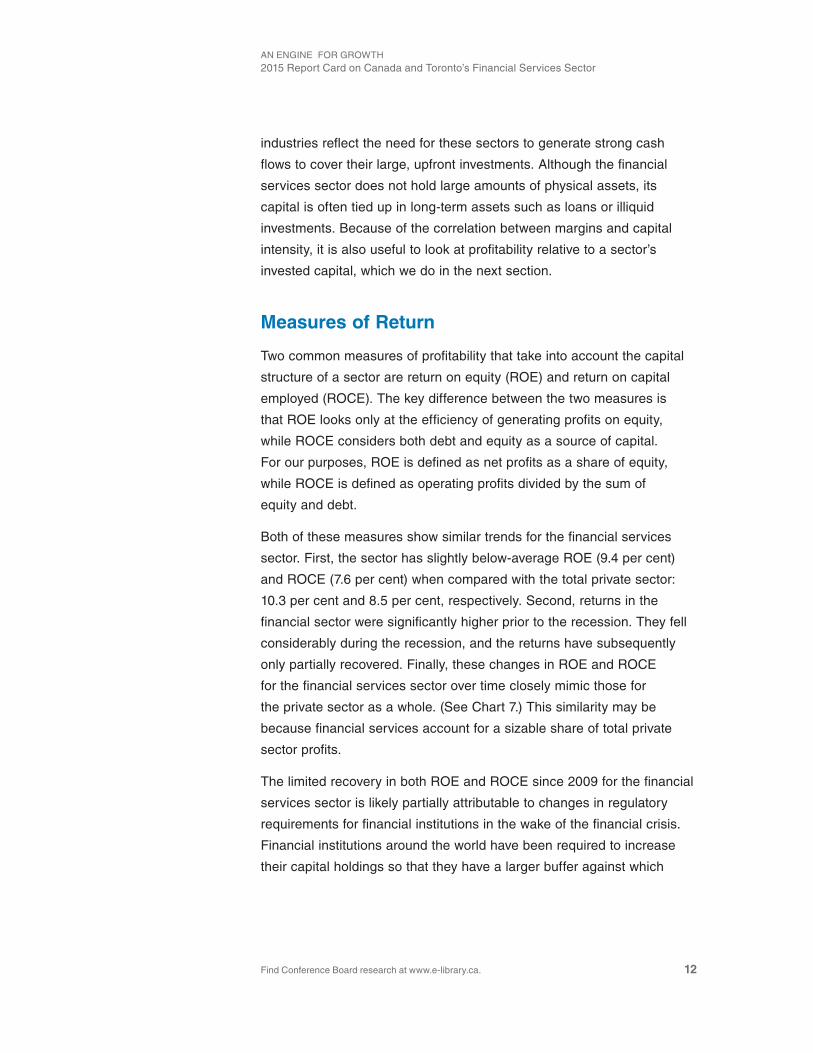
Both of these measures show similar trends for the financial services
sector. First, the sector has slightly below-average ROE (9.4 per cent)
and ROCE (7.6 per cent) when compared with the total private sector:
10.3 per cent and 8.5 per cent, respectively. second, returns in the
financial sector were significantly higher prior to the recession. They fell
considerably during the recession, and the returns have subsequently
only partially recovered. Finally, these changes in ROE and ROCE
for the financial services sector over time closely mimic those for
the private sector as a whole. (see Chart 7.) This similarity may be
because financial services account for a sizable share of total private
sector profits.
The limited recovery in both ROE and ROCE since 2009 for the financial
services sector is likely partially attributable to changes in regulatory
requirements for financial institutions in the wake of the financial crisis.
Financial institutions around the world have been required to increase
their capital holdings so that they have a larger buffer against which
Chapter 2 | The Conference Board of Canada
Find Conference Board research at www.e-library.ca. 13
they can write off losses. The intent of these regulatory changes is to
reduce systemic risk in the financial services sector, but it does have
the side effect of reducing returns on capital. in essence, the profits of
each financial institution are now being compared against a larger capital
base, reducing ROE and ROCE.
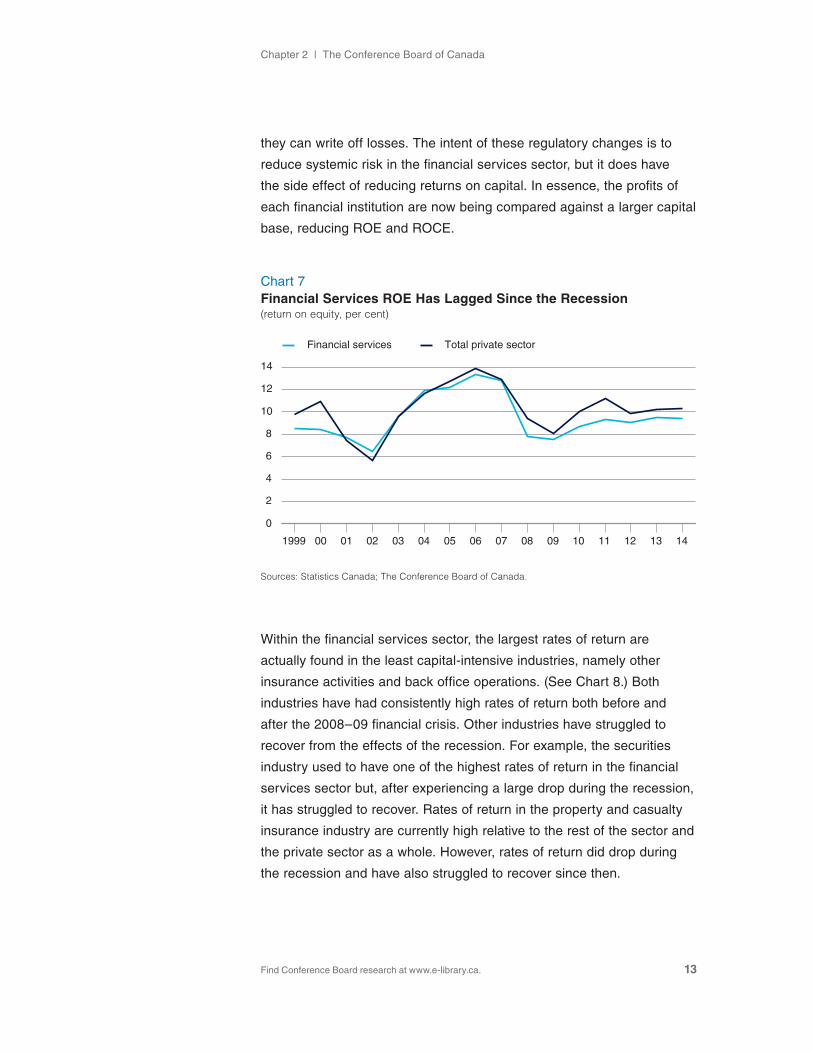
within the financial services sector, the largest rates of return are
actually found in the least capital-intensive industries, namely other
insurance activities and back office operations. (see Chart 8.) Both
industries have had consistently high rates of return both before and
after the 2008–09 financial crisis. Other industries have struggled to
recover from the effects of the recession. For example, the securities
industry used to have one of the highest rates of return in the financial
services sector but, after experiencing a large drop during the recession,
it has struggled to recover. Rates of return in the property and casualty
insurance industry are currently high relative to the rest of the sector and
the private sector as a whole. However, rates of return did drop during
the recession and have also struggled to recover since then.
Chart 7Financial Services ROE Has Lagged Since the Recession(return on equity, per cent)
Sources: Statistics Canada; The Conference Board of Canada.
1999 10 11 12 13 14
0
2
4
6
8
10
12
14
Financial services Total private sector
00 01 02 03 04 05 06 07 08 09
AN ENGiNE FOR GROwTH2015 Report Card on Canada and Toronto’s Financial services sector
Find Conference Board research at www.e-library.ca. 14
The weakest performers in terms of ROE for the financial services
sector are credit unions, and life and health insurance. Both industries
historically had higher ROEs, but they have trended down over the past
10 years. This trend is most prominent in the credit union industry, where
the ROE has fallen from 14.1 per cent in 2004 to 2.7 per cent in 2014.
As previously mentioned, the industry’s high dependence on residential
mortgages for revenues, combined with a prolonged period of low
interest rates, is likely the major factor contributing to this change.
Financial Stability Indicators
The Canadian financial system is often cited as being one of the
soundest in the world.3 A key reason for this is the strong financial
performance of the Canadian sector compared with its international
peers. One of the ways this performance can be assessed is by
examining the Financial stability indicators (Fsis) for deposit-taking
3 world Economic Forum, The Global Competitiveness Repor, 2014–2015.
Chart 8ROE Is Highest in the Least Capital-Intensive Industries(return on equity, per cent)
Sources: Statistics Canada; The Conference Board of Canada.
Other insurance activities
Back office
Property and casualty insurance
Private sector
Banking
Securities and exchanges
Total financial services
Life and health insurance
Credit unions
0 5 10 15 20 25

Chapter 2 | The Conference Board of Canada
Find Conference Board research at www.e-library.ca. 15
institutions that are set out by the international Monetary Fund (iMF).4
Fsis provide a snapshot of how well prepared deposit-taking institutions
are to meet unexpected external shocks and how they have increased in
prominence since the financial crisis of 2007–08.
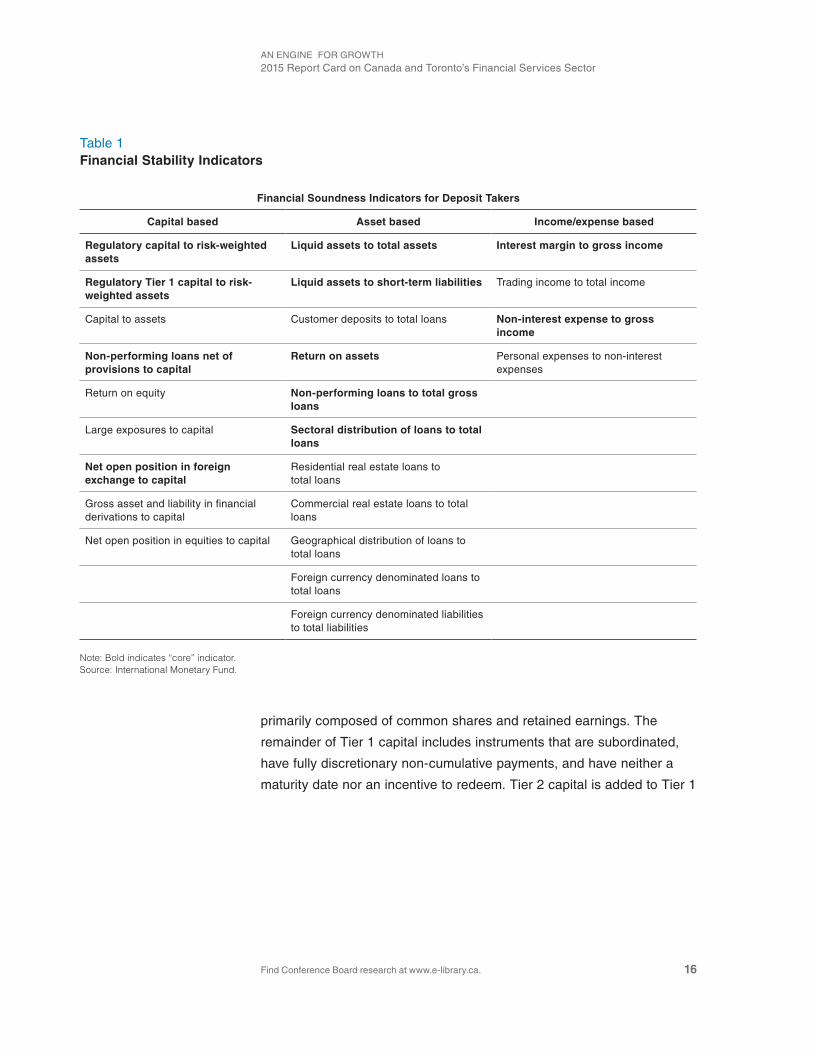
some of the Fsis listed in the current iMF Compilation Guide on
Financial Soundness Indicators predate the financial crisis, while others
have been added only recently through amendments to the guide.5
Fsis are listed as either a “core” or “encouraged” indicator of financial
soundness and are a key source of information for those who wish to
conduct macroprudential analysis. (see Table 1.) in theory, an analysis
conducted using Fsis raises the probability of detecting trends that
threaten financial systems or increase systemic risk. These risks can
then be mitigated before reaching crisis levels as they did in the U.s.
housing crash and leading into the sovereign debt crisis in western
Europe. For our purposes, we will focus on the core indicators.
Measures of Capital AdequacyOne of the principal causes of the 2007–08 financial crisis was the lack
of high-quality capital to support excessive on- and off-balance sheet
leverage.6 Consequently, commercial banks in many countries outside
of Canada were unable to absorb the systemic trading and credit losses
that ensued from the crisis. Therefore, to address the lack of available
capital during the financial crisis, regulators on the Basel Committee on
Banking supervision strengthened the capital requirements in december
2010 under the Third Basel Accord (commonly known as Basel iii).
Basel iii requirements sought to increase “the quality, consistency, and
transparency of the capital base.”7 To meet the objective of increasing
the quality of the capital base, Basel iii defined two forms of capital.
Tier 1 capital is defined as the principal source of bank capital and is
4 international Monetary Fund, Financial Soundness Indicators: Compilation Guide.
5 ibid.
6 Bank of international settlements, Basel III.
7 ibid.
AN ENGiNE FOR GROwTH2015 Report Card on Canada and Toronto’s Financial services sector
Find Conference Board research at www.e-library.ca. 16
primarily composed of common shares and retained earnings. The
remainder of Tier 1 capital includes instruments that are subordinated,
have fully discretionary non-cumulative payments, and have neither a
maturity date nor an incentive to redeem. Tier 2 capital is added to Tier 1
Table 1Financial Stability Indicators
Financial Soundness Indicators for Deposit Takers
Capital based Asset based Income/expense based
Regulatory capital to risk-weighted assets
Liquid assets to total assets Interest margin to gross income
Regulatory Tier 1 capital to risk-weighted assets
Liquid assets to short-term liabilities Trading income to total income
Capital to assets Customer deposits to total loans Non-interest expense to gross income
Non-performing loans net of provisions to capital
Return on assets Personal expenses to non-interest expenses
Return on equity Non-performing loans to total gross loans
Large exposures to capital Sectoral distribution of loans to total loans
Net open position in foreign exchange to capital
Residential real estate loans to total loans
Gross asset and liability in financial derivations to capital
Commercial real estate loans to total loans
Net open position in equities to capital Geographical distribution of loans to total loans
Foreign currency denominated loans to total loans
Foreign currency denominated liabilities to total liabilities
Note: Bold indicates “core” indicator.Source: International Monetary Fund.
Chapter 2 | The Conference Board of Canada
Find Conference Board research at www.e-library.ca. 17
capital to produce Total Regulatory Capital, with Tier 3 capital phased-
out under Basel iii. Tier 2 capital includes items such as subordinated
debt instruments.8
The capital measures under Basel iii are often measured against risk-
weighted assets (RwA). Under the RwA, assets are weighted according
to their relative riskiness. safe assets, such as cash and highly rated
government debt, have a weight of zero per cent. This suggests that
the bank does not need to hold capital against these assets because
it is very unlikely that these assets will deteriorate in value.9 Those
assets that are secured by residential real estate, such as residential
mortgages, typically have a weight of 35 per cent with higher weights
applied to loans with a high loan-to-value ratio. Past-due loans and
securities that are below investment grade can be weighted in excess of
100 per cent.
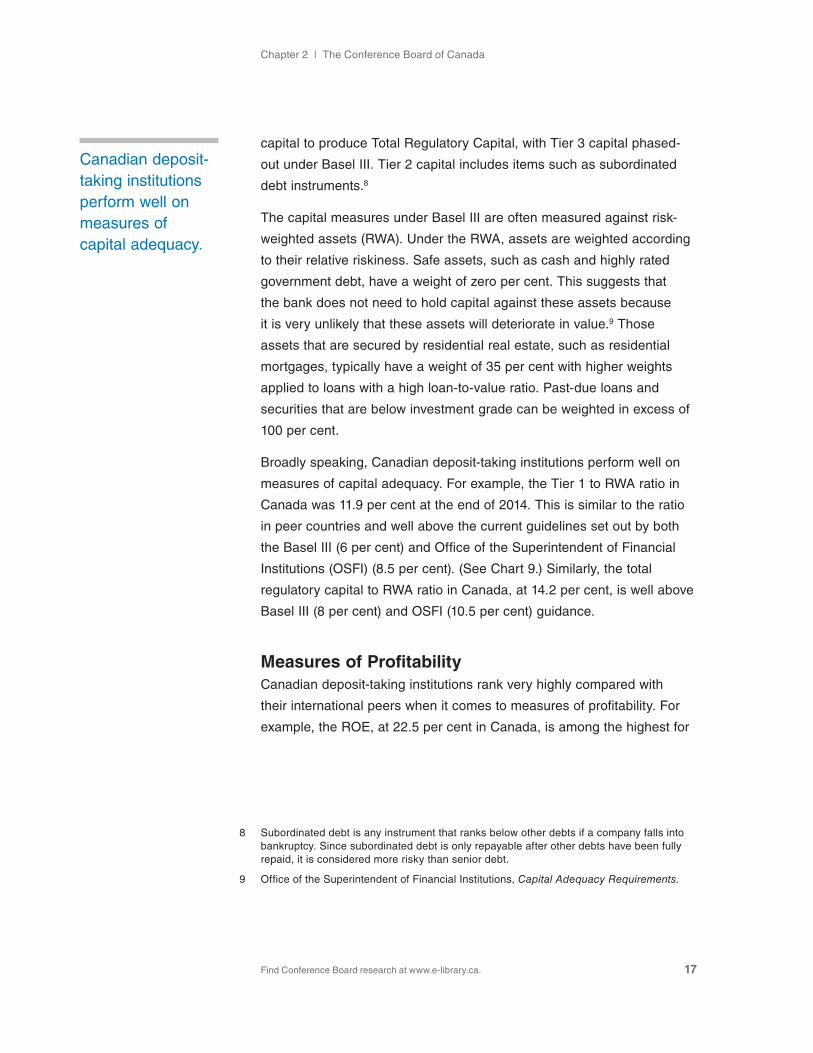
Broadly speaking, Canadian deposit-taking institutions perform well on
measures of capital adequacy. For example, the Tier 1 to RwA ratio in
Canada was 11.9 per cent at the end of 2014. This is similar to the ratio
in peer countries and well above the current guidelines set out by both
the Basel iii (6 per cent) and Office of the superintendent of Financial
institutions (OsFi) (8.5 per cent). (see Chart 9.) similarly, the total
regulatory capital to RwA ratio in Canada, at 14.2 per cent, is well above
Basel iii (8 per cent) and OsFi (10.5 per cent) guidance.
Measures of ProfitabilityCanadian deposit-taking institutions rank very highly compared with
their international peers when it comes to measures of profitability. For
example, the ROE, at 22.5 per cent in Canada, is among the highest for
8 subordinated debt is any instrument that ranks below other debts if a company falls into bankruptcy. since subordinated debt is only repayable after other debts have been fully repaid, it is considered more risky than senior debt.
9 Office of the superintendent of Financial institutions, Capital Adequacy Requirements.
Canadian deposit-taking institutions perform well on measures of capital adequacy.
AN ENGiNE FOR GROwTH2015 Report Card on Canada and Toronto’s Financial services sector
Find Conference Board research at www.e-library.ca. 18
countries that contain one or more major global financial centres.10
(see Chart 10.) similarly, the return on assets (ROA) in Canada stood at
1.1 per cent at the end of 2014; among the countries shown in Chart 10,
only Australia and singapore are higher. The high level of ROE and ROA
for Canadian deposit-taking institutions, in combination with their healthy
level of capital adequacy, suggests that they are using their capital very
efficiently. As well, the healthy level of profitability has the added benefit
of generating additional capital in the form of retained earnings for use
against any future losses.
One measure of profitability where Canadian deposit-taking institutions
compare less favourably to their peers is interest margin as a share of
gross income. At 51.3 per cent, the ratio in Canada is generally lower
10 The iMF measure of ROE uses operating income rather than net income. That is why it is significantly higher than the ROE for Canadian financial institutions reported in the previous section.
Chart 9Deposit-Taking Institutions in Canada Have More Than Sufficient Capital(Tier 1 capital to RWA for selected countries, 2014 Q4 or most recent, per cent)
Source: International Monetary Fund.
Germany
Switzerland
Hong Kong
Singapore
France
United States
United Kingdom
Japan
Canada
Italy
South Korea
Australia
OSFI
Basel III
0 2 4 6 8 10 12 14 16
Chapter 2 | The Conference Board of Canada
Find Conference Board research at www.e-library.ca. 19
than what we see in most other developed countries. However, this ratio
can be impacted by many things, such as the asset mix of the reporting
firms. if a firm’s asset mix is less concentrated on loans and instead
more focused on other financial activities, all else being equal, this
ratio will be lower. The loans to deposits ratio is also a very important
determinant of the interest margin ratio, but this can vary considerably
over time and across countries. As such, given its strong performance
for other measures of profitability, a low-interest margin ratio in Canada
likely reflects different structural characteristics among its deposit-taking
institutions rather than a cause for concern.
since profitability is impacted not only by revenues but also by costs,
it is equally important to look at the expense performance for deposit-
taking institutions. Non-interest expense as a share of gross income is
one measure identified by the iMF that helps to determine the amount of
Chart 10Deposit-Taking Institutions in Canada Have a High ROE(ROE for selected countries, 2014 Q4 or most recent, per cent)
Source: International Monetary Fund.
Canada
Australia
Singapore
Hong Kong
Switzerland
Japan
United Kingdom
France
Germany
South Korea
United States
Italy
0 5 10 15 20 25

AN ENGiNE FOR GROwTH2015 Report Card on Canada and Toronto’s Financial services sector
Find Conference Board research at www.e-library.ca. 20
administrative expenses (i.e., expenses accrued that are not related to
lending or borrowing activities). Thus, it is a measure by which we can
judge how efficiently deposit-taking institutions deliver their services.
By this measure, Canadian financial institutions generally compare
favourably to many of their peers. At 62.8 per cent, Canadian firms
generally have a higher non-interest expense ratio than we see
in Asian countries such as singapore (44.5 per cent), Hong Kong
(48.9 per cent), and south Korea (59.9 per cent). However, Canada
compares favourably with the U.s. (64.7 per cent) and many European
countries such as the U.K. (67.0 per cent), Germany (69.1 per cent),
and switzerland (69.4 per cent).
Measures of LiquidityLiquidity metrics are designed to measure to what extent financial
institutions can meet expected, and unexpected, demands for cash.
Low levels of liquidity could indicate that an institution, or the system in
aggregate, is vulnerable to external shocks that cause a rapid withdrawal
of funds (or a rapid slowdown in deposit growth). Conversely, higher
liquidity ratios provide the system a higher margin of safety. The iMF
considers two measures of liquidity to be core measures of financial
soundness: the ratio of liquid assets to total assets (liquidity ratio) and
the ratio of liquid assets to short-term liabilities (liability coverage ratio).
At 11 per cent, the liquidity ratio for Canadian deposit-taking institutions
is currently low; only a few small developed countries (such as sweden
and Norway) have a lower ratio. By way of comparison, the liquidity ratio
is 14.5 per cent in the United states and 25.5 per cent in the United
Kingdom. On the surface, this would suggest that Canadian institutions
are less able to deal with shocks to liquidity. However, Canada’s liabilities
coverage ratio is less concerning.
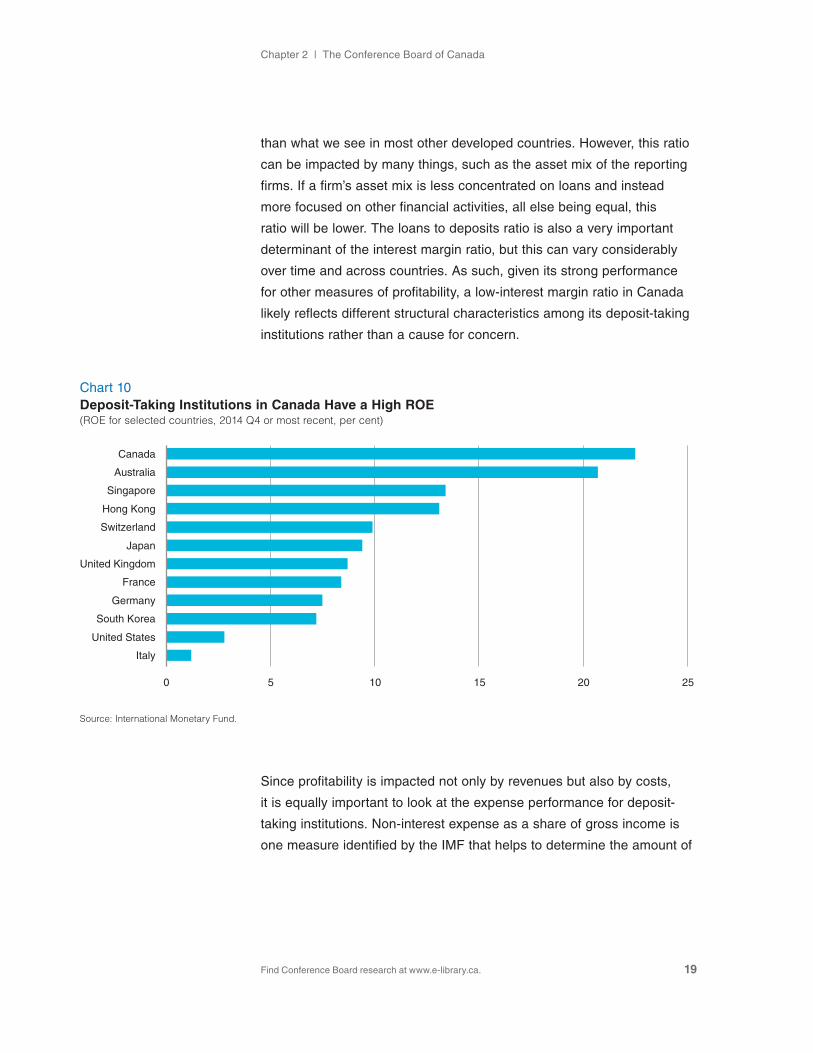
At 50.5 per cent, Canada’s liabilities coverage ratio is higher than some
peer countries, and lower than others. (see Chart 11.) The liabilities
coverage ratio “is intended to capture the liquidity mismatch of assets
Chapter 2 | The Conference Board of Canada
Find Conference Board research at www.e-library.ca. 21
and liabilities.”11 in other words, it assesses the degree to which an
institution has liquid or short-term assets matched with short-term
liabilities, such as demand deposits. As such, it likely better represents
the ability of deposit-taking institutions to manage unexpected and
significant withdrawals of cash without creating a liquidity crisis.
Measures of Loan PerformanceThe other major type of indicator included in the Fsi measures loan
performance, which assesses the relative size of non-performing loans
(NPLs). since NPLs are a major source of losses for deposit-taking
institutions, the purpose of these metrics is to assess the capacity of the
institution to absorb such losses. in general, Canada has a very low level
of NPL; its share of total loans is only 0.5 per cent, the lowest among
peer countries. (see Chart 12.)
11 international Monetary Fund, Financial Soundness Indicators: Compilation Guide, 83.
Chart 11Liquidity Is Adequate for Deposit-Taking Institutions in Canada(liabilities’ coverage ratio for selected countries, 2014 Q4 or most recent, per cent)
Source: International Monetary Fund.
Germany
Italy
South Korea
United States
Singapore
France
Canada
Switzerland
Hong Kong
Australia
United Kingdom
Japan
0 20 40 60 80 100 120 140 160
AN ENGiNE FOR GROwTH2015 Report Card on Canada and Toronto’s Financial services sector
Find Conference Board research at www.e-library.ca. 22
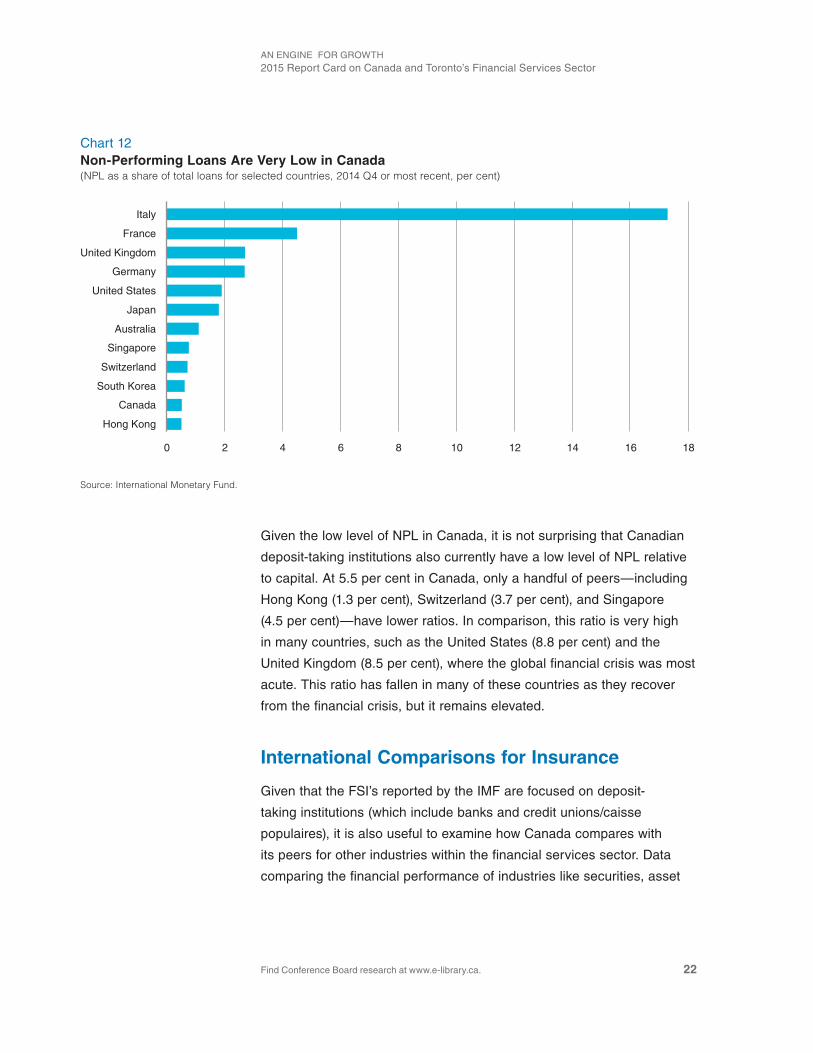
Given the low level of NPL in Canada, it is not surprising that Canadian
deposit-taking institutions also currently have a low level of NPL relative
to capital. At 5.5 per cent in Canada, only a handful of peers—including
Hong Kong (1.3 per cent), switzerland (3.7 per cent), and singapore
(4.5 per cent)—have lower ratios. in comparison, this ratio is very high
in many countries, such as the United states (8.8 per cent) and the
United Kingdom (8.5 per cent), where the global financial crisis was most
acute. This ratio has fallen in many of these countries as they recover
from the financial crisis, but it remains elevated.
International Comparisons for Insurance
Given that the Fsi’s reported by the iMF are focused on deposit-
taking institutions (which include banks and credit unions/caisse
populaires), it is also useful to examine how Canada compares with
its peers for other industries within the financial services sector. data
comparing the financial performance of industries like securities, asset
Chart 12Non-Performing Loans Are Very Low in Canada(NPL as a share of total loans for selected countries, 2014 Q4 or most recent, per cent)
Source: International Monetary Fund.
Italy
France
United Kingdom
Germany
United States
Japan
Australia
Singapore
Switzerland
South Korea
Canada
Hong Kong
0 2 4 6 8 10 12 14 16 18
Chapter 2 | The Conference Board of Canada
Find Conference Board research at www.e-library.ca. 23
management, and back offices across countries is scarce. However, the
OECd does publish financial indicators for the insurance industry by
country. This section of the report examines these statistics.
insurance premium growth across different countries is driven by three
factors. The first is broad economic growth, with premium growth
generally being weak in countries with poor economic conditions,
and vice versa. The second factor is the penetration rate of insurance
products: where penetration rates are low, growth tends to be stronger.
This is why emerging markets generally see much stronger premium
growth than developed countries. Finally, regulatory changes, such as
changes in what is mandatory coverage for automobile insurance, can
also have an impact on premium growth in specific countries.
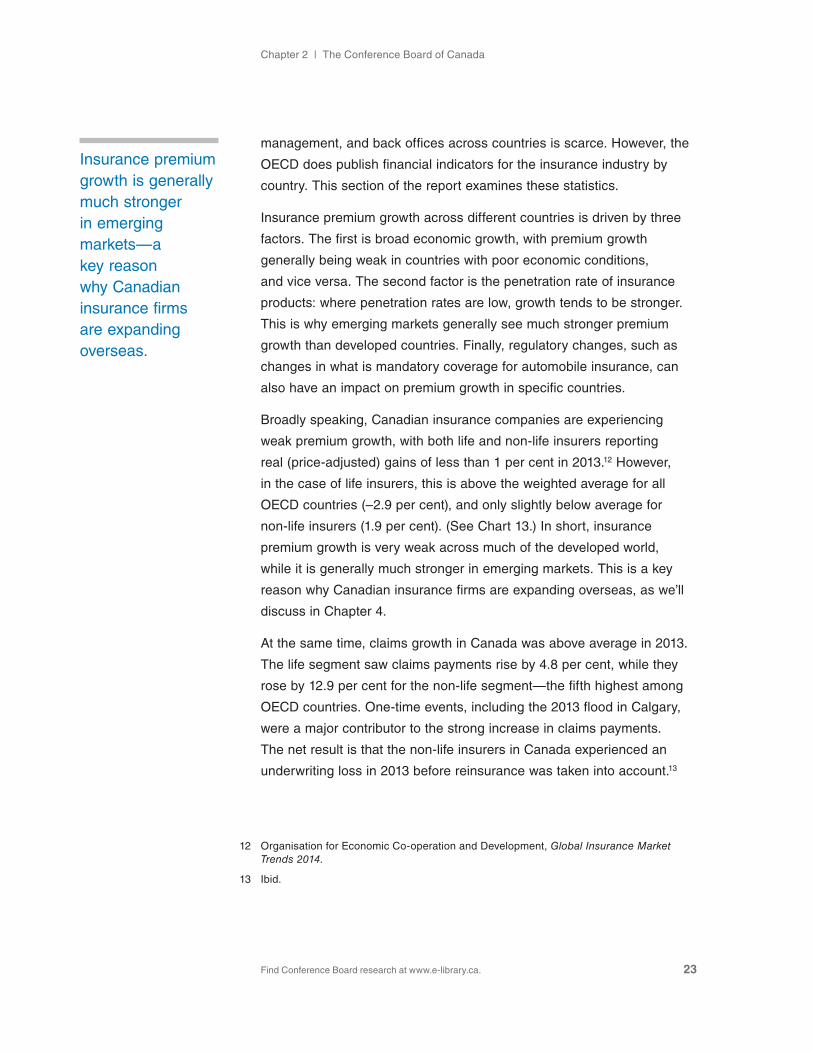
Broadly speaking, Canadian insurance companies are experiencing
weak premium growth, with both life and non-life insurers reporting
real (price-adjusted) gains of less than 1 per cent in 2013.12 However,
in the case of life insurers, this is above the weighted average for all
OECd countries (–2.9 per cent), and only slightly below average for
non-life insurers (1.9 per cent). (see Chart 13.) in short, insurance
premium growth is very weak across much of the developed world,
while it is generally much stronger in emerging markets. This is a key
reason why Canadian insurance firms are expanding overseas, as we’ll
discuss in Chapter 4.
At the same time, claims growth in Canada was above average in 2013.
The life segment saw claims payments rise by 4.8 per cent, while they
rose by 12.9 per cent for the non-life segment—the fifth highest among
OECd countries. One-time events, including the 2013 flood in Calgary,
were a major contributor to the strong increase in claims payments.
The net result is that the non-life insurers in Canada experienced an
underwriting loss in 2013 before reinsurance was taken into account.13
12 Organisation for Economic Co-operation and development, Global Insurance Market Trends 2014.
13 ibid.
insurance premium growth is generally much stronger in emerging markets—a key reason why Canadian insurance firms are expanding overseas.
AN ENGiNE FOR GROwTH2015 Report Card on Canada and Toronto’s Financial services sector
Find Conference Board research at www.e-library.ca. 24
However, the reported underwriting loss for Canadian non-life insurers
highlights a couple of issues that are specific to the industry. First,
profitability in the industry can be volatile from year to year depending
on the frequency and severity of the very events the industry is designed
to protect policy-holders from. second, premiums are not the only source
of revenues for insurers; they derive a significant share of their earnings
from their investments. Although the low interest rate environment has
made it more challenging for insurers to generate revenues from their
investments, they can be used to smooth the impacts of volatility in
claims on profitability.
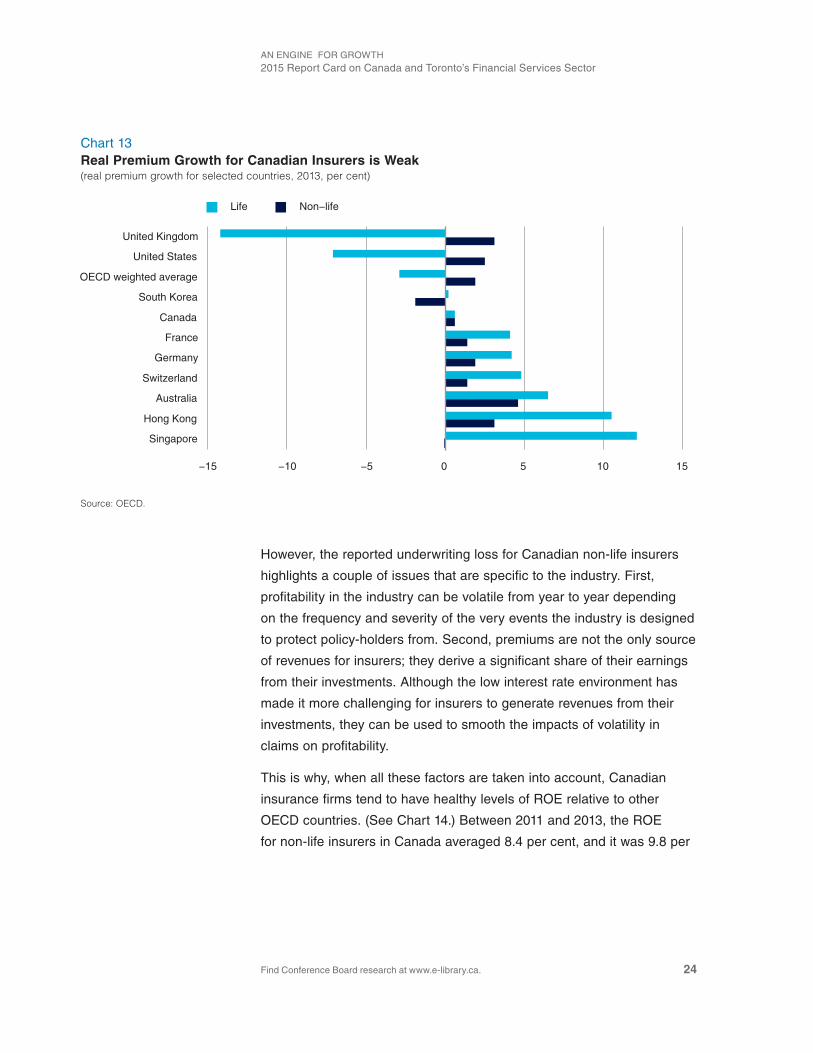
This is why, when all these factors are taken into account, Canadian
insurance firms tend to have healthy levels of ROE relative to other
OECd countries. (see Chart 14.) Between 2011 and 2013, the ROE
for non-life insurers in Canada averaged 8.4 per cent, and it was 9.8 per
Chart 13Real Premium Growth for Canadian Insurers is Weak(real premium growth for selected countries, 2013, per cent)
Source: OECD.
Singapore
Hong Kong
Australia
Switzerland
Germany
France
Canada
South Korea
OECD weighted average
United States
United Kingdom
−15 −10 −5 0 5 10 15
Life Non−life
Chapter 2 | The Conference Board of Canada
Find Conference Board research at www.e-library.ca. 25
cent for life insurers.14 This is above the average for many peer countries,
such as the United states and the United Kingdom. As such, Canadian
insurance providers have been able to maintain their profitability relative
to their peers in other countries despite the challenges they have faced.
14 The Canadian life ROE figures used here are reported as “composite” rather than “life” in the OECd data. This is because most Canadian life insurers are categorized as composite in the OECd data.
Chart 14Canadian Insurers Have Above-Average ROE Relative to Their Peers(average ROE for insurance providers for selected countries, 2011–13, per cent)
Source: OECD.
Switzerland
South Korea
Canada
United States
France
United Kingdom
Germany
Singapore
−15 −10 −5 0 5 10 15 20
Non-life Life

Find Conference Board research at www.e-library.ca.
CHAPTER 3
The Productivity and Innovation Performance of the Financial Services Sector
Chapter summary
• Canada’s financial services sector is innovative. According to statistics Canada’s survey of innovation and Business strategy, 73.6 per cent of financial services firms had undertaken some form of innovation in the previous year versus 63.5 per cent for all sectors.
• The most common forms of innovation undertaken by the sector include organizational and marketing innovations.
• The sector’s innovations have only partially translated into labour productivity growth. Gains in the sector have been below average versus other sectors in Canada, and moderate when compared with the financial services sectors of peer countries. However, Canada has outperformed some countries that host major global financial centres, such as the United Kingdom and Germany.
• One potential factor limiting productivity growth in the sector is that it already has an above- average level of productivity, and it is harder to grow from a high level.

Chapter 3 | The Conference Board of Canada
Find Conference Board research at www.e-library.ca. 27
Productivity is the single most important determinant of a country’s per capita income over the longer term. Countries that are innovative and able to adapt to the ebb and flow of the new global economy boast high productivity, and thus a superior standard of living. As such, understanding Canada’s productivity performance and the factors influencing i, is a key part of keeping Canada on the path of long-term economic growth.
Productivity is a measure of how efficiently goods and services are
produced, and the productivity of an economy or a sector can be
measured in different ways. For our purposes, we assess the labour
productivity of different sectors and countries. Labour productivity is
defined as the amount of output (or GdP) produced for every hour of
work. Labour productivity levels can be influenced by a variety of factors
such as the skill level and educational attainment of the workforce,
as well as the quality of the capital assets (such as machinery and
equipment, and information technology) that is available for workers.
Broadly speaking, Canada’s labour productivity performance has been
poor for many years. For example, among the 34 OECd countries,
Canada ranked 23rd in terms of labour productivity performance over
the period 2000 to 2014.1 A key factor limiting Canada’s productivity
performance has been a low rate of investment in machinery and
equipment, particularly in information and communications technology.
Low rates of investment in research and development, poor performance
on measures of innovation, and limited inward foreign direct investment
also contribute to Canada’s weak labour productivity performance.2
1 Based on calculations from the OECd productivity statistics database.
2 The Conference Board of Canada, How Canada Performs: Labour Productivity Growth.
AN ENGiNE FOR GROwTH2015 Report Card on Canada and Toronto’s Financial services sector
Find Conference Board research at www.e-library.ca. 28
International Comparisons of Financial Services Productivity Performance
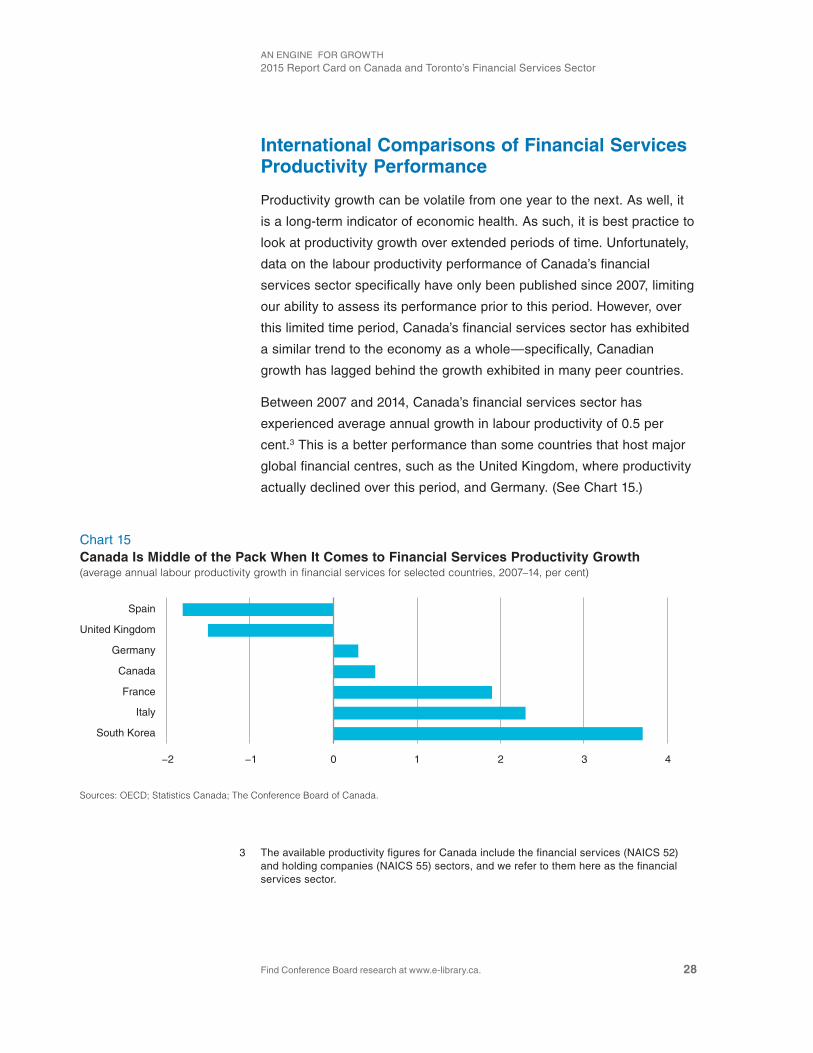
Productivity growth can be volatile from one year to the next. As well, it
is a long-term indicator of economic health. As such, it is best practice to
look at productivity growth over extended periods of time. Unfortunately,
data on the labour productivity performance of Canada’s financial
services sector specifically have only been published since 2007, limiting
our ability to assess its performance prior to this period. However, over
this limited time period, Canada’s financial services sector has exhibited
a similar trend to the economy as a whole—specifically, Canadian
growth has lagged behind the growth exhibited in many peer countries.
Between 2007 and 2014, Canada’s financial services sector has
experienced average annual growth in labour productivity of 0.5 per
cent.3 This is a better performance than some countries that host major
global financial centres, such as the United Kingdom, where productivity
actually declined over this period, and Germany. (see Chart 15.)
3 The available productivity figures for Canada include the financial services (NAiCs 52) and holding companies (NAiCs 55) sectors, and we refer to them here as the financial services sector.
Chart 15Canada Is Middle of the Pack When It Comes to Financial Services Productivity Growth(average annual labour productivity growth in financial services for selected countries, 2007–14, per cent)
Sources: OECD; Statistics Canada; The Conference Board of Canada.
South Korea
Italy
France
Canada
Germany
United Kingdom
Spain
−2 −1 0 1 2 3 4

Chapter 3 | The Conference Board of Canada
Find Conference Board research at www.e-library.ca. 29
However, it is below the growth exhibited in other countries, such as
France and south Korea. Canada’s performance was also essentially
on par with that of the broader European Union (0.6 per cent).
The exact cause for Canada’s middle of the pack performance in
financial services labour productivity growth is not easy to identify. One
potential factor may be that Canada already has an above-average level
of productivity, and it is harder to grow from a high level. However, this
should not lead to complacency, as continued weak relative growth in
Canada could allow other countries to catch up.
Another potential factor influencing the relative growth rates in labour
productivity across countries for the financial services sector is the mix
of activities undertaken in each country and how they may be changing.
For example, higher average wages per employee are an indicator of
higher productivity. This would imply that activities such as investment
banking are more productive than back office operations or retail
banking, for example. if a country has high relative concentrations in
high-productivity activities like investment banking, it will tend to have
high levels of productivity. similarly, a country that is experiencing strong
growth in high-productivity activities will contribute to robust productivity
growth in that country. Thus, if much of the financial services growth in
Canada is occurring in less productive activities, productivity growth for
the whole sector would be limited.
However, limited investment in machinery and equipment in the
Canadian financial services sector in recent years is likely a contributing
factor to the slow productivity growth. On a price-adjusted basis, total
financial services investment in Canada plunged by 40 per cent between
2007 and 2009, with nearly all of that decline occurring in machinery and
equipment investment.4 This is not surprising, as the decline occurred
during the financial crisis. what is surprising is that the recovery in the
sector’s investment spending has subsequently been very modest. Total
investment is still 35 per cent below its pre-recession peak—even though
4 see CANsiM table 031-0005.
AN ENGiNE FOR GROwTH2015 Report Card on Canada and Toronto’s Financial services sector
Find Conference Board research at www.e-library.ca. 30
the sector’s finances have recovered from the effects of the financial
crisis. Thus, the limited pace of investment is likely limiting the sector’s
productivity growth.
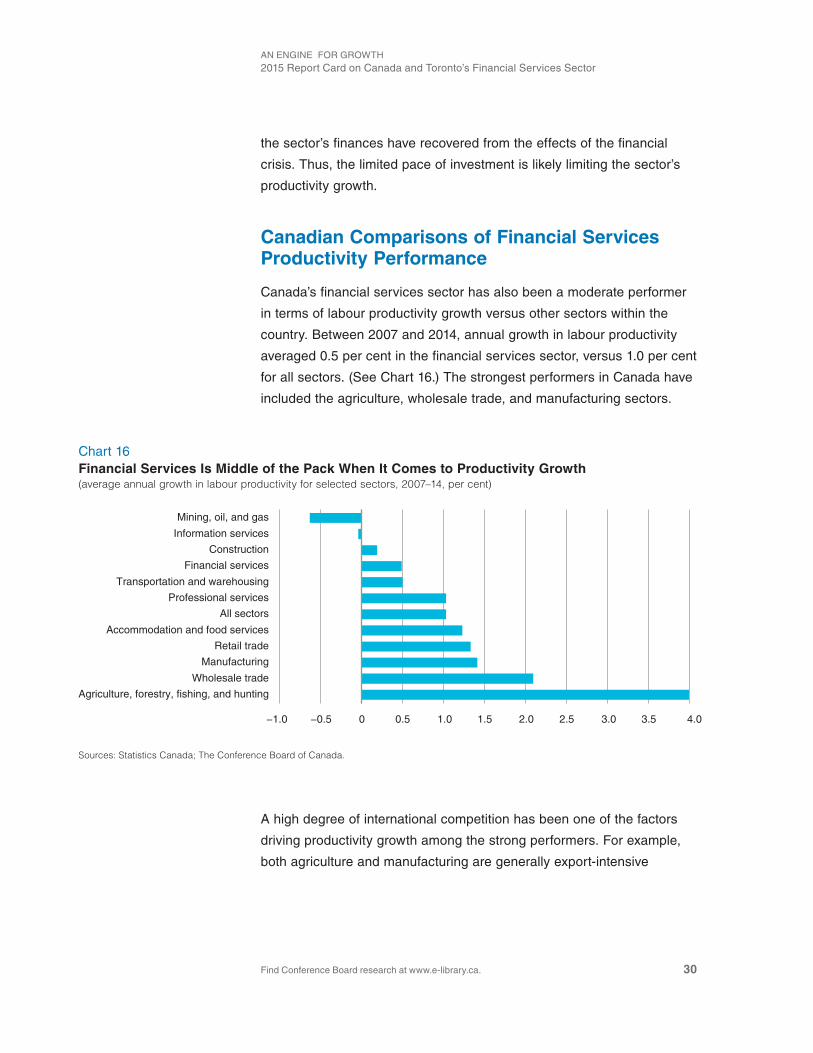
Canadian Comparisons of Financial Services Productivity Performance
Canada’s financial services sector has also been a moderate performer
in terms of labour productivity growth versus other sectors within the
country. Between 2007 and 2014, annual growth in labour productivity
averaged 0.5 per cent in the financial services sector, versus 1.0 per cent
for all sectors. (see Chart 16.) The strongest performers in Canada have
included the agriculture, wholesale trade, and manufacturing sectors.
A high degree of international competition has been one of the factors
driving productivity growth among the strong performers. For example,
both agriculture and manufacturing are generally export-intensive
Chart 16Financial Services Is Middle of the Pack When It Comes to Productivity Growth(average annual growth in labour productivity for selected sectors, 2007–14, per cent)
Sources: Statistics Canada; The Conference Board of Canada.
Agriculture, forestry, fishing, and hunting
Wholesale trade
Manufacturing
Retail trade
Accommodation and food services
All sectors
Professional services
Transportation and warehousing
Financial services
Construction
Information services
Mining, oil, and gas
−0.5 0 0.5 1.0−1.0 1.5 2.0 2.5 3.0 3.5 4.0

Chapter 3 | The Conference Board of Canada
Find Conference Board research at www.e-library.ca. 31
and had to increase productivity to maintain their competitiveness. As
well, agriculture, in particular, has benefited from robust investment in
machinery equipment, with the capital stock per worker rising strongly
in this sector.
At the opposite end of the spectrum, the largest decline in labour
productivity occurred in the mining, oil and gas sector. despite heavy
investment in the sector, productivity has been in decline as a result of
two things. The first is the changing mix in production, with products
like the oil sands requiring many more inputs to produce a given level
of output. As well, extraction sectors, such as mining, are impacted by
the fact that the most economical to exploit resources are extracted first,
before companies move on to second or third best options. Over time,
this means the sector needs to work harder to produce each unit of
production, even if production is not rising.
Financial Services Productivity Performance Across Provinces
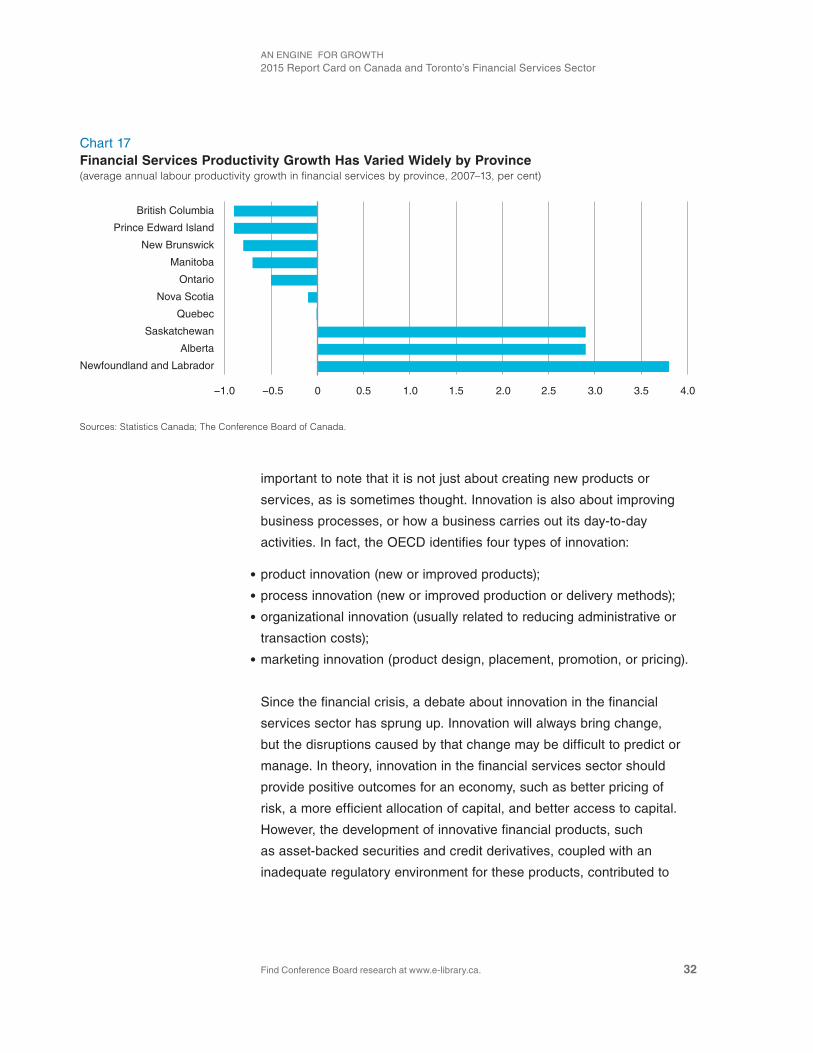
within Canada, there is considerable variation across the provinces
in terms of labour productivity growth for the financial services sector.
some provinces, such as Newfoundland and Labrador, Alberta, and
saskatchewan, experienced very strong growth, while others saw
declines. (see Chart 17.) One factor that likely contributed to the strong
productivity growth in specific provinces is the strong wage growth
experienced over the period examined in all three of those provinces.
strong wage appreciation likely leads financial services firms in those
provinces to find ways to produce more with fewer people.
Innovation Performance
Given the sector’s moderate productivity performance, it would be
useful to understand more about innovation in the sector. innovation is
key to maintaining and improving the competitiveness of any business,
and productivity improvement is one of the measurable outcomes of
successful innovation. in any conversation about innovation, it is also
The largest decline in labour productivity occurred in the mining, oil and gas sector, despite heavy investment.
AN ENGiNE FOR GROwTH2015 Report Card on Canada and Toronto’s Financial services sector
Find Conference Board research at www.e-library.ca. 32
important to note that it is not just about creating new products or
services, as is sometimes thought. innovation is also about improving
business processes, or how a business carries out its day-to-day
activities. in fact, the OECd identifies four types of innovation:
• product innovation (new or improved products);
• process innovation (new or improved production or delivery methods);
• organizational innovation (usually related to reducing administrative or
transaction costs);
• marketing innovation (product design, placement, promotion, or pricing).
since the financial crisis, a debate about innovation in the financial
services sector has sprung up. innovation will always bring change,
but the disruptions caused by that change may be difficult to predict or
manage. in theory, innovation in the financial services sector should
provide positive outcomes for an economy, such as better pricing of
risk, a more efficient allocation of capital, and better access to capital.
However, the development of innovative financial products, such
as asset-backed securities and credit derivatives, coupled with an
inadequate regulatory environment for these products, contributed to
Chart 17Financial Services Productivity Growth Has Varied Widely by Province(average annual labour productivity growth in financial services by province, 2007–13, per cent)
Sources: Statistics Canada; The Conference Board of Canada.
Newfoundland and Labrador
Alberta
Saskatchewan
Quebec
Nova Scotia
Ontario
Manitoba
New Brunswick
Prince Edward Island
British Columbia
−1.0 −0.5 0 0.5 1.0 1.5 2.0 2.5 3.0 3.5 4.0

Chapter 3 | The Conference Board of Canada
Find Conference Board research at www.e-library.ca. 33
the financial crisis.5 The result was not good for the financial services
sector in much of the world, nor for the broader economies in which the
crisis unfolded.
indeed, the two-sided nature of financial innovation was highlighted
in one recent study.6 The authors found that high levels of financial
innovation in a country lead to positive outcomes, such as higher levels
of capital invested per employee and stronger per capita GdP growth.
However, high levels of financial innovation were also linked with bank
fragility, economic volatility, and higher bank losses during the financial
crisis. As such, a measured pace to financial innovation—with a focus
on customer benefits and in cooperation with regulators in order to
reduce systemic risk—may be the best approach.
That said, a key challenge for anyone wishing to understand the
impacts of innovation must first overcome the difficulties of measuring
it. Researchers often use indicators like research and development
spending, or patents, as a proxy for innovation. But, these may be
more pertinent for some sectors than others. For example, the financial
services sector rarely takes out patents for its innovative business
practices, nor generally is the sector a major spender on formal R&d.
However, this does not mean that the sector is not innovative.
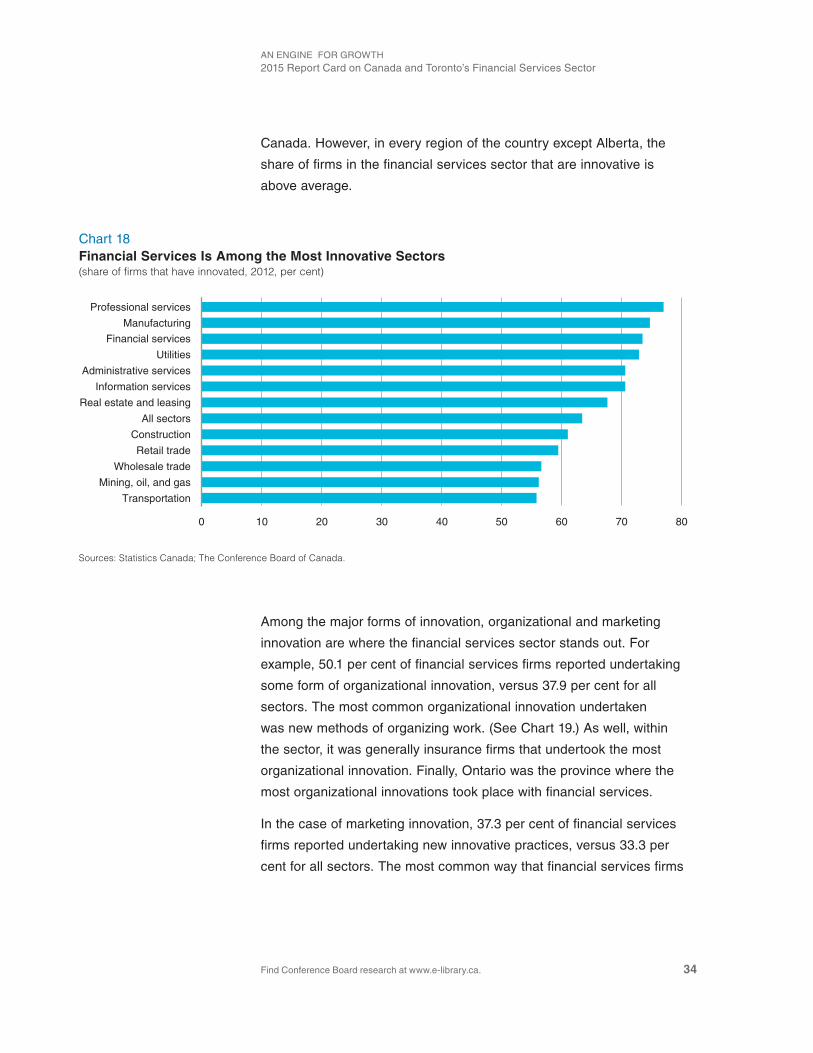
This is apparent when we examine the results of statistics Canada’s
survey of innovation and Business strategy, a periodic survey that
looks at the innovation practices of Canadian businesses. For example,
according to the survey, 73.6 per cent of financial services firms had
undertaken some form of innovation in the previous year, versus
63.5 per cent for all sectors. (see Chart 18.) Only the manufacturing and
professional services sectors reported a higher share of innovative firms.
within financial services, the most innovative firms are found in Ontario
and British Columbia, while innovation was lowest in Alberta and Atlantic
5 world Economic Forum, Rethinking Financial Innovation.
6 Beck and others, Financial Innovation: The Bright and Dark Sides.
AN ENGiNE FOR GROwTH2015 Report Card on Canada and Toronto’s Financial services sector
Find Conference Board research at www.e-library.ca. 34
Canada. However, in every region of the country except Alberta, the
share of firms in the financial services sector that are innovative is
above average.
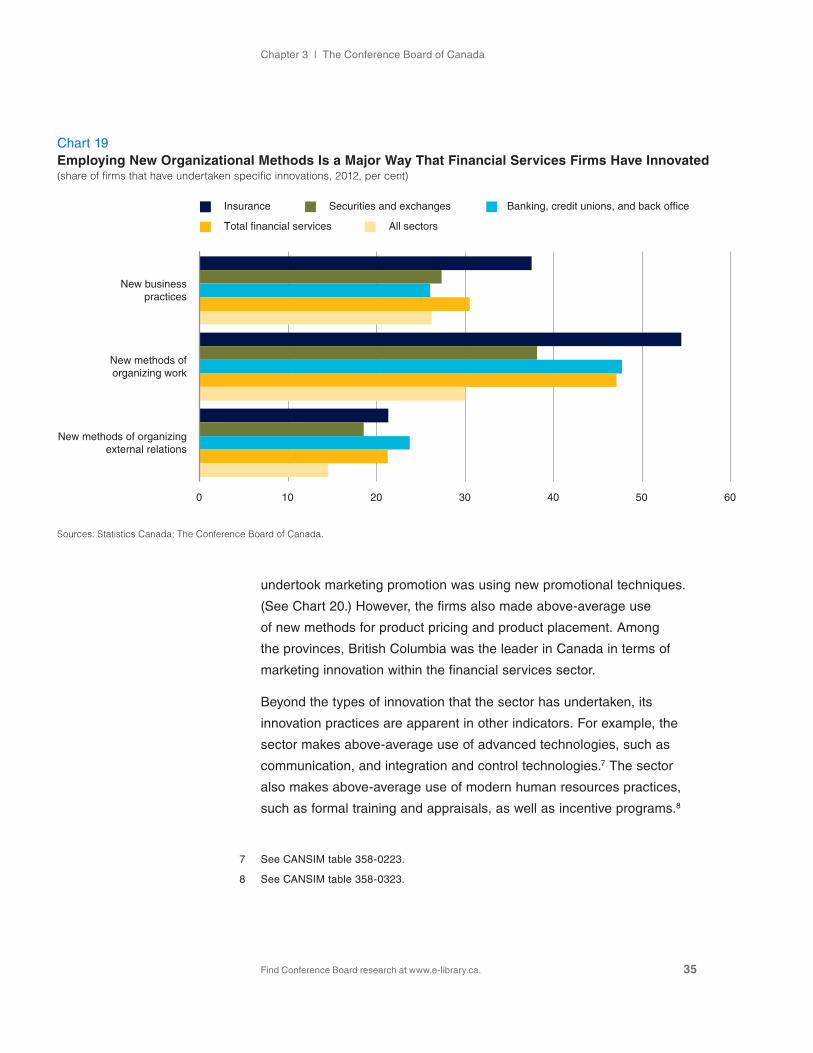
Among the major forms of innovation, organizational and marketing
innovation are where the financial services sector stands out. For
example, 50.1 per cent of financial services firms reported undertaking
some form of organizational innovation, versus 37.9 per cent for all
sectors. The most common organizational innovation undertaken
was new methods of organizing work. (see Chart 19.) As well, within
the sector, it was generally insurance firms that undertook the most
organizational innovation. Finally, Ontario was the province where the
most organizational innovations took place with financial services.
in the case of marketing innovation, 37.3 per cent of financial services
firms reported undertaking new innovative practices, versus 33.3 per
cent for all sectors. The most common way that financial services firms
Chart 18Financial Services Is Among the Most Innovative Sectors(share of firms that have innovated, 2012, per cent)
Sources: Statistics Canada; The Conference Board of Canada.
Professional services
Manufacturing
Financial services
Utilities
Administrative services
Information services
Real estate and leasing
All sectors
Construction
Retail trade
Wholesale trade
Mining, oil, and gas
Transportation
0 10 20 30 40 50 60 70 80
Chapter 3 | The Conference Board of Canada
Find Conference Board research at www.e-library.ca. 35
undertook marketing promotion was using new promotional techniques.
(see Chart 20.) However, the firms also made above-average use
of new methods for product pricing and product placement. Among
the provinces, British Columbia was the leader in Canada in terms of
marketing innovation within the financial services sector.
Beyond the types of innovation that the sector has undertaken, its
innovation practices are apparent in other indicators. For example, the
sector makes above-average use of advanced technologies, such as
communication, and integration and control technologies.7 The sector
also makes above-average use of modern human resources practices,
such as formal training and appraisals, as well as incentive programs.8
7 see CANsiM table 358-0223.
8 see CANsiM table 358-0323.
Chart 19Employing New Organizational Methods Is a Major Way That Financial Services Firms Have Innovated(share of firms that have undertaken specific innovations, 2012, per cent)
Sources: Statistics Canada; The Conference Board of Canada.
New methods of organizingexternal relations
New methods oforganizing work
New businesspractices
0 10 20 30 40 50 60
Insurance Securities and exchanges Banking, credit unions, and back office
Total financial services All sectors
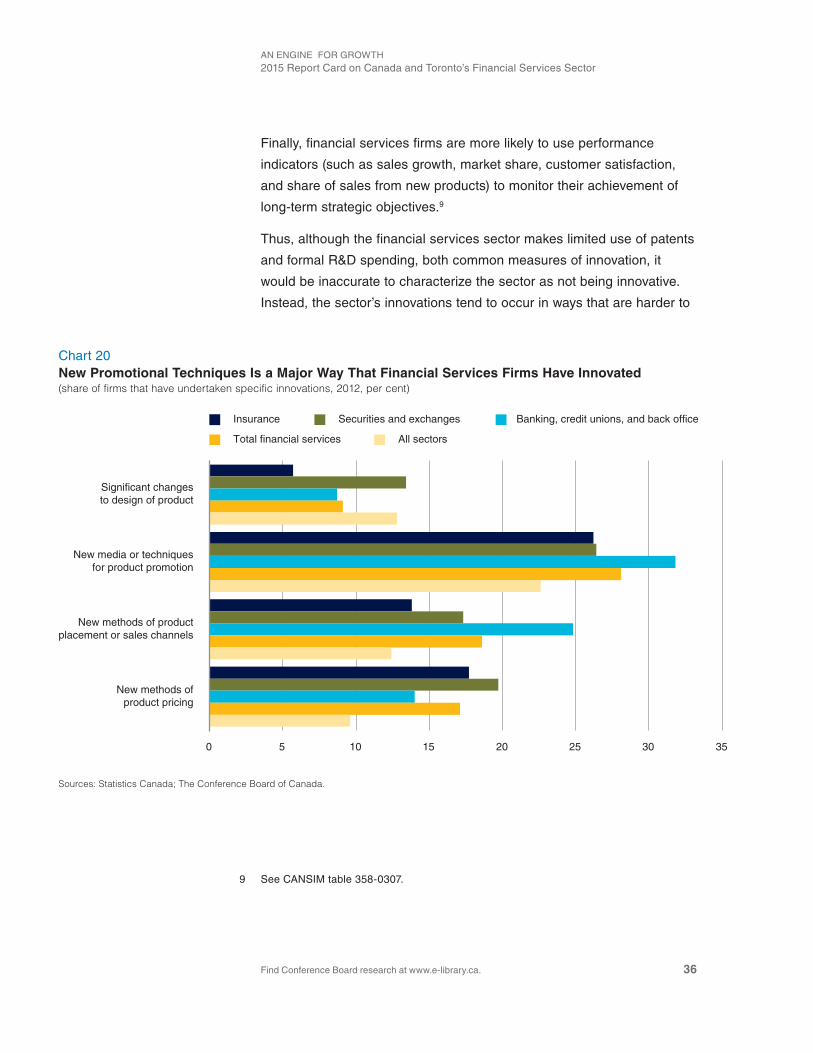
AN ENGiNE FOR GROwTH2015 Report Card on Canada and Toronto’s Financial services sector
Find Conference Board research at www.e-library.ca. 36
Finally, financial services firms are more likely to use performance
indicators (such as sales growth, market share, customer satisfaction,
and share of sales from new products) to monitor their achievement of
long-term strategic objectives.9
Thus, although the financial services sector makes limited use of patents
and formal R&d spending, both common measures of innovation, it
would be inaccurate to characterize the sector as not being innovative.
instead, the sector’s innovations tend to occur in ways that are harder to
9 see CANsiM table 358-0307.
Chart 20New Promotional Techniques Is a Major Way That Financial Services Firms Have Innovated(share of firms that have undertaken specific innovations, 2012, per cent)
Sources: Statistics Canada; The Conference Board of Canada.
New methods ofproduct pricing
New methods of productplacement or sales channels
New media or techniquesfor product promotion
Significant changesto design of product
0 5 10 15 20 25 30 35
Insurance Securities and exchanges Banking, credit unions, and back office
Total financial services All sectors

Chapter 3 | The Conference Board of Canada
Find Conference Board research at www.e-library.ca. 37
observe, such as how their businesses are organized. The challenge for
this sector going forward will be to translate these innovative business
practices into even stronger productivity growth.
Find Conference Board research at www.e-library.ca.
CHAPTER 4
Canada’s Financial Sector in a Global Context
Chapter summary
• Foreign affiliates are the principal avenue by which Canadian financial institutions provide financial services to overseas customers. Foreign affiliate sales have been consistently more than 10 times the size of exports.
• Establishing overseas presence has been made possible thanks to foreign direct investment. Canada’s stock of direct investment abroad in the financial services sector has more than quadrupled in the past 15 years, reaching $435 billion in 2014—twice the amount of financial services’ Fdi in Canada.
• Canadian exports of financial services have more than tripled since 1999, one of the strongest growth profiles among Canadian sectors. in large part, growth has been driven by the significant increase in exports of “other financial services,” which include items such as securities issuance and trading, and asset management services.
Chapter 4 | The Conference Board of Canada
Find Conference Board research at www.e-library.ca. 39
Canadian financial institutions are serving the financial needs of Canadians, but also those of international customers. In the past decade, Canada’s financial sector has significantly increased its footprint in global markets. This has been accomplished by selling directly to international customers from the sector’s Canadian offices and through establishing a physical presence in foreign countries. In fact, having a local presence in foreign markets is the principal avenue for Canadian financial institutions to provide financial services to international customers. Sales through foreign affiliates are, on average, nine times greater than the value of financial services exports.
This chapter looks at the latest trends in Canada’s financial services
trade through foreign affiliate sales and exports—the two main
channels used to reach international customers. Exporting financial
services directly contributes to economic growth and job creation in
Canada, and foreign affiliate sales raise the revenues and profits of
the parent companies—thus benefiting all Canadians holding shares
in those institutions. Having a presence abroad also contributes to the
international reputation of Canadian financial institutions and of the
Canadian financial system.
Having a local presence in foreign markets is the principal avenue for Canadian financial institutions to provide financial services to international customers.

AN ENGiNE FOR GROwTH2015 Report Card on Canada and Toronto’s Financial services sector
Find Conference Board research at www.e-library.ca. 40
Building a Global Presence Through Foreign Affiliates
Canadian financial firms have a significant out-of-country presence, as
measured by foreign affiliate sales data from statistics Canada.1 Foreign
affiliates are the principal avenue for Canadian financial institutions
to provide financial services to overseas customers. As such, foreign
affiliate sales are much larger than financial services exports. For
example, financial services exports have been equivalent to less than
10 per cent of foreign affiliate sales since 1999, when data were first
published. in other words, the value of services supplied by affiliates
abroad of Canadian financial institutions has been, on average, more
than 10 times the value of financial services exports.
There are many benefits to doing business through foreign affiliates; for
example, profits generated through sales by foreign affiliates directly
benefit Canada by contributing to the gross national income. in addition,
through establishing a local presence abroad, Canadian firms can
expand market share, provide better service for their foreign customers,
and improve their competitiveness within global value chains.
Foreign affiliate sales in the financial services sector have experienced
robust growth over the past decade, more than doubling between 1999
and 2012 and reaching close to $100 billion. in comparison, foreign
affiliate sales for all Canadian companies rose by 60 per cent and for all
service-oriented companies by 83 per cent over the same period. (see
Chart 21.) As a result, the financial services sector represents a steadily
growing segment of Canada’s foreign affiliate sales, rising from 13 to 20
per cent between 1999 and 2012.
The increasing volume of foreign affiliate sales attests to the fact that
Canadian financial institutions have been developing their commercial
presence around the world, and that presence has been growing by
1 For our purposes, we combine the data for the financial services (NAiCs 52) and holding companies (NAiCs 55) sectors, and refer to them as the financial services sector. we do this because financial institutions often use holding companies to set up and operate their foreign affiliates.
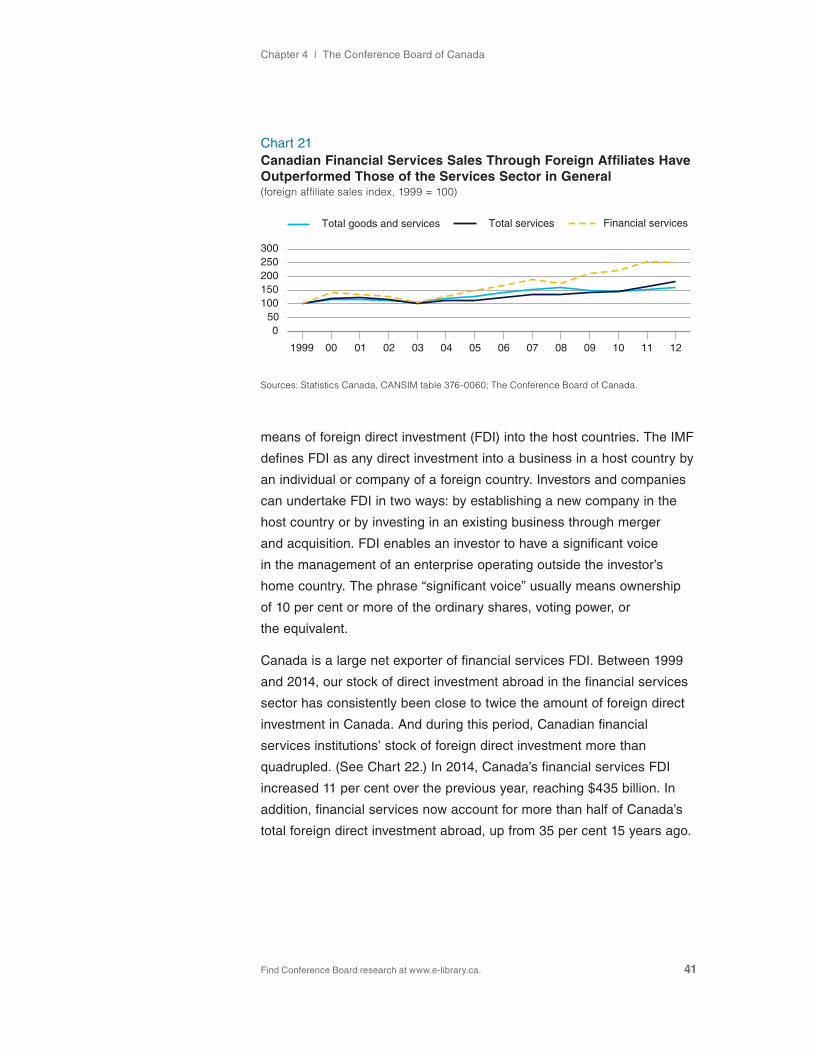
Chapter 4 | The Conference Board of Canada
Find Conference Board research at www.e-library.ca. 41
means of foreign direct investment (Fdi) into the host countries. The iMF
defines Fdi as any direct investment into a business in a host country by
an individual or company of a foreign country. investors and companies
can undertake Fdi in two ways: by establishing a new company in the
host country or by investing in an existing business through merger
and acquisition. Fdi enables an investor to have a significant voice
in the management of an enterprise operating outside the investor’s
home country. The phrase “significant voice” usually means ownership
of 10 per cent or more of the ordinary shares, voting power, or
the equivalent.
Canada is a large net exporter of financial services Fdi. Between 1999
and 2014, our stock of direct investment abroad in the financial services
sector has consistently been close to twice the amount of foreign direct
investment in Canada. And during this period, Canadian financial
services institutions’ stock of foreign direct investment more than
quadrupled. (see Chart 22.) in 2014, Canada’s financial services Fdi
increased 11 per cent over the previous year, reaching $435 billion. in
addition, financial services now account for more than half of Canada’s
total foreign direct investment abroad, up from 35 per cent 15 years ago.
Chart 21Canadian Financial Services Sales Through Foreign Affiliates Have Outperformed Those of the Services Sector in General(foreign affiliate sales index, 1999 = 100)
Sources: Statistics Canada, CANSIM table 376-0060; The Conference Board of Canada.
1999 00
050
100150200250300
Total goods and services Total services Financial services
01 02 03 04 05 06 07 08 09 10 11 12
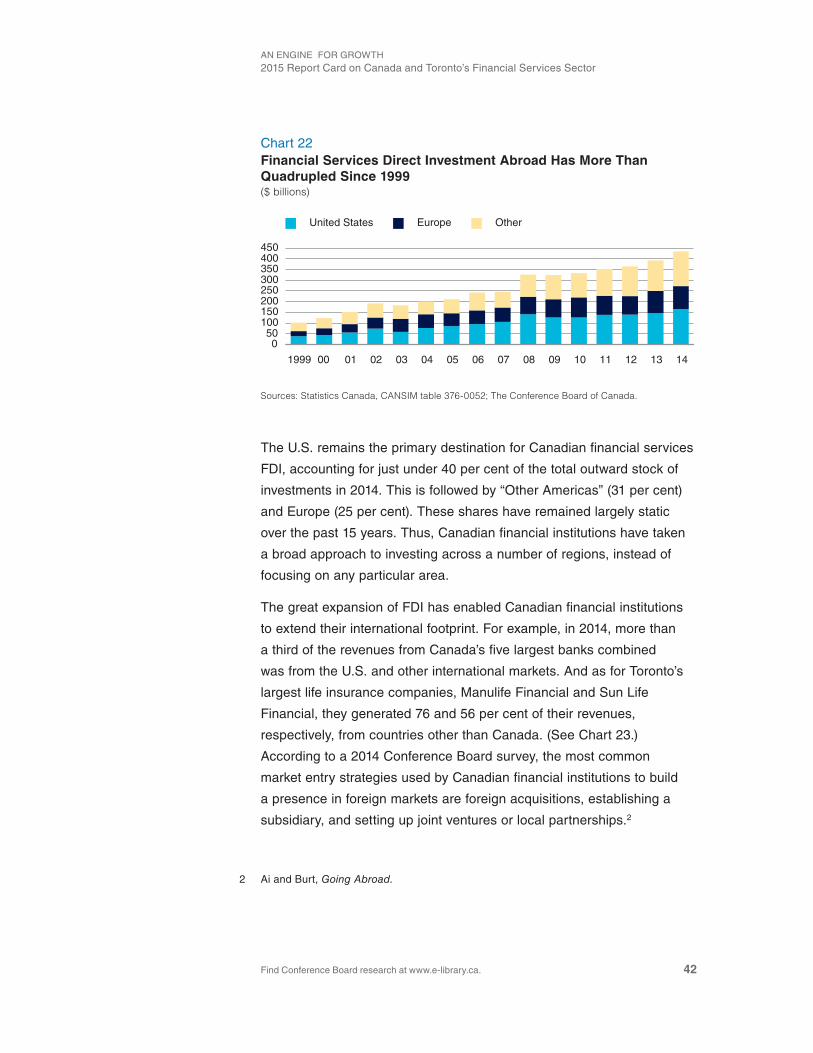
AN ENGiNE FOR GROwTH2015 Report Card on Canada and Toronto’s Financial services sector
Find Conference Board research at www.e-library.ca. 42
The U.s. remains the primary destination for Canadian financial services
Fdi, accounting for just under 40 per cent of the total outward stock of
investments in 2014. This is followed by “Other Americas” (31 per cent)
and Europe (25 per cent). These shares have remained largely static
over the past 15 years. Thus, Canadian financial institutions have taken
a broad approach to investing across a number of regions, instead of
focusing on any particular area.
The great expansion of Fdi has enabled Canadian financial institutions
to extend their international footprint. For example, in 2014, more than
a third of the revenues from Canada’s five largest banks combined
was from the U.s. and other international markets. And as for Toronto’s
largest life insurance companies, Manulife Financial and sun Life
Financial, they generated 76 and 56 per cent of their revenues,
respectively, from countries other than Canada. (see Chart 23.)
According to a 2014 Conference Board survey, the most common
market entry strategies used by Canadian financial institutions to build
a presence in foreign markets are foreign acquisitions, establishing a
subsidiary, and setting up joint ventures or local partnerships.2
2 Ai and Burt, Going Abroad.
Chart 22Financial Services Direct Investment Abroad Has More Than Quadrupled Since 1999 ($ billions)
Sources: Statistics Canada, CANSIM table 376-0052; The Conference Board of Canada.
1999
050
100150200250300350400450
United States Europe Other
00 01 02 03 04 05 06 07 08 09 10 11 12 13 14
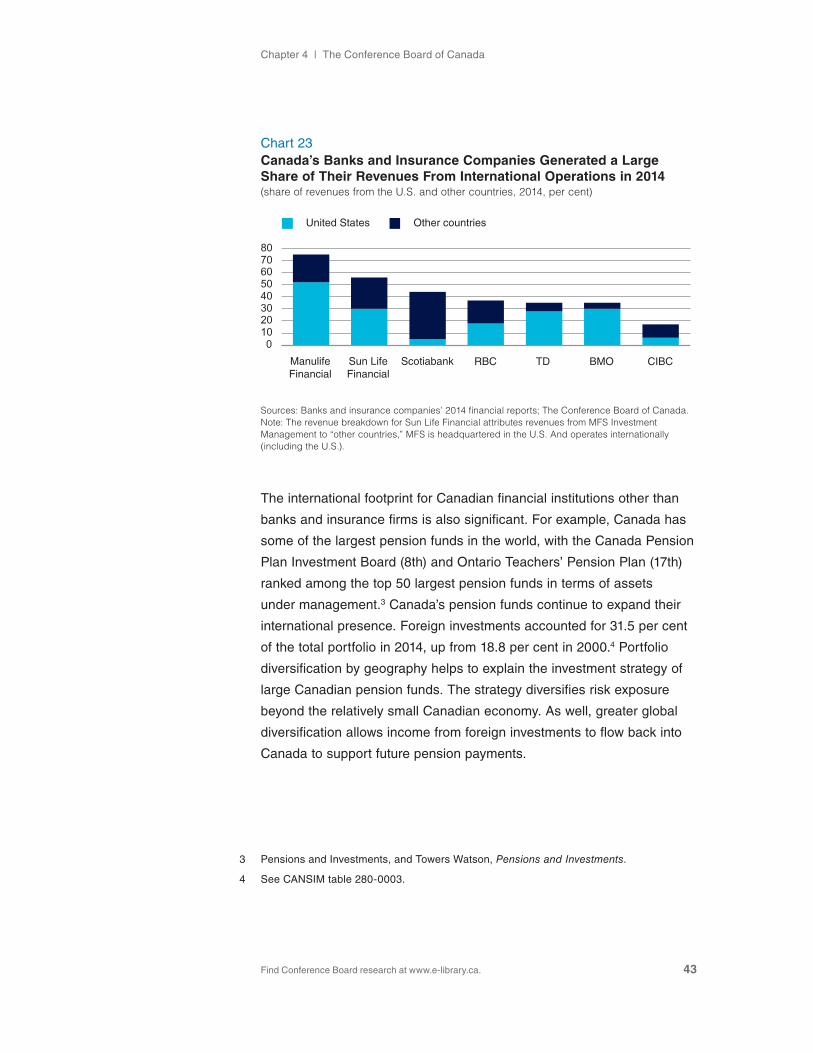
Chapter 4 | The Conference Board of Canada
Find Conference Board research at www.e-library.ca. 43
The international footprint for Canadian financial institutions other than
banks and insurance firms is also significant. For example, Canada has
some of the largest pension funds in the world, with the Canada Pension
Plan investment Board (8th) and Ontario Teachers’ Pension Plan (17th)
ranked among the top 50 largest pension funds in terms of assets
under management.3 Canada’s pension funds continue to expand their
international presence. Foreign investments accounted for 31.5 per cent
of the total portfolio in 2014, up from 18.8 per cent in 2000.4 Portfolio
diversification by geography helps to explain the investment strategy of
large Canadian pension funds. The strategy diversifies risk exposure
beyond the relatively small Canadian economy. As well, greater global
diversification allows income from foreign investments to flow back into
Canada to support future pension payments.
3 Pensions and investments, and Towers watson, Pensions and Investments.
4 see CANsiM table 280-0003.
Chart 23Canada’s Banks and Insurance Companies Generated a Large Share of Their Revenues From International Operations in 2014(share of revenues from the U.S. and other countries, 2014, per cent)
Sources: Banks and insurance companies’ 2014 financial reports; The Conference Board of Canada. Note: The revenue breakdown for Sun Life Financial attributes revenues from MFS Investment Management to “other countries,” MFS is headquartered in the U.S. And operates internationally (including the U.S.).
01020304050607080
RBC TD BMO CIBC
United States Other countries
ManulifeFinancial
Sun LifeFinancial
Scotiabank
AN ENGiNE FOR GROwTH2015 Report Card on Canada and Toronto’s Financial services sector
Find Conference Board research at www.e-library.ca. 44
Canada’s largest exchange operator, TMX Group Limited, also has a
significant foreign presence, with about 30 per cent of revenues coming
from international business.5 Key factors driving these foreign revenues
include international listings of the TMX Group’s exchanges and
transactions originating from foreign-based brokers.
Building a Global Presence Through Exports
The second channel by which Canada’s financial institutions can
serve foreign customers is through cross-border trade, also known
as exports. when a Canadian financial institution provides services
to non-residents through its Canadian operations, it is engaging in
an export activity, which is a source of income and job creation for
Canada. Exports of financial services can be split into three broad
categories: banking, insurance, and other financial services, which
are composed of items such as securities issuance and trading, and
asset management services.
Canadian financial services exports are much smaller than sales of
foreign affiliates. However, they have been growing at a faster pace than
foreign affiliate sales. Between 1999 and 2014, total exports of financial
services more than tripled, surpassing the $10 billion mark. in fact,
financial services are Canada’s largest and fastest-growing source of
services exports.6 (see Chart 24.) while banking and insurance exports
have both grown substantially over this period, other financial services
have experienced the strongest growth and now account for half of
Canada’s financial services exports. (see Chart 25.)
similarly, with foreign affiliate sales, the U.s. is also the number one
market for Canadian exports of financial services, accounting for 50 per
cent of the total—a share that has remained relatively unchanged over
time. (see Chart 26.) There are a variety of reasons for the strong growth
in financial services exports to the United states. The reasons include
5 Ai and Burt, Going Abroad.
6 Palladini, Spotlight on Services in Canada’s Global Commerce.
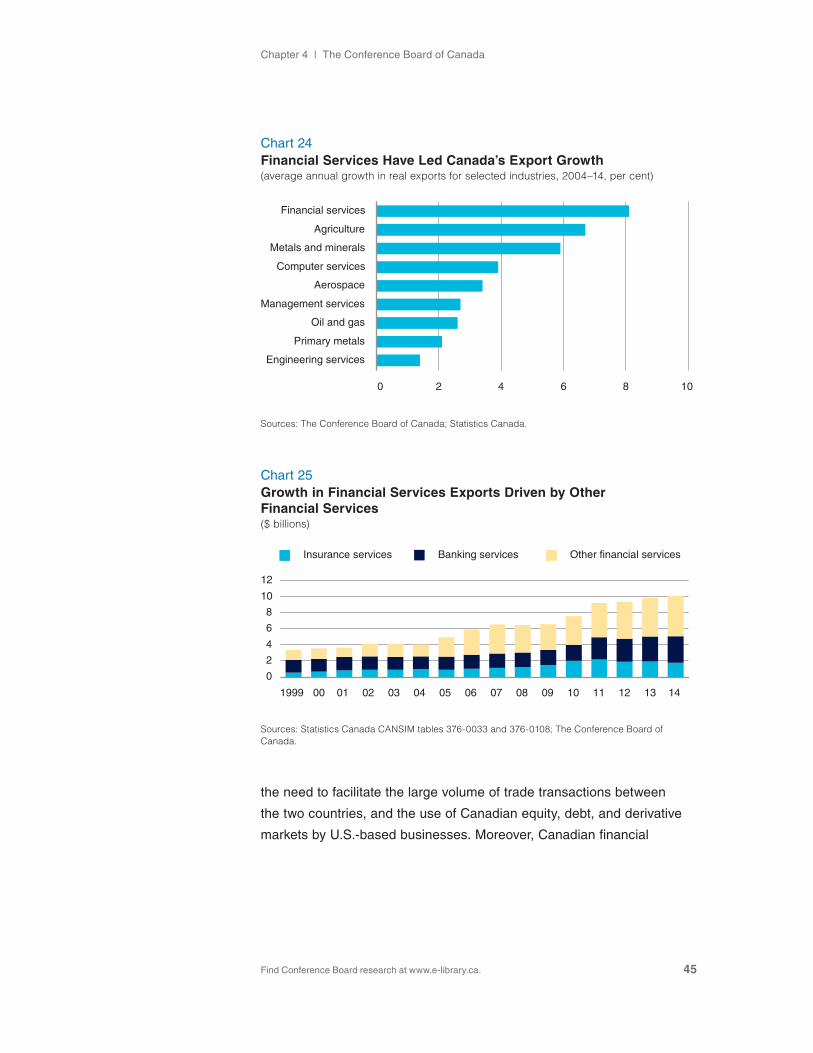
Chapter 4 | The Conference Board of Canada
Find Conference Board research at www.e-library.ca. 45
the need to facilitate the large volume of trade transactions between
the two countries, and the use of Canadian equity, debt, and derivative
markets by U.s.-based businesses. Moreover, Canadian financial
Chart 24Financial Services Have Led Canada’s Export Growth(average annual growth in real exports for selected industries, 2004–14, per cent)
Sources: The Conference Board of Canada; Statistics Canada.
Engineering services
Primary metals
Oil and gas
Management services
Aerospace
Computer services
Metals and minerals
Agriculture
Financial services
0 2 4 6 8 10
Chart 25 Growth in Financial Services Exports Driven by Other Financial Services($ billions)
Sources: Statistics Canada CANSIM tables 376-0033 and 376-0108; The Conference Board of Canada.
0
2
4
6
8
10
12
Insurance services Banking services Other financial services
1999 00 01 02 03 04 05 06 07 08 09 10 11 12 13 14
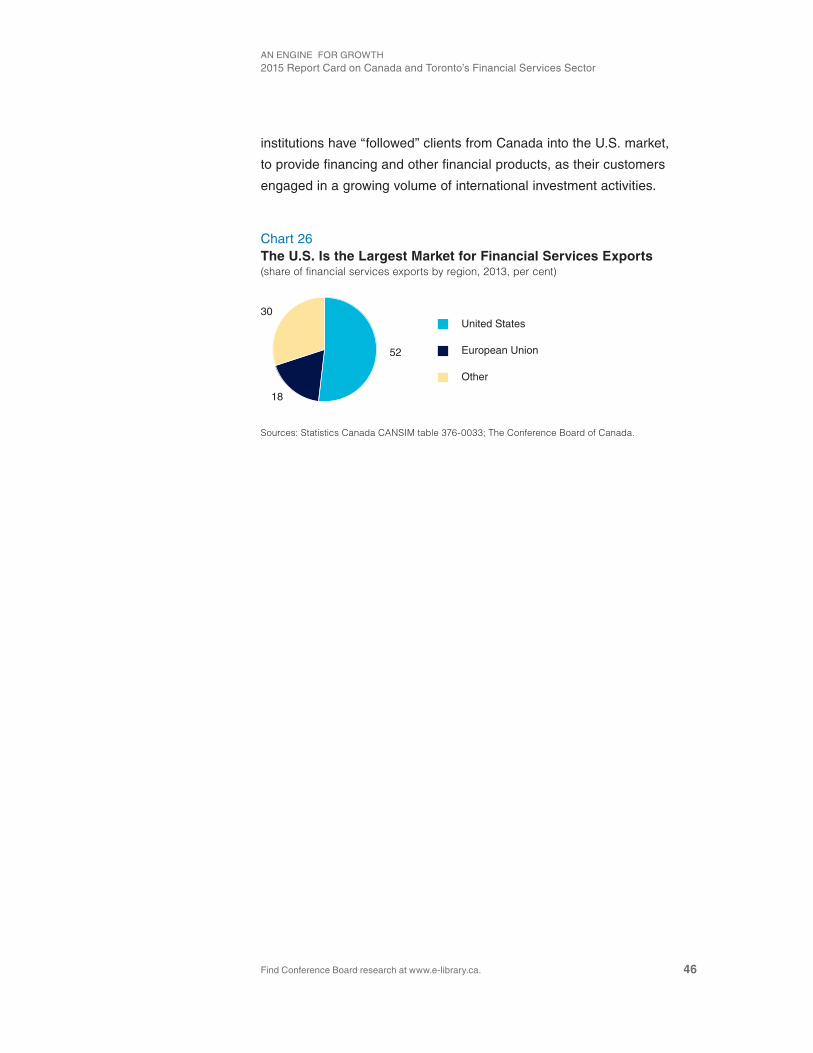
AN ENGiNE FOR GROwTH2015 Report Card on Canada and Toronto’s Financial services sector
Find Conference Board research at www.e-library.ca. 46
institutions have “followed” clients from Canada into the U.s. market,
to provide financing and other financial products, as their customers
engaged in a growing volume of international investment activities.
Chart 26The U.S. Is the Largest Market for Financial Services Exports(share of financial services exports by region, 2013, per cent)
Sources: Statistics Canada CANSIM table 376-0033; The Conference Board of Canada.
52
18
30United States
European Union
Other
Find Conference Board research at www.e-library.ca.
CHAPTER 5
Toronto’s Role in Canada’s Financial Services Sector
Chapter summary
• Financial services directly employed 251,375 people in Toronto in 2014. This represents 8.1 per cent of the metro area’s total employment, up from 7.1 per cent in 2004. in addition, the sector indirectly employed another 106,290 people in the metro area.
• Toronto accounts for a growing share of Canada’s financial services sector. Toronto’s share of the sector’s employment rose from 28.2 per cent in 2004 to 32.3 per cent in 2014.
• The sector directly accounts for 13.3 per cent of metro Toronto’s GdP. Only the public services sector is larger.
• in total, Toronto’s financial services sector generated a combined $15.7 billion in fiscal benefits in 2014 for the Canadian, Ontario, and City of Toronto governments.
AN ENGiNE FOR GROwTH2015 Report Card on Canada and Toronto’s Financial services sector
Find Conference Board research at www.e-library.ca. 48
The trends in the financial services sector that we have discussed thus far pertain broadly to Canada. We now turn our attention to Toronto’s role in the sector, as well as its contribution to the Canadian economy.
Toronto is the major hub for financial services headquarters in Canada.
For example, 31 per cent of all financial services headquarters are
located in Toronto, which is more than double the proportion in
Vancouver (13.2 per cent), its closest Canadian competitor.1 The
concentration of financial services headquarters activity is even more
apparent when we look at employment—43 per cent of financial
services headquarters employment is found in Toronto. This is more
than triple its nearest competitor, Montréal, at 12.4 per cent.
in addition, Canada’s financial services sector is becoming more
concentrated in Toronto, as the share of the sector’s employment in
Toronto has risen over the past decade. in 2004, Toronto accounted for
28.2 per cent of Canadian financial services employment: this share had
risen to 32.3 per cent by 2014. By way of comparison, Toronto’s share
of total Canadian employment changed by only a small amount over
that period, rising from 16.9 per cent to 17.4 per cent. This indicates that
Toronto has solidified its position as Canada’s leading financial centre.
Economic and Fiscal Impacts of the Sector in Toronto
when assessing the economic footprint of a sector, one can consider a
variety of effects. in this report, we consider the following three economic
effects associated with Toronto’s financial sector:
1. Direct effects. These are the economic effects directly associated
with the day-to-day operations of Toronto’s financial services sector.
Essentially, they include all of the sector’s economic activity in Toronto.
1 Ai, A Head for Finance.
Toronto is the major hub for financial services headquarters in Canada; 43 per cent of financial services headquarters employment is found in Toronto, compared with 12.4 per cent in Montréal, its nearest competitor.
Chapter 5 | The Conference Board of Canada
Find Conference Board research at www.e-library.ca. 49
2. Indirect effects. The indirect or supply-chain effects are the economic
effects associated with the financial services sector’s use of intermediate
inputs or other support services, both in Toronto and in the rest of
the country.
3. Fiscal effects. The fiscal impacts include all of the federal, provincial,
and municipal revenues associated with the direct and indirect economic
effects of the sector in Toronto.
Direct EffectsThe financial services sector is one of Toronto’s major clusters. it
directly employed 251,375 people in 2014, which included everyone
from tellers and insurance agents in local offices to the headquarters’
staff of multinationals in the metro area. This is of sufficient size to make
the sector the fifth largest in the metro area in terms of employment,
accounting for 8.1 per cent of the total. (see Table 2.) This share is even
higher in the City of Toronto, at 11.4 per cent.
Table 2Breakdown of Major Sectors in Toronto
2014 Employment 2014 GDP
Number Share (%) 2007 $ millions Share (%)
Financial services 251,375 8.1 40,891 13.3
Manufacturing 323,790 10.5 37,867 12.4
Public services 627,590 20.3 45,306 14.8
Professional services 332,375 10.8 24,733 8.1
information services 89,205 2.9 14,890 4.9
Retail trade 334,775 10.8 15,827 5.2
Transportation 152,802 4.9 13,570 4.4
Construction 186,001 6.0 14,174 4.6
Accommodation and food services 191,300 6.2 5,249 1.7
Other sectors 597,754 19.4 93,941 30.7
Total 3,086,969 100.0 306,449 100.0
Sources: The Conference Board of Canada; Statistics Canada.
AN ENGiNE FOR GROwTH2015 Report Card on Canada and Toronto’s Financial services sector
Find Conference Board research at www.e-library.ca. 50
Toronto’s financial services industry has also been a significant source
of growth in recent years. in 2004, the sector employed 192,025 people
in Toronto. This represents an average annual growth of 2.7 per cent
over the past decade, which compares favourably with 1.4 per cent for
all sectors in the Toronto metro area over the same period.
Because employment growth in the sector has outpaced the average
for all sectors, financial services have grown as a share of Toronto’s
economy. Between 2004 and 2014, the sector’s share of the metro
area’s employment rose from 7.1 per cent to 8.1 per cent. in fact, the
concentration of financial services employment in 2014 was higher in
Toronto than in any other metro area across the country. (see Chart 27.)
As large as the employment impacts are, it is important to note that
the GdP impacts of Toronto’s financial services sector are even larger.
On a GdP basis, financial services accounted for 13.3 per cent of the
metro area’s economy in 2014; this was second only to public services.
Financial services account for a larger share of Toronto’s GdP than its
employment because GdP per employee in the sector is significantly
above average. several factors determine a sector’s GdP, including the
Chart 27Concentration of Financial Services Employment Is Highest in Toronto Among Canadian Metro Areas(share of employment in financial services for selected metro areas, 2014, per cent)
Sources: Statistics Canada; The Conference Board of Canada.
CalgaryWinnipeg
LondonMontréal
VancouverKitchener−Waterloo
ReginaToronto
0 1 2 3 4 5 6 7 8 9

Chapter 5 | The Conference Board of Canada
Find Conference Board research at www.e-library.ca. 51
wages and salaries that it pays, the amount of depreciation of its assets,
and the profits that it earns. For all three factors, the financial services
sector’s numbers are above average.
For example, in Ontario, the sector’s average weekly earnings per
employee in 2014 were $1,218, versus the overall industrial average
of $938.2 As well, the sector’s depreciation expense per employee in
Canada was $11,100, versus $8,400 for all industries in 2014.3 Although
the sector’s capital stock per employee is below average, much of
what it consists of is information technology equipment and software,
which depreciates quickly. The result is an ongoing need for a high
rate of investment per employee in the sector. Finally, nationally, the
sector’s profit margin was 19.4 per cent in 2014, versus 7.1 per cent for
all industries.4 Ultimately, the high level of GdP per employee in the
financial services sector reflects the fact that, in general, it generates
a high degree of value-added for the economy.
Indirect Effectsin addition to employing people directly, the financial services sector also
generates secondary or indirect effects in the economy. indirect effects
measure the economic benefits associated with the financial services
sector’s use of intermediate inputs or other support services. Thus, the
indirect effects describe a sector’s supply chain, highlighting all of the
inputs necessary to conduct financial activity.
in aggregate, Toronto’s financial services sector supported an additional
209,371 jobs in 2014. Thus, the sector accounted for a total of 460,538
jobs once the direct effects were added to the indirect effects. The
indirect effects occurred largely in Toronto, but benefits did accrue
across the country. Of the 209,545 indirect jobs, 106,378 occurred in
Toronto; 69,589 occurred in the rest of Ontario; and 33,578 occurred
in the rest of Canada. (see Table 3.)
2 derived from statistics Canada’s CANsiM table 281-0026.
3 derived from statistics Canada’s CANsiM table 187-0001 and Labour Force Survey.
4 derived from statistics Canada’s CANsiM table 187-0001.
AN ENGiNE FOR GROwTH2015 Report Card on Canada and Toronto’s Financial services sector
Find Conference Board research at www.e-library.ca. 52
The indirect effects of a sector are often expressed as a multiplier,
which is the ratio of the combined direct and indirect effects to the direct
effects. in this case, the financial services sector had a multiplier of 1.83.
This means that for every direct job in the sector, it supported another
0.83 jobs through supply-chain impacts. we can break those results
down further by region. Thus, for every direct job in Toronto, there were
another 0.42 indirect jobs in Toronto; 0.28 indirect jobs in the rest of
Ontario; and 0.13 indirect jobs in the rest of Canada.
The sector also has indirect GdP effects across Canada. in fact, for
every $100 of GdP that the sector directly generated in Toronto, it
indirectly generated an additional $23 in Toronto; $21 in the rest of
Ontario; and $9 in the rest of Canada. This resulted in a total GdP
multiplier of 1.52 for the sector.
The GdP multiplier for the sector was lower than its employment
multiplier because the sector has a high level of GdP per employee.
Essentially, since the sector’s direct GdP effects were above average,
a large denominator was used to calculate the multiplier. As a result,
the GdP multiplier was smaller than the employment multiplier. Other
sectors with high GdP per employee ratios, such as mining and utilities,
experience a similar effect.
Table 3Financial Services Employment and GDP Effects, by Region
Toronto Rest of Ontario Rest of Canada Total
Direct Indirect Indirect Indirect
Value
Share of effects
(%) Value
Share of effects
(%) Value
Share of effects
(%) Value
Share of effects
(%) Value
Share of effects
(%)
Employment 251,375 54.5 106,378 23.1 69,589 15.1 33,578 7.3 460,920 100
GdP (2002 $ millions) 40,891 65.6 9,322 15 8,554 13.7 3,560 5.7 62,327 100
Sources: Statistics Canada; The Conference Board of Canada.
Chapter 5 | The Conference Board of Canada
Find Conference Board research at www.e-library.ca. 53
Indirect Effects on Professional Services in Torontoif we turn our focus to the indirect effects in Toronto, we can gain
some additional insights into which industries are supported by activity
in the financial services sector. in 2014, the single largest impact was
in the professional services industry, where financial services activity
supported 29,834 jobs. (see Chart 28.) indeed, the relationship is so
strong that some professional services, such as legal and accounting
services, are sometimes considered to be part of the financial services
sector. if we add the direct effects of the financial services sector
and its indirect effects in the professional services sector, the total of
281,209 jobs equates to 9.1 per cent of Toronto’s total employment.
within the professional services sector, the consulting industry
experienced the largest impact: financial services activity supported
8,309 jobs in this industry. (see Chart 29.) significantly, the financial
services sector also supported 5,983 legal services jobs (17.2 per cent
of local industry employment) and 3,989 accounting services jobs
(12.0 per cent of local industry employment).
Chart 28Professional Services Experienced the Largest Indirect Employment Effects in Toronto(indirect employment effects in Toronto by sector, 2014, 000s of jobs)
Sources: Statistics Canada; The Conference Board of Canada.
Other
Public sector
Holding companiesWholesale trade
Accommodation and food services
Personal servicesReal estate, rentals, and leasing
Information services
TransportationRetail trade
Administrative services
Professional services
0 5 10 15 20 25 30
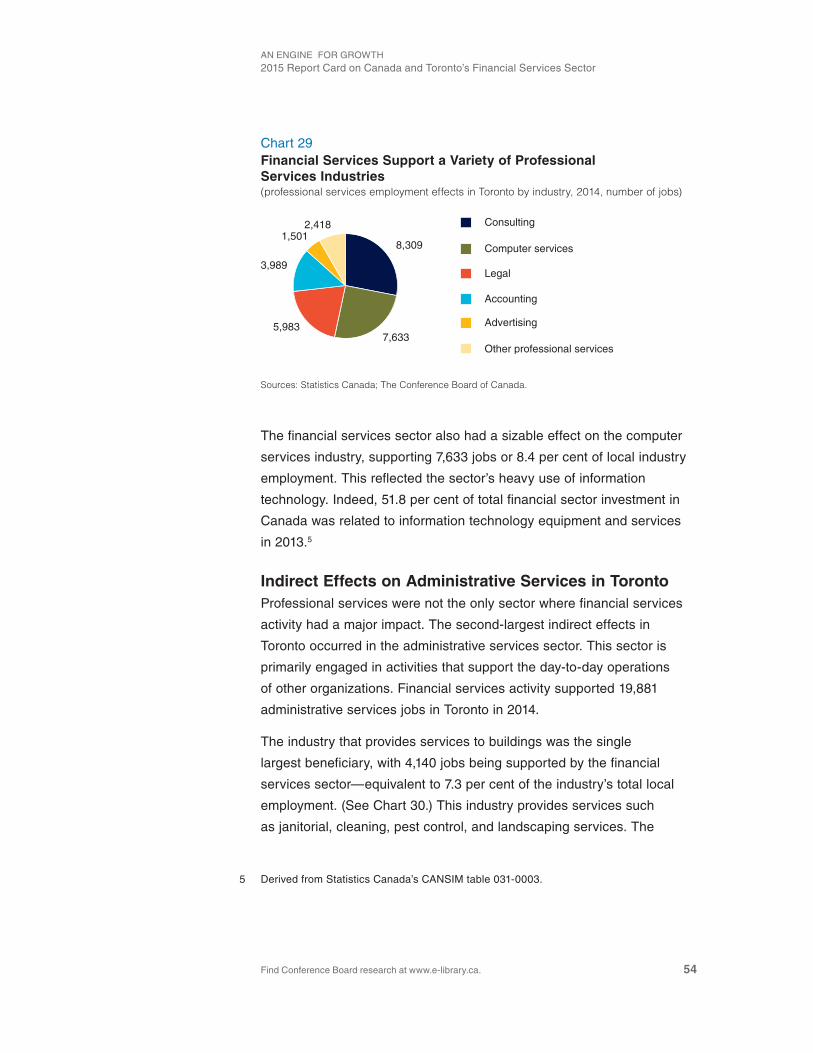
AN ENGiNE FOR GROwTH2015 Report Card on Canada and Toronto’s Financial services sector
Find Conference Board research at www.e-library.ca. 54
The financial services sector also had a sizable effect on the computer
services industry, supporting 7,633 jobs or 8.4 per cent of local industry
employment. This reflected the sector’s heavy use of information
technology. indeed, 51.8 per cent of total financial sector investment in
Canada was related to information technology equipment and services
in 2013.5
Indirect Effects on Administrative Services in TorontoProfessional services were not the only sector where financial services
activity had a major impact. The second-largest indirect effects in
Toronto occurred in the administrative services sector. This sector is
primarily engaged in activities that support the day-to-day operations
of other organizations. Financial services activity supported 19,881
administrative services jobs in Toronto in 2014.
The industry that provides services to buildings was the single
largest beneficiary, with 4,140 jobs being supported by the financial
services sector—equivalent to 7.3 per cent of the industry’s total local
employment. (see Chart 30.) This industry provides services such
as janitorial, cleaning, pest control, and landscaping services. The
5 derived from statistics Canada’s CANsiM table 031-0003.
Chart 29 Financial Services Support a Variety of Professional Services Industries(professional services employment effects in Toronto by industry, 2014, number of jobs)
Sources: Statistics Canada; The Conference Board of Canada.
8,309
7,6335,983
3,989
1,5012,418 Consulting
Computer services
Legal
Accounting
Advertising
Other professional services
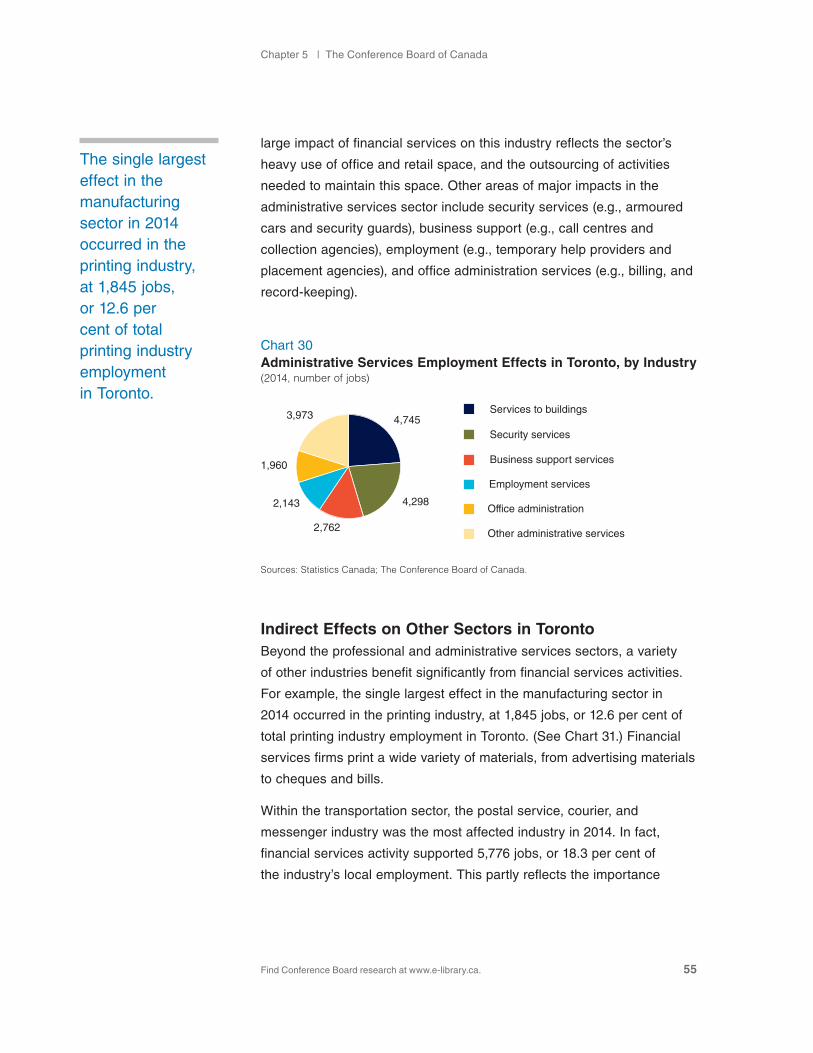
Chapter 5 | The Conference Board of Canada
Find Conference Board research at www.e-library.ca. 55
large impact of financial services on this industry reflects the sector’s
heavy use of office and retail space, and the outsourcing of activities
needed to maintain this space. Other areas of major impacts in the
administrative services sector include security services (e.g., armoured
cars and security guards), business support (e.g., call centres and
collection agencies), employment (e.g., temporary help providers and
placement agencies), and office administration services (e.g., billing, and
record-keeping).
Indirect Effects on Other Sectors in TorontoBeyond the professional and administrative services sectors, a variety
of other industries benefit significantly from financial services activities.
For example, the single largest effect in the manufacturing sector in
2014 occurred in the printing industry, at 1,845 jobs, or 12.6 per cent of
total printing industry employment in Toronto. (see Chart 31.) Financial
services firms print a wide variety of materials, from advertising materials
to cheques and bills.
within the transportation sector, the postal service, courier, and
messenger industry was the most affected industry in 2014. in fact,
financial services activity supported 5,776 jobs, or 18.3 per cent of
the industry’s local employment. This partly reflects the importance
Chart 30Administrative Services Employment Effects in Toronto, by Industry(2014, number of jobs)
Sources: Statistics Canada; The Conference Board of Canada.
4,745
4,298
2,762
2,143
1,960
3,973
Security services
Services to buildings
Business support services
Employment services
Office administration
Other administrative services
The single largest effect in the manufacturing sector in 2014 occurred in the printing industry, at 1,845 jobs, or 12.6 per cent of total printing industry employment in Toronto.
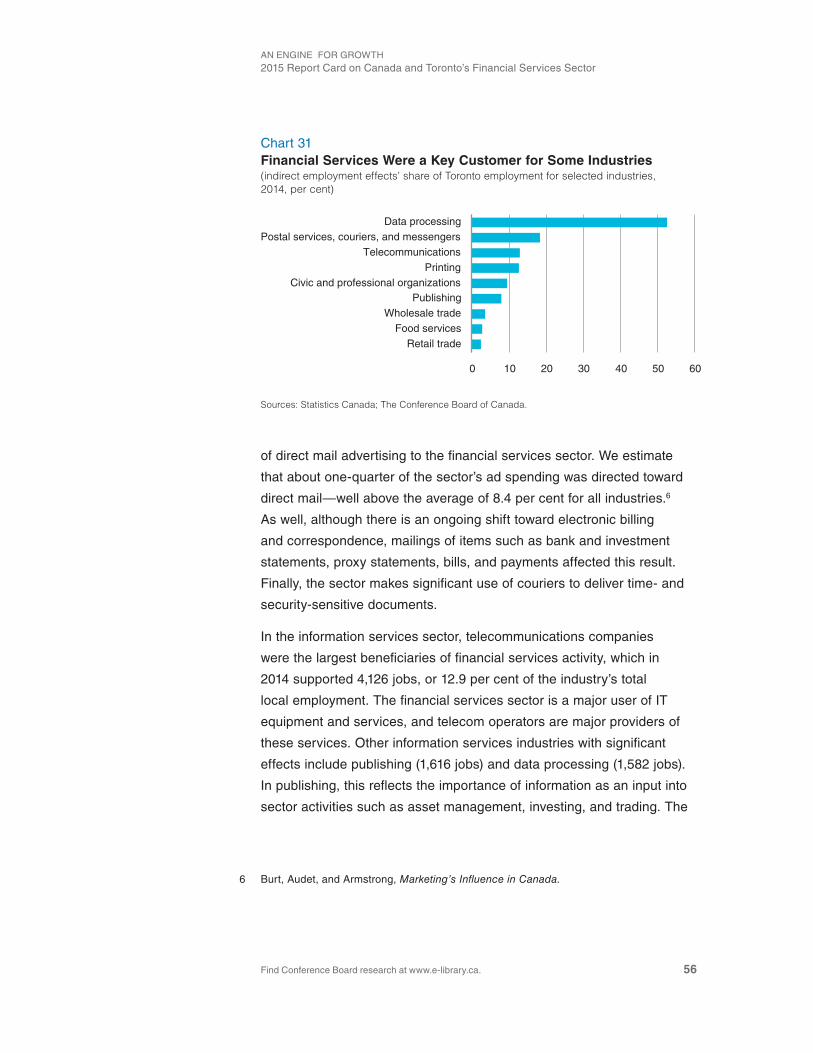
AN ENGiNE FOR GROwTH2015 Report Card on Canada and Toronto’s Financial services sector
Find Conference Board research at www.e-library.ca. 56
of direct mail advertising to the financial services sector. we estimate
that about one-quarter of the sector’s ad spending was directed toward
direct mail—well above the average of 8.4 per cent for all industries.6
As well, although there is an ongoing shift toward electronic billing
and correspondence, mailings of items such as bank and investment
statements, proxy statements, bills, and payments affected this result.
Finally, the sector makes significant use of couriers to deliver time- and
security-sensitive documents.
in the information services sector, telecommunications companies
were the largest beneficiaries of financial services activity, which in
2014 supported 4,126 jobs, or 12.9 per cent of the industry’s total
local employment. The financial services sector is a major user of iT
equipment and services, and telecom operators are major providers of
these services. Other information services industries with significant
effects include publishing (1,616 jobs) and data processing (1,582 jobs).
in publishing, this reflects the importance of information as an input into
sector activities such as asset management, investing, and trading. The
6 Burt, Audet, and Armstrong, Marketing’s Influence in Canada.
Chart 31Financial Services Were a Key Customer for Some Industries(indirect employment effects’ share of Toronto employment for selected industries, 2014, per cent)
Sources: Statistics Canada; The Conference Board of Canada.
Retail tradeFood services
Wholesale tradePublishing
Civic and professional organizationsPrinting
TelecommunicationsPostal services, couriers, and messengers
Data processing
0 10 20 30 40 50 60

Chapter 5 | The Conference Board of Canada
Find Conference Board research at www.e-library.ca. 57
effects in the data processing industry reflect the data-intensive nature
of the financial services sector, particularly those segments that are
transaction-oriented, such as exchanges and banking.
Although the financial services sector accounted for a smaller share of
their total employment, sectors such as retail and wholesale trade also
experienced significant employment effects, at 8,126 and 4,504 jobs,
respectively. These industries experience economic impacts from activity
in most industries because they connect businesses and consumers
across the economy.
Fiscal EffectsThe direct and indirect effects associated with Toronto’s financial
services sector also have significant fiscal implications for the City of
Toronto, for Ontario, and for the federal government. The sector affects
federal and provincial government revenues in several key areas,
including the personal income taxes that employees pay on their wages
and salaries; corporate taxes on the profits that financial services firms
generate; and indirect taxes, which include things such as sales taxes
and fuel taxes. At the municipal level, the employees of financial services
firms require office space, and property taxes are paid on this space.
in total, we estimate that Toronto’s financial services sector generated
a combined $15.7 billion in fiscal benefits in 2014 for the Canadian,
Ontario, and City of Toronto governments. (see Chart 32.)
FederalAmong the different levels of government, Toronto’s financial services
sector had the largest impact on the federal government. The sector
was equivalent to 3 per cent of the federal government’s $279.3 billion
in reported revenues for fiscal 2014–15.7 Personal income taxes were
the single largest source of these revenues, accounting for $3.2 billion
or 37.8 per cent of the total. The second-largest source of federal tax
revenues—at $2.3 billion, or 27 per cent of the total—was the GsT on
7 Government of Canada, Strong Leadership.
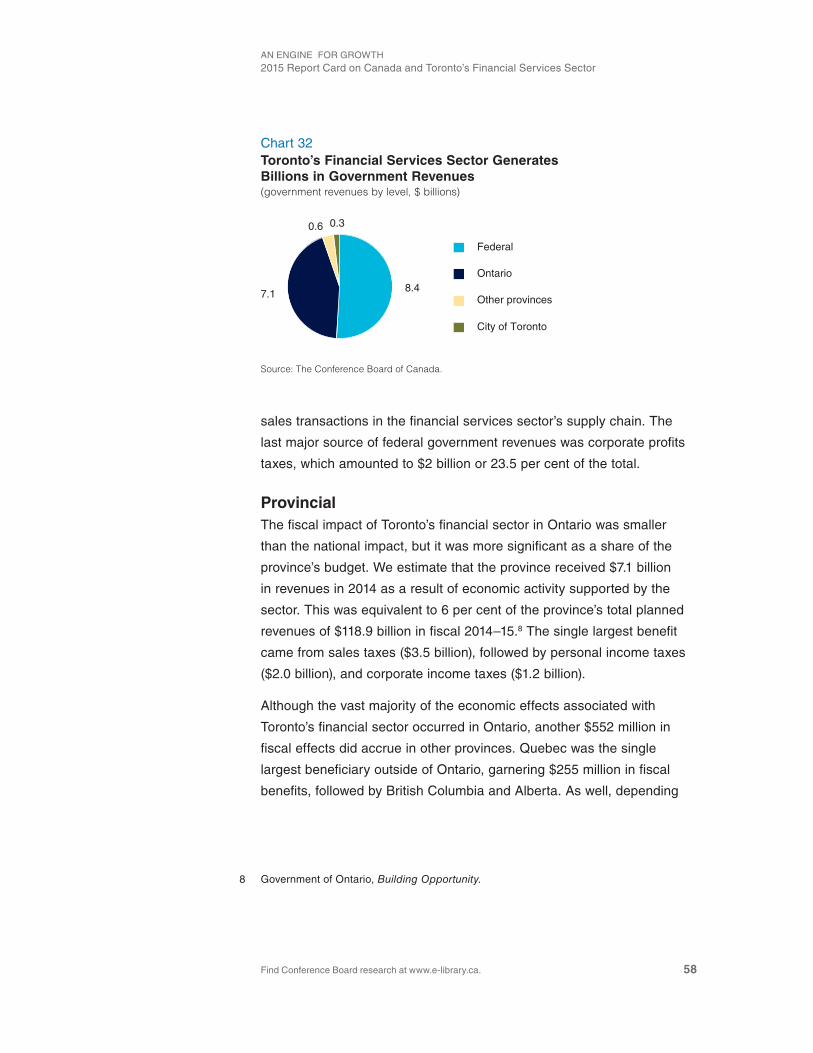
AN ENGiNE FOR GROwTH2015 Report Card on Canada and Toronto’s Financial services sector
Find Conference Board research at www.e-library.ca. 58
sales transactions in the financial services sector’s supply chain. The
last major source of federal government revenues was corporate profits
taxes, which amounted to $2 billion or 23.5 per cent of the total.
ProvincialThe fiscal impact of Toronto’s financial sector in Ontario was smaller
than the national impact, but it was more significant as a share of the
province’s budget. we estimate that the province received $7.1 billion
in revenues in 2014 as a result of economic activity supported by the
sector. This was equivalent to 6 per cent of the province’s total planned
revenues of $118.9 billion in fiscal 2014–15.8 The single largest benefit
came from sales taxes ($3.5 billion), followed by personal income taxes
($2.0 billion), and corporate income taxes ($1.2 billion).
Although the vast majority of the economic effects associated with
Toronto’s financial sector occurred in Ontario, another $552 million in
fiscal effects did accrue in other provinces. Quebec was the single
largest beneficiary outside of Ontario, garnering $255 million in fiscal
benefits, followed by British Columbia and Alberta. As well, depending
8 Government of Ontario, Building Opportunity.
Chart 32Toronto’s Financial Services Sector Generates Billions in Government Revenues(government revenues by level, $ billions)
Source: The Conference Board of Canada.
8.47.1
0.6 0.3
Federal
Ontario
Other provinces
City of Toronto

Chapter 5 | The Conference Board of Canada
Find Conference Board research at www.e-library.ca. 59
on how the federal fiscal effects were spread across the country,
the other provinces would receive additional benefits associated with
federal spending.
MunicipalThe final fiscal impact associated with the financial services sector
comes from the office space that its employees occupy. we found that
the sector supported 357,450 jobs in the Toronto metro area in 2012,
both directly and indirectly. However, not all of these jobs were in the City
of Toronto, nor did all of them require office space. in fact, we estimate
that 166,800 of those jobs were in the City of Toronto and required some
form of commercial space (office or retail space). This was equivalent
to 20.7 per cent of the total employment in the City of Toronto that used
commercial space.
Using these employment figures and City of Toronto data on property
tax collections, we estimate that $277 million in municipal taxes in 2013
can be directly and indirectly linked to Toronto’s financial services sector.
That was equivalent to 7.5 per cent of Toronto’s total property taxes
and 2.5 per cent of the city’s total revenues of $11.2 billion in 2013.9 Of
course, the other municipalities that make up the Toronto metro area—
such as Mississauga, Oakville, and Markham—would have also received
fiscal benefits.
9 City of Toronto, 2013 Consolidated Financial Statements.
AN ENGiNE FOR GROwTH2015 Report Card on Canada and Toronto’s Financial services sector
Find Conference Board research at www.e-library.ca. 60
The Structure of Toronto’s Sector
Toronto’s financial services sector is made up of many constituent parts
that offer a variety of services. The key industries within the sector
include the following:
• banking
• credit unions
• insurance
• asset management
• securities
• exchanges
• back office operations
However, the distinctions between these industries have blurred over
time. in 1991, regulatory changes ended the policy of separating the
sector into “four pillars” (banks, insurance, trusts, and investment
dealers). As a result, different industries in the sector offer many similar
products and services. For example, many of the largest banks in
Canada offer insurance and asset management services. As well, some
large insurance providers offer asset management or banking services.
Because of the way industry statistics are compiled, the blurring of the
lines between industries can make cross-industry comparisons difficult.
Employees of an organization that earns most of its revenues from
banking would generally be recorded as banking industry employees,
even if the services they provide might be better classified under a
different industry. This problem affects the asset management industry
the most. with this caveat in mind, it is still instructive to look at the
structure of the industries that make up the financial services sector.
in terms of employment, three industries—banking, insurance, and
securities—accounted for a combined total of 92.8 per cent of Toronto’s
financial services employment in 2014. (see Chart 33.) This share has
declined modestly over the past decade. Although banking employment
experienced above-average growth, insurance and securities
employment did not. As a result, these two industries now account for
Three industries—banking, insurance, and securities—accounted for a combined total of 92.8 per cent of Toronto’s financial services employment in 2014.
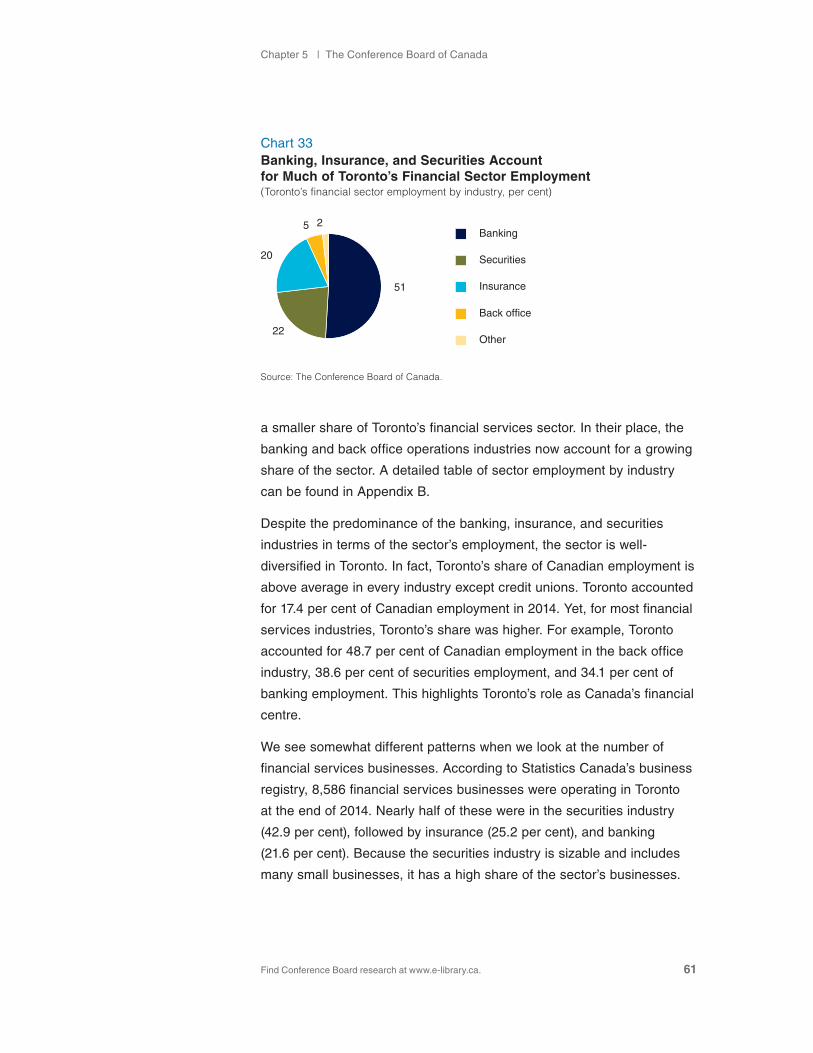
Chapter 5 | The Conference Board of Canada
Find Conference Board research at www.e-library.ca. 61
a smaller share of Toronto’s financial services sector. in their place, the
banking and back office operations industries now account for a growing
share of the sector. A detailed table of sector employment by industry
can be found in Appendix B.
despite the predominance of the banking, insurance, and securities
industries in terms of the sector’s employment, the sector is well-
diversified in Toronto. in fact, Toronto’s share of Canadian employment is
above average in every industry except credit unions. Toronto accounted
for 17.4 per cent of Canadian employment in 2014. Yet, for most financial
services industries, Toronto’s share was higher. For example, Toronto
accounted for 48.7 per cent of Canadian employment in the back office
industry, 38.6 per cent of securities employment, and 34.1 per cent of
banking employment. This highlights Toronto’s role as Canada’s financial
centre.
we see somewhat different patterns when we look at the number of
financial services businesses. According to statistics Canada’s business
registry, 8,586 financial services businesses were operating in Toronto
at the end of 2014. Nearly half of these were in the securities industry
(42.9 per cent), followed by insurance (25.2 per cent), and banking
(21.6 per cent). Because the securities industry is sizable and includes
many small businesses, it has a high share of the sector’s businesses.
Chart 33Banking, Insurance, and Securities Account for Much of Toronto’s Financial Sector Employment(Toronto’s financial sector employment by industry, per cent)
Source: The Conference Board of Canada.
51
22
20
5 2Banking
Securities
Insurance
Back office
Other

AN ENGiNE FOR GROwTH2015 Report Card on Canada and Toronto’s Financial services sector
Find Conference Board research at www.e-library.ca. 62
in fact, in 2014, 86 per cent of securities enterprises in Toronto had fewer
than 20 employees. A detailed table of financial services establishments
by employment can be found in Appendix B.
small businesses are common in most of the industries that make
up Toronto’s financial sector. in 2014, 75.4 per cent of enterprises
had fewer than 20 employees, versus 87.1 per cent for all industries.
However, some segments have more large businesses than others. For
example, nearly 10 per cent of life and health insurers had more than
200 employees. This may sound like a small share, but it is actually well
above average. in fact, only 1.1 per cent of all businesses across all
industries in Toronto had more than 200 employees.
within the financial services sector, large businesses are most common
in segments such as retail and commercial banking, insurance carriers,
credit card issuance, and exchanges, where larger businesses are
most likely to incur significant benefits. For example, capital-intensive
businesses can benefit from economies of scale. As well, size can
improve the perceived safety of a financial institution. This can lead to
real benefits, such as lower borrowing costs and reduced counterparty
risk premiums when dealing with other financial institutions. Finally, some
segments, such as retail banking, can benefit from the network effects
that come with scale. Larger banks generally have more locations where
customers can conduct transactions, improving customer convenience
and service.
Find Conference Board research at www.e-library.ca.
CHAPTER 6
Toronto as a Global Financial Centre
Chapter summary
• Toronto is highly ranked among global financial centres. it is ranked 7th by The Banker and its rank in the Global Financial Centres index (GFCi) rose from 11th to 8th in the most recent survey. The improvement appears to be largely tied to an improved reputation for the city.
• According to the GFCi, key areas where Toronto stands out include its business environment, infrastructure, human capital, and reputation.
• According to The Banker, key areas of strength for Toronto include high levels of outward foreign direct investment (Fdi), pre-tax profits, business friendliness, cost factors, and total bank assets.
• with financial services accounting for 8.1 per cent of the metro area’s employment, Toronto’s proportional reliance on financial services is even higher than that in major global financial centres such as London and New York.
AN ENGiNE FOR GROwTH2015 Report Card on Canada and Toronto’s Financial services sector
Find Conference Board research at www.e-library.ca. 64
Not only is Toronto the largest financial centre in Canada, it generally ranks well compared with other global financial centres. For example, The Banker magazine ranked Toronto 7th, behind cities like New York, London, and Singapore.1 As well, Toronto ranked 8th in the most recent Global Financial Centres Index (GFCI) report, an improvement of three positions from the previous version of that report.2 The improvement appears to be largely tied to an improved reputation for the city. In fact, Toronto now ranks 15th among the cities covered in the GFCI in terms of “reputational advantage”—meaning opinions about Toronto are significantly stronger than the quantitative data would suggest.
According to the most recent version of the GFCi, New York, London,
Hong Kong, and singapore are the most attractive financial centres
in the world. Toronto improves to 8th position, behind the top four, as
well as behind Tokyo, seoul, and Zurich.3 Toronto’s high ranking in the
GFCi is complemented by the fact that the report lists only 11 cities as
having financial sectors that are both broad and deep. (see Table 4.)
it is also worth noting that both surveys rank Toronto as the second
most important financial centre in North America.
The GFCi uses a combination of “instrumental factors” from other
reports and its own survey to generate its rankings. The categories
of instrumental factors include business environment, financial sector
development, infrastructure, human capital, and reputation. According
1 Pavoni, “London stays Top of iFC Tree: s Rankings.”
2 Yeandle, The Global Financial Centres Index 18.
3 ibid.
Chapter 6 | The Conference Board of Canada
Find Conference Board research at www.e-library.ca. 65
to the GFCi methodology, Toronto ranks among the top global cities in
four of these categories: business environment (9th), infrastructure (9th),
human capital (11th), and reputation (8th).
The GFCi survey also presents sub-indices based on its surveys, where
rankings are created using the responses of professionals working in
the relevant industry sectors. These five industry sectors are investment
management, banking, government and regulatory, insurance, and
professional services. Toronto is well-represented within these five
industry sectors, scoring a top 10 ranking in investment management, as
well as government and regulatory. (see Table 5.) As expected, the large
financial centres dominate each subsector.
in The Banker magazine’s survey,4 Toronto fared slightly better, ranking
7th globally. Key areas of identified strength for Toronto included high
levels of outward foreign direct investment (Fdi), pre-tax profits, business
friendliness, cost factors, and total bank assets. As well, Toronto ranked
4 Pavoni, London Stays Top of IFC Tree.
Table 4Ranking of Broad and Deep Global Financial Centres
London 1
New York 2
Hong Kong 3
singapore 4
seoul 6
Zurich 7
Toronto 8
Frankfurt 14
Amsterdam 36
Paris 37
dublin 46
Source: GFCI.
AN ENGiNE FOR GROwTH2015 Report Card on Canada and Toronto’s Financial services sector
Find Conference Board research at www.e-library.ca. 66
highly in terms of stock market capitalization, financial markets, and
international debt securities. Toronto ranked in the top 10 globally for all
of these factors. (see Table 6.)
Although it places well on all of these measures, Toronto generally
lagged well behind the major global financial centres. For example,
total assets were $6.9 trillion in London, $6.7 trillion in New York, and
only $2.8 trillion in Toronto.5 As well, there were about $3.1 trillion worth
of international debt securities issued in London, which far exceeds
the Toronto value of $777 billion. However, if we compare Toronto with
5 ibid.
Table 5Rankings for Sub-Indices Within the GFCI
Survey Based Instrument Based
Investment Management
Government and Regulatory
Business Environment Infrastructure Human Capital Reputation
London 1 London 1 London 1 London 1 New York 1 London 1
New York 2 New York 2 New York 2 New York 2 London 2 New York 2
Hong Kong 3 Hong Kong 3 Hong Kong 3 Hong Kong 3 Hong Kong 3 Hong Kong 3
singapore 4 singapore 4 singapore 4 singapore 4 singapore 4 singapore 4
Toronto 5 Tokyo 5 Tokyo 5 Tokyo 5 Tokyo 5 Tokyo 5
Tokyo 6 seoul 6 seoul 6 seoul 6 san Francisco 6 sydney 6
Chicago 7 Chicago 7 Zurich 7 Zurich 7 Zurich 7 Chicago 7
san Francisco 8 sydney 8 Luxembourg 8 Luxembourg 8 Chicago 8 Toronto 8
Boston 9 Toronto 9 Toronto 9 Toronto 9 washington, d.C. 9 san Francisco 9
Zurich 10 Zurich 10 Chicago 10 Chicago 10 Boston 10 Boston 10
sydney 11 sydney 11 Toronto 11 Zurich 11
dubai 12 dubai 12 seoul 12 Vancouver 12
Source: GFCI.
Chapter 6 | The Conference Board of Canada
Find Conference Board research at www.e-library.ca. 67
other cities, the gap is smaller. For example, in terms of total assets,
Toronto was on par with Zurich. in terms of the value of international
debt securities, Toronto was closer to Milan.
Table 6Activities Where Toronto Ranks Among the Top 10 Globally
Outward FDI International Debt Securities Cost Factors Financial Markets
London 1 London 1 Copenhagen 1 New York 1
New York 2 New York 2 Johannesburg 2 London 2
Paris 3 Amsterdam 3 Manama 3 Tokyo 3
Tokyo 4 Paris 4 wellington 4 Luxembourg 4
Zurich 5 Frankfurt 5 Bangkok 5 Amsterdam 5
Toronto 6 Toronto 6 Montréal 6 Paris 6
Beijing 7 Milan 7 Manila 7 Osaka 7
Mumbai 8 dublin 8 Toronto 8 Frankfurt 8
seoul 9 sydney 9 Chicago 9 Toronto 8
Frankfurt 10 Madrid 10 Jakarta 10 Hong Kong 10
Stock Market Capitalization Total Bank Assets Bank Pre-Tax Profits Business Friendliness
New York 1 Beijing 1 Beijing 1 London 1
Tokyo 2 Tokyo 2 New York 2 singapore 2
Osaka 2 London 3 Tokyo 3 Amsterdam 3
London 4 Paris 4 san Francisco 4 seoul 4
shanghai 5 New York 5 London 5 dubai 5
Hong Kong 6 Frankfurt 6 Toronto 6 Moscow 6
Mumbai 7 Toronto 7 shanghai 7 Toronto 7
Paris 8 Zurich 8 sydney 8 wellington 7
Toronto 9 shanghai 9 Paris 9 Paris 9
shenzhen 10 Madrid 10 são Paulo 10 Oslo 10
Source: The Banker.
AN ENGiNE FOR GROwTH2015 Report Card on Canada and Toronto’s Financial services sector
Find Conference Board research at www.e-library.ca. 68
in short, London and New York are clearly the largest global financial
centres. They remain in a league of their own, and they consistently vie
for first or second place in the global rankings. similarly, singapore and
Hong Kong generally compete for the third and fourth rankings. Toronto
is part of a group of cities that compete below these four large centres.
That said, on the measures where Toronto ranked the highest, it often
does better than some of the larger centres. For instance, Toronto
ranks above singapore and Hong Kong when it comes to outward Fdi,
financial markets, and international debt security issuance. Toronto
can even compete with London and New York on some measures.
Toronto outranks both cities in terms of cost factors, is more business
friendly than New York, and is essentially tied with London in the case
of bank profitability.
Given the difference in the results, it is clear that The Banker and
GFCi rankings are not completely comparable. For instance, the GFCi
combines quantitative results in five broad categories with its own survey
of global finance industry professionals to create an overall ranking.
Alternatively, The Banker compiles financial data in areas ranging from
economic potential to business environment.6 All in all, the rankings
provided by The Banker are more data-driven, while the GFCi’s also
reflect survey responses.
Employment in Global Financial Centres
Beyond these surveys, Toronto ranked highly compared with other global
financial centres in terms of employment. indeed, 251,000 people were
employed in Toronto’s financial services sector in 2014, meaning the city
ranked 6th among the global financial centres we consider here. (see
Chart 34.) However, Zurich is the only city that is more dependent than
Toronto on the financial services sector. (see Chart 35.) with financial
services accounting for 8.1 per cent of the metro area’s employment,
6 ibid.
Toronto ranks above singapore and Hong Kong when it comes to outward Fdi, financial markets, and international debt security issuance.
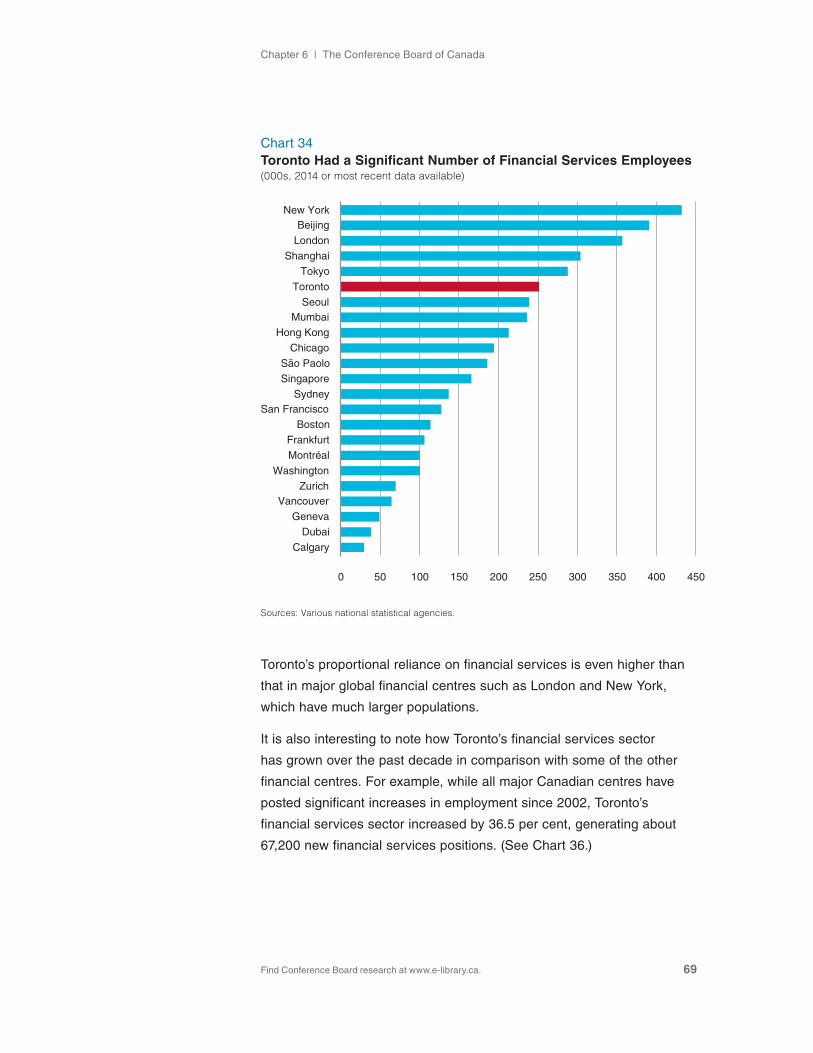
Chapter 6 | The Conference Board of Canada
Find Conference Board research at www.e-library.ca. 69
Toronto’s proportional reliance on financial services is even higher than
that in major global financial centres such as London and New York,
which have much larger populations.
it is also interesting to note how Toronto’s financial services sector
has grown over the past decade in comparison with some of the other
financial centres. For example, while all major Canadian centres have
posted significant increases in employment since 2002, Toronto’s
financial services sector increased by 36.5 per cent, generating about
67,200 new financial services positions. (see Chart 36.)
Chart 34 Toronto Had a Significant Number of Financial Services Employees(000s, 2014 or most recent data available)
Sources: Various national statistical agencies.
Calgary
DubaiGeneva
VancouverZurich
Washington
Montréal
Frankfurt
Boston
San FranciscoSydney
SingaporeSão Paolo
Chicago
Hong Kong
MumbaiSeoul
Toronto
Tokyo
Shanghai
London
BeijingNew York
0 50 100 150 200 250 300 350 400 450
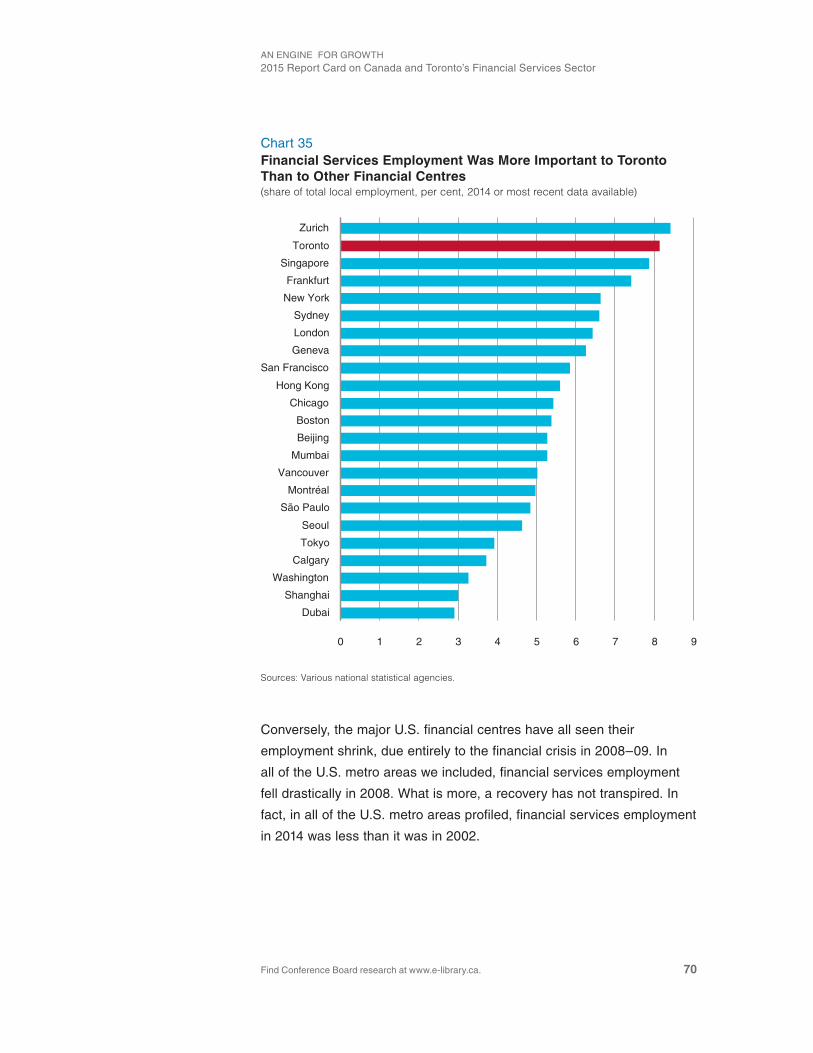
AN ENGiNE FOR GROwTH2015 Report Card on Canada and Toronto’s Financial services sector
Find Conference Board research at www.e-library.ca. 70
Conversely, the major U.s. financial centres have all seen their
employment shrink, due entirely to the financial crisis in 2008–09. in
all of the U.s. metro areas we included, financial services employment
fell drastically in 2008. what is more, a recovery has not transpired. in
fact, in all of the U.s. metro areas profiled, financial services employment
in 2014 was less than it was in 2002.
Chart 35Financial Services Employment Was More Important to Toronto Than to Other Financial Centres(share of total local employment, per cent, 2014 or most recent data available)
Sources: Various national statistical agencies.
Zurich
Toronto
Singapore
Frankfurt
New York
Sydney
London
Geneva
San Francisco
Hong Kong
Chicago
Boston
Beijing
Mumbai
Vancouver
Montréal
São Paulo
Seoul
Tokyo
Calgary
Washington
Shanghai
Dubai
0 1 2 3 4 5 6 7 8 9
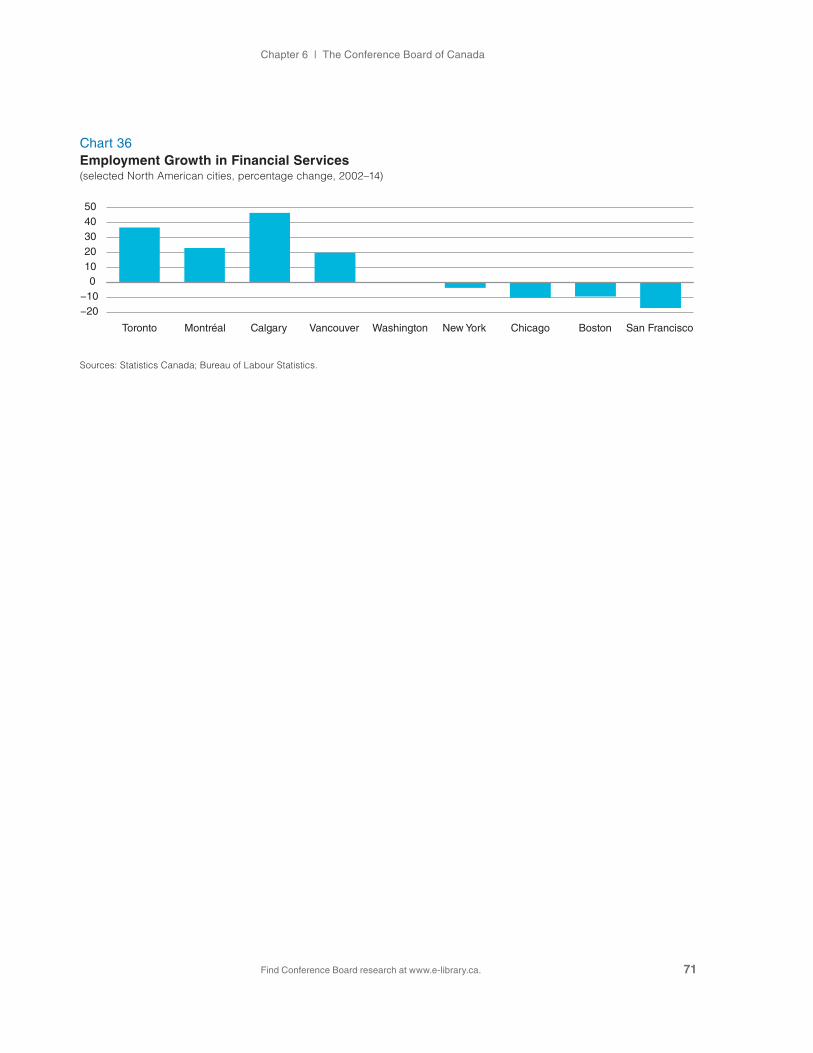
Chapter 6 | The Conference Board of Canada
Find Conference Board research at www.e-library.ca. 71
Chart 36Employment Growth in Financial Services(selected North American cities, percentage change, 2002–14)
Sources: Statistics Canada; Bureau of Labour Statistics.
−20−10
01020304050
MontréalToronto Calgary WashingtonVancouver New York Chicago Boston San Francisco

Find Conference Board research at www.e-library.ca.
CHAPTER 7
Conclusion
Chapter summary
• Looking only at employment understates the importance of the financial services sector to Canada’s economy. For example, the sector accounts for 26 per cent of private sector profits and 52 per cent of the stock of outward Fdi.
• Financial services have been a major source of growth for the Canadian economy over the past decade. The sector’s employment, financial results, and international trade and investment performance outpaced the average for all sectors.
• Key areas of strength for the sector include its financial and international trade and investment performance, but its productivity performance has been more modest.
• Toronto’s role as Canada’s largest financial hub has grown domestically and internationally. The sector’s share of domestic activity has increased, while its ranking among international financial centres has improved.

Chapter 7 | The Conference Board of Canada
Find Conference Board research at www.e-library.ca. 73
Our analysis has shown that the financial services sector is a critical part of the Canadian economy, and this is apparent in a myriad of ways. For example, the sector directly accounts for 4.4 per cent of Canadian employment, but this figure understates the impact of the sector in many ways. At the same time, it accounts for 20 per cent of Canada’s foreign affiliate sales, 26 per cent of the net profits generated by the private sector, and 52 per cent of the stock of outward FDI undertaken by Canadian firms.
Furthermore, the sector’s importance is growing. For most of the
indicators we looked at in this report—including employment, GdP,
private sector sales and profitability, and international trade and
investment—the sector’s share of Canadian activity has grown over
the past decade.
Beyond the direct footprint of the sector, it plays an important role as a
facilitator in the economy. Key functions that the financial services sector
provides, which essentially all consumers and business require, include
access to credit, transaction processing, and risk management services.
without these services, a modern, dynamic, and resilient economy
is impossible.
Thus, the financial services sector links the economy together in a
unique way. Financial services are a necessary input for every single
business across the country and are used by essentially every adult
individual. Only a handful of other sectors, such as telecommunications
and transportation, have the same impact on the day-to-day functioning
of the economy.
Given the size and growing importance of the sector, as well as its
facilitator role, assessing its performance is critical. in this report,
we have examined how financial services compare with other sectors
domestically, and with its peers internationally, in terms of financial

AN ENGiNE FOR GROwTH2015 Report Card on Canada and Toronto’s Financial services sector
Find Conference Board research at www.e-library.ca. 74
performance, innovation/productivity performance, and international
trade and investment performance. Broadly speaking, the sector is
well-positioned for future growth.
in terms of financial performance, the sector generally does well. it
has high profit margins but slightly below-average rates of return on
equity compared with other Canadian sectors. But, when compared
with financial institutions in other jurisdictions, Canadian firms fair
considerably better. deposit-taking institutions and insurers in Canada
both have ROE that is above those found in most countries with major
global financial centres. As well, Canadian deposit-taking institutions
stand out for having very low rates of non-performing loans, which is a
positive indicator for their future profitability.
The sector also outperforms when it comes to international trade and
investment. Growth in exports, investment, and foreign affiliate sales
for Canadian financial institutions have all been considerably stronger
than average. For example, financial services are Canada’s largest
and fastest-growing source of services exports. in fact, the size of the
sector’s international footprint means that it is now one of the most
common ways that foreigners interact with Canadian businesses.
Among the indicators we examined here, productivity is where the
sector could most improve its performance. Although financial institutions
reported a high rate of innovation compared with other sectors in
Canada, these innovations have been slow to materialize into labour
productivity growth. Canada’s financial services sector underperforms
the average for all domestic sectors—as well as some international—
peers on this measure.
it is in this environment that we focus on Toronto’s role in Canada’s
financial sector. Toronto has accounted for a growing share of the sector
domestically, and its ranking relative to other global financial centres is
high and improving. Given its status as Canada’s largest financial hub,
Toronto has a key role to play in the further development of the sector.
As well, given the growing importance of the sector to both Canada’s
and Toronto’s economies, we need to get the policy environment right,

Chapter 7 | The Conference Board of Canada
Find Conference Board research at www.e-library.ca. 75
balancing risks with the opportunities at home and abroad. if successful,
the sector will continue to be a source of growth for both Toronto
and Canada.
Tell us how we’re doing—rate this publication.
www.conferenceboard.ca/e-Library/abstract.aspx?did=7573
AN ENGiNE FOR GROwTH2015 Report Card on Canada and Toronto’s Financial services sector
Find Conference Board research at www.e-library.ca. 76
APPENDIX A
Bibliography
Ai, Lin. A Head for Finance: Growing Financial Services Headquarters
in Toronto. Ottawa: The Conference Board of Canada, 2014.
Ai, Lin, and Michael Burt. Going Abroad: Examining the
International Footprint of Canada’s Financial Services Sector.
Ottawa: The Conference Board of Canada, 2014.
Bank of international settlements. Basel III: A Global Regulatory
Framework for More Resilient Banks and Banking Systems. Basel:
Bank of international settlements, 2010.
Beck, Thorsten, Tao Chen, Chen Lin, and Frank M. song. Financial
Innovation: The Bright and Dark Sides. Hong Kong: Hong Kong institute
for Monetary Research, 2012.
Burt, Michael, Kristelle Audet, and Maxim Armstrong. Marketing’s
Influence in Canada: In an Evolving Digital Economy. don Mills:
Canadian Marketing Association, 2012.
Burt, Michael, Kristelle Audet, and Greg sutherland. Ensuring the Future:
Understanding the Importance of Toronto’s Financial Services Sector.
Ottawa: The Conference Board of Canada, 2013.
City of Toronto. 2013 Consolidated Financial Statements: City of Toronto
Financial Report. Toronto: City of Toronto, 2014.
Crawford, Todd. Canadian Credit Unions: Different by Design. Ottawa:
The Conference Board of Canada, 2015.

Find Conference Board research at www.e-library.ca. 77
Appendix A | The Conference Board of Canada
Government of Canada. Strong Leadership: A Balanced Budget,
Low-Tax Plan for Jobs, Growth and Security. Ottawa: Government of
Canada, 2015.
Government of Ontario. Building Opportunity, Securing Our Future:
Ontario Budget 2014. Toronto: Government of Ontario, 2015.
international Monetary Fund. Financial Soundness Indicators:
Compilation Guide. washington, d.C.: iMF, 2006.
Office of the superintendent of Financial institutions. Capital Adequacy
Requirements. Office of the superintendent of Financial institutions,
www.osfi-bsif.gc.ca/Eng/fi-if/rg-ro/gdn-ort/gl-ld/Pages/CAR_chpt1.aspx.
Organisation for Economic Co-operation and development. Global
Insurance Market Trends 2014. Paris: OECd, 2015.
Palladini, Jacquie. Spotlight on Services in Canada’s Global Commerce.
Ottawa: The Conference Board of Canada, 2015.
Pavoni, silvia. London stays Top on iFC Tree: iFC Rankings—
Full Results. The Banker, 2015.
Pensions and investments, and Towers watson. Pensions and
Investments/Towers Watson Global 300 Analysis. New York:
Towers watson, 2015.
statistics Canada. Labour Force Survey. 2015. www23.statcan.gc.ca/
imdb/p2sV.pl?Function=getsurvey&sdds=3701.
—. CANsiM table 031-0003. Flows and Stocks of Fixed Non-Residential
Capital, by Sector of North American Industry Classification System
(NAICS) and Asset, Canada, *Terminated.* www5.statcan.gc.ca/cansim/
a26?lang=eng&id=310003.
—. CANsiM table 031-0005. Flows and Stocks of Fixed Non-Residential
Capital, by Industry and Asset, Canada, Provinces and Territories.
www5.statcan.gc.ca/cansim/a26?lang=eng&retrLang=eng&id=031000
5&pattern=031-0005..031-0008&tabMode=dataTable&srchLan=-1&p1=-
1&p2=31.

AN ENGiNE FOR GROwTH2015 Report Card on Canada and Toronto’s Financial services sector
Find Conference Board research at www.e-library.ca. 78
—. CANsiM table 187-0001. Quarterly Balance Sheet and Income
Statement, by North American Industry Classification System (NAICS).
www5.statcan.gc.ca/cansim/a26?lang=eng&id=1870001.
—. CANsiM table 280-0003. Trusteed Pension Funds, Market and Book
Value of Assets, by Foreign and Domestic Holdings. www5.statcan.
gc.ca/cansim/pick-choisir?lang=eng&p2=33&id=2800003.
—. CANsiM table 281-0026. Survey of Employment, Payrolls and Hours
(SEPH), Average Weekly Earnings by Type of Employee, Overtime
Status and Detailed North American Industry Classification System
(NAICS), Unadjusted for Seasonality. www5.statcan.gc.ca/cansim/
a26?lang=eng&id=2810026.
—. CANsiM table 282-0008. Labour Force Survey Estimates (LFS), by
North American Industry Classification System (NAICS), Sex and Age
Group. www5.statcan.gc.ca/cansim/a26?lang=eng&id=2820008.
—. CANsiM table 358-0223. Survey of Innovation and Business
Strategy, Advanced Technology Use, by North American Industry
Classification System (NAICS) and Enterprise Size. www5.statcan.
gc.ca/cansim/a26?lang=eng&retrLang=eng&id=3580223&pattern=358-
0221..358-0223&tabMode=dataTable&srchLan=-1&p1=-1&p2=31.
—. CANsiM table 358-0307. Survey of Innovation and Business
Strategy, Performance Indicators Used to Monitor Long-Term Strategic
Objectives, by North American Industry Classification System (NAICS)
and Enterprise Size, All Surveyed Industries. www5.statcan.gc.ca/
cansim/a26?lang=eng&retrLang=eng&id=3580307&&pattern=&stByVal=1
&p1=1&p2=31&tabMode=dataTable&csid=.
—. CANsiM table 358-0323. Survey of Innovation and Business
Strategy, Human Resource Practices Used, by North American Industry
Classification System (NAICS) and Enterprise Size, All Surveyed
Industries. www5.statcan.gc.ca/cansim/a26?lang=eng&retrLang=eng&id
=3580323&pattern=358-0319..358-0323&tabMode=dataTable&srchLan=-
1&p1=-1&p2=31.

Find Conference Board research at www.e-library.ca. 79
Appendix A | The Conference Board of Canada
—. CANsiM table 379-0031. Gross Domestic Product (GDP) at Basic
Prices, by North American Industry Classification System (NAICS).
www5.statcan.gc.ca/cansim/a26?lang=eng&id=3790031.
sutherland, Greg. Performance and Potential: Toronto’s Financial
Services Sector 2014. Ottawa: The Conference Board of Canada, 2014.
The Conference Board of Canada. How Canada Performs:
Labour Productivity Growth. The Conference Board of Canada,
www.conferenceboard.ca/hcp/details/economy/measuring-productivity-
canada.aspx.
world Economic Forum. The Global Competitiveness Report 2014–2015.
Geneva: world Economic Forum, 2014.
—. Rethinking Financial Innovation: Reducing Negative Outcomes While
Retaining the Benefits. Geneva: world Economic Forum, 2012.
Yeandle, Mark. The Global Financial Centres Index 18. London:
Long Finance, 2015.
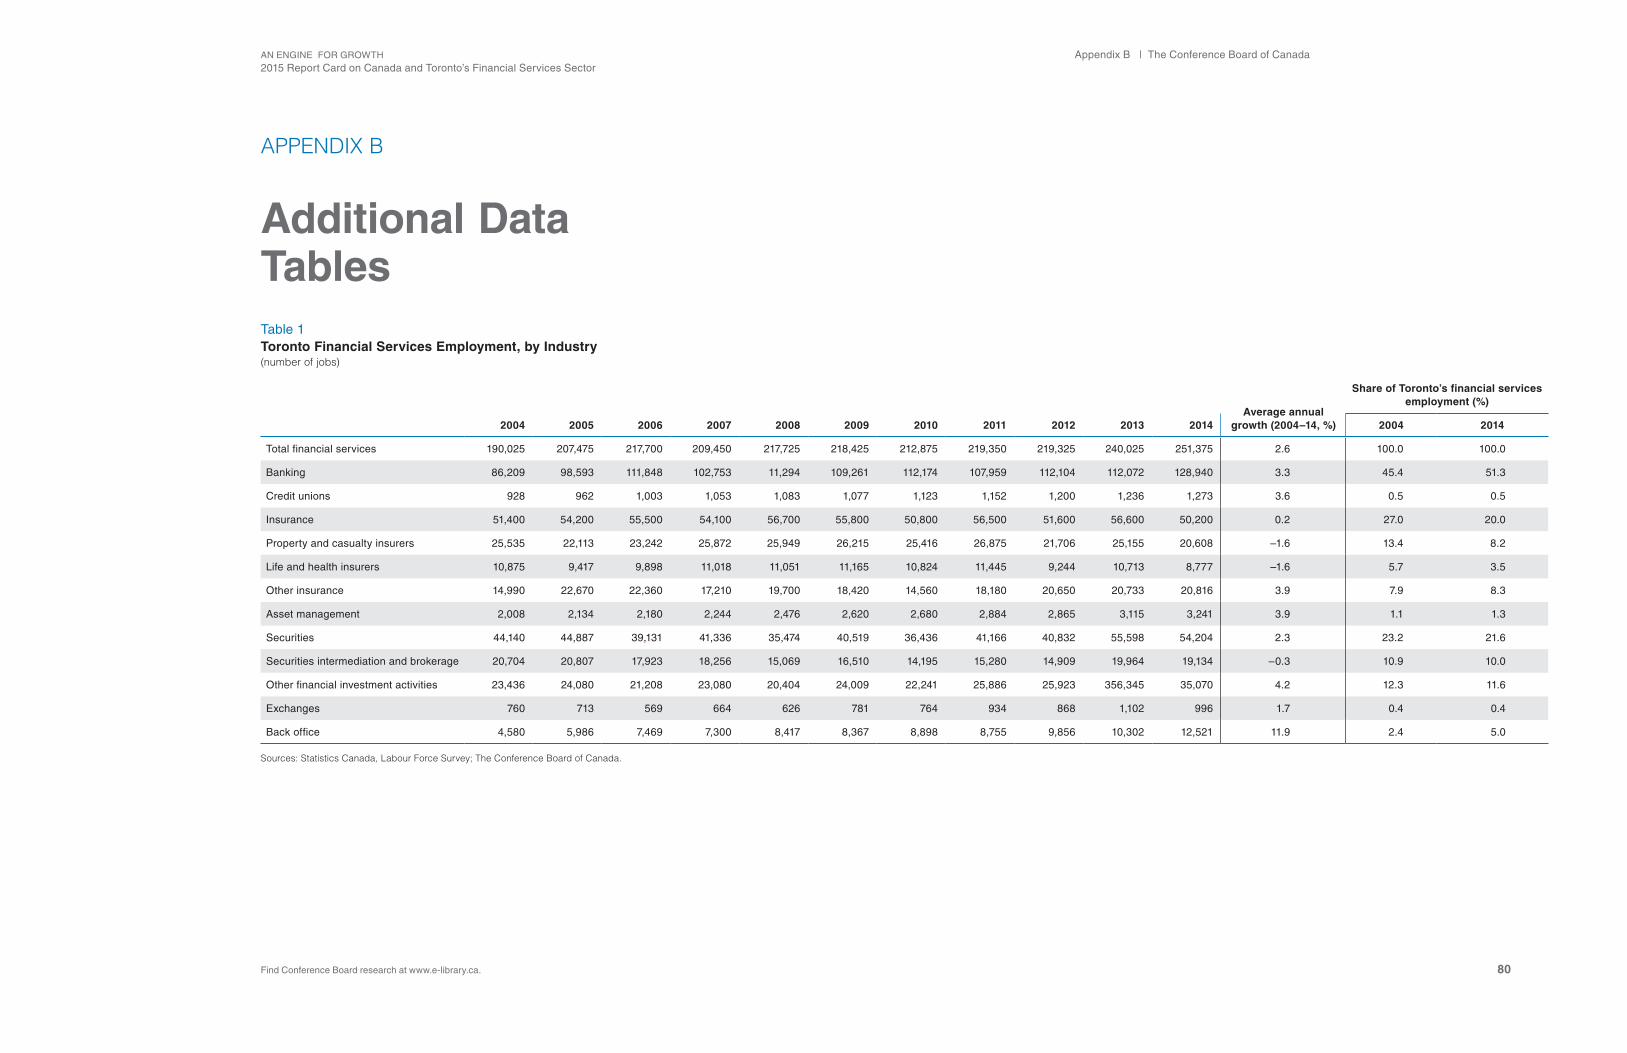
AN ENGiNE FOR GROwTH2015 Report Card on Canada and Toronto’s Financial services sector
Find Conference Board research at www.e-library.ca. 80
Appendix B | The Conference Board of Canada
APPENDIX B
Additional Data Tables Table 1Toronto Financial Services Employment, by Industry(number of jobs)
Share of Toronto’s financial services employment (%)
Average annual growth (2004–14, %)2004 2005 2006 2007 2008 2009 2010 2011 2012 2013 2014 2004 2014
Total financial services 190,025 207,475 217,700 209,450 217,725 218,425 212,875 219,350 219,325 240,025 251,375 2.6 100.0 100.0
Banking 86,209 98,593 111,848 102,753 11,294 109,261 112,174 107,959 112,104 112,072 128,940 3.3 45.4 51.3
Credit unions 928 962 1,003 1,053 1,083 1,077 1,123 1,152 1,200 1,236 1,273 3.6 0.5 0.5
insurance 51,400 54,200 55,500 54,100 56,700 55,800 50,800 56,500 51,600 56,600 50,200 0.2 27.0 20.0
Property and casualty insurers 25,535 22,113 23,242 25,872 25,949 26,215 25,416 26,875 21,706 25,155 20,608 –1.6 13.4 8.2
Life and health insurers 10,875 9,417 9,898 11,018 11,051 11,165 10,824 11,445 9,244 10,713 8,777 –1.6 5.7 3.5
Other insurance 14,990 22,670 22,360 17,210 19,700 18,420 14,560 18,180 20,650 20,733 20,816 3.9 7.9 8.3
Asset management 2,008 2,134 2,180 2,244 2,476 2,620 2,680 2,884 2,865 3,115 3,241 3.9 1.1 1.3
securities 44,140 44,887 39,131 41,336 35,474 40,519 36,436 41,166 40,832 55,598 54,204 2.3 23.2 21.6
securities intermediation and brokerage 20,704 20,807 17,923 18,256 15,069 16,510 14,195 15,280 14,909 19,964 19,134 –0.3 10.9 10.0
Other financial investment activities 23,436 24,080 21,208 23,080 20,404 24,009 22,241 25,886 25,923 356,345 35,070 4.2 12.3 11.6
Exchanges 760 713 569 664 626 781 764 934 868 1,102 996 1.7 0.4 0.4
Back office 4,580 5,986 7,469 7,300 8,417 8,367 8,898 8,755 9,856 10,302 12,521 11.9 2.4 5.0
Sources: Statistics Canada, Labour Force Survey; The Conference Board of Canada.
Find Conference Board research at www.e-library.ca. 81
Appendix B | The Conference Board of Canada
Table 1Toronto Financial Services Employment, by Industry(number of jobs)
Share of Toronto’s financial services employment (%)
Average annual growth (2004–14, %)2004 2005 2006 2007 2008 2009 2010 2011 2012 2013 2014 2004 2014
Total financial services 190,025 207,475 217,700 209,450 217,725 218,425 212,875 219,350 219,325 240,025 251,375 2.6 100.0 100.0
Banking 86,209 98,593 111,848 102,753 11,294 109,261 112,174 107,959 112,104 112,072 128,940 3.3 45.4 51.3
Credit unions 928 962 1,003 1,053 1,083 1,077 1,123 1,152 1,200 1,236 1,273 3.6 0.5 0.5
insurance 51,400 54,200 55,500 54,100 56,700 55,800 50,800 56,500 51,600 56,600 50,200 0.2 27.0 20.0
Property and casualty insurers 25,535 22,113 23,242 25,872 25,949 26,215 25,416 26,875 21,706 25,155 20,608 –1.6 13.4 8.2
Life and health insurers 10,875 9,417 9,898 11,018 11,051 11,165 10,824 11,445 9,244 10,713 8,777 –1.6 5.7 3.5
Other insurance 14,990 22,670 22,360 17,210 19,700 18,420 14,560 18,180 20,650 20,733 20,816 3.9 7.9 8.3
Asset management 2,008 2,134 2,180 2,244 2,476 2,620 2,680 2,884 2,865 3,115 3,241 3.9 1.1 1.3
securities 44,140 44,887 39,131 41,336 35,474 40,519 36,436 41,166 40,832 55,598 54,204 2.3 23.2 21.6
securities intermediation and brokerage 20,704 20,807 17,923 18,256 15,069 16,510 14,195 15,280 14,909 19,964 19,134 –0.3 10.9 10.0
Other financial investment activities 23,436 24,080 21,208 23,080 20,404 24,009 22,241 25,886 25,923 356,345 35,070 4.2 12.3 11.6
Exchanges 760 713 569 664 626 781 764 934 868 1,102 996 1.7 0.4 0.4
Back office 4,580 5,986 7,469 7,300 8,417 8,367 8,898 8,755 9,856 10,302 12,521 11.9 2.4 5.0
Sources: Statistics Canada, Labour Force Survey; The Conference Board of Canada.
Table 2Number of Financial Services Sector Firms Operating in Toronto, by Employment Size
Number of enterprises Share of enterprises (%)
Number of employees Total 1–9 10–19 20–99 100–199 200+ 1–9 10–19 20–99 100–199 200+
All industries 201,973 154,951 21,029 21,044 2,774 2,175 76.7 10.4 10.4 1.4 1.1
All financial services 8,586 5,648 829 1,749 155 205 65.8 9.7 20.4 1.8 2.4
Banking 1,829 405 260 1,109 21 34 22.1 14.2 60.6 1.1 1.9
depository credit intermediation
1,374 68 221 1,053 12 20 4.9 16.1 76.6 0.9 1.5
Credit card issuers, sales financing, consumer lending
177 113 18 33 3 10 63.8 10.2 18.6 1.7 5.6
All other banking 278 224 21 23 6 4 80.6 7.6 8.3 2.2 1.4
Credit unions 78 30 23 22 2 1 38.5 29.5 28.2 2.6 1.3
insurance 2,160 1,635 191 258 36 40 75.7 8.8 11.9 1.7 1.9
Life and health insurers 158 79 16 37 11 15 50.0 10.1 23.4 7.0 9.5
Property and casualty insurers
168 74 13 49 16 16 44.0 7.7 29.2 9.5 9.5
Other insurers 1,834 1,482 162 172 9 9 80.8 8.8 9.4 0.5 0.5
Asset management 198 161 13 15 3 6 81.3 6.6 7.6 1.5 3.0
securities 3,682 2,871 302 320 90 99 78.0 8.2 8.7 2.4 2.7
securities intermediation and brokerage
623 382 104 89 28 20 61.3 16.7 14.3 4.5 3.2
Other financial investment activities
3,059 2,489 198 231 62 79 81.4 6.5 7.6 2.0 2.6
Exchanges 18 10 2 1 1 4 55.6 11.1 5.6 5.6 22.2
Back office 621 536 38 24 2 21 86.3 6.1 3.9 0.3 3.4
Source: Statistics Canada, Canadian Business Patterns.

e-Library. Do you want to have access to expert thinking on the issues that really matter to you and your organization?
Our e-Library contains hundreds of Conference Board research studies in the areas of Organizational Performance, Economic Trends and Forecasts, and Public Policy.
www.e-library.ca
Insights. Understanding. Impact.

About The Conference Board of Canada
We are:
• The foremost independent, not-for-profit, applied research organization in Canada.
• Objective and non-partisan. We do not lobby for specific interests.• Funded exclusively through the fees we charge for services to the
private and public sectors.• Experts in running conferences but also at conducting, publishing,
and disseminating research; helping people network; developing individual leadership skills; and building organizational capacity.
• Specialists in economic trends, as well as organizational performance and public policy issues.
• Not a government department or agency, although we are often hired to provide services for all levels of government.
• Independent from, but affiliated with, The Conference Board, Inc. of New York, which serves nearly 2,000 companies in 60 nations and has offices in Brussels and Hong Kong.

255 smyth Road, Ottawa ON
K1H 8M7 Canada
Tel. 613-526-3280
Fax 613-526-4857
inquiries 1-866-711-2262
conferenceboard.ca
Insights. Understanding. Impact.
PUBLiCATiON 7573
PRiCE: COMPLiMENTARY
Recommended


![Research Institute for Ubiquitous Energy Devices National ... · Tm = 808 oc LiTFSA, LiBF4 ex. [EMI] [TFSA] -12 oc EMIBF4+ LiBF4 ex. Li[FTA] Tm = 100 oc Tm of TFSA salts containing](https://img.pdfslide.net/doc/110x75/5f32e3cc03c2980b6908199b/research-institute-for-ubiquitous-energy-devices-national-tm-808-oc-litfsa.jpg)