National Recreation and Park Association | 1
The Economic Impact of Local Parks
An Examination of the Economic Impacts of Operations and Capital Spending on the United States Economy
i | The Economic Impact of Local Parks
Center for Regional Analysis
The Center for Regional Analysis, housed in the School of Policy, Government, and International Affairs at George Mason University, is the premier university-based regional economic research center in the Washing-ton, D.C. Metropolitan Area. The Center provides regionally relevant, globally informed research for businesses, governments, and nonprofit agencies.
Terry L. Clower, Ph.D. – Director
Jeannette Chapman – Research Associate
Keunwon (Abraham) Song – Graduate Research Assistant
© 2015 National Recreation and Park Association
National Recreation and Park Association | ii
TABLE OF CONTENTS
Executive Summary . . . . . . . . . . . . . . . . . . . . . . . . . . . . . . . . . . . . . . . . . . . . . . . . . . . . . . . . . . . . . . . . . . . . . . . . . . . . iii
Introduction………………………………………………………………………………… . . . 1
Methods . . . . . . . . . . . . . . . . . . . . . . . . . . . . . . . . . . . . . . . . . . . . . . . . . . . . . . . . . . . . . . . . . . . . . . . . . . . . . . . . . . . . . . . . . . . . . . . 2
National Analysis . . . . . . . . . . . . . . . . . . . . . . . . . . . . . . . . . . . . . . . . . . . . . . . . . . . . . . . . . . . . . . . . . . . . . . . . . . . . . . . . . 3
Summary of Findings - National Analysis . . . . . . . . . . . . . . . . . . . . . . . . . . . . . . . . . . . . 4
State-Level Analysis . . . . . . . . . . . . . . . . . . . . . . . . . . . . . . . . . . . . . . . . . . . . . . . . . . . . . . . . . . . . . . . . . . . . . . . . . . . . . 5
Case Study Analysis . . . . . . . . . . . . . . . . . . . . . . . . . . . . . . . . . . . . . . . . . . . . . . . . . . . . . . . . . . . . . . . . . . . . . . . . . . . . . 7
References . . . . . . . . . . . . . . . . . . . . . . . . . . . . . . . . . . . . . . . . . . . . . . . . . . . . . . . . . . . . . . . . . . . . . . . . . . . . . . . . . . . . . . . . . . 20
LISTING OF TABLES
Table 1: Economic Impacts of Local and Regional Public Parks on the United States Economy — 2013.. . . . . . . . . . . . . . . . . . . . . . . . . . . . . . . . . . . . . . . . . . . . . . . . . . . . . . . . . . . . . 4
Table 2: Economic Impacts of Spending by Local and Regional Parks by State………………………………………………………………………………… . . . . . . . . . . 5
Table 3: Park Typologies . . . . . . . . . . . . . . . . . . . . . . . . . . . . . . . . . . . . . . . . . . . . . . . . . . . . . . . . . . . . . . . . . . . . . . . . 7
Table 4: Parks Included in the Case Study Analysis . . . . . . . . . . . . . . . . . . . . . . . . . . . . . . . . 8
Tables of Economic Impacts by Park . . . . . . . . . . . . . . . . . . . . . . . . . . . . . . . . . . . . . . . . . . . . . . . . . . . . . . 9
5a: Forest Park
5b: Shawnee Mission Park
5c: Martin Luther King, Jr. Memorial Park
5d: Waterfront Park
5e: Elgin Sports Complex
5f: City Park
5g: Reid Park Zoo
5h: Balloon Fiesta Park
5i: Fossil Trace Golf Club
5j: Memorial Park
5k: Sleepy Hollow Golf Course
5l: Atlanta BeltLine Park
5m: Great Miami River Bikeway
5n: Carpenter Park Recreation Center
5o: Henderson Multigenerational Center
5p: Monon Community Center
5q: Highland Heritage Regional Park
5r: Winton Woods Park
5s: Electric City Water Park
5t: San Gabriel River Trail
5u: South Germantown Park
iii | The Economic Impact of Local Parks
EXECUTIVE SUMMARY
The following summarizes the research findings of the Center for Regional Analysis on the economic impact of local and regional public park systems’ spending in the United States. This research, commissioned by the Na-tional Recreation and Park Association (NRPA), adds to the growing body of evidence that the benefits of parks extend well beyond their role as a public amenity and an enhancement to quality of life in their communities.
The analyses reported here cover three areas: a national-level study, state-level assessments, and economic impacts of selected case study parks. Key characteristics of the research include the following:
• The study is focused exclusively on the direct, indirect (business transactions of park agency ven-dors) and induced (employees spending their earnings) effects local and regional park agencies’ spending have on economic activity. The research does not measure the effects of visitor spending or the benefits local and regional park agencies generate for the environment, health and wellness, and property values.
• Data for this analysis come from the U.S. Census Bureau survey of local government employment and spending data from 1,169 local and regional park agencies accessed from NRPA’s PRORAGIS database and/or park system budget data posted online. Data for the case study park analysis were supplied by the relevant park agencies.
• Data analysis tasks employed economic input-output multipliers developed by IMPLAN, Inc. and the U.S. Bureau of Economic Analysis. The analyses provide estimates of economic activity (output or the value of transactions), value added (equivalent to gross domestic product), labor income (sala-ries, wages and benefits) and employment (headcount jobs).
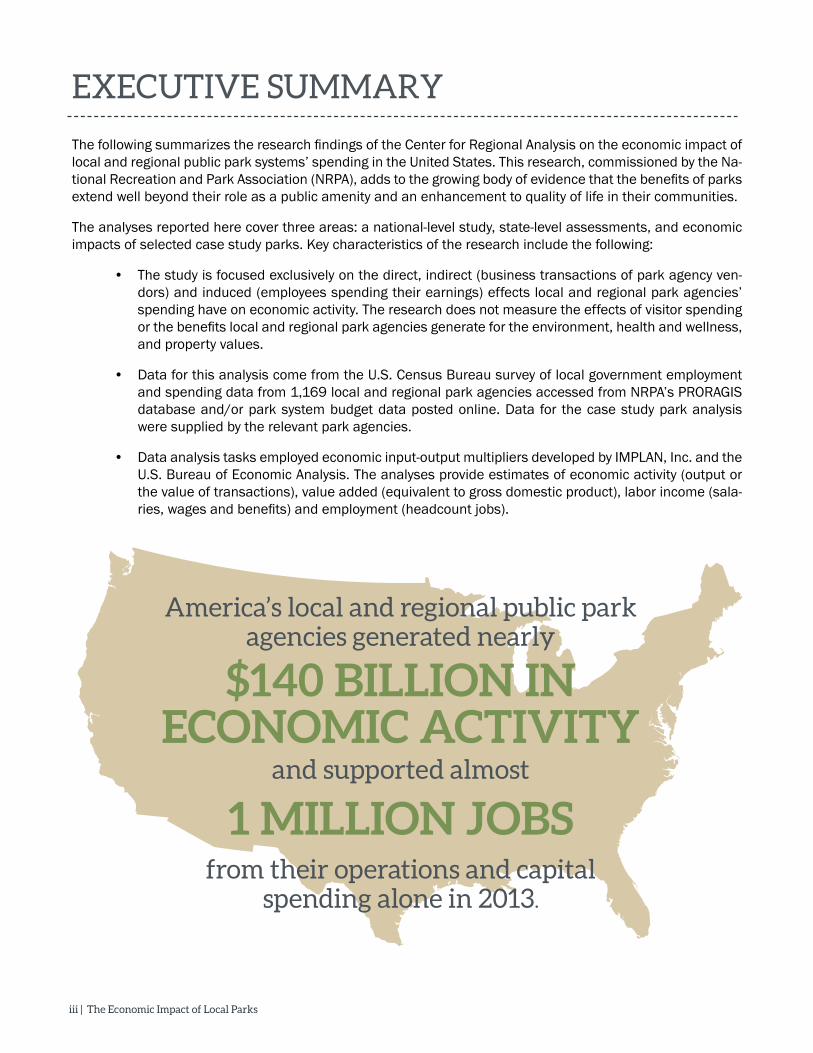
America’s local and regional public park agencies generated nearly
$140 BILLION IN ECONOMIC ACTIVITY
and supported almost
1 MILLION JOBS from their operations and capital
spending alone in 2013.
National Recreation and Park Association | iv
Economic Impact of Local and Regional Public Parkson the United States Economy — 2013
Operating Impacts
Capital Spending Impacts
Total Impact of Local and Regional Parks’
Spending
Economic Activity (transactions) $79,972,818,000 $59,655,408,000 $139,628,226,000
Value Added (GDP) $38,782,352,000 $29,169,189,000 $67,951,541,000
Labor Income (salaries, wages, benefits)
$24,176,431,000 $19,613,750,000 $43,790,181,000
Employment (jobs) 658,478 jobs 340,604 jobs 999,082 jobs
Sources: U.S. Census Bureau, PRORAGIS, IMPLAN (RIMS), Center for Regional Analysis
Key Findings From the National Study
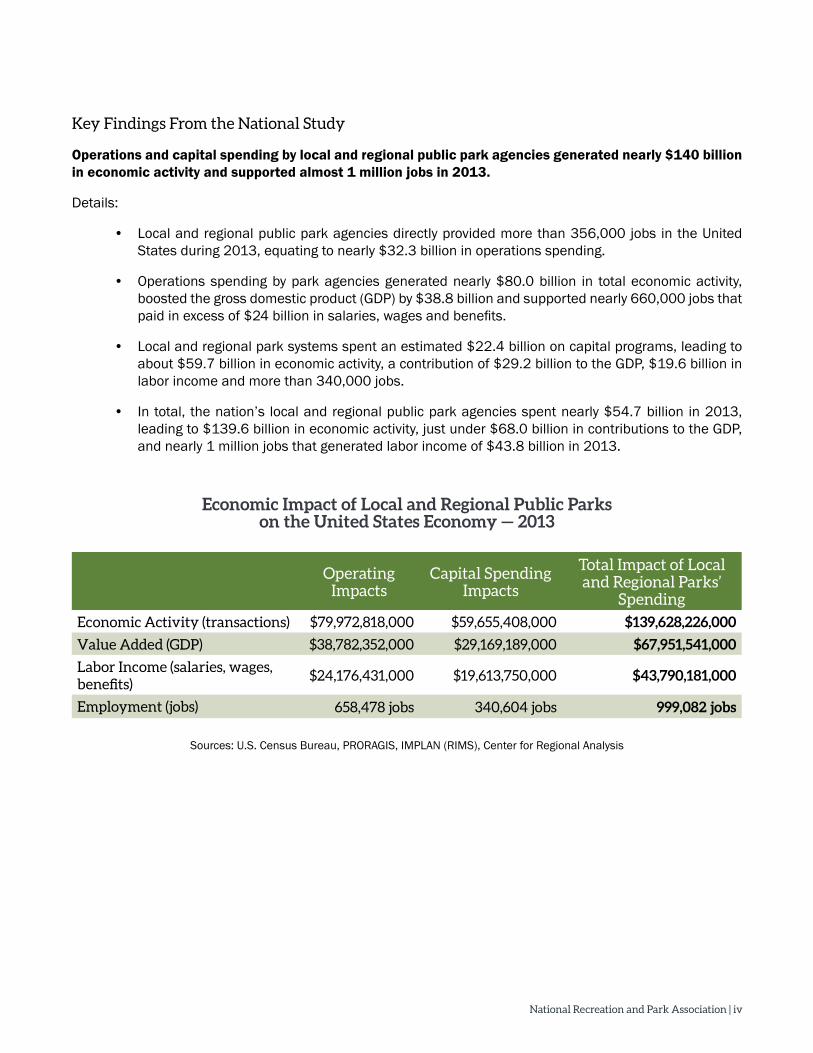
Operations and capital spending by local and regional public park agencies generated nearly $140 billion in economic activity and supported almost 1 million jobs in 2013.
Details:
• Local and regional public park agencies directly provided more than 356,000 jobs in the United States during 2013, equating to nearly $32.3 billion in operations spending.
• Operations spending by park agencies generated nearly $80.0 billion in total economic activity, boosted the gross domestic product (GDP) by $38.8 billion and supported nearly 660,000 jobs that paid in excess of $24 billion in salaries, wages and benefits.
• Local and regional park systems spent an estimated $22.4 billion on capital programs, leading to about $59.7 billion in economic activity, a contribution of $29.2 billion to the GDP, $19.6 billion in labor income and more than 340,000 jobs.
• In total, the nation’s local and regional public park agencies spent nearly $54.7 billion in 2013, leading to $139.6 billion in economic activity, just under $68.0 billion in contributions to the GDP, and nearly 1 million jobs that generated labor income of $43.8 billion in 2013.
1 | The Economic Impact of Local Parks
INTRODUCTION
The following reports the findings of the analysis of the economic impacts of spending by local park systems in the United States. This research adds to the growing body of evidence that the impacts of parks extend well be-yond their role as a public amenity and enhancement to quality of life in communities across the United States.
The academic and professional literature has established well-recognized contributions of parks to quality of life. This is evidenced by multiple studies that indicate residents prefer to live in proximity to a quality park system. The National Association of Home Builders reports that the presence of parks seriously influences 65 percent of home buyers. A 2001 study by the National Association of Realtors found that 50 percent of survey respondents would be more likely to choose a neighborhood near parks or open spaces and are willing to pay more to be located close to a park or open space. This has led much of the research to focus on the impacts of parks on nearby property values.
Another common approach to assessing the impacts of park systems is to examine the local and/or regional economic consequences of spending by non-local park visitors. There are dozens, if not hundreds, of these types of analyses conducted for individual park venues, such as for entertainment, golf courses and aquatic parks, and broader studies of state parks and park systems. There are recurring studies assessing the eco-nomic contributions of national parks on local, state and the national economies. In 2011, the National Fish and Wildlife Foundation sponsored a study that estimated the economic value of all outdoor recreation, nature conservation, and historic preservation activities and venues, not including motorized sports, boosted national economic activity by more than $1 trillion and supported 9.4 million jobs.
Emerging areas of research include assessing the economic impacts of parks in terms of carbon mitigation (usually based on vegetation coverage) and the health effects park visitors enjoy from exercise and stress relief associated with park and park facility visits. Increasingly, these studies include estimating the economic value of these impacts. For example, regular visitors to recreation facilities have lower incidences of obesity, which lowers healthcare spending for hypertension, cardiac disease and diabetes.
The remaining type of impact research addresses the economic consequences of operations and capital spending by park systems. This is a common component of private-sector entertainment, amusement and other park facilities impact studies. For example, the International Association of Amusement Parks and At-tractions estimated that in 2011 the nearly 30,000 attractions in the United States generated $211 billion in economic activity. These types of economic benefits also come from public park-related expenditures. While there are national-level studies for amusement and similar parks (IAAPA) and state- and national-level studies of federal- and state-funded parks, we are not aware of a systematic assessment of the national economic impacts of local and regional public park systems.
This study fills that gap in the understanding of the impacts of local and regional park and recreation agency spending in the United States. This study looks at three levels of analysis. The first level is a study of the eco-nomic benefits of operations and capital spending by local and regional parks summarized at the national level. The second level provides state-by-state estimates for all 50 states and the District of Columbia. And, the third level offers analyses of the economic impacts of park-related spending for a selection of individual parks.
National Recreation and Park Association | 2
METHODS
As noted above, there are several approaches to assessing the economic value of park systems. The most common is what is generally termed as an economic impact analysis. Economic impact analyses provide esti-mates of the value of new spending as the dollars for goods and services move through the regional economy. Economic impact analyses provide information to allocate resources among competing projects, assess the potential returns to public (or private) investments and policies, and put “hard numbers” to political strategies.
However, as pointed out in a 2010 study sponsored by the National Recreation and Park Association, this terminology is not technically correct. Simply put, an “economic impact” analysis should be an assessment of the net impacts of spending that (a) does not include direct spending by public agencies, and (b) only counts non-local visitor spending for a subset of visitors. The alternative term for studies that examine the impacts of a broader set of spending offered in the NRPA report is a “significance analysis.” The report quotes Stynes (2001):
“Economic significance is ‘a measure of the importance or significance of the project/program (rather than its impacts) within the local economy which shows the size and nature of economic activity associated with the project/program in the area.’”1
In this study, we recognize the convention established by the 2010 NRPA report; however, while the use of the term “economic significance” is academically more correct, it means little to non-academic policymakers and the general public. At the same time, it is important to communicate the contribution operations and capital spending by local and regional park agencies has on economic activity and job creation in a manner consistent with the majority of other studies in the public domain. Therefore, we will keep with the common practice in the professional and academic literature and refer to the “economic impacts” of local and regional park spending in this report.
This study’s estimates of the economic impacts of local and regional public park agencies focus exclusively on operations and capital spending. What is not measured is economic activity generated by local and regional park systems from tourism. For our national-level analysis, the vast majority of visitor spending would be a net zero sum. If a resident of Kentucky visits a local park in Missouri, it would be a net gain for Missouri but a net loss for Kentucky. But, for the United States, there is no additional visitor spending. While there are a number of local parks that entertain visitors from outside the United States, this represents a very small portion of total visitors to local park systems across the nation.
With the state-level analyses, the assessment of the economic impacts of park-generated tourism spending is beyond the scope of this analysis, due largely to limitations on data availability. Therefore, we do not include visitor spending in the state-level assessments.
Further, the scope of the study does not consider the economic benefits resulting from other benefits of local and regional parks. This includes this study not attempting to assess the economic value of parks resulting from carbon mitigation and health-related benefits of parks.
1 Crompton (2010). Measuring the Economic Impact of Park and Recreation Services. National Recreation and Park Association
3 | The Economic Impact of Local Parks
NATIONAL ANALYSIS
Operations spending estimates for local park systems are derived from the Survey of Local Government Em-ployment in 2013 and the IMPLAN economic input-output model. This survey, conducted by the United States Census Bureau, provides an estimate of the number of individuals (head count) employed by local govern-ments in park and recreation departments. Using the number of employees, the IMPLAN model provides an estimate of total direct output, which is treated as operations spending for the park systems. The relationship between total spending and employment is based on national averages for entities operating in the park and recreation industry and closely related activities.
We derive estimates of local and regional capital spending by park agencies from data available in NRPA’s PRORAGIS database. In addition, we obtained budget records for more than 400 local park systems through Internet searches. In total, we had direct information on the ratio of capital spending to operating spending for 1,169 park systems. We applied the observed ratio of capital to operating spending to our estimates of operating spending to determine an estimated total for capital spending for all local and regional public park systems in the nation.
Note that this approach leaves out a component of capital spending. The capital spending observed from PRORAGIS and our document searches showed to be representative of major capital purchases and devel-opments. According to data in PRORAGIS, there are capital items, such as small equipment and vehicles, purchased through ordinary (annual) budgeting. Since the capital spending data does not specifically include these recurring capital expenditures, the study’s estimates of total capital spending among local and regional public parks are likely understated. More importantly, we report the impacts of capital spending separately since they are nonrecurring in nature. However, in any given year, one can reasonably assume that there will be substantial total capital spending among the nation’s local and regional public park systems.
Economic input-output models provide estimates of direct, indirect and induced effects of new spending. Di-rect effects are the spending by local and regional park systems, whether for operations or capital spending programs and include spending for equipment, utilities, goods, services and personnel costs. Indirect effects capture the spending associated with the park systems’ vendors. For example, a park system contracts with a local company to spray for mosquitoes. The pest control company, in turn, hires employees, purchases pes-ticides and contracts with a bookkeeping service. The bookkeeping service rents office space, hires workers, and purchases office supplies and so on. The model adjusts for spending that leaves the study area. In this study, the model would adjust for imports of materials and goods purchased from foreign sources. For exam-ple, some portion of the value of fuel used in park equipment will represent purchases of imported oil.
The model estimates the total effects on output, labor income, value added and employment. Output is essen-tially a measure of the value of transactions. Labor income includes salaries, wages and benefits. Value added is the measure most closely equivalent to gross domestic product (GDP) and includes property income, divi-dends, corporate profits and other measures. Employment is the number of headcount jobs. The databases used to build the economic input-output model account for full- versus part-time employment in the relevant sectors of the economy.
National Recreation and Park Association | 4
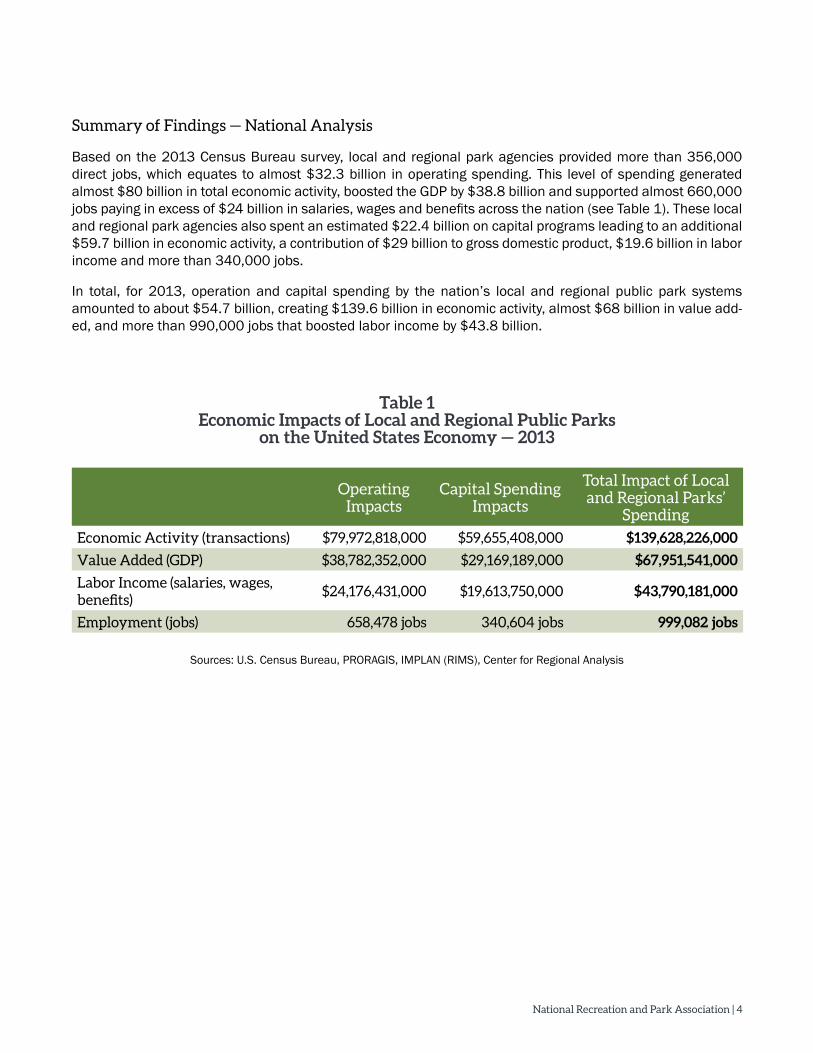
Summary of Findings — National Analysis
Based on the 2013 Census Bureau survey, local and regional park agencies provided more than 356,000 direct jobs, which equates to almost $32.3 billion in operating spending. This level of spending generated almost $80 billion in total economic activity, boosted the GDP by $38.8 billion and supported almost 660,000 jobs paying in excess of $24 billion in salaries, wages and benefits across the nation (see Table 1). These local and regional park agencies also spent an estimated $22.4 billion on capital programs leading to an additional $59.7 billion in economic activity, a contribution of $29 billion to gross domestic product, $19.6 billion in labor income and more than 340,000 jobs.
In total, for 2013, operation and capital spending by the nation’s local and regional public park systems amounted to about $54.7 billion, creating $139.6 billion in economic activity, almost $68 billion in value add-ed, and more than 990,000 jobs that boosted labor income by $43.8 billion.
Table 1Economic Impacts of Local and Regional Public Parks
on the United States Economy — 2013
Operating Impacts
Capital Spending Impacts
Total Impact of Local and Regional Parks’
Spending
Economic Activity (transactions) $79,972,818,000 $59,655,408,000 $139,628,226,000
Value Added (GDP) $38,782,352,000 $29,169,189,000 $67,951,541,000
Labor Income (salaries, wages, benefits)
$24,176,431,000 $19,613,750,000 $43,790,181,000
Employment (jobs) 658,478 jobs 340,604 jobs 999,082 jobs
Sources: U.S. Census Bureau, PRORAGIS, IMPLAN (RIMS), Center for Regional Analysis
5 | The Economic Impact of Local Parks
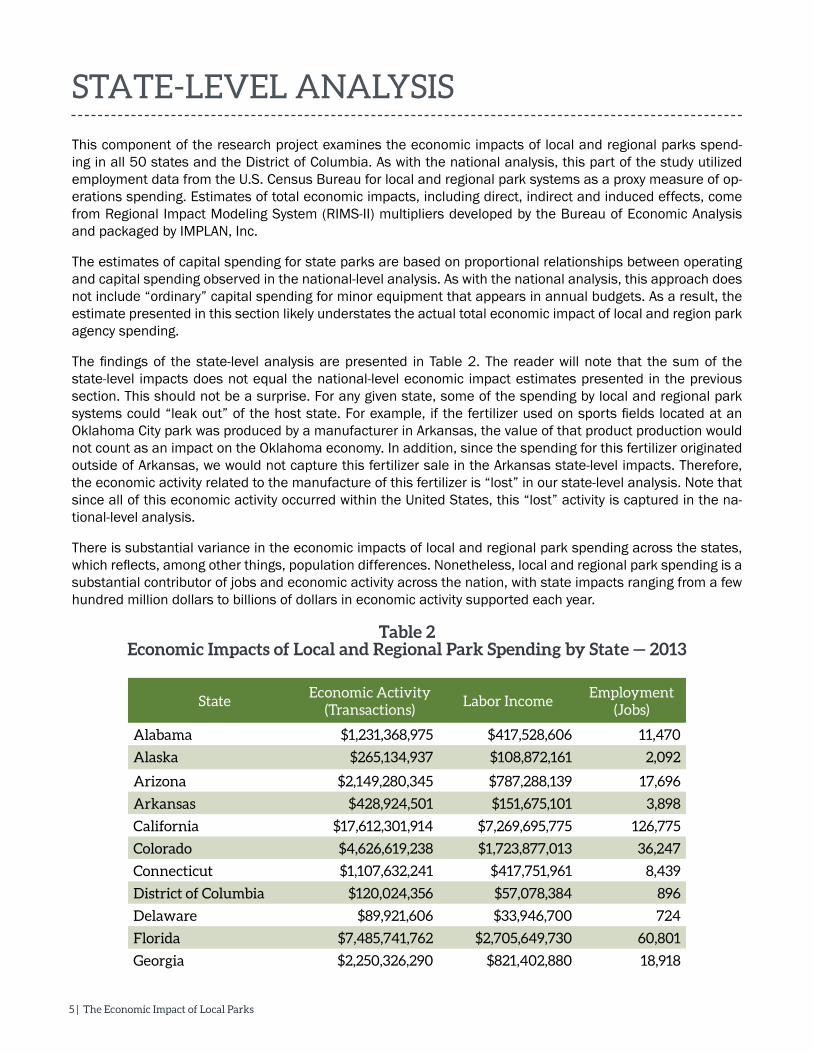
STATE-LEVEL ANALYSIS
This component of the research project examines the economic impacts of local and regional parks spend-ing in all 50 states and the District of Columbia. As with the national analysis, this part of the study utilized employment data from the U.S. Census Bureau for local and regional park systems as a proxy measure of op-erations spending. Estimates of total economic impacts, including direct, indirect and induced effects, come from Regional Impact Modeling System (RIMS-II) multipliers developed by the Bureau of Economic Analysis and packaged by IMPLAN, Inc.
The estimates of capital spending for state parks are based on proportional relationships between operating and capital spending observed in the national-level analysis. As with the national analysis, this approach does not include “ordinary” capital spending for minor equipment that appears in annual budgets. As a result, the estimate presented in this section likely understates the actual total economic impact of local and region park agency spending.
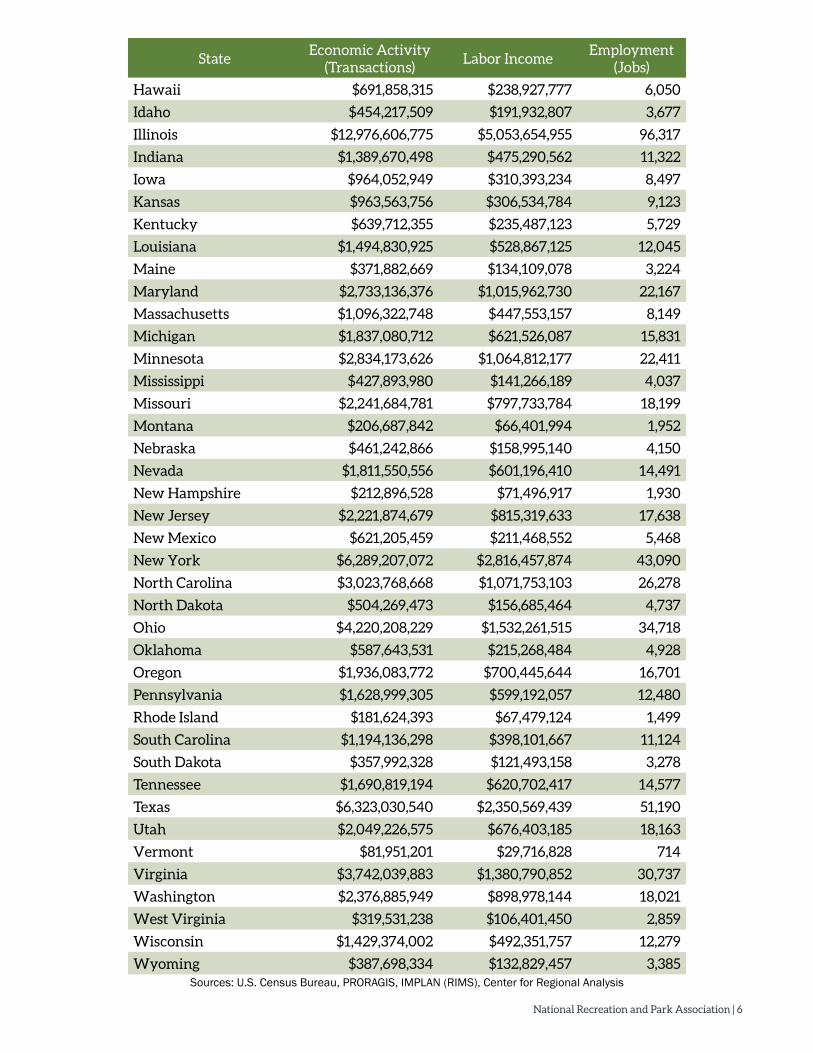
The findings of the state-level analysis are presented in Table 2. The reader will note that the sum of the state-level impacts does not equal the national-level economic impact estimates presented in the previous section. This should not be a surprise. For any given state, some of the spending by local and regional park systems could “leak out” of the host state. For example, if the fertilizer used on sports fields located at an Oklahoma City park was produced by a manufacturer in Arkansas, the value of that product production would not count as an impact on the Oklahoma economy. In addition, since the spending for this fertilizer originated outside of Arkansas, we would not capture this fertilizer sale in the Arkansas state-level impacts. Therefore, the economic activity related to the manufacture of this fertilizer is “lost” in our state-level analysis. Note that since all of this economic activity occurred within the United States, this “lost” activity is captured in the na-tional-level analysis.
There is substantial variance in the economic impacts of local and regional park spending across the states, which reflects, among other things, population differences. Nonetheless, local and regional park spending is a substantial contributor of jobs and economic activity across the nation, with state impacts ranging from a few hundred million dollars to billions of dollars in economic activity supported each year.
Table 2Economic Impacts of Local and Regional Park Spending by State — 2013
StateEconomic Activity
(Transactions)Labor Income
Employment (Jobs)
Alabama $1,231,368,975 $417,528,606 11,470
Alaska $265,134,937 $108,872,161 2,092
Arizona $2,149,280,345 $787,288,139 17,696
Arkansas $428,924,501 $151,675,101 3,898
California $17,612,301,914 $7,269,695,775 126,775
Colorado $4,626,619,238 $1,723,877,013 36,247
Connecticut $1,107,632,241 $417,751,961 8,439
District of Columbia $120,024,356 $57,078,384 896
Delaware $89,921,606 $33,946,700 724
Florida $7,485,741,762 $2,705,649,730 60,801
Georgia $2,250,326,290 $821,402,880 18,918
National Recreation and Park Association | 6
StateEconomic Activity
(Transactions)Labor Income
Employment (Jobs)
Hawaii $691,858,315 $238,927,777 6,050
Idaho $454,217,509 $191,932,807 3,677
Illinois $12,976,606,775 $5,053,654,955 96,317
Indiana $1,389,670,498 $475,290,562 11,322
Iowa $964,052,949 $310,393,234 8,497
Kansas $963,563,756 $306,534,784 9,123
Kentucky $639,712,355 $235,487,123 5,729
Louisiana $1,494,830,925 $528,867,125 12,045
Maine $371,882,669 $134,109,078 3,224
Maryland $2,733,136,376 $1,015,962,730 22,167
Massachusetts $1,096,322,748 $447,553,157 8,149
Michigan $1,837,080,712 $621,526,087 15,831
Minnesota $2,834,173,626 $1,064,812,177 22,411
Mississippi $427,893,980 $141,266,189 4,037
Missouri $2,241,684,781 $797,733,784 18,199
Montana $206,687,842 $66,401,994 1,952
Nebraska $461,242,866 $158,995,140 4,150
Nevada $1,811,550,556 $601,196,410 14,491
New Hampshire $212,896,528 $71,496,917 1,930
New Jersey $2,221,874,679 $815,319,633 17,638
New Mexico $621,205,459 $211,468,552 5,468
New York $6,289,207,072 $2,816,457,874 43,090
North Carolina $3,023,768,668 $1,071,753,103 26,278
North Dakota $504,269,473 $156,685,464 4,737
Ohio $4,220,208,229 $1,532,261,515 34,718
Oklahoma $587,643,531 $215,268,484 4,928
Oregon $1,936,083,772 $700,445,644 16,701
Pennsylvania $1,628,999,305 $599,192,057 12,480
Rhode Island $181,624,393 $67,479,124 1,499
South Carolina $1,194,136,298 $398,101,667 11,124
South Dakota $357,992,328 $121,493,158 3,278
Tennessee $1,690,819,194 $620,702,417 14,577
Texas $6,323,030,540 $2,350,569,439 51,190
Utah $2,049,226,575 $676,403,185 18,163
Vermont $81,951,201 $29,716,828 714
Virginia $3,742,039,883 $1,380,790,852 30,737
Washington $2,376,885,949 $898,978,144 18,021
West Virginia $319,531,238 $106,401,450 2,859
Wisconsin $1,429,374,002 $492,351,757 12,279
Wyoming $387,698,334 $132,829,457 3,385Sources: U.S. Census Bureau, PRORAGIS, IMPLAN (RIMS), Center for Regional Analysis
7 | The Economic Impact of Local Parks
CASE STUDY ANALYSIS
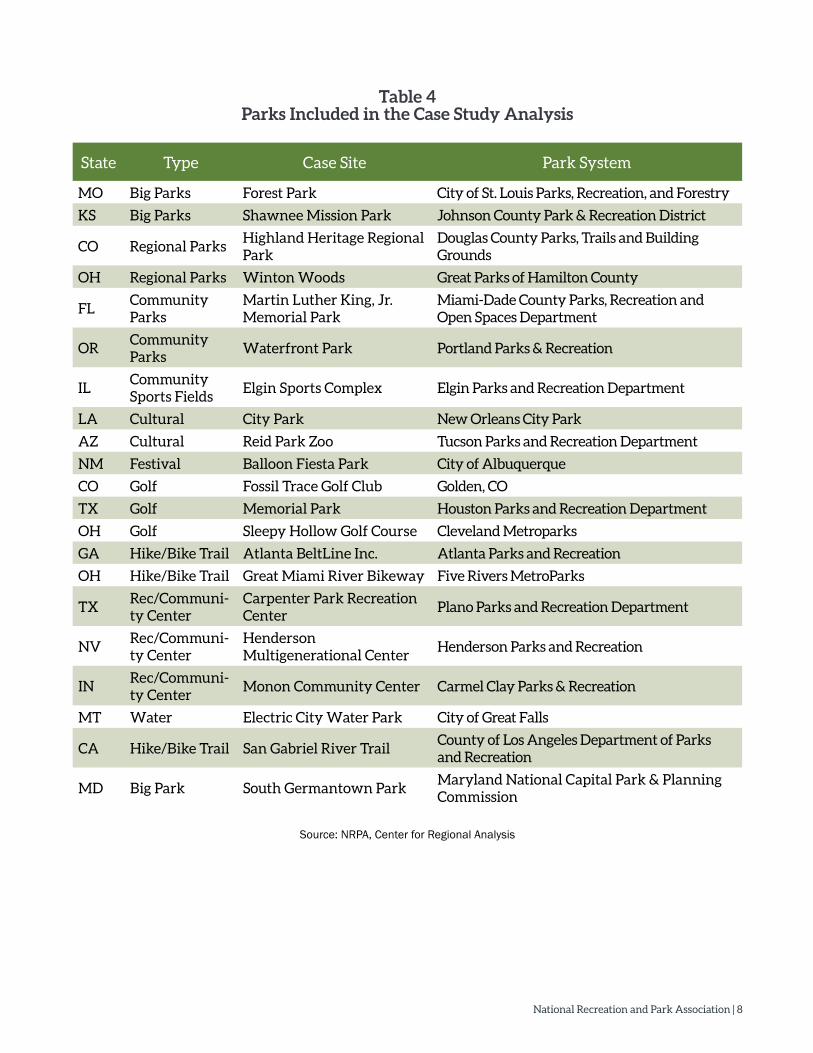
This research component assesses the economic impacts of specific parks located within local and regional park systems across the country. The example parks offer a more detailed analysis of park-related spending and the associated economic impacts to show how a differing mix of park types within a system of parks could affect that system’s economic impacts. In all, data were provided for 21 parks reflecting geographic and oper-ational diversity.
Participating park systems provided data for this analysis, some of which was augmented by the PRORAGIS database and direct data gathering from online resources. Our analysis assesses the economic impacts of operations and capital spending for each of the participating parks at the state level.
In this analysis, we have sufficient data to include ordinary capital spending that appears in the operating budget for some agencies. The analysis utilized RIMS-II multipliers obtained from IMPLAN, Inc., to calculate the impacts of park-related spending on total state economic activity, employment and labor earnings.
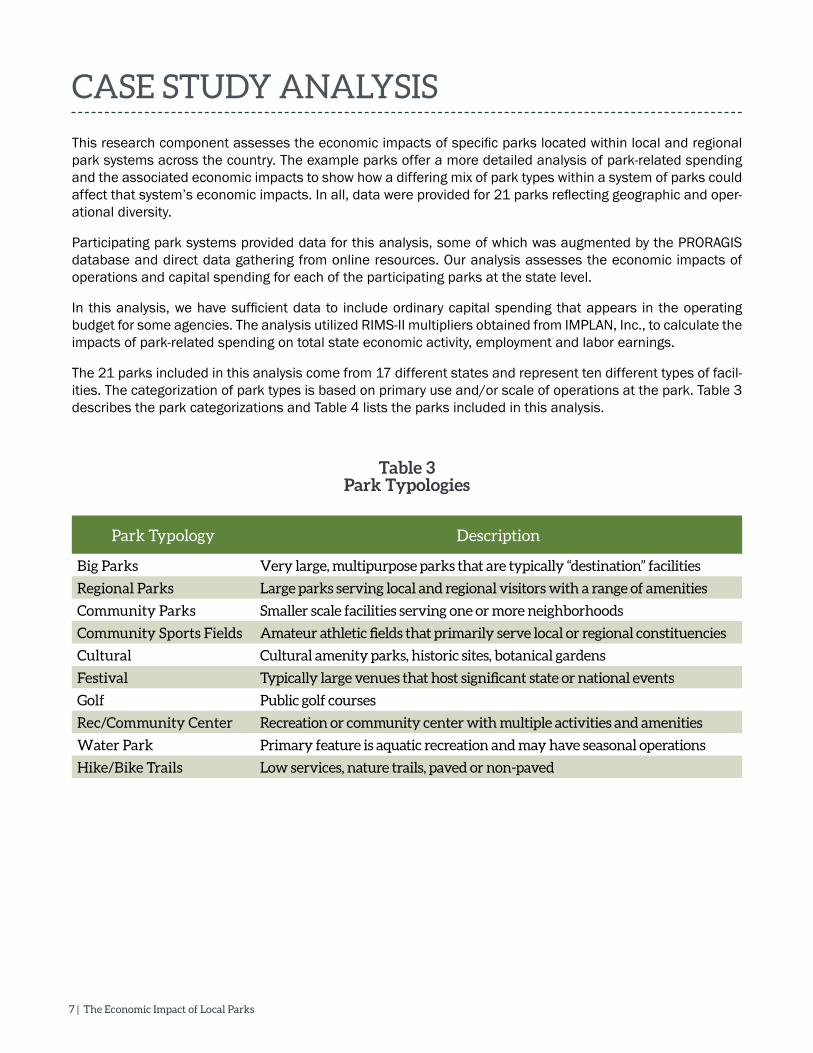
The 21 parks included in this analysis come from 17 different states and represent ten different types of facil-ities. The categorization of park types is based on primary use and/or scale of operations at the park. Table 3 describes the park categorizations and Table 4 lists the parks included in this analysis.
Table 3 Park Typologies
Park Typology Description
Big Parks Very large, multipurpose parks that are typically “destination” facilities
Regional Parks Large parks serving local and regional visitors with a range of amenities
Community Parks Smaller scale facilities serving one or more neighborhoods
Community Sports Fields Amateur athletic fields that primarily serve local or regional constituencies
Cultural Cultural amenity parks, historic sites, botanical gardens
Festival Typically large venues that host significant state or national events
Golf Public golf courses
Rec/Community Center Recreation or community center with multiple activities and amenities
Water Park Primary feature is aquatic recreation and may have seasonal operations
Hike/Bike Trails Low services, nature trails, paved or non-paved
National Recreation and Park Association | 8
Table 4Parks Included in the Case Study Analysis
State Type Case Site Park System
MO Big Parks Forest Park City of St. Louis Parks, Recreation, and Forestry
KS Big Parks Shawnee Mission Park Johnson County Park & Recreation District
CO Regional ParksHighland Heritage Regional Park
Douglas County Parks, Trails and Building Grounds
OH Regional Parks Winton Woods Great Parks of Hamilton County
FLCommunity Parks
Martin Luther King, Jr. Memorial Park
Miami-Dade County Parks, Recreation and Open Spaces Department
ORCommunity Parks
Waterfront Park Portland Parks & Recreation
ILCommunity Sports Fields
Elgin Sports Complex Elgin Parks and Recreation Department
LA Cultural City Park New Orleans City Park
AZ Cultural Reid Park Zoo Tucson Parks and Recreation Department
NM Festival Balloon Fiesta Park City of Albuquerque
CO Golf Fossil Trace Golf Club Golden, CO
TX Golf Memorial Park Houston Parks and Recreation Department
OH Golf Sleepy Hollow Golf Course Cleveland Metroparks
GA Hike/Bike Trail Atlanta BeltLine Inc. Atlanta Parks and Recreation
OH Hike/Bike Trail Great Miami River Bikeway Five Rivers MetroParks
TXRec/Communi-ty Center
Carpenter Park Recreation Center
Plano Parks and Recreation Department
NVRec/Communi-ty Center
Henderson Multigenerational Center
Henderson Parks and Recreation
INRec/Communi-ty Center
Monon Community Center Carmel Clay Parks & Recreation
MT Water Electric City Water Park City of Great Falls
CA Hike/Bike Trail San Gabriel River TrailCounty of Los Angeles Department of Parks and Recreation
MD Big Park South Germantown ParkMaryland National Capital Park & Planning Commission
Source: NRPA, Center for Regional Analysis
9 | The Economic Impact of Local Parks
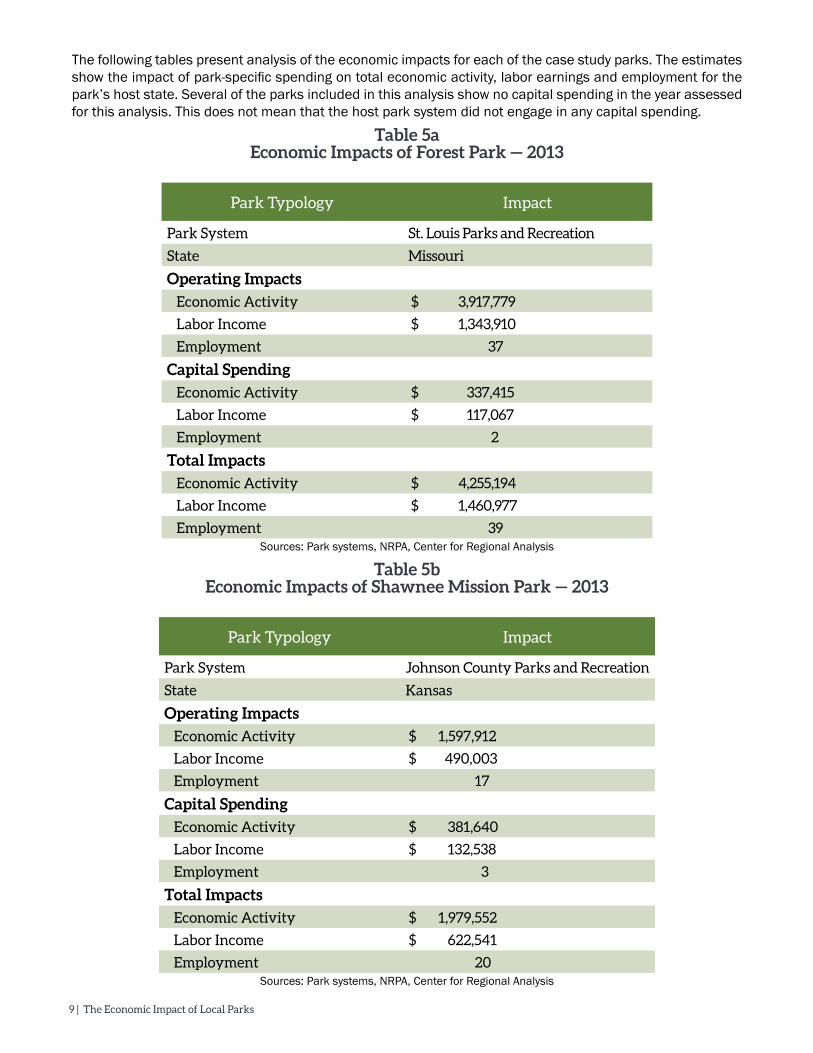
Table 5aEconomic Impacts of Forest Park — 2013
Park Typology Impact
Park System St. Louis Parks and Recreation
State Missouri
Operating Impacts
Economic Activity $ 3,917,779
Labor Income $ 1,343,910
Employment 37
Capital Spending
Economic Activity $ 337,415
Labor Income $ 117,067
Employment 2
Total Impacts
Economic Activity $ 4,255,194
Labor Income $ 1,460,977
Employment 39 Sources: Park systems, NRPA, Center for Regional Analysis
Table 5bEconomic Impacts of Shawnee Mission Park — 2013
Park Typology Impact
Park System Johnson County Parks and Recreation
State Kansas
Operating Impacts
Economic Activity $ 1,597,912
Labor Income $ 490,003
Employment 17
Capital Spending
Economic Activity $ 381,640
Labor Income $ 132,538
Employment 3
Total Impacts
Economic Activity $ 1,979,552
Labor Income $ 622,541
Employment 20 Sources: Park systems, NRPA, Center for Regional Analysis
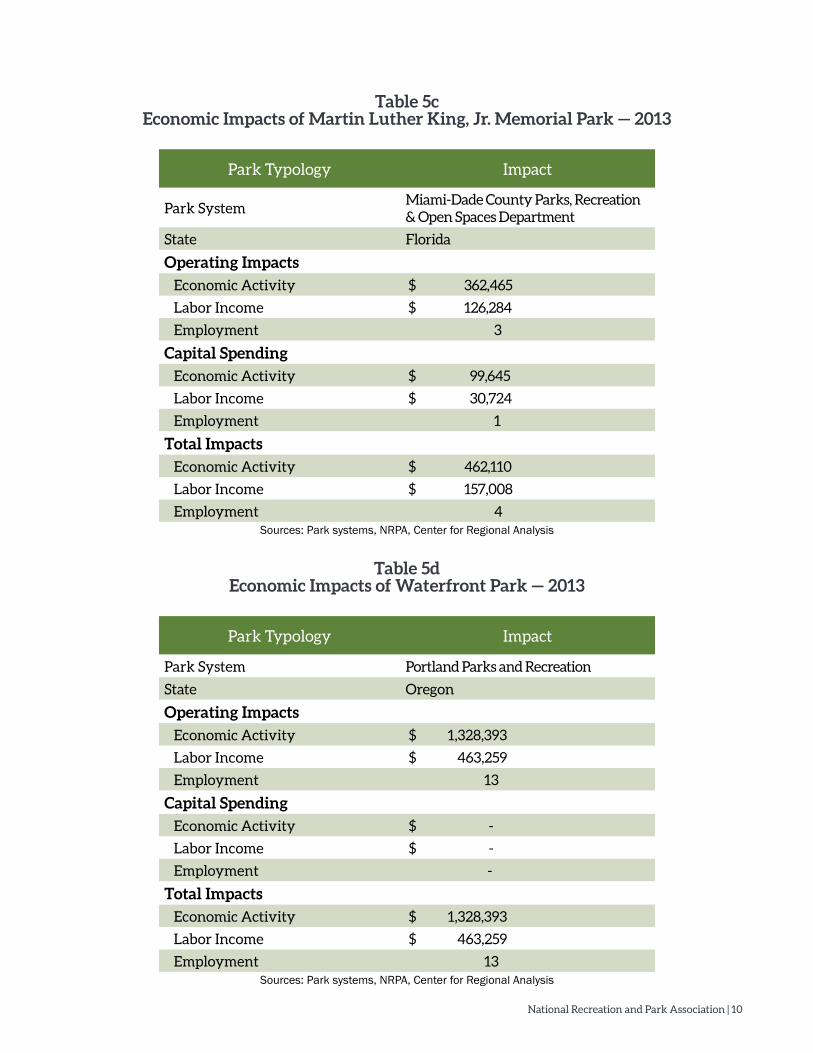
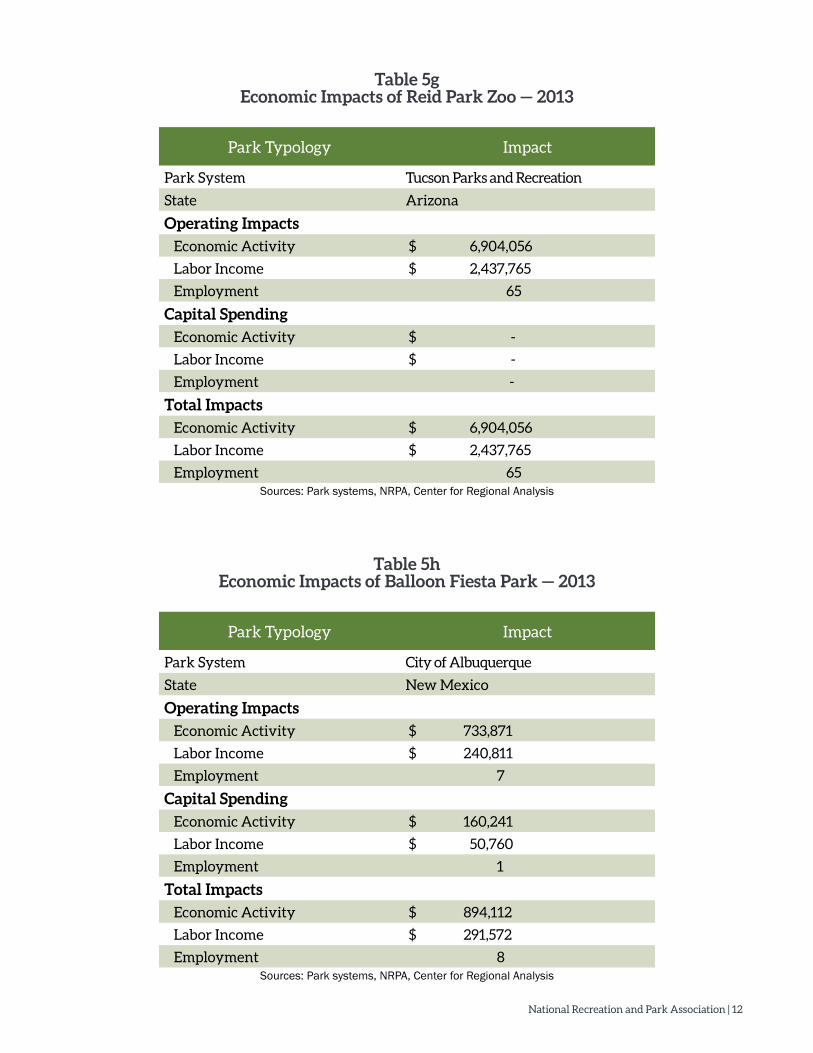
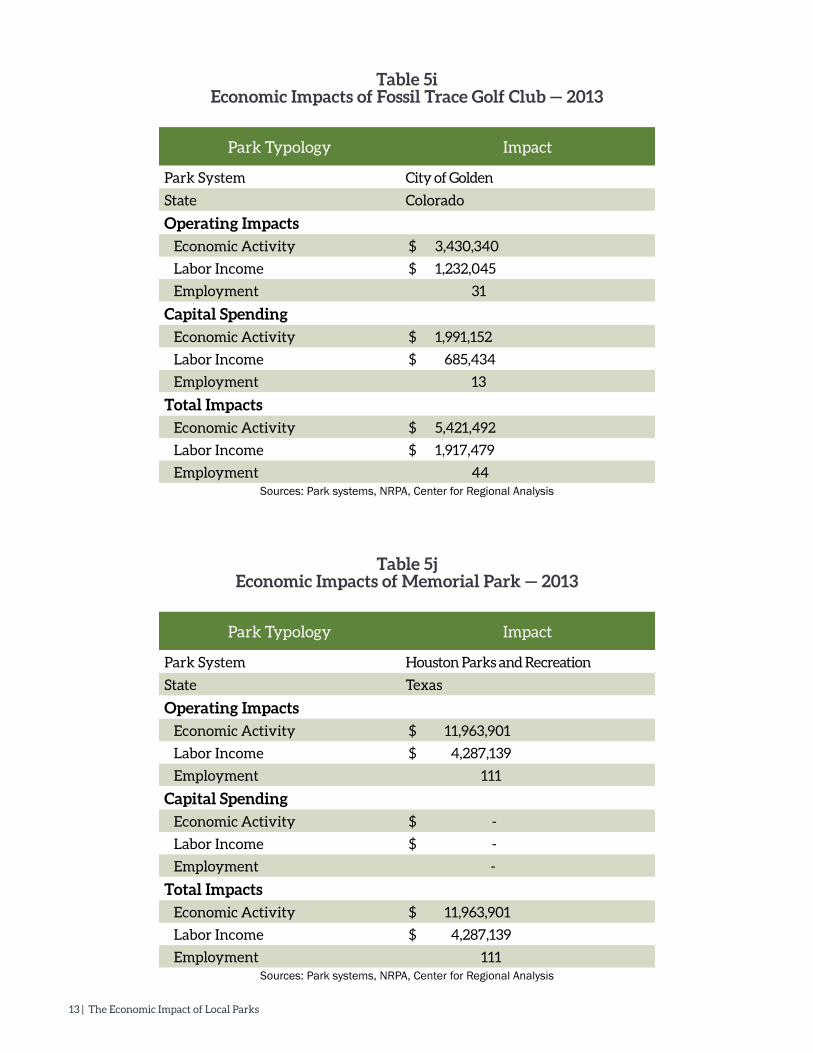
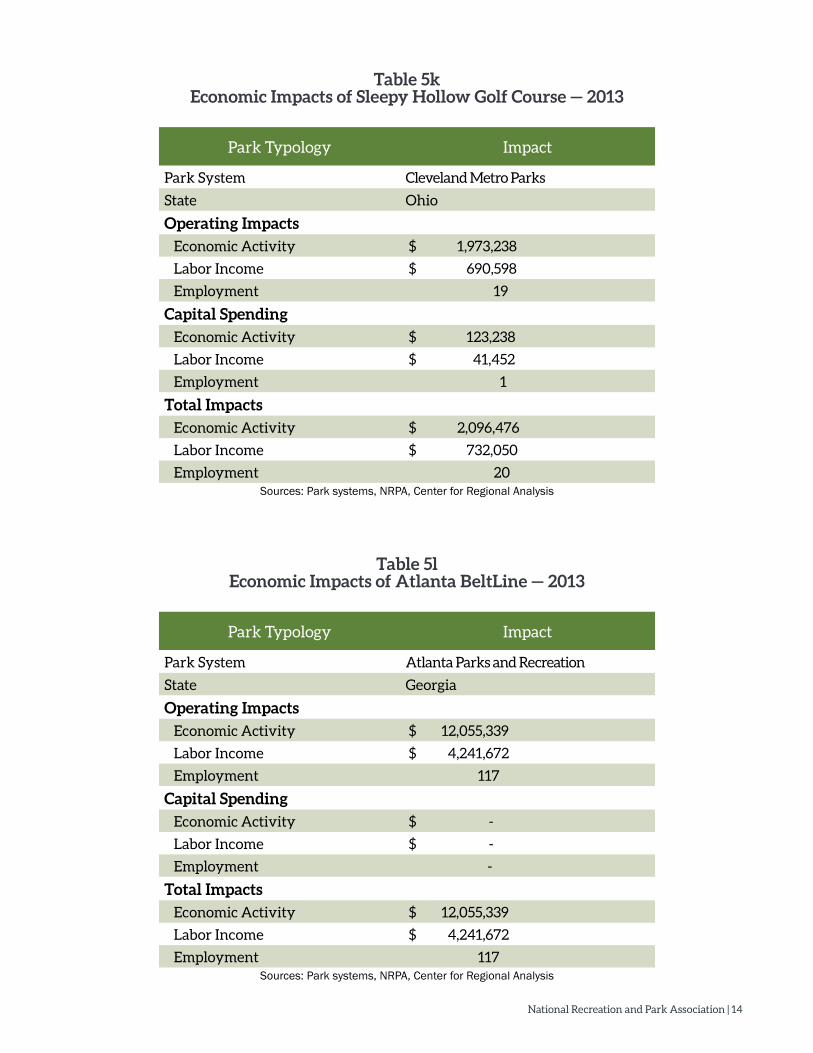
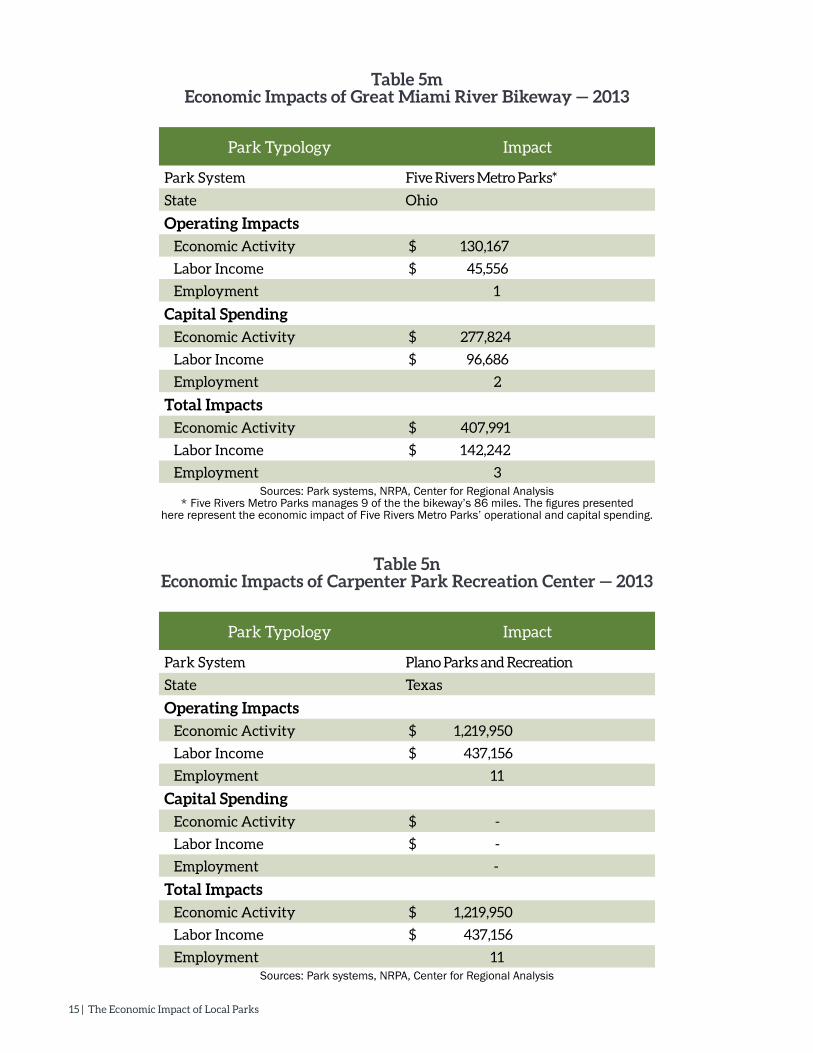
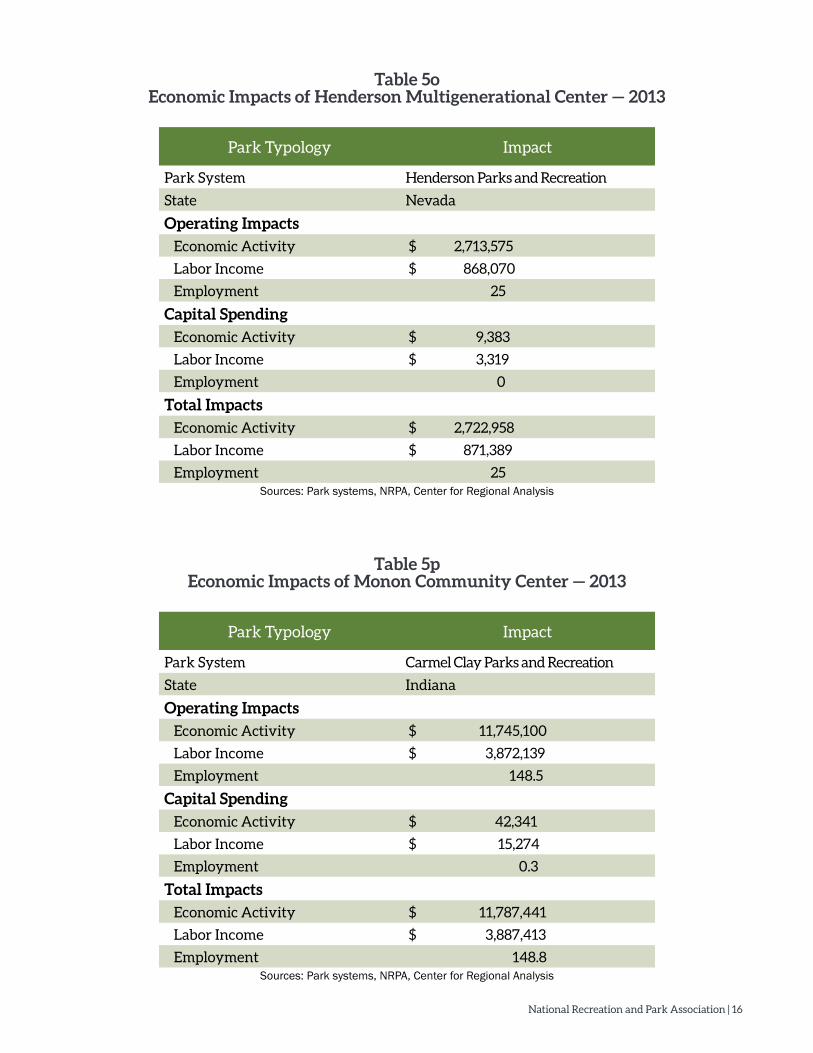
The following tables present analysis of the economic impacts for each of the case study parks. The estimates show the impact of park-specific spending on total economic activity, labor earnings and employment for the park’s host state. Several of the parks included in this analysis show no capital spending in the year assessed for this analysis. This does not mean that the host park system did not engage in any capital spending.
National Recreation and Park Association | 10
Table 5cEconomic Impacts of Martin Luther King, Jr. Memorial Park — 2013
Park Typology Impact
Park SystemMiami-Dade County Parks, Recreation & Open Spaces Department
State Florida
Operating Impacts
Economic Activity $ 362,465
Labor Income $ 126,284
Employment 3
Capital Spending
Economic Activity $ 99,645
Labor Income $ 30,724
Employment 1
Total Impacts
Economic Activity $ 462,110
Labor Income $ 157,008
Employment 4 Sources: Park systems, NRPA, Center for Regional Analysis
Table 5dEconomic Impacts of Waterfront Park — 2013
Park Typology Impact
Park System Portland Parks and Recreation
State Oregon
Operating Impacts
Economic Activity $ 1,328,393
Labor Income $ 463,259
Employment 13
Capital Spending
Economic Activity $ -
Labor Income $ -
Employment -
Total Impacts
Economic Activity $ 1,328,393
Labor Income $ 463,259
Employment 13 Sources: Park systems, NRPA, Center for Regional Analysis
11 | The Economic Impact of Local Parks
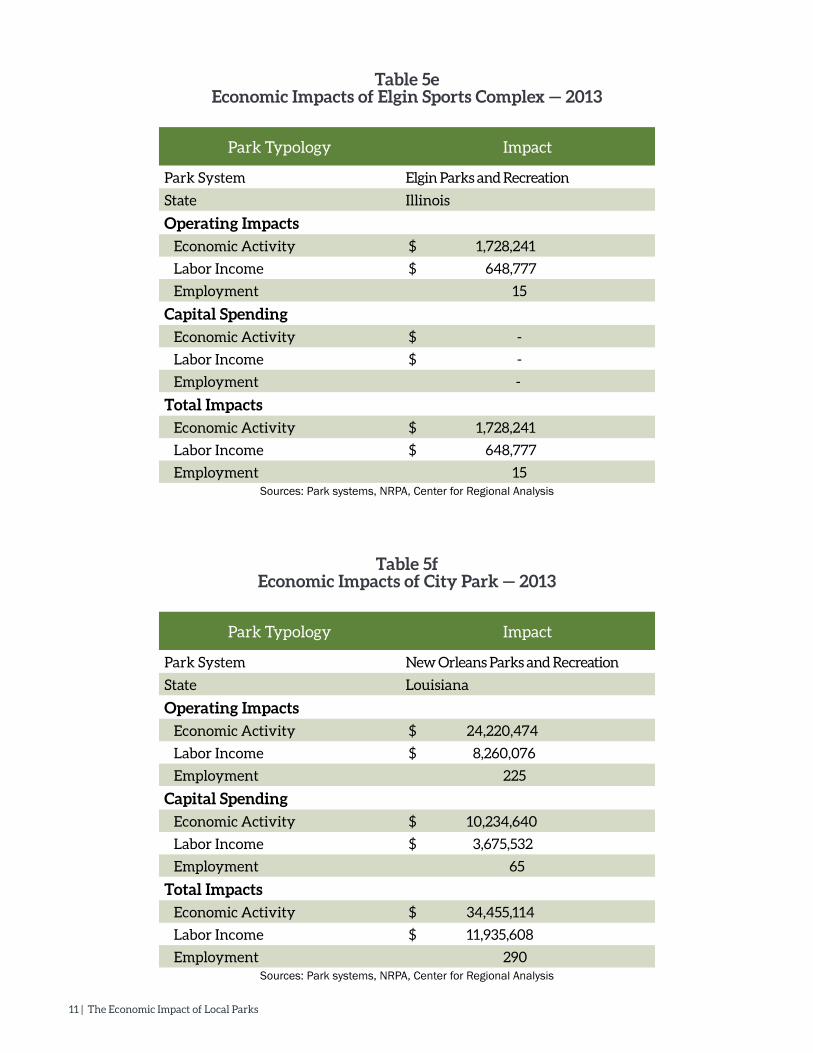
Table 5eEconomic Impacts of Elgin Sports Complex — 2013
Park Typology Impact
Park System Elgin Parks and Recreation
State Illinois
Operating Impacts
Economic Activity $ 1,728,241
Labor Income $ 648,777
Employment 15
Capital Spending
Economic Activity $ -
Labor Income $ -
Employment -
Total Impacts
Economic Activity $ 1,728,241
Labor Income $ 648,777
Employment 15 Sources: Park systems, NRPA, Center for Regional Analysis
Table 5fEconomic Impacts of City Park — 2013
Park Typology Impact
Park System New Orleans Parks and Recreation
State Louisiana
Operating Impacts
Economic Activity $ 24,220,474
Labor Income $ 8,260,076
Employment 225
Capital Spending
Economic Activity $ 10,234,640
Labor Income $ 3,675,532
Employment 65
Total Impacts
Economic Activity $ 34,455,114
Labor Income $ 11,935,608
Employment 290 Sources: Park systems, NRPA, Center for Regional Analysis
National Recreation and Park Association | 12
Table 5gEconomic Impacts of Reid Park Zoo — 2013
Park Typology Impact
Park System Tucson Parks and Recreation
State Arizona
Operating Impacts
Economic Activity $ 6,904,056
Labor Income $ 2,437,765
Employment 65
Capital Spending
Economic Activity $ -
Labor Income $ -
Employment -
Total Impacts
Economic Activity $ 6,904,056
Labor Income $ 2,437,765
Employment 65 Sources: Park systems, NRPA, Center for Regional Analysis
Table 5hEconomic Impacts of Balloon Fiesta Park — 2013
Park Typology Impact
Park System City of Albuquerque
State New Mexico
Operating Impacts
Economic Activity $ 733,871
Labor Income $ 240,811
Employment 7
Capital Spending
Economic Activity $ 160,241
Labor Income $ 50,760
Employment 1
Total Impacts
Economic Activity $ 894,112
Labor Income $ 291,572
Employment 8 Sources: Park systems, NRPA, Center for Regional Analysis
13 | The Economic Impact of Local Parks
Table 5iEconomic Impacts of Fossil Trace Golf Club — 2013
Park Typology Impact
Park System City of Golden
State Colorado
Operating Impacts
Economic Activity $ 3,430,340
Labor Income $ 1,232,045
Employment 31
Capital Spending
Economic Activity $ 1,991,152
Labor Income $ 685,434
Employment 13
Total Impacts
Economic Activity $ 5,421,492
Labor Income $ 1,917,479
Employment 44 Sources: Park systems, NRPA, Center for Regional Analysis
Table 5jEconomic Impacts of Memorial Park — 2013
Park Typology Impact
Park System Houston Parks and Recreation
State Texas
Operating Impacts
Economic Activity $ 11,963,901
Labor Income $ 4,287,139
Employment 111
Capital Spending
Economic Activity $ -
Labor Income $ -
Employment -
Total Impacts
Economic Activity $ 11,963,901
Labor Income $ 4,287,139
Employment 111 Sources: Park systems, NRPA, Center for Regional Analysis
National Recreation and Park Association | 14
Table 5kEconomic Impacts of Sleepy Hollow Golf Course — 2013
Park Typology Impact
Park System Cleveland Metro Parks
State Ohio
Operating Impacts
Economic Activity $ 1,973,238
Labor Income $ 690,598
Employment 19
Capital Spending
Economic Activity $ 123,238
Labor Income $ 41,452
Employment 1
Total Impacts
Economic Activity $ 2,096,476
Labor Income $ 732,050
Employment 20 Sources: Park systems, NRPA, Center for Regional Analysis
Table 5lEconomic Impacts of Atlanta BeltLine — 2013
Park Typology Impact
Park System Atlanta Parks and Recreation
State Georgia
Operating Impacts
Economic Activity $ 12,055,339
Labor Income $ 4,241,672
Employment 117
Capital Spending
Economic Activity $ -
Labor Income $ -
Employment -
Total Impacts
Economic Activity $ 12,055,339
Labor Income $ 4,241,672
Employment 117 Sources: Park systems, NRPA, Center for Regional Analysis
15 | The Economic Impact of Local Parks
Table 5mEconomic Impacts of Great Miami River Bikeway — 2013
Park Typology Impact
Park System Five Rivers Metro Parks*
State Ohio
Operating Impacts
Economic Activity $ 130,167
Labor Income $ 45,556
Employment 1
Capital Spending
Economic Activity $ 277,824
Labor Income $ 96,686
Employment 2
Total Impacts
Economic Activity $ 407,991
Labor Income $ 142,242
Employment 3 Sources: Park systems, NRPA, Center for Regional Analysis
* Five Rivers Metro Parks manages 9 of the the bikeway’s 86 miles. The figures presented here represent the economic impact of Five Rivers Metro Parks’ operational and capital spending.
Table 5nEconomic Impacts of Carpenter Park Recreation Center — 2013
Park Typology Impact
Park System Plano Parks and Recreation
State Texas
Operating Impacts
Economic Activity $ 1,219,950
Labor Income $ 437,156
Employment 11
Capital Spending
Economic Activity $ -
Labor Income $ -
Employment -
Total Impacts
Economic Activity $ 1,219,950
Labor Income $ 437,156
Employment 11 Sources: Park systems, NRPA, Center for Regional Analysis
National Recreation and Park Association | 16
Table 5oEconomic Impacts of Henderson Multigenerational Center — 2013
Park Typology Impact
Park System Henderson Parks and Recreation
State Nevada
Operating Impacts
Economic Activity $ 2,713,575
Labor Income $ 868,070
Employment 25
Capital Spending
Economic Activity $ 9,383
Labor Income $ 3,319
Employment 0
Total Impacts
Economic Activity $ 2,722,958
Labor Income $ 871,389
Employment 25 Sources: Park systems, NRPA, Center for Regional Analysis
Table 5pEconomic Impacts of Monon Community Center — 2013
Park Typology Impact
Park System Carmel Clay Parks and Recreation
State Indiana
Operating Impacts
Economic Activity $ 11,745,100
Labor Income $ 3,872,139
Employment 148.5
Capital Spending
Economic Activity $ 42,341
Labor Income $ 15,274
Employment 0.3
Total Impacts
Economic Activity $ 11,787,441
Labor Income $ 3,887,413
Employment 148.8Sources: Park systems, NRPA, Center for Regional Analysis
17 | The Economic Impact of Local Parks
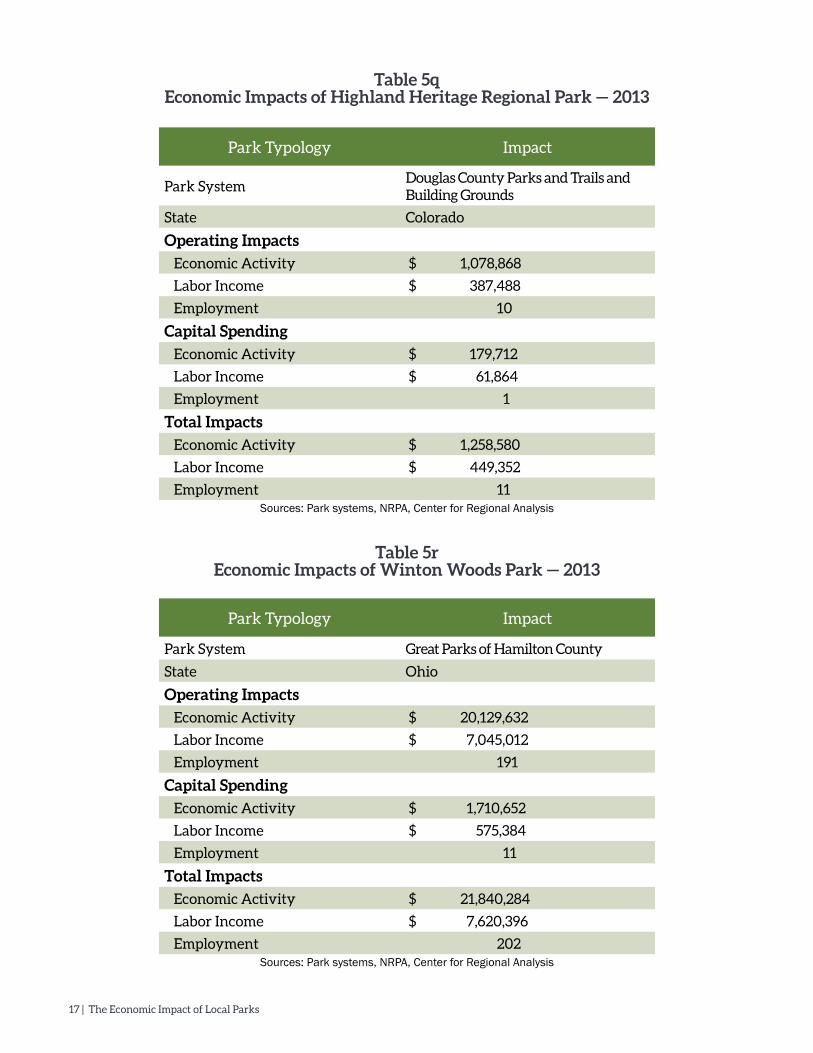
Table 5qEconomic Impacts of Highland Heritage Regional Park — 2013
Park Typology Impact
Park SystemDouglas County Parks and Trails and Building Grounds
State Colorado
Operating Impacts
Economic Activity $ 1,078,868
Labor Income $ 387,488
Employment 10
Capital Spending
Economic Activity $ 179,712
Labor Income $ 61,864
Employment 1
Total Impacts
Economic Activity $ 1,258,580
Labor Income $ 449,352
Employment 11 Sources: Park systems, NRPA, Center for Regional Analysis
Table 5rEconomic Impacts of Winton Woods Park — 2013
Park Typology Impact
Park System Great Parks of Hamilton County
State Ohio
Operating Impacts
Economic Activity $ 20,129,632
Labor Income $ 7,045,012
Employment 191
Capital Spending
Economic Activity $ 1,710,652
Labor Income $ 575,384
Employment 11
Total Impacts
Economic Activity $ 21,840,284
Labor Income $ 7,620,396
Employment 202 Sources: Park systems, NRPA, Center for Regional Analysis
National Recreation and Park Association | 18
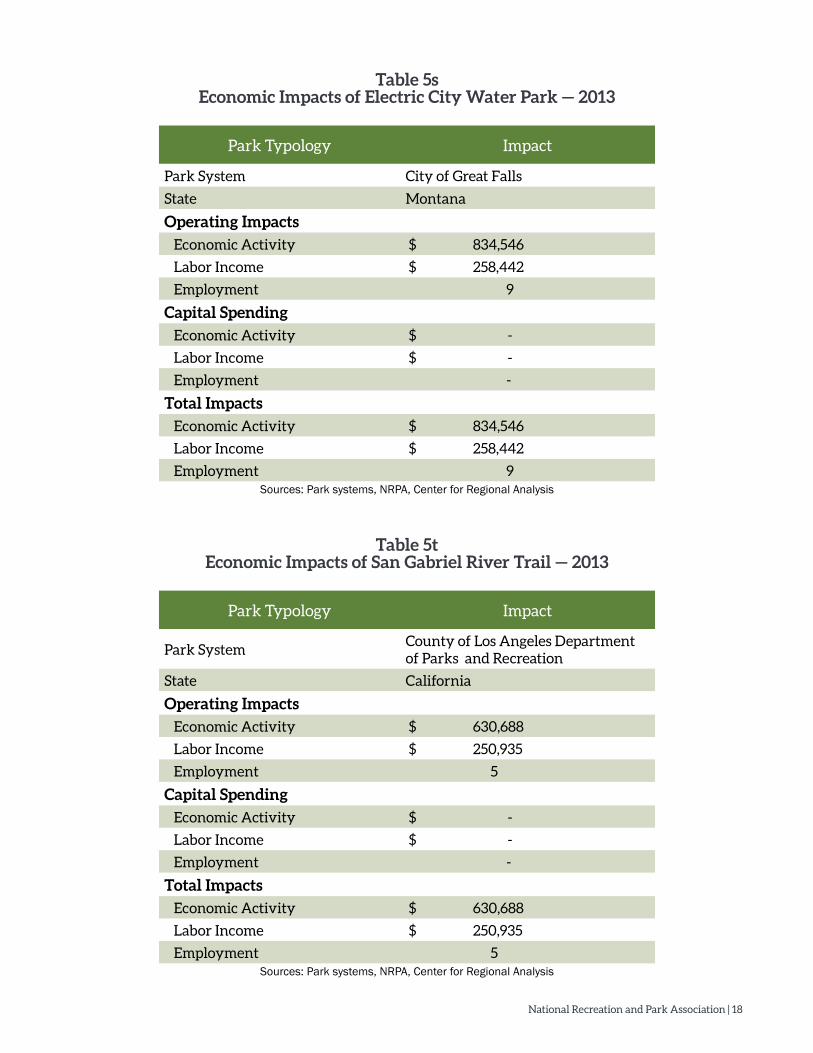
Table 5sEconomic Impacts of Electric City Water Park — 2013
Park Typology Impact
Park System City of Great Falls
State Montana
Operating Impacts
Economic Activity $ 834,546
Labor Income $ 258,442
Employment 9
Capital Spending
Economic Activity $ -
Labor Income $ -
Employment -
Total Impacts
Economic Activity $ 834,546
Labor Income $ 258,442
Employment 9 Sources: Park systems, NRPA, Center for Regional Analysis
Table 5tEconomic Impacts of San Gabriel River Trail — 2013
Park Typology Impact
Park SystemCounty of Los Angeles Department of Parks and Recreation
State California
Operating Impacts
Economic Activity $ 630,688
Labor Income $ 250,935
Employment 5
Capital Spending
Economic Activity $ -
Labor Income $ -
Employment -
Total Impacts
Economic Activity $ 630,688
Labor Income $ 250,935
Employment 5 Sources: Park systems, NRPA, Center for Regional Analysis
19 | The Economic Impact of Local Parks
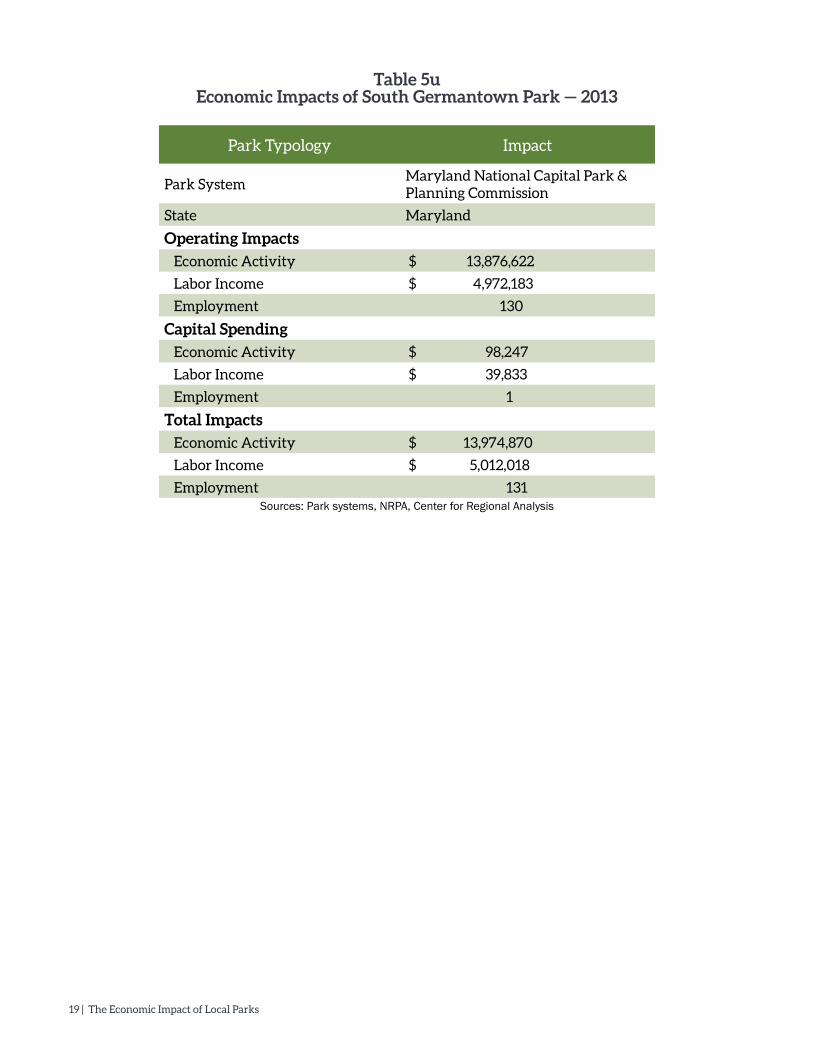
Table 5uEconomic Impacts of South Germantown Park — 2013
Park Typology Impact
Park SystemMaryland National Capital Park & Planning Commission
State Maryland
Operating Impacts
Economic Activity $ 13,876,622
Labor Income $ 4,972,183
Employment 130
Capital Spending
Economic Activity $ 98,247
Labor Income $ 39,833
Employment 1
Total Impacts
Economic Activity $ 13,974,870
Labor Income $ 5,012,018
Employment 131 Sources: Park systems, NRPA, Center for Regional Analysis
National Recreation and Park Association | 20
REFERENCES
City Parks Alliance, Why Are Parks Important to Cities? http://www.cityparksalliance.org/action-center/may-ors-for-parks/why-are-parks-important-to-cities.
Cullinane Thomas, C., C. Huber, and L. Koontz. 2014. 2013 National Park Visitor Spending Effects: Econom-ic Contributions to Local Communities, States, and the Nation. Natural Resource Report NPS/NRSS/EQD/NRR—2014/824. National Park Service, Fort Collins, Colorado
Cullinane Thomas, C., C. Huber, and L. Koontz. 2015. 2014 National Park Visitor Spending Effects: Econom-ic Contributions to Local Communities, States, and the Nation. Natural Resource Report NPS/NRSS/EQD/NRR—2015/947. National Park Service, Fort Collins, Colorado.
International Association of Amusement Parks and Attractions. The Economic Impacts of the U.S. Attractions Industry 2011. Oxford Economics. Theme parks, family entertainment centers, historical sites, museums, nature parks, water parks, zoos, aquariums, botanical gardens.
Southwick Associates 2011. The Economics Associated with Outdoor Recreation, Natural Resources Conser-vation and Historic Preservation in the United States. Prepared for The National Fish and Wildlife Foundation http://www.trcp.org/assets/pdf/The_Economic_Value_of_Outdoor_Recreation.pdf
Public Policy Associates, Inc. (2007). Measuring the Economic Value of Recreation, Programs and Parks: A How-To Guide. Michigan Recreation and Park Association. Available at http://www.mparks.org/Portals/0/Resource-Center/Justifying%20Parks%20and%20Recreation/Economic%20Impact/Guide%20to%20Mea-suring%20Economic%20Value%20of%20Parks%20and%20Recreation%20-%20MRPA.pdf

26 | The Economic Impact of Local Parks
22377 Belmont Ridge Road
Ashburn, VA 20148-4501
800.626.NRPA (6772)
www.nrpa.org
© 2015 National Recreation and Park Association
Recommended