Analysis and genotoxicity of the isoflavones
genistein, daidzein and equol,
and risk assessment for
consumption in human diet
PhD thesis to be submitted to the
Faculty of Chemistry,
University of Dortmund
by
Ana Laura Di Virgilio
Dortmund 2005

This thesis has been performed with support from the Deutsche Forschungsgemeinschaft by
the International Graduate College “Molecular Mechanisms in Food Toxicology”
(Düsseldorf-Dortmund-Maastricht-Utrecht-Wageningen). Supervisors within the International
Graduate College were Prof. Dr. Dr. H. M. Bolt, Dortmund (experimental part) and Prof. Dr.
J. C. S. Kleinjans, Maastricht (discussion of risk assessment). The teaching programme, as
part of the International Graduate College, was coordinated by Prof. Dr. R. Kahl, Heinrich-
Heine University, Düsseldorf.
Acknowledgements
I thank the Deutsche Forschungsgemeinschaft for the financial support of my thesis work, by
a stipend, via the International Graduate College “Molecular Mechanisms in Food
Toxicology” (GRK 738), located at the Heinrich-Heine University of Düsseldorf.
Special and sincere thanks to Prof. Dr. Dr. H.M. Bolt for giving me the possibility of carrying
out this project at IfADo (Institut für Arbeitsphysiologie, University of Dortmund).
I am also very grateful for the highly valuable discussions with Prof. Dr. G.H. Degen and for
her helpful comments and suggestions for this thesis work.
I would like to acknowledge Prof. Dr. R. Kahl for the dedicated hours and valuable
motivation during the Graduate College Lectures at the Heinrich-Heine University of
Düsseldorf.
I am very thankful to Dr. P. Diel, Institut für Kreislaufforschung und Sportmedizin der
Deutschen Sporthochschule, Köln, who provided me with the rodent plasma samples for
isoflavone analysis.
I thank all my colleagues from IfADo for the wonderful time I spent with them and for the
friendly support and help. Especially, I gratefully thank Dr. D. Bonacker, from whom I learnt
the Micronucleus assay and Stefan Moors who helped me with an introduction into the
analytical techniques. I would like to thank all my colleagues in Düsseldorf, with whom I
shared many lectures and graduate courses in Germany and in The Netherlands.
Last but not least, I would like to thank my parents and my sister for the unconditioned
support during the time I stayed in Germany, and to my beloved husband for his constant
understanding and encouragement.
Table of contents
1
Table of contents
Table of contents....................................................................................................................... 1
Abbreviations............................................................................................................................ 5
1. PREFACE .............................................................................................................. 7
2. INTRODUCTION .................................................................................................... 9
2.1. Phytoestrogens: definition ................................................................................................ 9
2.2. Phytoestrogens: dietary sources..................................................................................... 10
2.3. Metabolism and disposition of isoflavones.................................................................... 12 2.3.1. Absorption and reductive metabolism of isoflavones ................................................ 12 2.3.2. Conjugation and enterohepatic circulation of isoflavones ......................................... 15 2.3.3. Oxidative metabolism of isoflavones......................................................................... 16
2.4. Toxicokinetics of isoflavones .......................................................................................... 17 2.4.1. Toxicokinetics of isoflavones in rodents.................................................................... 17 2.4.2. Toxicokinetics of isoflavones in humans ................................................................... 19
2.5. Main biological effects .................................................................................................... 20 2.5.1. Hormonal effects ........................................................................................................ 20 2.5.2. Non-hormonal effects................................................................................................. 21 2.5.3. Genotoxicity ............................................................................................................... 21
2.6. Aim of the present study................................................................................................. 22
3. EXPERIMENTAL PART...................................................................................... 23
3.1. Materials and Methods ................................................................................................... 23 3.1.1. Chemicals ................................................................................................................... 23 3.1.2. Instruments ................................................................................................................. 25 3.1.3. Test solutions and buffers .......................................................................................... 26
3.1.3.1. Analytics of isoflavones ....................................................................................... 26 3.1.3.2. Cell culture .......................................................................................................... 27
3.1.4. Determination of genistein and daidzein concentrations in rat chow and rat plasma by HPLC.................................................................................................................................... 29
3.1.4.1. Chromatographic principles ............................................................................... 29 3.1.4.1.1. Principles and characteristic values of chromatographic separations .......... 29
3.1.4.1.1.1. Basis of liquid chromatography ........................................................... 32 3.1.4.1.1.2. Instrumentation in liquid chromatography .......................................... 33
3.1.4.2. Experimental procedures .................................................................................... 35 3.1.4.2.1. Study design on exposure evaluation ........................................................... 35 3.1.4.2.2. Analysis of isoflavones in rodent diet ......................................................... 36 3.1.4.2.3. Analysis of isoflavones in rat plasma.......................................................... 37
Table of contents
2
3.1.4.2.4. Instrumentation............................................................................................ 38 3.1.4.2.5. Peak identification....................................................................................... 38 3.1.4.2.6. Calibration curves ....................................................................................... 39 3.1.4.2.7. Reproducibility of isoflavone measurements by HPLC.............................. 40 3.1.4.2.8. Analytical recovery of isoflavones.............................................................. 41
3.1.5. Cell culture procedures............................................................................................... 41 3.1.5.1. Cell line ............................................................................................................... 41
3.1.5.1.1. Handling of V79 cells ................................................................................. 42 3.1.5.1.2. Passaging of V79 cells ................................................................................. 42 3.1.5.1.3. Cryopreservation and storage of V79 cells .................................................. 44
3.1.5.2. Cytotoxicity assays ............................................................................................. 44 3.1.5.2.1. Principles of cytotoxicity assays .................................................................. 44 3.1.5.2.2. Experimental procedures.............................................................................. 45
3.1.5.3. Micronucleus assay ............................................................................................. 47 3.1.5.3.1. Principles of micronucleus assay ................................................................ 47 3.1.5.3.2. Experimental procedures.............................................................................. 49
3.1.5.4. Kinesin-driven microtubule gliding assay........................................................... 49 3.1.5.5. CREST analysis ................................................................................................... 51 3.1.5.6. COMET assay ..................................................................................................... 52
3.2. Results .............................................................................................................................. 56 3.2.1. Evaluation of dietary isoflavone exposure ................................................................ 56
3.2.1.1. Parameters of the HPLC analysis ....................................................................... 56 3.2.1.2. Analysis of isoflavones in rodent diet by HPLC.................................................. 64 3.2.1.3. Analysis of isoflavones in rodent plasma by HPLC ............................................ 64
3.2.2. Dose-response assessment of the genotoxicity of isoflavones................................... 68 3.2.2.1. Assessment of cytotoxicity ................................................................................... 68
3.2.2.1.1. Cytotoxicity of daidzein in V79 cells........................................................... 68 3.2.2.1.2. Cytotoxicity of genistein in V79 cells.......................................................... 70 3.2.2.1.3. Cytotoxicity of equol in V79 cells ............................................................... 72
3.2.2.2. Induction of micronuclei ..................................................................................... 74 3.2.2.3. Assessment of microtubule gliding ...................................................................... 77 3.2.2.4. Characterization of micronuclei by CREST analysis.......................................... 78 3.2.2.5. Induction of DNA damage assessed by the COMET assay ................................. 80
3.3. Discussion......................................................................................................................... 86 3.3.1. Analytical procedures................................................................................................. 86
3.3.1.1. Analytical criteria for isoflavones....................................................................... 86 3.3.1.2. Isoflavone concentrations in experimental rodent diets ..................................... 87 3.3.1.3. Isoflavone plasma levels in experimental animals .............................................. 88
3.3.2. Coherence of isoflavone exposure and plasma levels between experimental animals and humans........................................................................................................................... 89 3.3.3. Genotoxicity ............................................................................................................... 90
3.3.3.1. Genotoxic vs. non-genotoxic mechanisms of chemical carcinogenicity ............. 90 3.3.3.2. Differentiation of carcinogens by mode of action, for the purpose of risk assessment and standard setting ...................................................................................... 92
4. RISK ASSESSMENT PART................................................................................. 95
4.1. Hormonal activity of isoflavones.................................................................................... 95
Table of contents
3
4.2. Genotoxicity of isoflavones ............................................................................................. 97 4.2.1. Mode of action of the clastogenicity of genistein as a topoisomerase-II inhibitor .... 99
4.3. Genistein: threshold and associate margin of safety.................................................. 101
5. CONCLUSIONS ..................................................................................................103
6. SUMMARY .........................................................................................................105
7. REFERENCES ....................................................................................................109

Abbreviations
5
Abbreviations A. dest. aqua destillata (distilled water)
AcOH acetic acid
ATP adenosine triphosphate
ATPase adenosine triphosphatase
AUC area under the curve (dose parameter in toxicokinetics)
BCA bicinchoninic acid
BSA bovine serum albumin
b.w. body weight
C max maximal plasma concentration (toxicokinetics)
Cl clearance (toxicokinetics)
Cl/F systemic clearance normalized to the bioavailable
cm² square centimeter
Conc. concentration
CREST Calcinosis, Raynaud phenomenon, Esophageal dismotility,
Sclerodactyly and Telangiectasia (disease leading to centromere
antibodies)
CV% coefficient of variation, %
D oral oral administered dose (toxicokinetics)
D i.v. intravenous administered dose (toxicokinetics)
DAPI 4`6`diamidino-2-phenylindole
DMEM Dulbecco`s modified Eagle`s medium (for cell culture)
DMSO dimethylsulphoxide
DNA deoxyribonucleic acid
EDTA ethylenediaminetetraacetic acid
ER estrogen receptor
F bioavailability
FCS fetal calf serum (for cell culture)
FITC fluorescein-5-isothiocyanate
GC-MS gas chromatography-mass spectrometry
h hour
HPLC high performance liquid chromatography
IC₅₀ inhibition concentration of 50 %
Abbreviations
6
Ig immunoglobulin
i.v. intravenous
MeOH methanol
MMS methylmethanesulfonate
MN micronucleus
NR Neutral Red
OVX ovariectomized
PBS phosphate- buffered saline
PI propidium iodide
p.o. per os
rpm revolutions per minute
SD standard deviation
t ⅟₂ half-life
t max mean time to attain peak plasma concentration
UV ultraviolet light
v/v volume/volume
V79 cells Chinese hamster cell line (for cell culture)
VCR vincristine
Vd volume of distribution (toxicokinetics)
Vd/F average volume of distribution normalized to apparent bioaiavailability
xi each independent measurement _ x mean value
Preface
7
1. PREFACE
The issue of environmental chemicals with hormonal activity, being addressed as “endocrine
disruptors”, has been debated since the beginning of the nineties (Bolt and Degen 1996/97).
Initially, this debate had been focused on polychlorinated organic compounds, plasticizers and
other man-made chemicals. Later, the impact of naturally occurring and hormonally active
(estrogenic) compounds in human food has been discussed. The impact of man-made
environmental chemicals with hormonal/endocrine effects has been compared with that of
natural food ingredients, in order to set priorities for governmental regulations (Bolt et al.
2001). This has initiated new interest in the biological activities of estrogenic, hormonally
active compounds found in plants, most of which have an isoflavone structure in common.
The phytoestrogens daidzein and genistein are two such naturally occurring isoflavones,
which are found in edible plants, especially in soybeans (structural formulae: see Fig. 2). A
significant part of human exposure to natural phytoestrogens is, therefore, dependent on the
type of diet.
In whole animal models and in experimental systems in vitro, phytoestrogens appear capable
of acting both as partial agonists and as antagonists, the primary effects of which are
mediated via interaction with the estrogen receptor. Phytoestrogen-rich diets have the
potential to exert adverse as well as beneficial effects in humans (Cassidy, 1996). This is
related to the hormonal activity, which is therefore relevant for the assessment of associated
risks to humans.
Apart from the intrinsic hormonal activities of these compounds, the question of genotoxicity
and the associated carcinogenicity has been raised from a toxicological point of view (Kulling
and Metzler, 1997). This thesis project, elaborated as part of the International Graduate
College “Molecular Mechanisms in Food Toxicology”, intended to confirm or reject the claim
of Kulling and Metzler (1997) of a relevant genotoxicity of genistein and daidzein and to
accomplish a genotoxicity risk assessment for soy isoflavones in human diets.
The work was therefore based on input from the fields of analytical chemistry, toxicology and
risk analysis.

Introduction
9
2. INTRODUCTION
2.1. Phytoestrogens: definition
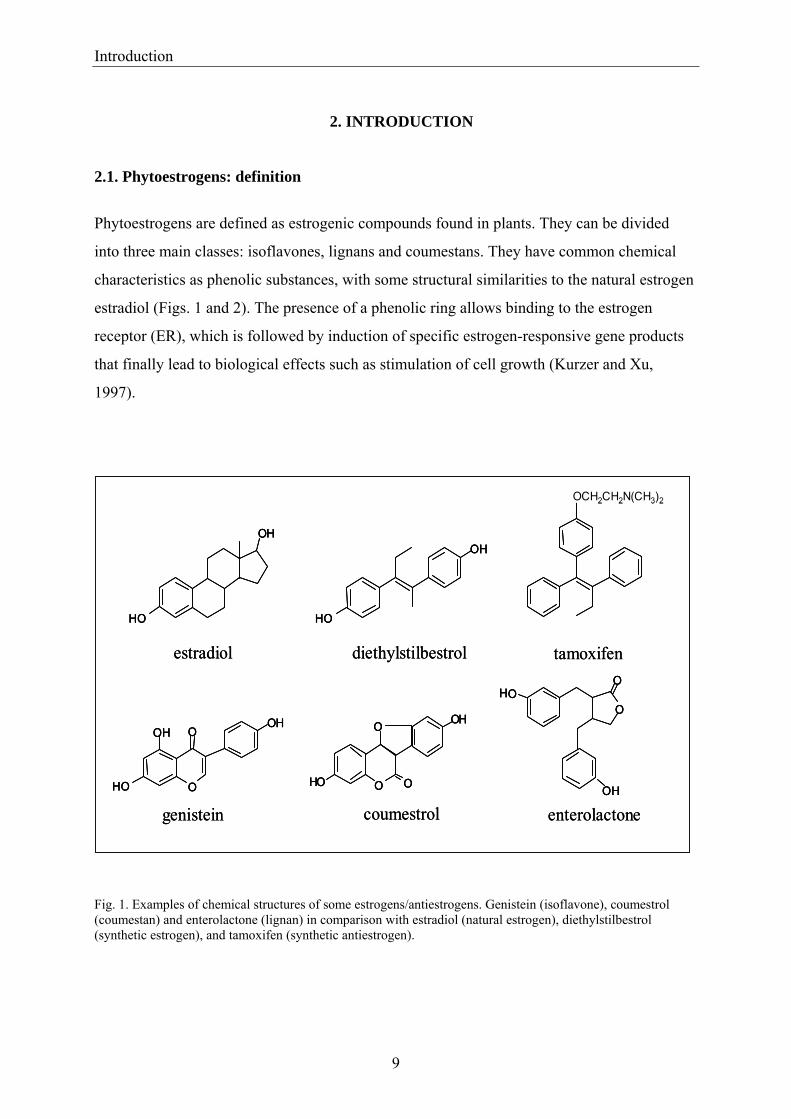
Phytoestrogens are defined as estrogenic compounds found in plants. They can be divided
into three main classes: isoflavones, lignans and coumestans. They have common chemical
characteristics as phenolic substances, with some structural similarities to the natural estrogen
estradiol (Figs. 1 and 2). The presence of a phenolic ring allows binding to the estrogen
receptor (ER), which is followed by induction of specific estrogen-responsive gene products
that finally lead to biological effects such as stimulation of cell growth (Kurzer and Xu,
1997).
Fig. 1. Examples of chemical structures of some estrogens/antiestrogens. Genistein (isoflavone), coumestrol (coumestan) and enterolactone (lignan) in comparison with estradiol (natural estrogen), diethylstilbestrol (synthetic estrogen), and tamoxifen (synthetic antiestrogen).
O
O OH
OOH
O
OH
OHO
O
OH
HOH
OH
OCH2CH2N(CH3)2
O
OOH
OH
OH
genistein
estradiol diethylstilbestrol
coumestrol enterolactone
tamoxifen
O
O OH
OOH O
O OH
OOH
O
OH
OHO
O
OH
OHO
O
OH
HO
OH
HOH
OH
OH
OH
OCH2CH2N(CH3)2OCH2CH2N(CH3)2
O
OOH
OH
OH
O
OOH
OH
OH
genistein
estradiol diethylstilbestrol
coumestrol enterolactone
tamoxifen
Introduction
10
2.2. Phytoestrogens: dietary sources
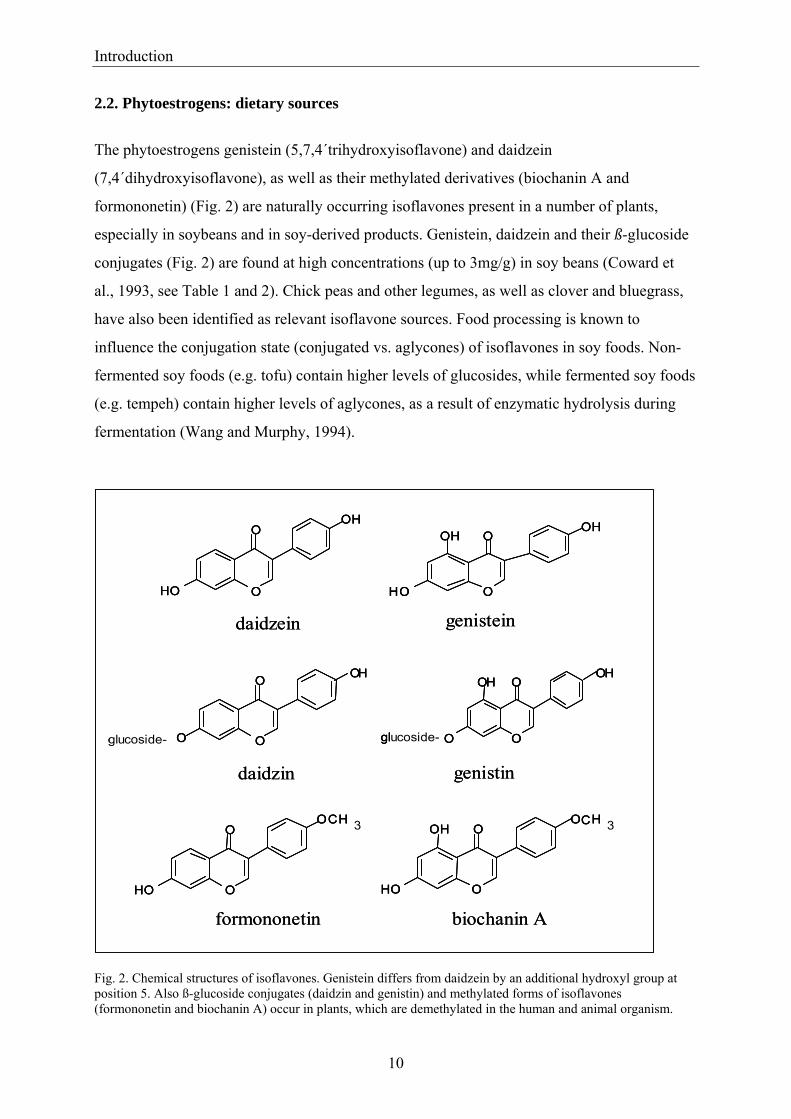
The phytoestrogens genistein (5,7,4´trihydroxyisoflavone) and daidzein
(7,4´dihydroxyisoflavone), as well as their methylated derivatives (biochanin A and
formononetin) (Fig. 2) are naturally occurring isoflavones present in a number of plants,
especially in soybeans and in soy-derived products. Genistein, daidzein and their ß-glucoside
conjugates (Fig. 2) are found at high concentrations (up to 3mg/g) in soy beans (Coward et
al., 1993, see Table 1 and 2). Chick peas and other legumes, as well as clover and bluegrass,
have also been identified as relevant isoflavone sources. Food processing is known to
influence the conjugation state (conjugated vs. aglycones) of isoflavones in soy foods. Non-
fermented soy foods (e.g. tofu) contain higher levels of glucosides, while fermented soy foods
(e.g. tempeh) contain higher levels of aglycones, as a result of enzymatic hydrolysis during
fermentation (Wang and Murphy, 1994). Fig. 2. Chemical structures of isoflavones. Genistein differs from daidzein by an additional hydroxyl group at position 5. Also ß-glucoside conjugates (daidzin and genistin) and methylated forms of isoflavones (formononetin and biochanin A) occur in plants, which are demethylated in the human and animal organism.
O
OOH
OH O
OOH
OH
OH
O
O
O
OH
glucoside- O
O
O
OHOH
glucoside-
O
OO
OH
CH 3
O
O
OH
OHOCH 3
daidzein genistein
daidzin genistin
formononetin biochanin A
O
OOH
OH O
OOH
OH O
OOH
OH
OH
O
OOH
OH
OH
O
O
O
OH
glucoside- O
O
O
OH
glucoside- O
O
O
OHOH
glucoside- O
O
O
OHOH
glucoside-
O
OO
OH
CH 3
O
OO
OH
CH 3
O
O
OH
OHOCH 3
O
O
OH
OHOCH 3
daidzein genistein
daidzin genistin
formononetin biochanin A
Introduction
11
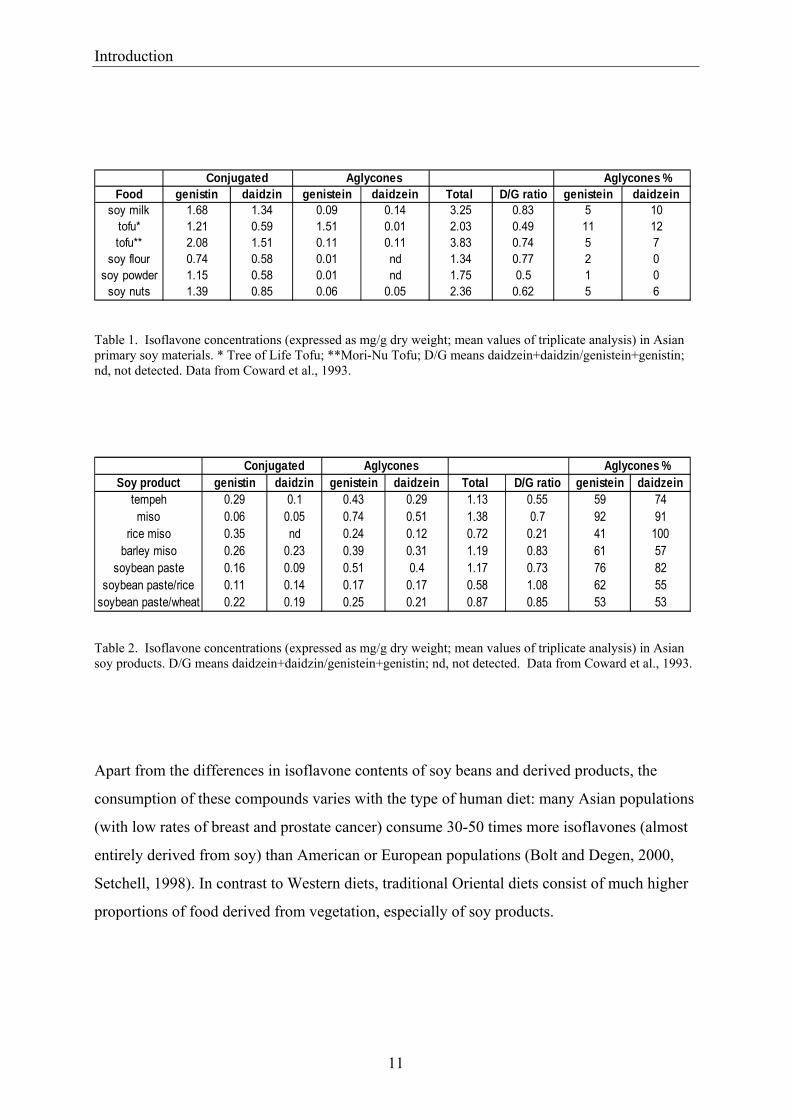
Table 1. Isoflavone concentrations (expressed as mg/g dry weight; mean values of triplicate analysis) in Asian primary soy materials. * Tree of Life Tofu; **Mori-Nu Tofu; D/G means daidzein+daidzin/genistein+genistin; nd, not detected. Data from Coward et al., 1993.
Table 2. Isoflavone concentrations (expressed as mg/g dry weight; mean values of triplicate analysis) in Asian soy products. D/G means daidzein+daidzin/genistein+genistin; nd, not detected. Data from Coward et al., 1993.
Apart from the differences in isoflavone contents of soy beans and derived products, the
consumption of these compounds varies with the type of human diet: many Asian populations
(with low rates of breast and prostate cancer) consume 30-50 times more isoflavones (almost
entirely derived from soy) than American or European populations (Bolt and Degen, 2000,
Setchell, 1998). In contrast to Western diets, traditional Oriental diets consist of much higher
proportions of food derived from vegetation, especially of soy products.
Conjugated Aglycones Aglycones %Food genistin daidzin genistein daidzein Total D/G ratio genistein daidzein
soy milk 1.68 1.34 0.09 0.14 3.25 0.83 5 10tofu* 1.21 0.59 1.51 0.01 2.03 0.49 11 12tofu** 2.08 1.51 0.11 0.11 3.83 0.74 5 7
soy flour 0.74 0.58 0.01 nd 1.34 0.77 2 0soy powder 1.15 0.58 0.01 nd 1.75 0.5 1 0
soy nuts 1.39 0.85 0.06 0.05 2.36 0.62 5 6
Conjugated Aglycones Aglycones %Soy product genistin daidzin genistein daidzein Total D/G ratio genistein daidzein
tempeh 0.29 0.1 0.43 0.29 1.13 0.55 59 74miso 0.06 0.05 0.74 0.51 1.38 0.7 92 91
rice miso 0.35 nd 0.24 0.12 0.72 0.21 41 100barley miso 0.26 0.23 0.39 0.31 1.19 0.83 61 57
soybean paste 0.16 0.09 0.51 0.4 1.17 0.73 76 82soybean paste/rice 0.11 0.14 0.17 0.17 0.58 1.08 62 55
soybean paste/wheat 0.22 0.19 0.25 0.21 0.87 0.85 53 53
Introduction
12
2.3. Metabolism and disposition of isoflavones 2.3.1. Absorption and reductive metabolism of isoflavones
The chemical form in which isoflavones occur is an important issue because it may influence
the biological activity, the bioavailability, and therefore the physiologic effects of these
dietary constituents.
Metabolic pathways of daidzein and genistein in humans were originally proposed by Setchell
and Adlercreutz (1988), based on the metabolites found in human urine (Fig.3). As already
mentioned, isoflavones occur in soy products mostly in the glycoside forms (daidzin and
genistin). After ingestion, soybean isoflavones are hydrolysed by intestinal glycosidases,
which release the aglycones, daidzein and genistein. These may be absorbed or further
metabolised to specific metabolites (Fig. 3).
The extent of absoption may be dependent on the chemical form of the isoflavones, in that the
unconjugated isoflavones, because of their liphophilic properties, may be more readily
absorbed and, therefore, be more bioavailable than the highly-polar conjugated species
(Cassidy, 1996). There is evidence that hydrolysis of the isoflavones glycosides occurs before
their absorption from the gut since the glycosides have not been detected in plasma (Andlauer
et al., 2000; Setchell et al., 2002). The site of hydrolysis has not been fully elucidated, but it is
known that glycosidase enzymes are produced in the small intestine and by the gut microflora
(Day et al., 1998; Rowland et al., 2003). It seems likely that mammalian beta –glycosidase
activity, associated with the small intestinal mucosa, is involved in glycoside hydrolysis prior
to absorption. Beta-glycosidase activity shows developmental expression early in life. This
facilitates the absorption of isoflavones contained in soy infant formulae, resulting in very
high plasma concentrations in infants fed with “soy milk” products (Setchell et al., 1997).
After hydrolysis of the sugar moiety in the gastrointestinal tract, isoflavones can be absorbed,
or undergo additional biotransformation by the gut microflora to reductive metabolites (Fig.
3): genistein is metabolically transformed to dihydrogenistein (4´,5,7 trihydroxy-
isoflavanone) and 6´hydroxy- O-desmethylangolesin (6´-hydroxy-O-DMA)
(2´,4´,6´,4´´tetrahydroxy-α-methyldeoxybenzoin, Fig. 3, right panel), and finally degraded to
4-hydroxyphenyl-2-propionic acid (HPPA) and 1,3,5-trihydroxybenzene (THB) (not shown,
Joannou et al., 1995; Coldham et al., 2002).
Introduction
13
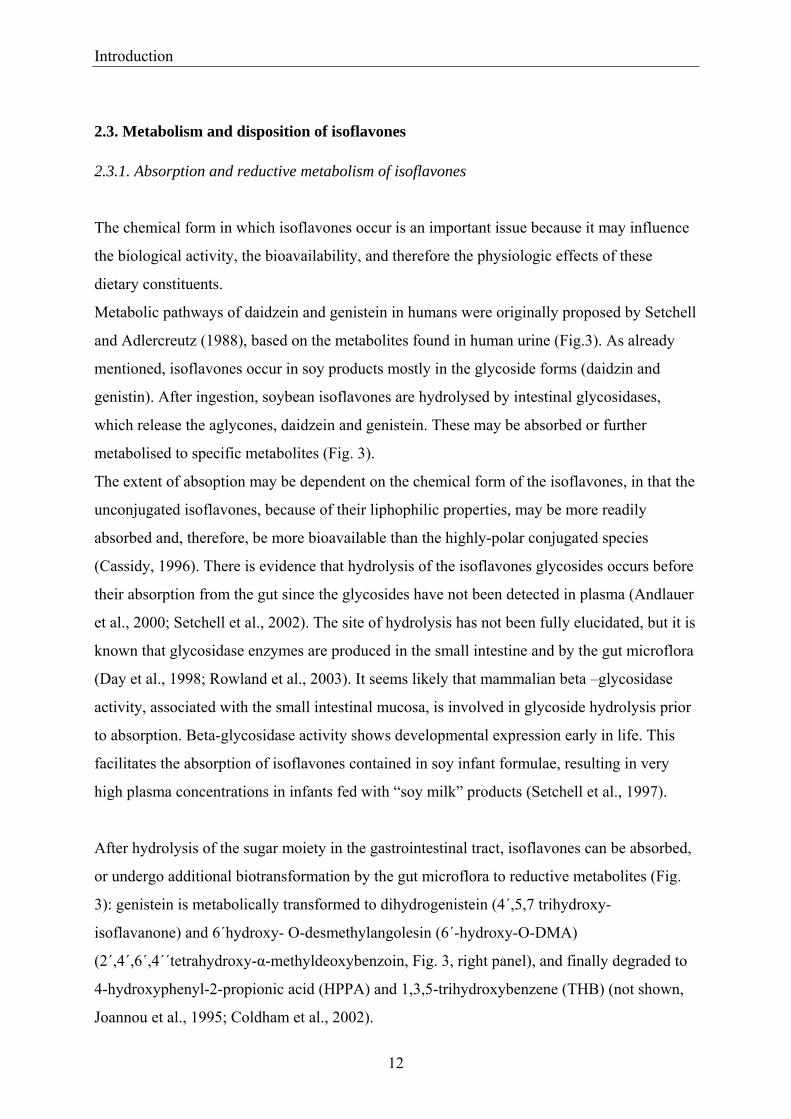
Fig. 3. Metabolic pathways for daidzein and genistein. The glycosidic forms present in plants are cleaved in the gastrointestinal tract and metabolised by gut bacteria and mammalian enzymes.
Daidzein is reduced to dihydrodaidzein (4´,7 dihydroxy-isoflavanone), which is further
metabolised to O-desmethylangolesin (O-DMA) (4´,6´,4´´trihydroxy-α-methyldeoxybenzoin)
and/or the isoflavan equol (Fig. 3, left panel). The ring structures and numbering of atoms
within these structures are shown in Fig. 4.
The extent of this metabolism appears to be highly variable among individuals and is
influenced by other components of the diets (Setchell et al., 1984). At high levels of
carbohydrate intake, causing increased intestinal fermentation, a more extensive
biotransformation of phytoestrogens is seen, with an increase of the formation of equol.
O
OOH
OH
O
OOH
OH
O
OOH
OH CH H O
OH
OH
O
O
O
OH
3
daidzein
glucoside-
daidzin
dihydrodaidzein
O-DMA equol
O
OO H
OH
O H
O
OO H
OH
O H
OO H
OH
O H
COH
O
O
O
O HO H
H 3
gen is tin
g lucos ide -
gen is te in
6 `-hyd ro -O -D M A
d ihyd rogen is te in
Introduction
14
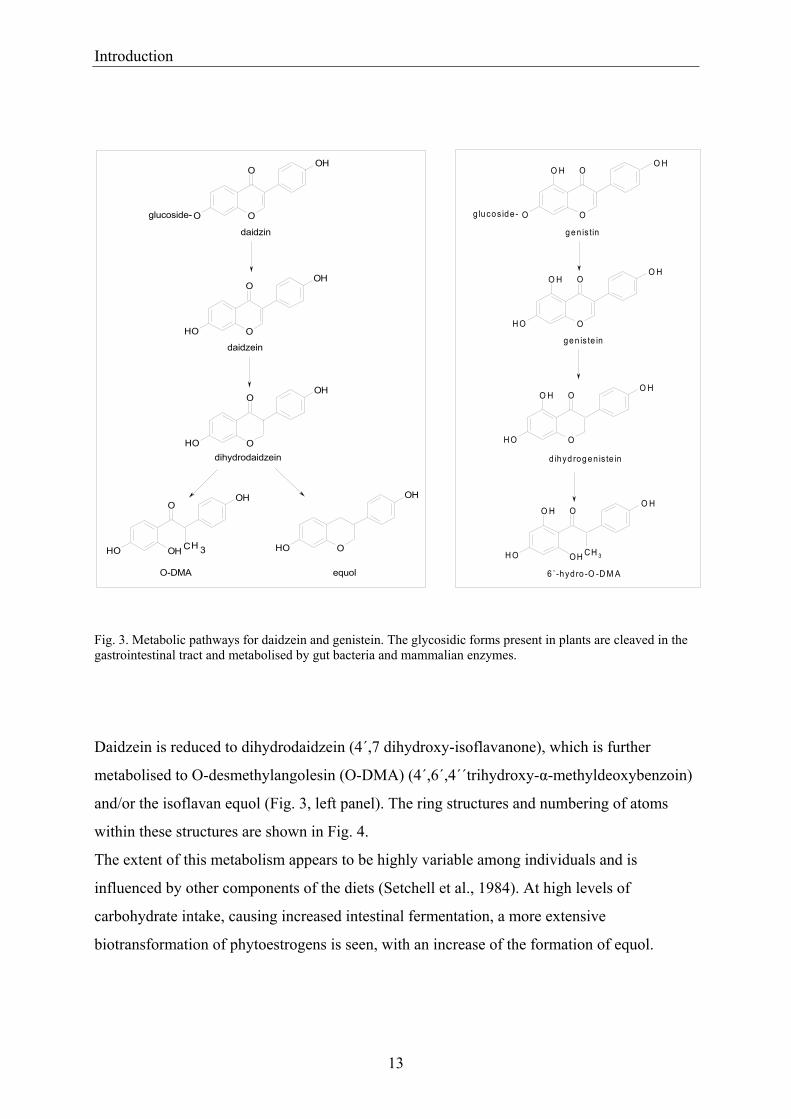
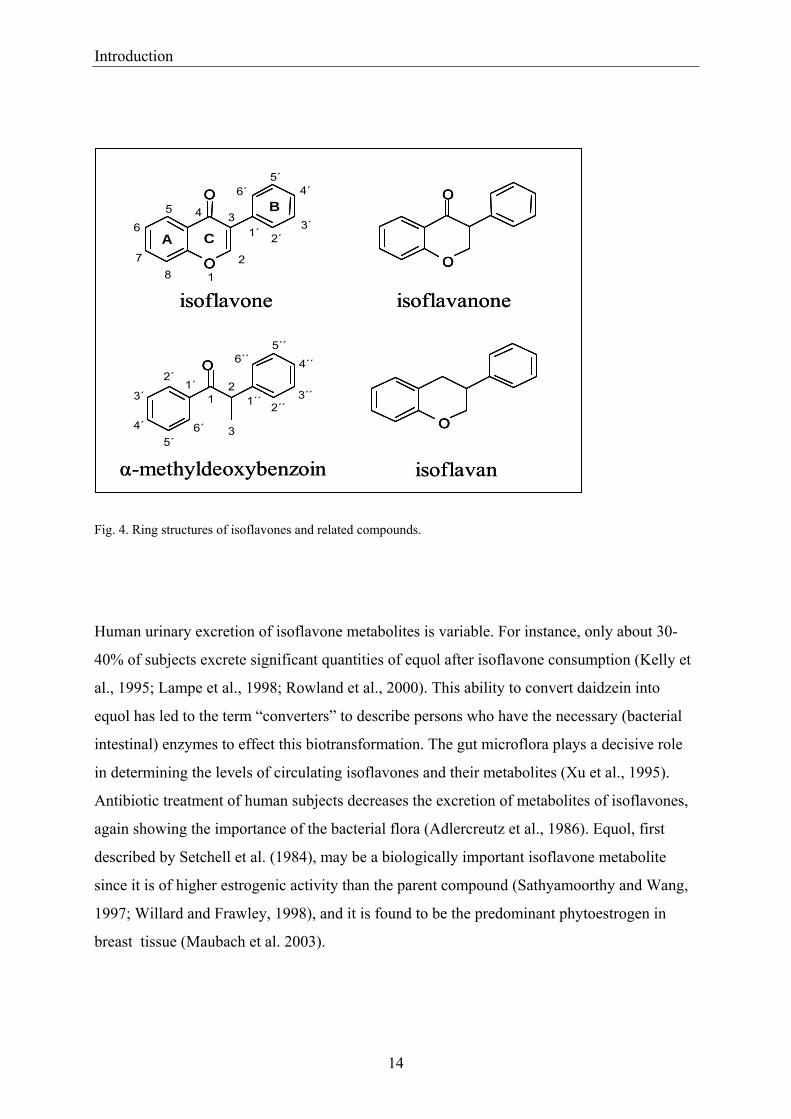
Fig. 4. Ring structures of isoflavones and related compounds.
Human urinary excretion of isoflavone metabolites is variable. For instance, only about 30-
40% of subjects excrete significant quantities of equol after isoflavone consumption (Kelly et
al., 1995; Lampe et al., 1998; Rowland et al., 2000). This ability to convert daidzein into
equol has led to the term “converters” to describe persons who have the necessary (bacterial
intestinal) enzymes to effect this biotransformation. The gut microflora plays a decisive role
in determining the levels of circulating isoflavones and their metabolites (Xu et al., 1995).
Antibiotic treatment of human subjects decreases the excretion of metabolites of isoflavones,
again showing the importance of the bacterial flora (Adlercreutz et al., 1986). Equol, first
described by Setchell et al. (1984), may be a biologically important isoflavone metabolite
since it is of higher estrogenic activity than the parent compound (Sathyamoorthy and Wang,
1997; Willard and Frawley, 1998), and it is found to be the predominant phytoestrogen in
breast tissue (Maubach et al. 2003).
O
O
O
A C
B
1
45
6
78
1´3
4´
2
2´3´
5´6´
O
1
4´´
5´´6´´
1´
34´
22´
3´
5´6´
1´´ 2´´3´´
O
O
isoflavanoneisoflavone
isoflavanα-methyldeoxybenzoin
OO
O
O
A C
B
1
45
6
78
1´3
4´
2
2´3´
5´6´
O
O
A C
B
1
45
6
78
1´3
4´
2
2´3´
5´6´
O
1
4´´
5´´6´´
1´
34´
22´
3´
5´6´
1´´ 2´´3´´
O
1
4´´
5´´6´´
1´
34´
22´
3´
5´6´
1´´ 2´´3´´
O
O
O
O
isoflavanoneisoflavone
isoflavanα-methyldeoxybenzoin
Introduction
15
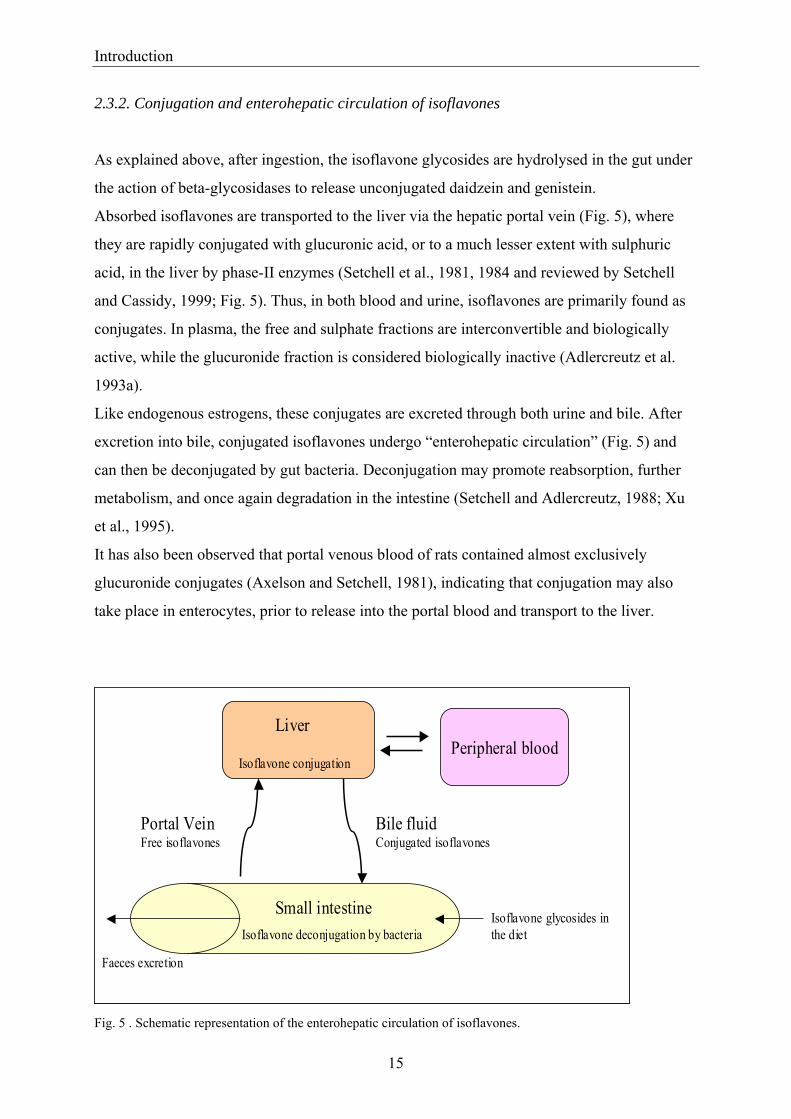
2.3.2. Conjugation and enterohepatic circulation of isoflavones
As explained above, after ingestion, the isoflavone glycosides are hydrolysed in the gut under
the action of beta-glycosidases to release unconjugated daidzein and genistein.
Absorbed isoflavones are transported to the liver via the hepatic portal vein (Fig. 5), where
they are rapidly conjugated with glucuronic acid, or to a much lesser extent with sulphuric
acid, in the liver by phase-II enzymes (Setchell et al., 1981, 1984 and reviewed by Setchell
and Cassidy, 1999; Fig. 5). Thus, in both blood and urine, isoflavones are primarily found as
conjugates. In plasma, the free and sulphate fractions are interconvertible and biologically
active, while the glucuronide fraction is considered biologically inactive (Adlercreutz et al.
1993a).
Like endogenous estrogens, these conjugates are excreted through both urine and bile. After
excretion into bile, conjugated isoflavones undergo “enterohepatic circulation” (Fig. 5) and
can then be deconjugated by gut bacteria. Deconjugation may promote reabsorption, further
metabolism, and once again degradation in the intestine (Setchell and Adlercreutz, 1988; Xu
et al., 1995).
It has also been observed that portal venous blood of rats contained almost exclusively
glucuronide conjugates (Axelson and Setchell, 1981), indicating that conjugation may also
take place in enterocytes, prior to release into the portal blood and transport to the liver.
Fig. 5 . Schematic representation of the enterohepatic circulation of isoflavones.
Liver
Portal VeinFree isoflavones
Bile fluidConjugated isoflavones
Isoflavone conjugationPeripheral blood
Isoflavone glycosides in the diet
Small intestineIsoflavone deconjugation by bacteria
Faeces excretion
Liver
Portal VeinFree isoflavones
Bile fluidConjugated isoflavones
Isoflavone conjugationPeripheral blood
Isoflavone glycosides in the diet
Small intestineIsoflavone deconjugation by bacteria
Faeces excretion
Introduction
16
2.3.3. Oxidative metabolism of isoflavones
Isoflavones, in addition to reductive and conjugation ways of metabolism, are prone to
oxidative (hepatic) biotransformation (Kulling et al., 2000; Kulling et al., 2001). Daidzein and
genistein are metabolised by cytochrome P-450 enzymes to hydroxylated metabolites, with
additional hydroxy group(s) vicinal to the original hydroxy group.
After incubating daidzein with hepatic rat microsomes, major products identified were 3´-OH-
daidzein, 6-OH-daidzein, 8-OH-daidzein, 5,6-diOH-daidzein, 3´,6-diOH-daidzein, 3´,8 diOH-
daidzein and 6,8-diOH-daidzein. Incubation of genistein with rat microsomes gave rise to the
monohydroxylated metabolites 6-OH-genistein, 3´-OH-genistein and 8-OH-genistein, and to
the dihydroxylated metabolites 3´,6-diOH-genistein and 3´,8-diOH-genistein.
The oxidative metabolism of the soy isoflavones was also studied in human volunteers
(Kulling et al., 2001). After intake of soy products, several hydroxylated metabolites of
daidzein and genistein were identified in urinary extracts after conjugate hydrolysis: 3´-OH-
daidzein, 6-OH-daidzein, 8-OH-daidzein, 3´-OH-genistein and 8-OH-genistein were observed
in HPLC profiles, and 6-OH-genistein, 3´,6-diOH-daidzein, 3´,8 diOH-daidzein, 3´,6-diOH-
genistein and 3´,8-diOH-genistein were additionally identified by GC-MS.
Also, some metabolites of daidzein of an isoflavanone, α-methyldeoxybenzoin, or an
isoflavan structure, with additional hydroxyl groups in the phenolic rings, were identified
from fecal fermentation extracts of the corresponding isoflavone or from human urine
collected after soy supplementation (Heinonen et al., 2003; Heinonen et al., 2004). The
analogous compounds derived from genistein could not be determined. Genistein, which has a
hydroxyl substituent at the 5-position, appears more susceptible to C-ring cleavage by
intestinal microflora (Xu et al., 1995), being converted to 4-hydroxyphenyl-2-propionic acid
(HPPA) and to 1,3,5-trihydroxybenzene (THB) (Coldham et al., 2002).
Thus, it appears likely that in human subjects the isoflavone aglycones are in fact first
converted to reduced metabolites by gut microflora prior to the oxidative metabolism in the
liver, as suggested Kulling et al. (2002). However, also a small fraction of oxidized isoflavone
metabolites may enter the enterohepatic circulation, may be excreted in bile, and may be
reduced by the gut microflora (Heinonen et al., 2004).
Formononetin and biochanin A represent the 4´-methyl ethers of daidzein and genistein,
respectively (Fig. 2). For these phenolic methyl ethers, the oxidative demethylation at C-4´ is
Introduction
17
an additional metabolic pathway, and the oxidative demethylation of formononetin and
biochanin A to daidzein and genistein appears to be favoured over a ring hydroxylation of
formononetin and biochanin A. This was confirmed after the intake of dietary supplements
containing formononetin and biochanin A, which resulted in high plasma concentrations of
daidzein and genistein (but not of ring-hydroxylated metabolites of formononetin and
biochanin A, Setchell et al., 2001).
2.4. Toxicokinetics of isoflavones
2.4.1. Toxicokinetics of isoflavones in rodents
The toxicokinetic behaviour of isoflavones in the organism of rodents has been characterized
by Janning et al. (2000) and by Supko and Malspeis (1995). The former reported on the
toxicokinetics of daidzein in female DA/Han rats, and the latter studied the plasma kinetics of
genistein in male Harlan CD2F1 mice.
The time-course of daidzein plasma levels after a single intravenous dose, can be fitted by a
three-exponential decline function (Derendorf and Garett, 1987): immediately after i.v.
injection of 10 mg/kg b.w. daidzein in rats, daidzein plasma concentrations were in the order
of 30 µg/ml, which decreased rapidly within the first hour. After 6 h, the daidzein
concentrations were below 50 ng/ml. The elimination half-life (t1/2) of the ultimate γ-period,
as derived from plasma concentration curves, was approximately 4.2 h. When the same dose
was administered orally (by gavage), the compound was detected in blood after 10 min,
indicating a rapid absorption of daidzein (or at least of a relevant part of the dose). The major
feature of the plasma level-time curve has been the occurrence of fluctuations, along with
marked individual deviations. This behaviour is very characteristic of extensive enterohepatic
circulation (Fig. 5; Löffler and Bolt, 1980; Back et al., 1980).
Compared to the lower dose of 10 mg/kg b.w., the plasma levels of daidzein after a higher
dose of 100 mg/kg b.w. remain within a similar order of magnitude, pointing to a lower
bioavailability at higher doses. Based on the calculated AUC (area under the curve) and the
respective doses, the oral bioavailability of daidzein was calculated to be 9.7% and 2.2%, for
the doses of 10 and 100 mg/kg b.w., respectively. Due to the enterohepatic recirculation, the
toxicokinetics are complex.
Introduction
18
The oral bioavailability (F) of a compound (drug or, in this case, daidzein) is calculated from
the dose and area under the plasma concentration vs. time curve (AUC) values, upon
comparative intravenous and oral administration of the same dose, according to:
Along with plasma levels of free daidzein, also the daidzein conjugates decline rapidly after
i.v. administration of daidzein. Conjugates (glucuronides and sulfates) are also the main
circulating metabolites when daidzein is given orally (e.g., by gavage). Daidzein is efficiently
excreted in the bile as glucuronide conjugate.
There seems to be an accumulation of daidzein in certain tissues, since concentrations of total
daidzein (free plus hydrolysed conjugates) in liver and kidney tissues were three- to five fold
higher than in plasma.
The administration of genistein to mice by i.v. injection at doses of 9, 26 and 54 mg/kg b.w.
has led to initial plasma levels in the range of 15 to 60 µg/ml (Supko and Malspeis, 1995).
After declining more than 250-fold over a period of 50 min, the plasma levels of genistein
again gradually increased until a plateau near 90 min; the appearance of this secondary peak
was due to enterohepatic cycling. The apparent terminal half-life was 4.7 h, and the mean
apparent total plasma clearance of genistein was about 66.5 ml/min/kg b.w., a value similar
to that of the hepatic blood flow. The systemic bioavailability of orally administered genistein
(180 mg/kg b.w.), which resulted in a genistein plasma concentration of 1.1 µg/ml, was only
12%.
Another study (Degen et al., 2002b) reported a rapid transplacental transfer of daidzein in
pregnant DA/Han rats to the fetus. After 10 min of a single i.v. administration of 10 mg/kg
b.w., the placenta contained one-tenth the hepatic daidzein concentration (31 µg/g in maternal
liver). This shows a rapid transfer from mother to fetus.
Overall, the toxicokinetics of both isoflavones, daidzein and genistein, present clear
similarities. Such data are relevant to extrapolate biological effects and toxicities from
experimental rodents to the human situation and are therefore indispensible for a toxicological
risk assessment.
AUCoral x Doseiv
Doseoral X AUCiv
F =
Introduction
19
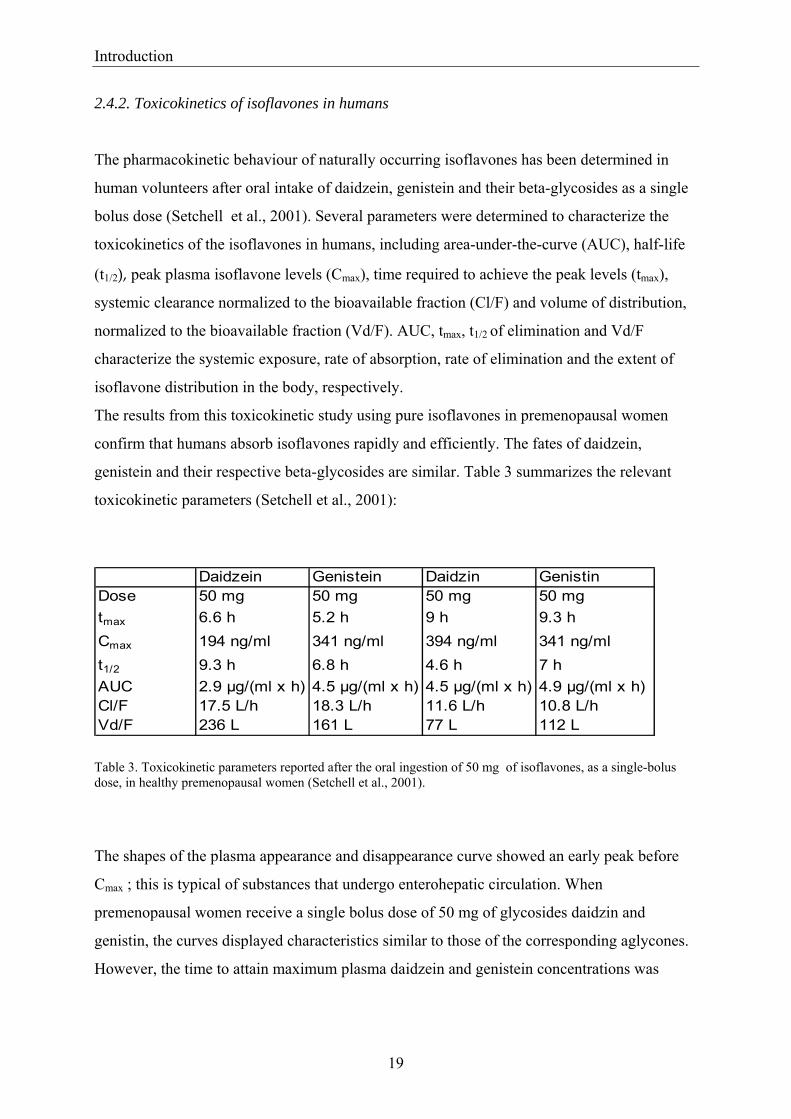
2.4.2. Toxicokinetics of isoflavones in humans
The pharmacokinetic behaviour of naturally occurring isoflavones has been determined in
human volunteers after oral intake of daidzein, genistein and their beta-glycosides as a single
bolus dose (Setchell et al., 2001). Several parameters were determined to characterize the
toxicokinetics of the isoflavones in humans, including area-under-the-curve (AUC), half-life
(t1/2), peak plasma isoflavone levels (Cmax), time required to achieve the peak levels (tmax),
systemic clearance normalized to the bioavailable fraction (Cl/F) and volume of distribution,
normalized to the bioavailable fraction (Vd/F). AUC, tmax, t1/2 of elimination and Vd/F
characterize the systemic exposure, rate of absorption, rate of elimination and the extent of
isoflavone distribution in the body, respectively.
The results from this toxicokinetic study using pure isoflavones in premenopausal women
confirm that humans absorb isoflavones rapidly and efficiently. The fates of daidzein,
genistein and their respective beta-glycosides are similar. Table 3 summarizes the relevant
toxicokinetic parameters (Setchell et al., 2001):
Table 3. Toxicokinetic parameters reported after the oral ingestion of 50 mg of isoflavones, as a single-bolus dose, in healthy premenopausal women (Setchell et al., 2001).
The shapes of the plasma appearance and disappearance curve showed an early peak before
Cmax ; this is typical of substances that undergo enterohepatic circulation. When
premenopausal women receive a single bolus dose of 50 mg of glycosides daidzin and
genistin, the curves displayed characteristics similar to those of the corresponding aglycones.
However, the time to attain maximum plasma daidzein and genistein concentrations was
Daidzein Genistein Daidzin GenistinDose 50 mg 50 mg 50 mg 50 mgtmax 6.6 h 5.2 h 9 h 9.3 hCmax 194 ng/ml 341 ng/ml 394 ng/ml 341 ng/mlt1/2 9.3 h 6.8 h 4.6 h 7 hAUC 2.9 µg/(ml x h) 4.5 µg/(ml x h) 4.5 µg/(ml x h) 4.9 µg/(ml x h)Cl/F 17.5 L/h 18.3 L/h 11.6 L/h 10.8 L/hVd/F 236 L 161 L 77 L 112 L
Introduction
20
longer at 9 and 9.3 h, respectively, after the glycosides were ingested. This indicates that the
rate-limiting step for absorption is the initial hydrolysis of the sugar moiety.
The systemic bioavailability of genistein is much greater than that for daidzein as indicated by
the high AUCs values. Moreover, the greater bioavailability of the isoflavones determined
from the AUC when the glycosides are ingested, is explained by the glycoside moiety acting
as a protective group to prevent biodegradation of the isoflavone structure.
The average volume of distribution normalized to apparent bioaiavailability fraction (Vd/F) is
large for both daidzein and genistein, indicating extensive tissue distribution. Daidzein
presents a much large Vd/F than genistein, and this explains why genistein levels in plasma
always exceed daidzein concentrations when equal amounts of the two isoflavones are given
(Setchell et al., 2001).
Compared to the levels of conjugates, only a relatively small proportion of the aglycone
isoflavones appears in plasma, even when high doses of isoflavones were ingested.
2.5. Main biological effects
2.5.1. Hormonal effects
Phytoestrogens have been shown to bind the estrogen receptor (ER), although this binding is
only weak in comparison to that of the endogenous hormone, estradiol. As an example,
genistein competes with [³H]-estradiol for binding to the ER (Wang et al. 1996), and the
concentration required to produce a 50% inhibition of estradiol binding (IC50) was 5x10⁻⁶ M.
Daidzein, equol and O-DMA (see Fig. 3) also bind to the ER: equol (IC50=1.0x10⁻⁶) has the
highest affinity for the ERα , two-fold higher than daidzein (IC50=2.0x10⁻⁶) and six-fold
higher than O-DMA (IC50=6.0x10⁻⁶) (Schmitt et al. 2001).
Phytoestrogens exert estrogenic effects both in cell culture and in vivo. For instance,
phytoestrogens stimulate the growth of estrogen-dependent MCF-7cells and elicit an
uterotrophic response in rodents (Diel et al. 2000). Interestingly, genistein and daidzein
showed a biphasic behaviour on cellular proliferation. Concentrations between 0.01-10 µM
stimulated the growth of MCF-7 cells (Wang et al. 1996, Hsu et al. 1999). However, at
concentrations >10 µM, these phytoestrogens inhibited cell proliferation. Genistein has been
shown to stimulate expression of estrogen-responsive pS2 mRNA at concentrations as low as
0.01 µM. Since the range for stimulation of cell proliferation was the same that stimulates
Introduction
21
expression of pS2, it indicates that stimulation of growth was mediated through the ER.
Genistein did not stimulate growth in ER-negative MDA-MB-231cells; in these ER-negative
cells the inhibitory effects of genistein (>10µM) on proliferation remained. These data show
that the inhibitory effect on the growth of MCF-7 cells observed with high concentrations of
genistein is independent of binding to the ER.
Phytoestrogens may also act as anti-estrogens. This may occur through various mechanisms:
at concentrations 100-1000 times those of endogenous estradiol (probable levels in human
plasma after high phytoestrogen consumption), phytoestrogens may be able to compete
effectively with endogenous estrogens, bind to the ER, and prevent estrogen-stimulated
growth in mammals (Adlercreutz et al. 1995).
2.5.2. Non-hormonal effects
Isoflavones may exert some effects through an antioxidant mechanism. Genistein has been
shown to decrease the hydrogen peroxide production in tumour cells (IC50 = 25 µM).
Daidzein displayed weaker effects (IC50 = 150 µM). Furthermore, genistein is a potent
inhibitor of superoxide anion generation by xanthine oxidase (IC50 = 1-2.5 µM ), but daidzein
has a moderate inhibitory effect (IC50 = 5 µM).
Genistein has also been shown to increase activities of antioxidant enzymes. Feeding 250 ppm
(in the diet) of genistein to 6- to 7-week old female CD-1 mice for 30 days enhanced the
activities of catalase, superoxide dismutase, glutathione peroxidase, and glutathione reductase
by 10-30% in skin and small intestine (Wei et al. 1995).
2.5.3. Genotoxicity
The question of genotoxicity of estrogenic compounds of plant origin has been raised for
lignans, coumestrol, and for the isoflavones, genistein and daidzein (Kulling and Metzler
1997, Kulling et al. 1999, Tsutsui et al. 2003). A lack of knowledge in this field is apparent.
The discussion is focused on chromosomal genotoxicity, and preliminary data by Kulling and
Metzler (1997) have pointed to genistein, the hydroxy derivative of daidzein, being more
genotoxic than the parent compound daidzein. In this context, several potential mechanisms
were discussed, such as interference with cytoskeletal macromolecules, with topoisomerase
Introduction
22
II, and effects on intracellular generation of reactive oxygen species (Kulling and Metzler
1997). Also, possible mechanisms of mutagenicity by direct interaction of the compounds
with DNA have been mentioned (Tsutsui et al. 2003).
As the genotoxicity of genistein and daidzein and associated mechanisms of action are of key
relevance for the regulatory handling of these compounds as components of human food, it
was of importance to establish dose-effect-relationships, related to genotoxicity endpoints, in
a suitable test system. As the preliminary data of Kulling and Metzler (1997) have
demonstrated that the chromosomal endpoint of induction of micronuclei in the V79 cell line
could be relevant for the consideration of genotoxicity of genistein and daidzein, the second
part of the thesis presented here establishes the dose-genotoxicity response relations in this
experimental test system; these data also incorporated genistein, daidzein and its metabolite
equol.
2.6. Aim of the present study
The aim of the present thesis work was to characterize the genotoxicity risk of the isoflavones
daidzein, genistein and the daidzein metabolite, equol. There are two aspects of risk
assessment: the profile of biological effects of the agent (hazard) and the quantity exposure to
that compound of humans.
Thus, an assessment of the human exposure was performed, based on literature data and on
an own additional investigation of the toxicokinetics. For the latter, rodents were used as an in
vivo model.
On the other hand, a hazard identification was done: a qualitative/quantitative description of
the possible effects of the substances. Again, the information on the known hormonal effects
of the compounds was taken from the literature, whereas experimental data on the dose-
response of genotoxicity and a characterization of the mode of action were generated as part
of this thesis.
Finally, both aspects, possible human exposure and compound-related effects were put into a
perspective to arrive at a characterization of the possible risk of endocrine activities and of
genotoxicity for humans, due to phytoestrogen contents in the human diet.
Experimental Part Materials and Methods
23
3. EXPERIMENTAL PART
3.1. Materials and Methods
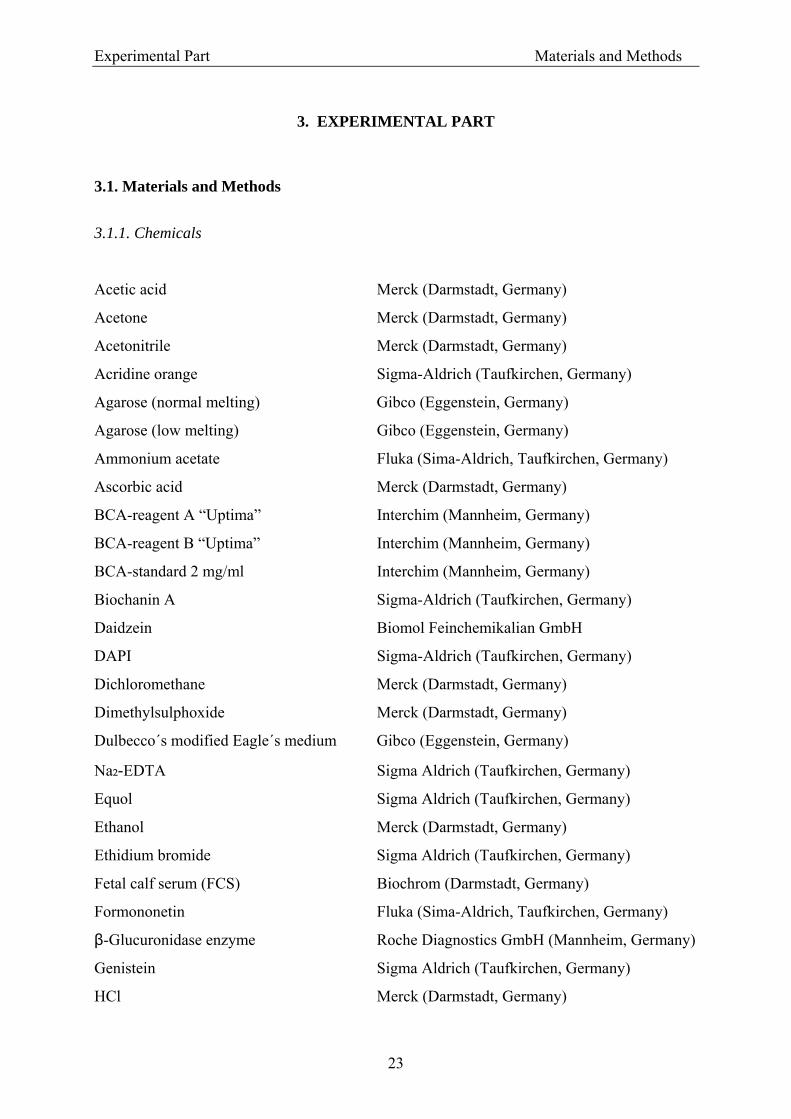
3.1.1. Chemicals
Acetic acid Merck (Darmstadt, Germany)
Acetone Merck (Darmstadt, Germany)
Acetonitrile Merck (Darmstadt, Germany)
Acridine orange Sigma-Aldrich (Taufkirchen, Germany)
Agarose (normal melting) Gibco (Eggenstein, Germany)
Agarose (low melting) Gibco (Eggenstein, Germany)
Ammonium acetate Fluka (Sima-Aldrich, Taufkirchen, Germany)
Ascorbic acid Merck (Darmstadt, Germany)
BCA-reagent A “Uptima” Interchim (Mannheim, Germany)
BCA-reagent B “Uptima” Interchim (Mannheim, Germany)
BCA-standard 2 mg/ml Interchim (Mannheim, Germany)
Biochanin A Sigma-Aldrich (Taufkirchen, Germany)
Daidzein Biomol Feinchemikalian GmbH
DAPI Sigma-Aldrich (Taufkirchen, Germany)
Dichloromethane Merck (Darmstadt, Germany)
Dimethylsulphoxide Merck (Darmstadt, Germany)
Dulbecco´s modified Eagle´s medium Gibco (Eggenstein, Germany)
Na₂‐EDTA Sigma Aldrich (Taufkirchen, Germany)
Equol Sigma Aldrich (Taufkirchen, Germany)
Ethanol Merck (Darmstadt, Germany)
Ethidium bromide Sigma Aldrich (Taufkirchen, Germany)
Fetal calf serum (FCS) Biochrom (Darmstadt, Germany)
Formononetin Fluka (Sima-Aldrich, Taufkirchen, Germany)
β-Glucuronidase enzyme Roche Diagnostics GmbH (Mannheim, Germany)
Genistein Sigma Aldrich (Taufkirchen, Germany)
HCl Merck (Darmstadt, Germany)
Experimental Part Materials and Methods
24
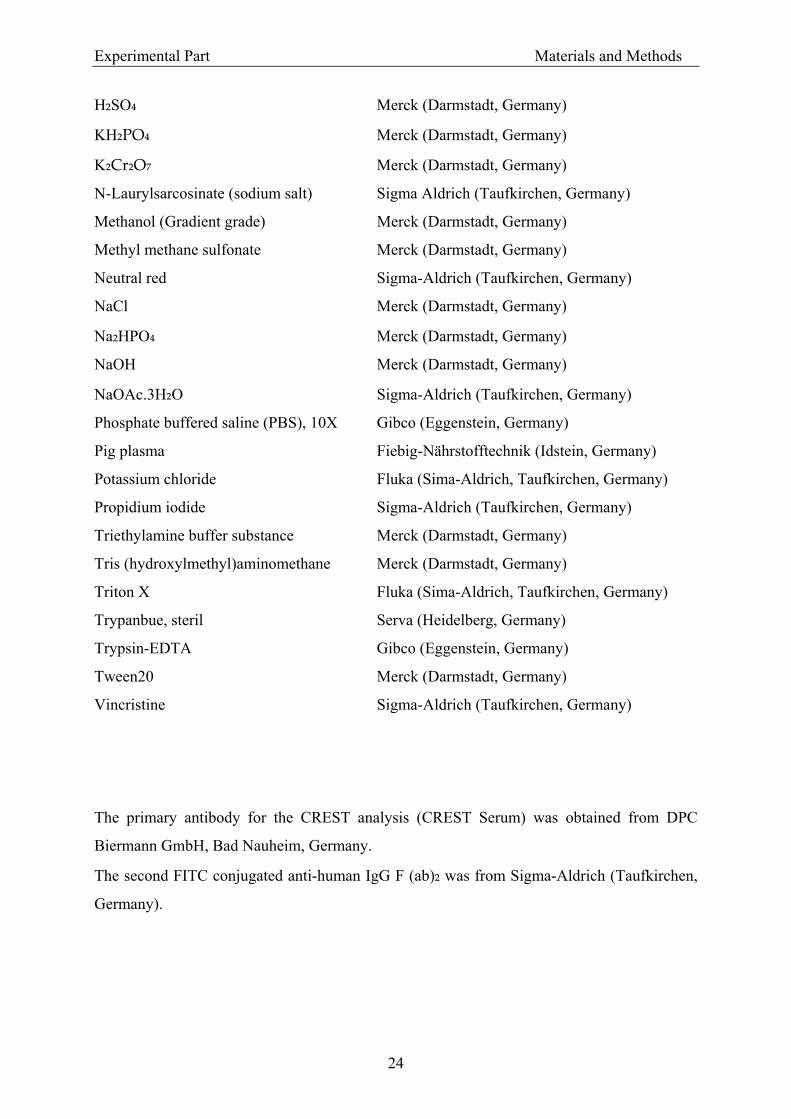
H₂SO₄ Merck (Darmstadt, Germany)
KH₂PO₄ Merck (Darmstadt, Germany)
K₂Cr₂O₇ Merck (Darmstadt, Germany)
N-Laurylsarcosinate (sodium salt) Sigma Aldrich (Taufkirchen, Germany)
Methanol (Gradient grade) Merck (Darmstadt, Germany)
Methyl methane sulfonate Merck (Darmstadt, Germany)
Neutral red Sigma-Aldrich (Taufkirchen, Germany)
NaCl Merck (Darmstadt, Germany)
Na₂HPO₄ Merck (Darmstadt, Germany)
NaOH Merck (Darmstadt, Germany)
NaOAc.3H₂O Sigma-Aldrich (Taufkirchen, Germany)
Phosphate buffered saline (PBS), 10X Gibco (Eggenstein, Germany)
Pig plasma Fiebig-Nährstofftechnik (Idstein, Germany)
Potassium chloride Fluka (Sima-Aldrich, Taufkirchen, Germany)
Propidium iodide Sigma-Aldrich (Taufkirchen, Germany)
Triethylamine buffer substance Merck (Darmstadt, Germany)
Tris (hydroxylmethyl)aminomethane Merck (Darmstadt, Germany)
Triton X Fluka (Sima-Aldrich, Taufkirchen, Germany)
Trypanbue, steril Serva (Heidelberg, Germany)
Trypsin-EDTA Gibco (Eggenstein, Germany)
Tween20 Merck (Darmstadt, Germany)
Vincristine Sigma-Aldrich (Taufkirchen, Germany)
The primary antibody for the CREST analysis (CREST Serum) was obtained from DPC
Biermann GmbH, Bad Nauheim, Germany.
The second FITC conjugated anti-human IgG F (ab)₂ was from Sigma-Aldrich (Taufkirchen,
Germany).
Experimental Part Materials and Methods
25
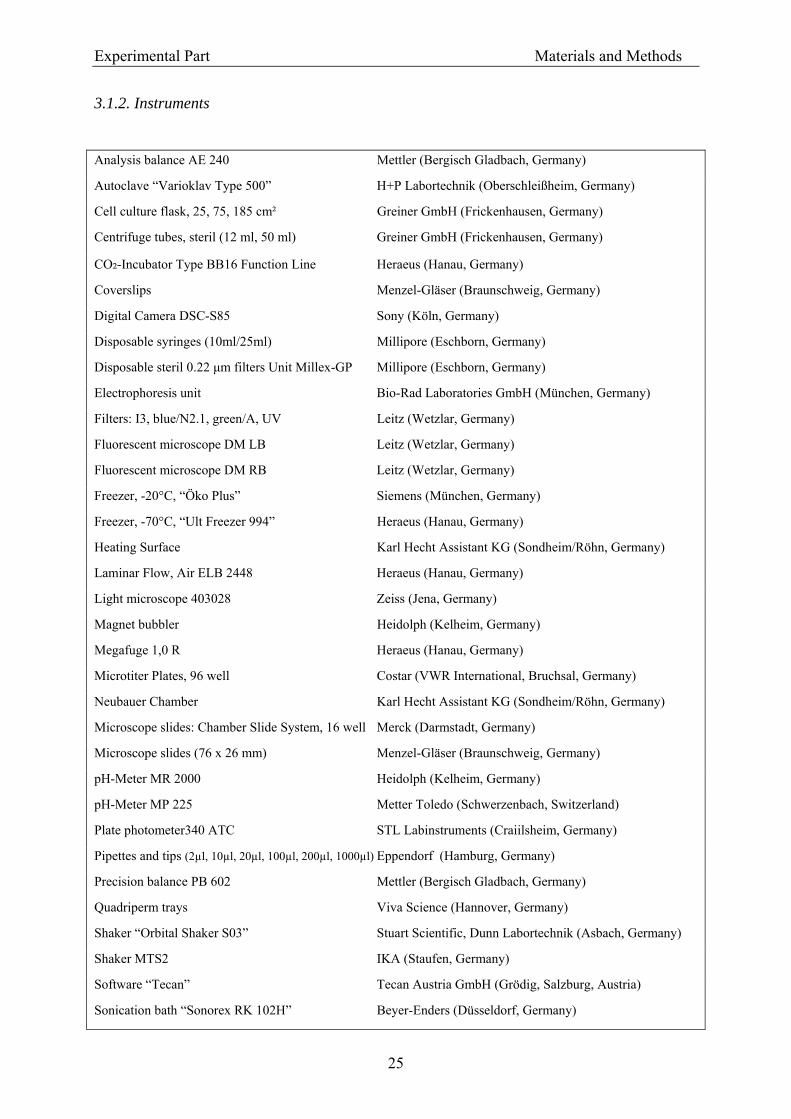
3.1.2. Instruments
Analysis balance AE 240 Mettler (Bergisch Gladbach, Germany)
Autoclave “Varioklav Type 500” H+P Labortechnik (Oberschleißheim, Germany)
Cell culture flask, 25, 75, 185 cm² Greiner GmbH (Frickenhausen, Germany)
Centrifuge tubes, steril (12 ml, 50 ml) Greiner GmbH (Frickenhausen, Germany)
CO₂-Incubator Type BB16 Function Line Heraeus (Hanau, Germany)
Coverslips Menzel-Gläser (Braunschweig, Germany)
Digital Camera DSC-S85 Sony (Köln, Germany)
Disposable syringes (10ml/25ml) Millipore (Eschborn, Germany)
Disposable steril 0.22 µm filters Unit Millex-GP Millipore (Eschborn, Germany)
Electrophoresis unit Bio-Rad Laboratories GmbH (München, Germany)
Filters: I3, blue/N2.1, green/A, UV Leitz (Wetzlar, Germany)
Fluorescent microscope DM LB Leitz (Wetzlar, Germany)
Fluorescent microscope DM RB Leitz (Wetzlar, Germany)
Freezer, -20°C, “Öko Plus” Siemens (München, Germany)
Freezer, -70°C, “Ult Freezer 994” Heraeus (Hanau, Germany)
Heating Surface Karl Hecht Assistant KG (Sondheim/Röhn, Germany)
Laminar Flow, Air ELB 2448 Heraeus (Hanau, Germany)
Light microscope 403028 Zeiss (Jena, Germany)
Magnet bubbler Heidolph (Kelheim, Germany)
Megafuge 1,0 R Heraeus (Hanau, Germany)
Microtiter Plates, 96 well Costar (VWR International, Bruchsal, Germany)
Neubauer Chamber Karl Hecht Assistant KG (Sondheim/Röhn, Germany)
Microscope slides: Chamber Slide System, 16 well Merck (Darmstadt, Germany)
Microscope slides (76 x 26 mm) Menzel-Gläser (Braunschweig, Germany)
pH-Meter MR 2000 Heidolph (Kelheim, Germany)
pH-Meter MP 225 Metter Toledo (Schwerzenbach, Switzerland)
Plate photometer340 ATC STL Labinstruments (Craiilsheim, Germany)
Pipettes and tips (2µl, 10µl, 20µl, 100µl, 200µl, 1000µl) Eppendorf (Hamburg, Germany)
Precision balance PB 602 Mettler (Bergisch Gladbach, Germany)
Quadriperm trays Viva Science (Hannover, Germany)
Shaker “Orbital Shaker S03” Stuart Scientific, Dunn Labortechnik (Asbach, Germany)
Shaker MTS2 IKA (Staufen, Germany)
Software “Tecan” Tecan Austria GmbH (Grödig, Salzburg, Austria)
Sonication bath “Sonorex RK 102H” Beyer-Enders (Düsseldorf, Germany)
Experimental Part Materials and Methods
26
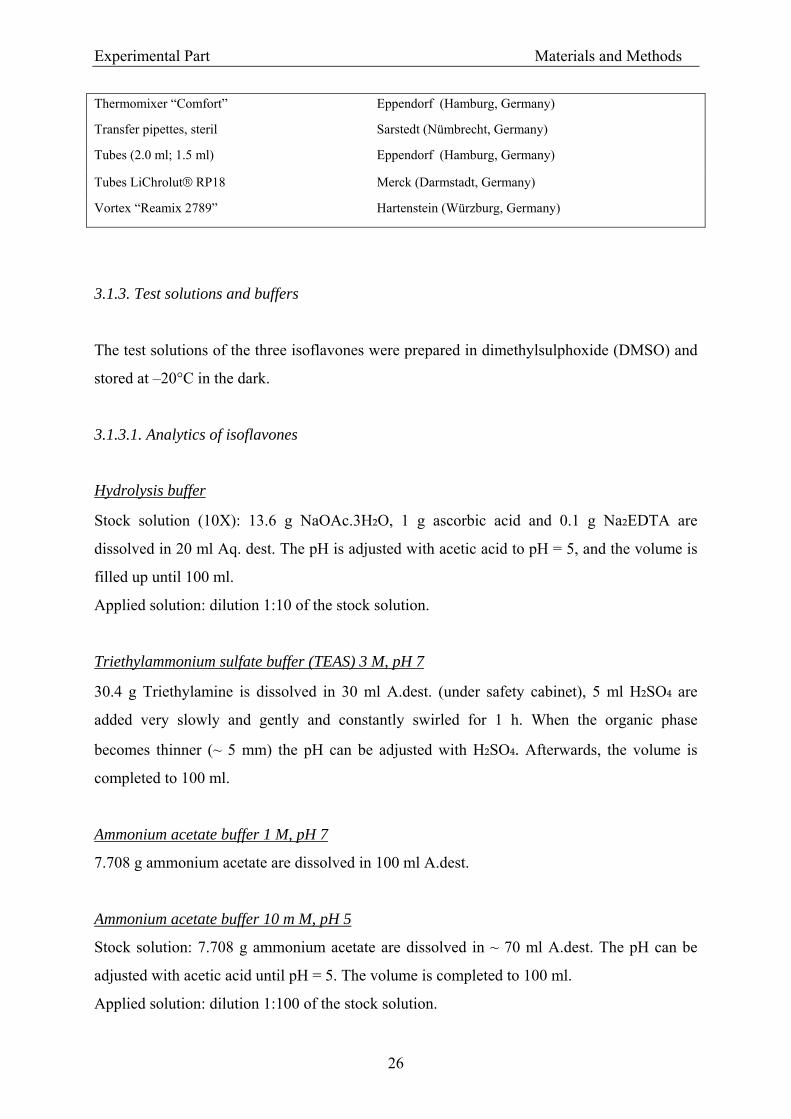
Thermomixer “Comfort” Eppendorf (Hamburg, Germany)
Transfer pipettes, steril Sarstedt (Nümbrecht, Germany)
Tubes (2.0 ml; 1.5 ml) Eppendorf (Hamburg, Germany)
Tubes LiChrolut® RP18 Merck (Darmstadt, Germany)
Vortex “Reamix 2789” Hartenstein (Würzburg, Germany)
3.1.3. Test solutions and buffers
The test solutions of the three isoflavones were prepared in dimethylsulphoxide (DMSO) and
stored at –20°C in the dark.
3.1.3.1. Analytics of isoflavones
Hydrolysis buffer
Stock solution (10X): 13.6 g NaOAc.3H₂O, 1 g ascorbic acid and 0.1 g Na₂EDTA are
dissolved in 20 ml Aq. dest. The pH is adjusted with acetic acid to pH = 5, and the volume is
filled up until 100 ml.
Applied solution: dilution 1:10 of the stock solution.
Triethylammonium sulfate buffer (TEAS) 3 M, pH 7
30.4 g Triethylamine is dissolved in 30 ml A.dest. (under safety cabinet), 5 ml H₂SO₄ are
added very slowly and gently and constantly swirled for 1 h. When the organic phase
becomes thinner (~ 5 mm) the pH can be adjusted with H₂SO₄. Afterwards, the volume is
completed to 100 ml.
Ammonium acetate buffer 1 M, pH 7
7.708 g ammonium acetate are dissolved in 100 ml A.dest.
Ammonium acetate buffer 10 m M, pH 5
Stock solution: 7.708 g ammonium acetate are dissolved in ~ 70 ml A.dest. The pH can be
adjusted with acetic acid until pH = 5. The volume is completed to 100 ml.
Applied solution: dilution 1:100 of the stock solution.
Experimental Part Materials and Methods
27
Compounds used as internal standards
Biochanin A, stock solution: 5 mg biochanin A is dissolved in 10 ml ethanol (0.5 mg/ml)
Formononetin, stock solution: 2.5 mg formononetin is dissolved in 50 ml methanol (50
µg/ml)
3.1.3.2. Cell culture
Trypan Blue solution
Trypan Blue 1:10 in PBS
Acridine Orange solution
Stock solution: 1mg/ml A. dest.
Applied solution:
• 7 ml 0.3 M Na₂HPO₄ * 2 H₂O
• 7 ml 0.3 M KH₂PO₄
• 5 ml stock solution
• 80 ml A. dest
Methanol-acetic acid fixation solution
Methanol-acetic acid (3:1) is prepared 1 day before use and is stored at –20°C.
KCl A 0.4% KCl in A. dest. solution is prepared a day before use, sterilized and stored at 4°C.
Micronucleus positive control substances MMS stock solution (10mg/ml): 0.1 g MMS is dissolved in 1 ml medium and then is diluted
1:10 in medium.
VCR stock solution (1 µM): 0.9 mg VCR is dissolved in 1 ml medium and then is diluted 1:
10³ in medium.
Neutral red solution Stock solution: 40 mg Neutral Red in 10 ml A. dest. is shaken for 1 h at 37°C and then stored
at 4°C.
Experimental Part Materials and Methods
28
Applied solution (NR medium): 100 ml medium + 1250 µl stock solution is prepared and
stored for 18 h at 37°C in an incubator. Before usage, the solution is filtered using a 0.22 µm
filter Unit Millex-GP.
Neutral red fixation solution
50 % Ethanol, 1 % acetic acid
BCA reagent
50 parts BCA reagent A “Uptima” and 1 part BCA reagent B “Uptima”
Soerensen buffer (pH 6.8)
5 ml 0.3 M Na₂HPO₄ * 2 H₂O + 5 ml 0.3 M KH₂PO₄. The volume is completed until 100 ml
with A. dest.
CREST dye solution
• 1 µg/ml DAPI
• 0.1 mg/ml PI
• DAPI/PI (3:1)
Lysing solution
Stock solution: 131.5 g NaCl, 33.5 g Na₂EDTA, 1.08 g Tris, and 7.2-10.8 g NaOH are
dissolved in 900 ml A.dest. and the pH is adjusted in 10.
1 g Na-laurylsarcosinate is dissolved in 100ml A.dest. and is added to the previous solution.
This stock solution can be stored at 4°C for a month.
Applied solution: 178 ml stock solution is warmed up to room temperatute and is mixed with
20 ml DMSO and 2 ml Triton X.
Electrophoresis buffer
150 ml of a 10 N NaOH solution (400 g/L) and 25 ml of a 200 mM Na₂EDTA solution (14.9
g/200 ml) are diluted in 5 L A. dest.
This stock solution can be stored at 4°C for a month.
Experimental Part Materials and Methods
29
Neutralization buffer
48.4 g/L Tris is dissolved in A. dest. (pH = 7.5).
Ethidium bromide solution
Stock solution (10X): 10 mg ethidium bromide in 50 ml A. dest. (200 µg/ml). It is stored in
the dark at room temperature.
Applied solution: 1:10 dilution (20 µg/ml).
Agarose preparation
0.5 % low melting temperature (LMP) agarose is prepared dissolving 100 mg in 20 ml PBS. It
is boiled twice and stored in sterile Eppendorf tubes. For the COMET assay the agarose is
warmed up to 95°C and kept at 37°C.
3.1.4. Determination of genistein and daidzein concentrations in rat chow and rat plasma by
HPLC
3.1.4.1. Chromatographic principles
3.1.4.1.1. Principles and characteristic values of chromatographic separations
The principle of chromatography is based on the passage of the constituents to be separated
between two immiscible phases. For this, the sample is dissolved in the mobile phase and
moves across a stationary phase.
In the case of column chromatography, all the constituents travel the same route through the
separation bed, and due to the specific interactions with the stationary phase they appear at the
end of the column at different times, where they are detected.
The sample is dissolved in the mobile phase and is introduced at the head of the column.
Then, using the mobile phase, elution is undertaken until the substances are separated and
detected at the end of the column. Once the sample has been injected, the constituents
distribute between the mobile and stationary phases. If the mobile phase is then continuosly
supplied, the substances distribute along the column between the new mobile and the
stationary phase. Compounds retained more strongly on the stationary phase take longer to be
separated than substances, which are less strongly bound.
Experimental Part Materials and Methods
30
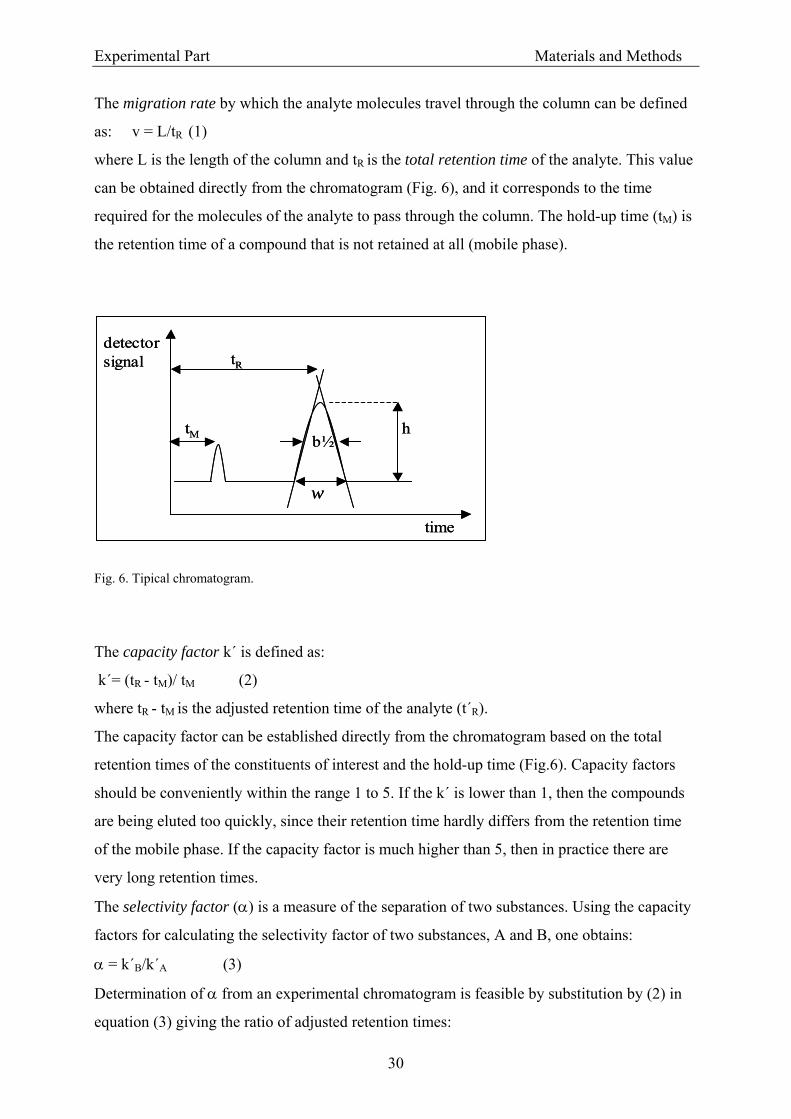
The migration rate by which the analyte molecules travel through the column can be defined
as: v = L/tR (1)
where L is the length of the column and tR is the total retention time of the analyte. This value
can be obtained directly from the chromatogram (Fig. 6), and it corresponds to the time
required for the molecules of the analyte to pass through the column. The hold-up time (tM) is
the retention time of a compound that is not retained at all (mobile phase).
Fig. 6. Tipical chromatogram.
The capacity factor k´ is defined as:
k´= (tR - tM)/ tM (2)
where tR - tM is the adjusted retention time of the analyte (t´R).
The capacity factor can be established directly from the chromatogram based on the total
retention times of the constituents of interest and the hold-up time (Fig.6). Capacity factors
should be conveniently within the range 1 to 5. If the k´ is lower than 1, then the compounds
are being eluted too quickly, since their retention time hardly differs from the retention time
of the mobile phase. If the capacity factor is much higher than 5, then in practice there are
very long retention times.
The selectivity factor (α) is a measure of the separation of two substances. Using the capacity
factors for calculating the selectivity factor of two substances, A and B, one obtains:
α = k´B/k´A (3)
Determination of α from an experimental chromatogram is feasible by substitution by (2) in
equation (3) giving the ratio of adjusted retention times:
time
detector signal
w
b½h
tR
tM
time
detector signal
w
b½h
tR
tM
Experimental Part Materials and Methods
31
α = (t´R)B/ (t´R) A (4)
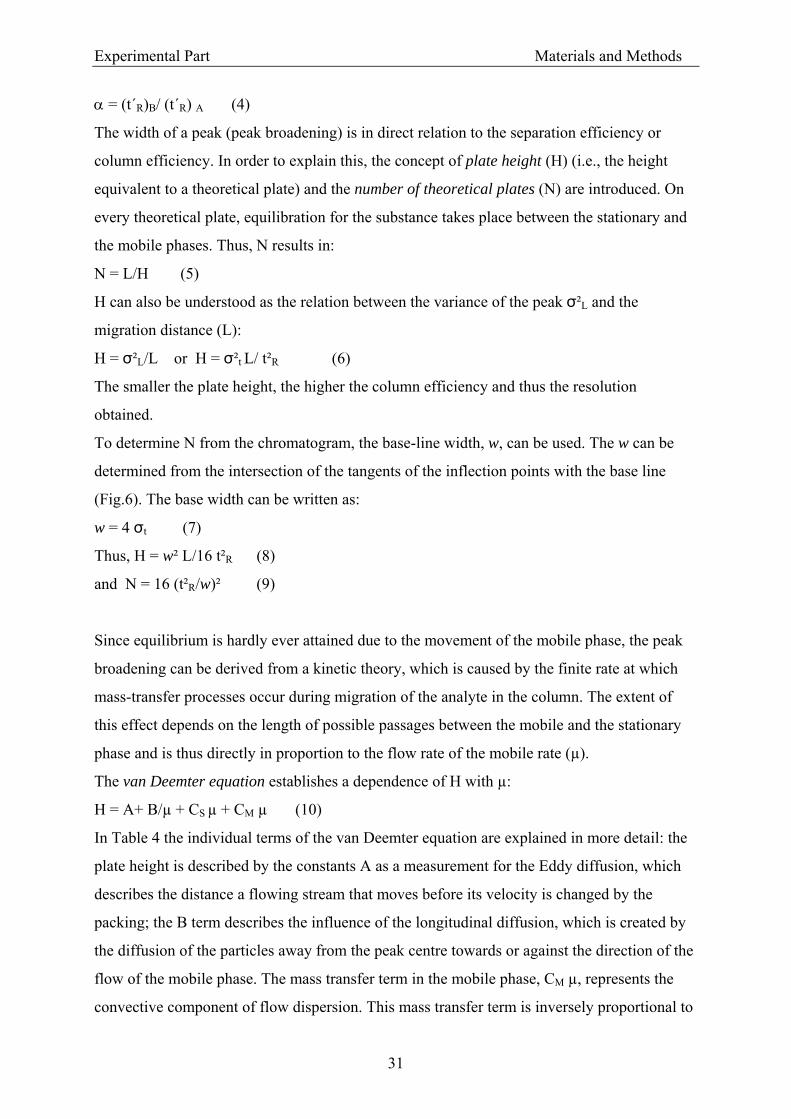
The width of a peak (peak broadening) is in direct relation to the separation efficiency or
column efficiency. In order to explain this, the concept of plate height (H) (i.e., the height
equivalent to a theoretical plate) and the number of theoretical plates (N) are introduced. On
every theoretical plate, equilibration for the substance takes place between the stationary and
the mobile phases. Thus, N results in:
N = L/H (5)
H can also be understood as the relation between the variance of the peak σ²L and the
migration distance (L):
H = σ²L/L or H = σ²t L/ t²R (6)
The smaller the plate height, the higher the column efficiency and thus the resolution
obtained.
To determine N from the chromatogram, the base-line width, w, can be used. The w can be
determined from the intersection of the tangents of the inflection points with the base line
(Fig.6). The base width can be written as:
w = 4 σt (7)
Thus, H = w² L/16 t²R (8)
and N = 16 (t²R/w)² (9)
Since equilibrium is hardly ever attained due to the movement of the mobile phase, the peak
broadening can be derived from a kinetic theory, which is caused by the finite rate at which
mass-transfer processes occur during migration of the analyte in the column. The extent of
this effect depends on the length of possible passages between the mobile and the stationary
phase and is thus directly in proportion to the flow rate of the mobile rate (µ).
The van Deemter equation establishes a dependence of H with µ:
H = A+ B/µ + CS µ + CM µ (10)
In Table 4 the individual terms of the van Deemter equation are explained in more detail: the
plate height is described by the constants A as a measurement for the Eddy diffusion, which
describes the distance a flowing stream that moves before its velocity is changed by the
packing; the B term describes the influence of the longitudinal diffusion, which is created by
the diffusion of the particles away from the peak centre towards or against the direction of the
flow of the mobile phase. The mass transfer term in the mobile phase, CM µ, represents the
convective component of flow dispersion. This mass transfer term is inversely proportional to
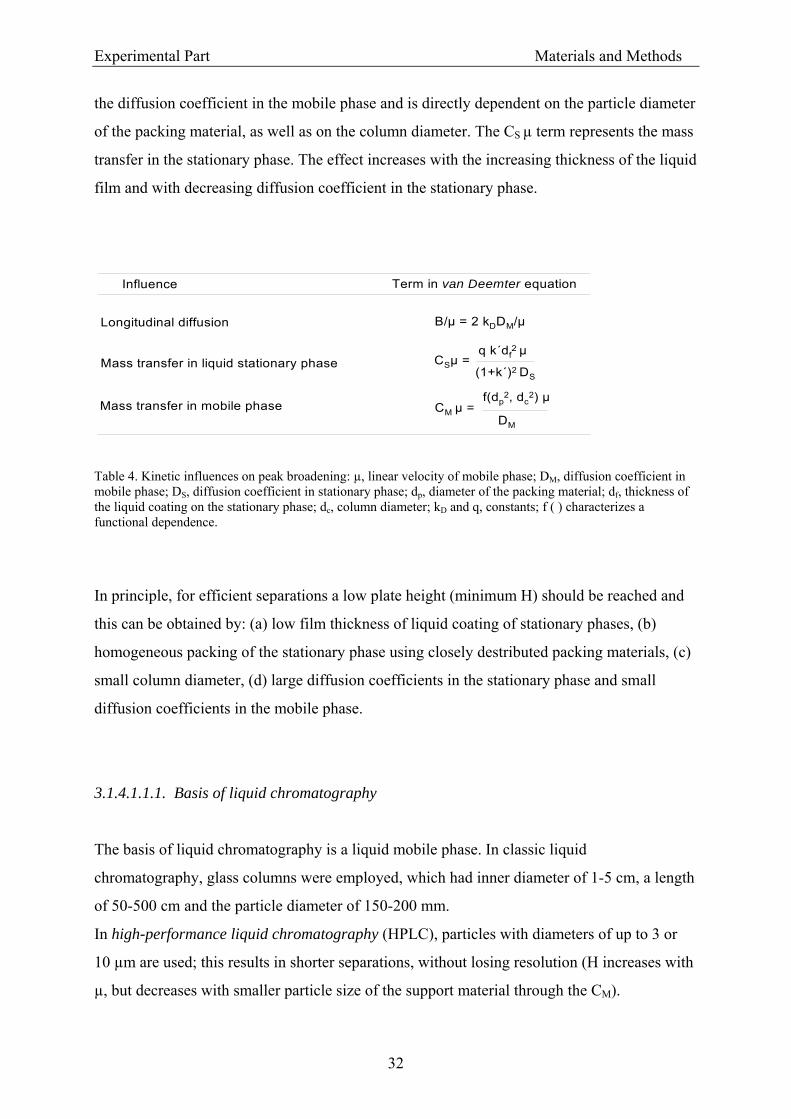
Experimental Part Materials and Methods
32
the diffusion coefficient in the mobile phase and is directly dependent on the particle diameter
of the packing material, as well as on the column diameter. The CS µ term represents the mass
transfer in the stationary phase. The effect increases with the increasing thickness of the liquid
film and with decreasing diffusion coefficient in the stationary phase.
Table 4. Kinetic influences on peak broadening: µ, linear velocity of mobile phase; DM, diffusion coefficient in mobile phase; DS, diffusion coefficient in stationary phase; dp, diameter of the packing material; df, thickness of the liquid coating on the stationary phase; dc, column diameter; kD and q, constants; f ( ) characterizes a functional dependence.
In principle, for efficient separations a low plate height (minimum H) should be reached and
this can be obtained by: (a) low film thickness of liquid coating of stationary phases, (b)
homogeneous packing of the stationary phase using closely destributed packing materials, (c)
small column diameter, (d) large diffusion coefficients in the stationary phase and small
diffusion coefficients in the mobile phase.
3.1.4.1.1.1. Basis of liquid chromatography
The basis of liquid chromatography is a liquid mobile phase. In classic liquid
chromatography, glass columns were employed, which had inner diameter of 1-5 cm, a length
of 50-500 cm and the particle diameter of 150-200 mm.
In high-performance liquid chromatography (HPLC), particles with diameters of up to 3 or
10 µm are used; this results in shorter separations, without losing resolution (H increases with
µ, but decreases with smaller particle size of the support material through the CM).
Influence Term in van Deemter equation
Longitudinal diffusion
Mass transfer in liquid stationary phase
Mass transfer in mobile phase
B/µ = 2 kDDM/µ
q k´df2 µ
(1+k´)2 DS
CSµ =
CM µ =f(dp
2, dc2) µ
DM
Experimental Part Materials and Methods
33
Separations using a liquid mobile can be based on four different principles: adsorption, in the
form of liquid-solid chromatography; ion exchange, to be understood as the transfer of classic
ion exchange in the batch process to column chromatography; the exclusion principle is based
on the molecular sieve effect. The principle of partition is currently one of the most
frequently used analysis methods and is the methodology used in this work, and thus will be
explained in more detail: liquid immobilized on a carrier, which can be silica gel or alumina,
can act as stationary phase. The liquid is adhered to the carrier by physical adsorption.
Chromatography in which a polar stationary phase and a less polar or non-polar mobile phase
is used, is termed normal-phase chromatography. In contrast, when the stationary phase is
relatively non-polar and a polar mobile phase is used, is termed reversed-phase
chromatography.
Reversed phases
Silica gel is used as a uniform, porous, mechanically sturdy material in particles sizes of 3, 5
or 10 µm. The surface of fully hydrolysed silica gel consists of silanol-(hydroxyl-) groups,
which can react with siloxanes (Si-O-Si groups). The alkyl group most frequently used is C18
(n-octadecyl); these long chains are aligned in parallel and perpendicular to the particle
surface. They form a brush-like surface, and the longer the alkyl chain is, the longer the
retention times are.
3.1.4.1.1.2. Instrumentation in liquid chromatography
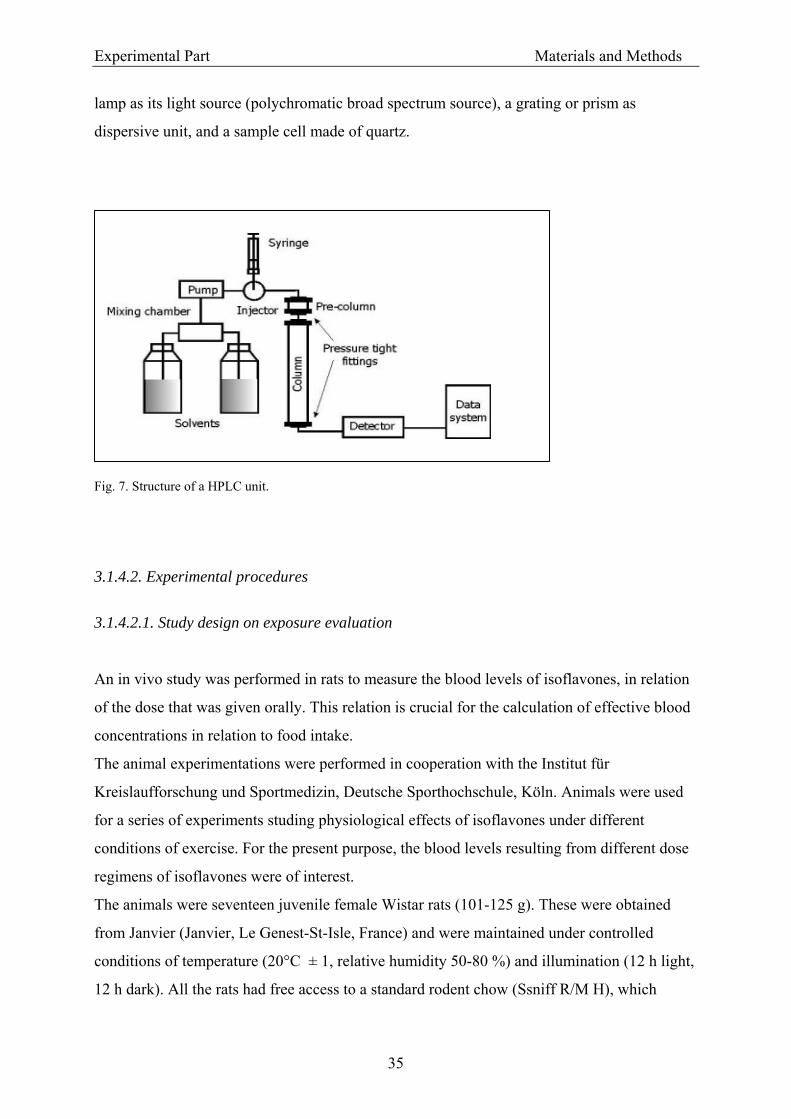
The components of a HPLC unit, which are shown in Fig. 7, are:
• Reservoir for the solvents in the mobile phase
• Pump system
• Syringe or an injection system to feed the sample
• Separation column, preceded by a precolumn
• Detector
The solvents used as mobile phase are stored in a resevoir in glass bottles. Dissolved gases,
which can lead to the formation of bubbles and might interference in the detector, are
Experimental Part Materials and Methods
34
removed by sucking through a degasser, installed before the pumps. Also, a millipore filter is
used to remove suspended matter in the inlet pipe.
A distinction is made between isocratic and gradient elution. In the former method, one works
with a single solvent of constant composition; in gradient elution, better separation is
achieved, because the composition of the eluents is constantly altered according to a particular
programme.
The pumping system for HPLC generates high pressures, this is obtained using sapphire
valves; the system must have only slight residual pulsation, chemical resistence and good
control of the flow. Reciprocating pumps are preponderant today and were employed for this
study. They operate as double piston pumps, which work with a phase shift of 180° to
suppress pulsation.
Gradients can be produced on the low or high pressure side. If the two solvents are mixed on
the suction side of the pump, one refers to a low pressure gradient, the overall flow rate is
controlled by a single pump. To produce a high pressure gradient two pumps are required and
the solvent constituents are mixed on the pressure side of the pumps; in this work this form
was employed.
The sample injection system must allow volumes of 50-500 µl to be introduced and pressure
must be kept within the system. A sample loop is suitable for sample introduction. Using a
microlitre syringe, the sample solution is fed in through a needle inlet into the loop of a six-
way valve.
A standard separation column initially used was 250 mm long, with an inner diameter of 4.6
mm, and was filled with 5 or 10 µm particles. A number of theoretical plates of approximately
50,000 per metre can be obtained. The columns are integrated into the system in the form of
cartridges. The connections to the stainless steel tubes are fittings (conical metal sealing
rings).
In order to reduce the volume of solvents, a smaller column with inner diameter of 1mm and
150 mm long was employed in this work. A number of theoretical plates up to 100,000 per
metre can be attained using 3 µm particles (microbore HPLC).
Short precolumns are employed to protect the separation column (4.5 mm inner diameter x 30
mm length).
For detection, a UV detector is most frequently used and was also employed for the detection
of isoflavones in this study at 260 nm, the absorption maximum of the analytes according to
Franke et al. (1995). The single wavelength UV detector employed here uses a deuterium
Experimental Part Materials and Methods
35
lamp as its light source (polychromatic broad spectrum source), a grating or prism as
dispersive unit, and a sample cell made of quartz.
Fig. 7. Structure of a HPLC unit. 3.1.4.2. Experimental procedures
3.1.4.2.1. Study design on exposure evaluation
An in vivo study was performed in rats to measure the blood levels of isoflavones, in relation
of the dose that was given orally. This relation is crucial for the calculation of effective blood
concentrations in relation to food intake.
The animal experimentations were performed in cooperation with the Institut für
Kreislaufforschung und Sportmedizin, Deutsche Sporthochschule, Köln. Animals were used
for a series of experiments studing physiological effects of isoflavones under different
conditions of exercise. For the present purpose, the blood levels resulting from different dose
regimens of isoflavones were of interest.
The animals were seventeen juvenile female Wistar rats (101-125 g). These were obtained
from Janvier (Janvier, Le Genest-St-Isle, France) and were maintained under controlled
conditions of temperature (20°C ± 1, relative humidity 50-80 %) and illumination (12 h light,
12 h dark). All the rats had free access to a standard rodent chow (Ssniff R/M H), which
Experimental Part Materials and Methods
36
contained an expected total isoflavone concentration of ~ 400 µg/g (according to Degen et al.,
2002a) and to drinking water.
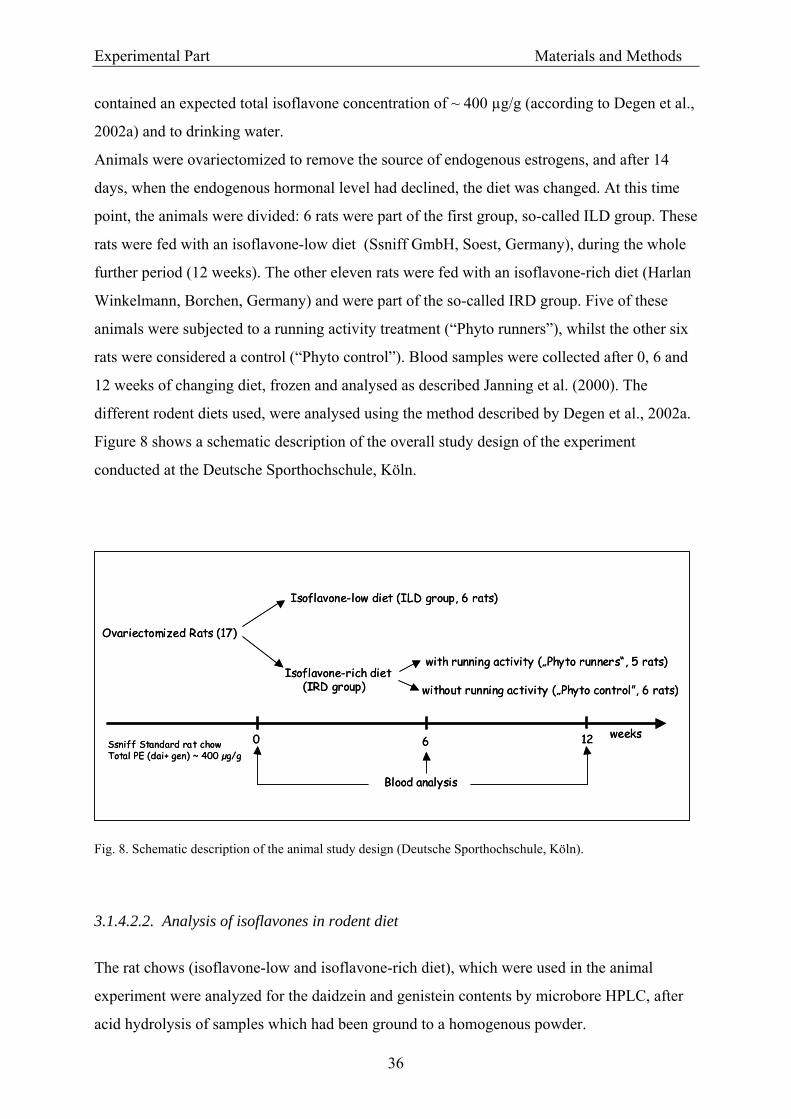
Animals were ovariectomized to remove the source of endogenous estrogens, and after 14
days, when the endogenous hormonal level had declined, the diet was changed. At this time
point, the animals were divided: 6 rats were part of the first group, so-called ILD group. These
rats were fed with an isoflavone-low diet (Ssniff GmbH, Soest, Germany), during the whole
further period (12 weeks). The other eleven rats were fed with an isoflavone-rich diet (Harlan
Winkelmann, Borchen, Germany) and were part of the so-called IRD group. Five of these
animals were subjected to a running activity treatment (“Phyto runners”), whilst the other six
rats were considered a control (“Phyto control”). Blood samples were collected after 0, 6 and
12 weeks of changing diet, frozen and analysed as described Janning et al. (2000). The
different rodent diets used, were analysed using the method described by Degen et al., 2002a.
Figure 8 shows a schematic description of the overall study design of the experiment
conducted at the Deutsche Sporthochschule, Köln.
Fig. 8. Schematic description of the animal study design (Deutsche Sporthochschule, Köln). 3.1.4.2.2. Analysis of isoflavones in rodent diet
The rat chows (isoflavone-low and isoflavone-rich diet), which were used in the animal
experiment were analyzed for the daidzein and genistein contents by microbore HPLC, after
acid hydrolysis of samples which had been ground to a homogenous powder.
Ovariectomized Rats (17)
Isoflavone-low diet (ILD group, 6 rats)
Isoflavone-rich diet(IRD group)
Ssniff Standard rat chowTotal PE (dai+ gen) ~ 400 µg/g
0 6 12 weeks
with running activity („Phyto runners“, 5 rats)
without running activity („Phyto control”, 6 rats)
Blood analysis
Ovariectomized Rats (17)
Isoflavone-low diet (ILD group, 6 rats)
Isoflavone-rich diet(IRD group)
Ssniff Standard rat chowTotal PE (dai+ gen) ~ 400 µg/g
0 6 12 weeks
with running activity („Phyto runners“, 5 rats)
without running activity („Phyto control”, 6 rats)
Blood analysis
Experimental Part Materials and Methods
37
The basic procedure followed the method of Franke et al. (1994, 1995). Briefly, 1 g of the
powdered dry material was dispersed in a mixture of 10 ml of 10 M HCl and 40 ml of 96%
ethanol. Biochanin A was used as internal standard, 50 µl (stock solution of 0.5 mg/ml in
ethanol). The mixture was sonicated for 10 minutes, followed by refluxing at 80° C for 3 h
and cooling to room temperature. About 4 ml of this mixture was centrifuged at 4300 rpm for
at least 10 minutes. Aliquots (100 µl) of the supernatant were diluted with 900 µl of water
containing 10% methanol in 1% acetic acid, and 10 µl of this dilution were injected into the
microbore HPLC system (described below).
Separation and quantification of the isoflavones followed procedures of Degen (1990) and
Franke et al. (1998), with modifications for the microbore-HPLC system: a time gradient was
used mixing eluent B (10:5:1 v/v/v of methanol/acetonitril/dichloromethane) and eluent A
(90:10 v/v of 10% aqueous acetic acid /eluent B): 0-5 minutes 15% B in A; 5-16 min 15-30%
B in A; 16-35 min 30-100 % B in A for separation of the analytes, and a re-equilibration
phase at 35-36 min 100-15% B in A; 36-45 min 15% B in A; the gradient was delivered at a
flow rate of 40 µl/min (the eluent flow from the pumps of 260 µl/min was reduced by means
of a splitter). The effluent was monitored continuously at 260 nm (UV detection). The limit of
detection was 10 µg isoflavone/g chow (the same as described by Degen et al., 2002a).
3.1.4.2.3. Analysis of isoflavones in rat plasma
The HPLC analysis was based on the method of Franke et al. (1998). Plasma samples from
rats were thawed and subjected to conjugate hydrolysis according to Gamache and Acwoth
(1998): aliquots of 100 µl plasma were mixed with 100 µl of “hydrolysis buffer” (0.1 M
sodium acetate pH 5 with 0.1% (w/v) ascorbic acid and 0.01% (w/v) EDTA), 10 µl of internal
standard (formononetin; stock solution of 50 µg/ml in methanol), 8 µl glucuronidase solution
and 4 µl sulfatase solution and were allowed to hydrolyse (glucuronide and sulfate
metabolites) while shaking (Thermomixer) at 37 °C overnight. Then, 119.7 µl water, 75 µl
ammonium acetate buffer (1 M, pH 7), and 83.3 µl triethylammonium sulfate buffer (3 M, pH
7) were added, and the samples were heated at 60 °C (Thermomixer) for 10 minutes to
facilitate dissociation of isoflavones from plasma proteins. The deproteinized samples were
afterwards extracted by solid-phase at room temperature using LiChrolut® RP18 tubes, which
were first washed with 7.5 ml methanol for 30 min, 5 ml water and 5 ml ammonium acetate
Experimental Part Materials and Methods
38
buffer (10mM, pH 5). After the plasma samples had passed over the tubes, these were rinsed
with 5 ml ammonium acetate buffer (10mM, pH 5) and 5 ml water. The absorbed isoflavones
were eluted with 1.5 ml methanol. The eluates were evaporated to dryness under a gentle
stream of nitrogen at 45 °C, dissolved in 100 µl of (40:60 v/v) methanol/aqueous acetic acid
(1%), and stored at –20 °C until HPLC analysis. Separation and quantitation was carried out
on a microbore HPLC system. Samples were chromatographed with a gradient mixed from
eluent B (10:5:1 v/v/v of methanol/acetonitril/dichloromethane) and eluent A (90:10 v/v of
10% aqueous acetic acid /eluent B): 0-5 minutes 25% B in A; 5-25 min 25-50% B in A; 25-40
min 50-100 % B in A and 40-41 min 100-25% B in A; 41-50 min 25% B in A; the gradient
was delivered at a flow rate of 260 µl/min (from the pumps), and after split at 40 µl/min (to
the column). The effluent was monitored continuously at 260 nm (UV detection). The limit of
detection was 20 ng isoflavone/ml plasma (Janning et al., 2000).
3.1.4.2.4. Instrumentation
For the analysis of daidzein and genistein in rat chow and in rat plasma, microbore HPLC
analysis was used on a gradient system (pumps: LC10 AD, Shimadzu), equipped with a SCL-
10 A VP system controller (Shimadzu, Diusburg, Germany), a LCP flowsplitter (LC
Packings, Amsterdam, the Netherlands), and a SPD-10 AV VP spectrophotometrical UV
detector (Shimadzu, Duisburg, Germany) with a micro flow cell (LC-Packings, Amsterdam,
the Netherlands). Data processing was carried out using Class VP 4.2 chromatography data
system (Shimadzu, Duisburg, Germany). Samples were chromatographed on a reverse-phase
analytical column (150 x 1 mm, with Luna 3 µm C18(2)), and a precolumn (30 x 1 mm, same
reverse-phase material) both from Phenomex (Aschaffenburg, Germany).
3.1.4.2.5. Peak identification
HPLC peaks were identified by comparison of the retention times of standard mixtures with
those of samples. Some samples were spiked with standards solutions of isoflavones to see
whether the retention times change by matrix influences. Both matrixes (plasma and rodent
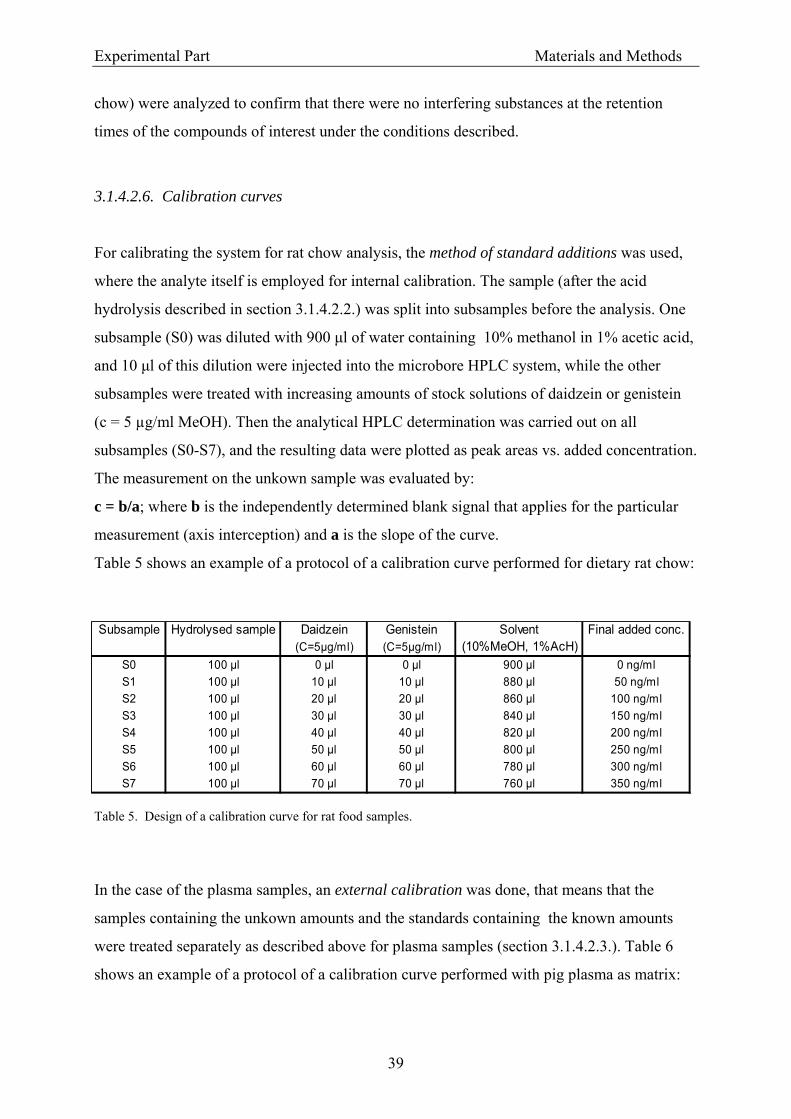
Experimental Part Materials and Methods
39
chow) were analyzed to confirm that there were no interfering substances at the retention
times of the compounds of interest under the conditions described.
3.1.4.2.6. Calibration curves
For calibrating the system for rat chow analysis, the method of standard additions was used,
where the analyte itself is employed for internal calibration. The sample (after the acid
hydrolysis described in section 3.1.4.2.2.) was split into subsamples before the analysis. One
subsample (S0) was diluted with 900 µl of water containing 10% methanol in 1% acetic acid,
and 10 µl of this dilution were injected into the microbore HPLC system, while the other
subsamples were treated with increasing amounts of stock solutions of daidzein or genistein
(c = 5 µg/ml MeOH). Then the analytical HPLC determination was carried out on all
subsamples (S0-S7), and the resulting data were plotted as peak areas vs. added concentration.
The measurement on the unkown sample was evaluated by:
c = b/a; where b is the independently determined blank signal that applies for the particular
measurement (axis interception) and a is the slope of the curve.
Table 5 shows an example of a protocol of a calibration curve performed for dietary rat chow:
´ Table 5. Design of a calibration curve for rat food samples.
In the case of the plasma samples, an external calibration was done, that means that the
samples containing the unkown amounts and the standards containing the known amounts
were treated separately as described above for plasma samples (section 3.1.4.2.3.). Table 6
shows an example of a protocol of a calibration curve performed with pig plasma as matrix:
Subsample Hydrolysed sample Daidzein Genistein Solvent Final added conc.(C=5µg/ml) (C=5µg/ml) (10%MeOH, 1%AcH)
S0 100 µl 0 µl 0 µl 900 µl 0 ng/mlS1 100 µl 10 µl 10 µl 880 µl 50 ng/mlS2 100 µl 20 µl 20 µl 860 µl 100 ng/mlS3 100 µl 30 µl 30 µl 840 µl 150 ng/mlS4 100 µl 40 µl 40 µl 820 µl 200 ng/mlS5 100 µl 50 µl 50 µl 800 µl 250 ng/mlS6 100 µl 60 µl 60 µl 780 µl 300 ng/mlS7 100 µl 70 µl 70 µl 760 µl 350 ng/ml
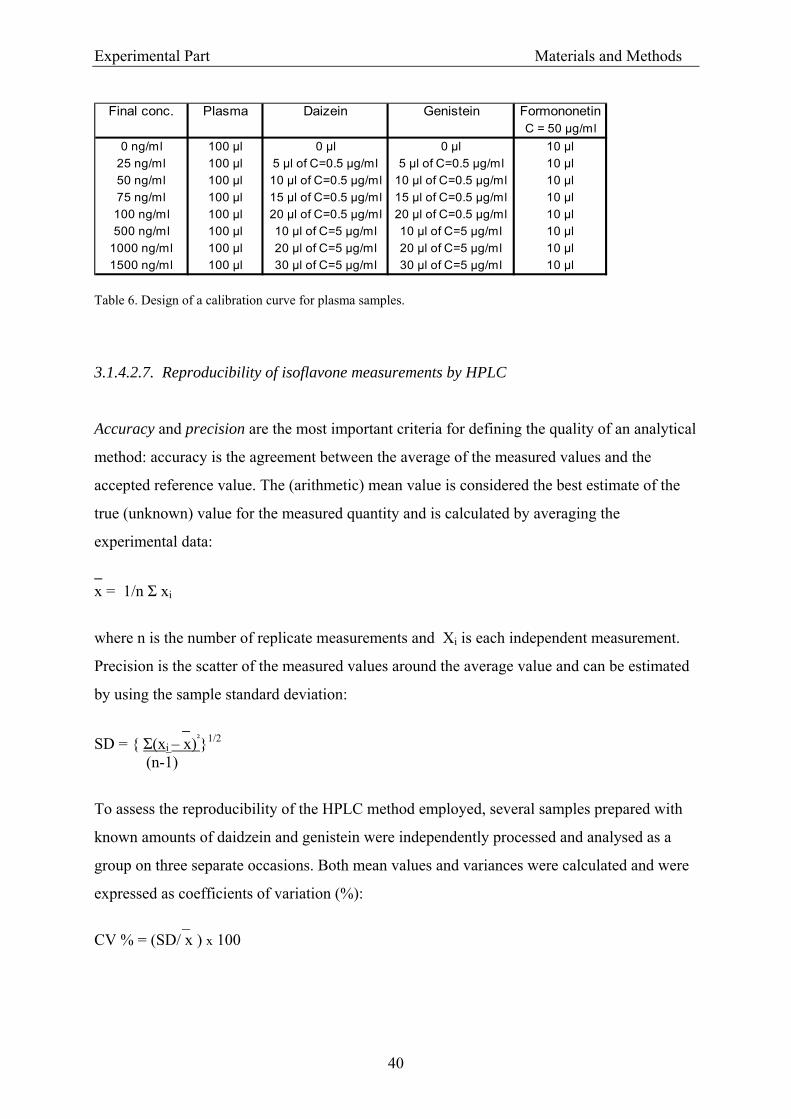
Experimental Part Materials and Methods
40
Table 6. Design of a calibration curve for plasma samples. 3.1.4.2.7. Reproducibility of isoflavone measurements by HPLC
Accuracy and precision are the most important criteria for defining the quality of an analytical
method: accuracy is the agreement between the average of the measured values and the
accepted reference value. The (arithmetic) mean value is considered the best estimate of the
true (unknown) value for the measured quantity and is calculated by averaging the
experimental data:
_ x = 1/n Σ xi
where n is the number of replicate measurements and Xi is each independent measurement.
Precision is the scatter of the measured values around the average value and can be estimated
by using the sample standard deviation:
_ SD = { Σ(xi – x)²}1/2
(n-1)
To assess the reproducibility of the HPLC method employed, several samples prepared with
known amounts of daidzein and genistein were independently processed and analysed as a
group on three separate occasions. Both mean values and variances were calculated and were
expressed as coefficients of variation (%):
_ CV % = (SD/ x ) x 100
Final conc. Plasma Daizein Genistein FormononetinC = 50 µg/ml
0 ng/ml 100 µl 0 µl 0 µl 10 µl25 ng/ml 100 µl 5 µl of C=0.5 µg/ml 5 µl of C=0.5 µg/ml 10 µl50 ng/ml 100 µl 10 µl of C=0.5 µg/ml 10 µl of C=0.5 µg/ml 10 µl75 ng/ml 100 µl 15 µl of C=0.5 µg/ml 15 µl of C=0.5 µg/ml 10 µl100 ng/ml 100 µl 20 µl of C=0.5 µg/ml 20 µl of C=0.5 µg/ml 10 µl500 ng/ml 100 µl 10 µl of C=5 µg/ml 10 µl of C=5 µg/ml 10 µl
1000 ng/ml 100 µl 20 µl of C=5 µg/ml 20 µl of C=5 µg/ml 10 µl1500 ng/ml 100 µl 30 µl of C=5 µg/ml 30 µl of C=5 µg/ml 10 µl
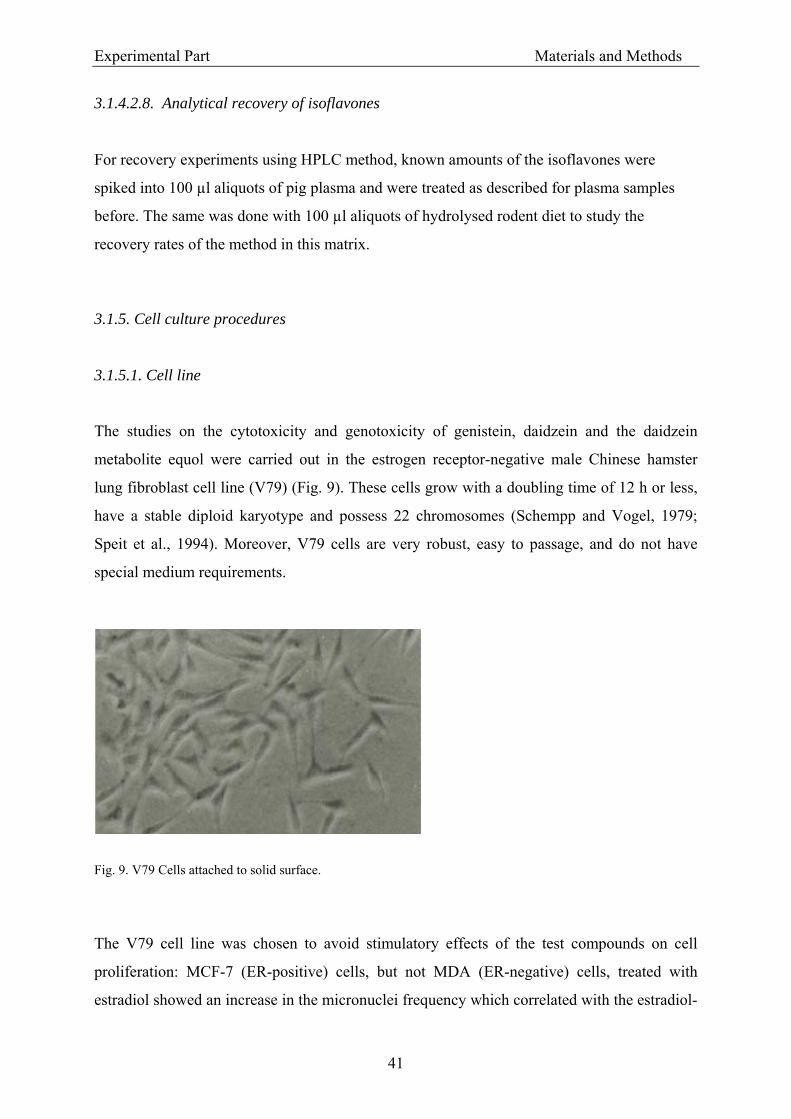
Experimental Part Materials and Methods
41
3.1.4.2.8. Analytical recovery of isoflavones
For recovery experiments using HPLC method, known amounts of the isoflavones were
spiked into 100 µl aliquots of pig plasma and were treated as described for plasma samples
before. The same was done with 100 µl aliquots of hydrolysed rodent diet to study the
recovery rates of the method in this matrix.
3.1.5. Cell culture procedures
3.1.5.1. Cell line
The studies on the cytotoxicity and genotoxicity of genistein, daidzein and the daidzein
metabolite equol were carried out in the estrogen receptor-negative male Chinese hamster
lung fibroblast cell line (V79) (Fig. 9). These cells grow with a doubling time of 12 h or less,
have a stable diploid karyotype and possess 22 chromosomes (Schempp and Vogel, 1979;
Speit et al., 1994). Moreover, V79 cells are very robust, easy to passage, and do not have
special medium requirements.
Fig. 9. V79 Cells attached to solid surface.
The V79 cell line was chosen to avoid stimulatory effects of the test compounds on cell
proliferation: MCF-7 (ER-positive) cells, but not MDA (ER-negative) cells, treated with
estradiol showed an increase in the micronuclei frequency which correlated with the estradiol-
Experimental Part Materials and Methods
42
induced cell proliferation (Fischer et al., 2001). Genistein and daidzein are known to stimulate
the growth of ER-positive cells in concentration ranges between 0.01 and 10 µM and inhibit
growth at higher (>10 µM) concentrations (see section 2.5.1). Thus, with the reported
(biphasic) effects on cell growth, an assessment on the genotoxicity of phytoestrogens may be
complex.
3.1.5.1.1. Handling of V79 cells
Continous cultures are comprised of a single cell type that can be serially propagated in
culture for a limited number of cell divisions (approximately 30).
The cultivation of V79 cells was carried out in Dulbecco´s modified Eagle´s medium
(DMEM) supplemented with 10% fetal calf serum (FCS). This cell culture medium contains
3.7 g/l NaHCO₃, 1 g/l D-glucose as well as L-glutamine. This composition allows an optimal
cell proliferation. The fetal calf serum contributes with amino acids, inorganic salts, albumin,
and growth factors. The cells were cultured in special plastic flasks in a chamber (incubator)
that provides a humidified atmosphere with 5% CO₂ in air at 37°C. The flasks allow a
continued air supply to the cells.
3.1.5.1.2. Passaging of V79 cells
Most cells will only survive and grow in culture when attached to a suitable solid surface.
Once the cells have filled the available space, the rate of cell division decreases (confluent
culture). Under conditions which are not optimal, the cells tend to peel off the surface. Thus,
it is essential to transfer the cells to fresh bottles regularly, to prevent them becoming
overcrowded. The first step in sub-culturing is to detach the cells from the surface of the
culture vessel. This is done by exposing the cells to trypsin (proteolytic enzyme), this works
best if Ca⁺² and Mg⁺² ions are removed by chelating with EDTA. Hence, the medium is
poured off, the V79 cells are then rinsed with 5 ml of trypsin-EDTA solution (0.25% trypsin,
1mM EDTA), the flask bottom must be completely covered to rinse out the medium,
otherwise the trypsinisation is not optimal. Afterwards, the cells are treated again with 5 ml
trypsin for 3-5 min until the cells are detached (this is examined using a phase contrast
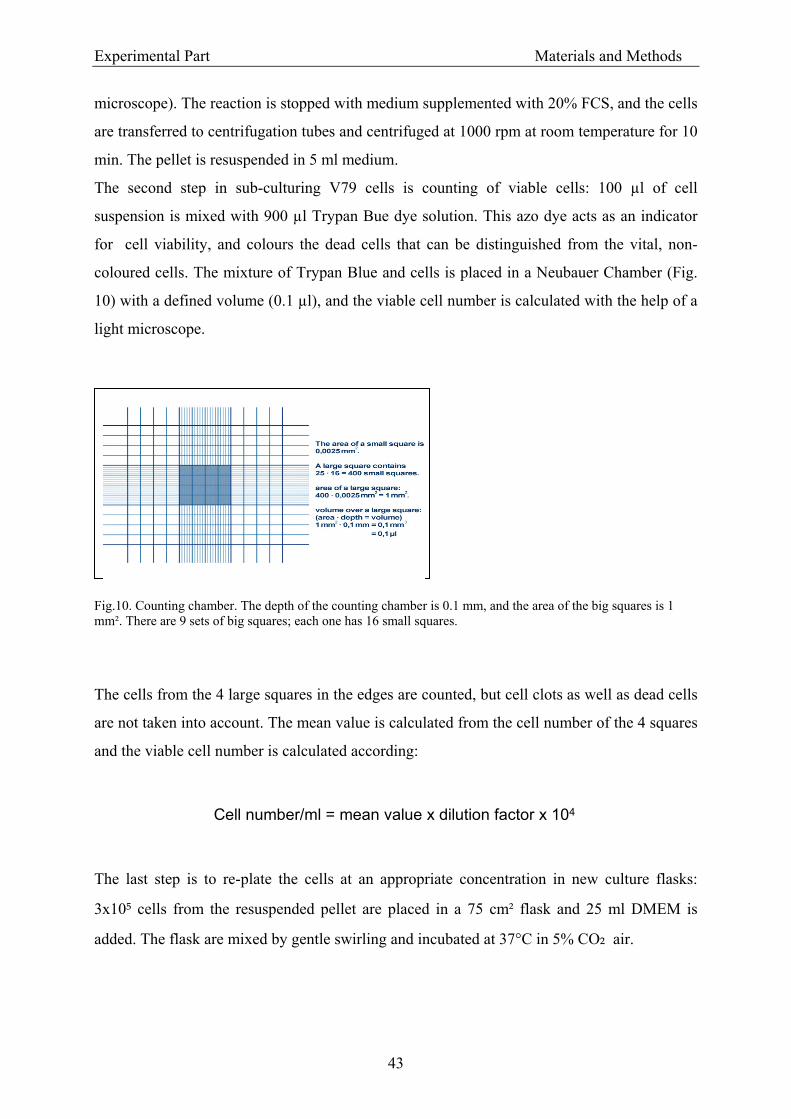
Experimental Part Materials and Methods
43
microscope). The reaction is stopped with medium supplemented with 20% FCS, and the cells
are transferred to centrifugation tubes and centrifuged at 1000 rpm at room temperature for 10
min. The pellet is resuspended in 5 ml medium.
The second step in sub-culturing V79 cells is counting of viable cells: 100 µl of cell
suspension is mixed with 900 µl Trypan Bue dye solution. This azo dye acts as an indicator
for cell viability, and colours the dead cells that can be distinguished from the vital, non-
coloured cells. The mixture of Trypan Blue and cells is placed in a Neubauer Chamber (Fig.
10) with a defined volume (0.1 µl), and the viable cell number is calculated with the help of a
light microscope.
Fig.10. Counting chamber. The depth of the counting chamber is 0.1 mm, and the area of the big squares is 1 mm². There are 9 sets of big squares; each one has 16 small squares.
The cells from the 4 large squares in the edges are counted, but cell clots as well as dead cells
are not taken into account. The mean value is calculated from the cell number of the 4 squares
and the viable cell number is calculated according:
The last step is to re-plate the cells at an appropriate concentration in new culture flasks:
3x10⁵ cells from the resuspended pellet are placed in a 75 cm² flask and 25 ml DMEM is
added. The flask are mixed by gentle swirling and incubated at 37°C in 5% CO₂ air.
Cell number/ml = mean value x dilution factor x 104
Experimental Part Materials and Methods
44
3.1.5.1.3. Cryopreservation and storage of V79 cells
The aim of cryopreservation is to enable stocks of cells to be stored to prevent the need to
have the cells in culture at all times. Thus, V79 cells are frozen in sterile Eppendorf 1 ml
tubes with 10 % DMSO for 2 h at –20°C and then at –70°C.
3.1.5.2. Cytotoxicity assays
3.1.5.2.1. Principles of cytotoxicity assays
Two methods for determining the cytotoxicity of daidzein, equol and genistein on cell
cultures were used. These methods are the Neutral Red Uptake assay, based on the method of
Borenfreund and Borrero (1984) and Riddell et al. (1986) and the determination of total
cellular protein (BCA).
The Neutral Red Uptake assay can be used to measure the growth of a population of cultured
mammalian V79 cells. Viable cells take up the Neutral Red dye and transport it to a specific
cellular compartment, the lysosome. The uptake, transport, and storage of Neutral Red dye
occurs via active biological processes that require energy, as well as intact cellular and
lysosomal structures. Damage to any of the systems involved or a reduction in cell number
due to cell death would result in a decreased uptake of the Neutral Red in treated cells
(compared to untreated controls).
The BCA assay is a colorimetric assay that involves the reduction of Cu²⁺ to Cu⁺ by proteins
in an alkaline medium. The bicinchoninic acid chelates Cu⁺ ions with very high specificity, to
forms a water-soluble purple coloured complex. The macromolecular structure of proteins, the
number of peptide bonds and the presence of four amino acids (cysteine, cystine, tryptophan
and tyrosine) are responsible for the color formation in protein samples when assayed with
BCA. This reaction is measured by the high optical absorbance of the final Cu⁺ complex at
570 nm. Absorbance is directly proportional to the protein concentration, with a broad linear
range between 5-20 µg/ml to 1-2 mg/ml. The protein concentration can be calculated with a
reference curve obtained from a standard protein.
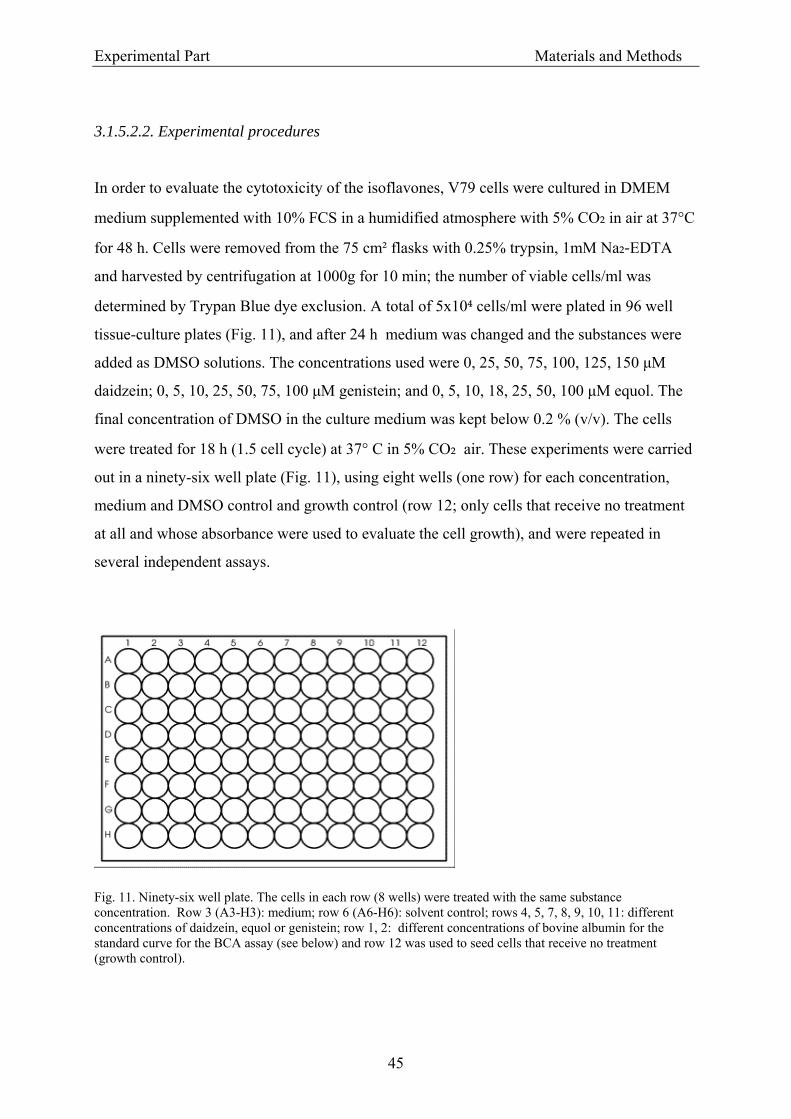
Experimental Part Materials and Methods
45
3.1.5.2.2. Experimental procedures
In order to evaluate the cytotoxicity of the isoflavones, V79 cells were cultured in DMEM
medium supplemented with 10% FCS in a humidified atmosphere with 5% CO₂ in air at 37°C
for 48 h. Cells were removed from the 75 cm² flasks with 0.25% trypsin, 1mM Na₂‐EDTA
and harvested by centrifugation at 1000g for 10 min; the number of viable cells/ml was
determined by Trypan Blue dye exclusion. A total of 5x10⁴ cells/ml were plated in 96 well
tissue-culture plates (Fig. 11), and after 24 h medium was changed and the substances were
added as DMSO solutions. The concentrations used were 0, 25, 50, 75, 100, 125, 150 µM
daidzein; 0, 5, 10, 25, 50, 75, 100 µM genistein; and 0, 5, 10, 18, 25, 50, 100 µM equol. The
final concentration of DMSO in the culture medium was kept below 0.2 % (v/v). The cells
were treated for 18 h (1.5 cell cycle) at 37° C in 5% CO₂ air. These experiments were carried
out in a ninety-six well plate (Fig. 11), using eight wells (one row) for each concentration,
medium and DMSO control and growth control (row 12; only cells that receive no treatment
at all and whose absorbance were used to evaluate the cell growth), and were repeated in
several independent assays.
Fig. 11. Ninety-six well plate. The cells in each row (8 wells) were treated with the same substance concentration. Row 3 (A3-H3): medium; row 6 (A6-H6): solvent control; rows 4, 5, 7, 8, 9, 10, 11: different concentrations of daidzein, equol or genistein; row 1, 2: different concentrations of bovine albumin for the standard curve for the BCA assay (see below) and row 12 was used to seed cells that receive no treatment (growth control).
Experimental Part Materials and Methods
46
For the Neutral Red Uptake Assay a 0.4 % aqueous stock solution of Neutral Red (NR) was
prepared and added to DMEM medium to obtain a final concentration of 0.05 mg/ml
(designated NR medium). This solution was pre-incubated overnight at 37°C and then
filtrated using a 0.22 µm filter Unit Millex-GP to remove precipitated crystals. The NR
medium was added to the treated cells. After 3 h, neutral red solution was discarded, the cells
were rinsed five times with warm (37° C) phosphate-buffered saline (PBS; pH = 7.4) to
remove the excess non-incorporated dye and 200 µl of destain solution (50% ethanol, 1%
acetic acid) were added to each well to fix the cells and remove the NR into solution. The
plates were shaken for 20 min, and the absorbance of the solution in each well was measured
in a 96-well plate spectrophotometer at 540 nm, against wells with untreated cells (Tecan
software).
The BCA assay was performed on the same cells that were rinsed five times with warm
(37°C) PBS, and a cell protein “extraction” was carried out with a solution of 0.1% Triton.
The plates were kept at -70° C for 30 min. Then the plates were thawed, and the lysis of the
cells was checked with the help of a light microscope.
The BCA reagent was prepared with cupric sulfate and bicinchoninic acid (1:50) (BCA:
protein quantitation kit Uptima), and 200 µl per well was added to the cells. They were
incubated for 30 min at 37° C. The absorbance was measured at 570 nm.
For the standard curve, different known concentrations of bovine serum albumin were used:
2.0, 1.0, 0.8, 0.6, 0.4 and 0.2 mg/ml; each concentration was added in two wells in rows 1 and
2 (where no cells were seeded). These standard solutions were also mixed with the BCA
reagent. The Tecan software compares the absorbances of the albumin with the cell protein
solutions.
The following is a schematic description of the procedures conducted for both cytotoxicity
assays:
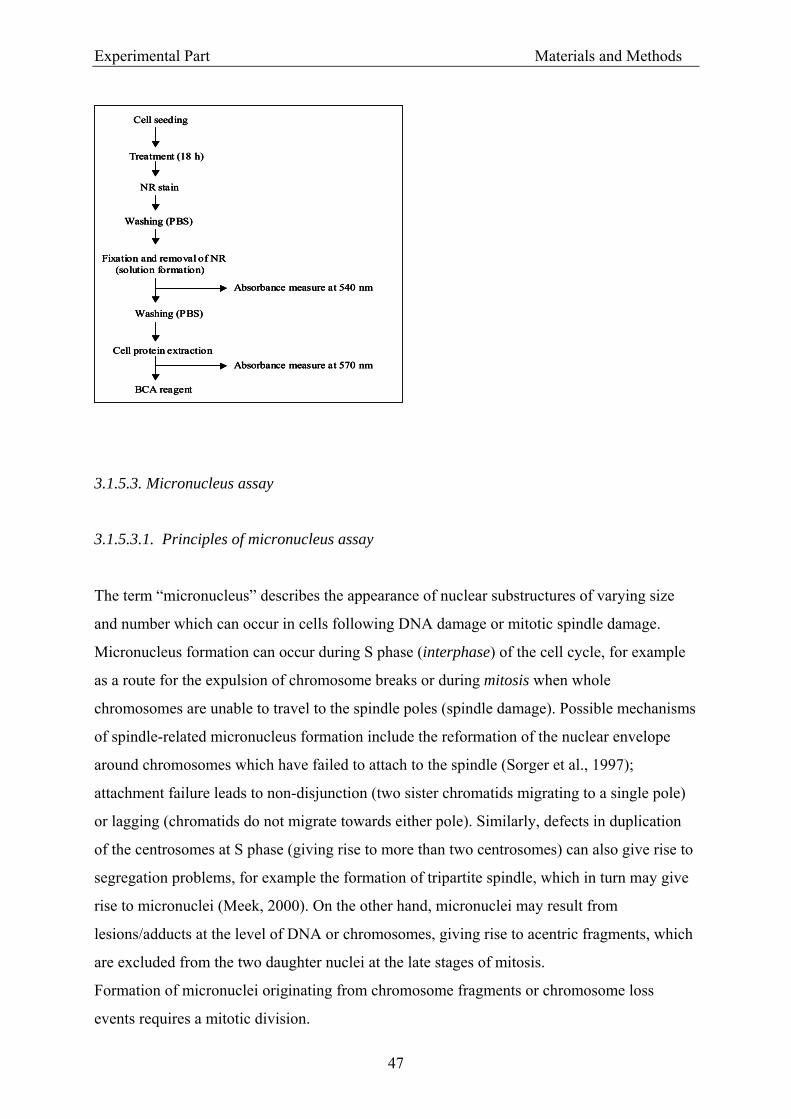
Experimental Part Materials and Methods
47
3.1.5.3. Micronucleus assay
3.1.5.3.1. Principles of micronucleus assay
The term “micronucleus” describes the appearance of nuclear substructures of varying size
and number which can occur in cells following DNA damage or mitotic spindle damage.
Micronucleus formation can occur during S phase (interphase) of the cell cycle, for example
as a route for the expulsion of chromosome breaks or during mitosis when whole
chromosomes are unable to travel to the spindle poles (spindle damage). Possible mechanisms
of spindle-related micronucleus formation include the reformation of the nuclear envelope
around chromosomes which have failed to attach to the spindle (Sorger et al., 1997);
attachment failure leads to non-disjunction (two sister chromatids migrating to a single pole)
or lagging (chromatids do not migrate towards either pole). Similarly, defects in duplication
of the centrosomes at S phase (giving rise to more than two centrosomes) can also give rise to
segregation problems, for example the formation of tripartite spindle, which in turn may give
rise to micronuclei (Meek, 2000). On the other hand, micronuclei may result from
lesions/adducts at the level of DNA or chromosomes, giving rise to acentric fragments, which
are excluded from the two daughter nuclei at the late stages of mitosis.
Formation of micronuclei originating from chromosome fragments or chromosome loss
events requires a mitotic division.
Cell seeding
Treatment (18 h)
NR stain
Washing (PBS)
Fixation and removal of NR(solution formation)
Absorbance measure at 540 nm
Cell protein extraction
BCA reagent
Absorbance measure at 570 nm
Washing (PBS)
Cell seeding
Treatment (18 h)
NR stain
Washing (PBS)
Fixation and removal of NR(solution formation)
Absorbance measure at 540 nm
Cell protein extraction
BCA reagent
Absorbance measure at 570 nm
Washing (PBS)
Cell seeding
Treatment (18 h)
NR stain
Washing (PBS)
Fixation and removal of NR(solution formation)
Absorbance measure at 540 nm
Cell protein extraction
BCA reagent
Absorbance measure at 570 nm
Washing (PBS)
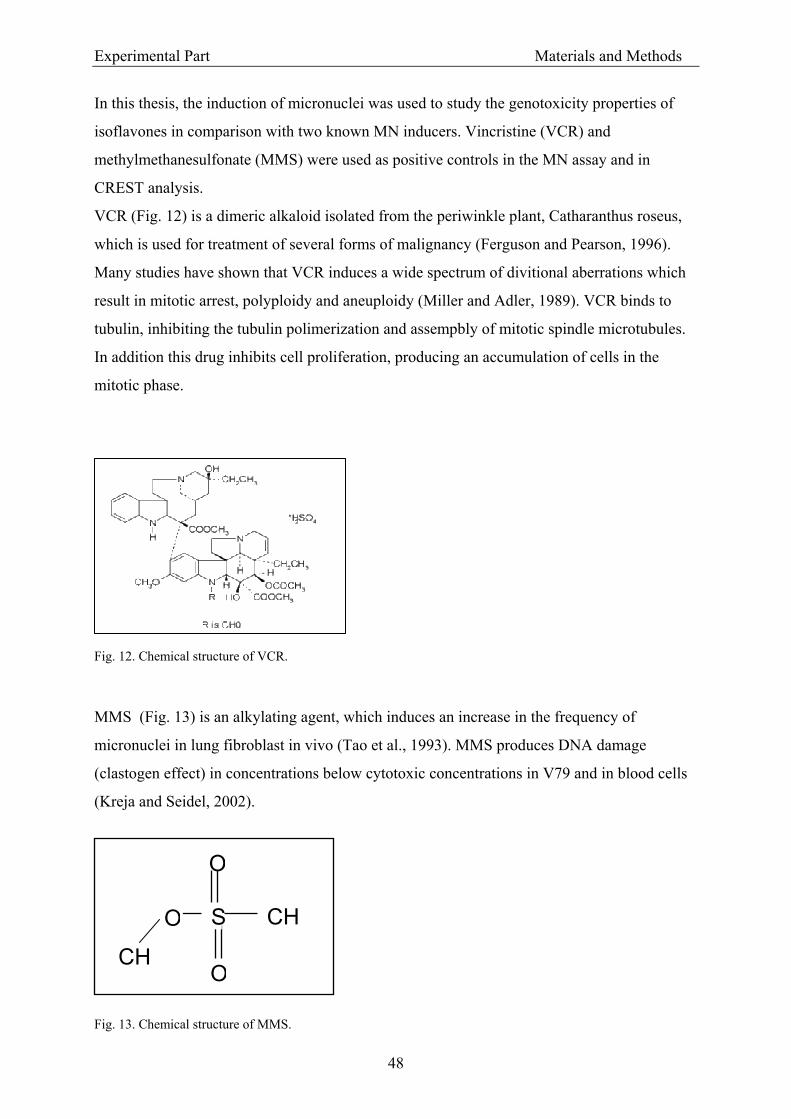
Experimental Part Materials and Methods
48
In this thesis, the induction of micronuclei was used to study the genotoxicity properties of
isoflavones in comparison with two known MN inducers. Vincristine (VCR) and
methylmethanesulfonate (MMS) were used as positive controls in the MN assay and in
CREST analysis.
VCR (Fig. 12) is a dimeric alkaloid isolated from the periwinkle plant, Catharanthus roseus,
which is used for treatment of several forms of malignancy (Ferguson and Pearson, 1996).
Many studies have shown that VCR induces a wide spectrum of divitional aberrations which
result in mitotic arrest, polyploidy and aneuploidy (Miller and Adler, 1989). VCR binds to
tubulin, inhibiting the tubulin polimerization and assempbly of mitotic spindle microtubules.
In addition this drug inhibits cell proliferation, producing an accumulation of cells in the
mitotic phase. Fig. 12. Chemical structure of VCR.
MMS (Fig. 13) is an alkylating agent, which induces an increase in the frequency of
micronuclei in lung fibroblast in vivo (Tao et al., 1993). MMS produces DNA damage
(clastogen effect) in concentrations below cytotoxic concentrations in V79 and in blood cells
(Kreja and Seidel, 2002).
Fig. 13. Chemical structure of MMS.
S
O
O
OCH
CH
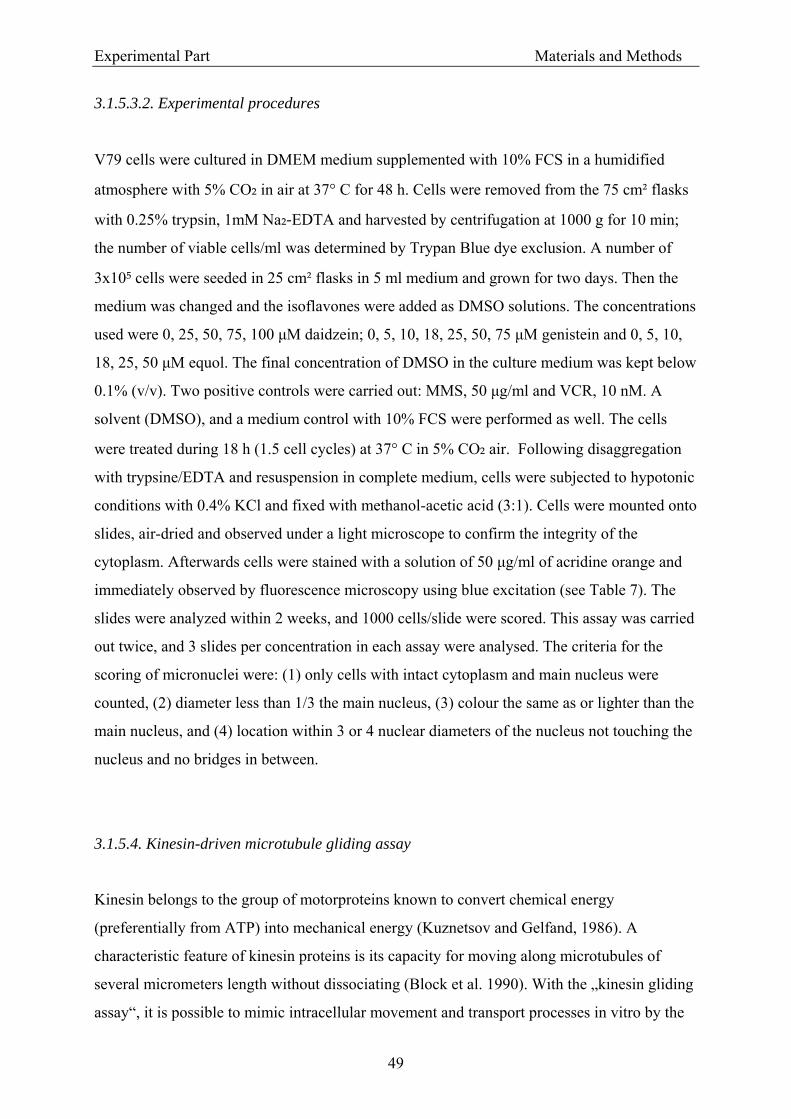
Experimental Part Materials and Methods
49
3.1.5.3.2. Experimental procedures
V79 cells were cultured in DMEM medium supplemented with 10% FCS in a humidified
atmosphere with 5% CO₂ in air at 37° C for 48 h. Cells were removed from the 75 cm² flasks
with 0.25% trypsin, 1mM Na₂‐EDTA and harvested by centrifugation at 1000 g for 10 min;
the number of viable cells/ml was determined by Trypan Blue dye exclusion. A number of
3x10⁵ cells were seeded in 25 cm² flasks in 5 ml medium and grown for two days. Then the
medium was changed and the isoflavones were added as DMSO solutions. The concentrations
used were 0, 25, 50, 75, 100 µM daidzein; 0, 5, 10, 18, 25, 50, 75 µM genistein and 0, 5, 10,
18, 25, 50 µM equol. The final concentration of DMSO in the culture medium was kept below
0.1% (v/v). Two positive controls were carried out: MMS, 50 µg/ml and VCR, 10 nM. A
solvent (DMSO), and a medium control with 10% FCS were performed as well. The cells
were treated during 18 h (1.5 cell cycles) at 37° C in 5% CO₂ air. Following disaggregation
with trypsine/EDTA and resuspension in complete medium, cells were subjected to hypotonic
conditions with 0.4% KCl and fixed with methanol-acetic acid (3:1). Cells were mounted onto
slides, air-dried and observed under a light microscope to confirm the integrity of the
cytoplasm. Afterwards cells were stained with a solution of 50 µg/ml of acridine orange and
immediately observed by fluorescence microscopy using blue excitation (see Table 7). The
slides were analyzed within 2 weeks, and 1000 cells/slide were scored. This assay was carried
out twice, and 3 slides per concentration in each assay were analysed. The criteria for the
scoring of micronuclei were: (1) only cells with intact cytoplasm and main nucleus were
counted, (2) diameter less than 1/3 the main nucleus, (3) colour the same as or lighter than the
main nucleus, and (4) location within 3 or 4 nuclear diameters of the nucleus not touching the
nucleus and no bridges in between.
3.1.5.4. Kinesin-driven microtubule gliding assay
Kinesin belongs to the group of motorproteins known to convert chemical energy
(preferentially from ATP) into mechanical energy (Kuznetsov and Gelfand, 1986). A
characteristic feature of kinesin proteins is its capacity for moving along microtubules of
several micrometers length without dissociating (Block et al. 1990). With the „kinesin gliding
assay“, it is possible to mimic intracellular movement and transport processes in vitro by the
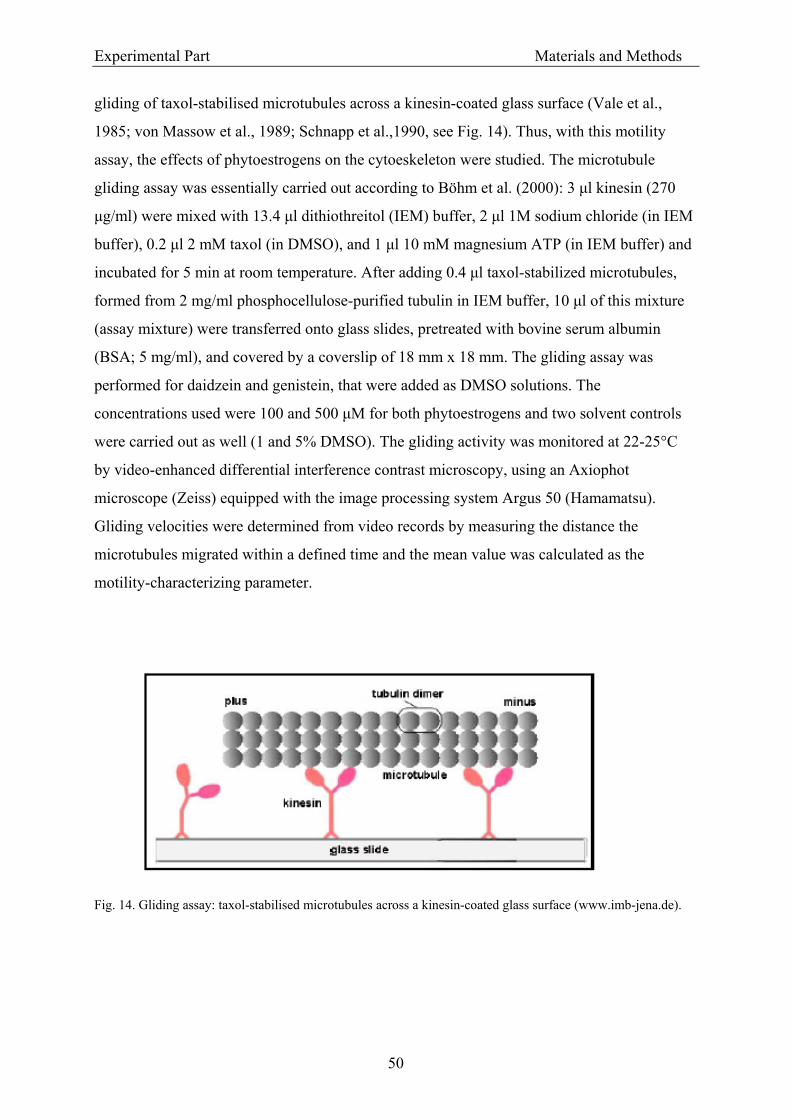
Experimental Part Materials and Methods
50
gliding of taxol-stabilised microtubules across a kinesin-coated glass surface (Vale et al.,
1985; von Massow et al., 1989; Schnapp et al.,1990, see Fig. 14). Thus, with this motility
assay, the effects of phytoestrogens on the cytoeskeleton were studied. The microtubule
gliding assay was essentially carried out according to Böhm et al. (2000): 3 µl kinesin (270
µg/ml) were mixed with 13.4 µl dithiothreitol (IEM) buffer, 2 µl 1M sodium chloride (in IEM
buffer), 0.2 µl 2 mM taxol (in DMSO), and 1 µl 10 mM magnesium ATP (in IEM buffer) and
incubated for 5 min at room temperature. After adding 0.4 µl taxol-stabilized microtubules,
formed from 2 mg/ml phosphocellulose-purified tubulin in IEM buffer, 10 µl of this mixture
(assay mixture) were transferred onto glass slides, pretreated with bovine serum albumin
(BSA; 5 mg/ml), and covered by a coverslip of 18 mm x 18 mm. The gliding assay was
performed for daidzein and genistein, that were added as DMSO solutions. The
concentrations used were 100 and 500 µM for both phytoestrogens and two solvent controls
were carried out as well (1 and 5% DMSO). The gliding activity was monitored at 22-25°C
by video-enhanced differential interference contrast microscopy, using an Axiophot
microscope (Zeiss) equipped with the image processing system Argus 50 (Hamamatsu).
Gliding velocities were determined from video records by measuring the distance the
microtubules migrated within a defined time and the mean value was calculated as the
motility-characterizing parameter.
Fig. 14. Gliding assay: taxol-stabilised microtubules across a kinesin-coated glass surface (www.imb-jena.de).
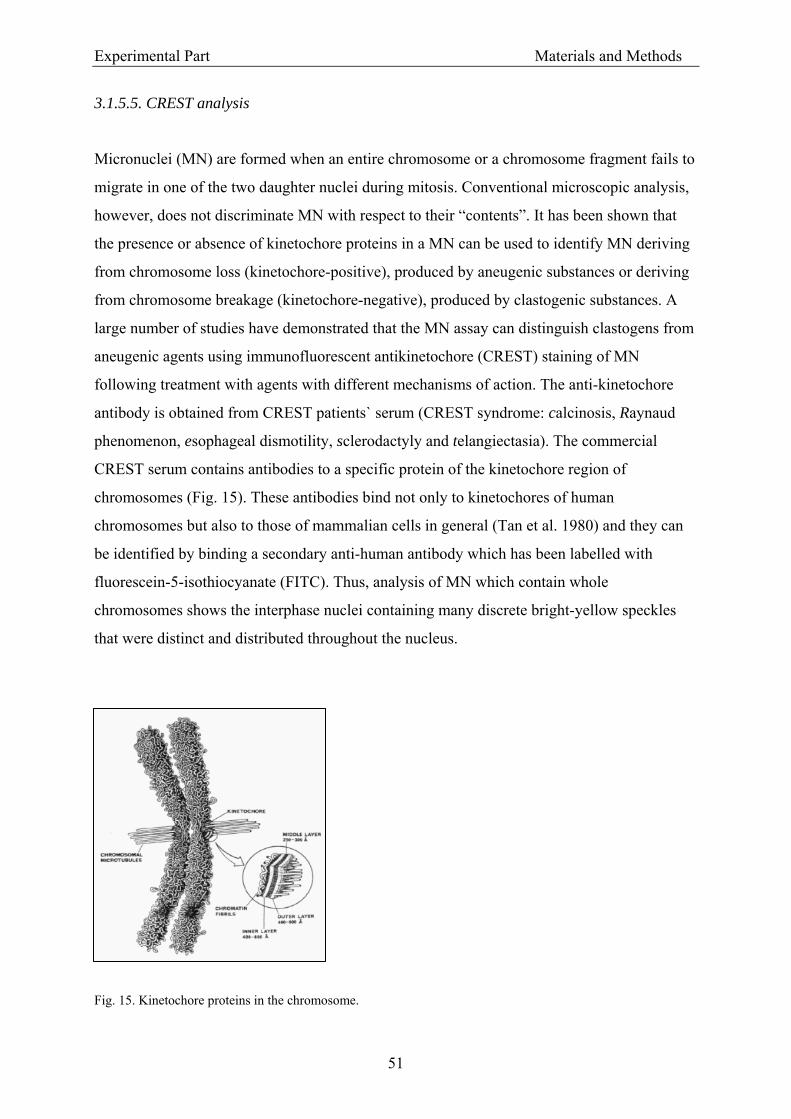
Experimental Part Materials and Methods
51
3.1.5.5. CREST analysis
Micronuclei (MN) are formed when an entire chromosome or a chromosome fragment fails to
migrate in one of the two daughter nuclei during mitosis. Conventional microscopic analysis,
however, does not discriminate MN with respect to their “contents”. It has been shown that
the presence or absence of kinetochore proteins in a MN can be used to identify MN deriving
from chromosome loss (kinetochore-positive), produced by aneugenic substances or deriving
from chromosome breakage (kinetochore-negative), produced by clastogenic substances. A
large number of studies have demonstrated that the MN assay can distinguish clastogens from
aneugenic agents using immunofluorescent antikinetochore (CREST) staining of MN
following treatment with agents with different mechanisms of action. The anti-kinetochore
antibody is obtained from CREST patients` serum (CREST syndrome: calcinosis, Raynaud
phenomenon, esophageal dismotility, sclerodactyly and telangiectasia). The commercial
CREST serum contains antibodies to a specific protein of the kinetochore region of
chromosomes (Fig. 15). These antibodies bind not only to kinetochores of human
chromosomes but also to those of mammalian cells in general (Tan et al. 1980) and they can
be identified by binding a secondary anti-human antibody which has been labelled with
fluorescein-5-isothiocyanate (FITC). Thus, analysis of MN which contain whole
chromosomes shows the interphase nuclei containing many discrete bright-yellow speckles
that were distinct and distributed throughout the nucleus.
Fig. 15. Kinetochore proteins in the chromosome.
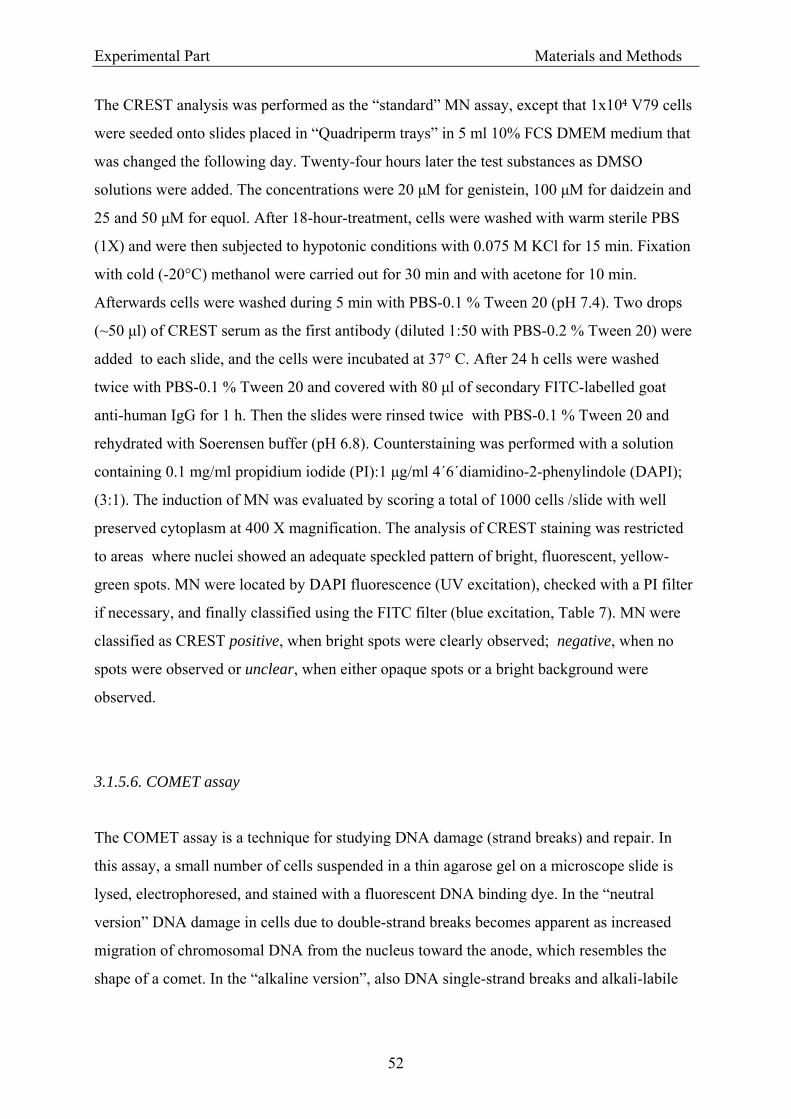
Experimental Part Materials and Methods
52
The CREST analysis was performed as the “standard” MN assay, except that 1x10⁴ V79 cells
were seeded onto slides placed in “Quadriperm trays” in 5 ml 10% FCS DMEM medium that
was changed the following day. Twenty-four hours later the test substances as DMSO
solutions were added. The concentrations were 20 µM for genistein, 100 µM for daidzein and
25 and 50 µM for equol. After 18-hour-treatment, cells were washed with warm sterile PBS
(1X) and were then subjected to hypotonic conditions with 0.075 M KCl for 15 min. Fixation
with cold (-20°C) methanol were carried out for 30 min and with acetone for 10 min.
Afterwards cells were washed during 5 min with PBS-0.1 % Tween 20 (pH 7.4). Two drops
(~50 µl) of CREST serum as the first antibody (diluted 1:50 with PBS-0.2 % Tween 20) were
added to each slide, and the cells were incubated at 37° C. After 24 h cells were washed
twice with PBS-0.1 % Tween 20 and covered with 80 µl of secondary FITC-labelled goat
anti-human IgG for 1 h. Then the slides were rinsed twice with PBS-0.1 % Tween 20 and
rehydrated with Soerensen buffer (pH 6.8). Counterstaining was performed with a solution
containing 0.1 mg/ml propidium iodide (PI):1 µg/ml 4´6´diamidino-2-phenylindole (DAPI);
(3:1). The induction of MN was evaluated by scoring a total of 1000 cells /slide with well
preserved cytoplasm at 400 X magnification. The analysis of CREST staining was restricted
to areas where nuclei showed an adequate speckled pattern of bright, fluorescent, yellow-
green spots. MN were located by DAPI fluorescence (UV excitation), checked with a PI filter
if necessary, and finally classified using the FITC filter (blue excitation, Table 7). MN were
classified as CREST positive, when bright spots were clearly observed; negative, when no
spots were observed or unclear, when either opaque spots or a bright background were
observed.
3.1.5.6. COMET assay
The COMET assay is a technique for studying DNA damage (strand breaks) and repair. In
this assay, a small number of cells suspended in a thin agarose gel on a microscope slide is
lysed, electrophoresed, and stained with a fluorescent DNA binding dye. In the “neutral
version” DNA damage in cells due to double-strand breaks becomes apparent as increased
migration of chromosomal DNA from the nucleus toward the anode, which resembles the
shape of a comet. In the “alkaline version”, also DNA single-strand breaks and alkali-labile
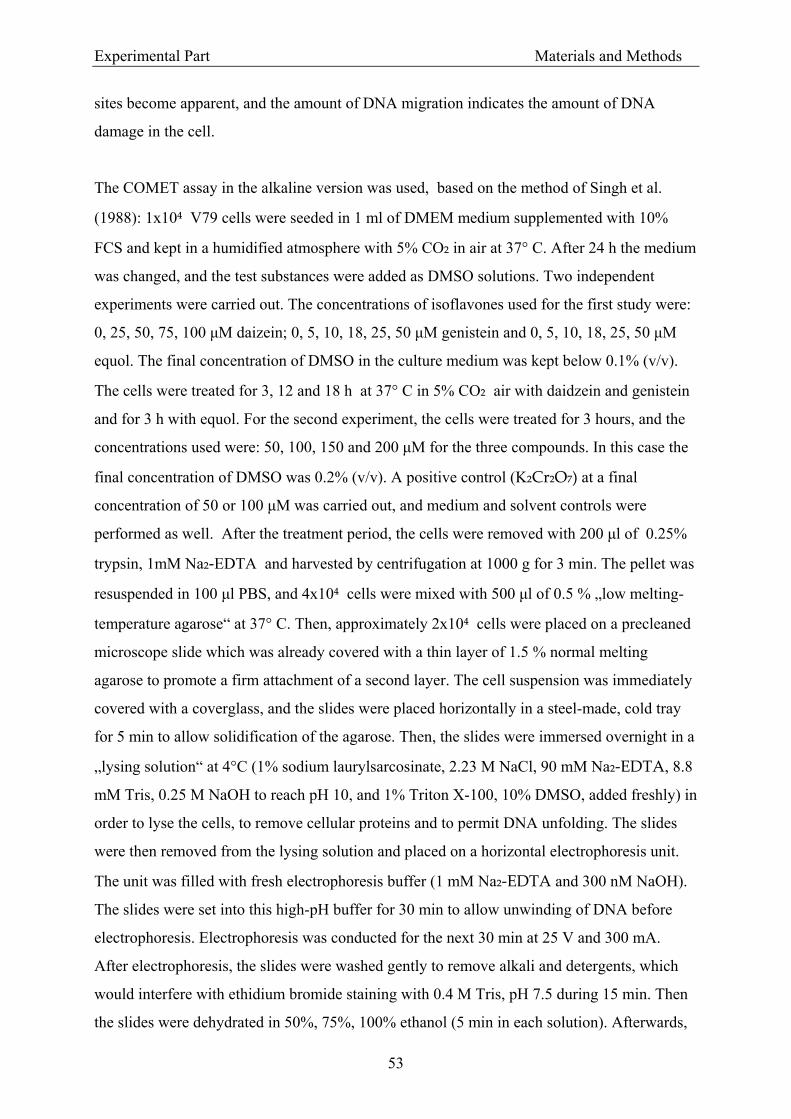
Experimental Part Materials and Methods
53
sites become apparent, and the amount of DNA migration indicates the amount of DNA
damage in the cell.
The COMET assay in the alkaline version was used, based on the method of Singh et al.
(1988): 1x10⁴ V79 cells were seeded in 1 ml of DMEM medium supplemented with 10%
FCS and kept in a humidified atmosphere with 5% CO₂ in air at 37° C. After 24 h the medium
was changed, and the test substances were added as DMSO solutions. Two independent
experiments were carried out. The concentrations of isoflavones used for the first study were:
0, 25, 50, 75, 100 µM daizein; 0, 5, 10, 18, 25, 50 µM genistein and 0, 5, 10, 18, 25, 50 µM
equol. The final concentration of DMSO in the culture medium was kept below 0.1% (v/v).
The cells were treated for 3, 12 and 18 h at 37° C in 5% CO₂ air with daidzein and genistein
and for 3 h with equol. For the second experiment, the cells were treated for 3 hours, and the
concentrations used were: 50, 100, 150 and 200 µM for the three compounds. In this case the
final concentration of DMSO was 0.2% (v/v). A positive control (K₂Cr₂O₇) at a final
concentration of 50 or 100 µM was carried out, and medium and solvent controls were
performed as well. After the treatment period, the cells were removed with 200 µl of 0.25%
trypsin, 1mM Na₂‐EDTA and harvested by centrifugation at 1000 g for 3 min. The pellet was
resuspended in 100 µl PBS, and 4x10⁴ cells were mixed with 500 µl of 0.5 % „low melting-
temperature agarose“ at 37° C. Then, approximately 2x10⁴ cells were placed on a precleaned
microscope slide which was already covered with a thin layer of 1.5 % normal melting
agarose to promote a firm attachment of a second layer. The cell suspension was immediately
covered with a coverglass, and the slides were placed horizontally in a steel-made, cold tray
for 5 min to allow solidification of the agarose. Then, the slides were immersed overnight in a
„lysing solution“ at 4°C (1% sodium laurylsarcosinate, 2.23 M NaCl, 90 mM Na₂‐EDTA, 8.8
mM Tris, 0.25 M NaOH to reach pH 10, and 1% Triton X-100, 10% DMSO, added freshly) in
order to lyse the cells, to remove cellular proteins and to permit DNA unfolding. The slides
were then removed from the lysing solution and placed on a horizontal electrophoresis unit.
The unit was filled with fresh electrophoresis buffer (1 mM Na₂‐EDTA and 300 nM NaOH).
The slides were set into this high-pH buffer for 30 min to allow unwinding of DNA before
electrophoresis. Electrophoresis was conducted for the next 30 min at 25 V and 300 mA.
After electrophoresis, the slides were washed gently to remove alkali and detergents, which
would interfere with ethidium bromide staining with 0.4 M Tris, pH 7.5 during 15 min. Then
the slides were dehydrated in 50%, 75%, 100% ethanol (5 min in each solution). Afterwards,
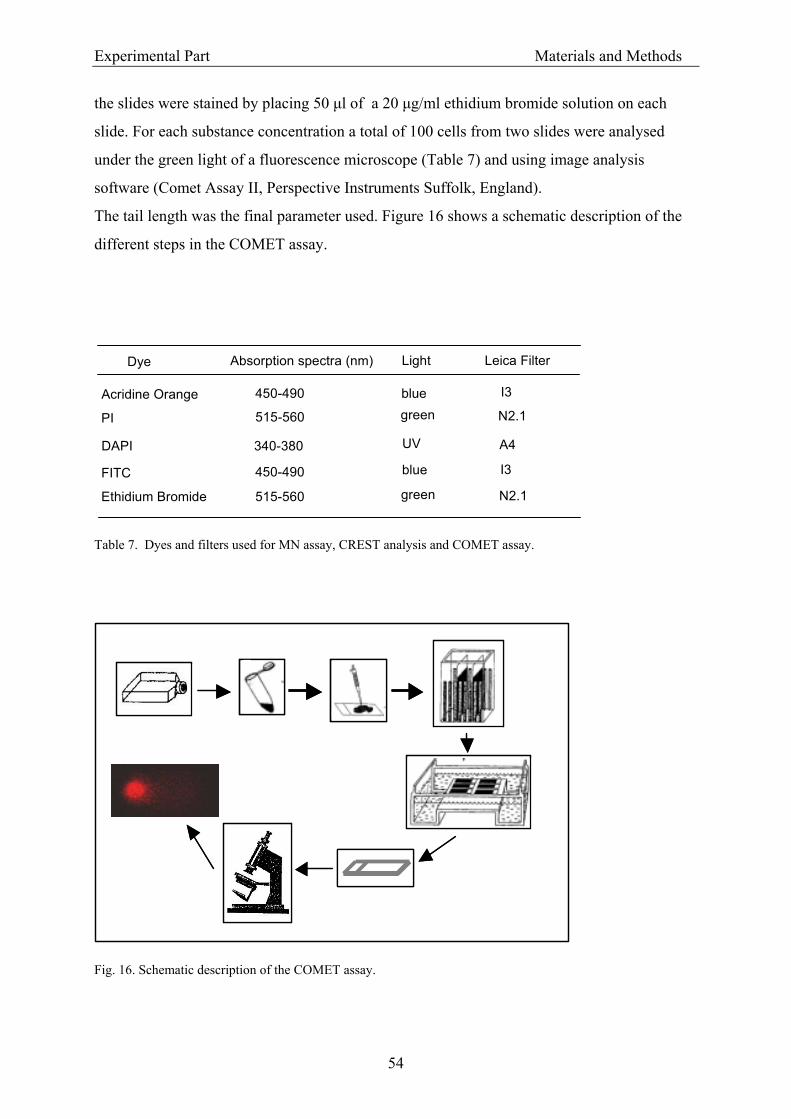
Experimental Part Materials and Methods
54
the slides were stained by placing 50 µl of a 20 µg/ml ethidium bromide solution on each
slide. For each substance concentration a total of 100 cells from two slides were analysed
under the green light of a fluorescence microscope (Table 7) and using image analysis
software (Comet Assay II, Perspective Instruments Suffolk, England).
The tail length was the final parameter used. Figure 16 shows a schematic description of the
different steps in the COMET assay.
Table 7. Dyes and filters used for MN assay, CREST analysis and COMET assay.
Fig. 16. Schematic description of the COMET assay.
Dye Absorption spectra (nm) Light Leica Filter
Acridine Orange
PI
DAPI
FITC
Ethidium Bromide
450-490
515-560
340-380
450-490
515-560
blue green
UV
blue
green
I3
N2.1
A4
I3
N2.1
Experimental Part Materials and Methods
55
In collaboration with the laboratory of Prof. Dr. Regine Kahl, Heinrich-Heine University,
Düsseldorf, two other experiments were carried out. The induction of DNA damage by much
higher concentrations of genistein was detected by the COMET assay in V79 cells. The
experimental procedures were the same as those described above, except for the lysis solution,
that was slighly different (2.5 M NaCl, 10mM Tris, 100mM Na₂‐EDTA, 1 % Triton X-100,
pH 10). V79 cells were incubated with different concentrations of genistein (100, 250 and 500
µM) for 3 h and the induced DNA damage was evaluated in 50 cells as the average image
length.
In order to study an antioxidative capacity of genistein, the COMET assay was applied with
hydrogen peroxide. This causes oxidative damage to DNA, and pre-treatment of V79 cells
with antioxidative compounds was expected to decrease hydrogen peroxide-induced DNA-
damage. Cells (3x10⁶) were seeded in a six-well plate; after 24 h, cells were pre-incubated for
1 h with 50 µM genistein and then treated with 500 µM H₂O₂ for 2 h. After treatment,
formation of DNA strand breaks was assessed with the COMET assay as described above.
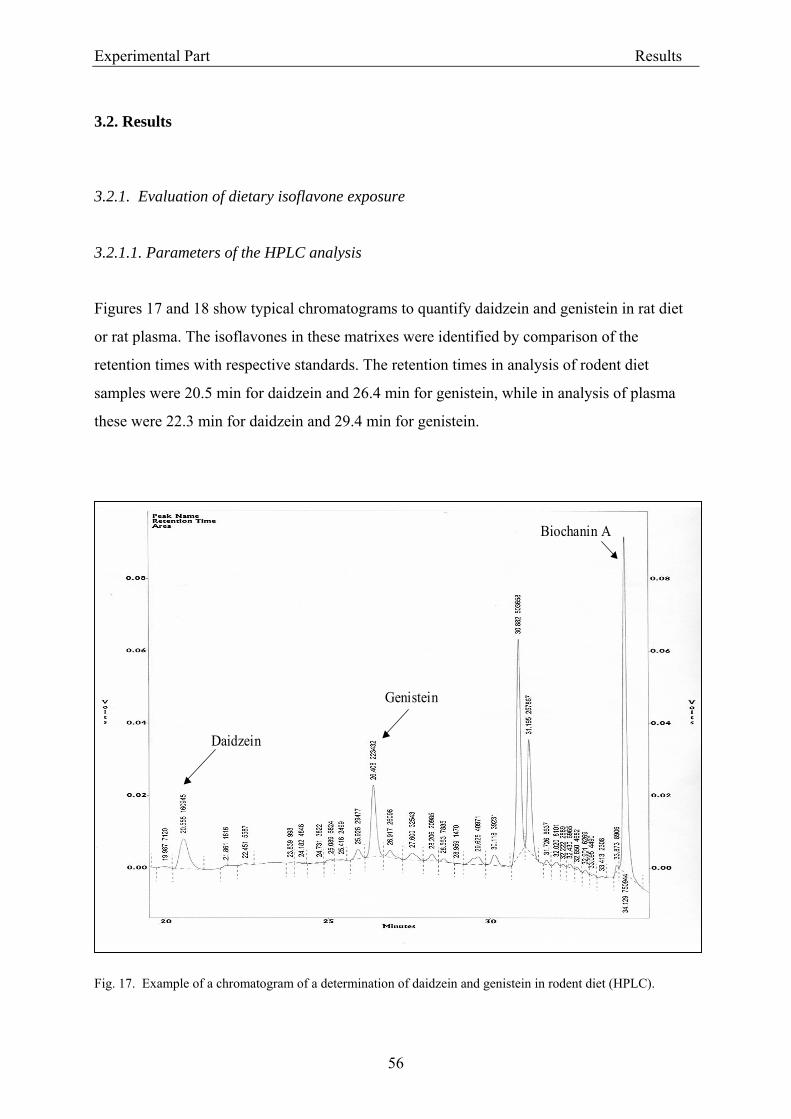
Experimental Part Results
56
3.2. Results
3.2.1. Evaluation of dietary isoflavone exposure
3.2.1.1. Parameters of the HPLC analysis
Figures 17 and 18 show typical chromatograms to quantify daidzein and genistein in rat diet
or rat plasma. The isoflavones in these matrixes were identified by comparison of the
retention times with respective standards. The retention times in analysis of rodent diet
samples were 20.5 min for daidzein and 26.4 min for genistein, while in analysis of plasma
these were 22.3 min for daidzein and 29.4 min for genistein.
Fig. 17. Example of a chromatogram of a determination of daidzein and genistein in rodent diet (HPLC).
Daidzein
Genistein
Biochanin A
Daidzein
Genistein
Biochanin A
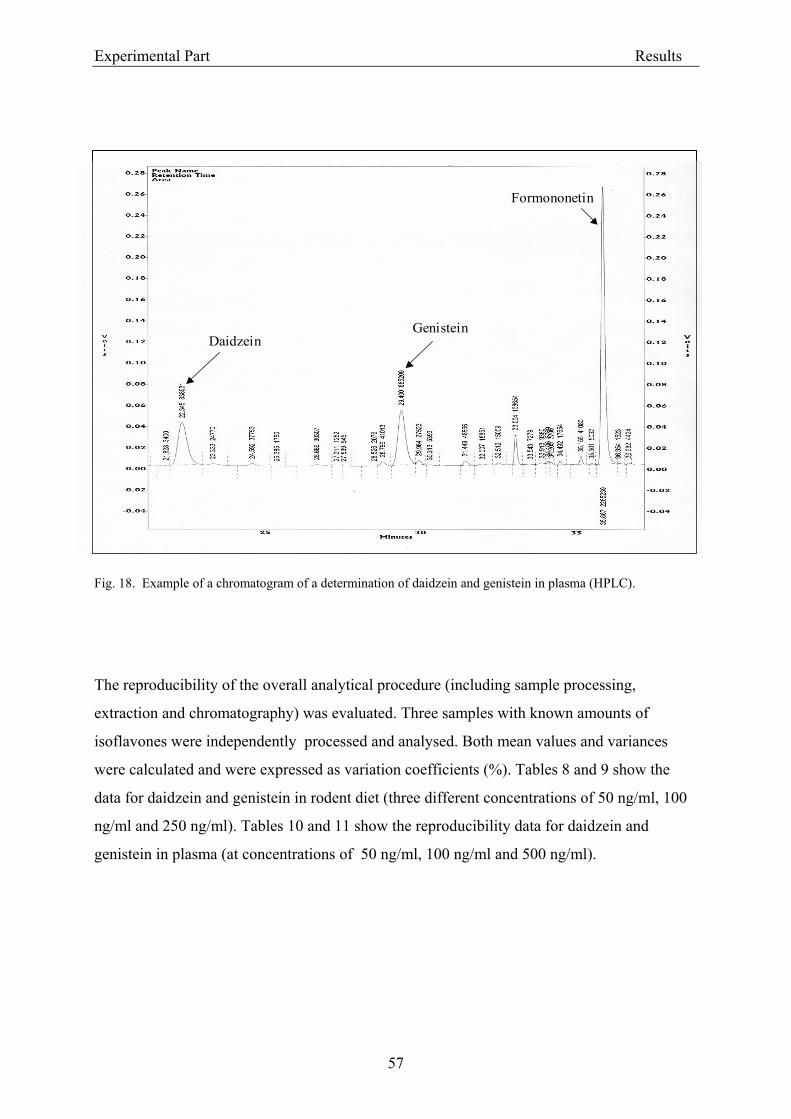
Experimental Part Results
57
Fig. 18. Example of a chromatogram of a determination of daidzein and genistein in plasma (HPLC).
The reproducibility of the overall analytical procedure (including sample processing,
extraction and chromatography) was evaluated. Three samples with known amounts of
isoflavones were independently processed and analysed. Both mean values and variances
were calculated and were expressed as variation coefficients (%). Tables 8 and 9 show the
data for daidzein and genistein in rodent diet (three different concentrations of 50 ng/ml, 100
ng/ml and 250 ng/ml). Tables 10 and 11 show the reproducibility data for daidzein and
genistein in plasma (at concentrations of 50 ng/ml, 100 ng/ml and 500 ng/ml).
DaidzeinGenistein
Formononetin
DaidzeinGenistein
Formononetin
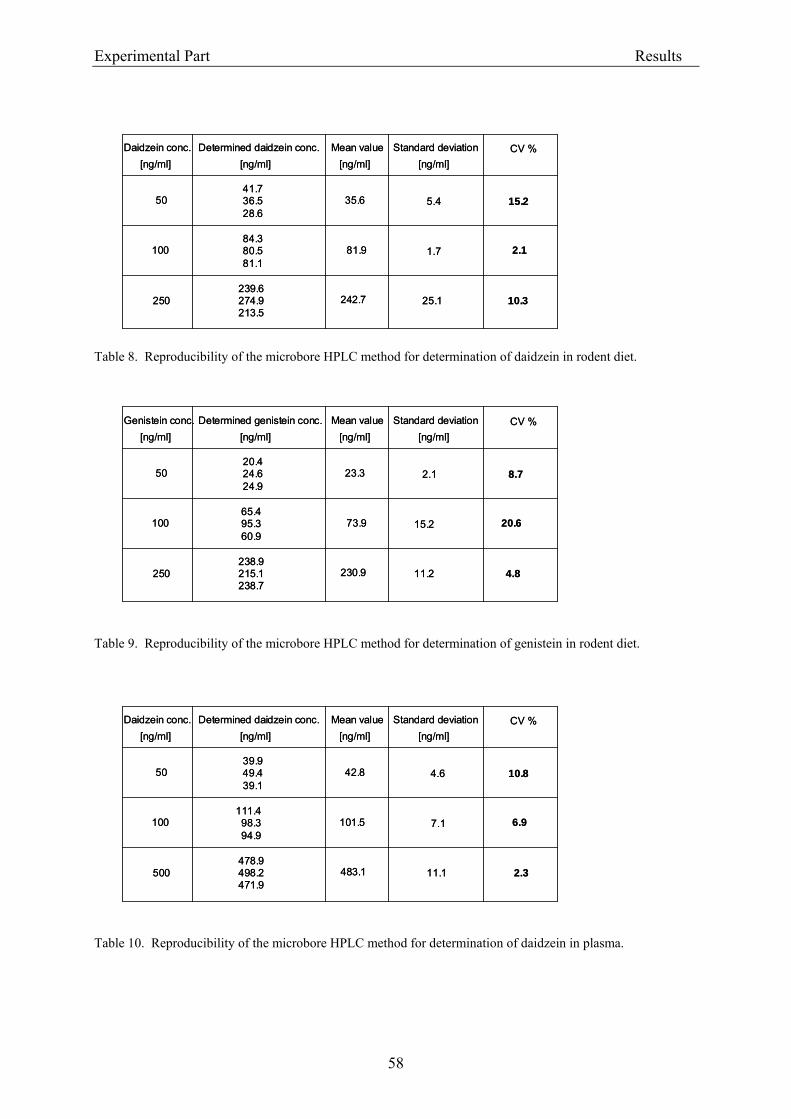
Experimental Part Results
58
Table 8. Reproducibility of the microbore HPLC method for determination of daidzein in rodent diet.
Table 9. Reproducibility of the microbore HPLC method for determination of genistein in rodent diet.
Table 10. Reproducibility of the microbore HPLC method for determination of daidzein in plasma.
Daidzein conc. Determined daidzein conc. Mean value Standard deviation[ng/ml] [ng/ml]
50
100
250
41.736.528.6
35.6
84.380.581.1
239.6274.9213.5
242.7
5.4
1.7
25.1
81.9
[ng/ml] [ng/ml]
15.2
2.1
10.3
CV %Daidzein conc. Determined daidzein conc. Mean value Standard deviation[ng/ml] [ng/ml]
50
100
250
41.736.528.6
35.6
84.380.581.1
239.6274.9213.5
242.7
5.4
1.7
25.1
81.9
[ng/ml] [ng/ml]
15.2
2.1
10.3
CV %
Genistein conc. Determined genistein conc. Mean value Standard deviation[ng/ml] [ng/ml]
50
100
250
20.424.624.9
23.3
65.495.360.9
238.9215.1238.7
230.9
2.1
15.2
11.2
73.9
[ng/ml] [ng/ml]
8.7
20.6
4.8
CV %Genistein conc. Determined genistein conc. Mean value Standard deviation[ng/ml] [ng/ml]
50
100
250
20.424.624.9
23.3
65.495.360.9
238.9215.1238.7
230.9
2.1
15.2
11.2
73.9
[ng/ml] [ng/ml]
8.7
20.6
4.8
CV %
CV %Daidzein conc. Determined daidzein conc. Mean value Standard deviation[ng/ml] [ng/ml]
50
100
500
39.949.439.1
42.8
111.498.394.9
478.9498.2471.9
483.1
4.6
7.1
11.1
101.5
[ng/ml] [ng/ml]
10.8
6.9
2.3
CV %Daidzein conc. Determined daidzein conc. Mean value Standard deviation[ng/ml] [ng/ml]
50
100
500
39.949.439.1
42.8
111.498.394.9
478.9498.2471.9
483.1
4.6
7.1
11.1
101.5
[ng/ml] [ng/ml]
10.8
6.9
2.3
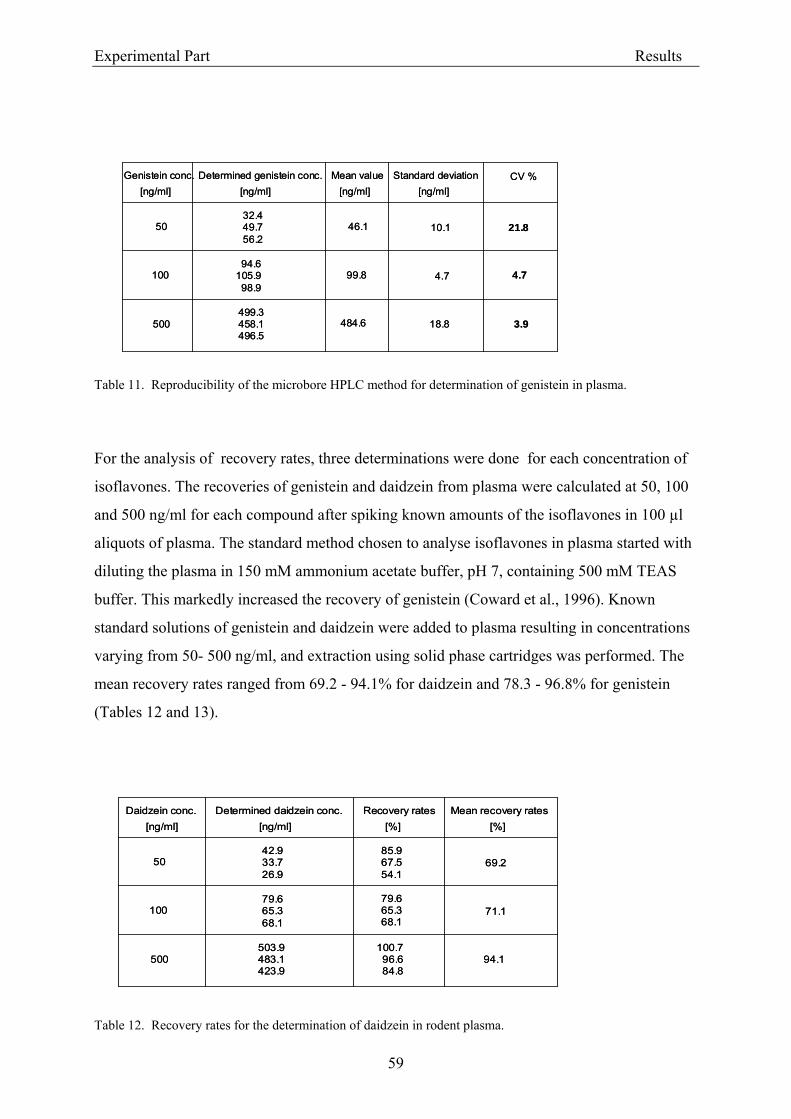
Experimental Part Results
59
Table 11. Reproducibility of the microbore HPLC method for determination of genistein in plasma.
For the analysis of recovery rates, three determinations were done for each concentration of
isoflavones. The recoveries of genistein and daidzein from plasma were calculated at 50, 100
and 500 ng/ml for each compound after spiking known amounts of the isoflavones in 100 µl
aliquots of plasma. The standard method chosen to analyse isoflavones in plasma started with
diluting the plasma in 150 mM ammonium acetate buffer, pH 7, containing 500 mM TEAS
buffer. This markedly increased the recovery of genistein (Coward et al., 1996). Known
standard solutions of genistein and daidzein were added to plasma resulting in concentrations
varying from 50- 500 ng/ml, and extraction using solid phase cartridges was performed. The
mean recovery rates ranged from 69.2 - 94.1% for daidzein and 78.3 - 96.8% for genistein
(Tables 12 and 13).
Table 12. Recovery rates for the determination of daidzein in rodent plasma.
Daidzein conc. Determined daidzein conc. Recovery rates Mean recovery rates[ng/ml] [ng/ml] [%] [%]
50
100
500
42.933.726.9
85.967.554.1
79.665.368.1
503.9483.1423.9
79.665.368.1
100.796.684.8
69.2
71.1
94.1
Daidzein conc. Determined daidzein conc. Recovery rates Mean recovery rates[ng/ml] [ng/ml] [%] [%]
50
100
500
42.933.726.9
85.967.554.1
79.665.368.1
503.9483.1423.9
79.665.368.1
100.796.684.8
69.2
71.1
94.1
Genistein conc. Determined genistein conc. Mean value Standard deviation[ng/ml] [ng/ml]
50
100
500
32.449.756.2
46.1
94.6105.998.9
499.3458.1496.5
484.6
10.1
4.7
18.8
99.8
[ng/ml] [ng/ml]
21.8
4.7
3.9
CV %Genistein conc. Determined genistein conc. Mean value Standard deviation[ng/ml] [ng/ml]
50
100
500
32.449.756.2
46.1
94.6105.998.9
499.3458.1496.5
484.6
10.1
4.7
18.8
99.8
[ng/ml] [ng/ml]
21.8
4.7
3.9
CV %
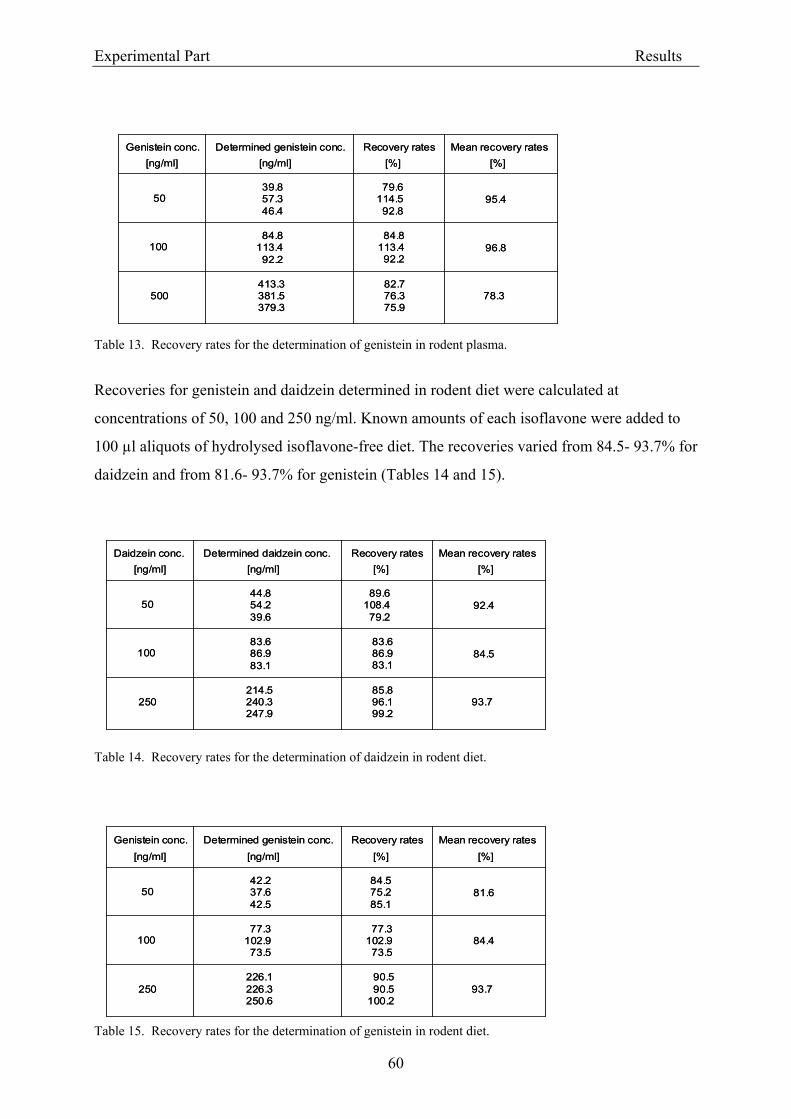
Experimental Part Results
60
Table 13. Recovery rates for the determination of genistein in rodent plasma.
Recoveries for genistein and daidzein determined in rodent diet were calculated at
concentrations of 50, 100 and 250 ng/ml. Known amounts of each isoflavone were added to
100 µl aliquots of hydrolysed isoflavone-free diet. The recoveries varied from 84.5- 93.7% for
daidzein and from 81.6- 93.7% for genistein (Tables 14 and 15).
Table 14. Recovery rates for the determination of daidzein in rodent diet.
Table 15. Recovery rates for the determination of genistein in rodent diet.
Daidzein conc. Determined daidzein conc. Recovery rates Mean recovery rates[ng/ml] [ng/ml] [%] [%]
50
100
250
44.854.239.6
89.6108.479.2
83.686.983.1
214.5240.3247.9
85.896.199.2
92.4
84.5
93.7
83.686.983.1
Daidzein conc. Determined daidzein conc. Recovery rates Mean recovery rates[ng/ml] [ng/ml] [%] [%]
50
100
250
44.854.239.6
89.6108.479.2
83.686.983.1
214.5240.3247.9
85.896.199.2
92.4
84.5
93.7
83.686.983.1
Genistein conc. Determined genistein conc. Recovery rates Mean recovery rates[ng/ml] [ng/ml] [%] [%]
50
100
250
42.237.642.5
84.575.285.1
77.3102.973.5
226.1226.3250.6
90.590.5
100.2
81.6
84.4
93.7
77.3102.973.5
Genistein conc. Determined genistein conc. Recovery rates Mean recovery rates[ng/ml] [ng/ml] [%] [%]
50
100
250
42.237.642.5
84.575.285.1
77.3102.973.5
226.1226.3250.6
90.590.5
100.2
81.6
84.4
93.7
77.3102.973.5
Genistein conc. Determined genistein conc. Recovery rates Mean recovery rates[ng/ml] [ng/ml] [%] [%]
50
100
500
39.857.346.4
79.6114.592.8
84.8113.492.2
413.3381.5379.3
82.776.375.9
95.4
96.8
78.3
84.8113.492.2
Genistein conc. Determined genistein conc. Recovery rates Mean recovery rates[ng/ml] [ng/ml] [%] [%]
50
100
500
39.857.346.4
79.6114.592.8
84.8113.492.2
413.3381.5379.3
82.776.375.9
95.4
96.8
78.3
84.8113.492.2
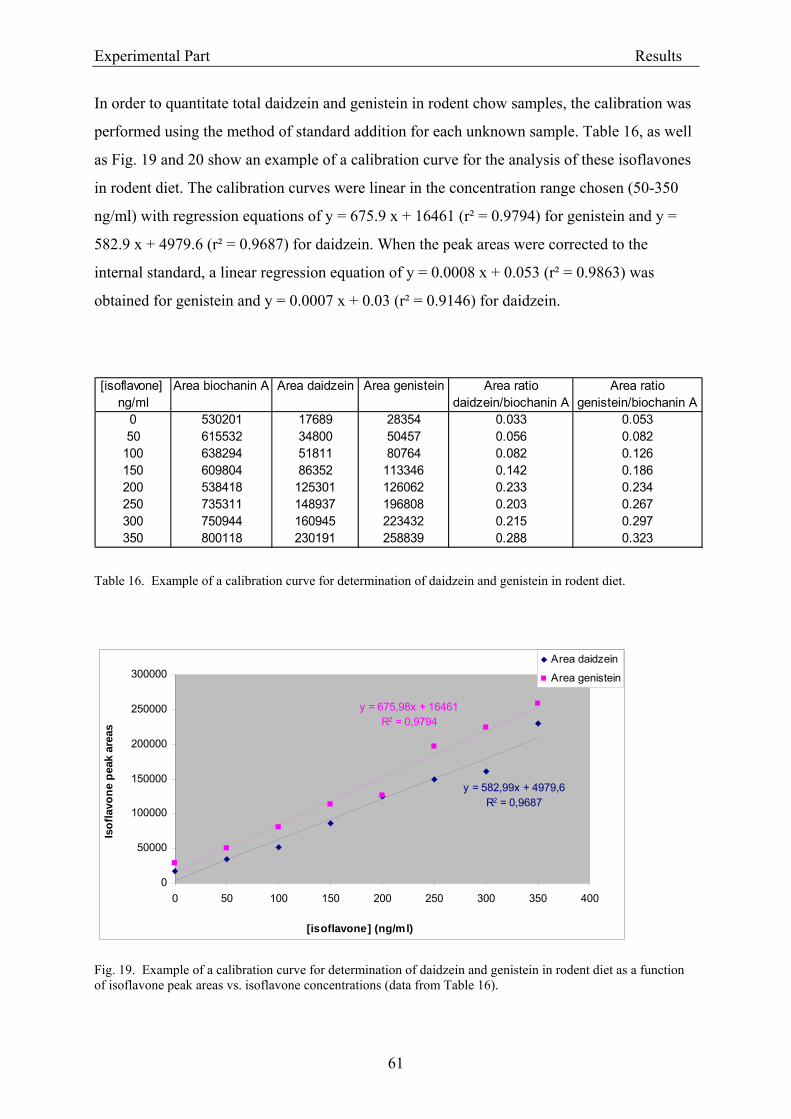
Experimental Part Results
61
In order to quantitate total daidzein and genistein in rodent chow samples, the calibration was
performed using the method of standard addition for each unknown sample. Table 16, as well
as Fig. 19 and 20 show an example of a calibration curve for the analysis of these isoflavones
in rodent diet. The calibration curves were linear in the concentration range chosen (50-350
ng/ml) with regression equations of y = 675.9 x + 16461 (r² = 0.9794) for genistein and y =
582.9 x + 4979.6 (r² = 0.9687) for daidzein. When the peak areas were corrected to the
internal standard, a linear regression equation of y = 0.0008 x + 0.053 (r² = 0.9863) was
obtained for genistein and y = 0.0007 x + 0.03 (r² = 0.9146) for daidzein.
Table 16. Example of a calibration curve for determination of daidzein and genistein in rodent diet.
Fig. 19. Example of a calibration curve for determination of daidzein and genistein in rodent diet as a function of isoflavone peak areas vs. isoflavone concentrations (data from Table 16).
[isoflavone] Area biochanin A Area daidzein Area genistein Area ratio Area rationg/ml daidzein/biochanin A genistein/biochanin A
0 530201 17689 28354 0.033 0.05350 615532 34800 50457 0.056 0.082
100 638294 51811 80764 0.082 0.126150 609804 86352 113346 0.142 0.186200 538418 125301 126062 0.233 0.234250 735311 148937 196808 0.203 0.267300 750944 160945 223432 0.215 0.297350 800118 230191 258839 0.288 0.323
y = 675,98x + 16461R2 = 0,9794
y = 582,99x + 4979,6R2 = 0,9687
0
50000
100000
150000
200000
250000
300000
0 50 100 150 200 250 300 350 400
[isoflavone] (ng/ml)
Isof
lavo
ne p
eak
area
s
Area daidzein
Area genistein
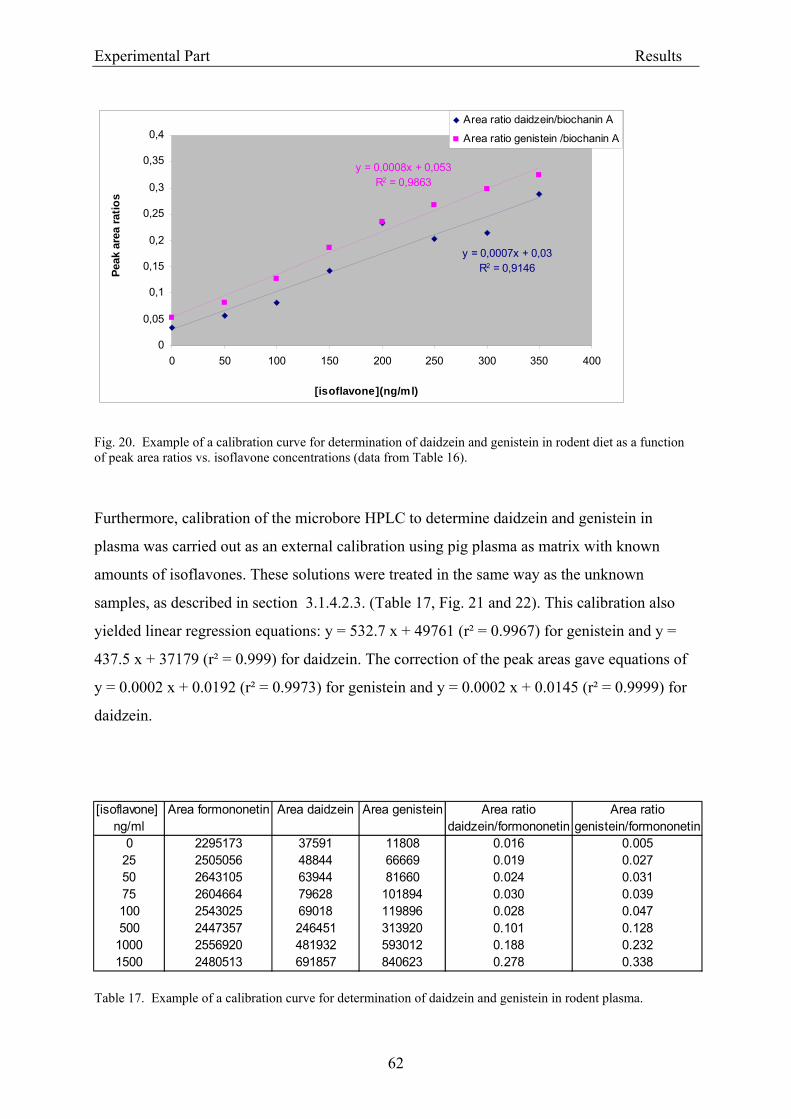
Experimental Part Results
62
Fig. 20. Example of a calibration curve for determination of daidzein and genistein in rodent diet as a function of peak area ratios vs. isoflavone concentrations (data from Table 16).
Furthermore, calibration of the microbore HPLC to determine daidzein and genistein in
plasma was carried out as an external calibration using pig plasma as matrix with known
amounts of isoflavones. These solutions were treated in the same way as the unknown
samples, as described in section 3.1.4.2.3. (Table 17, Fig. 21 and 22). This calibration also
yielded linear regression equations: y = 532.7 x + 49761 (r² = 0.9967) for genistein and y =
437.5 x + 37179 (r² = 0.999) for daidzein. The correction of the peak areas gave equations of
y = 0.0002 x + 0.0192 (r² = 0.9973) for genistein and y = 0.0002 x + 0.0145 (r² = 0.9999) for
daidzein.
Table 17. Example of a calibration curve for determination of daidzein and genistein in rodent plasma.
y = 0,0007x + 0,03R2 = 0,9146
y = 0,0008x + 0,053R2 = 0,9863
0
0,05
0,1
0,15
0,2
0,25
0,3
0,35
0,4
0 50 100 150 200 250 300 350 400
[isoflavone](ng/ml)
Peak
are
a ra
tios
Area ratio daidzein/biochanin A
Area ratio genistein /biochanin A
[isoflavone] Area formononetin Area daidzein Area genistein Area ratio Area rationg/ml daidzein/formononetin genistein/formononetin
0 2295173 37591 11808 0.016 0.00525 2505056 48844 66669 0.019 0.02750 2643105 63944 81660 0.024 0.03175 2604664 79628 101894 0.030 0.039100 2543025 69018 119896 0.028 0.047500 2447357 246451 313920 0.101 0.128
1000 2556920 481932 593012 0.188 0.2321500 2480513 691857 840623 0.278 0.338
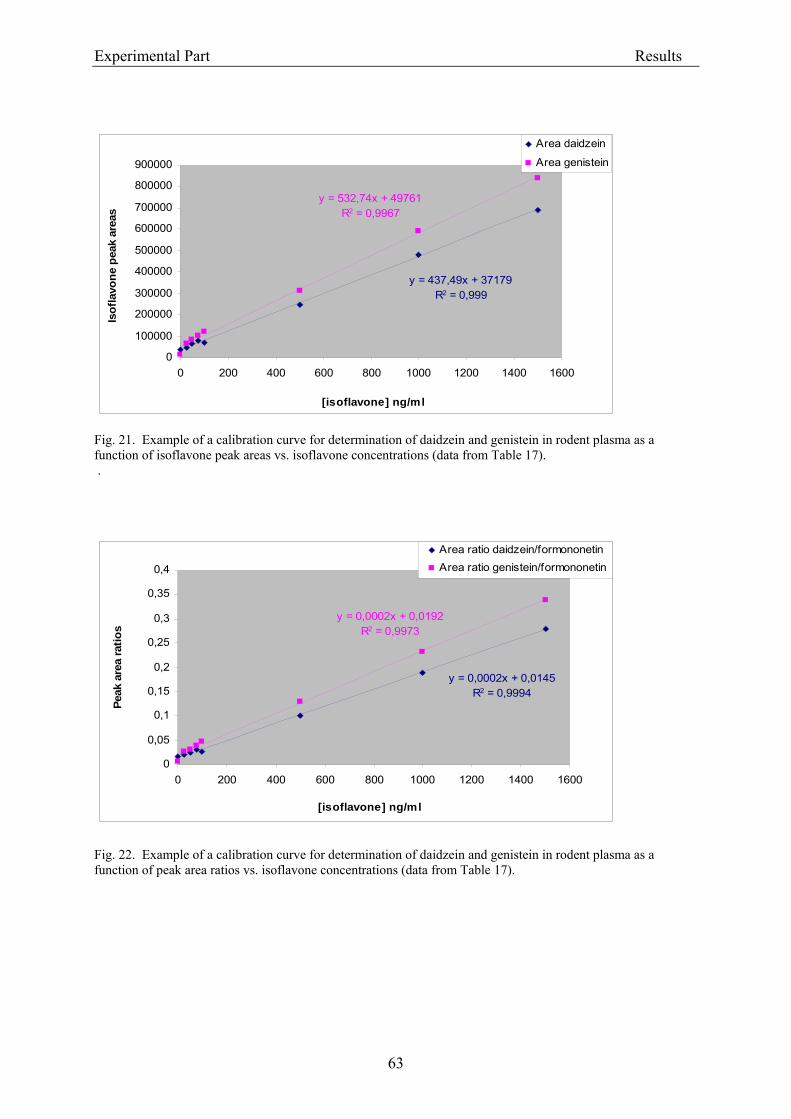
Experimental Part Results
63
Fig. 21. Example of a calibration curve for determination of daidzein and genistein in rodent plasma as a function of isoflavone peak areas vs. isoflavone concentrations (data from Table 17).
.
Fig. 22. Example of a calibration curve for determination of daidzein and genistein in rodent plasma as a function of peak area ratios vs. isoflavone concentrations (data from Table 17).
y = 437,49x + 37179R2 = 0,999
y = 532,74x + 49761R2 = 0,9967
0
100000
200000
300000
400000
500000
600000
700000
800000
900000
0 200 400 600 800 1000 1200 1400 1600
[isoflavone] ng/ml
Isof
lavo
ne p
eak
area
s
Area daidzein
Area genistein
y = 0,0002x + 0,0145R2 = 0,9994
y = 0,0002x + 0,0192R2 = 0,9973
0
0,05
0,1
0,15
0,2
0,25
0,3
0,35
0,4
0 200 400 600 800 1000 1200 1400 1600
[isoflavone] ng/ml
Peak
are
a ra
tios
Area ratio daidzein/formononetinArea ratio genistein/formononetin
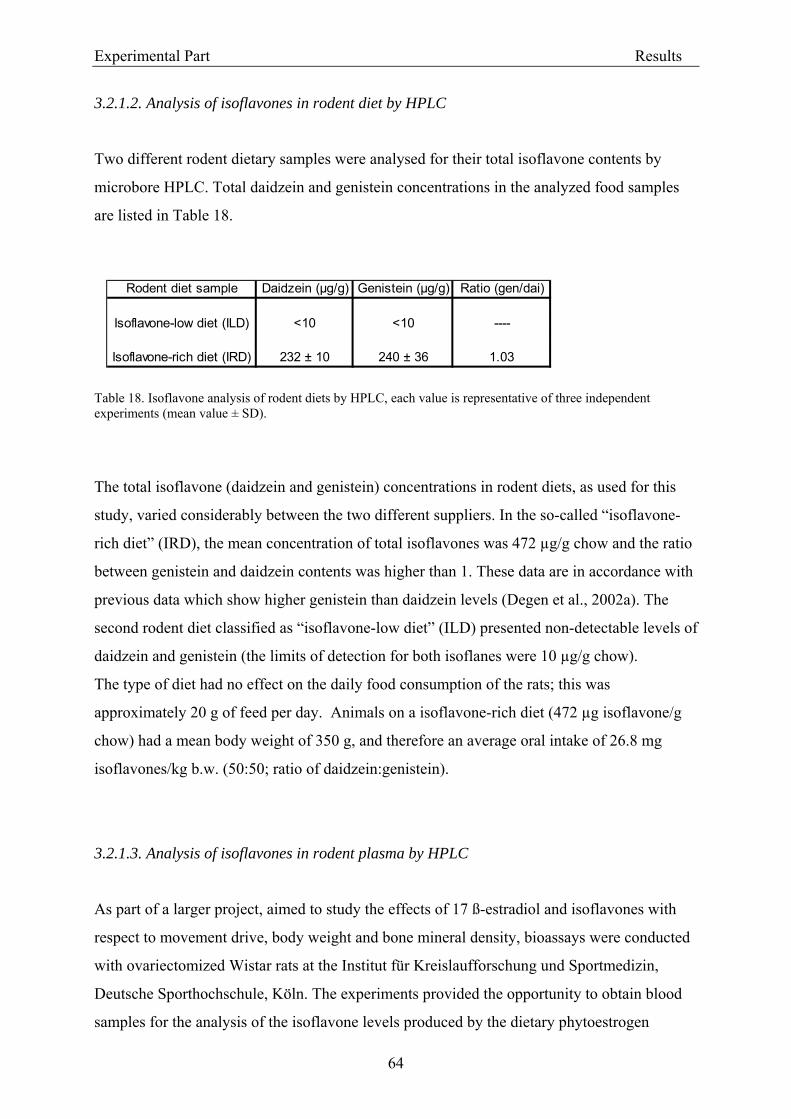
Experimental Part Results
64
3.2.1.2. Analysis of isoflavones in rodent diet by HPLC
Two different rodent dietary samples were analysed for their total isoflavone contents by
microbore HPLC. Total daidzein and genistein concentrations in the analyzed food samples
are listed in Table 18.
Table 18. Isoflavone analysis of rodent diets by HPLC, each value is representative of three independent experiments (mean value ± SD).
The total isoflavone (daidzein and genistein) concentrations in rodent diets, as used for this
study, varied considerably between the two different suppliers. In the so-called “isoflavone-
rich diet” (IRD), the mean concentration of total isoflavones was 472 µg/g chow and the ratio
between genistein and daidzein contents was higher than 1. These data are in accordance with
previous data which show higher genistein than daidzein levels (Degen et al., 2002a). The
second rodent diet classified as “isoflavone-low diet” (ILD) presented non-detectable levels of
daidzein and genistein (the limits of detection for both isoflanes were 10 µg/g chow).
The type of diet had no effect on the daily food consumption of the rats; this was
approximately 20 g of feed per day. Animals on a isoflavone-rich diet (472 µg isoflavone/g
chow) had a mean body weight of 350 g, and therefore an average oral intake of 26.8 mg
isoflavones/kg b.w. (50:50; ratio of daidzein:genistein).
3.2.1.3. Analysis of isoflavones in rodent plasma by HPLC
As part of a larger project, aimed to study the effects of 17 ß-estradiol and isoflavones with
respect to movement drive, body weight and bone mineral density, bioassays were conducted
with ovariectomized Wistar rats at the Institut für Kreislaufforschung und Sportmedizin,
Deutsche Sporthochschule, Köln. The experiments provided the opportunity to obtain blood
samples for the analysis of the isoflavone levels produced by the dietary phytoestrogen
Rodent diet sample Daidzein (µg/g) Genistein (µg/g) Ratio (gen/dai)
Isoflavone-low diet (ILD) <10 <10 ----
Isoflavone-rich diet (IRD) 232 ± 10 240 ± 36 1.03
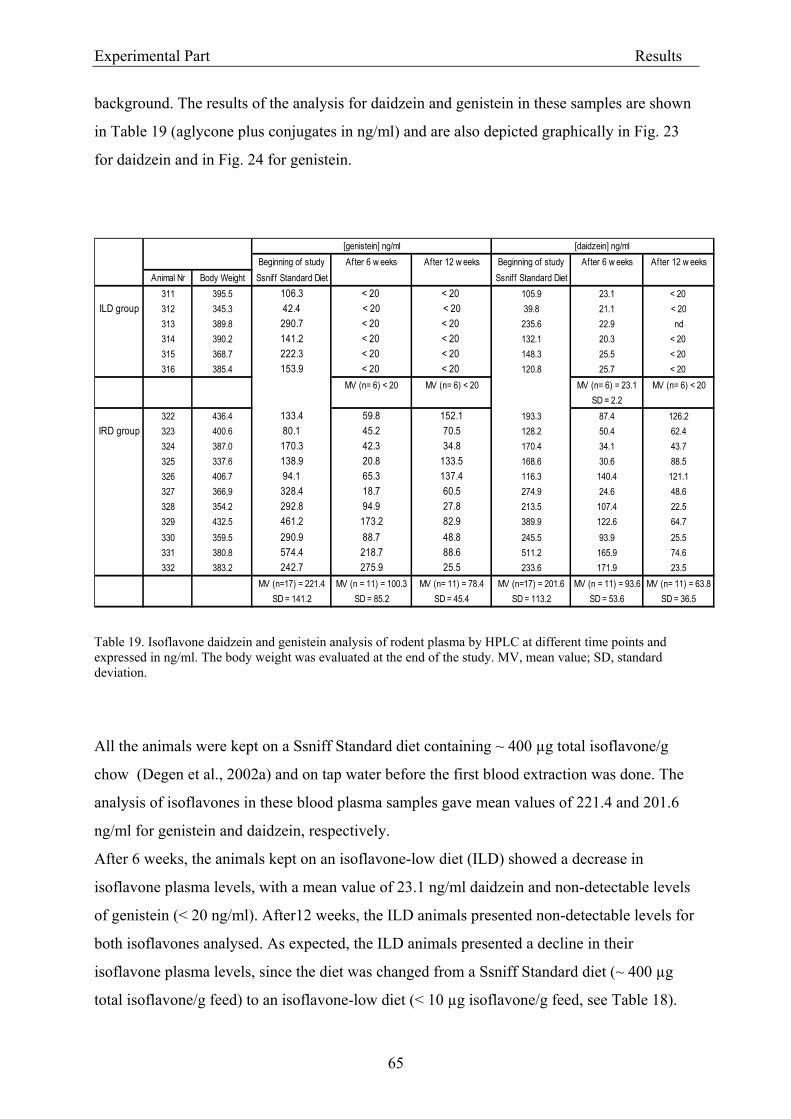
Experimental Part Results
65
background. The results of the analysis for daidzein and genistein in these samples are shown
in Table 19 (aglycone plus conjugates in ng/ml) and are also depicted graphically in Fig. 23
for daidzein and in Fig. 24 for genistein.
Table 19. Isoflavone daidzein and genistein analysis of rodent plasma by HPLC at different time points and expressed in ng/ml. The body weight was evaluated at the end of the study. MV, mean value; SD, standard deviation.
All the animals were kept on a Ssniff Standard diet containing ~ 400 µg total isoflavone/g
chow (Degen et al., 2002a) and on tap water before the first blood extraction was done. The
analysis of isoflavones in these blood plasma samples gave mean values of 221.4 and 201.6
ng/ml for genistein and daidzein, respectively.
After 6 weeks, the animals kept on an isoflavone-low diet (ILD) showed a decrease in
isoflavone plasma levels, with a mean value of 23.1 ng/ml daidzein and non-detectable levels
of genistein (< 20 ng/ml). After12 weeks, the ILD animals presented non-detectable levels for
both isoflavones analysed. As expected, the ILD animals presented a decline in their
isoflavone plasma levels, since the diet was changed from a Ssniff Standard diet (~ 400 µg
total isoflavone/g feed) to an isoflavone-low diet (< 10 µg isoflavone/g feed, see Table 18).
[genistein] ng/ml [daidzein] ng/mlBeginning of study After 6 w eeks After 12 w eeks Beginning of study After 6 w eeks After 12 w eeks
Animal Nr Body Weight Ssniff Standard Diet Ssniff Standard Diet311 395.5 106.3 < 20 < 20 105.9 23.1 < 20
ILD group 312 345.3 42.4 < 20 < 20 39.8 21.1 < 20313 389.8 290.7 < 20 < 20 235.6 22.9 nd314 390.2 141.2 < 20 < 20 132.1 20.3 < 20 315 368.7 222.3 < 20 < 20 148.3 25.5 < 20 316 385.4 153.9 < 20 < 20 120.8 25.7 < 20
MV (n= 6) < 20 MV (n= 6) < 20 MV (n= 6) = 23.1 MV (n= 6) < 20SD = 2.2
322 436.4 133.4 59.8 152.1 193.3 87.4 126.2IRD group 323 400.6 80.1 45.2 70.5 128.2 50.4 62.4
324 387.0 170.3 42.3 34.8 170.4 34.1 43.7325 337.6 138.9 20.8 133.5 168.6 30.6 88.5326 406.7 94.1 65.3 137.4 116.3 140.4 121.1327 366,9 328.4 18.7 60.5 274.9 24.6 48.6328 354.2 292.8 94.9 27.8 213.5 107.4 22.5329 432.5 461.2 173.2 82.9 389.9 122.6 64.7330 359.5 290.9 88.7 48.8 245.5 93.9 25.5331 380.8 574.4 218.7 88.6 511.2 165.9 74.6332 383.2 242.7 275.9 25.5 233.6 171.9 23.5
MV (n=17) = 221.4 MV (n = 11) = 100.3 MV (n= 11) = 78.4 MV (n=17) = 201.6 MV (n = 11) = 93.6 MV (n= 11) = 63.8SD = 141.2 SD = 85.2 SD = 45.4 SD = 113.2 SD = 53.6 SD = 36.5
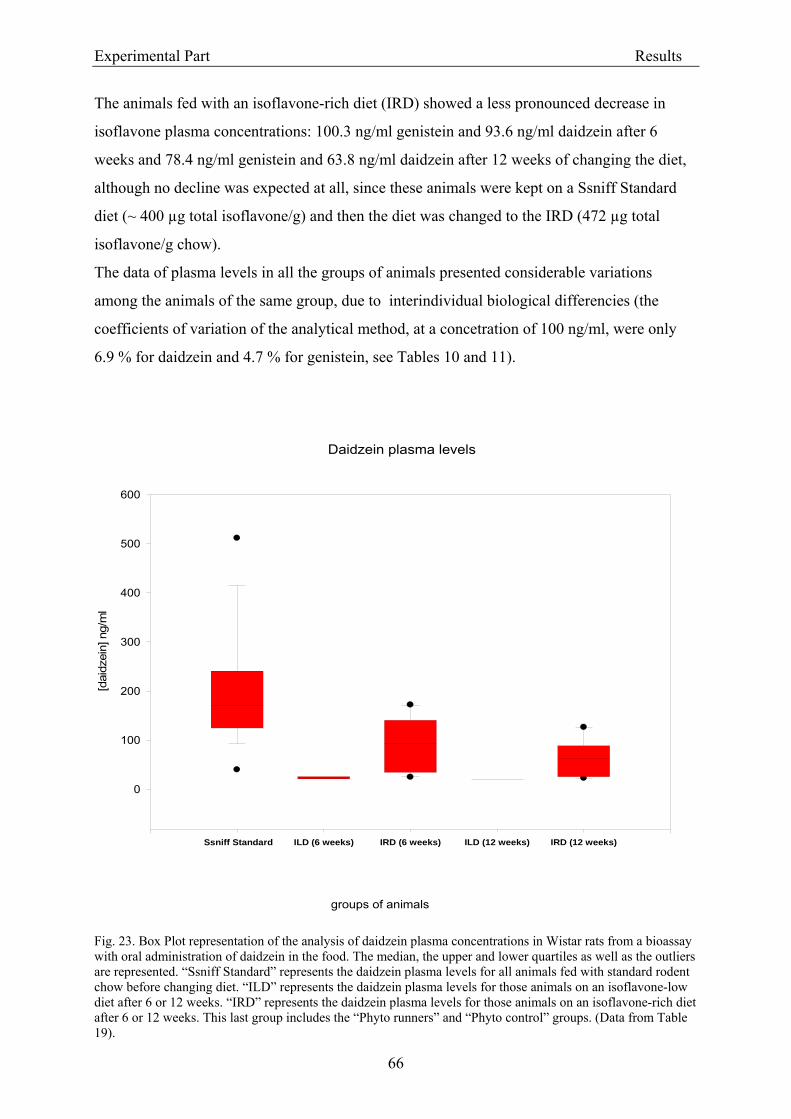
Experimental Part Results
66
The animals fed with an isoflavone-rich diet (IRD) showed a less pronounced decrease in
isoflavone plasma concentrations: 100.3 ng/ml genistein and 93.6 ng/ml daidzein after 6
weeks and 78.4 ng/ml genistein and 63.8 ng/ml daidzein after 12 weeks of changing the diet,
although no decline was expected at all, since these animals were kept on a Ssniff Standard
diet (~ 400 µg total isoflavone/g) and then the diet was changed to the IRD (472 µg total
isoflavone/g chow).
The data of plasma levels in all the groups of animals presented considerable variations
among the animals of the same group, due to interindividual biological differencies (the
coefficients of variation of the analytical method, at a concetration of 100 ng/ml, were only
6.9 % for daidzein and 4.7 % for genistein, see Tables 10 and 11).
Fig. 23. Box Plot representation of the analysis of daidzein plasma concentrations in Wistar rats from a bioassay with oral administration of daidzein in the food. The median, the upper and lower quartiles as well as the outliers are represented. “Ssniff Standard” represents the daidzein plasma levels for all animals fed with standard rodent chow before changing diet. “ILD” represents the daidzein plasma levels for those animals on an isoflavone-low diet after 6 or 12 weeks. “IRD” represents the daidzein plasma levels for those animals on an isoflavone-rich diet after 6 or 12 weeks. This last group includes the “Phyto runners” and “Phyto control” groups. (Data from Table 19).
Daidzein plasma levels
groups of animals
Ssniff Standard ILD (6 weeks) IRD (6 weeks) ILD (12 weeks) IRD (12 weeks)
[dai
dzei
n] n
g/m
l
0
100
200
300
400
500
600
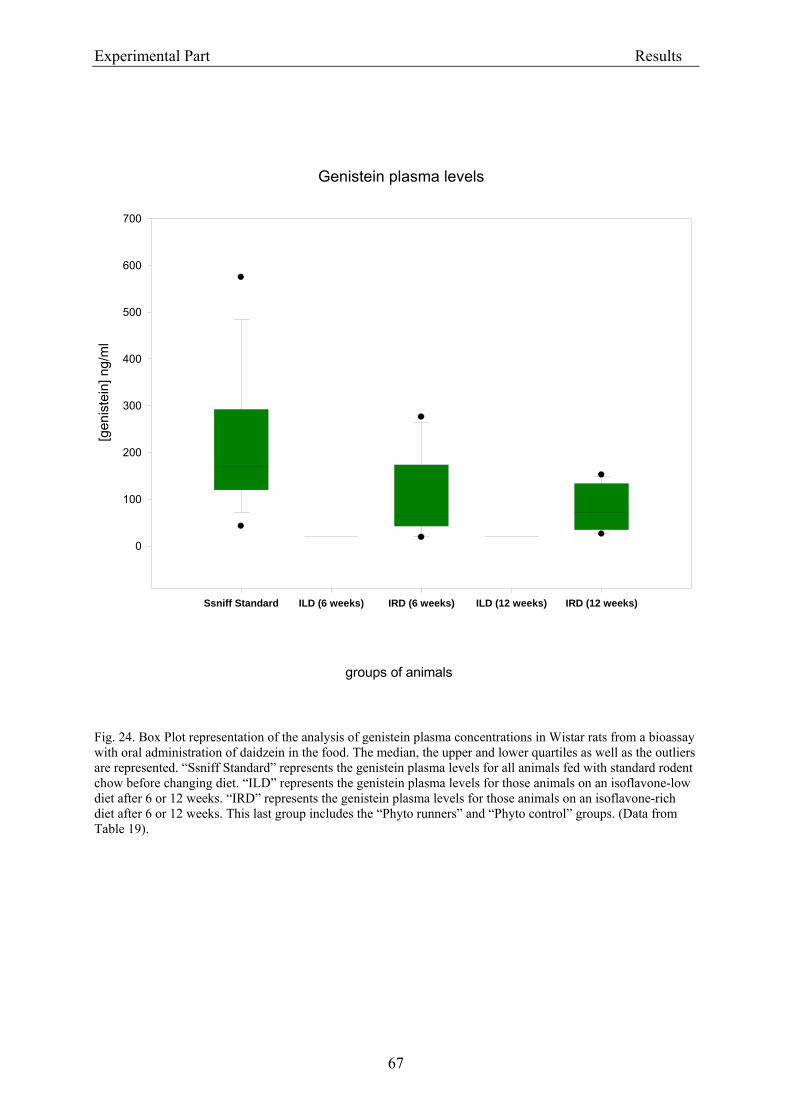
Experimental Part Results
67
Fig. 24. Box Plot representation of the analysis of genistein plasma concentrations in Wistar rats from a bioassay with oral administration of daidzein in the food. The median, the upper and lower quartiles as well as the outliers are represented. “Ssniff Standard” represents the genistein plasma levels for all animals fed with standard rodent chow before changing diet. “ILD” represents the genistein plasma levels for those animals on an isoflavone-low diet after 6 or 12 weeks. “IRD” represents the genistein plasma levels for those animals on an isoflavone-rich diet after 6 or 12 weeks. This last group includes the “Phyto runners” and “Phyto control” groups. (Data from Table 19).
Genistein plasma levels
Ssniff Standard ILD (6 weeks) IRD (6 weeks) ILD (12 weeks) IRD (12 weeks)
[gen
iste
in] n
g/m
l
0
100
200
300
400
500
600
700
groups of animals
Genistein plasma levels
Ssniff Standard ILD (6 weeks) IRD (6 weeks) ILD (12 weeks) IRD (12 weeks)
[gen
iste
in] n
g/m
l
0
100
200
300
400
500
600
700
groups of animals
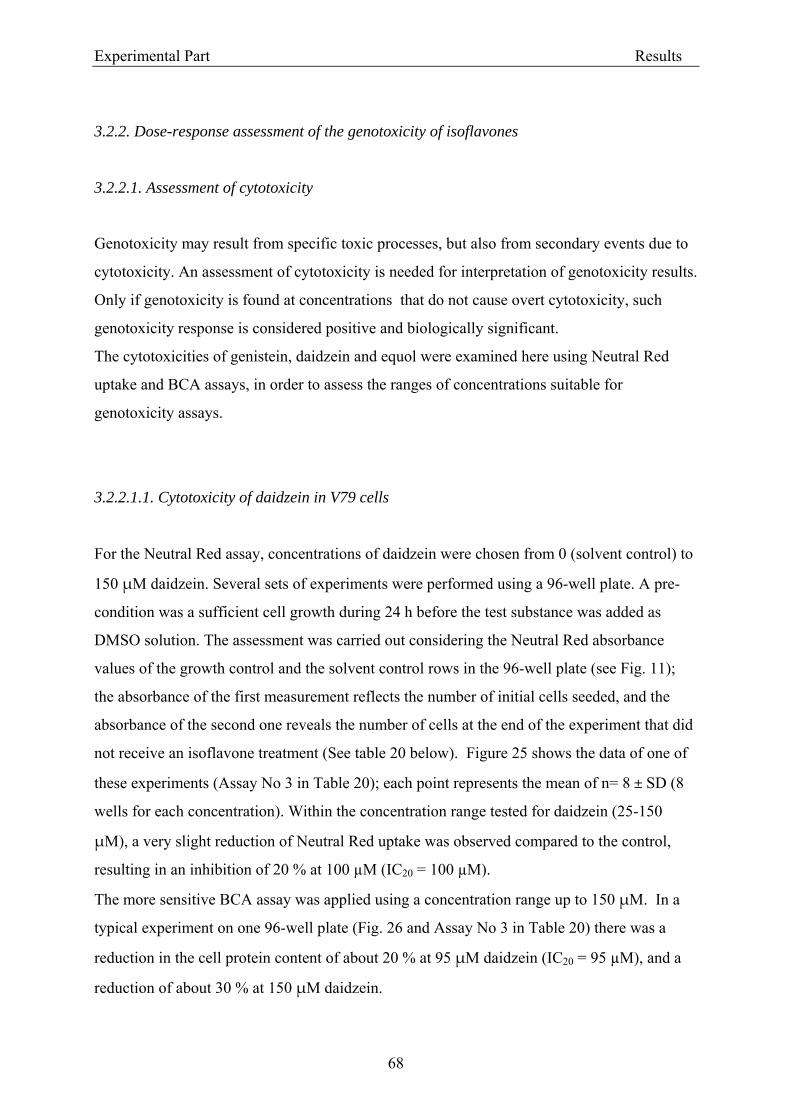
Experimental Part Results
68
3.2.2. Dose-response assessment of the genotoxicity of isoflavones
3.2.2.1. Assessment of cytotoxicity
Genotoxicity may result from specific toxic processes, but also from secondary events due to
cytotoxicity. An assessment of cytotoxicity is needed for interpretation of genotoxicity results.
Only if genotoxicity is found at concentrations that do not cause overt cytotoxicity, such
genotoxicity response is considered positive and biologically significant.
The cytotoxicities of genistein, daidzein and equol were examined here using Neutral Red
uptake and BCA assays, in order to assess the ranges of concentrations suitable for
genotoxicity assays.
3.2.2.1.1. Cytotoxicity of daidzein in V79 cells
For the Neutral Red assay, concentrations of daidzein were chosen from 0 (solvent control) to
150 μM daidzein. Several sets of experiments were performed using a 96-well plate. A pre-
condition was a sufficient cell growth during 24 h before the test substance was added as
DMSO solution. The assessment was carried out considering the Neutral Red absorbance
values of the growth control and the solvent control rows in the 96-well plate (see Fig. 11);
the absorbance of the first measurement reflects the number of initial cells seeded, and the
absorbance of the second one reveals the number of cells at the end of the experiment that did
not receive an isoflavone treatment (See table 20 below). Figure 25 shows the data of one of
these experiments (Assay No 3 in Table 20); each point represents the mean of n= 8 ± SD (8
wells for each concentration). Within the concentration range tested for daidzein (25-150
μM), a very slight reduction of Neutral Red uptake was observed compared to the control,
resulting in an inhibition of 20 % at 100 µM (IC20 = 100 µM).
The more sensitive BCA assay was applied using a concentration range up to 150 μM. In a
typical experiment on one 96-well plate (Fig. 26 and Assay No 3 in Table 20) there was a
reduction in the cell protein content of about 20 % at 95 μM daidzein (IC20 = 95 µM), and a
reduction of about 30 % at 150 μM daidzein.
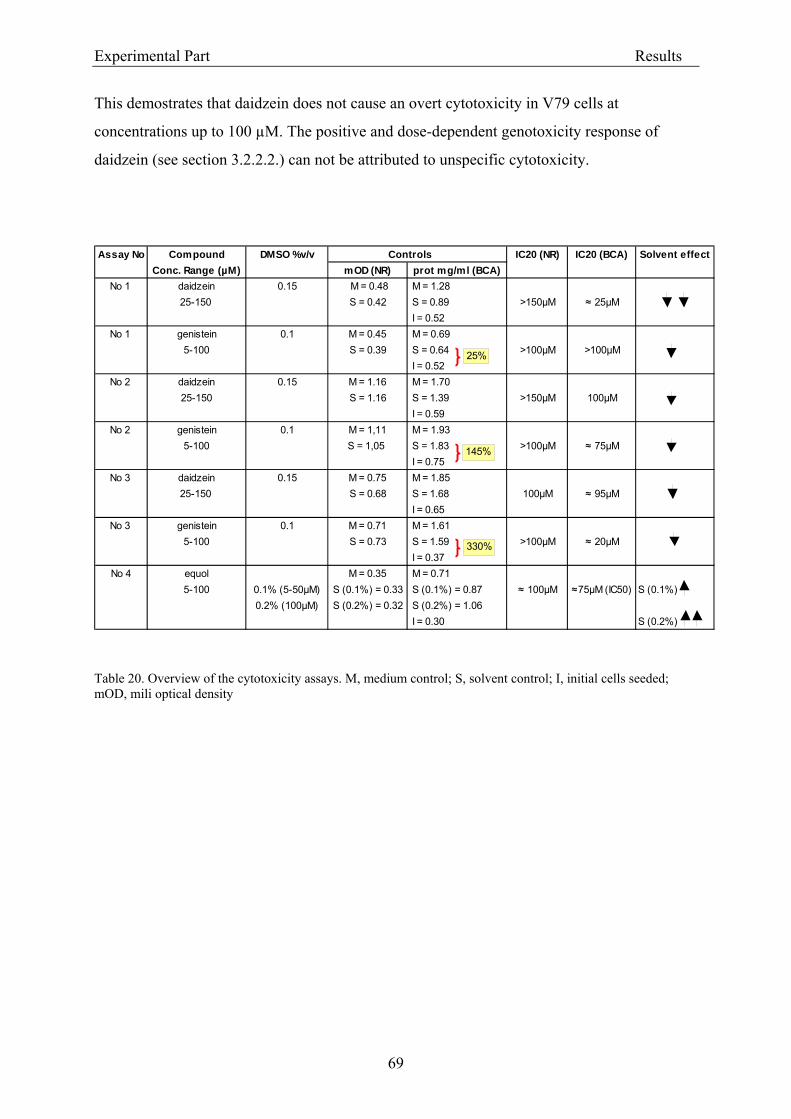
Experimental Part Results
69
This demostrates that daidzein does not cause an overt cytotoxicity in V79 cells at
concentrations up to 100 µM. The positive and dose-dependent genotoxicity response of
daidzein (see section 3.2.2.2.) can not be attributed to unspecific cytotoxicity.
Table 20. Overview of the cytotoxicity assays. M, medium control; S, solvent control; I, initial cells seeded; mOD, mili optical density
Assay No Compound DMSO %v/v Controls IC20 (NR) IC20 (BCA) Solvent effectConc. Range (µM) mOD (NR) prot mg/ml (BCA)
No 1 daidzein 0.15 M = 0.48 M = 1.28 25-150 S = 0.42 S = 0.89 >150µM ≈ 25µM
I = 0.52 No 1 genistein 0.1 M = 0.45 M = 0.69
5-100 S = 0.39 S = 0.64 >100µM >100µM I = 0.52
No 2 daidzein 0.15 M = 1.16 M = 1.7025-150 S = 1.16 S = 1.39 >150µM 100µM
I = 0.59No 2 genistein 0.1 M = 1,11 M = 1.93
5-100 S = 1,05 S = 1.83 >100µM ≈ 75µM I = 0.75
No 3 daidzein 0.15 M = 0.75 M = 1.8525-150 S = 0.68 S = 1.68 100µM ≈ 95µM
I = 0.65No 3 genistein 0.1 M = 0.71 M = 1.61
5-100 S = 0.73 S = 1.59 >100µM ≈ 20µM I = 0.37
No 4 equol M = 0.35 M = 0.715-100 0.1% (5-50µM) S (0.1%) = 0.33 S (0.1%) = 0.87 ≈ 100µM ≈75µM (IC50) S (0.1%)
0.2% (100µM) S (0.2%) = 0.32 S (0.2%) = 1.06 I = 0.30 S (0.2%)
145%
25%
330%
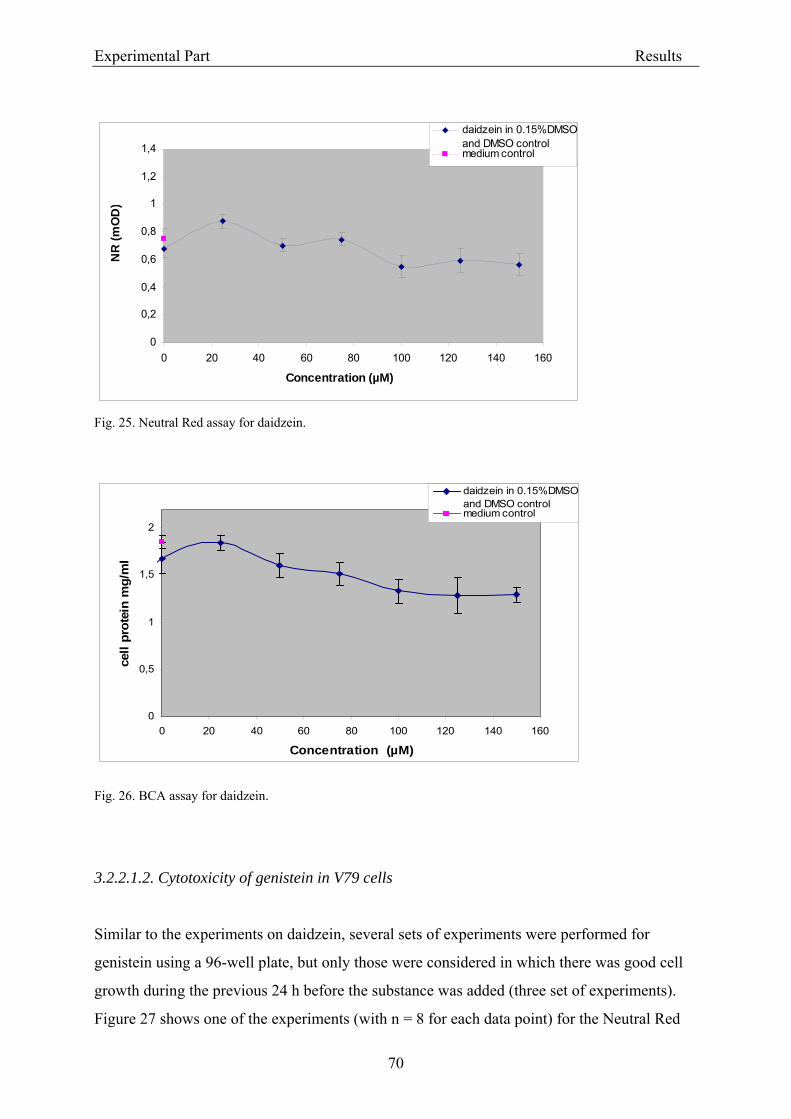
Experimental Part Results
70
Fig. 25. Neutral Red assay for daidzein. Fig. 26. BCA assay for daidzein.
3.2.2.1.2. Cytotoxicity of genistein in V79 cells
Similar to the experiments on daidzein, several sets of experiments were performed for
genistein using a 96-well plate, but only those were considered in which there was good cell
growth during the previous 24 h before the substance was added (three set of experiments).
Figure 27 shows one of the experiments (with n = 8 for each data point) for the Neutral Red
0
0,2
0,4
0,6
0,8
1
1,2
1,4
0 20 40 60 80 100 120 140 160
Concentration (µM)
NR
(mO
D)
daidzein in 0.15%DMSOand DMSO controlmedium control
0
0,5
1
1,5
2
0 20 40 60 80 100 120 140 160
Concentration (µM)
cell
prot
ein
mg/
ml
daidzein in 0.15%DMSOand DMSO controlmedium control
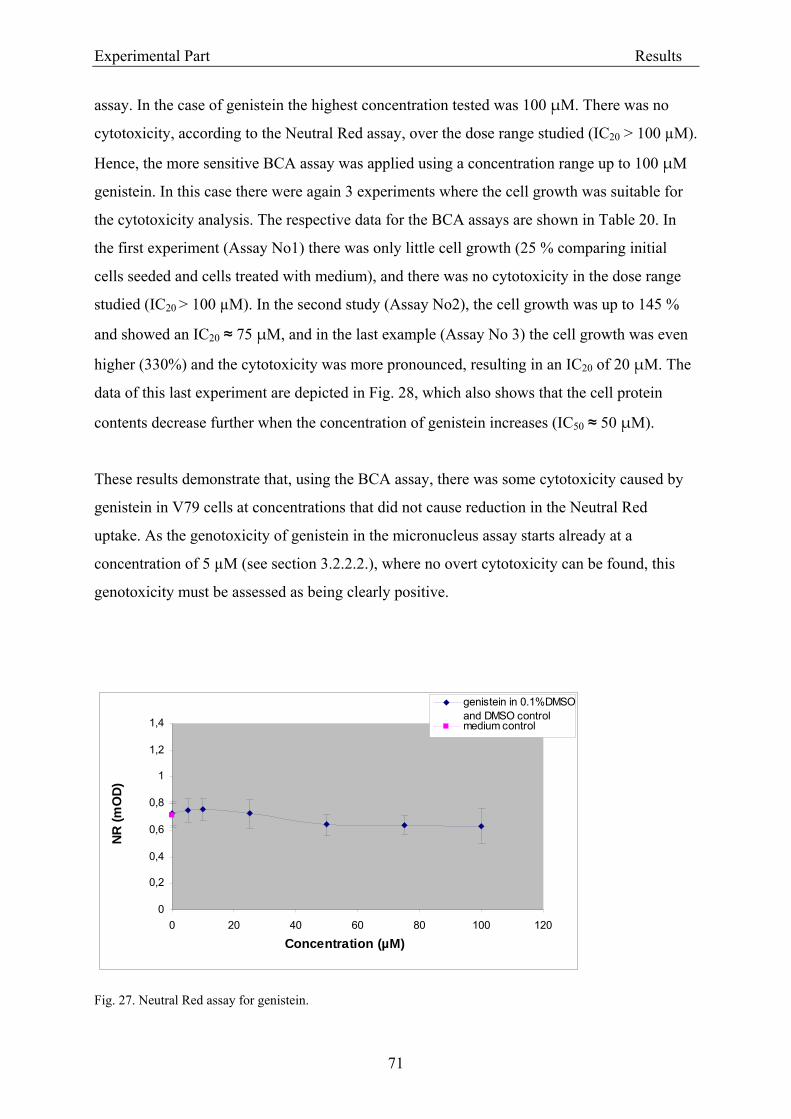
Experimental Part Results
71
assay. In the case of genistein the highest concentration tested was 100 μM. There was no
cytotoxicity, according to the Neutral Red assay, over the dose range studied (IC20 > 100 µM).
Hence, the more sensitive BCA assay was applied using a concentration range up to 100 μM
genistein. In this case there were again 3 experiments where the cell growth was suitable for
the cytotoxicity analysis. The respective data for the BCA assays are shown in Table 20. In
the first experiment (Assay No1) there was only little cell growth (25 % comparing initial
cells seeded and cells treated with medium), and there was no cytotoxicity in the dose range
studied (IC20 > 100 µM). In the second study (Assay No2), the cell growth was up to 145 %
and showed an IC20 ≈ 75 μM, and in the last example (Assay No 3) the cell growth was even
higher (330%) and the cytotoxicity was more pronounced, resulting in an IC20 of 20 μM. The
data of this last experiment are depicted in Fig. 28, which also shows that the cell protein
contents decrease further when the concentration of genistein increases (IC50 ≈ 50 μM).
These results demonstrate that, using the BCA assay, there was some cytotoxicity caused by
genistein in V79 cells at concentrations that did not cause reduction in the Neutral Red
uptake. As the genotoxicity of genistein in the micronucleus assay starts already at a
concentration of 5 µM (see section 3.2.2.2.), where no overt cytotoxicity can be found, this
genotoxicity must be assessed as being clearly positive.
Fig. 27. Neutral Red assay for genistein.
0
0,2
0,4
0,6
0,8
1
1,2
1,4
0 20 40 60 80 100 120
Concentration (µM)
NR
(mO
D)
genistein in 0.1%DMSOand DMSO controlmedium control
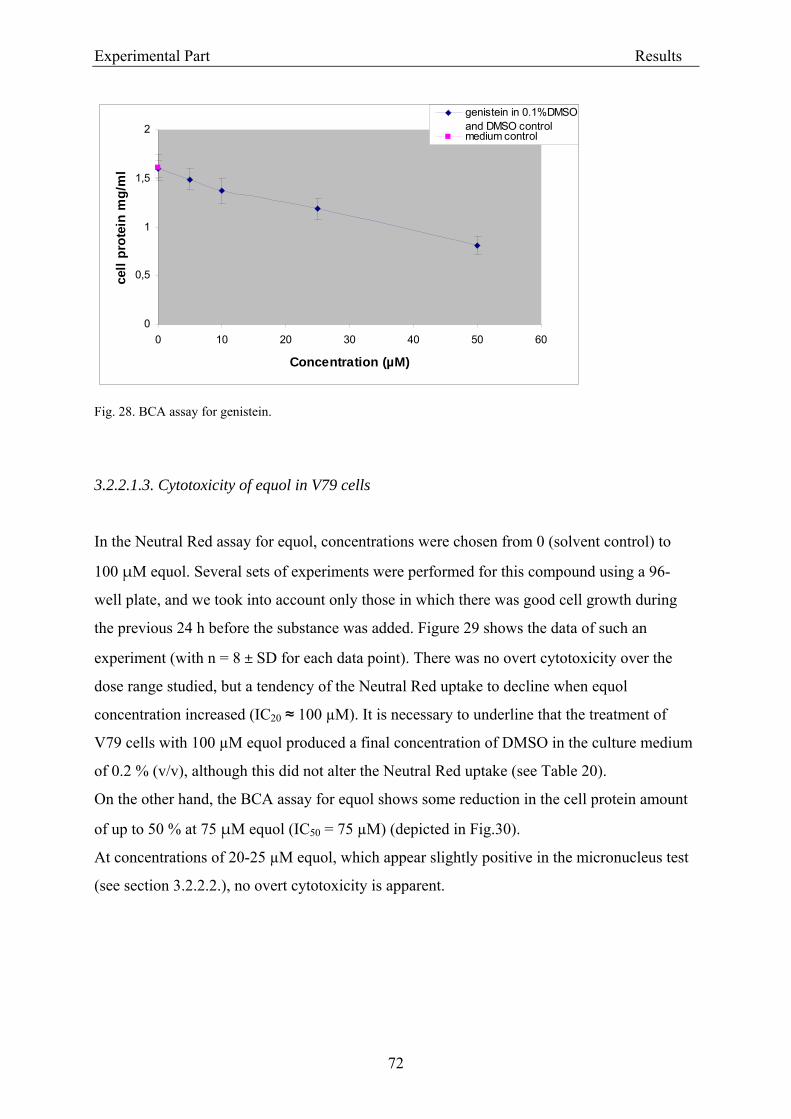
Experimental Part Results
72
Fig. 28. BCA assay for genistein.
3.2.2.1.3. Cytotoxicity of equol in V79 cells
In the Neutral Red assay for equol, concentrations were chosen from 0 (solvent control) to
100 μM equol. Several sets of experiments were performed for this compound using a 96-
well plate, and we took into account only those in which there was good cell growth during
the previous 24 h before the substance was added. Figure 29 shows the data of such an
experiment (with n = 8 ± SD for each data point). There was no overt cytotoxicity over the
dose range studied, but a tendency of the Neutral Red uptake to decline when equol
concentration increased (IC20 ≈ 100 µM). It is necessary to underline that the treatment of
V79 cells with 100 µM equol produced a final concentration of DMSO in the culture medium
of 0.2 % (v/v), although this did not alter the Neutral Red uptake (see Table 20).
On the other hand, the BCA assay for equol shows some reduction in the cell protein amount
of up to 50 % at 75 μM equol (IC50 = 75 µM) (depicted in Fig.30).
At concentrations of 20-25 µM equol, which appear slightly positive in the micronucleus test
(see section 3.2.2.2.), no overt cytotoxicity is apparent.
0
0,5
1
1,5
2
0 10 20 30 40 50 60
Concentration (µM)
cell
prot
ein
mg/
ml
genistein in 0.1%DMSOand DMSO controlmedium control
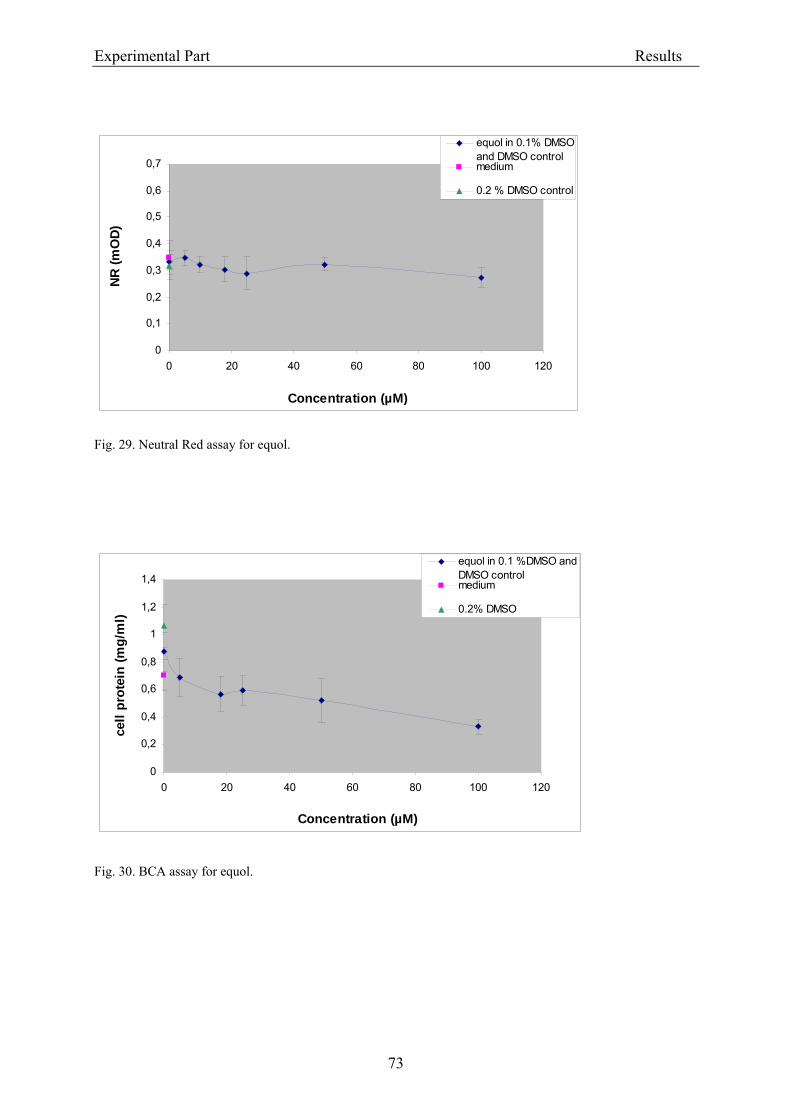
Experimental Part Results
73
Fig. 29. Neutral Red assay for equol.
Fig. 30. BCA assay for equol.
0
0,1
0,2
0,3
0,4
0,5
0,6
0,7
0 20 40 60 80 100 120
Concentration (µM)
NR (m
OD)
equol in 0.1% DMSOand DMSO controlmedium
0.2 % DMSO control
0
0,2
0,4
0,6
0,8
1
1,2
1,4
0 20 40 60 80 100 120
Concentration (µM)
cell
prot
ein
(mg/
ml)
equol in 0.1 %DMSO andDMSO controlmedium
0.2% DMSO
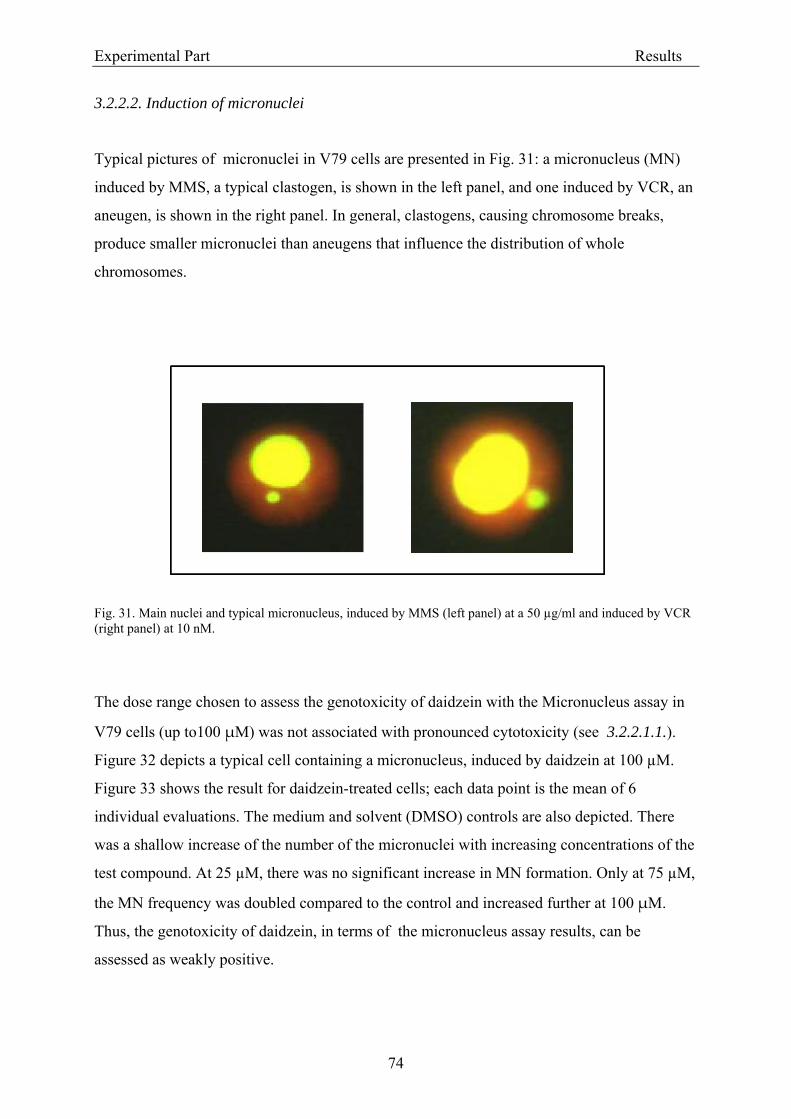
Experimental Part Results
74
3.2.2.2. Induction of micronuclei
Typical pictures of micronuclei in V79 cells are presented in Fig. 31: a micronucleus (MN)
induced by MMS, a typical clastogen, is shown in the left panel, and one induced by VCR, an
aneugen, is shown in the right panel. In general, clastogens, causing chromosome breaks,
produce smaller micronuclei than aneugens that influence the distribution of whole
chromosomes.
Fig. 31. Main nuclei and typical micronucleus, induced by MMS (left panel) at a 50 µg/ml and induced by VCR (right panel) at 10 nM.
The dose range chosen to assess the genotoxicity of daidzein with the Micronucleus assay in
V79 cells (up to100 μM) was not associated with pronounced cytotoxicity (see 3.2.2.1.1.).
Figure 32 depicts a typical cell containing a micronucleus, induced by daidzein at 100 µM.
Figure 33 shows the result for daidzein-treated cells; each data point is the mean of 6
individual evaluations. The medium and solvent (DMSO) controls are also depicted. There
was a shallow increase of the number of the micronuclei with increasing concentrations of the
test compound. At 25 µM, there was no significant increase in MN formation. Only at 75 µM,
the MN frequency was doubled compared to the control and increased further at 100 μM.
Thus, the genotoxicity of daidzein, in terms of the micronucleus assay results, can be
assessed as weakly positive.
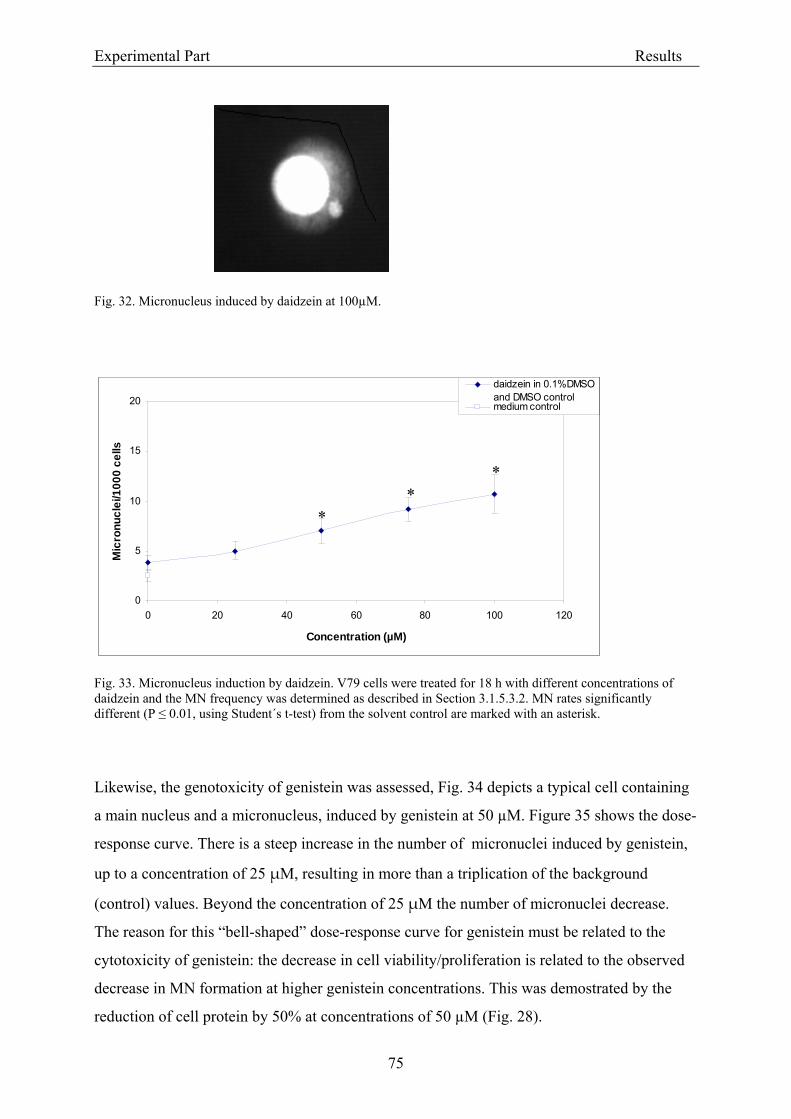
Experimental Part Results
75
Fig. 32. Micronucleus induced by daidzein at 100µM.
Fig. 33. Micronucleus induction by daidzein. V79 cells were treated for 18 h with different concentrations of daidzein and the MN frequency was determined as described in Section 3.1.5.3.2. MN rates significantly different (P ≤ 0.01, using Student´s t-test) from the solvent control are marked with an asterisk.
Likewise, the genotoxicity of genistein was assessed, Fig. 34 depicts a typical cell containing
a main nucleus and a micronucleus, induced by genistein at 50 µM. Figure 35 shows the dose-
response curve. There is a steep increase in the number of micronuclei induced by genistein,
up to a concentration of 25 μM, resulting in more than a triplication of the background
(control) values. Beyond the concentration of 25 μM the number of micronuclei decrease.
The reason for this “bell-shaped” dose-response curve for genistein must be related to the
cytotoxicity of genistein: the decrease in cell viability/proliferation is related to the observed
decrease in MN formation at higher genistein concentrations. This was demostrated by the
reduction of cell protein by 50% at concentrations of 50 µM (Fig. 28).
0
5
10
15
20
0 20 40 60 80 100 120
Concentration (µM)
Mic
ronu
clei
/100
0 ce
lls
daidzein in 0.1%DMSOand DMSO controlmedium control
**
*
0
5
10
15
20
0 20 40 60 80 100 120
Concentration (µM)
Mic
ronu
clei
/100
0 ce
lls
daidzein in 0.1%DMSOand DMSO controlmedium control
**
*
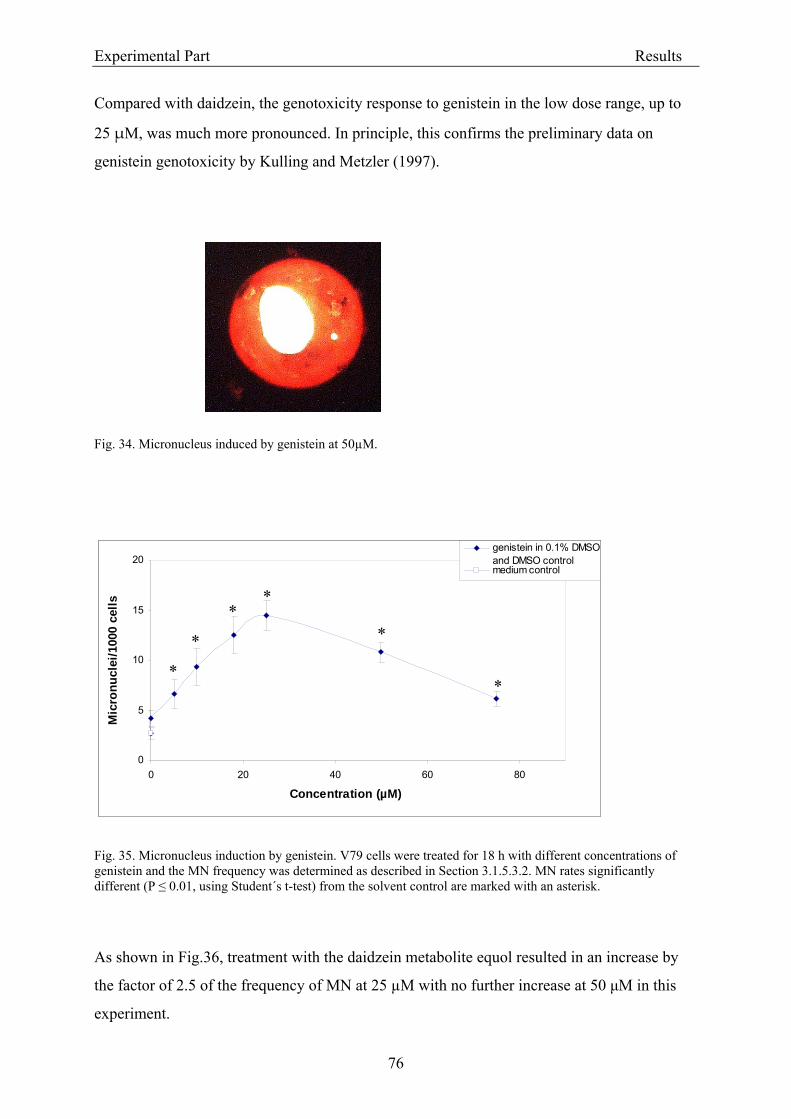
Experimental Part Results
76
Compared with daidzein, the genotoxicity response to genistein in the low dose range, up to
25 μM, was much more pronounced. In principle, this confirms the preliminary data on
genistein genotoxicity by Kulling and Metzler (1997).
Fig. 34. Micronucleus induced by genistein at 50µM.
Fig. 35. Micronucleus induction by genistein. V79 cells were treated for 18 h with different concentrations of genistein and the MN frequency was determined as described in Section 3.1.5.3.2. MN rates significantly different (P ≤ 0.01, using Student´s t-test) from the solvent control are marked with an asterisk.
As shown in Fig.36, treatment with the daidzein metabolite equol resulted in an increase by
the factor of 2.5 of the frequency of MN at 25 µM with no further increase at 50 µM in this
experiment.
0
5
10
15
20
0 20 40 60 80
Concentration (µM)
Mic
ronu
clei
/100
0 ce
lls
genistein in 0.1% DMSOand DMSO controlmedium control
*
*
**
*
*
0
5
10
15
20
0 20 40 60 80
Concentration (µM)
Mic
ronu
clei
/100
0 ce
lls
genistein in 0.1% DMSOand DMSO controlmedium control
*
*
**
*
*
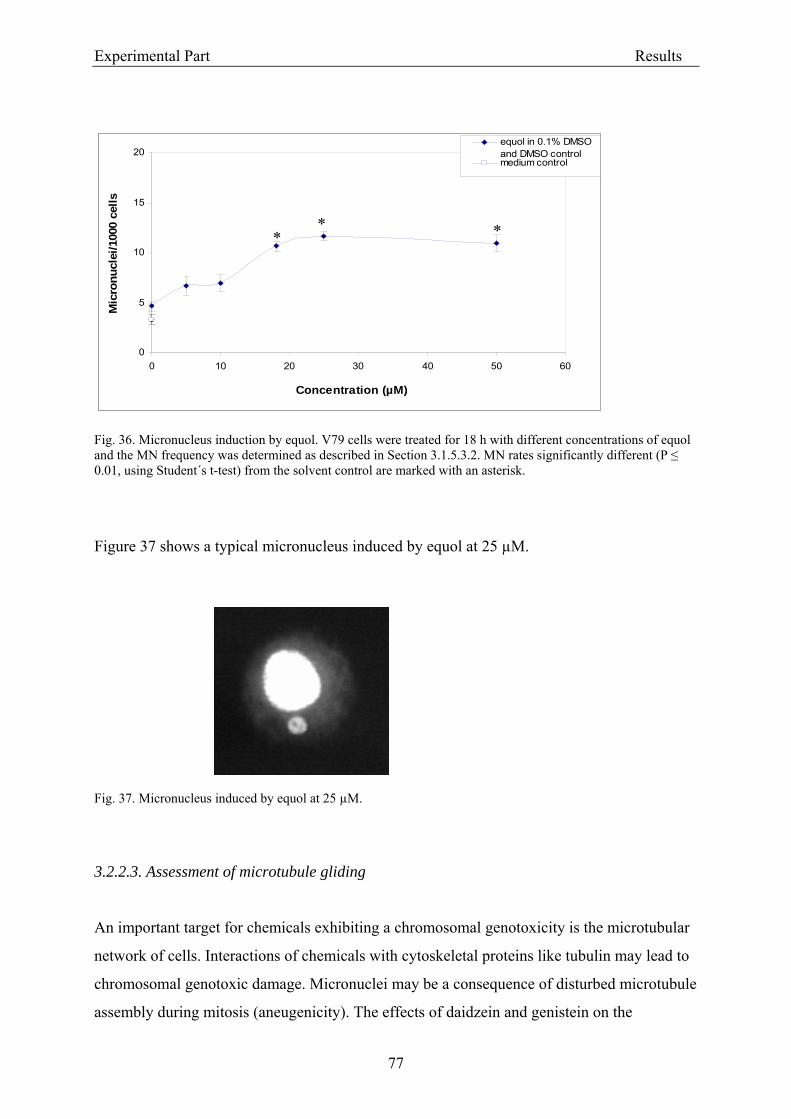
Experimental Part Results
77
Fig. 36. Micronucleus induction by equol. V79 cells were treated for 18 h with different concentrations of equol and the MN frequency was determined as described in Section 3.1.5.3.2. MN rates significantly different (P ≤ 0.01, using Student´s t-test) from the solvent control are marked with an asterisk.
Figure 37 shows a typical micronucleus induced by equol at 25 µM.
Fig. 37. Micronucleus induced by equol at 25 µM.
3.2.2.3. Assessment of microtubule gliding
An important target for chemicals exhibiting a chromosomal genotoxicity is the microtubular
network of cells. Interactions of chemicals with cytoskeletal proteins like tubulin may lead to
chromosomal genotoxic damage. Micronuclei may be a consequence of disturbed microtubule
assembly during mitosis (aneugenicity). The effects of daidzein and genistein on the
0
5
10
15
20
0 10 20 30 40 50 60
Concentration (µM)
Mic
ronu
clei
/100
0 ce
lls
equol in 0.1% DMSOand DMSO controlmedium control
** *
0
5
10
15
20
0 10 20 30 40 50 60
Concentration (µM)
Mic
ronu
clei
/100
0 ce
lls
equol in 0.1% DMSOand DMSO controlmedium control
** *
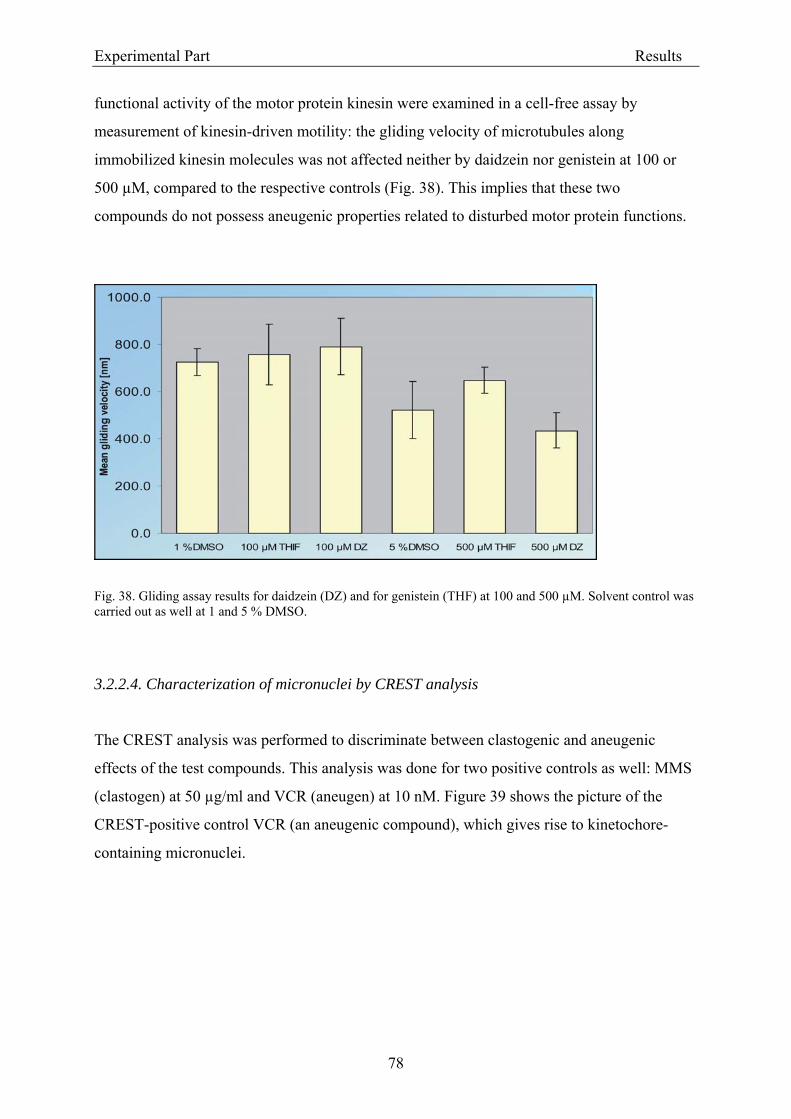
Experimental Part Results
78
functional activity of the motor protein kinesin were examined in a cell-free assay by
measurement of kinesin-driven motility: the gliding velocity of microtubules along
immobilized kinesin molecules was not affected neither by daidzein nor genistein at 100 or
500 µM, compared to the respective controls (Fig. 38). This implies that these two
compounds do not possess aneugenic properties related to disturbed motor protein functions.
Fig. 38. Gliding assay results for daidzein (DZ) and for genistein (THF) at 100 and 500 µM. Solvent control was carried out as well at 1 and 5 % DMSO.
3.2.2.4. Characterization of micronuclei by CREST analysis
The CREST analysis was performed to discriminate between clastogenic and aneugenic
effects of the test compounds. This analysis was done for two positive controls as well: MMS
(clastogen) at 50 µg/ml and VCR (aneugen) at 10 nM. Figure 39 shows the picture of the
CREST-positive control VCR (an aneugenic compound), which gives rise to kinetochore-
containing micronuclei.
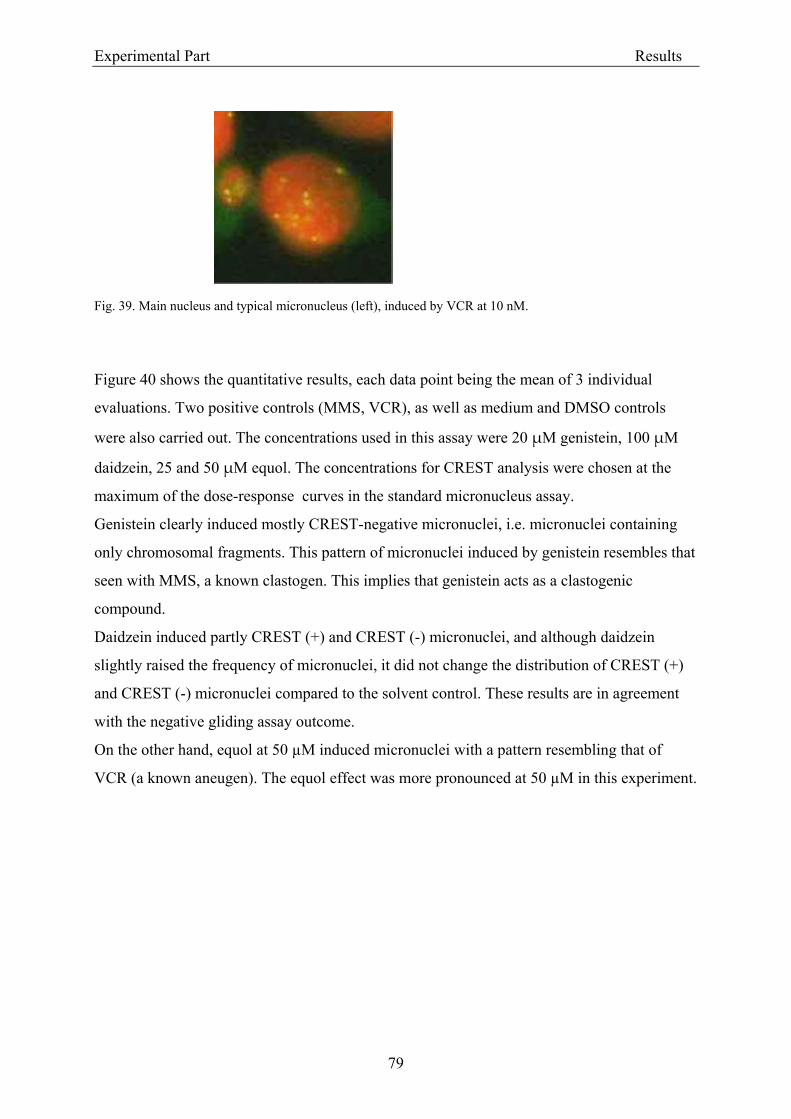
Experimental Part Results
79
Fig. 39. Main nucleus and typical micronucleus (left), induced by VCR at 10 nM.
Figure 40 shows the quantitative results, each data point being the mean of 3 individual
evaluations. Two positive controls (MMS, VCR), as well as medium and DMSO controls
were also carried out. The concentrations used in this assay were 20 μM genistein, 100 μM
daidzein, 25 and 50 μM equol. The concentrations for CREST analysis were chosen at the
maximum of the dose-response curves in the standard micronucleus assay.
Genistein clearly induced mostly CREST-negative micronuclei, i.e. micronuclei containing
only chromosomal fragments. This pattern of micronuclei induced by genistein resembles that
seen with MMS, a known clastogen. This implies that genistein acts as a clastogenic
compound.
Daidzein induced partly CREST (+) and CREST (-) micronuclei, and although daidzein
slightly raised the frequency of micronuclei, it did not change the distribution of CREST (+)
and CREST (-) micronuclei compared to the solvent control. These results are in agreement
with the negative gliding assay outcome.
On the other hand, equol at 50 µM induced micronuclei with a pattern resembling that of
VCR (a known aneugen). The equol effect was more pronounced at 50 µM in this experiment.
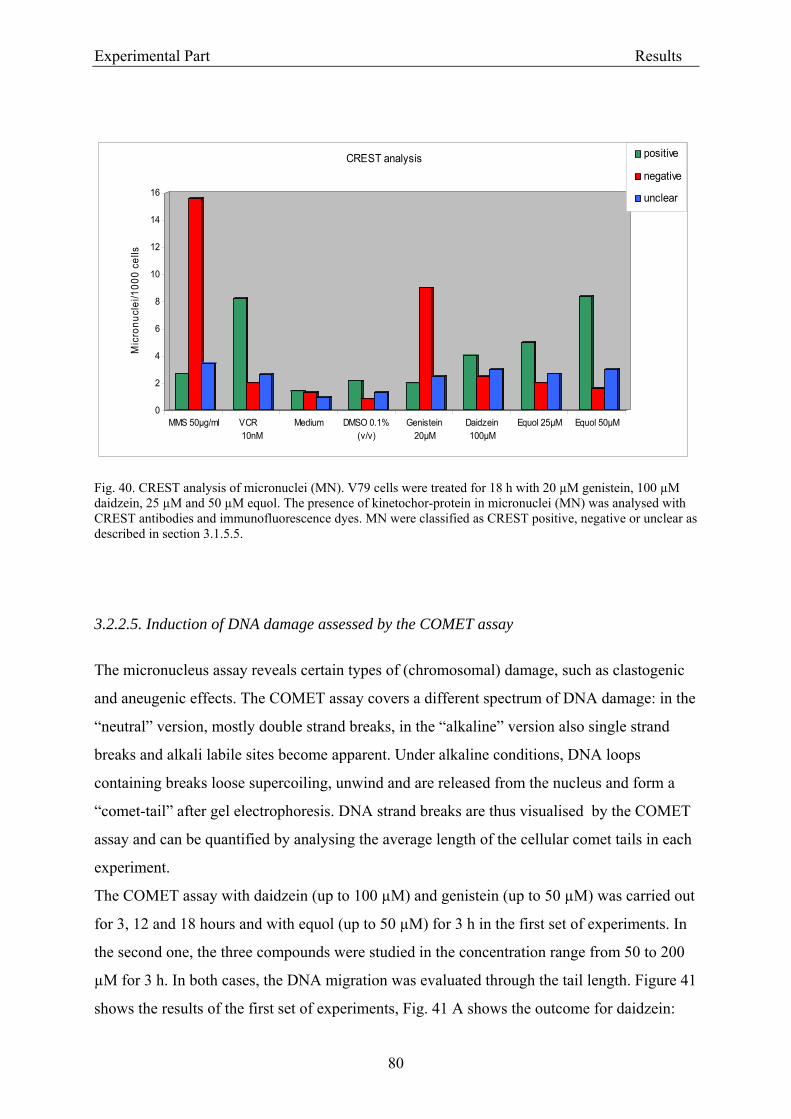
Experimental Part Results
80
Fig. 40. CREST analysis of micronuclei (MN). V79 cells were treated for 18 h with 20 µM genistein, 100 µM daidzein, 25 µM and 50 µM equol. The presence of kinetochor-protein in micronuclei (MN) was analysed with CREST antibodies and immunofluorescence dyes. MN were classified as CREST positive, negative or unclear as described in section 3.1.5.5. 3.2.2.5. Induction of DNA damage assessed by the COMET assay
The micronucleus assay reveals certain types of (chromosomal) damage, such as clastogenic
and aneugenic effects. The COMET assay covers a different spectrum of DNA damage: in the
“neutral” version, mostly double strand breaks, in the “alkaline” version also single strand
breaks and alkali labile sites become apparent. Under alkaline conditions, DNA loops
containing breaks loose supercoiling, unwind and are released from the nucleus and form a
“comet-tail” after gel electrophoresis. DNA strand breaks are thus visualised by the COMET
assay and can be quantified by analysing the average length of the cellular comet tails in each
experiment.
The COMET assay with daidzein (up to 100 µM) and genistein (up to 50 µM) was carried out
for 3, 12 and 18 hours and with equol (up to 50 µM) for 3 h in the first set of experiments. In
the second one, the three compounds were studied in the concentration range from 50 to 200
µM for 3 h. In both cases, the DNA migration was evaluated through the tail length. Figure 41
shows the results of the first set of experiments, Fig. 41 A shows the outcome for daidzein:
0
2
4
6
8
10
12
14
16
Mic
ronu
clei
/100
0 ce
lls
MMS 50µg/ml VCR 10nM
Medium DMSO 0.1%(v/v)
Genistein20µM
Daidzein100µM
Equol 25µM Equol 50µM
CREST analysis positive
negative
unclear
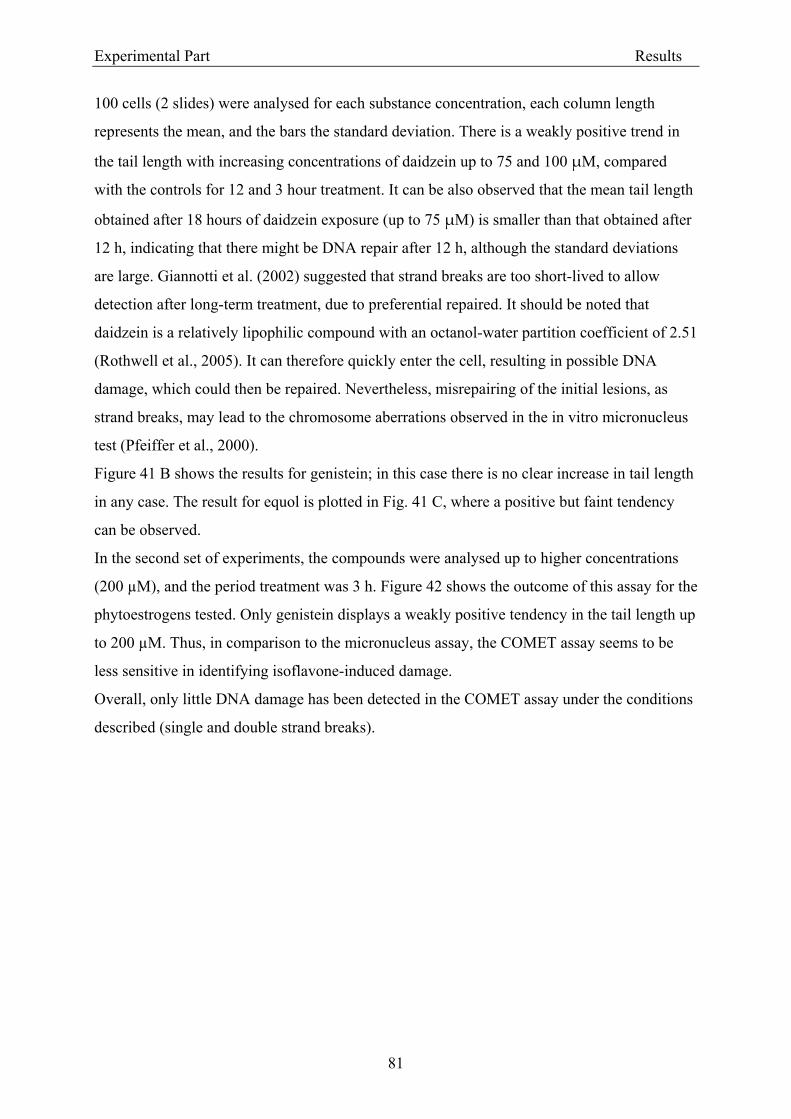
Experimental Part Results
81
100 cells (2 slides) were analysed for each substance concentration, each column length
represents the mean, and the bars the standard deviation. There is a weakly positive trend in
the tail length with increasing concentrations of daidzein up to 75 and 100 μM, compared
with the controls for 12 and 3 hour treatment. It can be also observed that the mean tail length
obtained after 18 hours of daidzein exposure (up to 75 μM) is smaller than that obtained after
12 h, indicating that there might be DNA repair after 12 h, although the standard deviations
are large. Giannotti et al. (2002) suggested that strand breaks are too short-lived to allow
detection after long-term treatment, due to preferential repaired. It should be noted that
daidzein is a relatively lipophilic compound with an octanol-water partition coefficient of 2.51
(Rothwell et al., 2005). It can therefore quickly enter the cell, resulting in possible DNA
damage, which could then be repaired. Nevertheless, misrepairing of the initial lesions, as
strand breaks, may lead to the chromosome aberrations observed in the in vitro micronucleus
test (Pfeiffer et al., 2000).
Figure 41 B shows the results for genistein; in this case there is no clear increase in tail length
in any case. The result for equol is plotted in Fig. 41 C, where a positive but faint tendency
can be observed.
In the second set of experiments, the compounds were analysed up to higher concentrations
(200 µM), and the period treatment was 3 h. Figure 42 shows the outcome of this assay for the
phytoestrogens tested. Only genistein displays a weakly positive tendency in the tail length up
to 200 µM. Thus, in comparison to the micronucleus assay, the COMET assay seems to be
less sensitive in identifying isoflavone-induced damage.
Overall, only little DNA damage has been detected in the COMET assay under the conditions
described (single and double strand breaks).
Experimental Part Results
82
A
B
C
Fig. 41. Induction of DNA damage (strand breaks) by daidzein (A), genistein (B) and equol (C). V79 cells were incubated with different concentrations of the isoflavones for 3, 12 and 18 hfor daidzein and genistein, and 3 h for equol, then the DNA strand breaks were analysed by single cell electrophoresis (COMET assay).
0
10
20
30
40
50
60
70
K2Cr2O7 50 µM medium DMSO 0.1%v/v daid 25 µM daid 50 µM daid 75 µM daid 100 µM
tail
leng
th (µ
m)
3 h treatment
12 h teatment
18 h treatment
0
10
20
30
40
50
60
70
K2Cr2O7 50 µM medium DMSO 0.1%v/v gen 5 µM gen 10 µM gen 18 µM gen 25 µM gen 50 µM
tail
leng
th (µ
m)
3 h treatment
12 h treatment
18 h treatment
0
10
20
30
40
50
60
70
K2Cr2O7 50 µM medium DMSO 0.5%v/v equol 5 µM equol 10 µM equol 18 µM equol 25 µM equol 50 µM
tail
leng
th (µ
m)
3 h treatment
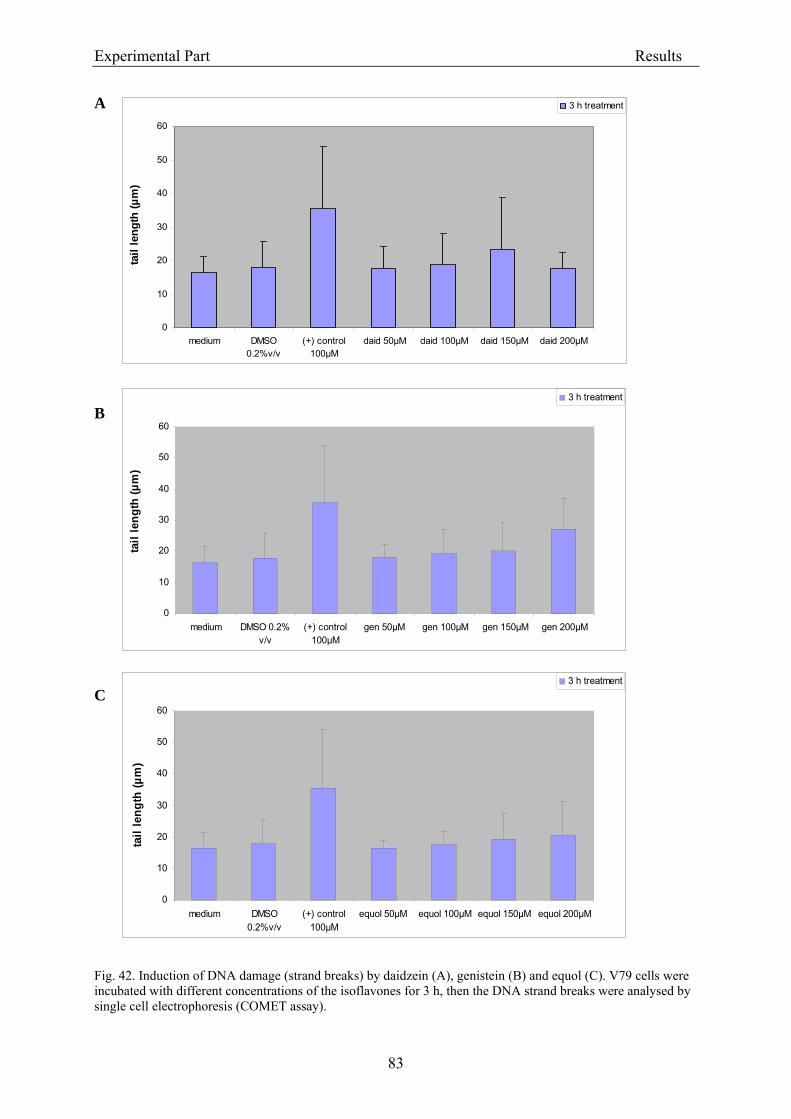
Experimental Part Results
83
A
B
C
Fig. 42. Induction of DNA damage (strand breaks) by daidzein (A), genistein (B) and equol (C). V79 cells were incubated with different concentrations of the isoflavones for 3 h, then the DNA strand breaks were analysed by single cell electrophoresis (COMET assay).
0
10
20
30
40
50
60
medium DMSO 0.2%v/v
(+) control100µM
gen 50µM gen 100µM gen 150µM gen 200µM
tail
leng
th (µ
m)
3 h treatment
0
10
20
30
40
50
60
medium DMSO0.2%v/v
(+) control100µM
equol 50µM equol 100µM equol 150µM equol 200µM
tail
leng
th (µ
m)
3 h treatment
0
10
20
30
40
50
60
medium DMSO0.2%v/v
(+) control100µM
daid 50µM daid 100µM daid 150µM daid 200µM
tail
leng
th (µ
m)
3 h treatment
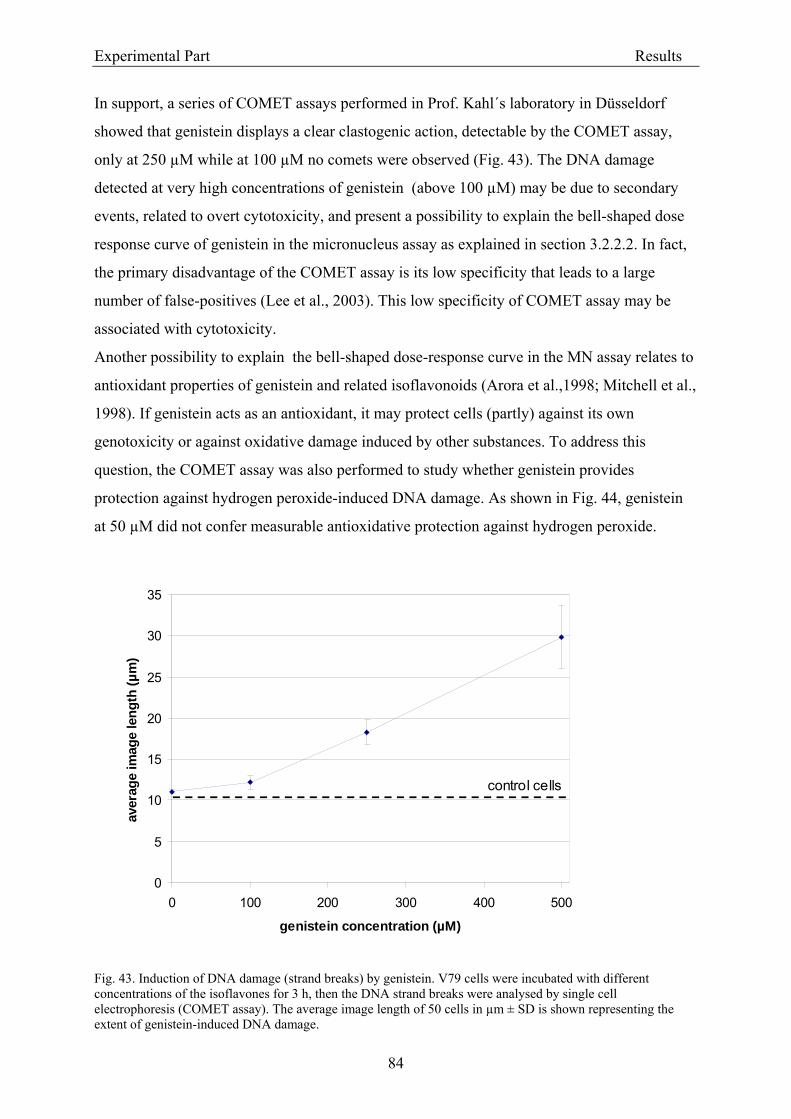
Experimental Part Results
84
In support, a series of COMET assays performed in Prof. Kahl´s laboratory in Düsseldorf
showed that genistein displays a clear clastogenic action, detectable by the COMET assay,
only at 250 µM while at 100 µM no comets were observed (Fig. 43). The DNA damage
detected at very high concentrations of genistein (above 100 µM) may be due to secondary
events, related to overt cytotoxicity, and present a possibility to explain the bell-shaped dose
response curve of genistein in the micronucleus assay as explained in section 3.2.2.2. In fact,
the primary disadvantage of the COMET assay is its low specificity that leads to a large
number of false-positives (Lee et al., 2003). This low specificity of COMET assay may be
associated with cytotoxicity.
Another possibility to explain the bell-shaped dose-response curve in the MN assay relates to
antioxidant properties of genistein and related isoflavonoids (Arora et al.,1998; Mitchell et al.,
1998). If genistein acts as an antioxidant, it may protect cells (partly) against its own
genotoxicity or against oxidative damage induced by other substances. To address this
question, the COMET assay was also performed to study whether genistein provides
protection against hydrogen peroxide-induced DNA damage. As shown in Fig. 44, genistein
at 50 µM did not confer measurable antioxidative protection against hydrogen peroxide.
Fig. 43. Induction of DNA damage (strand breaks) by genistein. V79 cells were incubated with different concentrations of the isoflavones for 3 h, then the DNA strand breaks were analysed by single cell electrophoresis (COMET assay). The average image length of 50 cells in µm ± SD is shown representing the extent of genistein-induced DNA damage.
0
5
10
15
20
25
30
35
0 100 200 300 400 500
genistein concentration (µM)
aver
age
imag
e le
ngth
(µm
)
control cells
0
5
10
15
20
25
30
35
0 100 200 300 400 500
genistein concentration (µM)
aver
age
imag
e le
ngth
(µm
)
control cells
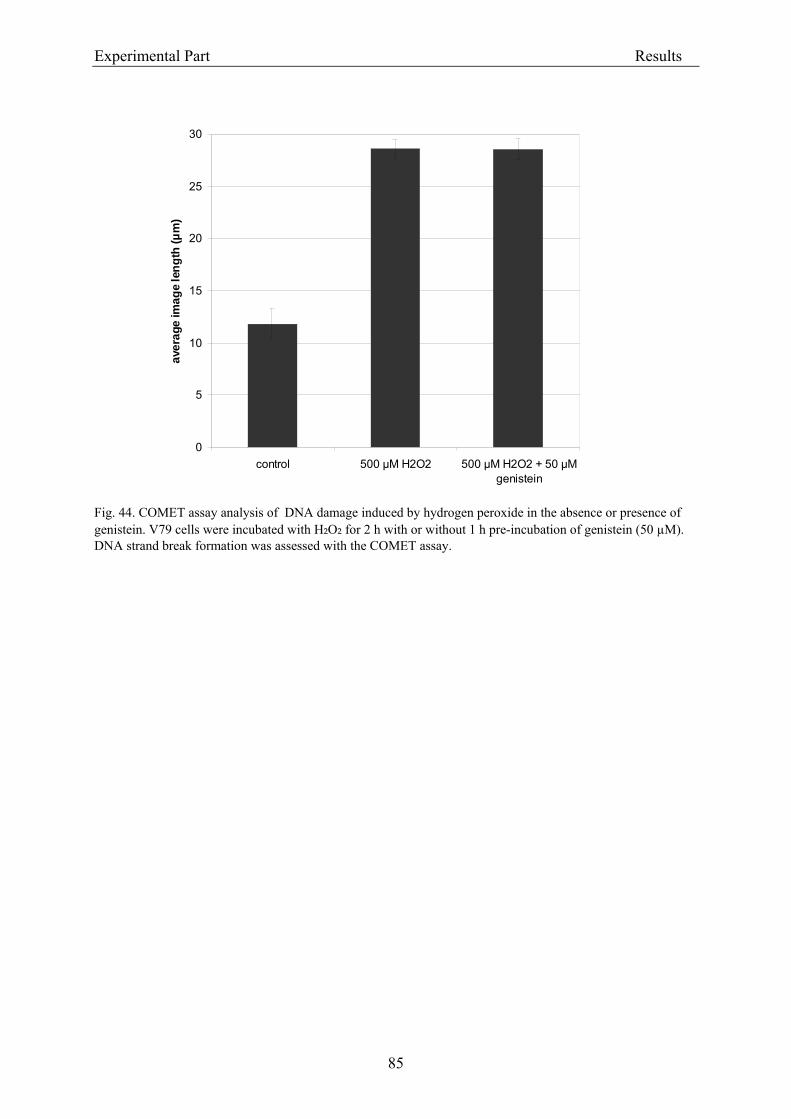
Experimental Part Results
85
Fig. 44. COMET assay analysis of DNA damage induced by hydrogen peroxide in the absence or presence of genistein. V79 cells were incubated with H₂O₂ for 2 h with or without 1 h pre-incubation of genistein (50 µM). DNA strand break formation was assessed with the COMET assay.
0
5
10
15
20
25
30
control 500 µM H2O2 500 µM H2O2 + 50 µMgenistein
aver
age
imag
e le
ngth
(µm
)
Experimental Part Discussion
86
3.3. Discussion 3.3.1. Analytical procedures
3.3.1.1. Analytical criteria for isoflavones
The aim of the present thesis work was to set into perspective the contents of the isoflavones
daidzein, genistein and the daidzein metabolite, equol, in human diet with the toxicity of these
compounds. In order to experimentally study the coherence of dietary exposure with resulting
blood concentrations, female Wistar rats were chosen as an animal model. Analysis of the
isoflavones daidzein and genistein by microbore HPLC was performed in dietary rodent chow
and in rodent plasma.
After suitable preparation of the samples, total isoflavone analysis in rodent diet and in rodent
plasma samples was performed with a microbore HPLC system with ultraviolet (UV)
detection. This was based on the method of Franke et al. (1994, 1995 and 1998), which was
slightly modified for the microbore scale to optimise the solvents used as mobile phase, the
flow rate and the gradient with regard to (i) selectivity, (ii) limits of detection, (iii)
reproducibility and (iv) recovery rates.
(i) The isoflavones daidzein and genistein in plasma and samples of rodent diet were
identified by comparison of the retention times with the respective standards and by spiking
with authentic compounds. Figures 17 and 18 show a HPLC chromatograms of rodent diet
and plasma samples, respectively, demonstrating adequate separation of the compounds from
both matrixes (see retention times in section 3.2.1.1.).
The calibration curves for the compounds analysed from plasma were linear over the
concentration range expected for this matrix (25-1500 ng/ml) as well as the calibration curves
of rodent diet samples (50-350 ng/ml).
(ii) The limits of detection for daidzein and genistein in both matrixes were previously
established using the same methods as presented here and published by Degen et al., 2002a.
For dietary analysis, the detection limit was 10 µg isoflavone/g feed and 20 ng isoflavone per
ml plasma.
(iii) The overall reproducibility of measurements of daidzein and genistein in plasma and
rodent diet using the HPLC method ranged from 2.1- 21.8 % (coefficient of variation for three
samples measured on three separate occasions). When genistein was analyzed, the mean CV%
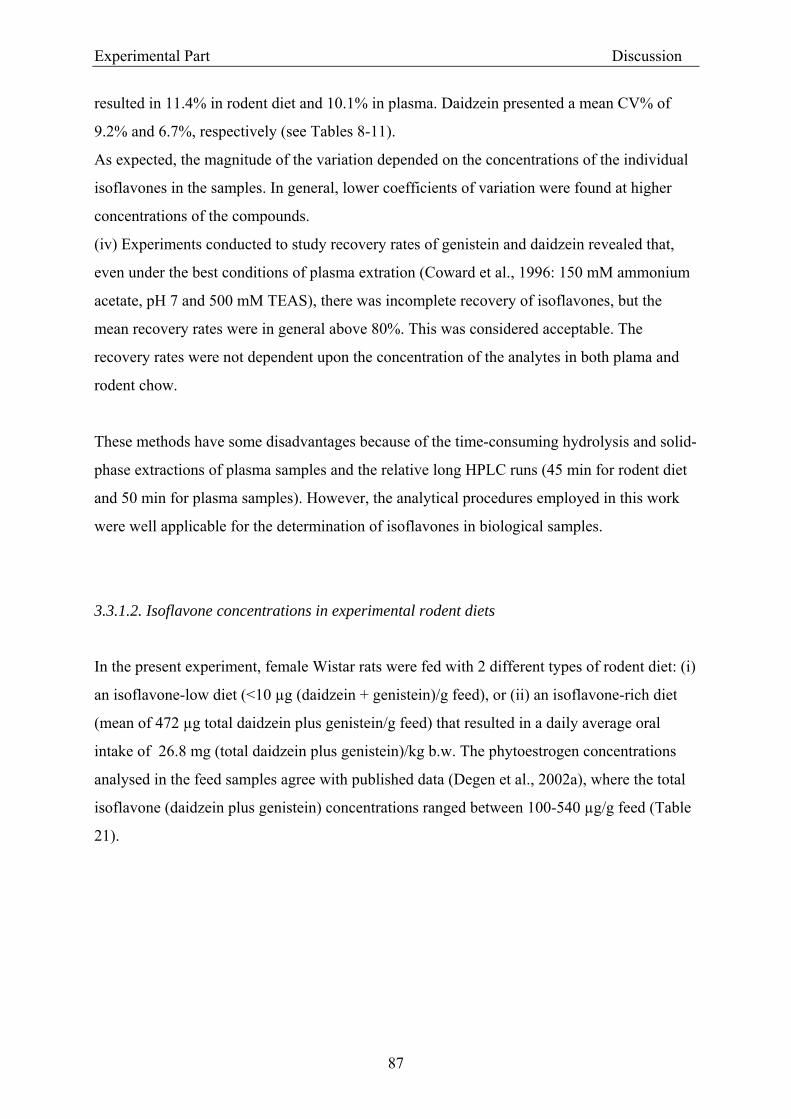
Experimental Part Discussion
87
resulted in 11.4% in rodent diet and 10.1% in plasma. Daidzein presented a mean CV% of
9.2% and 6.7%, respectively (see Tables 8-11).
As expected, the magnitude of the variation depended on the concentrations of the individual
isoflavones in the samples. In general, lower coefficients of variation were found at higher
concentrations of the compounds.
(iv) Experiments conducted to study recovery rates of genistein and daidzein revealed that,
even under the best conditions of plasma extration (Coward et al., 1996: 150 mM ammonium
acetate, pH 7 and 500 mM TEAS), there was incomplete recovery of isoflavones, but the
mean recovery rates were in general above 80%. This was considered acceptable. The
recovery rates were not dependent upon the concentration of the analytes in both plama and
rodent chow.
These methods have some disadvantages because of the time-consuming hydrolysis and solid-
phase extractions of plasma samples and the relative long HPLC runs (45 min for rodent diet
and 50 min for plasma samples). However, the analytical procedures employed in this work
were well applicable for the determination of isoflavones in biological samples.
3.3.1.2. Isoflavone concentrations in experimental rodent diets
In the present experiment, female Wistar rats were fed with 2 different types of rodent diet: (i)
an isoflavone-low diet (<10 µg (daidzein + genistein)/g feed), or (ii) an isoflavone-rich diet
(mean of 472 µg total daidzein plus genistein/g feed) that resulted in a daily average oral
intake of 26.8 mg (total daidzein plus genistein)/kg b.w. The phytoestrogen concentrations
analysed in the feed samples agree with published data (Degen et al., 2002a), where the total
isoflavone (daidzein plus genistein) concentrations ranged between 100-540 µg/g feed (Table
21).
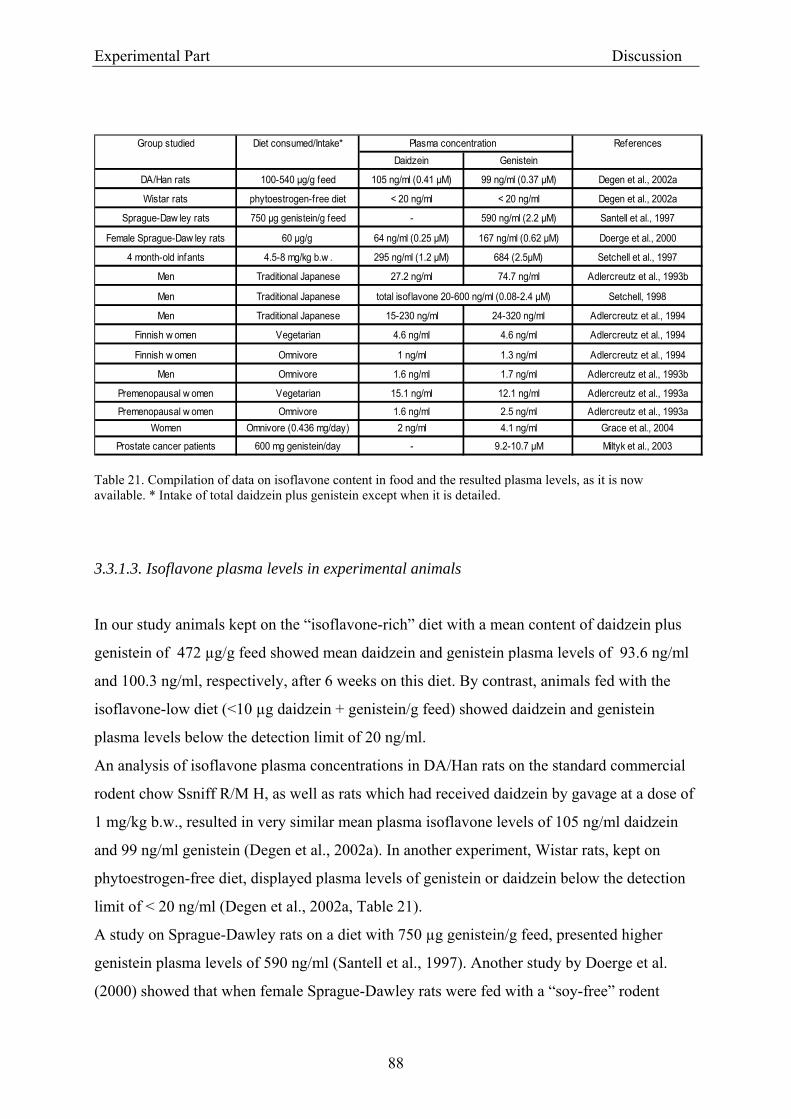
Experimental Part Discussion
88
Table 21. Compilation of data on isoflavone content in food and the resulted plasma levels, as it is now available. * Intake of total daidzein plus genistein except when it is detailed.
3.3.1.3. Isoflavone plasma levels in experimental animals
In our study animals kept on the “isoflavone-rich” diet with a mean content of daidzein plus
genistein of 472 µg/g feed showed mean daidzein and genistein plasma levels of 93.6 ng/ml
and 100.3 ng/ml, respectively, after 6 weeks on this diet. By contrast, animals fed with the
isoflavone-low diet (<10 µg daidzein + genistein/g feed) showed daidzein and genistein
plasma levels below the detection limit of 20 ng/ml.
An analysis of isoflavone plasma concentrations in DA/Han rats on the standard commercial
rodent chow Ssniff R/M H, as well as rats which had received daidzein by gavage at a dose of
1 mg/kg b.w., resulted in very similar mean plasma isoflavone levels of 105 ng/ml daidzein
and 99 ng/ml genistein (Degen et al., 2002a). In another experiment, Wistar rats, kept on
phytoestrogen-free diet, displayed plasma levels of genistein or daidzein below the detection
limit of < 20 ng/ml (Degen et al., 2002a, Table 21).
A study on Sprague-Dawley rats on a diet with 750 µg genistein/g feed, presented higher
genistein plasma levels of 590 ng/ml (Santell et al., 1997). Another study by Doerge et al.
(2000) showed that when female Sprague-Dawley rats were fed with a “soy-free” rodent
Group studied Diet consumed/Intake* Plasma concentration ReferencesDaidzein Genistein
DA/Han rats 100-540 µg/g feed 105 ng/ml (0.41 µM) 99 ng/ml (0.37 µM) Degen et al., 2002a
Wistar rats phytoestrogen-free diet < 20 ng/ml < 20 ng/ml Degen et al., 2002a
Sprague-Daw ley rats 750 µg genistein/g feed - 590 ng/ml (2.2 µM) Santell et al., 1997
Female Sprague-Daw ley rats 60 µg/g 64 ng/ml (0.25 µM) 167 ng/ml (0.62 µM) Doerge et al., 2000
4 month-old infants 4.5-8 mg/kg b.w . 295 ng/ml (1.2 µM) 684 (2.5µM) Setchell et al., 1997
Men Traditional Japanese 27.2 ng/ml 74.7 ng/ml Adlercreutz et al., 1993b
Men Traditional Japanese total isoflavone 20-600 ng/ml (0.08-2.4 µM) Setchell, 1998
Men Traditional Japanese 15-230 ng/ml 24-320 ng/ml Adlercreutz et al., 1994
Finnish w omen Vegetarian 4.6 ng/ml 4.6 ng/ml Adlercreutz et al., 1994
Finnish w omen Omnivore 1 ng/ml 1.3 ng/ml Adlercreutz et al., 1994
Men Omnivore 1.6 ng/ml 1.7 ng/ml Adlercreutz et al., 1993b
Premenopausal w omen Vegetarian 15.1 ng/ml 12.1 ng/ml Adlercreutz et al., 1993a
Premenopausal w omen Omnivore 1.6 ng/ml 2.5 ng/ml Adlercreutz et al., 1993aWomen Omnivore (0.436 mg/day) 2 ng/ml 4.1 ng/ml Grace et al., 2004
Prostate cancer patients 600 mg genistein/day - 9.2-10.7 µM Miltyk et al., 2003
Experimental Part Discussion
89
diets, containing 60 µg total isoflavones/g feed, the plasma levels in female rats were 64
ng/ml daidzein and 167 ng/ml genistein (Table 21).
Taking into account possible differences in toxicokinetics between different rat stains, the
present data are consistent with each other, confirming the coherence between dietary
exposure to soy isoflavones and the resulting isoflavone plasma levels.
3.3.2. Coherence of isoflavone exposure and plasma levels between experimental animals and
humans
In humans, exposure scenarios to daidzein and genistein present a general pattern similar to
that observed in experimental rodents, varying with dietary habits.
The nutritional uptake of these compounds is high in Japan and other East Asian countries
where traditionally a soy-rich diet is consumed, as well as in vegetarians in Western countries
where the uptake has been estimated to be 50-100 mg/day (Barnes et al., 1990, Adlercreutz et
al., 1991, Coward et al., 1993). In Japanese adults or in Westeners on a soy-supplemented
diet, resulting plasma levels of total isoflavones (daidzein plus genistein) were found between
40-500 ng/ml (0.15- 1.9 µM; Adlercreutz et al., 1993b; Adlercreutz et al., 1994; Cassidy
1996) or even higher, 20-600 ng/ml (Setchell, 1998, see Table 21).
By contrast, the intake of isoflavones is consistently lower in Westeners on an “omnivorous”
diet. In the UK, the intake of isoflavones has been estimated to be < 1 mg/day (Jones et al.,
1989), reflected by low isoflavone plasma levels of < 6 ng/ml (< 0.02 µM) (Grace et al.,
2004) as well as in omnivorous Finnish women (Adlercreutz et al., 1993a).
Other studies were performed in infants receiving soy-based formulas (the concentration of
isoflavones in such “soy milk” ranges between 32-47 µg/ml; Setchell et al., 1997). Exposure
to isoflavones of these babies appeared even higher than that found in Asian populations, at a
range of 4.5-8 mg/kg b.w. per day, with mean plasma concentrations of 295 ng/ml daidzein
and 684 ng/ml genistein.
The question of how human exposure scenarios fit to the dietary exposure data of isoflavones
in experimental rodents may be answered as follows. The total isoflavone intake per day for
the presently investigated isoflavone-rich rodent diet with mean contents of daidzein of 232
µg/g and of genistein of 240 µg/g is estimated at a daily feed consumption by rats of 20 g of
chow. Hence, the calculated daily intake per animal on the isoflavone-rich diet (IRD) was
Experimental Part Discussion
90
4.6 mg daidzein and 4.8 mg genistein, or 9.4 mg of total isoflavones. Animals on this
isoflavone-rich diet had a mean body weight of 350 g, resulting in a daily intake of 26.8 mg
total isoflavone/kg b.w. This dietary isoflavone exposure for rats was even higher than that of
humans consuming Asian-style food, and was also higher than that of infants on a soy-based
dietary formula (“soy milk”).
There is sufficient information on the isoflavone contents of human foods. In the UK,
Margaret Ritchie has established a database of isoflavone contents of more than 600 types of
foods, and she found that the dietary intakes were clearly reflected by the resulting isoflavone
concentrations in the plasma (Ritchie et al., 2004).
According to Ritchie et al. (2004), the correlation between dietary isoflavone intake (x [mg],
using duplicate diet analysis) and plasma concentrations (y [ng/ml]) was highly significant: y
= 9.08 x + 13.53; r = 0.92; P < 0.001. This was valid within a wide range of intakes, from 0 –
44 mg isoflavone per day.
When this relationship, based on data in humans, is used to predict the plasma concentrations
in the rats of the present study (i.e. an exposure level of 26.8 mg isoflavone/kg b.w. or 9.4 mg
per day), it results in an expected isoflavone plasma level of 99.2 ng/ml, while the measured
total isoflavone plasma concentrations were 193.9 and 142.2 ng/ml after 6 and 12 weeks of
dietary exposure, respectively. Considering the biological differences between the species,
this demonstrates a similar range of resulting plasma concentrations across the species, which
in turn confirmes the validity of animal experiments concerning the toxicokinetics of dietary
isoflavones.
3.3.3. Genotoxicity
3.3.3.1. Genotoxic vs. non-genotoxic mechanisms of chemical carcinogenicity
Chemical carcinogens are substances that cause tumours in humans and/or experimental
animals. Part of the chemical carcinogens are “non-genotoxic”. In this case, there is no direct
interaction of the compound or its metabolites with the genetic material (DNA), and the tumor
induction is triggered by other mechanisms, e.g. cell proliferation or receptor-mediated
mechanisms. On the other hand, tumours are often induced by genotoxic mechanisms, which
can be divided into three main categories:
Experimental Part Discussion
91
(i) Substances that produced single point mutations. Example of this type of genotoxic
damage are base-pair substitutions, addition or deletion of bases.
(ii) Substances that produce structural chromosomal aberrations. Major changes in structure
of chromosomes which are visible under the light microscope. Compounds eliciting such
effects are called clastogens. Such aberrations arise from breaks, deletions, exchange and
rearragement of the chromosomal material during the cell cycle.
(iii) Substances that cause aneuploidy. This term comprises abnormalities in the number of
chromosomes. Chemicals which cause aneuploidy are called aneugens. Aneuploidy may be
the result of the loss of a chromosome during cell division, or of an irregular distribution
(“non-disjuntion”) of the chromatids over two daughter cells. Potential targets for compounds
causing aneuploidy are spindle microtubules, centromeres, centrioles and centrosomes.
The evaluation of the nature of genotoxicity is important for the European classification and
labelling of chemicals as carcinogens and as mutagens. The present system of categorization
of carcinogens of the European Union used for the labelling of the chemicals implies 3
categories: category 1 comprises compounds of which the carcinogenicity has been proven by
human epidemiology, in category 2 compounds are listed of which carcinogenicity is based
on positive animal experimentation, and category 3 includes compounds with a suspicion of
carcinogenicity.
This system is presently being debated, and a proposal has been made by the Deutsche
Forschungsgemeinschaft (Neumann et al., 1998) for modifications, which gives more
consideration to modes of action of carcinogenicity.
For matters of standard setting, e.g. for residues of chemicals in food, it is important to know
whether a genotoxic/carcinogenic response of a chemical has a threshold or not. This has been
discussed very recently on several occasions (Hengstler et al. 2003, Bolt 2003).
In general, genotoxicity that is mediated by direct interaction of the chemical (or metabolites),
which is also associated with mutagenicity, is considered non-threshold, and a linear
extrapolation towards low doses is commonly applied. By contrast, genotoxic effects on
chromosomal aberrations or aneuploidy, due to chemical-protein interactions, may be
associated with a threshold. In this case, allowable safe doses may be derived from
experimental non-effects levels, by introducing safety margins.
There is almost general agreement that a distinction between genotoxic and non-genotoxic
compounds should be made when conducting assessment of cancer risk to humans.
Experimental Part Discussion
92
Non-genotoxic carcinogens are characterized by a conventional dose-response that allows
derivation of a no-observed-adverse-effect level (NOAEL). Insertion of an uncertainty (or
safety) factor permits the derivation of permissible exposure levels at which no relevant
human cancer risks are anticipated. The risk assessment approach for non-genotoxic
chemicals is generally similar among different regulatory bodies worldwide (Seeley et al.,
2001).
For genotoxic carcinogens, Streffer et al. (2004) have suggested several possibilities for
assessing carcinogenic risk. Positive data of chromosomal effects only, e.g., aneugenicity or
clastogenicity, in the absence of mutagenicity, may support the characterization of a
compound that produces carcinogenic effects only at high, toxic doses (Schoeny, 1996). For
instance, non-DNA-reactive genotoxicans, such as topoisomerase inhibitors (Lynch et al.,
2003) or inhibitors of the spindle apparatus or associated motor proteins (Decodier et al.,
2002), are considered in this respect. In these cases, relevant arguments have been put forward
in favour of the existence of practical thresholds (Crebelli, 2000; Parry et al., 2000).
Sometimes, a practical threshold may be quite low compared to existing environmental or
occupational exposures (Thier et al., 2003).
Moreover, genotoxicity (especially when of a local nature) may be relevant only under
conditions of sustained local tissue damage and associated increased cell proliferation.
Formaldahyde (Morgan, 1997) and vinyl acetate (Bogdanffy and Valentine, 2003) have been
noted as examples. In any case, the derivation of practical thresholds and, in consequence, of
health-based exposure limits, must be sufficiently justified.
3.3.3.2. Differentiation of carcinogens by mode of action, for the purpose of risk assessment
and standard setting
These ideas have been taken together and a practical distinction of carcinogens has been
proposed, with the following examples (Streffer et al., 2004, as summarized by Bolt et al.,
2004; see Fig. 45):
1. Non-threshold genotoxic carcinogens; for risk low-dose assessment, the linear non-
threshold (LNT) model appears appropiate. Regulations may be based on the principle
of as low as reasonably achievable (ALARA), technical feasibility, and other socio-
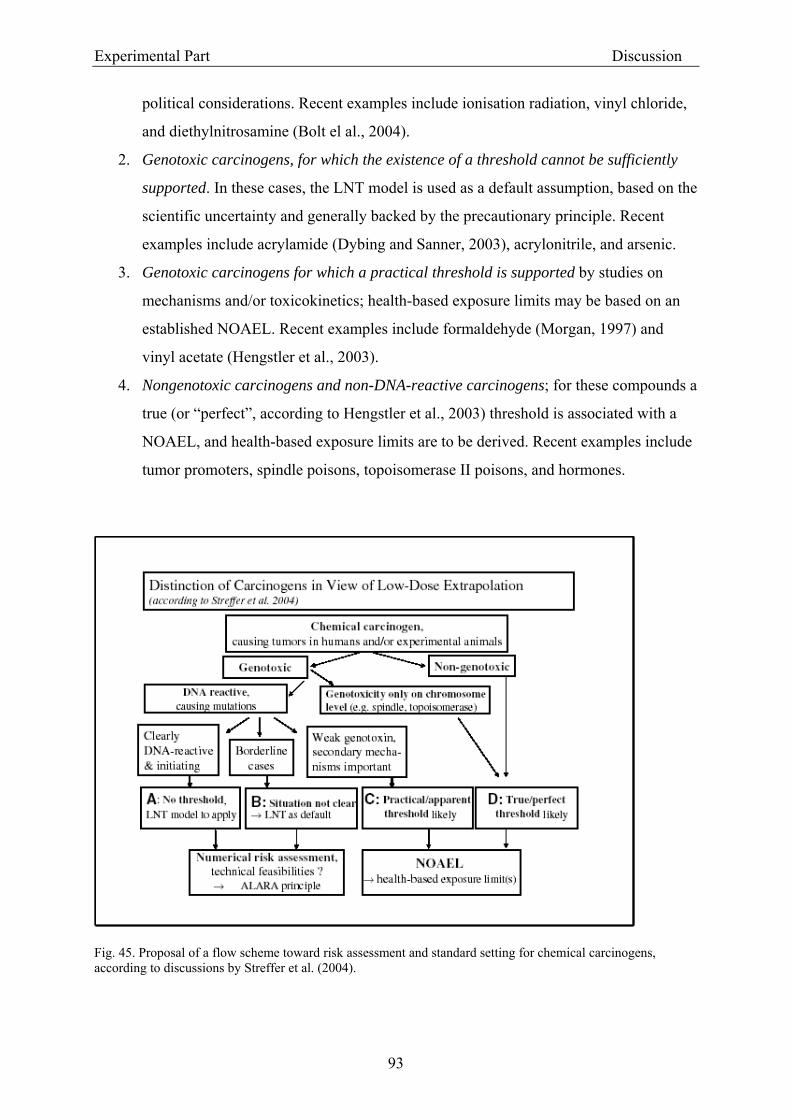
Experimental Part Discussion
93
political considerations. Recent examples include ionisation radiation, vinyl chloride,
and diethylnitrosamine (Bolt el al., 2004).
2. Genotoxic carcinogens, for which the existence of a threshold cannot be sufficiently
supported. In these cases, the LNT model is used as a default assumption, based on the
scientific uncertainty and generally backed by the precautionary principle. Recent
examples include acrylamide (Dybing and Sanner, 2003), acrylonitrile, and arsenic.
3. Genotoxic carcinogens for which a practical threshold is supported by studies on
mechanisms and/or toxicokinetics; health-based exposure limits may be based on an
established NOAEL. Recent examples include formaldehyde (Morgan, 1997) and
vinyl acetate (Hengstler et al., 2003).
4. Nongenotoxic carcinogens and non-DNA-reactive carcinogens; for these compounds a
true (or “perfect”, according to Hengstler et al., 2003) threshold is associated with a
NOAEL, and health-based exposure limits are to be derived. Recent examples include
tumor promoters, spindle poisons, topoisomerase II poisons, and hormones.
Fig. 45. Proposal of a flow scheme toward risk assessment and standard setting for chemical carcinogens, according to discussions by Streffer et al. (2004).
Experimental Part Discussion
94
For phytoestrogens, carcinogenic effects could be due to either genotoxicity, or to hormone-
mediated effects on target tissues. According to Streffer et al. (2004), to hormone-mediated
effects a clear threshold can be assigned. The same is true for topoisomerase II poisons.
Lynch et al. (2003) have discussed the genotoxicity of genistein and have ascribed this to
inhibition of topoisomerase II. Inhibition of topoisomerase II could result in DNA double-
strand breaks, which is compatible with the present results on clastogenicity of this
compound.
As a result of a discussion of this mode of action, Lynch et al. (2003) have proposed a
“pragmatic threshold” for clastogenicity of genistein (in L5178Y mouse lymphoma cells) in
the order of 1 µg/ml (3.7 µM).
Risk Assessment Part
95
4. RISK ASSESSMENT PART
In the assessment of the toxicological risks of chemicals to humans, relevant processes are
hazard identification, exposure assessment and risk assessment. For the regulatory handling,
also aspects of communication of risks of chemicals with the public are of importance.
For the phytoestrogens, both hormonal and genotoxic effects must be considered, as
mentioned in section 3.3.3.2. It has been discussed that thresholds for hormonal effects can
clearly be defined, and that thresholds for genotoxicity may be defined under certain
conditions.
In the following, this will be further elaborated, focussing on the compounds examined in this
thesis.
4.1. Hormonal activity of isoflavones
The typical hormonal effects of isoflavones are estrogenic effects at different target organs.
Tissue-specific estrogenic responses and underlying molecular mechanisms have been
discussed at large by Diel (2002). These receptor-mediated responses, imply that the existence
of a threshold, below which no such effects can occur.
Based on the uterotropic response (increase of the weight of the uterus in immature or
castrated animals) in different strains of rats, Diel et al. (2000) reported daily doses of
daidzein of 10 mg/kg b.w. and below to be without a hormonal effect. In most experimental
systems in vivo and in vitro, genistein and daidzein are about equipotent. A sensitive target
tissue regarding estrogenic effects is the epithelium of the vagina of castrated
(ovariectomized) rats; Fig. 46 shows an example based on the data of Diel et al. (2004). In
three different rat strains tested (DA/Han, Sprague-Dawley and Wistar), genistein caused a
clear dose-response in the thickness of the vaginal epithelial layer, at daily doses between 25
and 100 mg/kg b.w. A non-hormonal effect dose of 10 mg genistein/kg b.w. daily is
compatible with these data. According to the data of the present thesis, this non-hormonal
effect dose, when given repeatedly, is related to total genistein blood concentrations (free plus
conjugated combined) of about 100 ng/ml plasma, corresponding to a concentration of 0.37
µM.
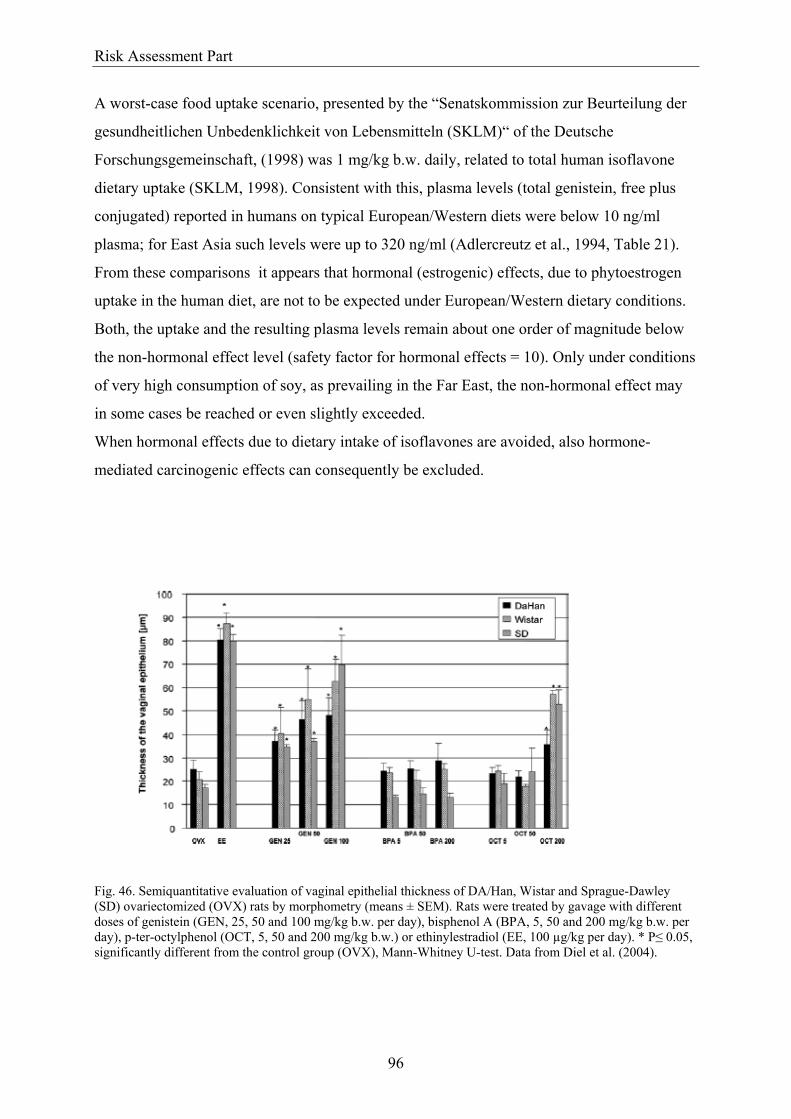
Risk Assessment Part
96
A worst-case food uptake scenario, presented by the “Senatskommission zur Beurteilung der
gesundheitlichen Unbedenklichkeit von Lebensmitteln (SKLM)“ of the Deutsche
Forschungsgemeinschaft, (1998) was 1 mg/kg b.w. daily, related to total human isoflavone
dietary uptake (SKLM, 1998). Consistent with this, plasma levels (total genistein, free plus
conjugated) reported in humans on typical European/Western diets were below 10 ng/ml
plasma; for East Asia such levels were up to 320 ng/ml (Adlercreutz et al., 1994, Table 21).
From these comparisons it appears that hormonal (estrogenic) effects, due to phytoestrogen
uptake in the human diet, are not to be expected under European/Western dietary conditions.
Both, the uptake and the resulting plasma levels remain about one order of magnitude below
the non-hormonal effect level (safety factor for hormonal effects = 10). Only under conditions
of very high consumption of soy, as prevailing in the Far East, the non-hormonal effect may
in some cases be reached or even slightly exceeded.
When hormonal effects due to dietary intake of isoflavones are avoided, also hormone-
mediated carcinogenic effects can consequently be excluded.
Fig. 46. Semiquantitative evaluation of vaginal epithelial thickness of DA/Han, Wistar and Sprague-Dawley (SD) ovariectomized (OVX) rats by morphometry (means ± SEM). Rats were treated by gavage with different doses of genistein (GEN, 25, 50 and 100 mg/kg b.w. per day), bisphenol A (BPA, 5, 50 and 200 mg/kg b.w. per day), p-ter-octylphenol (OCT, 5, 50 and 200 mg/kg b.w.) or ethinylestradiol (EE, 100 µg/kg per day). * P≤ 0.05, significantly different from the control group (OVX), Mann-Whitney U-test. Data from Diel et al. (2004).
Risk Assessment Part
97
4.2. Genotoxicity of isoflavones
Based on a set of preliminary data, Kulling and Metzler (1997) were the first to postulate
genotoxic properties of the phytoestrogen genistein. This was the reason to presently study
genistein, daidzein and the daidzein metabolite, equol, in vitro in V79 cells, for various
endpoints of chromosomal genotoxicity.
Both isoflavones, genistein and daidzein, were negative in the induction of hypoxanthine-
guanine-phosphoribosyltransferase (HPRT) point mutations (Kulling and Metzler, 1997).
Also the substances did not affect the cytoplasmic microtubule complex or the mitotic spindle
(Kulling and Metzler, 1997). However, genistein but not daidzein induced DNA strand
breaks, indicated by use of the “alkaline filter elution” technique; the induction of micronuclei
was also reported (Kulling and Metzler, 1997). The isoflavones were also studied in cultured
human peripheral blood lymphocytes (Kulling et al., 1999). Only genistein caused structural
chromosomal aberrations, at a concentration of 25 µM.
In accordance with these results, the data presented here show that both phytoestrogens,
genistein and daidzein, as well as the daidzein metabolite equol, display genotoxic properties
in vitro. The studies were carried out in estrogen receptor-negative Chinese hamster lung
fibroblasts (V79 cells), in order to avoid receptor-mediated (hormonal) effects (see section
3.1.5.1).
The genotoxic properties of the isoflavones genistein, daidzein and equol appear now well
characterised by a positive dose-dependent response in the micronucleus assay (see Fig. 33,
35 and 36). However, the quantities of these responses are different: at low concentrations (25
µM or less), the effects of genistein and, to a lesser effect, of equol are much more
pronounced than those of daidzein. The compounds also differ in the shape of their dose-
response curves; the genotoxicity of genistein in the micronucleus assay starts already at 5
µM and has a maximum at 25 µM. Higher concentrations (above 25 µM) of genistein lead to
decreasing genotoxicity in the micronucleus assay, in parallel with observed cytotoxicity,
which becomes more pronounced within this dose range.
It is generally accepted that estrogens stimulate cell proliferation in target tissues by receptor-
mediated mechanisms and may thereby act as tumour promoters. Earlier studies in Syrian
hamster embryo cells have shown that steroidal estrogens may lead to aneuploidy (Tsutsui et
al., 1983, 1987). In order to further study the mechanisms of micronuclei formation, several
experiments were conducted in the framework of the present thesis. The gliding velocity of
microtubules along immobilized kinesin molecules was investigated with daidzein and
Risk Assessment Part
98
genistein at 100 and 500 µM to study effects on the cytoskeleton and on motor protein
functions. But none of these isoflavones showed an effect in this direction. A lack of
aneuploidogenic potential was supported by the observation that no CREST-positive
micronuclei (i.e. micronuclei containing chromosomes/chromatids with kinetochores) were
induced by genistein. Daidzein showed a mixed response and the majority of the micronuclei
induced by the daidzein metabolite equol proved to be CREST-positive, pointing to a
predominantly aneugenic effect (see Fig. 40). This shows that differential modes of actions
should be operative, as far as the micronuclei induction by genistein and daidzein are
concerned.
The more recently developed COMET assay (single-cell electrophoresis) is an useful
additional technique to study cellular DNA damage. Single and double-strand breaks can be
observed under alkaline conditions. Clastogenic substances are supposed to induce breaks of
chromosomal material that might be detectable by the comet formation. However, only at
higher, cytotoxic concentrations (> 250 µM), genistein induced a damage detectable by this
technique. This may be due to a lower sensitivity of the COMET compared to the
micronucleus assay, in the detection of specific clastogenic effects.
In essence, the present data basically confirm the clastogenicity of genistein that has first been
postulated by Kulling and Metzler (1997). Furthermore, they show a quantitative difference in
potency between genistein and daidzein, and they also clearly indicate a genotoxic potential
for the isoflavone metabolite equol, a metabolite of daidzein that is found both in
experimental rodents (Setchell et al., 1984) and in humans (Rowland et al., 2000; Maubach et
al., 2003).
For matters of assessment of genotoxic risk, it appears from the present study that the
phytoestrogens in question must be seen differently; in the micronucleus assay, key results
were:
• Daidzein: statistically positive response between 50 and 100 µM
• Equol: statistically positive response between 20 and 25 µM
• Genistein: statistically positive response at 5 µM and higher (maximum at 25 µM)
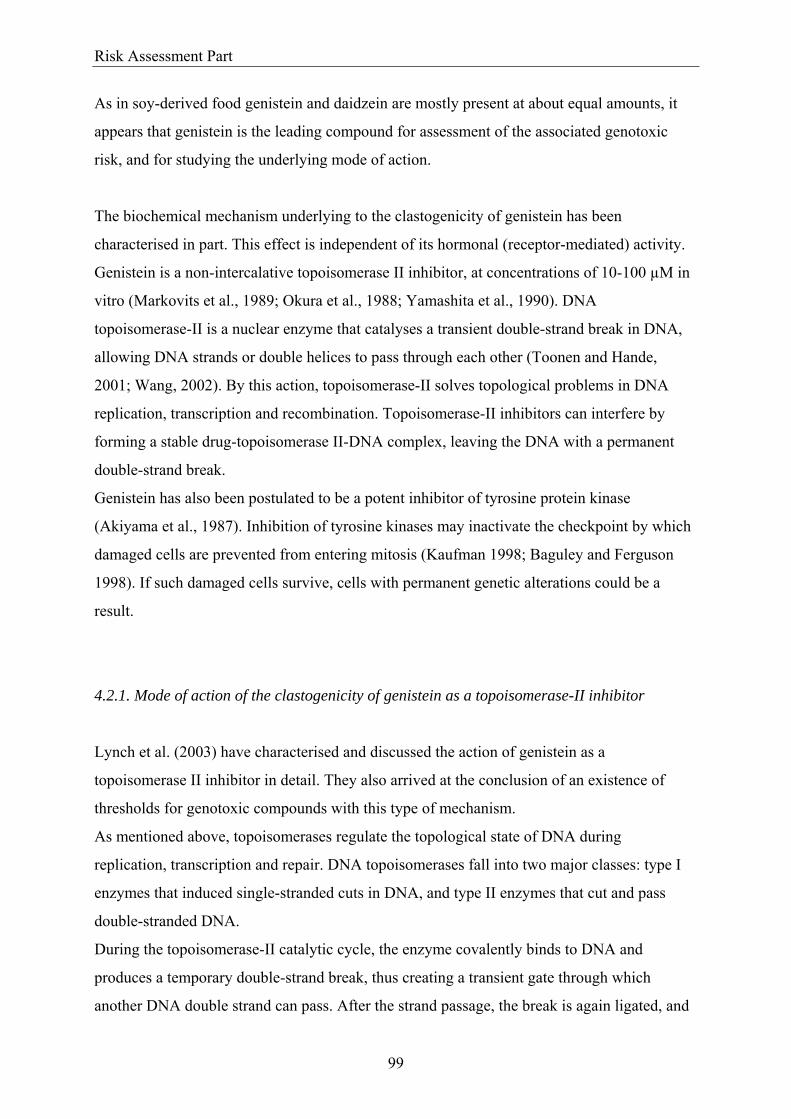
Risk Assessment Part
99
As in soy-derived food genistein and daidzein are mostly present at about equal amounts, it
appears that genistein is the leading compound for assessment of the associated genotoxic
risk, and for studying the underlying mode of action.
The biochemical mechanism underlying to the clastogenicity of genistein has been
characterised in part. This effect is independent of its hormonal (receptor-mediated) activity.
Genistein is a non-intercalative topoisomerase II inhibitor, at concentrations of 10-100 µM in
vitro (Markovits et al., 1989; Okura et al., 1988; Yamashita et al., 1990). DNA
topoisomerase-II is a nuclear enzyme that catalyses a transient double-strand break in DNA,
allowing DNA strands or double helices to pass through each other (Toonen and Hande,
2001; Wang, 2002). By this action, topoisomerase-II solves topological problems in DNA
replication, transcription and recombination. Topoisomerase-II inhibitors can interfere by
forming a stable drug-topoisomerase II-DNA complex, leaving the DNA with a permanent
double-strand break.
Genistein has also been postulated to be a potent inhibitor of tyrosine protein kinase
(Akiyama et al., 1987). Inhibition of tyrosine kinases may inactivate the checkpoint by which
damaged cells are prevented from entering mitosis (Kaufman 1998; Baguley and Ferguson
1998). If such damaged cells survive, cells with permanent genetic alterations could be a
result.
4.2.1. Mode of action of the clastogenicity of genistein as a topoisomerase-II inhibitor
Lynch et al. (2003) have characterised and discussed the action of genistein as a
topoisomerase II inhibitor in detail. They also arrived at the conclusion of an existence of
thresholds for genotoxic compounds with this type of mechanism.
As mentioned above, topoisomerases regulate the topological state of DNA during
replication, transcription and repair. DNA topoisomerases fall into two major classes: type I
enzymes that induced single-stranded cuts in DNA, and type II enzymes that cut and pass
double-stranded DNA.
During the topoisomerase-II catalytic cycle, the enzyme covalently binds to DNA and
produces a temporary double-strand break, thus creating a transient gate through which
another DNA double strand can pass. After the strand passage, the break is again ligated, and
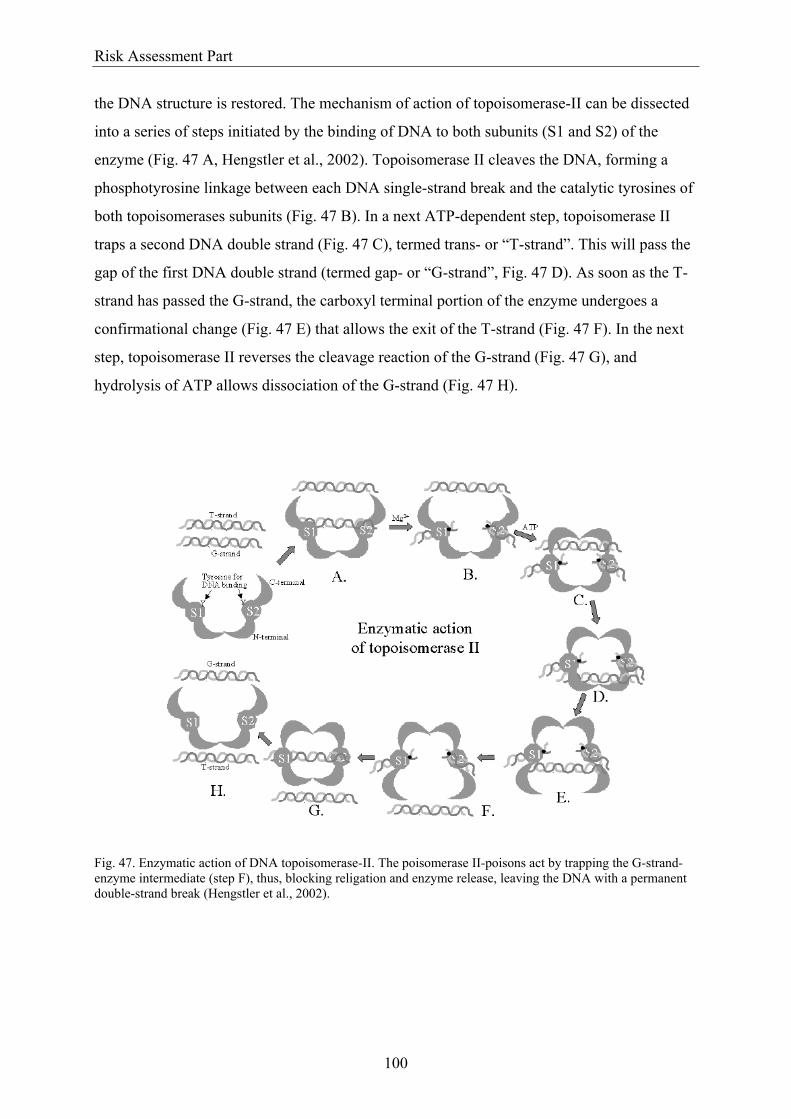
Risk Assessment Part
100
the DNA structure is restored. The mechanism of action of topoisomerase-II can be dissected
into a series of steps initiated by the binding of DNA to both subunits (S1 and S2) of the
enzyme (Fig. 47 A, Hengstler et al., 2002). Topoisomerase II cleaves the DNA, forming a
phosphotyrosine linkage between each DNA single-strand break and the catalytic tyrosines of
both topoisomerases subunits (Fig. 47 B). In a next ATP-dependent step, topoisomerase II
traps a second DNA double strand (Fig. 47 C), termed trans- or “T-strand”. This will pass the
gap of the first DNA double strand (termed gap- or “G-strand”, Fig. 47 D). As soon as the T-
strand has passed the G-strand, the carboxyl terminal portion of the enzyme undergoes a
confirmational change (Fig. 47 E) that allows the exit of the T-strand (Fig. 47 F). In the next
step, topoisomerase II reverses the cleavage reaction of the G-strand (Fig. 47 G), and
hydrolysis of ATP allows dissociation of the G-strand (Fig. 47 H).
Fig. 47. Enzymatic action of DNA topoisomerase-II. The poisomerase II-poisons act by trapping the G-strand-enzyme intermediate (step F), thus, blocking religation and enzyme release, leaving the DNA with a permanent double-strand break (Hengstler et al., 2002).
Risk Assessment Part
101
Numerous compounds are known to disrupt the DNA breakage-reunion cycle of mammalian
topoisomerase-II (Burden and Osheroff, 1998). They may either disrupt the catalytic cycle
(catalytic inhibitors) or stabilize the normally transient cleavage complex formed between the
enzyme and DNA (topoisimerase-II poisons). Whereas catalytic inhibitors disrupt the enzyme
physiology, topoisomerase-II poisons transform the enzyme into a potent cellular toxin
through the formation of stabilized cleavage complexes (SCCs) in which the enzyme remains
covalently bound to both strands of the DNA double strand break, leaving the DNA with a
permanent double strand break, that may lead to clastogenicity. Genistein induces, in a dose-
dependent manner, the formation of SCCs in mouse lymphoma cells, studied by the TARDIS
assay (“trapped in agarose DNA immunostaining”; Lynch et al., 2003).
An important implication of such an indirect (topoisomerase II-mediated) effect on DNA is
the concept of a threshold for clastogenicity; a “pragmatic” threshold can be considered as a
concentration below which any effect is considered biologically unimportant (Lutz, 1998).
This may be defined with the help of statistical tests (Lovell, 2000). A concentration-response
curve was determined for genistein using micronucleus induction as a measure of
clastogenicity (Lynch et al., 2003). A combination of hypothesis testing and estimation
(mathematical modelling) was used to resolve a “pragmatic” threshold for clastogenicity for
genistein, which resulted in 1 µg/ml (3.7 µM). In the present study, 5 µM genistein produced
the first statistically significant positive micronucleus response.
4.3. Genistein: threshold and associate margin of safety
According to Lynch et al. (2003) and supported by the present data, a pragmatic threshold of
genistein for clastogenicity would be at 1 µg/ml (3.7 µM). This is about one order of
magnitude higher than the blood levels of rats on isoflavone-rich diets in our investigation, or
of human populations in the Far East with a dietary preference of soy products. It is about two
orders of magnitude higher than plasma levels of European/Western populations under worst-
case conditions (generally < 10 ng/ml).
For the European population, this would imply a margin of safety of about 100 between
worst-case plasma levels and the possible beginning of a chromosomal genotoxic response.
This is usually considered sufficient.

Conclusions
103
5. CONCLUSIONS
There is a variety of existing data on potential uptake of isoflavones in the human diet and in
animal feed. Genistein and daidzein are the compounds that must be considered from a
quantitative point of view; both compounds are about equipotent considering their hormonal
(estrogenic) activities.
The available data on daily uptake of isoflavones with the human food have been evaluated
by the Deutsche Forschungsgemeinschaft (SKLM, 1998). For a European/Western-type diet,
a worst case uptake of 1 mg isoflavones (genistein plus daidzein) per kg body weight has been
presented. On the basis of these figures, the resulting plasma levels of genistein and daidzein,
and the toxicological effects discussed in this thesis, the following margins of safety (MOS)
are deduced:
• For hormonal (estrogenic) effects: MOS = 10
• For chromosomal genotoxicity (micronucleus test): MOS = 100
For both types of toxic effects a threshold can reasonably be deduced.
Under these conditions, there appears to be sufficient safety, given the usual patterns of
human food consumption in Europe.

Summary
105
6. SUMMARY
Hormonally active chemicals in the human diet, such as man-made estrogenic compounds or
plant-derived substances (phytoestrogens), have become a matter of public concern. A
significant part of human exposure to phytoestrogens is attributable to soy isoflavones. The
phytoestrogens genistein and daidzein are naturally occurring isoflavones, present in a
number of plants, especially in soybeans and soy-derived products.
In whole-animal models and in experimental systems in vitro, phytoestrogens appear capable
of acting both as partial estrogen agonists and as antagonists, the primary effects of which are
mediated via interaction with the estrogen receptor. Besides their estrogenic properties, soy
isoflavones also exert genotoxic actions. The aim of the present thesis work was to
characterize the genotoxicity risk of the isoflavones daidzein, genistein and the daidzein
metabolite, equol. Thus, an assessment of the human exposure was performed, based on
literature data and on an own investigation of the toxicokinetics. For this purpose, a study was
performed in rats to measure the blood levels of isoflavones, in relation to the dose that was
given orally. This relation was crucial for the calculation of effective blood concentrations in
relation to food intake. All the animals kept on a Ssniff Standard diet containing ~ 400 µg
total isoflavone/g chow showed isoflavone mean plasma levels of 202 and 221 ng/ml for
daidzein and genistein, respectively. The animals kept on an isoflavone-low diet (ILD, < 10
µg isoflavone/g feed) after 6 weeks showed a mean isoflavone plasma levels of 23.1 ng/ml
daidzein and non-detectable levels of genistein (< 20 ng/ml). After12 weeks, the ILD animals
presented non-detectable levels for both isoflavones analysed. The animals fed with an
isoflavone-rich diet (IRD, 472 µg total isoflavone/g chow) showed isoflavone plasma
concentrations of 100.3 ng/ml genistein and 93.6 ng/ml daidzein after 6 weeks and 78.4 ng/ml
genistein and 63.8 ng/ml daidzein after 12 weeks on this diet.
On the other hand, a hazard identification was done: a qualitative/quantitative description of
the possible effects of the substances. Again, the information on the known hormonal effects
of the compounds was taken from the literature, whereas experimental data on the dose-
response of genotoxicity and a characterization of the mode of action were generated as part
of this thesis. For this purpose, the micronucleus (MN) assay in V79 cells was used to study
chromosomal genotoxicity. Genistein caused a clear dose-related induction of MN within the
Summary
106
range of 5–25 µM; MN rates were declining at higher genistein concentrations. This was
probably due to cytotoxicity of genistein. Daidzein induced a comparatively shallow increase
in the number of MN between 25 and 100 µM. In contrast, the daidzein metabolite equol
caused an increase in the number of MN up to 25 µM with no further increase at higher
concentrations. In order to further study the mechanisms of micronuclei formation, several
experiments were conducted in the framework of the present thesis. The gliding velocity of
microtubules along immobilized kinesin molecules was investigated for daidzein and
genistein at 100 and 500 µM to study effects on the cytoskeleton and on motor protein
functions. But none of these isoflavones showed an effect in this direction. A lack of
aneuploidogenic potential was supported by the observation that no CREST-positive
micronuclei (i.e. micronuclei containing chromosomes/chromatids with kinetochores) were
induced by genistein. Daidzein showed a mixed response and the majority of the micronuclei
induced by the daidzein metabolite equol proved to be CREST-positive, pointing to a
predominantly aneugenic effect.
Clastogenic substances are supposed to induce breakages of chromosomal material that might
be detectable by the comet formation (COMET assay). However, only at higher, cytotoxic
concentrations (> 250 µM), genistein induced a damage detectable by this technique. This
may be due to a lower sensitivity of the COMET compared to the micronucleus assay, in the
detection of specific clastogenic effects.
In essence, the present data basically confirm the clastogenicity of genistein that had first
been postulated by Kulling and Metzler (1997). Furthermore, they show a quantitative
difference in potency between genistein and daidzein, and they also clearly indicate a
genotoxic potential for the isoflavone metabolite equol.
Finally, both aspects, possible human exposure and compound-related effects were put into a
perspective to arrive at a characterisation of the possible risk of genotoxicity for humans due
to phytoestrogen contents of human diet.
Based on uterotropic response, a non-hormonal daily effect dose of 10 mg/kg b.w. was
established. This non-effect dose is related to a total genistein plasma level of about 100
ng/ml. Both, the uptake and the resulting plasma levels remain about one order of magnitude
below the non-hormonal effect level (safety factor for hormonal effects = 10).
The biochemical mechanism underlying to the clastogenicity of genistein has been
characterised in part. Genistein is a non-intercalative topoisomerase II inhibitor, at
Summary
107
concentrations of 10-100 µM in vitro. Lynch et al. (2003) arrived at the conclusion of a
possible existence of thresholds for genotoxic compounds with this type of mechanism. A
“pragmatic” threshold can be considered as a concentration below which any effect is
considered biologically unimportant. For genistein a pragmatic threshold for clastogenicity
resulted in 1 µg/ml (3.7 µM). This is about one order of magnitude higher than the blood
levels of rats on isoflavone-rich diets in our investigation, or of human populations in the Far
East with a dietary preference of soy products. It is about two orders of magnitude higher than
plasma levels of European/Western populations under worst-case conditions (generally < 10
ng/ml). For the European population, this would imply a margin of safety of about 100
between worst-case plasma levels and the possible beginning of a chromosomal genotoxic
response. Such a margin of safety is usually considered sufficient.

References
109
7. REFERENCES
Adlercreutz H., Fotsis T., Bannwart C., Wähäla K., Mäkela T., Brunow G., Hase T.
(1986). Determination of urinary lignans and phytoestrogens metabolites, potential
antiestrogens and anticarcinogens, in urine of women on various habitual diets. J. Steroid
Biochem. 25, 791-797.
Adlercreutz H., Honjo H., Higashi A., Fotsis T., Hamalainen E., Hasegawa T., Okada H.
(1991). Urinary excretion of lignans and isoflavonoid phytoestrogens in Japanese men and
women consuming a traditional Japanese diet. Am. J. Clin. Nutr. 54, 1093-1100.
Adlercreutz H.A., Fotsis T., Lampe J., Wähäla K., Brunow G., Hase T. (1993a).
Quantitative determination of lignans and isoflavonoids in plasma of omnivorous and
vegetarian women by isotope dilution gas chromatography-mass spectrometry. Scand. J.
Clin. Lab. Invest. (Suppl. 215) 53, 5-18.
Adlercreutz H.A., Makkanen H., Watanabe S. (1993b). Plasma concentration of
Phytoestrogens in Japanese men. Lancet 342, 1209-1210.
Adlercreutz H.A., Fotsis T., Watanabe S., Lampe J., Wähäla K., Mäkela T., Hase T.
(1994). Determination of lignans and isoflavonoids in plasma by isotope dilution gas
chromatography-mass spectrometry. Cancer Detect.Prev.18(4), 259-271.
Adlercreutz H., Goldin B.R., Gorbach S.L., Höckerstedt K.A.V., Watanabe S. et al.
(1995). Soybean phytoestrogen intake and cancer risk. J. Nutr. 125, 757-770S.
Akiyama T., Ishida J., Nakagava S., Ogawara S., Watanabe S., Itoh N., Shiyba M.,
Fukami Y. (1987). Genistein, a specific inhibitor of tyrosine-specific protein kinases. J.
Biol. Chem. 262, 5592-5595.
Andlauer W., Kolb J., Furst P. (2000). Absorption and metabolism of genistein in the
isolated rat small intestine. FEBS Letters 475, 127.
References
110
Arora A., Nair M.G., Straburg G.M. (1998). Antioxidant activities of isoflavones and their
biological metabolites in a liposomal system. Arch. Biochem. Biophys. 356, 133-141.
Axelson M.and Setchell K.D.R. (1981). The excretion of lignans in rats: evidence for an
intestinal bacterial source of this new group of compounds. FEBS Lett. 123, 337-342.
Back D.J., Bolt H.M., Breckenridge A.M., Crawford F.E., Orme M.L.E., Rowe P.H.,
Schindler A.E. (1980). The pharmacokinetics of a large (3 mg) oral dose of
ethinylestradiol in women. Contraception 21, 145-153.
Baguley B.C. and Ferguson L.R. (1998). Mutagenic properties of topoisomerase-targeted
drugs. Biochem. Biophys. Acta 1400, 213-222.
Barnes S., Grubbs C., Setchell K.D.R., Carlson J. (1990). Soyabeans inhibit mammary
tumor growth in breast cancer. Mutagens and Carcinogens in the Diet, pp 239-253. New
York: Wiley-Liss.
Block S.M., Goldstein L.S., Schnapp B.J. (1990). Bead movement by single kinesin
molecules studied with optical tweezers. Nature 348: 348-352.
Bogdanffy M.S. and Valentine R. (2003). Differentiating between local cytotoxicity,
mitogenesis, and genotoxicity in carcinogen risk assessment : The case of vinyl acetate.
Toxicol. Lett. 140/141, 83-98.
Böhm K.J., Stracke R., Unger E., (2000). Speeding up kinesin-driven microtubule gliding
in vitro by variation of cofactor composition and physicochemical parameters. Cell Biol.
Int. 24, 335-341.
Bolt H.M. (2003). Genotoxicity-threshold or not? Introduction of cases of industrial
chemicals. Toxicology Letters. 140-141, 43-51.
References
111
Bolt H.M. and Degen G. (1996/97). Wenn Fremdstoffe wie Hormone wirken. Chemie
heute pp. 84-89.
Bolt H.M. and Degen G. (2000). Hormoneffekte von Chemikalien in Nahrung und
Umwelt. Zur Diskussion von Wirkungen östrogener Stoffe als « endokrine Disruptoren ».
Chemie in unserer Zeit 34, 30-37.
Bolt H.M., Janning P., Michna H., Degen G.H. (2001). Comparative assessment of
endocrine modulators with oestrogenic activity : I. Definition of a hygiene-based margin
of safety (HBMOS) for xeno-oestrogens against the background of European
developments. Arch. Toxicol. 74, 649-662.
Bolt H.M., Foth H., Hengstler J.G., Degen G. H. (2004). Carcinogenicity categorization of
chemicals : New aspects to be considered in a European perspective. Toxicol. Lett. 151,
29-41.
Borenfreund E.and Borrero O. (1984). In vitro cytotoxicity assays. Potential alternatives
to the Draize ocular allergy test. Cell Biol. Toxicol. Oct ;1 (1), 55-65.
Burden D.A. and Osheroff N. (1998). Mechanism of action of eukariotic topoisomerase II
and drugs targeted to the enzyme. Biochim. Biophys. Acta 1400, 3-18.
Cassidy A. (1996). Physiological effects of phytoestrogens in relation to cancer and other
human health risk. Proceed. Nutr. Soc. 55, 399-417.
Coldham N.G., Darby C., Hows M., King L.J., Zhang A.Q., Sauer M.J. (2002).
Comparative metabolism of genistein by human and rat gut microflora: detection and
identification of end-products of metabolism. Xenobiotica 32, 45-67.
Coward L., Barnes N.C., Setchell K., Barnes S. (1993). Genistein, daidzein, and their ß-
glycoside conjugates: antitumor isoflavones in soybean foods from American and Asian
diets. J. Agric. Food Chem. 41,1961-1967.
References
112
Coward L., Kirk M., Albin N., Barnes S. (1996). Analysis of plasma isoflavones by
reversed-phase HPLC-multiple reaction ion monitoring-mass spectrometry. Clinica
Chimica Acta 247, 121-142.
Crebelli R. (2000). Threshold-mediated mechanisms in mutagenesis: Implications in the
classification and regulation of chemical mutagens. Mutat. Res. 464, 129-135.
Day A.J., DuPont M.S., Saxon Ridley S. (1998). Deglycosylation of flavonoid and
isoflavonoid glycosides by human small intestine and liver and beta glucosidase activity.
FEBS Letters 436, 71-75.
Decodier I., Dillen L., Cundari E., Kirsch-Volders M. (2002). Elimination of
micronucleated cells by apoptosis after treatment with inhibitors of microtubules.
Mutagenesis 17, 337-344.
Degen G. H. (1990). Interactions of phytoestrogens and environmental estrogens with
prostaglandin synthase: an in vitro investigation. J. Steroid. Biochem. 35, 473-479.
Degen G. H., Janning P., Diel P., Bolt H.M. (2002a). Estrogenic isoflavones in rodent
diets. Toxicology Letters 128, 145-157.
Degen G. H., Janning P., Diel P., Michna H., Bolt H.M. (2002b). Transplacental transfer
of the phytoestrogen daidzein in DA/Han rats. Arch. Toxicol.. 76, 23-29.
Derendorf H.and Garett E.R. (1987). Pharmakokinetik: Einführung in die Theorie und
Relevanz für die Arzneimitteltherapie. Wissenschaftliche Verlagsgesellschaft, Stuttgart.
Deutsche Forschungsgemeinschaft (1998). Hormonally active agents in food. In:
Eisenbrand G., Daniel H., Dayan A.D., Elias P.S., Grunow W., Kemper F.H., Löser E.,
Metzler M., Schlatter J. (eds) Symposium. Wiley-VCH, Weinheim.
Diel P. (2002). Tissue-specific estrogenic response and molecular mechanisms.
Toxicology Letters 127, 217-224.
References
113
Diel P., Schulz T., Smolnikar K., Strunck E., Vollmer G., Michna H. (2000). Ability of
xeno-and phytoestrogens to modulate expression of estrogen-sensitive genes in rat uterus:
estrogenicity profiles and uterotropic activity. J. Steroid Biochem. Molec. Biol. 73, 1-10.
Diel P., Schmidt S., Vollmer G., Janning P., Upmeier A., Michna H., Bolt H.M., Degen
G.H. (2004). Comparative responses of three rat strains (DA/Han, Sprague-Dawley and
Wistar) to treatment with environmental estrogens. Arch. Toxicol. 78, 183-193.
Doerge D.R., Churchwell M., Delclos K.B. (2000). On-line sample preparation using
restricted-access media in the analysis of the soy isoflavones, genistein and daidzein, in
rat serum using liquid chromatography electrospray mass spectrometry. Rapid Commun.
Mass Spectr. 14, 673-678.
Dybing E. and Sanner T. (2003). Risk assessment of acrylamide in foods. Toxicol. Sci.
75, 7-15.
Ferguson L.R.and Pearson A.E. (1996). The clinical use of mutagenic anticancer drugs.
Mutat. Res. 355, 1-12.
Fischer W.H., Keiwan A., Schmitt E., Stopper H. (2001). Increased formation of
micronuclei after hormonal stimulation of cell proliferation in human breast cancer cells.
Mutagenesis 16, 209-212.
Franke A.A., Custer L.J., Cerna C.M., Narala K.K. (1994). Quantitation of phytoestrogens
in legumes by HPLC. J. Agric. Food. Chem. 42, 1905-1913.
Franke A.A., Custer L.J., Cerna C.M., Narala K.K. (1995). Rapid HPLC analysis of
dietary phytoestrogens from legumes and from human urine. Proceedings of the Society
for Experimental Biology and Medicine 208, 18-26.
References
114
Franke A.A., Custer L.J., Wang W., Shi C.Y. (1998). HPLC analysis of isoflavonoids and
other phenolic agents from food and from human fluids. Proc. Soc. Exp. Biol. Med. 217,
263-273.
Gamache P.H. and Acworth I.N. (1998). Analysis of isoflavoids and other phenolic agents
in plasma, tissue, and urine using HPLC with coulometric array detection. Proc. Soc. Exp.
Biol. Med. 217: 274-280.
Giannotti E., Vandin L., Repeto P., Comelli R. (2002). A comparison of the in vitro
Comet assay with the in vitro chromosome aberration assay using whole human blood or
Chinese hamster lung cells: validation study using a range of novel pharmaceuticals.
Mutagenesis 17(2), 163-170.
Grace P.B., Taylor J.I., Low Y.L., Luben R.N., Mulligan A.A., Botting N.P., Dowsett M.,
Welch A.A., Khaw K.T., Wareham N.J., Day N.E., Bingham S.A. (2004). Phytoestrogen
concentrations in serum and spot urine as biomarkers for dietary phytoestrogen intake and
their relation to breast cancer risk in European Prospective Investigation of Cancer and
Nutrition-Norfolk. Cancer Epidemiol. Biomarkers Prev. 13(5), 698-708.
Heinonen S.M., Hoikkala A., Wähälä K., Adlercreutz H. (2003). Metabolism of the soy
isoflavones daidzein, genistein and glycitein in human subjects. Identification of new
metabolites having an intact isoflavonoid skeleton. J. Steroid Biochem. Mol. Biol. 87,
285-299.
Heinonen S.M., Wähälä K., Liukkonen K.H., Aura A.M., Poutanen K., Adlercreutz H.
(2004). Studies of the in vitro intestinal metabolism of isoflavones aid in the identification
of their urinary metabolites. J.Agric. Food Chem. 52, 2640-2646.
Hengstler J.G., Heimerdinger C.K., Schiffer I.B., Gebhard S., Sagemueller J., Tanner B.,
Bolt H.M., Oesch F. (2002). Dietary topoisomerase II-poisons : contribution of soy
products to infant leukemia? EXCLI Journal 1, 8-14.
References
115
Hengstler J.G., Bogdanffy M.S., Bolt H.M., Oesch F. (2003). Challenging dogma:
thresholds for genotoxic carcinogens? The case of vinyl acetate. Annu. Rev. Pharmacol.
Toxicol. 43, 485-520.
Hsu J., Jean T., Chan M., Ying C. (1999). Differential display screening for specific gene
expression induced by dietary nonsteroidal estrogen. Mol. Reprod. Dev. 52, 141-148.
Janning P., Schuhmacher U.S., Upmeir A., Diel P., Michna H., Degen G.H., Bolt H.M.
(2000). Toxicokinetics of the phytoestrogen daidzein in female DA/Han rats after single
i.v. and oral application. Arch. Toxicol. 74, 421-430.
Joannou G.E., Kelly G.E., Reeder A.Y., Waring M.A., Nelson C. (1995). A urinary
profile study of dietary phytoestrogens. The identification and mode of metabolism of
new isoflavonoids. J. Steroid Biochem. Mol. Biol. 54, 167-184.
Jones A.E., Price K.R., Fenwick G.R. (1989). Development and application of a high-
performance liquid chromatography method for the analysis of phytoestrogens. J. Sci
Food Agric. 46, 357-364.
Kaufmann W.K. (1998). Human topoisomerase II function, tyrosine phosphorylation and
cell cycle checkpoints. Proc. Soc. Exp. Biol. Med. 217, 327-334
Kelly G.E., Joannou G.E., Reeder A.Y., Nelson C., Waring M. A. (1995). The variable
metabolic response in humans. Proc. Soc. Exp. Biol. Med. 208, 40-43.
Kreja L.and Seidel H.J. (2002). On the cytotoxicity of some microbial volatile organic
compounds as studied in the human lung cell line A549. Chemosphere 49 (1), 105-110.
Kulling S.E and Metzler M. (1997). Induction of Micronuclei, DNA strand breaks and
HPRT mutations in cultured Chinese hamster V79 cells by the phytoestrogen
coumoestrol. Food and Chem. Toxicol. 35, 605-613.
References
116
Kulling S.E., Rosenberg B., Jacobs E., Metzler M. (1999). The phytoestrogens coumestrol
and genistein induce structural chromosomal aberrations in cultured human peripheral
blood lymphocytes. Arch. Toxicol. 73, 50-54.
Kulling S.E., Honig D.M., Simat T.J., Metzler M. (2000). Oxidative in vitro metabolism
of the soy phytoestrogens daidzein and genistein. J. Agric. Food Chem. 48, 4963-4972.
Kulling S.E., Honig D.M., Metzler M. (2001). Oxidative metabolism of the soy
isoflavones daidzein and genistein in humans in vitro and in vivo. J. Agric. Food Chem.
49, 3024-3033.
Kulling S.E., Lehmann L., Metzler M. (2002). Oxidative metabolism and genotoxic
potential of major isoflavone phytoestrogens. J. Chromatog. B Anal Technol. Biomed.
Life Sci. 777, 211-218.
Kurzer M.S. and Xu X. (1997). Dietary phytoestrogens. Annu. Rev. Nutr., 17, 353-81.
Kuznetsov S.A.and Gelfand V.I. (1986). Bovine brain kinesin is a microtubule-activated
ATPase. Proc. Natl. Acad. Sci. USA 83: 8530-8534.
Lampe J.W., Karr S.C., Hutchins A.M., Slavin J.L. (1998). Urinary equol excretion with
soy challenge: influence of habitual diet. Proc. Soc. Exp.Biol. Med. 217, 335-339.
Lee M., Kwon J., Chung M. K. (2003). Enhanced prediction of potential rodent
carcinogenicity by comet assay and apoptotic assay in combination. Mut. Res. 541, 9-19.
Löffler S.and Bolt H.M. (1980). Untersuchungen zum enterohepatischen Kreislauf von
Östradiol und Äthinylöstradiol bei der Ratte. Arzneimittelforschung 30, 810-813.
Lovell D.P. (2000). Dose-response and threshold-mediated mechanisms in mutagenesis:
statistical models and study design. Mutat. Res.464, 87-95.
References
117
Lutz W. (1998). Dose-response relationship in chemical carcinogenesis ; superposition of
different mechanisms of action, resulting in linear non-linear curves, practical thresholds,
J-shapes. Mutat. Res. 405, 117-124.
Lynch A., Harvey J., Aylott M., Nicholas E., Burman M., Siddiqui A., Walker S., Rees R.
(2003). Investigations into the concept of a threshold for topoisomerase inhibitor-induced
clastogenicity. Mutagenesis 18, 345-353.
Markovits J., Linassier C., Fosse P., Couprie J., Pierre J., Jacquemin-Sablon A., Saucier
J.-M., Le Pecq J.-B., Larson A.K. (1989). Inhibitory effects of the tyrosine kinase
inhibitor genistein on mammalian DNA topoisomerase II. Cancer Research 49, 5111-
5117.
Maubach J., Bracke M.E., Heyerick A., Depypere H.T., Serreyn R.E., Mareel M.M., De
Keukeleire D. (2003). Quantitation of soy-derived phytoestrogens in human breast tissue
and biological fluids by high-performance liquid chromatography. Journal of
Chromatography B 784, 137-144.
Meek D.W. (2000). The role of p53 in the response to mitotic spindle damage. Pathol.
Biol. 48, 246-54.
Miller B.M.and Adler I.D. (1989). Suspect spindle poisons: analysis of c-mitotic effects in
mouse bone marrow cells. Mutagenesis 4, 208-215.
Miltyk W., Craciunescu C.N., Fischer L., Jeffcoat R.A., Koch M.A., Lopaczynski W.,
Mahoney C., Jeffcoat R.A., Crowell J., Paglieri J., Zeisel S. (2003). Lack of significant
genotoxicity of purified soy isoflavones (genistein, daidzein and glycitein) in 20 patients
with prostate cancer. Am. J. Clin. Nutr. 77, 875-882.
Mitchell J.H., Gardner P.T., McPhail D.B., Morrice P.C., Collins A.R., Duthie G.G.
(1998). Antioxidant efficacy of phytoestrogens in chemical and biological model systems.
Arch. Biochem. Biophys. 360, 142-148.
References
118
Morgan K.T. (1997). A brief review of formaldehyde carcinogenesis in ralation to rat
nasal pathology and human risk assessment. Toxicol. Pathol. 25, 291-307.
Neumann H.G., Vamvakas S., Thielmann H.W., Gelbke H.P., Filser J.G., Reuter U.,
Greim H., Kappus H., Norpoth K.H., Wardenbach P., Wichmann H.E. (1998). Changes in
the classification of carcinogenic chemicals in the work area. Int. Arch. Occup. Environ.
Health 71, 566-574.
Okura A., Arakawa H., Oka H., Yoshinari T., Monden Y. (1988). Effects of genistein on
topoisomerase activity and on the growth of [VAL 12]Ha-ras-transformed NIH 3T3 cells.
Biochem. Biophys. Res. Com. 157, 183-189.
Parry J.M., Jenkins G.J.S., Haddad F., Bourner R., Parry E.M. (2000). In vitro and in vivo
extrapolations of genotoxic exposures: Consideration of factors which influence dose-
response thresholds. Mutat. Res. 464, 53-63.
Pfeiffer P., Goedecke W., Obe G. (2000). Mechanisms of DNA double-strand break repair
and their potential to induce chromosomal aberrations. Mutagenesis 15 (4), 289-302.
Riddell R. J., Clothier R. H. and Balls M. (1986). An evaluation of three in vitro
cytotoxicity assays. Food. Chem. Toxic. 24, 469-471.
Ritchie M. R., Morton M.S., Deighton N., Blake A., Cummings J.H. (2004). Plasma and
urinary phytoestrogens as biomarkers of intake: validation by duplicate diet analysis.
British Journal of Nutrition 91, 447-457.
Rowland I.R., Wiseman H., Sanders T.A.B., Adlercreutz H., Bowey E.A. (2000).
Interindividual variation in metabolism of soy isoflavones and lignans: influence of
habitual diet on equol production by the gut microflora. Nutr. Cancer 36, 27-32.
Rowland I., Faughnan M., Hoey L., Wähälä K., Williamson G., Cassidy A. (2003).
Bioavailability of phytoestrogens. British J. Nutr. 89 (suppl 1), S45-S58.
References
119
Rothwell J.A., Day A.J., Morgan M.R. (2005). Experimental determination of octanol-
water partition coefficients of quercetin and related flavonoids. J. Agric. Food Chem. Jun
1, 53 (11), 4355-60.
Santell R.C., Chang Y.C., Nair M.G., Helferich W.C. (1997). Dietary genistein exerts
estrogenic effects upon the uterus, mammary gland and the hypothalamic/pituitary axis in
rats. J. Nutr. 127, 263-269.
Sathyamoorthy N.and Wang T.T.Y. (1997). Differential effects of dietary phytoestrogens
daidzein and equol on human breast cancer MCF-7 cells. Eur. J. Cancer 33, 2384-2389.
Schempp W. and Vogel W. (1979). Difference between diploid and aneuploid Chinese
hamster cells in replication at mid-S-phase. Chromosoma 73 (1), 109-115.
Schmitt E., Dekant W., Stopper H. (2001). Assaying the estrogenicity of phytoestrogens
in cells of different estrogen sensitive tissues. Toxicology in vitro. 15, 433-439.
Schnapp B.J., Crise B., Sheetz M.P., Reese T.S., Khan S., (1990). Delayed start-up of
kinesin-driven microtubule gliding following inhibition by adenosine 5´-[beta, gamma-
imido] triphosphate. Proc. Natl. Acad.Sci. USA 87, 10,053-10,057.
Schoeny R. (1996). Use of genetic toxicology data in U.S. EPA risk assessment: The
mercury study report as an example. Environ. Health Perspect. 104 (Suppl. 3), 663-673.
Seeley M.R., Tonner-Navarro L.E., Beck B. D., Deskin R., Feron V.J., Johanson G., Bolt
H.M. (2001). Procedures of health risk assessment in Europe. Regul. Toxicol. Pharmacol.
34, 153-169.
Setchell K.D.R. (1998). Phytoestrogens: the biochemistry, physiology, and implications
for human health of soy isoflavones. Am. J. Clin. Nutr. 68 (suppl), 1333S-46S.
Setchell K.D.R. and Adlercreutz H. (1988). Mammalian lignans and phytoestrogens.
Recent studies on their formation, metabolism and biological role in health and disease. In
References
120
Role of the Gut Flora in Toxicity and Cancer, ed. IR Rowland, pp. 315-45. London:
Academic Press.
Setchell K.D.R. and Cassidy A. (1999). Dietary isoflavones: biological effects and
relevance to human health. J. Nutr. 129, 758S-767S.
Setchell K.D.R., Lawson A.M., Borriello S.P., Harkness H., Gordon H., Morgan D.M.L.,
Hirk D.N., Adlercreutz H. (1981). Lignan formation in man-microbial involvement and
possible roles in relation to cancer. Lancet 2, 4-8.
Setchell K.D.R., Borriello S.P., Hulme P., Kirk D.N., Axelson M. (1984). Non-esteroidal
estrogens of dietary origin: possible roles in hormone-dependent disease. Am. J. Clin.
Nutr. 40, 569-78.
Setchell K.D.R., Zimmer-Nechemias L., Cai J., Heubi J.E. (1997). Exposure of infants to
phytoestrogens from soy-based infant formula. Lancet 350, 23-27.
Setchell K.D.R., Brown N.M., Desai P., Zimmer-Nechemias L., Wolfe B.E., Brashear
W.T., Kischner A.S., Cassidy A., Heubi J.E. (2001). Bioavailability of pure isoflavones in
healthy humans and analysis of commercial soy isoflavone supplements. J. Nutr. 131,
1362S-1375S.
Setchell K.D.R., Brown N.M., Zimmer-Nechemias L., Brashear W.T., Wolfe B.E.,
Kirschner A.S., Heubi J.E. (2002). Evidence for lack of absorption of soy isoflavone
glycosides in humans, supporting the crucial role of intestinal metabolism for
bioavailability. Am. J. Clin. Nutr. 76, 447-453.
Singh N.P., McCoy M.T., Tice R.R., Schneider E.L. (1988). A simple technique for
quantitation of low levels of DNA damage in individual cells. Experimental Cell Research
175, 184-191.
Sorger P.K., Dobles M., Tournebize R., Hyman A. (1997). Coupling cell division and cell
death to microtubule dynamics. Curr. Opin. Cell Biol. 9, 807-14.
References
121
Speit G., Habermeier B., Helbig R. (1994). Differences in the response to mutagens
between two V79 sublines. Mut. Res. 325 (2-3), 105-111.
Streffer C., Bolt H.M., Föllesdal D., Hall P., Hengstler J. G., Jacob P., Oughton D., Priess
K., Rehbinder E., Swaton E. (2004). Environmental Standards-Dose-Effects Relations in
the Low Dose Range and Risk Evaluation. Springer-Verlag, Berlin.
Supko J.G. and Malspeis L. (1995). Plasma pharmacokinetics of genistein in mice. Int. J.
Oncol. 7, 847-854.
Tan E.M., Rodman G.P., Garcia L., Moroi Y., Fritzler M.J., Peebles C. (1980). Diversity
of antinuclear antibodies in progressive systemic sclerosis. Arthritis Rheum. 23, 617-625.
Tao K.S., Urlando C., Heddle J.A. (1993). Mutagenicity of methyl methanesulfonate
(MMS) in vivo at the Dlb-1 native locus and a lacI transgene. Environ. Mol. Mutagen. 22,
293-296.
Thier R., Bonacker D., Stoiber T., Böhm K.J., Wang M., Unger E., Bolt H.M., Degen G.
H. (2003). Interaction of metal salts with cytoskeletal motor protein systems. Toxicol.
Lett. 140/141, 75-81.
Toonen T.R. and Hande K.R.(2001). Topoisomerase II inhibitors. Cancer Chemother.
Biol. Response Modif. 19, 129-147.
Tsutsui T., Maizumi H., McLachlan J.A., Barrett J.C.(1983). Aneuploidy induction and
cell transformation by diethylstilbestrol: a possible chromosomal mechanism in
carcinogenesis. Cancer Res. 43, 3814-3821.
Tsutsui T., Suzuki N., Fukuda S., Sato M., Maizumi H., McLachlan J.A., Barrett
J.C.(1987). 17ß-Estradiol-induced cell transformation and aneuploidy of Syrian hamster
embryo cells in culture. Carcinogenesis. 8, 1715-1719.
References
122
Tsutsui T., Tamura Y., Yagi E., Someya H., Hori I., Metzler M., Barrett J.C.(2003). Cell-
transforming activity and mutagenicity of 5 phytoestrogens in cultured mammalian cells.
Int. J. Cancer. 105, 312-20.
Vale R.D., Reese T.S., Sheetz M.P., (1985). Identification of a novel force-generating
protein, kinesin, involved in microtubule-based motility. Cell 42, 39-50.
von Massow A., Mandelkow E.M., Mandelkow E., (1989). Interaction between kinesin,
microtubules, and microtubule associated protein 2. Cell. Motil. Cytoskeleton 14, 562-
571.
Wang J.C. (2002). Cellular roles of DNA topoisomerases: a molecular perspective. Nat.
Rev. Mol. Cell Biol. 3, 430-440.
Wang H.J. and Murphy P.A. (1994). Isoflavone content in commercial soybean foods. J.
Agric. Food Chem. 42, 1666-73.
Wang T.T.Y., Sathyamoorthy N., Phang J.M. (1996). Molecular effects of genistein on
estrogen receptor mediated pathway. Carcinogenesis 17, 271-275.
Wei H., Bowen R., Cai Q., Barnes S., Wang Y. (1995). Antioxidant and antipromotional
effects of the soybean isoflavone genistein. Proc. Soc. Exp. Biol. Med. 208, 124-130.
Willard S.T. and Frawley L.S. (1998). Phytoestrogens have agonistic and combinatorial
effects on estrogen-responsive gene expression in MCF-7 human breast cancer cells.
Endocrine 8, 117-121.
Xu X., Harris K.S., Wang H.J., Murphy P.A., Hendrich C.L. (1995). Bioavailability of
soybean isoflavones depends upon gut microflora in women. J. Nutr. 125, 2307-2315.
Yamashita Y., Kawada S., Nakano H. (1990). Induction of mamalian topoisomerase II
dependent DNA cleavage by non-intercalative flavonoids, genistein and orobol. Biochem.
Pharmacol. 39, 737-744.
Recommended