Epidemiology, Biostatistics and Prevention Institute
30/08/17 Page 1
Analysis of dietary patterns in the Swiss population NFP1A and MONICA studies
Jean-Philippe Krieger

Classic approaches vs. Dietary patterns
30/08/17 University of Zurich, EBPI Page 2
Classic approaches: - Single food - Single food groups - Single nutrients
Dietary patterns: - A priori (hypothesis-driven): Mediterranean Index, Healthy Eating Index, ... - A posteriori (data-driven): Principal component methods, Clustering, ...

Published menu CH data (03/2017)
30/08/17 University of Zurich, EBPI Page 3
Very nice... but these are mostly averages... Every Swiss does not eat like an average Swiss!

Principle: how to identify a posteriori dietary patterns?

30/08/17 University of Zurich, EBPI Page 5
How to find dietary patterns?
DEFINITION Identifying dietary patterns = finding individuals that have a similar profile of answers to a nutrition questionnaire
METHODS
1/ Summarize the variability in a lower dimensional space
2/ Use these new dimensions to cluster individuals

Survey data are highly multidimensional
30/08/17 University of Zurich, EBPI Page 6
Each individual has answered no=0 or yes=1 to nutrition questions.
Case 1: only 2 questions.
0
1
1
John (0,1) Helen (1,1)
Case 2: 3 questions.
John (0,1,1) Helen (1,1,0)
2D-graph
3D-graph
Case 3: 12 questions. 0
1
1
1
John (0,1,1,.......,1,0) Helen (1,1,0,........,0,0)
No graph possible but each point as a unique position in a 12th-dimensional space
Can we summarize this highly dimensional point cloud into a lower dimensional space, so that we
can graph and interprete the data?

Finding principal components: example 3D>2D

Finding principal components: example 3D>2D
PC 1
PC 2

Finding principal components: example 3D>2D
PC 1
PC 2

30/08/17 University of Zurich, EBPI Page 10
How to find dietary patterns?
DEFINITION Identifying dietary patterns = finding individuals that have a similar profile of answers to the 12 food questions
METHODS
1/ Summarize the variability in a lower dimensional space
2/ Use these new dimensions to cluster individuals
Hierarchical clustering on principal components
PC 1
PC 2
„Head“ „Back“
„Limbs“

Example: dietary patterns in the Swiss population (1977-1993)

Identification of a posteriori dietary patterns: an example
30/08/17 University of Zurich, EBPI Page 13
N = 18,484 NRP1A (77-79) = 8631 Males = 8944 M1 (84-86) = 3324 Females = 9540 M2 (88-89) = 3304 M3 (92-93) = 3125
Age = 45.22 +/- 13.62 y BMI = 23.84 +/- 4.00
NUTRITION: 24h recall 12 food items (y/n)
Fish / meat / sausage / vegetables / salad / fruit / chocolate / bread_dark / eggs /
cheese / milk / yogurt
SUPPLEMENTARY: Demographics and lifestyle
factors Age / sex / education / BMI / Sport /
Smoking / ....
Data set: 4 studies (monitoring of trends and determinants of cardiovascular diseases)
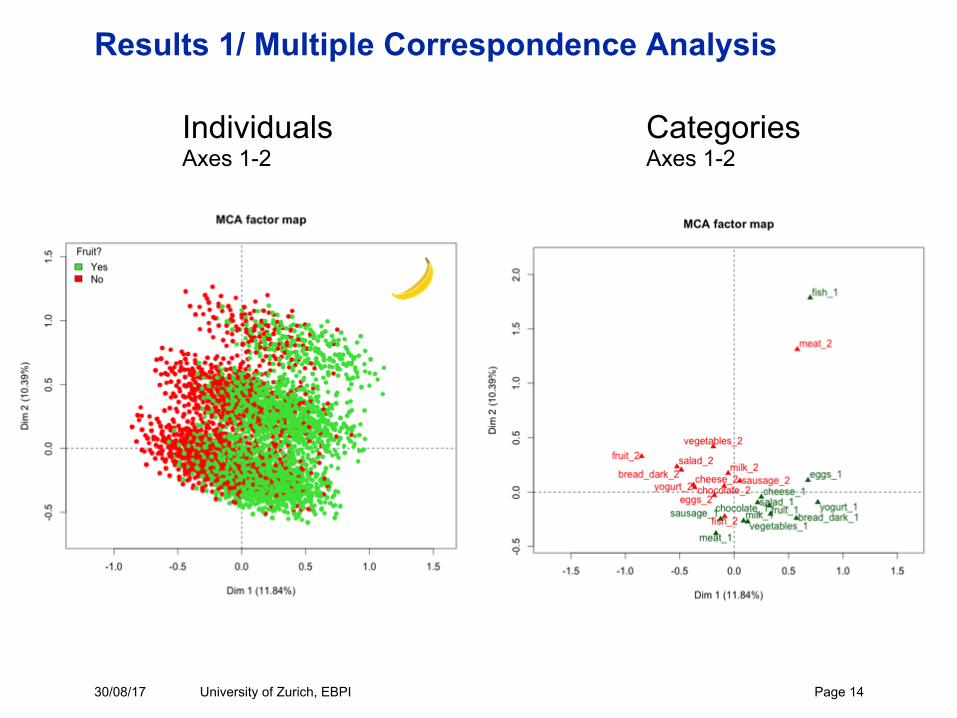
Results 1/ Multiple Correspondence Analysis
30/08/17 University of Zurich, EBPI Page 14
Individuals Axes 1-2
Categories Axes 1-2
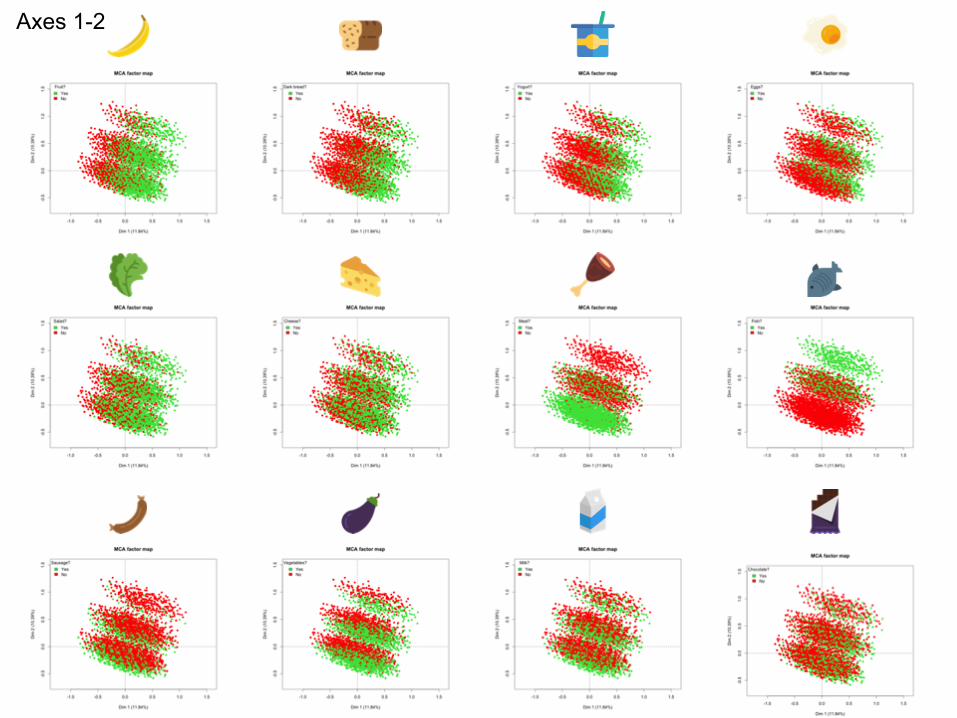
Axes 1-2

Axes 3-4

Results 2/ HCPC
30/08/17 University of Zurich, EBPI Page 17
Axes 1-2 Axes 3-4

Results 2/ HCPC - % of food consumption by cluster
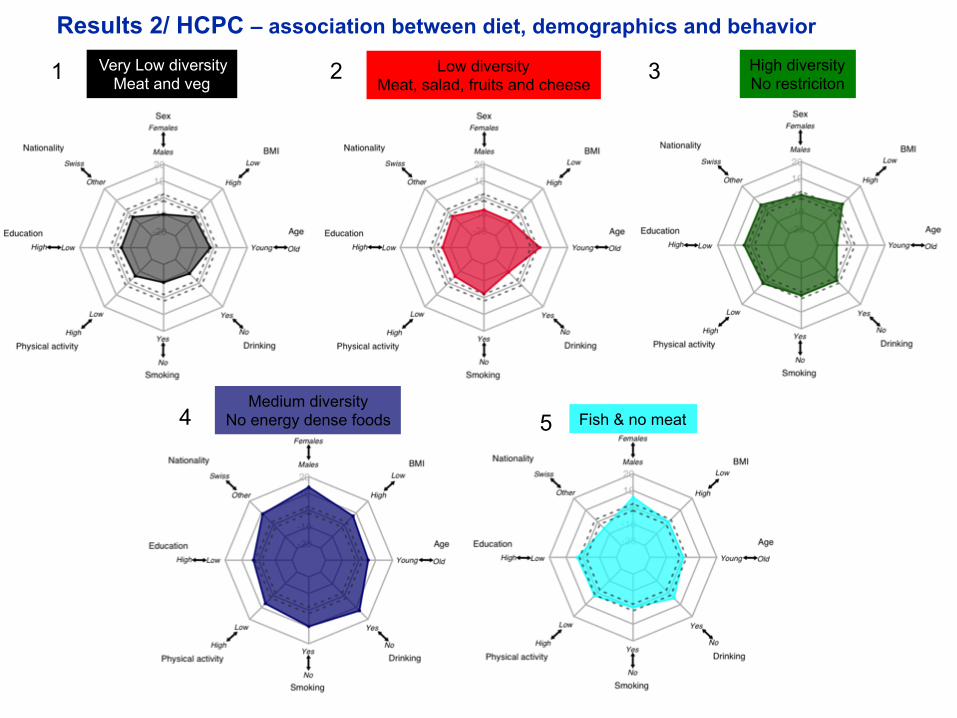
Fish & no meat
High diversity No restriciton
Medium diversity No energy dense foods
Low diversity Meat, salad, fruits and cheese
Very Low diversity Meat and veg 2 3
4 5
1

Results 2/ HCPC - An example of supplementary variable Axes 1-2 Axes 3-4
0 = never 1 = former 2 = light
3 = heavy
Smokingcluster# Never Former Light Heavy
1 -8.88 -2.65 2.32 11.682 -3.99 2.57 5.793 8.56 -10.254 3.54 -3.455 4.03 2.02 -2.86 -4.61
Fish & no meat
High diversity No restriciton
Medium diversity No energy dense foods
Low diversity Meat, salad, fruits and cheese
Very Low diversity Meat and veg 2 3
4 5
1
Results 2/ HCPC – association between diet, demographics and behavior

Epidemiology, Biostatistics and Prevention Institute
Take-home messages
• MCA allows to summarize the variabilty in the available dataset (12 food items from a 24h recall among 18,000 ind).
• HCPC allowed to identify 5 clear dietary patterns on the basis of the 4 first principal components of the MCA.
• Supplementary variables allowed to find the other demographic or lifestyle factors that characterize the 5 dietary patterns.
• This approach is currently applied to the MenuCH data.
Recommended