Analysis of farm household technical efficiency in Chinese litchi farm using bootstrap DEA
Bagchi, M.; Zhuang, L.
Custos e @gronegócio on line - v. 12, n. 4 – Oct/Dec - 2016. ISSN 1808-2882
www.custoseagronegocioonline.com.br
378
Analysis of farm household technical efficiency in Chinese litchi farm using
bootstrap DEA
Reception of originals: 11/17/2016
Release for publication: 12/31/2016
Mita Bagchi (Corresponding author) PostDoc in College of Economics and Management
Institute: South china Agricultural University
Address: 483 Wushan Road, Guangzhou 510642, PR China
E-mail: [email protected]
Lijuan Zhuang
Professor in South china Agricultural University
Institute: College of Economics and Management
Address: 483 Wushan Road, Guangzhou 510642, PR China
E-mail: [email protected]
Abstract
The present study applies a bootstrapped DEA procedure to compute bias corrected measures
of technical and scale efficiency of Chinese litchi farmers. DEA approach is appropriate to
estimate the efficiency but the result is ambiguous due to lack of information about estimates’
uncertainty. The present study overcomes this drawback by applying bootstrapping procedure
to DEA. The data is collected from 160 farm household spread across the six southern
provinces of China during 2014. The result revealed that the mean technical efficiency is
0.804 in study area which suggest that farm households are potential for producing 80% of
litchi. The scale efficiency score imply that a majority of litchi farmers are operating with
decreasing returns to scale. We also examine farmer’s characteristics with respect to input use
under various returns to scale. The bootstrap procedure corrected bias in technical efficiency
scores from a mean of 0.804 to 0.66. So it is important to use bootstrap technique to reduce
the ambiguity of result.
Keyword: Bootstrapping DEA. Technical and scale efficiency. Litchi production.
1. Introduction
Litchi is originated in southern subtropical and northern tropical regions of China. As
the origin of litchi, China is the biggest litchi producer in the world with its more than 2100
years of cultivation history. But because of the historical reason litchi cultivation did not get
due attention before. After reform, Litchi has become the forth largest fruits in China with the
improvement of production technology and increase living standard. Since 1980s, litchi has
become major industry in South China and creates an employment generation for local
population (Chen and Huang 2000). The major litchi producing area of China is Guangdong,
Guangxi, Hainan, Fujian, Yunnan, Taiwan Province and some parts of Sichuan, Zhejiang and

Analysis of farm household technical efficiency in Chinese litchi farm using bootstrap DEA
Bagchi, M.; Zhuang, L.
Custos e @gronegócio on line - v. 12, n. 4 – Oct/Dec - 2016. ISSN 1808-2882
www.custoseagronegocioonline.com.br
379
Guizhou Province. These Provinces are suitable for litchi production due to its special local
geographical status and micro-climate (Wu, et al. 2007).
Guangdong Province is the largest Litchi producing area of China, accounting for
more than 60% of country’s total production. In 2009, China produced 1.69 million tons of
litchi which is 70% of world production by using 557200 hectares of land. But recently the
area under litchi cultivation is declining due to constraint bottleneck to industrial development
(Morshed and Shan-Ni 2012). The declining total area under litchi production may also be
attributed to the high labor cost, low yield and low price of fruit. It is reported by Morshed
and Shan-ni (2012) that there exists instability in China’s litchi industry. Figure 1 represents
the acreage of litchi in main litchi producing area of China.
190000
210000
230000
250000
270000
290000
310000
330000
20002001
20022003
20042005
20062007
20082009
20102011
20122013
Year
Prod
uctio
n ar
ea (h
a)
Guangdong
Guangxi
Log. (Guangxi)
Log. (Guangdong)
Figure 1: Trend of litchi producing area of Guangdong and Guangxi provinces of China
It is clear from the figure that in every region total litchi cultivated area is gradually
declining. Though there is no scope to increase the supply of land so in this situation
efficiency improvement has become more important in order to meet the increasing demand.
Given this backdrop, present research set out the main objectives is to estimates the technical
efficiency (TE) and scale efficiency (SE) of litchi farmers in China.
There are two competing approach in efficiency estimate, non-parametric data
envelopment analysis (DEA) and parametric stochastic frontier approach (SFA). Non-
parametric DEA approach is especially popular for several reasons. First, no assumptions
need to be made regarding the functional form for the production function and cost function
Analysis of farm household technical efficiency in Chinese litchi farm using bootstrap DEA
Bagchi, M.; Zhuang, L.
Custos e @gronegócio on line - v. 12, n. 4 – Oct/Dec - 2016. ISSN 1808-2882
www.custoseagronegocioonline.com.br
380
and does not require price data. Second, in DEA, it is not required to aggregate the multiple
input and output. Third, due to the linear programming technique, DEA can identify best
practice for every firm (Färe, et al. 2013).
The parametric SFA approach is based on econometric regression and one of its strong
restrictive features is that it requires prior specification of the functional form for the
production function. For multiple inputs and outputs, SFA needs to aggregate them. Based on
the above considerations, we have decided to use data envelopment analysis (DEA) in our
present study.
Several studies have used parametric (SFA) and non-parametric (DEA) approaches to
estimate the efficiency in the agricultural sector (Wilson, et al. 2001, Coelli, et al. 2002,
Bozoğlu and Ceyhan 2007, Alam, et al. 2011, Hormozi, et al. 2012, Madau 2012, Bagchi and
Shunbo 2013, Kočišová 2015, Mirza, et al. 2015). But none of these studies have been
estimated confidence intervals of the efficiency scores to provide statistical inferences. DEA
is best suited to measure the efficiency but the results are criticized for not providing
statistical precision (Coelli, et al. 2002, Caves, et al. 1982).
The other drawback of DEA is the biased measures of estimates of efficiency which
may lead to biased conclusions. To overcome this drawback in our present study we employ
bootstrap technique to DEA estimate. A number of studies (Feng 2008, Chen, et al. 2009,
Tan, et al. 2010) also estimated the efficiency of agricultural sector in China without
correcting the bias of the efficiency score using bootstrap technique. To the best of our
knowledge there is no studied has been conducted to measure the biased corrected technical
efficiency of Chinese litchi farmers.
To address this research gap the present study applies bootstrapped DEA to assess the
biased corrected technical efficiency of Chinese litchi farms. So this is the first study of both
scale and technical efficiency at the farm level for the litchi producing in China.
2. Materials and Methods
2.1. Data Envelopment Analysis (DEA)
The nonparametric Data Envelopment Analysis (DEA) is applied to analyze the
technical and scale efficiency score in our study derives from Färe et al., (1985, 1994), which
is based on the study of Farrell (1957) and others and farther explain in Coelli et al., (1998).
DEA is linear programming method that can be employed for both output- oriented or input-
oriented model depends on whether we use output distance function or input distance

Analysis of farm household technical efficiency in Chinese litchi farm using bootstrap DEA
Bagchi, M.; Zhuang, L.
Custos e @gronegócio on line - v. 12, n. 4 – Oct/Dec - 2016. ISSN 1808-2882
www.custoseagronegocioonline.com.br
381
function. Output-oriented measure refers to production technology that considers maximum
proportional increase in output, with constant level of input. In contrast, in case of input-
oriented, the DEA method seeks minimum usage in input usage, with fixed level of output.
Under the constant returns to scale (CRS) both measures derive same technical efficiency
scores, but not when technology exhibits variable returns to scale (VRS).
2.2. Technical efficiency
Technical efficiency (TE) refers to the firm’s capability to produce the maximum
possible level of output from a fixed level of inputs (output-oriented approach), or uses the
minimum viable level of inputs to produce a given output level (input-oriented approach). The
optimality of firm’s size is measured by the scale efficiency. In present study, we apply DEA
approach to estimate both input-based and output based technical efficiency and scale
efficiency
In this DEA model, k refers to the input and m refers to the output for each of n farms.
Vectors xj and yj represent the input and output data for jth farm whereas X and Y represent
the k´n input matrix X, and the m´n output matrix for all of the n farms in the sample
respectively. Overall TE for jth farm for input and output based DEA under VRS and CRS
technology is calculated by following equation:
2.3. Input-oriented technical efficiency
0;;
,
XXYY
CRSj
CRSjTE
j
CRS
jj
j
tosubject
Min (1)
Where λ is n×1 vector of weights and generally 10 CRS
j . By solving the value of
CRS
j we can find TE score for CRS. For interpretation, 1CRS
j shows the farm is on the
frontier and technically efficient and the value of 1CRS
j refers to the technically inefficient
farm. After solving n times of linear programming problem we can get the value of CRS
j for
Analysis of farm household technical efficiency in Chinese litchi farm using bootstrap DEA
Bagchi, M.; Zhuang, L.
Custos e @gronegócio on line - v. 12, n. 4 – Oct/Dec - 2016. ISSN 1808-2882
www.custoseagronegocioonline.com.br
382
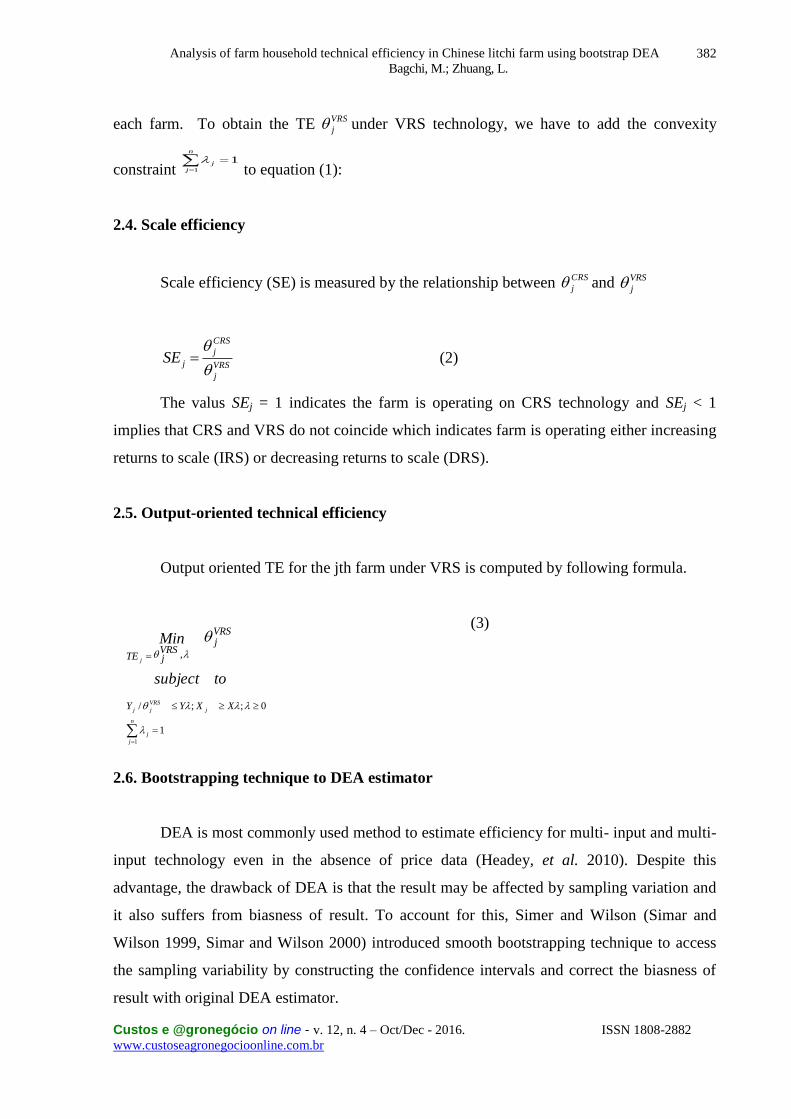
each farm. To obtain the TE VRS
j under VRS technology, we have to add the convexity
constraint 1
1
n
j
j to equation (1):
2.4. Scale efficiency
Scale efficiency (SE) is measured by the relationship between CRS
j and VRS
j
VRS
j
CRS
j
jSE
(2)
The valus SEj = 1 indicates the farm is operating on CRS technology and SEj < 1
implies that CRS and VRS do not coincide which indicates farm is operating either increasing
returns to scale (IRS) or decreasing returns to scale (DRS).
2.5. Output-oriented technical efficiency
Output oriented TE for the jth farm under VRS is computed by following formula.
(3)
2.6. Bootstrapping technique to DEA estimator
DEA is most commonly used method to estimate efficiency for multi- input and multi-
input technology even in the absence of price data (Headey, et al. 2010). Despite this
advantage, the drawback of DEA is that the result may be affected by sampling variation and
it also suffers from biasness of result. To account for this, Simer and Wilson (Simar and
Wilson 1999, Simar and Wilson 2000) introduced smooth bootstrapping technique to access
the sampling variability by constructing the confidence intervals and correct the biasness of
result with original DEA estimator.
1
0;;/
,
1
n
j
j
j
VRS
jj
j
XXYY
VRSj
VRSjTE
tosubject
Min
Analysis of farm household technical efficiency in Chinese litchi farm using bootstrap DEA
Bagchi, M.; Zhuang, L.
Custos e @gronegócio on line - v. 12, n. 4 – Oct/Dec - 2016. ISSN 1808-2882
www.custoseagronegocioonline.com.br
383
In the present study we employ bootstrap procedure proposed by Simar and Wilson
(1999), initiated by Efron (1979). Following Simar and Wilson (1999) idea underlying the
bootstrapping technique is by mimicking the data generating process (DGP) it approximates a
true sampling distribution, here the output from original DEA.
The basic of bootstrapping efficiency score is to construct a large number of pseudo-
data set and re-estimate the DEA model with this new data set. This estimates a new DEA
efficiency score for each farm. After many replication of this re-sampling process, we can
obtain a good approximation of the empirical distribution of the efficiency estimates.
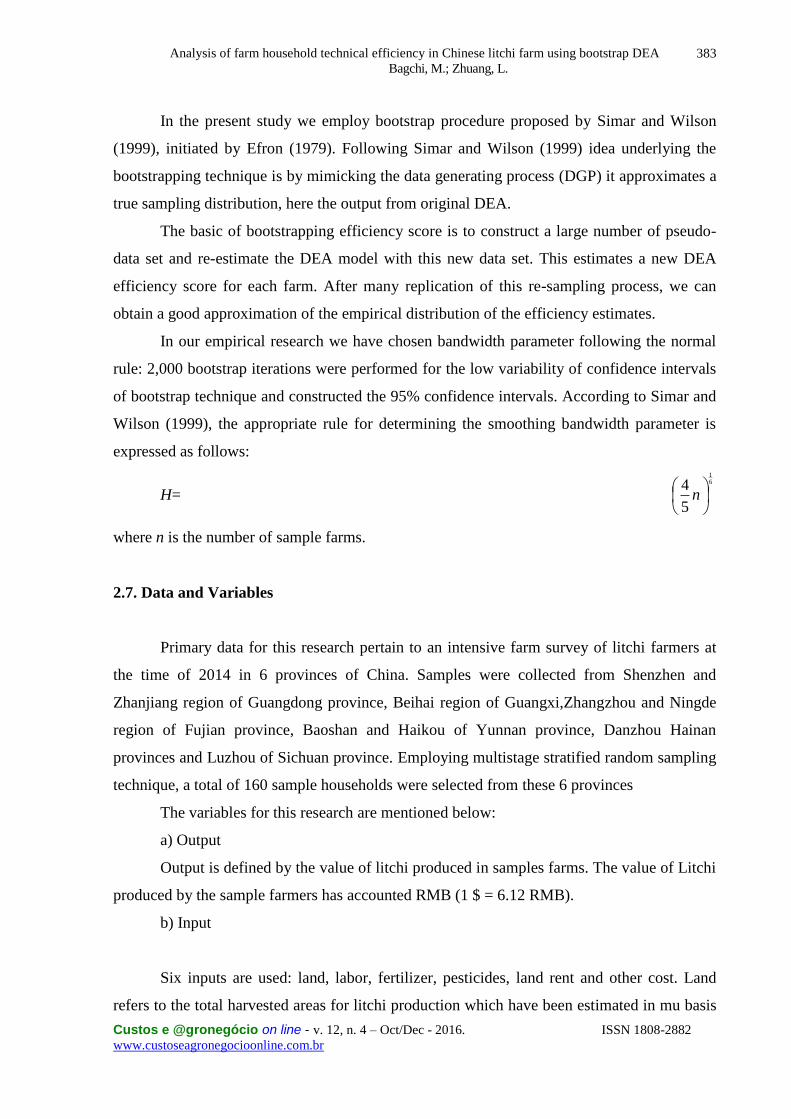
In our empirical research we have chosen bandwidth parameter following the normal
rule: 2,000 bootstrap iterations were performed for the low variability of confidence intervals
of bootstrap technique and constructed the 95% confidence intervals. According to Simar and
Wilson (1999), the appropriate rule for determining the smoothing bandwidth parameter is
expressed as follows:
H=61
5
4
n
where n is the number of sample farms.
2.7. Data and Variables
Primary data for this research pertain to an intensive farm survey of litchi farmers at
the time of 2014 in 6 provinces of China. Samples were collected from Shenzhen and
Zhanjiang region of Guangdong province, Beihai region of Guangxi,Zhangzhou and Ningde
region of Fujian province, Baoshan and Haikou of Yunnan province, Danzhou Hainan
provinces and Luzhou of Sichuan province. Employing multistage stratified random sampling
technique, a total of 160 sample households were selected from these 6 provinces
The variables for this research are mentioned below:
a) Output
Output is defined by the value of litchi produced in samples farms. The value of Litchi
produced by the sample farmers has accounted RMB (1 $ = 6.12 RMB).
b) Input
Six inputs are used: land, labor, fertilizer, pesticides, land rent and other cost. Land
refers to the total harvested areas for litchi production which have been estimated in mu basis
Analysis of farm household technical efficiency in Chinese litchi farm using bootstrap DEA
Bagchi, M.; Zhuang, L.
Custos e @gronegócio on line - v. 12, n. 4 – Oct/Dec - 2016. ISSN 1808-2882
www.custoseagronegocioonline.com.br
384
(Chinese area unit, approximately 0.067 hectare). Labor is measured as the number of farmers
engaged in litchi production. Fertilizer includes the total value (in RMB) of all fertilizer used
for litchi production. Pesticides input means the values of pesticides (in RMB) used for litchi
cultivation. Land rent and other cost also expressed as the value (in RMB). All variables are
presented in the following Table 1.
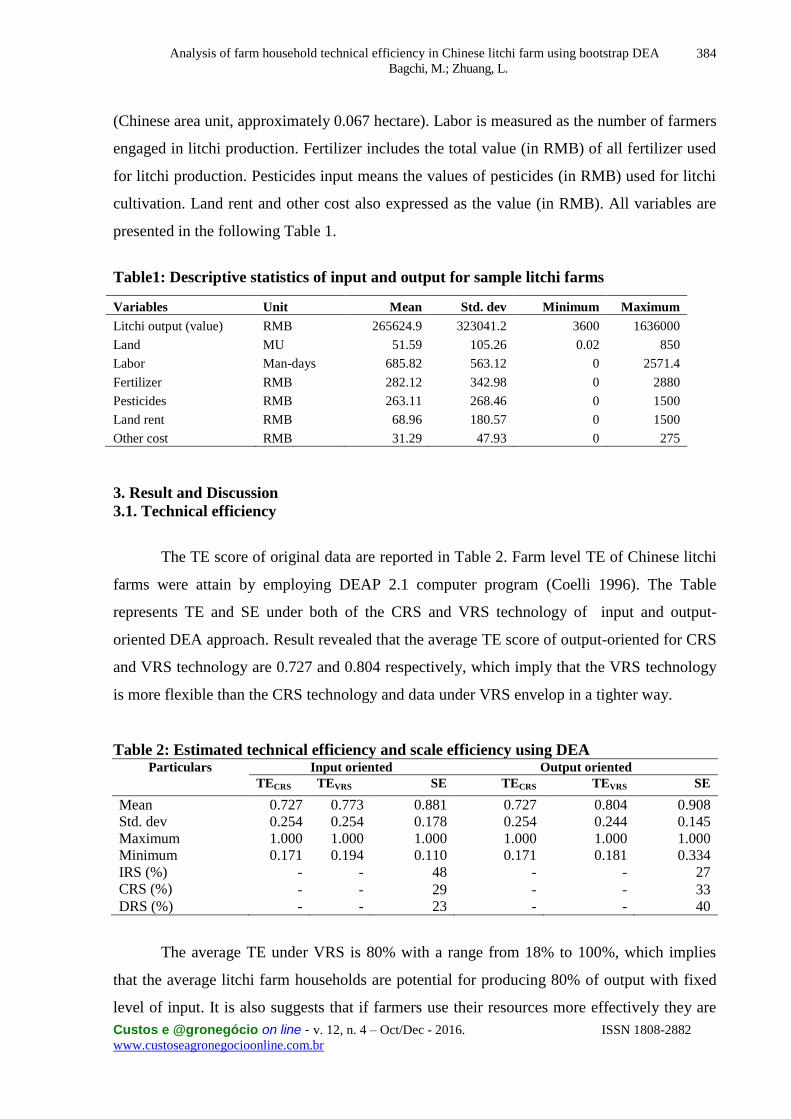
Table1: Descriptive statistics of input and output for sample litchi farms
Variables Unit Mean Std. dev Minimum Maximum
Litchi output (value) RMB 265624.9 323041.2 3600 1636000
Land MU 51.59 105.26 0.02 850
Labor Man-days 685.82 563.12 0 2571.4
Fertilizer RMB 282.12 342.98 0 2880
Pesticides RMB 263.11 268.46 0 1500
Land rent RMB 68.96 180.57 0 1500
Other cost RMB 31.29 47.93 0 275
3. Result and Discussion
3.1. Technical efficiency
The TE score of original data are reported in Table 2. Farm level TE of Chinese litchi
farms were attain by employing DEAP 2.1 computer program (Coelli 1996). The Table
represents TE and SE under both of the CRS and VRS technology of input and output-
oriented DEA approach. Result revealed that the average TE score of output-oriented for CRS
and VRS technology are 0.727 and 0.804 respectively, which imply that the VRS technology
is more flexible than the CRS technology and data under VRS envelop in a tighter way.
Table 2: Estimated technical efficiency and scale efficiency using DEA Particulars Input oriented Output oriented
TECRS TEVRS SE TECRS TEVRS SE
Mean 0.727 0.773 0.881 0.727 0.804 0.908
Std. dev 0.254 0.254 0.178 0.254 0.244 0.145
Maximum 1.000 1.000 1.000 1.000 1.000 1.000
Minimum 0.171 0.194 0.110 0.171 0.181 0.334
IRS (%) - - 48 - - 27
CRS (%) - - 29 - - 33
DRS (%) - - 23 - - 40
The average TE under VRS is 80% with a range from 18% to 100%, which implies
that the average litchi farm households are potential for producing 80% of output with fixed
level of input. It is also suggests that if farmers use their resources more effectively they are
Analysis of farm household technical efficiency in Chinese litchi farm using bootstrap DEA
Bagchi, M.; Zhuang, L.
Custos e @gronegócio on line - v. 12, n. 4 – Oct/Dec - 2016. ISSN 1808-2882
www.custoseagronegocioonline.com.br
385
able to increase the output quantities by 20%. It is also clear from the Table 2 that the mean
TE score in input oriented VRS frontier is 77% with a range from 19% to 100%, which is
lower than the output oriented technical efficiency score.
The mean TE scores 77% indicate the mean potentiality of litchi farmers is 23% for
saving the input. It also demonstrates that average litchi farmers can reduce their input by
23% for producing same level of output quantities. Our estimated technical efficiency (0.804)
is generally comparable with the result obtained by Chen et al., (2009), which were 0.80,
0.85, 0.73, and 0.69 for North, Northeast, East and Southwest part of China, respectively, and
with the result of Feng (2008), who estimate the technical efficiency of 0.82 for Jiangxi
province and Chen and Song (2008), which was 0.803 for China as a whole.
The estimated TE of this study is higher than the TE by Bagchi and Yao (2013) who
estimates TE for VRS and CRS are 0.772 and 0.746 respectively for Bangladeshi rice farm,
the result of Madau (2012), which were 0.711 and 0.643 for VRS and CRS respectively in
case of Italian citrus fruits, but lower than the Chinese rice grower which were 0.91, 0.89 and
0.80 and for early rice, late rice and one-season rice, respectively (Tan, et al. 2010) and
wheat grower technical efficiency (0.870) Wilson et al., (2001).
3.2. Comparing efficiency score between original and bias-corrected DEA
Now we consider the bias corrected technical efficiency result obtained by
bootstrapping to DEA approach which is somewhat different from the original efficiency
scores. Table 3 compare the results of output oriented DEA efficiency scores under VRS and
the corresponding bias corrected bootstrapped technical efficiency scores with lower and
upper bound.
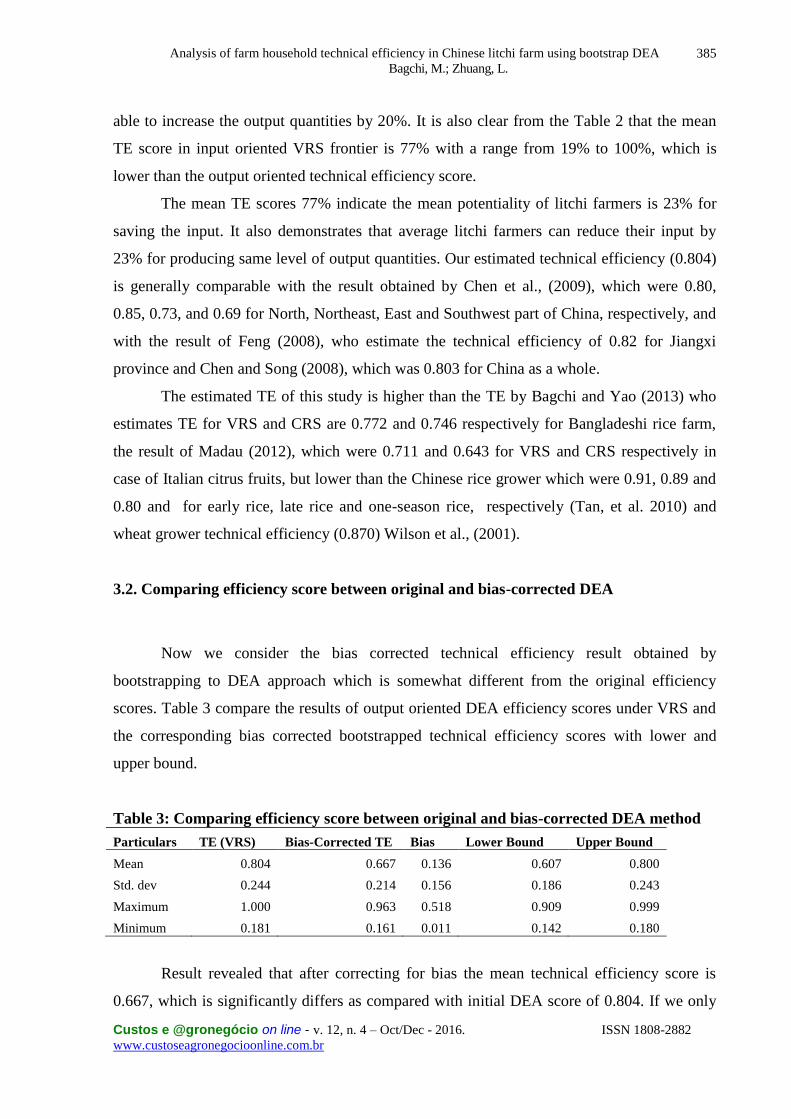
Table 3: Comparing efficiency score between original and bias-corrected DEA method
Particulars TE (VRS) Bias-Corrected TE Bias Lower Bound Upper Bound
Mean 0.804 0.667 0.136 0.607 0.800
Std. dev 0.244 0.214 0.156 0.186 0.243
Maximum 1.000 0.963 0.518 0.909 0.999
Minimum 0.181 0.161 0.011 0.142 0.180
Result revealed that after correcting for bias the mean technical efficiency score is
0.667, which is significantly differs as compared with initial DEA score of 0.804. If we only

Analysis of farm household technical efficiency in Chinese litchi farm using bootstrap DEA
Bagchi, M.; Zhuang, L.
Custos e @gronegócio on line - v. 12, n. 4 – Oct/Dec - 2016. ISSN 1808-2882
www.custoseagronegocioonline.com.br
386
know the original score, it means that average litchi farms have the potentiality for producing
80% of outputs. But after correcting for bias, farms have the potentiality for producing 66% of
output by same level of input as before. The bias corrected bootstrapped technical efficiency
scores is depicted in Figure 2 with upper and lower bound.
Figure 2: Bias-corrected technical efficiency score with upper bound and lower bound
In addition, the means with relatively large bias and confidence intervals implying
wide variation in efficiency scores. Relatively wider confidence intervals of efficiency score
demonstrate the additional justification for bootstrapping. After using bootstrap technique to
DEA, technical efficiency score is significantly lower than the initial DEA score is supported
by Abatania et al., (2012), Simer and Wilson (2000) and Emili et al., (2007).
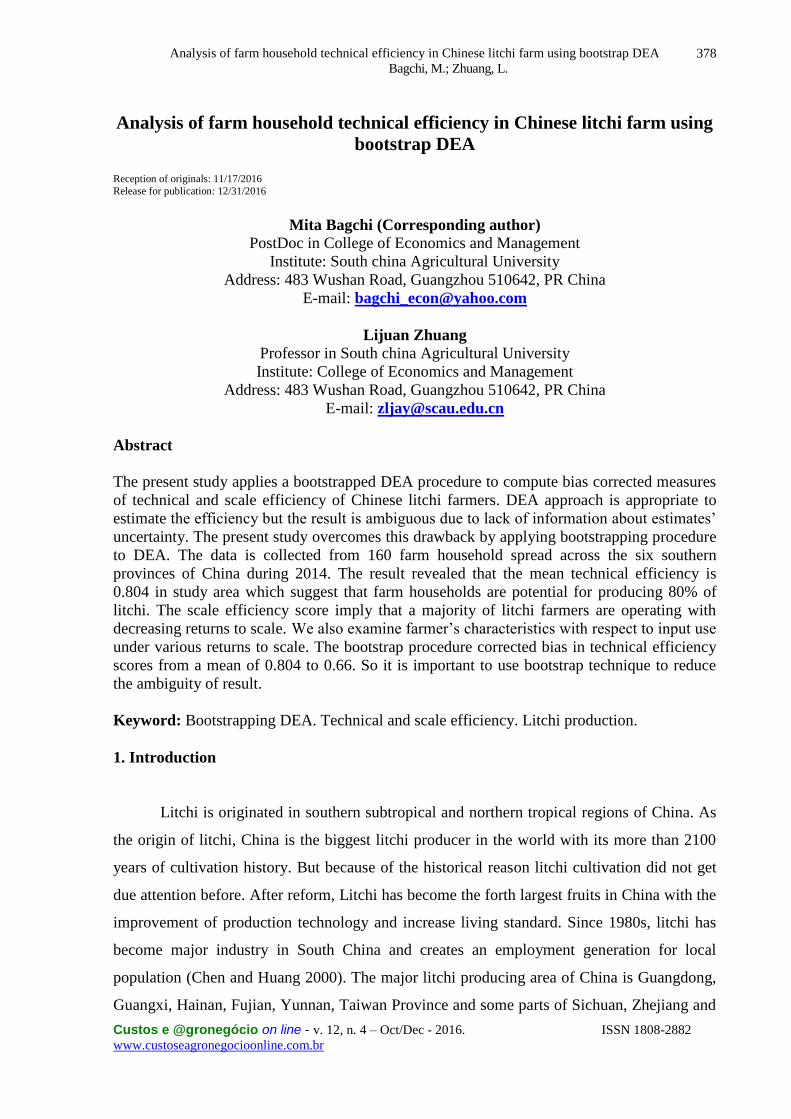
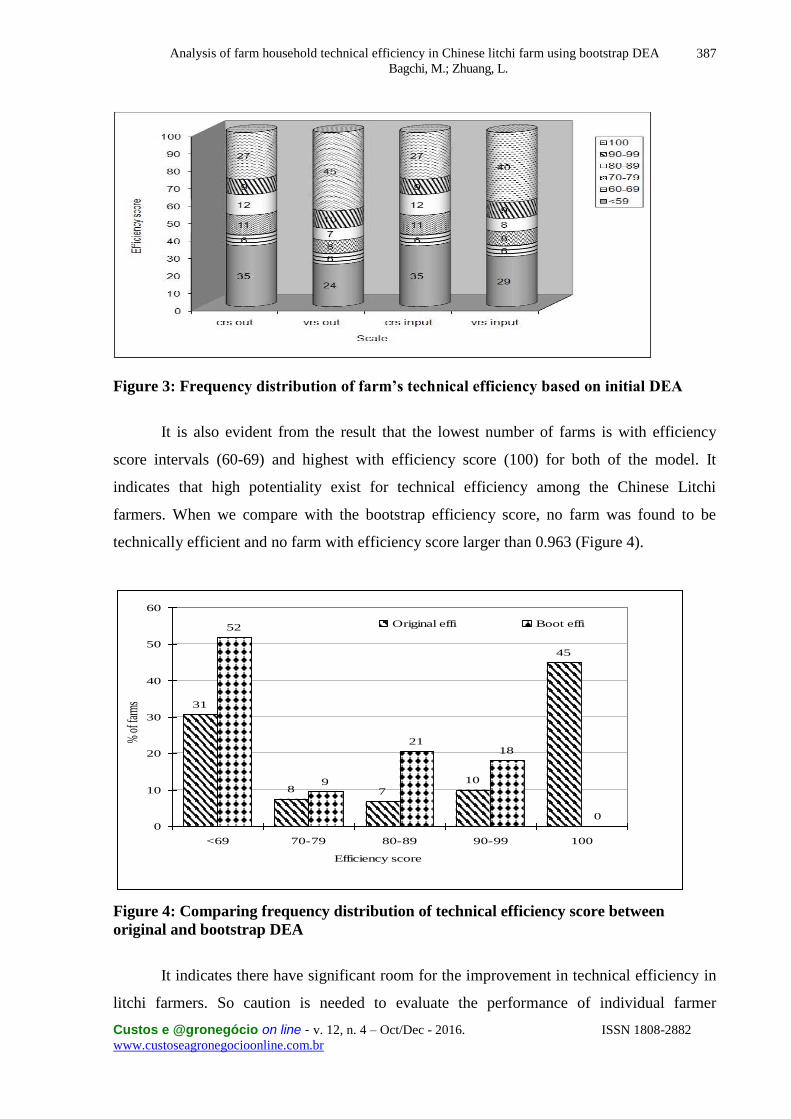
The frequency distribution of Chinese litchi farm based on original DEA is
represented in figure 3. Figure depict that in output oriented 45% farm households are fully
technically efficient in VRS model while it is 27% for CRS model. But in input-oriented case
fully technically efficient farm households are 40% under VRS and 27% under CRS.
Analysis of farm household technical efficiency in Chinese litchi farm using bootstrap DEA
Bagchi, M.; Zhuang, L.
Custos e @gronegócio on line - v. 12, n. 4 – Oct/Dec - 2016. ISSN 1808-2882
www.custoseagronegocioonline.com.br
387
Figure 3: Frequency distribution of farm’s technical efficiency based on initial DEA
It is also evident from the result that the lowest number of farms is with efficiency
score intervals (60-69) and highest with efficiency score (100) for both of the model. It
indicates that high potentiality exist for technical efficiency among the Chinese Litchi
farmers. When we compare with the bootstrap efficiency score, no farm was found to be
technically efficient and no farm with efficiency score larger than 0.963 (Figure 4).
31
8 7
45
52
9
2118
0
10
0
10
20
30
40
50
60
<69 70-79 80-89 90-99 100
Efficiency score
% o
f far
ms
Original effi Boot effi
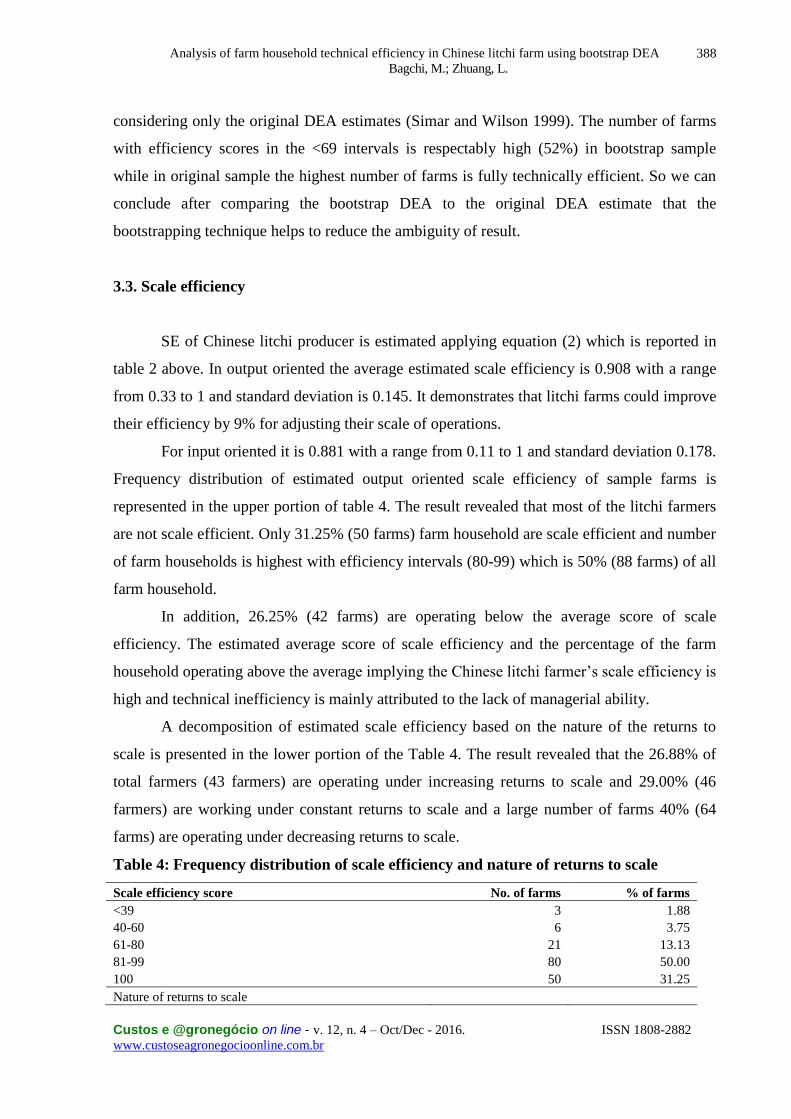
Figure 4: Comparing frequency distribution of technical efficiency score between
original and bootstrap DEA
It indicates there have significant room for the improvement in technical efficiency in
litchi farmers. So caution is needed to evaluate the performance of individual farmer
Analysis of farm household technical efficiency in Chinese litchi farm using bootstrap DEA
Bagchi, M.; Zhuang, L.
Custos e @gronegócio on line - v. 12, n. 4 – Oct/Dec - 2016. ISSN 1808-2882
www.custoseagronegocioonline.com.br
388
considering only the original DEA estimates (Simar and Wilson 1999). The number of farms
with efficiency scores in the <69 intervals is respectably high (52%) in bootstrap sample
while in original sample the highest number of farms is fully technically efficient. So we can
conclude after comparing the bootstrap DEA to the original DEA estimate that the
bootstrapping technique helps to reduce the ambiguity of result.
3.3. Scale efficiency
SE of Chinese litchi producer is estimated applying equation (2) which is reported in
table 2 above. In output oriented the average estimated scale efficiency is 0.908 with a range
from 0.33 to 1 and standard deviation is 0.145. It demonstrates that litchi farms could improve
their efficiency by 9% for adjusting their scale of operations.
For input oriented it is 0.881 with a range from 0.11 to 1 and standard deviation 0.178.
Frequency distribution of estimated output oriented scale efficiency of sample farms is
represented in the upper portion of table 4. The result revealed that most of the litchi farmers
are not scale efficient. Only 31.25% (50 farms) farm household are scale efficient and number
of farm households is highest with efficiency intervals (80-99) which is 50% (88 farms) of all
farm household.
In addition, 26.25% (42 farms) are operating below the average score of scale
efficiency. The estimated average score of scale efficiency and the percentage of the farm
household operating above the average implying the Chinese litchi farmer’s scale efficiency is
high and technical inefficiency is mainly attributed to the lack of managerial ability.
A decomposition of estimated scale efficiency based on the nature of the returns to
scale is presented in the lower portion of the Table 4. The result revealed that the 26.88% of
total farmers (43 farmers) are operating under increasing returns to scale and 29.00% (46
farmers) are working under constant returns to scale and a large number of farms 40% (64
farms) are operating under decreasing returns to scale.
Table 4: Frequency distribution of scale efficiency and nature of returns to scale
Scale efficiency score No. of farms % of farms
<39 3 1.88
40-60 6 3.75
61-80 21 13.13
81-99 80 50.00
100 50 31.25
Nature of returns to scale
Analysis of farm household technical efficiency in Chinese litchi farm using bootstrap DEA
Bagchi, M.; Zhuang, L.
Custos e @gronegócio on line - v. 12, n. 4 – Oct/Dec - 2016. ISSN 1808-2882
www.custoseagronegocioonline.com.br
389
Increasing Returns to scale(IRS) 43 26.88
Constant Returns to Scale (CRS) 46 29.00
Decreasing returns to Scale (DRS) 64 40.00
Most productive scale size (MPSS) 7 4.00
Only seven farmers which are 4.00% of the total sample farmers are operating with
most productive scale size which are technically inefficient but scale efficient.
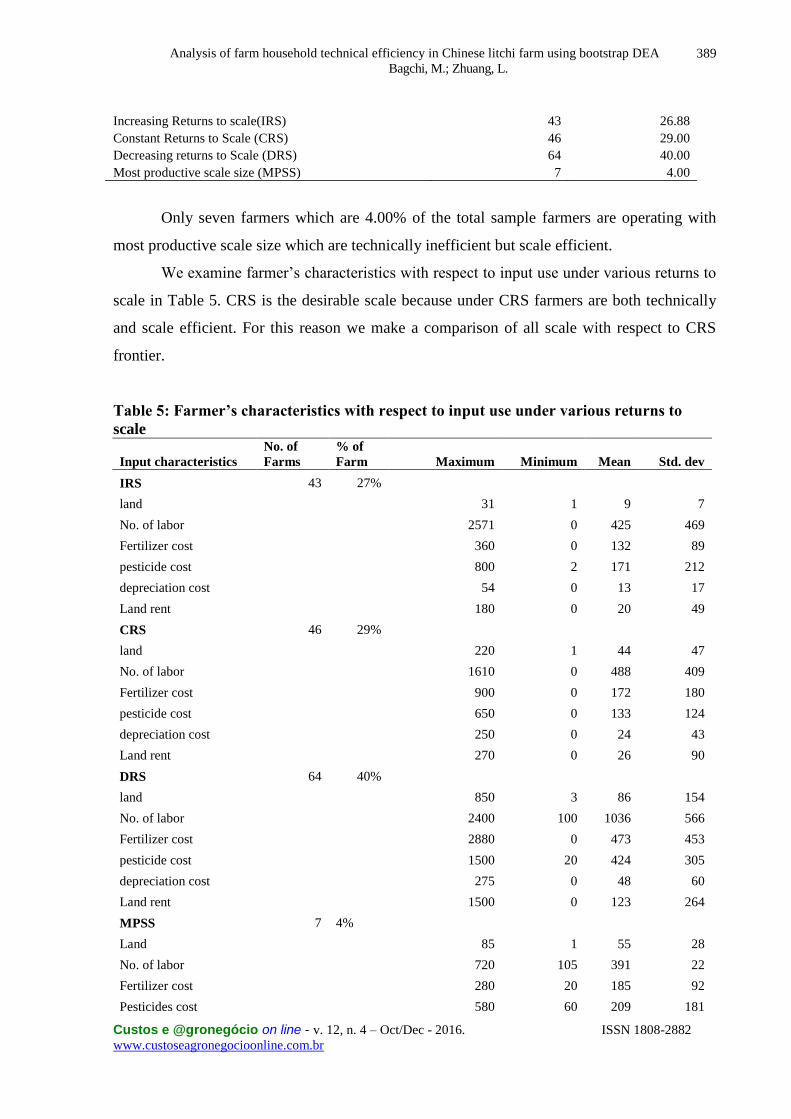
We examine farmer’s characteristics with respect to input use under various returns to
scale in Table 5. CRS is the desirable scale because under CRS farmers are both technically
and scale efficient. For this reason we make a comparison of all scale with respect to CRS
frontier.
Table 5: Farmer’s characteristics with respect to input use under various returns to
scale
Input characteristics
No. of
Farms
% of
Farm Maximum Minimum Mean Std. dev
IRS 43 27%
land 31 1 9 7
No. of labor 2571 0 425 469
Fertilizer cost 360 0 132 89
pesticide cost 800 2 171 212
depreciation cost 54 0 13 17
Land rent 180 0 20 49
CRS 46 29%
land 220 1 44 47
No. of labor 1610 0 488 409
Fertilizer cost 900 0 172 180
pesticide cost 650 0 133 124
depreciation cost 250 0 24 43
Land rent 270 0 26 90
DRS 64 40%
land 850 3 86 154
No. of labor 2400 100 1036 566
Fertilizer cost 2880 0 473 453
pesticide cost 1500 20 424 305
depreciation cost 275 0 48 60
Land rent 1500 0 123 264
MPSS 7 4%
Land 85 1 55 28
No. of labor 720 105 391 22
Fertilizer cost 280 20 185 92
Pesticides cost 580 60 209 181
Analysis of farm household technical efficiency in Chinese litchi farm using bootstrap DEA
Bagchi, M.; Zhuang, L.
Custos e @gronegócio on line - v. 12, n. 4 – Oct/Dec - 2016. ISSN 1808-2882
www.custoseagronegocioonline.com.br
390
Depreciation cost 75 15 44 25
Land rent 80 0 19 30
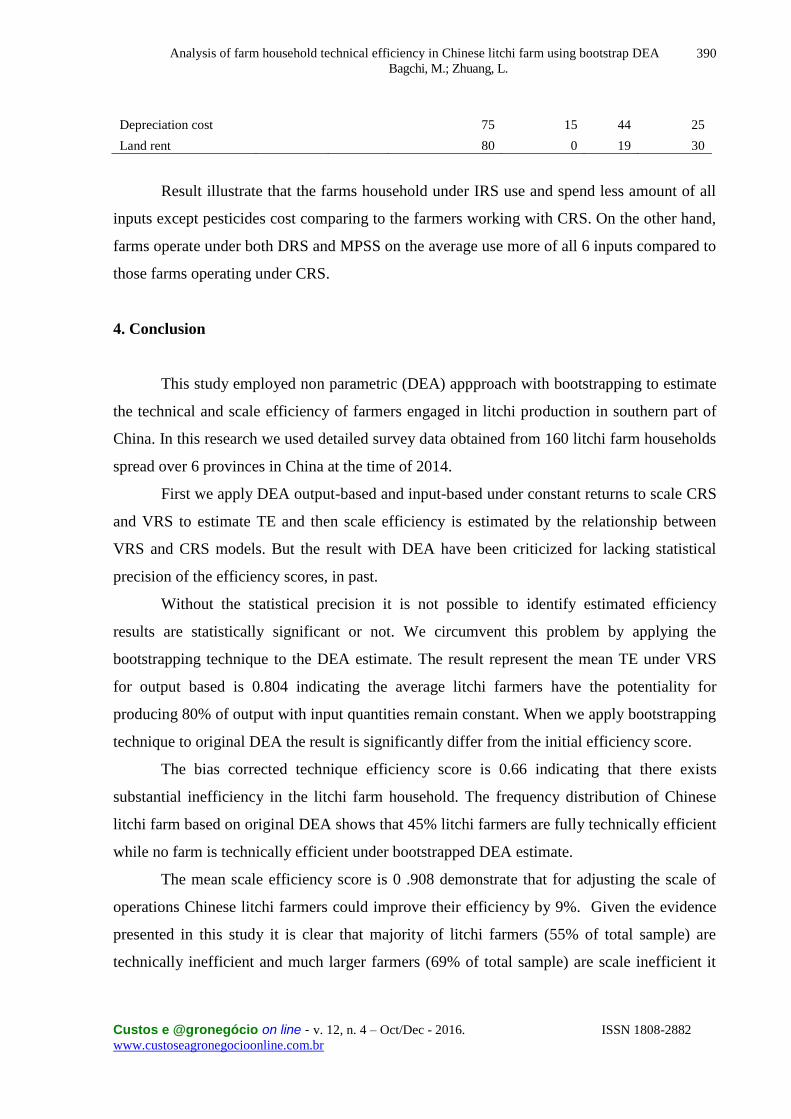
Result illustrate that the farms household under IRS use and spend less amount of all
inputs except pesticides cost comparing to the farmers working with CRS. On the other hand,
farms operate under both DRS and MPSS on the average use more of all 6 inputs compared to
those farms operating under CRS.
4. Conclusion
This study employed non parametric (DEA) appproach with bootstrapping to estimate
the technical and scale efficiency of farmers engaged in litchi production in southern part of
China. In this research we used detailed survey data obtained from 160 litchi farm households
spread over 6 provinces in China at the time of 2014.
First we apply DEA output-based and input-based under constant returns to scale CRS
and VRS to estimate TE and then scale efficiency is estimated by the relationship between
VRS and CRS models. But the result with DEA have been criticized for lacking statistical
precision of the efficiency scores, in past.
Without the statistical precision it is not possible to identify estimated efficiency
results are statistically significant or not. We circumvent this problem by applying the
bootstrapping technique to the DEA estimate. The result represent the mean TE under VRS
for output based is 0.804 indicating the average litchi farmers have the potentiality for
producing 80% of output with input quantities remain constant. When we apply bootstrapping
technique to original DEA the result is significantly differ from the initial efficiency score.
The bias corrected technique efficiency score is 0.66 indicating that there exists
substantial inefficiency in the litchi farm household. The frequency distribution of Chinese
litchi farm based on original DEA shows that 45% litchi farmers are fully technically efficient
while no farm is technically efficient under bootstrapped DEA estimate.
The mean scale efficiency score is 0 .908 demonstrate that for adjusting the scale of
operations Chinese litchi farmers could improve their efficiency by 9%. Given the evidence
presented in this study it is clear that majority of litchi farmers (55% of total sample) are
technically inefficient and much larger farmers (69% of total sample) are scale inefficient it
Analysis of farm household technical efficiency in Chinese litchi farm using bootstrap DEA
Bagchi, M.; Zhuang, L.
Custos e @gronegócio on line - v. 12, n. 4 – Oct/Dec - 2016. ISSN 1808-2882
www.custoseagronegocioonline.com.br
391
would be suggest to make every effort to convert inefficient farmers to the efficient in litchi
production.
5. References
ALAM, M.J.;VAN HUYLENBROECK, G.;BUYSSE, J.;BEGUM, I.A.;RAHMAN, S.,
Technical efficiency changes at the farm-level: A panel data analysis of rice farms in
Bangladesh, African Journal of Business Management, vol. 5, p. 5559, 2011.
BAGCHI, M.;SHUNBO, Y., IMPACT OF FARMER'S MANAGEMENT
CHARACTERISTICS ON TECHNICAL EFFICIENCY OF RICE FARM IN
BANGLADESH, Metalurgia International, vol. 18, p. 142, 2013.
BOZOĞLU, M.;CEYHAN, V., Measuring the technical efficiency and exploring the
inefficiency determinants of vegetable farms in Samsun province, Turkey, Agricultural
systems, vol. 94, pp. 649-656, 2007.
CAVES, D.W.;CHRISTENSEN, L.R.;DIEWERT, W.E., The economic theory of index
numbers and the measurement of input, output, and productivity, Econometrica: Journal of
the Econometric Society, pp. 1393-1414, 1982.
CHEN, H.;HUANG, H., China litchi industry: Development, achievements and problems, in I
International Symposium on Litchi and Longan 558, 2000, pp. 31-39.
CHEN, Z.;HUFFMAN, W.E.;ROZELLE, S., Farm technology and technical efficiency:
Evidence from four regions in China, China Economic Review, vol. 20, pp. 153-161, 2009.
COELLI, T., A guide to DEAP version 2.1: a data envelopment analysis (computer) program,
Centre for Efficiency and Productivity Analysis, University of New England, Australia, 1996.
Analysis of farm household technical efficiency in Chinese litchi farm using bootstrap DEA
Bagchi, M.; Zhuang, L.
Custos e @gronegócio on line - v. 12, n. 4 – Oct/Dec - 2016. ISSN 1808-2882
www.custoseagronegocioonline.com.br
392
COELLI, T.;RAHMAN, S.;THIRTLE, C., Technical, Allocative, Cost and Scale Efficiencies
in Bangladesh Rice Cultivation: A Non‐parametric Approach, Journal of Agricultural
Economics, vol. 53, pp. 607-626, 2002.
FÄRE, R.;GROSSKOPF, S.;LOVELL, C.K., The measurement of efficiency of production
vol. 6: Springer Science & Business Media, 2013.
FENG, S., Land rental, off-farm employment and technical efficiency of farm households in
Jiangxi Province, China, NJAS-Wageningen Journal of Life Sciences, vol. 55, pp. 363-378,
2008.
HEADEY, D.;ALAUDDIN, M.;RAO, D., Explaining agricultural productivity growth: an
international perspective, Agricultural Economics, vol. 41, pp. 1-14, 2010.
HORMOZI, M.A.;ASOODAR, M.A.;ABDESHAHI, A., Impact of mechanization on
technical efficiency: A case study of rice farmers in Iran, Procedia Economics and Finance,
vol. 1, pp. 176-185, 2012.
KOČIŠOVÁ, K., Application of the DEA on the measurement of efficiency in the EU
countries, Agric. Econ.–Czech, vol. 61, pp. 51-62, 2015.
MADAU, F.A., Technical and scale efficiency in the Italian citrus farming: A comparison
between stochastic frontier analysis (SFA) and data envelopment analysis (DEA) models,
2012.
MIRZA, F.M.;NAJAM, N.;MEHDI, M.;AHMAD, B., DETERMINANTS OF TECHNICAL
EFFICIENCY OF WHEAT FARMS IN PAKISTAN, Pak. J. Agri. Sci, vol. 52, pp. 565-570,
2015.
MORSHED, M.;SHAN-NI, C., An Empirical Study on International Competitiveness of
Litchi and Longan Industry in China, Science Journal of Economics, vol. 2012, 2012.
SIMAR, L.;WILSON, P.W., Estimating and bootstrapping Malmquist indices, European
Analysis of farm household technical efficiency in Chinese litchi farm using bootstrap DEA
Bagchi, M.; Zhuang, L.
Custos e @gronegócio on line - v. 12, n. 4 – Oct/Dec - 2016. ISSN 1808-2882
www.custoseagronegocioonline.com.br
393
Journal of Operational Research, vol. 115, pp. 459-471, 1999.
SIMAR, L.;WILSON, P.W., Statistical inference in nonparametric frontier models: The state
of the art, Journal of productivity analysis, vol. 13, pp. 49-78, 2000.
TAN, S.;HEERINK, N.;KUYVENHOVEN, A.;QU, F., Impact of land fragmentation on rice
producers’ technical efficiency in South-East China, NJAS-Wageningen Journal of Life
Sciences, vol. 57, pp. 117-123, 2010.
WILSON, P.;HADLEY, D.;ASBY, C., The influence of management characteristics on the
technical efficiency of wheat farmers in eastern England, Agricultural Economics, vol. 24, pp.
329-338, 2001.
WU, Y.;YI, G.;ZHOU, B.;ZENG, J.;HUANG, Y., The advancement of research on litchi and
longan germplasm resources in China, Scientia horticulturae, vol. 114, pp. 143-150, 2007.
Acknowledgment
This research was financially supported by “The Modern Agricultural Industry Technology
System Set up Special Project Lychee & Longan Industry Development and Policy Research
(CARS-33-16)”.
Recommended