Analysis of interspecific variation in plant growthresponses to nitrogen
Daniel R. Taub
Abstract: Plant species differ greatly in their growth responses to nutrients, but little is known about the physiologicaland morphological factors that are responsible for this variation. To address this question, I measured the responses toadded nitrogen of relative growth rate and three of its components (specific leaf area, unit leaf rate, and leaf weight ra-tio) for 17 C3 grass species. Plants were grown in sand culture in a greenhouse and were fertilized daily with either 5or 0.05 mM NH4NO3. For most species, growth response to nitrogen was primarily associated with an increased massallocation to leaves at high versus low nitrogen. Across all species, the average response at high versus low nitrogenwas a 37% increase in leaf weight ratio, a 12% increase in unit leaf rate, and a 4% decrease in specific leaf area.Interspecific differences in growth response to nitrogen, however, were associated primarily with species differences inthe response of unit leaf area to nitrogen supply. I determined the nitrogen response ratio of each parameter as thevalue of the parameter at high nitrogen divided by the value at low nitrogen. The rank-order correlation between theunit leaf area response ratio and the relative growth rate response ratio was 0.88. Reanalysis of previous experimentson plant nutrient response showed a similar pattern. In all studies, interspecific variation in the response of relativegrowth rate to nutrients was associated primarily with interspecific differences in the plastic response of unit leaf area.
Key words: leaf weight ratio, net assimilation rate, plant growth analysis, relative growth rate, specific leaf area, unitleaf rate.
Résumé: Les espèces végétales réagissent très différemment aux nutriments, mais on sait peu de choses sur les fac-teurs morphologiques et physiologiques responsables de ces variations. Pour aborder cette question, l’auteur à mesuréles réactions à l’addition d’azote, au niveau du taux relatif de croissance et de trois de ses composantes (surface fo-liaire spécifique, taux foliaire unitaire et rapport du poids foliaire) chez 17 espèces de graminées en C3. Il a cultivé cesplantes en serre dans du sable avec fertilisation quotidienne, en utilisant du NH4NO3 5 mM ou 0,05 mM. Chez la plu-part des espèces, la réaction de croissance à l’azote est surtout associée avec une augmentation de l’allocation demasse dans les feuilles, avec l’azote élevé vs l’azote faible. Chez toutes les espèces, la réaction moyenne envers l’azoteélevé versus l’azote faible se traduit par une augmentation de 37% dans le rapport du poids foliaire, de 12% dans letaux foliaire unitaire et par une diminution de 4% de la surface foliaire spécifique. Cependant, les différences interspé-cifiques dans la réaction de croissance à l’azote sont associées surtout avec des différences spécifiques dans la réactionau niveau de la surface foliaire unitaire par rapport à l’apport en azote. L’auteur a déterminé le rapport de la réaction àl’azote pour chaque paramètre comme la valeur du paramètre avec l’azote élevé divisé par la valeur avec l’azote faible.La corrélation par ordination entre le rapport de la réaction de la surface foliaire unitaire et la réaction du taux decroissance relative est de 0,88. Un réexamen d’expérience précédentes sur les réactions nutritionnelles montre un patronsimilaire. Dans toutes les études, la variation interspécifique en réaction au taux relatif de croissance envers les nutri-ments est associée surtout avec les différences interspécifiques dans la réaction plastique de la surface foliaire unitaire.
Mots clés: rapport de poids foliaire, taux net d’assimilation, analyse de la croissance foliaire, taux relatif de croissance,surface foliaire spécifique, taux d’unité foliaire.
[Traduit par la Rédaction] 41TaubIntroduction
Plant species differ greatly in their growth responses to nu-trients, particularly nitrogen. In one well-known study, Shipleyand Keddy (1988) examined the growth of 28 species of plants
fertilized with full-strength and 1/10 strength Hoagland’s solu-tion. Growth response to nutrient supply varied greatly amongspecies. Relative growth rate (RGR) (change in plant weightper plant weight per time) increased in the high-nutrient treat-ment by 11% for the least and 850% for the most responsivespecies. Many other studies have also shown substantialinterspecific differences in the degree to which growth is stim-ulated by nutrients (e.g., Bradshaw et al. 1964; Fichtner andSchulze 1992; Meziane and Shipley 1999).
Such interspecific differences in growth response to nutri-ents are likely to be an important determinant of species dis-tribution across natural fertility gradients. An ability torespond to added nutrients with increased growth is often the-orized to be an important component of success in fertile en-
Can. J. Bot.80: 34–41 (2002) DOI: 10.1139/B01-134 © 2002 NRC Canada
34
Received 13 July 2001. Published on the NRC ResearchPress Web site at http://canjbot.nrc.ca on 30 January 2002.
D.R. Taub.1 Department of Ecology and Evolution, StateUniversity of New York, Stony Brook, NY 11794, U.S.A.
1Present address: Department of Biology, SouthwesternUniversity, P.O. Box 770, Georgetown, TX 78627, U.S.A.(email: [email protected]).
J:\cjb\cjb80\cjb-01\B01-134.vpWednesday, January 23, 2002 2:04:39 PM
Color profile: Generic CMYK printer profileComposite Default screen
vironments. Species that occur naturally in highly fertileenvironments typically have a larger growth response to nutri-ents than species found in less fertile habitats (Chapin 1980;Fichtner and Schulze 1992; Schulze and Chapin 1987). Inspite of the potential ecological importance of interspecificvariation in growth responses to nutrients, relatively few stud-ies have explored the morphological or physiological differ-ences among species that underlie this variation. Mostinterspecific analyses of the morphological or physiologicalcorrelates of growth rate have compared a group of species atonly one level of nutrient supply, typically at levels intendedto maximize plant growth (Grime and Hunt 1975; Hunt et al.1993; Lambers and Poorter 1992). These previous studieshave generated insights into species differences in growthrates in nutrient-rich conditions, often through use of the tech-niques of plant growth analysis (Hunt 1990). The most com-mon method decomposes RGR into three factors: unit leafrate (ULR) (synonymous with net assimilation rate, rate ofdry weight increase per leaf area), specific leaf area (SLA)(leaf area per leaf mass), and leaf weight ratio (LWR) (leafweight per total weight):
[1] RGR = ULR × SLA × LWR
Under conditions that allow near-maximum growth rates,interspecific differences in RGR among herbaceous plantspecies are usually associated with differences in SLA, withinterspecific variation in LWR and ULR playing a much lessimportant role (Lambers and Dijkstra 1987; Poorter 1990;Poorter and van der Werf 1998). For woody species,interspecific variation in RGR is also usually associated withSLA and is additionally correlated with LWR in some stud-ies (e.g., Cornelissen et al. 1998) but not in others (e.g.,Huante et al. 1995a).
While these studies have generated insight into speciesdifferences in growth under nutrient-rich conditions, theyhave not examined interspecific differences in the degree towhich growth is stimulated by nutrients. Insight into suchplastic responses to nutrients may be gained by a simple ex-tension of the standard growth analysis techniques. There-sponse of growth to an environmental variable such asnutrient supply can be decomposed into several components:
[2]RGRRGR
ULRULR
SLASLA
LWRLWR
1
2
1
2
1
2
1
2
= ´ ´
where the subscripts represent different environmental con-ditions (in the present case, nutrient supply). Equation 2states that the response of growth to a change in nutrientsupply (or other environmental variation) is the product ofthe responses of ULR, SLA, and LWR to the changed nutri-ent supply. This approach allows us to consider the relativeimportance of plastic response in these factors in determin-ing growth response to nutrients. This approach does not ap-pear to have been used previously, although Bunce (1997)used a very similar analysis to examine plant growth re-sponses to atmospheric CO2.
To apply this approach to the examination of growth re-sponses to nitrogen, I measured RGR, ULR, SLA, and LWRfor 17 C3 grass species grown in a greenhouse at two levelsof nitrogen supply. These species included some that aretypically found in nutrient-poor sites (Deschampsia flexuosa,
Festuca ovina, Poa compressa) and others that occur typi-cally on fertile soils (Elymus riparius, Glyceria grandis,Phalaris arundinacea, Phleum pratense) as well as addi-tional species that occur in habitats of intermediate fertilityor are found in sites over a wide range of fertility. In addi-tion, I applied the analysis shown in eq. 2 to previously pub-lished results by other authors to examine the generality ofthe findings of this study.
Materials and methods
Seeds of Agrostis gigantea, Anthoxanthum odoratum,Bromus inermis, Dactylis glomerata, Deschampsia flexuosa,Elymus virginicus, Festuca ovina, Phalaris arundinacea,Phleum pratense, and Poa compressawere collected frompopulations on Long Island, New York (specific nomencla-ture follows Gleason and Cronquist (1991)). Caryopses ofBromus kalmii, Elymus canadensis, Elymus hystrix, Elymusriparius, Elymus trachycaulus, and Glyceria grandiswereobtained commercially from Prairie Moon Nursery (Winona,Minn.) and originated from populations in Iowa, Minnesota,and Wisconsin. Seeds ofFestuca elatiorwere obtained fromthe U.S. Department of Agriculture Western Regional PlantIntroduction Station (accession No. 304844) and originatedfrom a population in New Hampshire.
Plants were grown in the Life Sciences greenhouse at theState University of New York at Stony Brook. Seeds weregerminated in flats of sand watered with deionized water.In order to synchronize germination, planting dates foreach species varied based on prior germination tests. Seed-lings were transplanted at emergence into plastic pots con-taining 600 mL of washed sand (one plant per pot). Plantswere grown during the period 20 March – 19 April 1996under natural light, with an estimated maximumphotosynthetically active photon flux density of 1150mmolphotons·m–2·s–1. Mean daily minimum and maximum tem-peratures were 18 and 28°C, respectively. Pots were wa-tered to excess daily with a modified Johnson solution(Fichtner and Schulze 1992) containing 2 mM K2PO4,1 mM CaSO4, 2 mM MgSO4, 40mM FeNa EDTA, 50mMKCl, 33 mM H3BO4, 2 mM MnSO4, 2 mM ZnSO4, 0.5mMCuSO4, and 0.5mM MoO3. The pH was adjusted to 5.8with H3PO4. Nitrogen was varied as NH4NO3 at concentra-tions of 0.05 and 5 mM. Nutrient solution was delivered viaa drip-irrigation system arranged so that lines delivering 5and 0.05 mM nitrogen solution alternated on the green-house bench (12 irrigation lines in all). Pots receiving 5and 0.05 mM nitrogen were therefore arranged in alternat-ing rows as well.
Plants were assigned at random to nitrogen treatment, har-vest date (see below), and position on the greenhouse bench.Harvests were scheduled for days 7, 10, 13, 16, 19, and 22 af-ter emergence, although for logistical reasons, a small numberof plants were harvested at other ages (all between 7 and22 days postemergence). The original design called for fourplants per species per treatment per harvest date for a total of24 plants per species and treatment. As it became clear thatsome species would not germinate sufficiently to be includedin the experiment, their bench space was assigned to otherspecies according to the availability of emerging seedlings.
© 2002 NRC Canada
Taub 35
J:\cjb\cjb80\cjb-01\B01-134.vpWednesday, January 23, 2002 2:04:40 PM
Color profile: Generic CMYK printer profileComposite Default screen
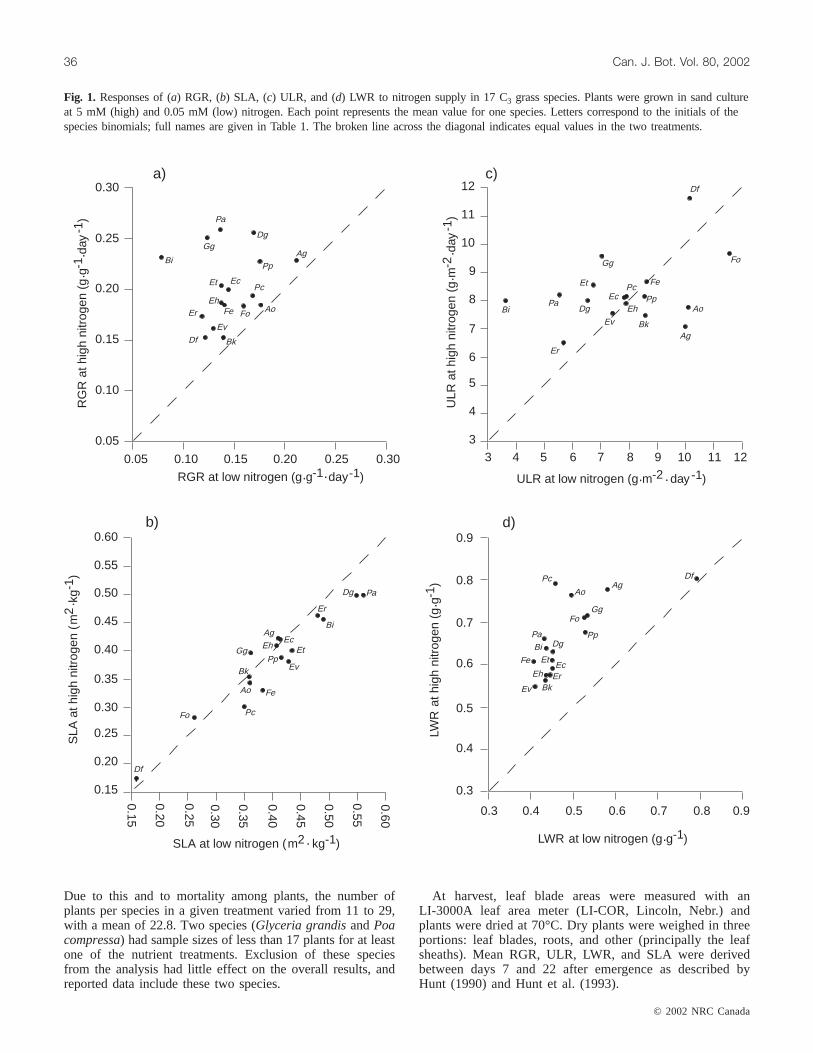
Due to this and to mortality among plants, the number ofplants per species in a given treatment varied from 11 to 29,with a mean of 22.8. Two species (Glyceria grandisandPoacompressa) had sample sizes of less than 17 plants for at leastone of the nutrient treatments. Exclusion of these speciesfrom the analysis had little effect on the overall results, andreported data include these two species.
At harvest, leaf blade areas were measured with anLI-3000A leaf area meter (LI-COR, Lincoln, Nebr.) andplants were dried at 70°C. Dry plants were weighed in threeportions: leaf blades, roots, and other (principally the leafsheaths). Mean RGR, ULR, LWR, and SLA were derivedbetween days 7 and 22 after emergence as described byHunt (1990) and Hunt et al. (1993).
© 2002 NRC Canada
36 Can. J. Bot. Vol. 80, 2002
0.10 0.15 0.20 0.25 0.300.05
0.05
0.10
0.15
0.20
0.25
0.30
RG
Rat
hig
h ni
trog
en (
gg ·-1
·day
-1)
RGR at low nitrogen (g g· -1·day-1)
a)
0.15
0.20
0.25
0.30
0.35
0.40
0.45
0.50
0.55
0.60
0.15
0.20
0.25
0.30
0.35
0.40
0.45
0.50
0.55
0.60
SLA
at h
igh
nitr
ogen
(m
2·k
g-1 )
SLA at low nitrogen (m2·kg-1)
3
4
5
6
7
8
9
10
11
12
4 5 6 7 8 9 10 11 123
ULR at low nitrogen (g m· -2·day -1)
ULR
at h
igh
nitr
ogen
(g
m ·-2
·day
-1)
c)
0.3 0.4 0.5 0.6 0.7 0.8 0.9
0.3
0.4
0.5
0.6
0.7
0.8
0.9
LWR at low nitrogen (g g· -1)
LWR
at h
igh
nitr
ogen
(g
g ·-1
)
d)b)
Df Bk
Ev
ErEh
Fe Fo Ao
PcEcEt
BiPp
AgGg
Dg
Pa
Er
AgBkEv
AoPp
Pc
EhEc
DgPa
Bi
Et Fe
Gg Fo
Df
Df
Fo Pc
FeAo
Bk
Gg
EvPp
EtEhEc
AgBi
Er
Dg Pa
Ev Bk
Eh ErEcFe Et
DgBiPa Pp
FoGg
AoAg
Pc Df
Fig. 1. Responses of (a) RGR, (b) SLA, (c) ULR, and (d) LWR to nitrogen supply in 17 C3 grass species. Plants were grown in sand cultureat 5 mM (high) and 0.05 mM (low) nitrogen. Each point represents the mean value for one species. Letters correspond to the initials of thespecies binomials; full names are given in Table 1. The broken line across the diagonal indicates equal values in the two treatments.
J:\cjb\cjb80\cjb-01\B01-134.vpWednesday, January 23, 2002 2:04:40 PM
Color profile: Generic CMYK printer profileComposite Default screen
© 2002 NRC Canada
Taub 37
0.10
0.05
0.15
0.20
0.25
0.30
3 4 5 6 7 8 9 10 12
0.10
0.05
0.15
0.20
0.25
0.30
ULR (g m· -2 day· -1)
b)
Spearman r = 0.13
11
0.10
0.05
0.15
0.20
0.25
0.30
3 4 5 6 7 8 9 10 11 12
ULR (g m· -2 day· -1)
e)
Spearman r = 0.52*
0.3 0.4 0.5 0.6 0.7 0.8 0.9
0.10
0.05
0.15
0.20
0.25
0.30
LWR (g g· -1)
Rela
tive
gro
wth
rate
(gg ·
Rela
tive
gro
wth
rate
(gg ·
Rela
tive
gro
wth
rate
(gg ·
-1-1
-1day
·day
·day
·-1
-1-1
))
)
c)
Spearman r = 0.25
0.10
0.05
0.15
0.20
0.25
0.30
0.3 0.4 0.5 0.6 0.7 0.8 0.9
LWR (g g· -1)
f)
Spearman r = 0.34
0.10
0.05
0.15
0.20
0.25
0.30
SLA (m2· kg-1)
15 20 25 30 35 40 50 55 6045
a)
Spearman r = 0.66 **
Df BkEv
ErEhFo Fe
Ao
Pc EcEt
PpAg
Bi
GgDg
Pa
15 20 25 30 35 40 50 55 6045
SLA (m2 ·kg-1)
d)
Spearman r = - 0.21
DfBk
EvEr
FoFe
EhAoPc
Ec Et
Ag BiPp
GgDg
Pa
DfBk
EvEr
EhFe Fo Ao
PcEc Et
Bi
PpAg
DgPa
Gg
Bi
Er
Pa
Dg
Df GgEv
Et
Ec
EhFeBk
Fo PcPp
Ao
Ag
Bi
DfEr
GgEv
Pa EtEc Fe
Bk
Fo
Ao
Ag
PpPcDg
Bi
DfGg
Er
Ev
FeEc
Et
Eh
Bk
Eh
FoPc
DgAo
Pp
Ag
High nitrogen Low nitrogen
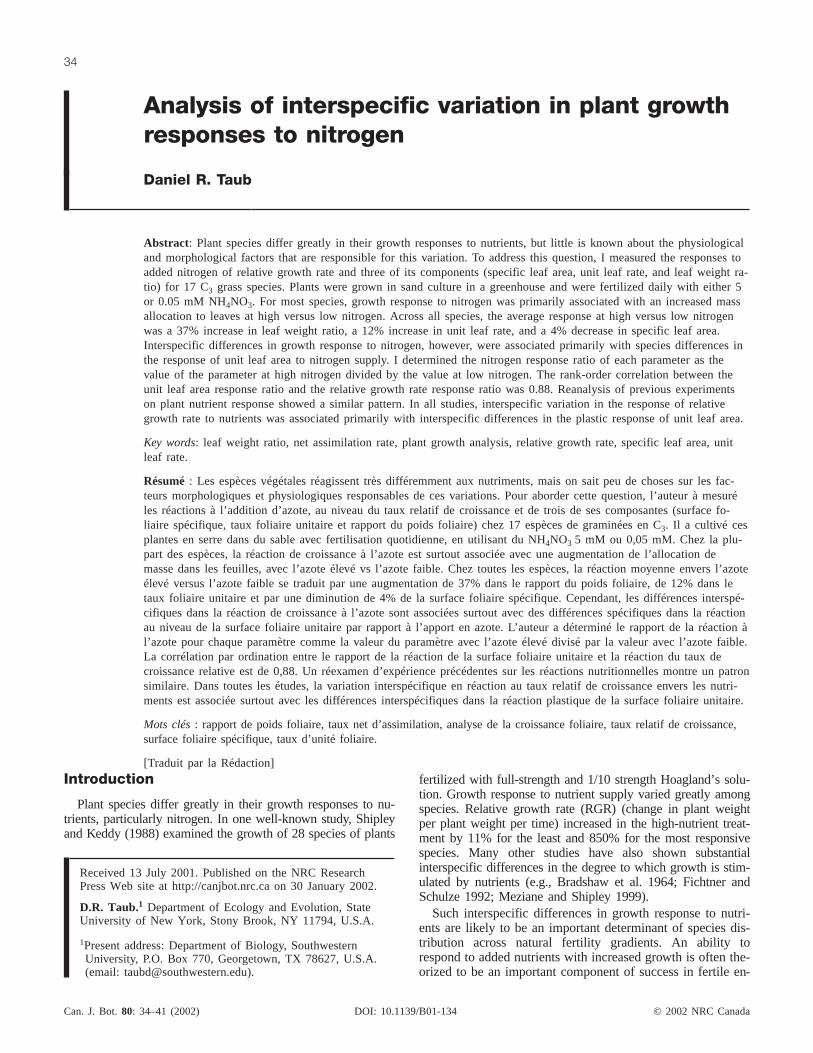
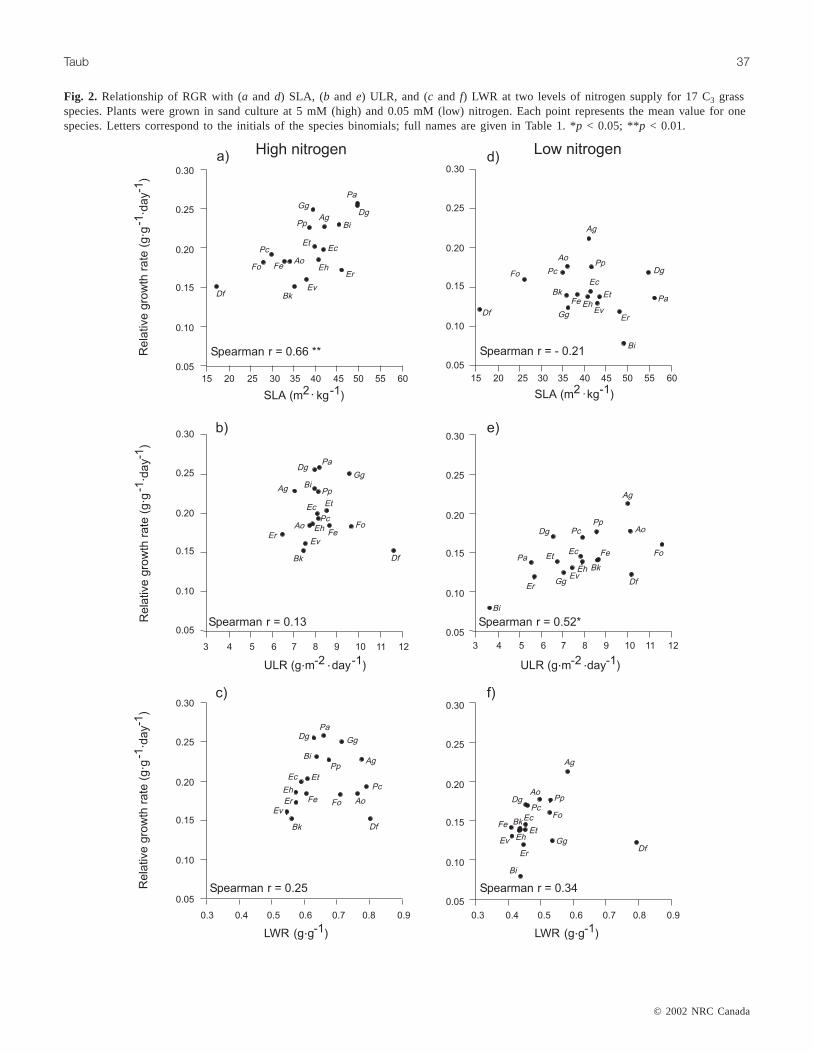
Fig. 2. Relationship of RGR with (a and d) SLA, (b and e) ULR, and (c and f) LWR at two levels of nitrogen supply for 17 C3 grassspecies. Plants were grown in sand culture at 5 mM (high) and 0.05 mM (low) nitrogen. Each point represents the mean value for onespecies. Letters correspond to the initials of the species binomials; full names are given in Table 1. *p < 0.05; **p < 0.01.
J:\cjb\cjb80\cjb-01\B01-134.vpWednesday, January 23, 2002 2:04:40 PM
Color profile: Generic CMYK printer profileComposite Default screen
Correlations between variables were assessed usingSpearman rank-order correlation to minimize the influenceof outlier values. In addition to the Spearman correlations,data were analyzed using the growth response coefficientmethod of Poorter and van der Werf (1998). Growth re-sponse coefficients are related to the slope of relationshipssuch as those in Fig. 3. The growth response coefficient val-ues for the three components of RGR sum to 1 (approxi-mately), with a value of 1 indicating that variation in thatcomponent is fully proportional to variation in RGR and avalue of 0 indicating that interspecific differences in RGRare not systematically related to interspecific differences inthat particular growth parameter.
Results
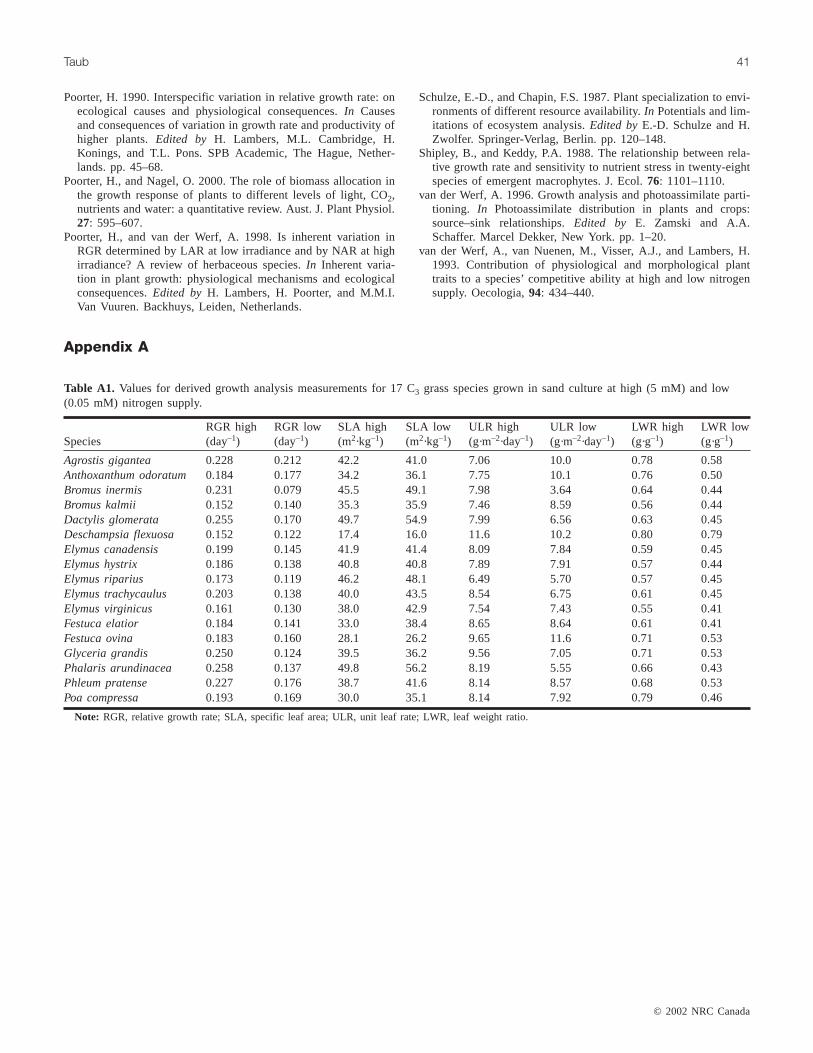
All species grew faster at 5 mM nitrogen than at 0.05 mMnitrogen (Fig. 1a). Each species also allocated a greater pro-portion of total dry mass to leaves at high nitrogen than atlow nitrogen (Fig. 1d). In contrast, responses of ULR to ni-trogen supply varied widely. ULR of some species in-creased, while that of others decreased at high versus lownitrogen (Fig. 1c). Most species had a decreased SLA withincreased nitrogen supply, although the response of SLA tonitrogen was fairly modest (Fig. 1b). Growth parameters forall species are listed in Appendix A.
Across species, RGR at 5 mM nitrogen was positivelycorrelated with SLA but was not correlated with either ULRor LWR (Figs. 2a–2c). In contrast, RGR at 0.05 mM nitro-gen was positively correlated with ULR but not with SLA orLWR (Figs. 2d–2f).
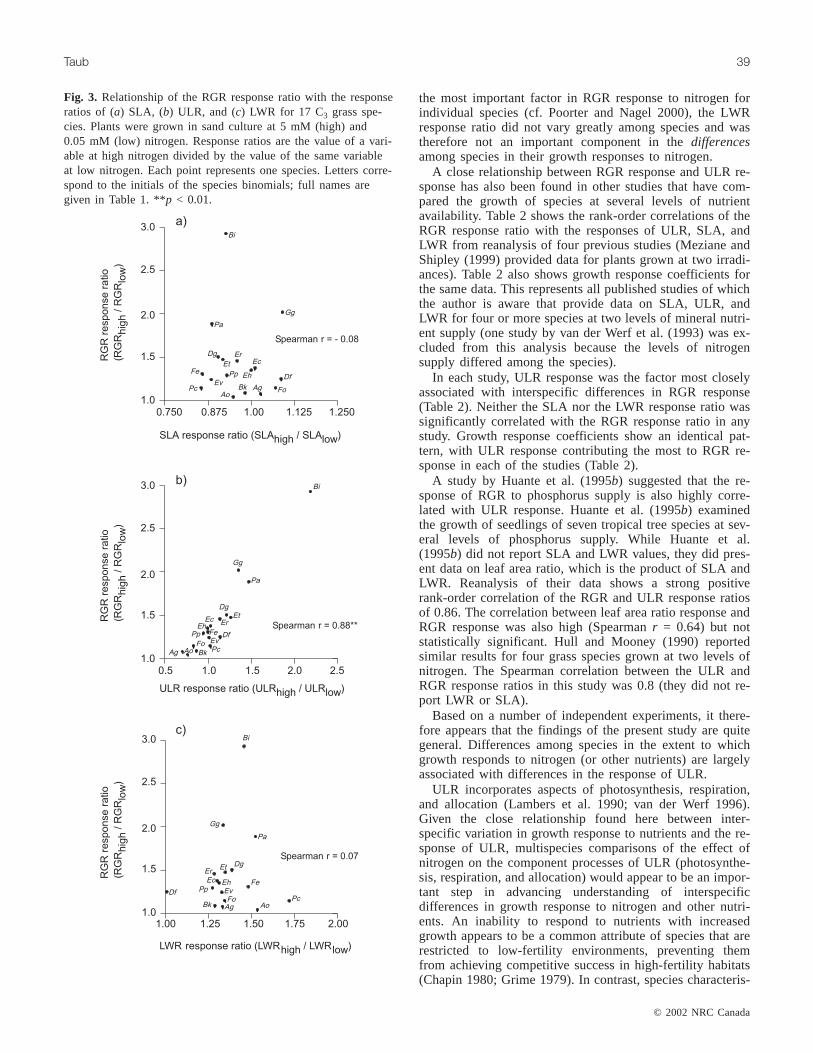
For most species, growth response to nitrogen was largelyattributable to increased mass allocation to leaves (LWR).Table 1 shows the response ratios (eq. 2) of SLA, ULR, and
LWR for each species. For 14 of the species, the largestpositive response was for LWR, while for the other threespecies, the largest response was in ULR. LWR was also theonly one of the three factors that increased (ratio > 1.0) at5 mM nitrogen in every species. On average, species had a37% increase in LWR, a 4% decrease in SLA, and a 12% in-crease in ULR at 5 versus 0.05 mM nitrogen.
Although all species showed an increase in LWR with in-creased nitrogen, interspecific variation among species inLWR response (and in SLA response) was much less thanthat in ULR response. The range of variation in the LWRand SLA response ratios was 1.01–1.72 and 0.86–1.09, re-spectively, while for the ULR response ratio, it was0.71–2.19 (Table 1). The coefficient of variation was approx-imately three to four times as great for the ULR response ra-tio as for the LWR or SLA response ratio (0.31 for ULRversus 0.11 for LWR and 0.08 for SLA; Table 1).
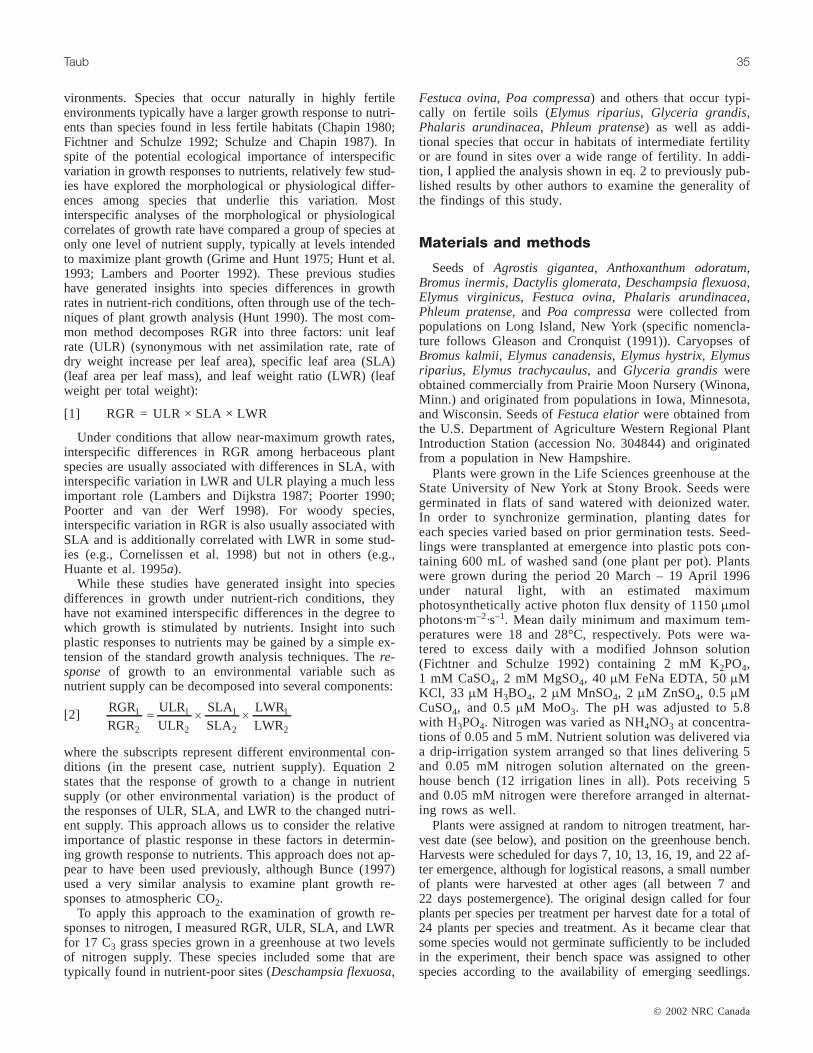
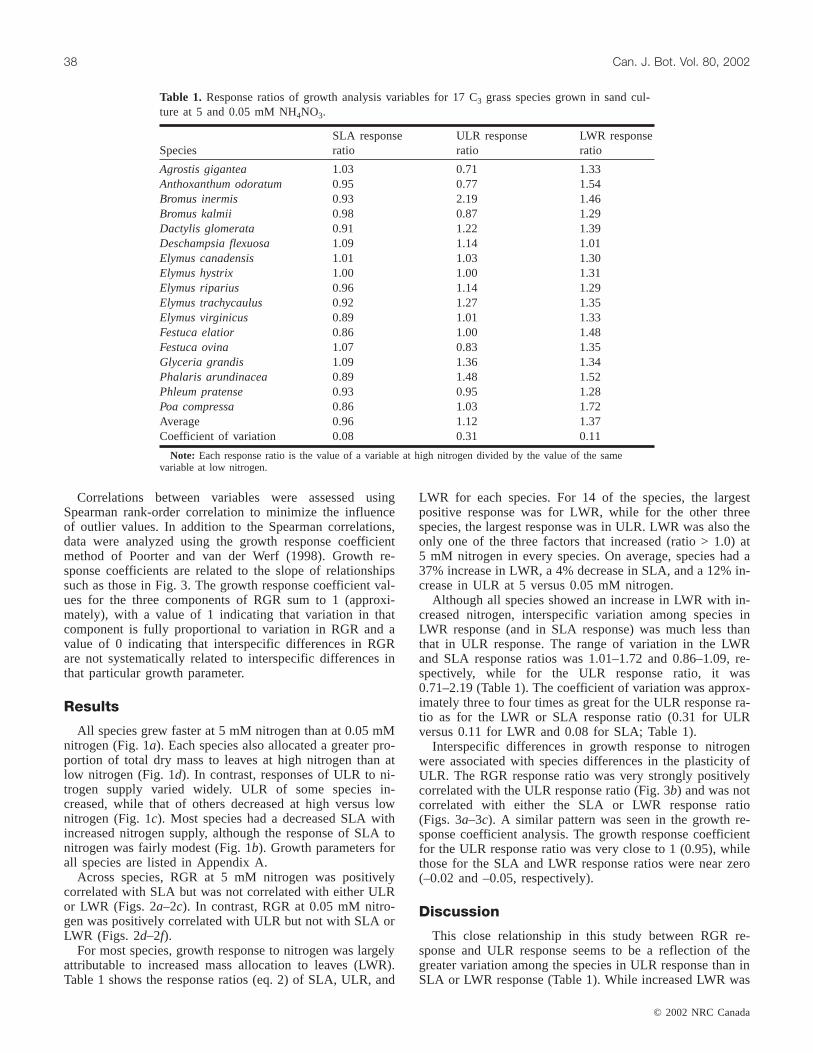
Interspecific differences in growth response to nitrogenwere associated with species differences in the plasticity ofULR. The RGR response ratio was very strongly positivelycorrelated with the ULR response ratio (Fig. 3b) and was notcorrelated with either the SLA or LWR response ratio(Figs. 3a–3c). A similar pattern was seen in the growth re-sponse coefficient analysis. The growth response coefficientfor the ULR response ratio was very close to 1 (0.95), whilethose for the SLA and LWR response ratios were near zero(–0.02 and –0.05, respectively).
Discussion
This close relationship in this study between RGR re-sponse and ULR response seems to be a reflection of thegreater variation among the species in ULR response than inSLA or LWR response (Table 1). While increased LWR was
© 2002 NRC Canada
38 Can. J. Bot. Vol. 80, 2002
SpeciesSLA responseratio
ULR responseratio
LWR responseratio
Agrostis gigantea 1.03 0.71 1.33Anthoxanthum odoratum 0.95 0.77 1.54Bromus inermis 0.93 2.19 1.46Bromus kalmii 0.98 0.87 1.29Dactylis glomerata 0.91 1.22 1.39Deschampsia flexuosa 1.09 1.14 1.01Elymus canadensis 1.01 1.03 1.30Elymus hystrix 1.00 1.00 1.31Elymus riparius 0.96 1.14 1.29Elymus trachycaulus 0.92 1.27 1.35Elymus virginicus 0.89 1.01 1.33Festuca elatior 0.86 1.00 1.48Festuca ovina 1.07 0.83 1.35Glyceria grandis 1.09 1.36 1.34Phalaris arundinacea 0.89 1.48 1.52Phleum pratense 0.93 0.95 1.28Poa compressa 0.86 1.03 1.72Average 0.96 1.12 1.37Coefficient of variation 0.08 0.31 0.11
Note: Each response ratio is the value of a variable at high nitrogen divided by the value of the samevariable at low nitrogen.
Table 1. Response ratios of growth analysis variables for 17 C3 grass species grown in sand cul-ture at 5 and 0.05 mM NH4NO3.
J:\cjb\cjb80\cjb-01\B01-134.vpWednesday, January 23, 2002 2:04:40 PM
Color profile: Generic CMYK printer profileComposite Default screen
the most important factor in RGR response to nitrogen forindividual species (cf. Poorter and Nagel 2000), the LWRresponse ratio did not vary greatly among species and wastherefore not an important component in thedifferencesamong species in their growth responses to nitrogen.
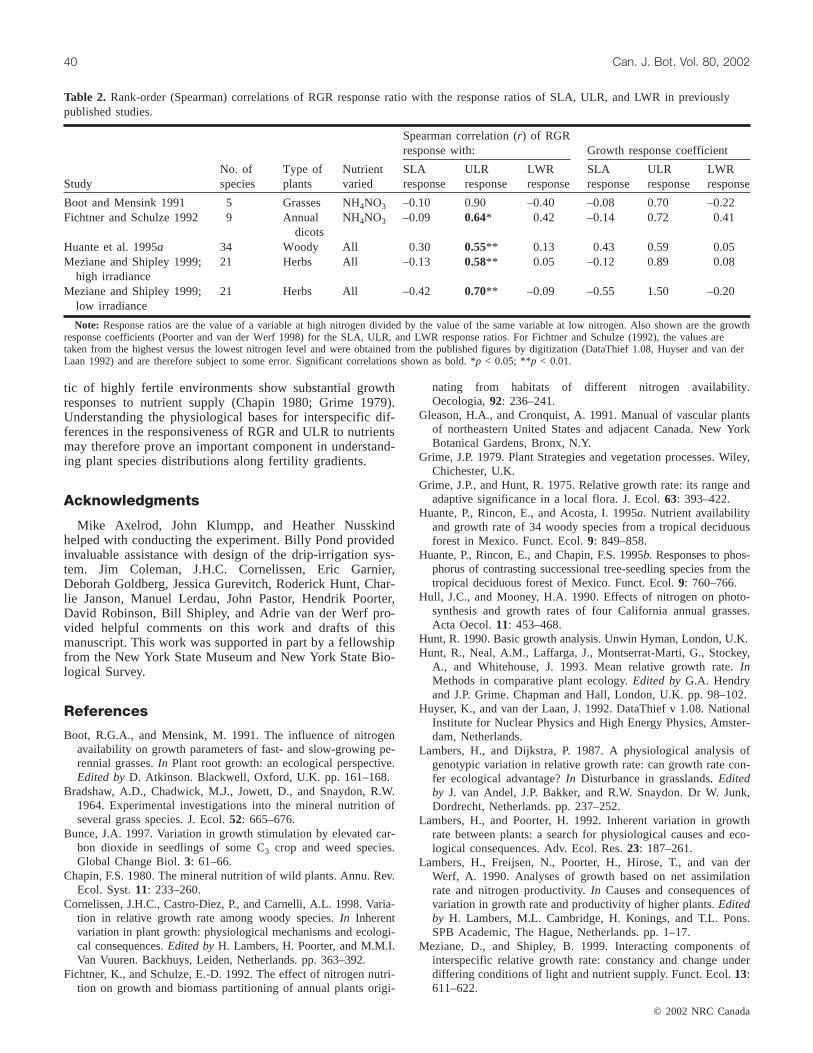
A close relationship between RGR response and ULR re-sponse has also been found in other studies that have com-pared the growth of species at several levels of nutrientavailability. Table 2 shows the rank-order correlations of theRGR response ratio with the responses of ULR, SLA, andLWR from reanalysis of four previous studies (Meziane andShipley (1999) provided data for plants grown at two irradi-ances). Table 2 also shows growth response coefficients forthe same data. This represents all published studies of whichthe author is aware that provide data on SLA, ULR, andLWR for four or more species at two levels of mineral nutri-ent supply (one study by van der Werf et al. (1993) was ex-cluded from this analysis because the levels of nitrogensupply differed among the species).
In each study, ULR response was the factor most closelyassociated with interspecific differences in RGR response(Table 2). Neither the SLA nor the LWR response ratio wassignificantly correlated with the RGR response ratio in anystudy. Growth response coefficients show an identical pat-tern, with ULR response contributing the most to RGR re-sponse in each of the studies (Table 2).
A study by Huante et al. (1995b) suggested that the re-sponse of RGR to phosphorus supply is also highly corre-lated with ULR response. Huante et al. (1995b) examinedthe growth of seedlings of seven tropical tree species at sev-eral levels of phosphorus supply. While Huante et al.(1995b) did not report SLA and LWR values, they did pres-ent data on leaf area ratio, which is the product of SLA andLWR. Reanalysis of their data shows a strong positiverank-order correlation of the RGR and ULR response ratiosof 0.86. The correlation between leaf area ratio response andRGR response was also high (Spearmanr = 0.64) but notstatistically significant. Hull and Mooney (1990) reportedsimilar results for four grass species grown at two levels ofnitrogen. The Spearman correlation between the ULR andRGR response ratios in this study was 0.8 (they did not re-port LWR or SLA).
Based on a number of independent experiments, it there-fore appears that the findings of the present study are quitegeneral. Differences among species in the extent to whichgrowth responds to nitrogen (or other nutrients) are largelyassociated with differences in the response of ULR.
ULR incorporates aspects of photosynthesis, respiration,and allocation (Lambers et al. 1990; van der Werf 1996).Given the close relationship found here between inter-specific variation in growth response to nutrients and the re-sponse of ULR, multispecies comparisons of the effect ofnitrogen on the component processes of ULR (photosynthe-sis, respiration, and allocation) would appear to be an impor-tant step in advancing understanding of interspecificdifferences in growth response to nitrogen and other nutri-ents. An inability to respond to nutrients with increasedgrowth appears to be a common attribute of species that arerestricted to low-fertility environments, preventing themfrom achieving competitive success in high-fertility habitats(Chapin 1980; Grime 1979). In contrast, species characteris-
© 2002 NRC Canada
Taub 39
1.00 1.25 1.50 1.75 2.001.0
1.5
2.0
2.5
3.0
0.750 0.875 1.00 1.125 1.2501.0
1.5
2.0
2.5
3.0
RG
Rre
sp
on
se
ratio
(RG
Rh
igh
/R
GR
low
)
SLA response ratio (SLAhigh / SLAlow)
0.5 1.0 1.5 2.0 2.51.0
1.5
2.0
2.5
3.0
RG
Rre
sp
on
se
ratio
(RG
Rh
igh
/R
GR
low
)
RG
Rre
sp
on
se
ratio
(RG
Rh
igh
/R
GR
low
)
ULR response ratio (ULRhigh / ULRlow)
LWR response ratio (LWRhigh / LWRlow)
a)
b)
c)
Spearman r = - 0.08
Spearman r = 0.88**
Spearman r = 0.07
AoAgBkPc Fo
EvDfPpFe
Eh
EcEr
Et
Dg
Pa
Gg
Bi
Bi
Gg
Pa
DgEt
ErEcEh
FePp DfEvFoPcBkAg Ao
Bi
Gg
Pa
DgEtEr
Ec Eh FePpDf Ev
PcFoBk Ag Ao
Fig. 3. Relationship of the RGR response ratio with the responseratios of (a) SLA, (b) ULR, and (c) LWR for 17 C3 grass spe-cies. Plants were grown in sand culture at 5 mM (high) and0.05 mM (low) nitrogen. Response ratios are the value of a vari-able at high nitrogen divided by the value of the same variableat low nitrogen. Each point represents one species. Letters corre-spond to the initials of the species binomials; full names aregiven in Table 1. **p < 0.01.
J:\cjb\cjb80\cjb-01\B01-134.vpWednesday, January 23, 2002 2:04:41 PM
Color profile: Generic CMYK printer profileComposite Default screen
tic of highly fertile environments show substantial growthresponses to nutrient supply (Chapin 1980; Grime 1979).Understanding the physiological bases for interspecific dif-ferences in the responsiveness of RGR and ULR to nutrientsmay therefore prove an important component in understand-ing plant species distributions along fertility gradients.
Acknowledgments
Mike Axelrod, John Klumpp, and Heather Nusskindhelped with conducting the experiment. Billy Pond providedinvaluable assistance with design of the drip-irrigation sys-tem. Jim Coleman, J.H.C. Cornelissen, Eric Garnier,Deborah Goldberg, Jessica Gurevitch, Roderick Hunt, Char-lie Janson, Manuel Lerdau, John Pastor, Hendrik Poorter,David Robinson, Bill Shipley, and Adrie van der Werf pro-vided helpful comments on this work and drafts of thismanuscript. This work was supported in part by a fellowshipfrom the New York State Museum and New York State Bio-logical Survey.
References
Boot, R.G.A., and Mensink, M. 1991. The influence of nitrogenavailability on growth parameters of fast- and slow-growing pe-rennial grasses.In Plant root growth: an ecological perspective.Edited byD. Atkinson. Blackwell, Oxford, U.K. pp. 161–168.
Bradshaw, A.D., Chadwick, M.J., Jowett, D., and Snaydon, R.W.1964. Experimental investigations into the mineral nutrition ofseveral grass species. J. Ecol.52: 665–676.
Bunce, J.A. 1997. Variation in growth stimulation by elevated car-bon dioxide in seedlings of some C3 crop and weed species.Global Change Biol.3: 61–66.
Chapin, F.S. 1980. The mineral nutrition of wild plants. Annu. Rev.Ecol. Syst.11: 233–260.
Cornelissen, J.H.C., Castro-Diez, P., and Carnelli, A.L. 1998. Varia-tion in relative growth rate among woody species.In Inherentvariation in plant growth: physiological mechanisms and ecologi-cal consequences.Edited byH. Lambers, H. Poorter, and M.M.I.Van Vuuren. Backhuys, Leiden, Netherlands. pp. 363–392.
Fichtner, K., and Schulze, E.-D. 1992. The effect of nitrogen nutri-tion on growth and biomass partitioning of annual plants origi-
nating from habitats of different nitrogen availability.Oecologia,92: 236–241.
Gleason, H.A., and Cronquist, A. 1991. Manual of vascular plantsof northeastern United States and adjacent Canada. New YorkBotanical Gardens, Bronx, N.Y.
Grime, J.P. 1979. Plant Strategies and vegetation processes. Wiley,Chichester, U.K.
Grime, J.P., and Hunt, R. 1975. Relative growth rate: its range andadaptive significance in a local flora. J. Ecol.63: 393–422.
Huante, P., Rincon, E., and Acosta, I. 1995a. Nutrient availabilityand growth rate of 34 woody species from a tropical deciduousforest in Mexico. Funct. Ecol.9: 849–858.
Huante, P., Rincon, E., and Chapin, F.S. 1995b. Responses to phos-phorus of contrasting successional tree-seedling species from thetropical deciduous forest of Mexico. Funct. Ecol.9: 760–766.
Hull, J.C., and Mooney, H.A. 1990. Effects of nitrogen on photo-synthesis and growth rates of four California annual grasses.Acta Oecol.11: 453–468.
Hunt, R. 1990. Basic growth analysis. Unwin Hyman, London, U.K.Hunt, R., Neal, A.M., Laffarga, J., Montserrat-Marti, G., Stockey,
A., and Whitehouse, J. 1993. Mean relative growth rate.InMethods in comparative plant ecology.Edited byG.A. Hendryand J.P. Grime. Chapman and Hall, London, U.K. pp. 98–102.
Huyser, K., and van der Laan, J. 1992. DataThief v 1.08. NationalInstitute for Nuclear Physics and High Energy Physics, Amster-dam, Netherlands.
Lambers, H., and Dijkstra, P. 1987. A physiological analysis ofgenotypic variation in relative growth rate: can growth rate con-fer ecological advantage?In Disturbance in grasslands.Editedby J. van Andel, J.P. Bakker, and R.W. Snaydon. Dr W. Junk,Dordrecht, Netherlands. pp. 237–252.
Lambers, H., and Poorter, H. 1992. Inherent variation in growthrate between plants: a search for physiological causes and eco-logical consequences. Adv. Ecol. Res.23: 187–261.
Lambers, H., Freijsen, N., Poorter, H., Hirose, T., and van derWerf, A. 1990. Analyses of growth based on net assimilationrate and nitrogen productivity.In Causes and consequences ofvariation in growth rate and productivity of higher plants.Editedby H. Lambers, M.L. Cambridge, H. Konings, and T.L. Pons.SPB Academic, The Hague, Netherlands. pp. 1–17.
Meziane, D., and Shipley, B. 1999. Interacting components ofinterspecific relative growth rate: constancy and change underdiffering conditions of light and nutrient supply. Funct. Ecol.13:611–622.
© 2002 NRC Canada
40 Can. J. Bot. Vol. 80, 2002
Spearman correlation (r) of RGRresponse with: Growth response coefficient
StudyNo. ofspecies
Type ofplants
Nutrientvaried
SLAresponse
ULRresponse
LWRresponse
SLAresponse
ULRresponse
LWRresponse
Boot and Mensink 1991 5 Grasses NH4NO3 –0.10 0.90 –0.40 –0.08 0.70 –0.22Fichtner and Schulze 1992 9 Annual
dicotsNH4NO3 –0.09 0.64* 0.42 –0.14 0.72 0.41
Huante et al. 1995a 34 Woody All 0.30 0.55** 0.13 0.43 0.59 0.05Meziane and Shipley 1999;
high irradiance21 Herbs All –0.13 0.58** 0.05 –0.12 0.89 0.08
Meziane and Shipley 1999;low irradiance
21 Herbs All –0.42 0.70** –0.09 –0.55 1.50 –0.20
Note: Response ratios are the value of a variable at high nitrogen divided by the value of the same variable at low nitrogen. Also shown are the growthresponse coefficients (Poorter and van der Werf 1998) for the SLA, ULR, and LWR response ratios. For Fichtner and Schulze (1992), the values aretaken from the highest versus the lowest nitrogen level and were obtained from the published figures by digitization (DataThief 1.08, Huyser and van derLaan 1992) and are therefore subject to some error. Significant correlations shown as bold. *p < 0.05; **p < 0.01.
Table 2. Rank-order (Spearman) correlations of RGR response ratio with the response ratios of SLA, ULR, and LWR in previouslypublished studies.
J:\cjb\cjb80\cjb-01\B01-134.vpWednesday, January 23, 2002 2:04:41 PM
Color profile: Generic CMYK printer profileComposite Default screen
© 2002 NRC Canada
Taub 41
Poorter, H. 1990. Interspecific variation in relative growth rate: onecological causes and physiological consequences.In Causesand consequences of variation in growth rate and productivity ofhigher plants.Edited by H. Lambers, M.L. Cambridge, H.Konings, and T.L. Pons. SPB Academic, The Hague, Nether-lands. pp. 45–68.
Poorter, H., and Nagel, O. 2000. The role of biomass allocation inthe growth response of plants to different levels of light, CO2,nutrients and water: a quantitative review. Aust. J. Plant Physiol.27: 595–607.
Poorter, H., and van der Werf, A. 1998. Is inherent variation inRGR determined by LAR at low irradiance and by NAR at highirradiance? A review of herbaceous species.In Inherent varia-tion in plant growth: physiological mechanisms and ecologicalconsequences.Edited by H. Lambers, H. Poorter, and M.M.I.Van Vuuren. Backhuys, Leiden, Netherlands.
Schulze, E.-D., and Chapin, F.S. 1987. Plant specialization to envi-ronments of different resource availability.In Potentials and lim-itations of ecosystem analysis.Edited byE.-D. Schulze and H.Zwolfer. Springer-Verlag, Berlin. pp. 120–148.
Shipley, B., and Keddy, P.A. 1988. The relationship between rela-tive growth rate and sensitivity to nutrient stress in twenty-eightspecies of emergent macrophytes. J. Ecol.76: 1101–1110.
van der Werf, A. 1996. Growth analysis and photoassimilate parti-tioning. In Photoassimilate distribution in plants and crops:source–sink relationships.Edited by E. Zamski and A.A.Schaffer. Marcel Dekker, New York. pp. 1–20.
van der Werf, A., van Nuenen, M., Visser, A.J., and Lambers, H.1993. Contribution of physiological and morphological planttraits to a species’ competitive ability at high and low nitrogensupply. Oecologia,94: 434–440.
SpeciesRGR high(day–1)
RGR low(day–1)
SLA high(m2·kg–1)
SLA low(m2·kg–1)
ULR high(g·m–2·day–1)
ULR low(g·m–2·day–1)
LWR high(g·g–1)
LWR low(g·g–1)
Agrostis gigantea 0.228 0.212 42.2 41.0 7.06 10.0 0.78 0.58Anthoxanthum odoratum 0.184 0.177 34.2 36.1 7.75 10.1 0.76 0.50Bromus inermis 0.231 0.079 45.5 49.1 7.98 3.64 0.64 0.44Bromus kalmii 0.152 0.140 35.3 35.9 7.46 8.59 0.56 0.44Dactylis glomerata 0.255 0.170 49.7 54.9 7.99 6.56 0.63 0.45Deschampsia flexuosa 0.152 0.122 17.4 16.0 11.6 10.2 0.80 0.79Elymus canadensis 0.199 0.145 41.9 41.4 8.09 7.84 0.59 0.45Elymus hystrix 0.186 0.138 40.8 40.8 7.89 7.91 0.57 0.44Elymus riparius 0.173 0.119 46.2 48.1 6.49 5.70 0.57 0.45Elymus trachycaulus 0.203 0.138 40.0 43.5 8.54 6.75 0.61 0.45Elymus virginicus 0.161 0.130 38.0 42.9 7.54 7.43 0.55 0.41Festuca elatior 0.184 0.141 33.0 38.4 8.65 8.64 0.61 0.41Festuca ovina 0.183 0.160 28.1 26.2 9.65 11.6 0.71 0.53Glyceria grandis 0.250 0.124 39.5 36.2 9.56 7.05 0.71 0.53Phalaris arundinacea 0.258 0.137 49.8 56.2 8.19 5.55 0.66 0.43Phleum pratense 0.227 0.176 38.7 41.6 8.14 8.57 0.68 0.53Poa compressa 0.193 0.169 30.0 35.1 8.14 7.92 0.79 0.46
Note: RGR, relative growth rate; SLA, specific leaf area; ULR, unit leaf rate; LWR, leaf weight ratio.
Table A1. Values for derived growth analysis measurements for 17 C3 grass species grown in sand culture at high (5 mM) and low(0.05 mM) nitrogen supply.
Appendix A
J:\cjb\cjb80\cjb-01\B01-134.vpWednesday, January 23, 2002 2:04:42 PM
Color profile: Generic CMYK printer profileComposite Default screen
Recommended