DEPARTAMENTO DE
ENGENHARIA MECÂNICA
AAnnaallyyssiiss ooff tthhee ttrriibboollooggiiccaall bbeehhaavviioouurr ooff
WW--TTii--NN ccooaattiinnggss Submitted in Partial Fulfilment of the Requirements for the Degree of Master of Science in Mechanical Engineering in Production and Project Speciality
Author
José Miguel Fernandes Figueiredo
Advisors
Marta Cristina Cardoso de Oliveira Tomas Polcar
Jury
President Albano Augusto Cavaleiro Rodrigues de Carvalho
Professor Catedrático da Universidade de Coimbra
Vowels
Amílcar Lopes Ramalho Professor Associado da Universidade de Coimbra
Marta Cristina Cardoso de Oliveira
Professora Auxiliar da Universidade de Coimbra
Tomas Polcar Professor Associado da Czech Technical University in Prague
Institutional Collaboration
Department of Control Engineering Faculty of Electrical Engineering Czech Technical University in Prague
Coimbra, January 2013


By three methods we may learn wisdom:
First, by reflection, which is noblest;
Second, by imitation, which is easiest; and
third by experience, which is the bitterest.
Confucius

Acknowledgments
José Miguel Fernandes Figueiredo iii
Acknowledgments
The success of any project depends largely on the encouragement and guidance
of many others. This was also the case of this work. Therefore, apart from my own work
and efforts, I would like to express my gratitude to the people who have been fundamental
in its successful completion.
First, I express my sincere gratitude to Professor Doutora Marta Oliveira, for
supporting me during the whole work, for many discussions and suggestions regarding the
research, encouraging me to do more and better.
To Professor Doutor Albano Cavaleiro and Professor Doutor Tomas Polcar, for
the opportunity to work abroad and all guidance in the analysis and discussion of the
results of this research.
To all the team members of the Advanced Materials Group, of the Department
of Control Engineering, of the Faculty of Electrical Engineering of the Czech Technical
University in Prague, for all the technical support and help during my stay in Prague.
To the team members of the Experimental and Computer Aided Technology
Group, of the mechanical Engineering Research Centre of the University of Coimbra
(CEMUC), for all the technical support.
To the team members of the Surface Engineering Group from CEMUC, for all
the help in the coated samples data collection.
I also acknowledge Professor Doutora Cristina Louro (Erasmus Coordinator)
and the International Relations Unit of the University of Coimbra, for all help with the
bureaucratic procedures related with my stay in Prague. I also acknowledge the finantial
support of the ERASMUS Internship Program. This thesis would not be possible without
this support.
To my friends for the fellowship and the amazing moments during the
academic life.
To Ana for all the patience, support and encouragement.
To my parents, grandparents and my sister for all the encouragement, help and
dedication. I would never have come so far without your support.
Analysis of the tribological behaviour of W-Ti-N coatings
iv 2013
The author gratefully acknowledge the financial support of the Portuguese
Foundation for Science and Technology (FCT) under Project PTDC/EME-
TME/103350/2008 by FEDER through the program QREN (COMPETE: FCOMP-01-
0124-FEDER-010301). This research was also sponsored by FEDER funds through the
program COMPETE – Programa Operacional Factores de Competitividade – and by
national funds through FCT, under the project PEst-C/EME/UI0285/2011.
Resumo
José Miguel Fernandes Figueiredo v
Resumo
O principal objectivo deste trabalho é fornecer uma base de dados
experimentais para as condições de contacto com atrito entre chapas laminadas da liga de
alumínio (AA5754-O) e um aço (H13) revestido com um filme fino (W-Ti-N). A análise
inclui a realização de ensaios tribológicos pino-disco à temperatura ambiente e a 100ºC,
150ºC e 200ºC, sem lubrificante e utilizando uma quantidade mínima de lubrificante. De
modo a reproduzir as diferentes condições de contacto que ocorrem em processos de
estampagem de chapas metálicas de alumínio, foram revestidos dois tipos de amostras de
aço: planas e esféricas. O primeiro tipo de amostras foi ensaiado utilizando como contra-
corpo esferas de alumínio AA5754. O segundo tipo de amostras constituiu o contra-corpo
dos ensaios realizados com chapas de alumínio como corpo de contacto.
Os ensaios de pino-disco foram realizados em condições idênticas para: (i)
amostras planas revestidas, produzidas com condições de deposição diferentes, à
temperatura ambiente, com o objectivo de analisar a influência das propriedades do
revestimento nas condições de contacto; (ii) chapas de alumínio, utilizando como contra-
corpo esferas revestidas, obtidas todas com as mesmas condições de deposição (N9). Para
cada chapa foi utilizada uma quantidade de lubrificante diferente, de modo a analisar a
influência da quantidade de lubrificante nas condições de contacto, incluindo o efeito da
temperatura; (iii) amostras planas revestidas (N9), com diferentes quantidades de
lubrificante, com o objectivo de analisar a influência da quantidade de lubrificante nas
condições de contacto, incluindo o efeito da temperatura.
Para cada teste foi determinado o valor mínimo, máximo e médio do
coeficiente de atrito, o que permitiu retirar algumas conclusões globais. As amostras
revestidas que apresentaram uma menor gama de variação do coeficiente de atrito não são
necessariamente as que apresentam um baixo volume de desgaste do pino. Para os testes
realizados com as chapas de alumínio e esferas revestidas, observou-se uma variação da
evolução do coeficiente de atrito com o tempo, associada ao aumento de temperatura,
como resultado da alteração das características do lubrificante. Este efeito não foi
observado para os testes realizados com as amostras planas revestidas e os pinos de
Analysis of the tribological behaviour of W-Ti-N coatings
vi 2013
alumínio, o que pode estar relacionado com a diferente rugosidade das amostras.
Globalmente, o coeficiente de atrito médio aumenta com a temperatura no caso das chapas
de alumínio. Para as amostras planas revestidas não foi possível determinar a influência da
quantidade de lubrificante, uma vez que o coeficiente de atrito médio é semelhante para as
duas amostras, para cada temperatura.
Este trabalho também constitui uma base de dados importante para permitir
melhorar o procedimento experimental, a análise de resultados e o planeamento de ensaios
em trabalhos futuros. Neste contexto, são apresentadas algumas recomendações para
referência futura.
Palavras-chave: Filmes finos de W-Ti-N, AA5754-O, Lubrificante, Pino-disco, Coeficiente de atrito, Estampagem.
Abstract
José Miguel Fernandes Figueiredo vii
Abstract
The aim objective of this work is to provide an experimental database for the
tribological characteristics, at room and warm temperature (100ºC, 150ºC and 200ºC),
between the AA5754-O aluminium alloy and a steel (H13) coated with a thin film (W-Ti-
N). The experimental database was built based on pin-on-disk tests, without lubricant and
using a minimum amount of lubricant. In order to reproduce the different contact
conditions associated to sheet metal forming process, two types of steel samples were
coated: planar and spherical. The first type of samples was tested using as counter-body
aluminium pins. The second type of samples was the counter-body of the tests performed
with aluminium sheets.
The pin-on-disk tests were performed under identical conditions for: (i) planar
sample coatings, obtained with different deposition conditions, tested at room temperature
with the goal of analysing the influence of the coating properties in the contact conditions;
(ii) aluminium sheets, using coated balls corresponding to one of the deposition conditions
(N9). A different amount of lubricant was applied for each aluminium sheet, with the main
goal of analysing the influence of the lubricant amount in the contact conditions, including
the temperature effect; (iii) planar sample coatings (N9) using different amounts of
lubricant, in order to evaluate the influence of the lubricant amount in the contact
conditions, including the temperature effect.
The analysis of the minimum, maximum and average friction coefficients
determined for each test, allowed to draw some global conclusions. The coated samples
that present the lower range for the friction coefficient are not necessarily the ones with the
lower wear volume for the pin. For the tests performed with aluminium sheets against
coated and steel balls, it was observed a different evolution of the friction coefficient with
time, associated to the temperature increase, as a result of the alteration of the lubricant
characteristics. This effect was not observed for the tests performed with coated samples
against the aluminium pins, which can be related with the different sample roughness.
Globally, the average friction coefficient increases with temperature in case of the sheet
planar sample, while it was not possible to determine the influence of the lubricant amount
Analysis of the tribological behaviour of W-Ti-N coatings
viii 2013
for the coated planar samples, since the average friction coefficient is similar for both
samples, for each temperature.
This work also constitutes an important database for allowing the improving of
the experimental procedure, results analysis and test planning in future works. In this
context, some recommendations were listed for future reference.
Keywords W-Ti-N thin films, AA5754-O, Lubricant, Pin-on-disk, Friction coefficient, Deep drawing.
Index
José Miguel Fernandes Figueiredo ix
Index
List of Figures ....................................................................................................................... xi
List of Tables ...................................................................................................................... xix
1. Introduction ................................................................................................................... 1
1.1. Framework .............................................................................................................. 8 1.2. Objectives ............................................................................................................... 9 1.3. Manuscript Organization ...................................................................................... 10
2. Materials, Equipments and Methods ........................................................................... 11 2.1. Materials ............................................................................................................... 11
2.2. Equipments and Methods ...................................................................................... 14 2.2.1. Tribometer ..................................................................................................... 14 2.2.2. Profilometer ................................................................................................... 18 2.2.3. Microscope .................................................................................................... 19
2.2.1. Precision Scale ............................................................................................... 20
3. Experimental Details ................................................................................................... 21 3.1. Pin-on-Disk Test Procedure .................................................................................. 21 3.2. Preliminary Tests .................................................................................................. 22
3.2.1. Results Discussion ......................................................................................... 23 3.2.1. Normal Load Selection .................................................................................. 25
3.3. Test Plan ............................................................................................................... 27
4. Results Analysis .......................................................................................................... 31 4.1. First Task: Coated Samples - Aluminium Pins ..................................................... 31
4.2. Second Task: Aluminium Sheets – Coated Pins ................................................... 33 4.3. Third Task: Coated Samples - Aluminium Pins ................................................... 36
4.4. Analysis of the Tools Coating (N9) ...................................................................... 38
4.5. Analysis of the Acquisition Parameters ................................................................ 39 4.6. Analysis of the Friction Coefficient Anisotropy ................................................... 43
5. Conclusions, Remarks and Future Work Suggestions................................................. 47
References ........................................................................................................................... 51
A. Annex: Preliminary Tests ............................................................................................ 53
B. Annex: First Task ........................................................................................................ 63
C. Annex: Second Task .................................................................................................... 67
D. Annex: Third Task ....................................................................................................... 77

Analysis of the tribological behaviour of W-Ti-N coatings
x 2013
List of Figures
José Miguel Fernandes Figueiredo xi
LIST OF FIGURES
Figure 1.1 - Deep drawing scheme (Schumann et al., 2001)................................................. 1
Figure 1.2 - XRD pattern of W–Ti–N films deposited without (Vs=70V) and with ion gun
assistance (Vs=40V) (extracted from Silva et al., 2005). ........................................ 3
Figure 1.3 - Pressure distribution values for different punch displacement values, as well as
maximum values for 0, 4, 8, 12, 16, 20, 24 and 28 mm of punch displacement
(Simões, 2012)......................................................................................................... 7
Figure 2.1 - Evolution of the chemical composition of reactively deposited W–Ti–N
coatings as a function of the partial pressure ratio of the reactive gas (pN2/pAr). 13
Figure 2.2 - XRD patterns of W-Ti-N coatings deposited with increasing partial pressure of
the reactive gas. ..................................................................................................... 13
Figure 2.3 - High Temperature Tribometer (CMS Instruments, catalogue, 2012). ............. 15
Figure 2.4 - InstrumX edit parameters interface.................................................................. 16
Figure 2.5 - InstrumX online output interface. .................................................................... 16
Figure 2.6 - Stick slip effect (Cailletaud et al. 2012). ......................................................... 18
Figure 2.7 - Zygo 3D Optical Surface Profiler model NewView™ 7000 Series. ............... 18
Figure 2.8 - MetroPro software Interface. ........................................................................... 19
Figure 2.9 - Neophot 30 microscope. .................................................................................. 19
Figure 2.10 - KERN770 precision scale. ............................................................................. 20
Figure 3.1 – Tribometer components scheme. .................................................................... 22
Figure 3.2 - Minimum, maximum and average friction coefficient for the preliminary tests.
............................................................................................................................... 24
Figure 3.3 - Average maximum depth of the wear track for the preliminary tests. ............ 25
Figure 3.4 - (a) Schematic, cross-sectional representation of the sphere on plane hertzian
indentation; Corresponding normalized stresses distribution on the (b) contact
surface and (c) plane depth (Cailletaud et al., 2010). ............................................ 26
Figure 4.1 - Minimum, maximum and average friction coefficient for the coated samples-
aluminium pins tests. ............................................................................................. 32
Figure 4.2 - Wear volume for the coated samples-aluminium pins tests. ........................... 33
Figure 4.3 - Stribeck curve (image courtesy of SKF).......................................................... 35
Figure 4.4 - Minimum, maximum and average friction coefficient for the aluminium
sheets-coated and steel pins tests........................................................................... 36
Figure 4.5 - Minimum, maximum and average friction coefficient for the coated samples-
aluminium pins, with temperature tests. ................................................................ 37
Analysis of the tribological behaviour of W-Ti-N coatings
xii 2013
Figure 4.6 - Wear volume for the coated samples- aluminium pins, with temperature tests.
............................................................................................................................... 38
Figure 4.7 - Minimum, maximum and average friction coefficient for the coated N9
samples- aluminium pins and alumium sheets-coated N9 pins, with temperature
tests. ....................................................................................................................... 39
Figure 4.8 - Friction coefficient as a function of the lubricant amount, at room temperature.
Coated N9 samples- aluminium pins (full marks) and alumium sheets-coated N9
pins (open marks). ................................................................................................. 39
Figure 4.9 - Minimum and maximum number of points acquired in each lap as a function
of the track radius. Percentage of acquisition of the maximum number of points as
a function of the track radius. ................................................................................ 41
Figure 4.10 - Schematic representation of a fixed tilt and diagram showing the force
balance for a fixed external load, . , , and are the observed lateral force,
the effective normal force, and the actual friction force, respectively. ................. 42
Figure 4.11 - evolution with the number of cycles, for equal to 1 rad and: a isotropic
friction coefficient equal to 0.1 and (i) a constant tilt angle (label iso.) (ii)
a sinusoidal evolution of the tilt angle (label sin); a linear
increasing and decreasing friction coefficient, between 0.1 and 0.2 (label aniso.).
The starting point corresponds to the open dot in Figure 4.10. ............................. 43
Figure 4.12 - Evolution of the friction coefficient with the relative angular position for the
test: (a) WTiN1.1s TA; (b) WTiN1.3s TA and (c) 440C1.4s TA. (d) Evolution of
the friction coefficient for each relative angular position with time. .................... 45
Figure 4.13 - Evolution of the friction coefficient with the relative angular position for the
test: (a) WTiN9-P-1.5g TA; (b) WTiN9-P-4.5g TA; (c) WTiN9-P and (d) WTiN7-
P. ............................................................................................................................ 46
Figure A.1 - Friction coefficient evolution for the test performed with the coated sample 2
using as counter body a steel ball and no lubricant (Left). Steel ball wear with a
magnification scale [12.5x10] (Top right). Coated sample 2 wear track (Bottom
right). ..................................................................................................................... 53
Figure A.2 - Friction coefficient evolution for the tests performed with the coated sample 2
using as counter body an alumina ball and no lubricant (left). Alumina ball wear
with a magnification scale [12.5x12.5](Top right). Coated sample 2 3D wear track
(Bottom right). ....................................................................................................... 53
Figure A.3 - Friction coefficient evolution for the test performed with the coated sample 3
using as counter body a steel ball and no lubricant (Left). Steel ball wear with a
magnification scale [12.5x10] (Top right). ........................................................... 54
Figure A.4 - Friction coefficient evolution for the tests performed with the coated sample 3
using as counter body an alumina ball and no lubricant (left). Alumina ball wear
with a magnification scale [12.5x10](Top right). Coated sample 3 3D wear track
(Bottom right). ....................................................................................................... 54
Figure A.5 - Friction coefficient evolution for the test performed with the coated sample 4
using as counter body a steel ball and no lubricant (Left). Steel ball wear with a
magnification scale [12.5x10] (Top right). ........................................................... 55
List of Figures
José Miguel Fernandes Figueiredo xiii
Figure A.6 - Friction coefficient evolution for the test performed with the coated sample 4
using as counter body an alumina ball and no lubricant (Left). Alumina ball wear
with a magnification scale [12.5x16] (Top right). Coated sample 4 wear track
(Bottom right). ....................................................................................................... 55
Figure A.7 - Friction coefficient evolution for the test performed with the coated sample 5
using as counter body a steel ball and no lubricant (Left). Steel ball wear with a
magnification scale [12.5x10] (Top right). Coated sample 5 wear track (Bottom
right). ..................................................................................................................... 56
Figure A.8 - Friction coefficient evolution for the test performed with the coated sample 5
using as counter body an alumina ball and no lubricant (Left). Alumina ball wear
with a magnification scale [12.5x10] (Top right). Coated sample 5 wear track
(Bottom right). ....................................................................................................... 56
Figure A.9 - Friction coefficient evolution for the test performed with the coated sample 6
using as counter body a steel ball and no lubricant (Left). Steel ball wear with a
magnification scale [12.5x12.5] (Top right). Coated sample 6 wear track (Bottom
right). ..................................................................................................................... 57
Figure A.10 - Friction coefficient evolution for the test performed with the coated sample 6
using as counter body an alumina ball and no lubricant (Left). Alumina ball wear
with a magnification scale [12.5x12.5] (Top right). Coated sample 6 wear track
(Bottom right). ....................................................................................................... 57
Figure A.11 - Friction coefficient evolution for the test performed with the coated sample 7
using as counter body a steel ball and no lubricant (Left). Steel ball wear with a
magnification scale [12.5x16] (Top right). Coated sample 7 wear track (Bottom
right). ..................................................................................................................... 58
Figure A.12 - Friction coefficient evolution for the test performed with the coated sample 7
using as counter body an alumina ball and no lubricant (Left). Alumina ball wear
with a magnification scale [12.5x12.5] (Top right). Coated sample 7 wear track
(Bottom right). ....................................................................................................... 58
Figure A.13 - Friction coefficient evolution for the test performed with the coated sample 8
using as counter body a steel ball and no lubricant (Left). Steel ball wear with a
magnification scale [12.5x12.5] (Top right). Coated sample 8 wear track (Bottom
right). ..................................................................................................................... 59
Figure A.14 - Friction coefficient evolution for the test performed with the coated sample 9
using as counter body an alumina ball and no lubricant (Left). Alumina ball wear
with a magnification scale [12.5x20] (Top right). Coated sample 9 wear track
(Bottom right). ....................................................................................................... 59
Figure A.15 - Friction coefficient evolution for the test performed with the coated sample 9
using as counter body a steel ball and no lubricant (Left). Steel ball wear with a
magnification scale [12.5x16] (Top right). Coated sample 9 wear track (Bottom
right). ..................................................................................................................... 60
Figure A.16 - Friction coefficient evolution for the test performed with the coated sample 9
using as counter body an alumina ball and no lubricant (Left). Alumina ball wear
with a magnification scale [12.5x16] (Top right). Coated sample 9 3D wear track
(Bottom right). ....................................................................................................... 60
Analysis of the tribological behaviour of W-Ti-N coatings
xiv 2013
Figure B.1 - Friction coefficient evolution for the test performed with the coated sample 2
using as counter body an aluminium pin and an amount of lubricant of 2.4 g/m²
(left). Aluminium pin wear with a magnification scale [12.5x8] (pin not cleaned)
(Top right). Coated sample 2 wear track (Bottom right). ...................................... 63
Figure B.2 - Friction coefficient evolution for the test performed with the coated sample 3
using as counter body an aluminium pin and an amount of lubricant of 2.7
g/m²(left). Aluminium pin wear with a magnification scale [12.5x12.5] (pin not
cleaned) (Top right). Coated sample 3 wear track (Bottom right). ....................... 63
Figure B.3 - Friction coefficient evolution for the test performed with the coated sample 4
using as counter body an aluminium pin and an amount of lubricant of 2.2 g/m2
(Left) Aluminium pin wear with a magnification scale [12.5x8] (pin not cleaned)
(Top right). Coated sample 4 wear track (Bottom right). ...................................... 64
Figure B.4 - Friction coefficient evolution for the test performed with the coated sample 5
using as counter body an aluminium pin and an amount of lubricant of 2.0 g/m2
(Left). Aluminium pin wear with a magnification scale [12.5x8] (pin not cleaned)
(Top right). Coated sample 5 wear track (Bottom right). ...................................... 64
Figure B.5 - Friction coefficient evolution for the test performed with the coated sample 6
using as counter body an aluminium pin and an amount of lubricant of 2.4
g/m2(Left). Aluminium pin wear with a magnification scale [12.5x8] (pin not
cleaned) (Top right). Coated sample 6 wear track (Bottom right). ....................... 65
Figure B.6 - Friction coefficient evolution for the tests performed with the coated sample 7
using as counter body an aluminium pin and an amount of lubricant of 2.7 g/m2
(Left). Aluminium pin wear with a magnification scale [12.5x10] (pin not
cleaned) (Top right). Coated sample 7 wear track (Bottom right). ....................... 65
Figure B.7 - Friction coefficient evolution for the test performed with the coated sample 8
using as counter body an aluminium pin and an amount of lubricant of 2.3 g/m2
(Left). Aluminium pin wear with a magnification scale [12.5x16] (pin not
cleaned) (Top right). Coated sample 8 wear track (Bottom right). ....................... 66
Figure B.8 - Friction coefficient evolution for the test performed with the coated sample 9
using as counter body an aluminium pin and an amount of lubricant of 2.4 g/m2
(Left). Aluminium pin wear with a magnification scale [12.5x8] (pin not cleaned)
(Top right). Coated sample 9 wear track (Bottom right). ...................................... 66
Figure C.1 - Friction coefficient evolution for the test performed with the AA AA5754-O
sheet using as counter body a coated ball and an amount of lubricant of 1.5 g/m2
at
room temperature (Left). Coated ball wear with a magnification scale [12.5x8]
(ball not cleaned) (Top right). AA AA5754-O sheet 3D wear track (Bottom right).
............................................................................................................................... 67
Figure C.2 - Friction coefficient evolution for the test performed with the AA AA5754-O
sheet using as counter body a coated ball and no lubricant at room temperature
(Left). Coated ball wear with a magnification scale [12.5x8] (ball not cleaned)
(Top right). ............................................................................................................ 67
Figure C.3 - Friction coefficient evolution for the test performed with the AA AA5754-O
sheet using as counter body a coated ball and an amount of lubricant of 1.8 g/m2
at
room temperature (Left). Coated ball wear with a magnification scale [12.5x8]
List of Figures
José Miguel Fernandes Figueiredo xv
(ball not cleaned) (Top right). AA AA5754-O sheet 3D wear track (Bottom right).
............................................................................................................................... 68
Figure C.4 - Friction coefficient evolution for the test performed with the AA AA5754-O
sheet using as counter body a steel ball and an amount of lubricant of 2.3g/m2
at
room temperature (Left). Steel ball wear with a magnification scale [12.5x8] (ball
not cleaned) (Top right). ........................................................................................ 68
Figure C.5 - Friction coefficient evolution for the test performed with the AA AA5754-O
sheet using as counter body a coated ball and an amount of lubricant of 1.5 g/m2
at
100°C (Left). Coated ball wear with a magnification scale [12.5x8] (ball not
cleaned) (Top right). AA AA5754-O sheet 3D wear track (Bottom right). .......... 69
Figure C.6 - Friction coefficient evolution for the test performed with the AA AA5754-O
sheet using as counter body a coated ball and no lubricant at 100°C (Left). Coated
ball wear with a magnification scale [12.5x8] (ball not cleaned) (Top right). ...... 69
Figure C.7 - Friction coefficient evolution for the test performed with the AA AA5754-O
sheet using as counter body a coated ball and an amount of lubricant of 1.8 g/m2
at
100°C (Left). Coated ball wear with a magnification scale [12.5x8] (ball not
cleaned) (Top right). AA AA5754-O sheet 3D wear track (Bottom right). .......... 70
Figure C.8 - Friction coefficient evolution for the test performed with the AA AA5754-O
sheet using as counter body a steel ball and an amount of lubricant of 2.3g/m2
at
100°C (Left). Steel ball wear with a magnification scale [12.5x8] (ball not
cleaned) (Top right). .............................................................................................. 70
Figure C.9 - Friction coefficient evolution for the test performed with the AA AA5754-O
sheet using as counter body a coated ball and an amount of lubricant of 1.5 g/m2
at
150°C (Left). Coated ball wear with a magnification scale [12.5x8] (ball not
cleaned) (Top right). AA AA5754-O sheet 3D wear track (Bottom right). .......... 71
Figure C.10 - Friction coefficient evolution for the test performed with the AA AA5754-O
sheet using as counter body a coated ball and no lubricant at 150°C (Left). Coated
ball wear with a magnification scale [12.5x8] (ball not cleaned) (Top right). ...... 71
Figure C.11 - Friction coefficient evolution for the test performed with the AA AA5754-O
sheet using as counter body a coated ball and an amount of lubricant of 1.8 g/m2
at
150°C (Left). Coated ball wear with a magnification scale [12.5x8] (ball not
cleaned) (Top right). AA AA5754-O sheet 3D wear track (Bottom right). .......... 72
Figure C.12 - Friction coefficient evolution for the test performed with the AA AA5754-O
sheet using as counter body a steel ball and an amount of lubricant of 2.3g/m2
at
150°C (Left). Steel ball wear with a magnification scale [12.5x8] (ball not
cleaned) (Top right). .............................................................................................. 72
Figure C.13 - Friction coefficient evolution for the test performed with the AA AA5754-O
sheet using as counter body a coated ball and an amount of lubricant of 1.5 g/m2
at
200°C (Left). Coated ball wear with a magnification scale [12.5x8] (ball not
cleaned) (Top right). .............................................................................................. 73
Figure C.14 - Friction coefficient evolution for the test performed with the AA AA5754-O
sheet using as counter body a coated ball and an amount of lubricant of 1.5 g/m2
at
Analysis of the tribological behaviour of W-Ti-N coatings
xvi 2013
200°C for the initial 50 seconds (Left). Coated ball wear with a magnification
scale [12.5x8] (ball not cleaned) (Top right). ........................................................ 73
Figure C.15 - Friction coefficient evolution for the test performed with the AA AA5754-O
sheet using as counter body a coated ball and no lubricant at 200°C (Left). Coated
ball wear with a magnification scale [12.5x8] (ball not cleaned) (Top right). ...... 74
Figure C.16 - Friction coefficient evolution for the test performed with the AA AA5754-O
sheet using as counter body a coated ball and an amount of lubricant of 1.8 g/m2
at
200°C (Left). Coated ball wear with a magnification scale [12.5x8] (ball not
cleaned) (Top right). .............................................................................................. 74
Figure C.17 - Friction coefficient evolution for the test performed with the AA AA5754-O
sheet using as counter body a coated ball and an amount of lubricant of 1.8 g/m2
at
200°C for the initial 50 seconds(Left). Coated ball wear with a magnification
scale [12.5x8] (ball not cleaned) (Top right). ........................................................ 75
Figure C.18 - Friction coefficient evolution for the test performed with the AA AA5754-O
sheet using as counter body a steel ball and an amount of lubricant of 2.3g/m2
at
200°C (Left). Steel ball wear with a magnification scale [12.5x8] (ball not
cleaned) (Top right). .............................................................................................. 75
Figure C.19 - Friction coefficient evolution for the test performed with the AA AA5754-O
sheet using as counter body a steel ball and an amount of lubricant of 2.3g/m2
at
200°C for the initial 50 seconds (Left). Steel ball wear with a magnification scale
[12.5x8] (ball not cleaned) (Top right). ................................................................. 76
Figure D.1 - Friction coefficient evolution for the tests performed with the coated sample 9
using as counter body an aluminium pin and an amount of lubricant of 1.5 g/m2, at
room temperature (Left). Aluminium pin wear with a magnification scale
[12.5x12.5] (Top right). Coated sample wear track (Bottom right). ..................... 77
Figure D.2 - Friction coefficient evolution for the tests performed with the coated sample 9
using as counter body an aluminium pin and an amount of lubricant of 4.5 g/m2, at
room temperature (Left). Aluminium pin wear with a magnification scale [12.5x8]
(Top right). Coated sample wear track (Bottom right). ......................................... 77
Figure D.3 - Friction coefficient evolution for the tests performed with the coated sample 9
using as counter body an aluminium pin and an amount of lubricant of 1.5 g/m2, at
100°C (Left). Aluminium pin wear with a magnification scale [12.5x8] (Top
right). Coated sample wear track (Bottom right). ................................................. 78
Figure D.4 - Friction coefficient evolution for the tests performed with the coated sample 9
using as counter body an aluminium pin and an amount of lubricant of 4.5 g/m2, at
100°C (Left). Aluminium pin wear with a magnification scale [12.5x8] (Top
right). Coated sample wear track (Bottom right). ................................................. 78
Figure D.5- Friction coefficient evolution for the tests performed with the coated sample 9
using as counter body an aluminium pin and an amount of lubricant of 1.5 g/m2, at
150°C (Left). Aluminium pin wear with a magnification scale [12.5x8] (Top
right). Coated sample wear track (Bottom right). ................................................. 79
Figure D.6 - Friction coefficient evolution for the tests performed with the coated sample 9
using as counter body an aluminium pin and an amount of lubricant of 4.5 g/m2, at
List of Figures
José Miguel Fernandes Figueiredo xvii
150°c (Left). Aluminium pin wear with a magnification scale [12.5x8] (Top
right). Coated sample wear track (Bottom right). ................................................. 79
Figure D.7 - Friction coefficient evolution for the tests performed with the coated sample 9
using as counter body an aluminium pin and an amount of lubricant of 1.5 g/m2, at
200°c (Left). Aluminium pin wear with a magnification scale [12.5x16] (Top
right). Coated sample wear track (Bottom right). ................................................. 80
Figure D.8 - Friction coefficient evolution for the tests performed with the coated sample 9
using as counter body an aluminium pin and an amount of lubricant of 1.5 g/m2, at
200°c for the initial 150 seconds (Left). Aluminium pin wear with a magnification
scale [12.5x16] (Top right). Coated sample wear track (Bottom right). ............... 80
Figure D.9 - Friction coefficient evolution for the tests performed with the coated sample 9
using as counter body an aluminium pin and an amount of lubricant of 4.5 g/m2, at
200°c (Left). Aluminium pin wear with a magnification scale [12.5x10] (Top
right). Coated sample wear track (Bottom right). ................................................. 81

Analysis of the tribological behaviour of W-Ti-N coatings
xviii 2013
List of Tables
José Miguel Fernandes Figueiredo xix
LIST OF TABLES
Table 2.1 - Composition in weight % of AA5754-O. ......................................................... 11
Table 2.2 - Nitrogen and argon partial pressure of W-Ti-N coatings.................................. 12
Table 2.3 - Composition in atomic % of the W-Ti-N coatings. .......................................... 12
Table 2.4 - Mechanical properties of the materials and pin radius...................................... 14
Table 2.5 - Tribometer settings range (CMS Instruments, catalogue, 2012). ..................... 15
Table 2.6 - Factors that influence the friction and wear measurement (Sakamoto, 2001). . 17
Table 3.1 - Load that limits the elastic regime for the normal contact, in the plane, ... 27
Table 3.2 – Resume of the experimental test conditions. .................................................... 29
Table 4.1 - Roughness values of the W-Ti-N coated samples............................................. 32
Table A.1 - Preliminary test results: track and balls wear rate. ........................................... 61

Analysis of the tribological behaviour of W-Ti-N coatings
xx 2013
Introduction
José Miguel Fernandes Figueiredo 1
1. INTRODUCTION
One of the most common metalworking processes is stamping, which involves
forming an initial flat metallic sheet into a non-planar shaped component, such as "cup-
shaped" parts. If the depth of the formed part is equal to or greater than the radius of the
cup, the process is called deep drawing (Schumann et al., 2001). The deep drawing
operation is based on forming the metallic sheet by plastic deformation. The deformation is
achieved by forcing the metallic sheet into a female die using a male shaped punch. In
deep drawing the die is relatively deep and significant plastic flow results from the forming
operation.
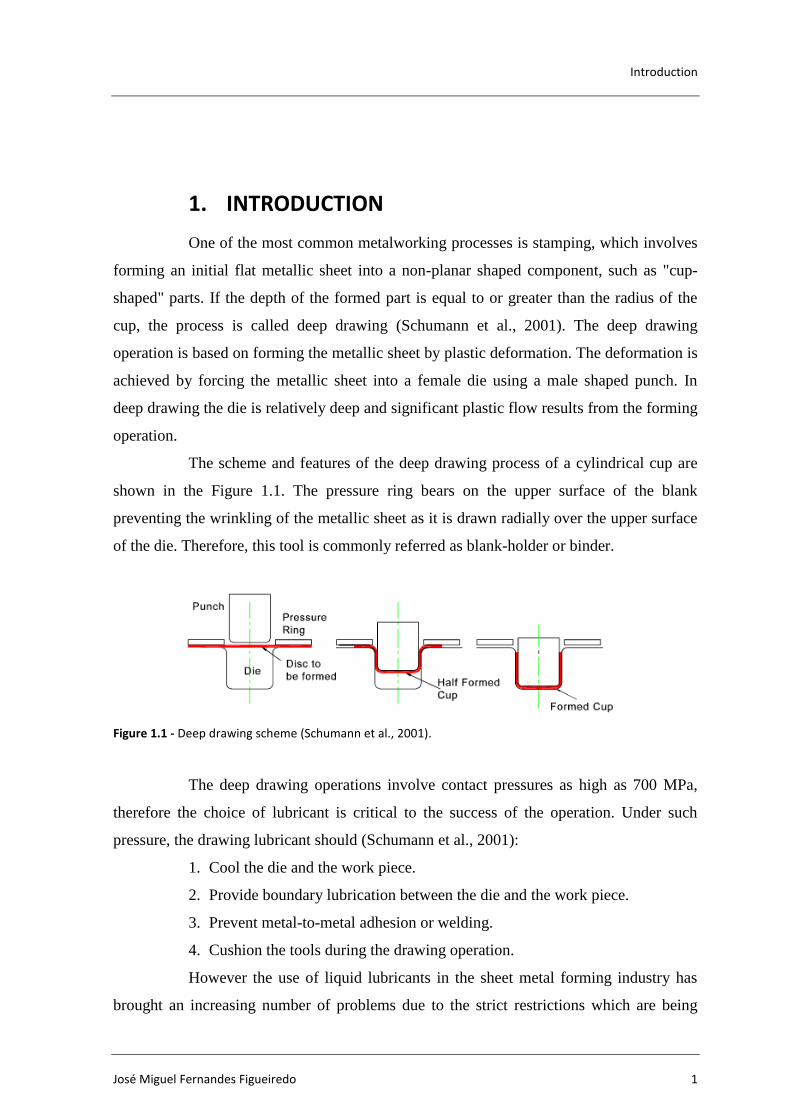
The scheme and features of the deep drawing process of a cylindrical cup are
shown in the Figure 1.1. The pressure ring bears on the upper surface of the blank
preventing the wrinkling of the metallic sheet as it is drawn radially over the upper surface
of the die. Therefore, this tool is commonly referred as blank-holder or binder.
Figure 1.1 - Deep drawing scheme (Schumann et al., 2001).
The deep drawing operations involve contact pressures as high as 700 MPa,
therefore the choice of lubricant is critical to the success of the operation. Under such
pressure, the drawing lubricant should (Schumann et al., 2001):
1. Cool the die and the work piece.
2. Provide boundary lubrication between the die and the work piece.
3. Prevent metal-to-metal adhesion or welding.
4. Cushion the tools during the drawing operation.
However the use of liquid lubricants in the sheet metal forming industry has
brought an increasing number of problems due to the strict restrictions which are being
Analysis of the tribological behaviour of W-Ti-N coatings
2 2013
imposed by the European Union, related with the environment protection. The European
directives impose severe restrictions to the automotive agents on the use (reduction or
removal), disposal (cleaner environment) and manufacturing (without toxic products) of
lubricants, including those for sheet metal forming industry. However, as previously
mentioned, the high contact pressures between the sliding elements in different mechanical
applications, such as deep drawing forming processes, injection moulding or cutting tools,
make the production very difficult without proper lubrication conditions, leading
frequently to sticking problems that cannot be overcome without “critical” quantities of
lubricants (Silva et al., 2008). In fact, the absence of lubricants leads invariably to adhesion
problems and premature wear of the tools, particularly in deep drawing of ductile
materials, namely aluminium alloys. One of the possible solutions for these problems is the
surface modification of the tools by applying hard coatings which can, simultaneously,
reduce the necessary lubricant amount and decrease the friction coefficient in the contact.
For example, Le and Sutcliffe (2002) showed that the coatings deposited by Physical vapor
deposition (PVD) techniques can improve the wear resistance and contribute to the
reduction or even elimination of the use of liquid lubricants. In previous research works,
Cavaleiro et al. (2003) performed a study of the W-Ti-N system, where it was shown that
alloying W–Ti films with nitrogen was a good way to improve the mechanical properties,
such as hardness up to 50 GPa and adhesion/cohesion critical loads up to 70 N. Moreover,
the addition of N improves the corrosion resistance of the coatings. The good corrosion
and mechanical properties allowed predicting that these films should be suitable for
mechanical components, such as stamping or cutting tools for high speed machining.
Therefore, further studies were performed to optimize the deposition conditions, in
particular to study the influence of enhancing the bombardment during film growth by
assisting the deposition with an ion gun on the chemical, structural and mechanical
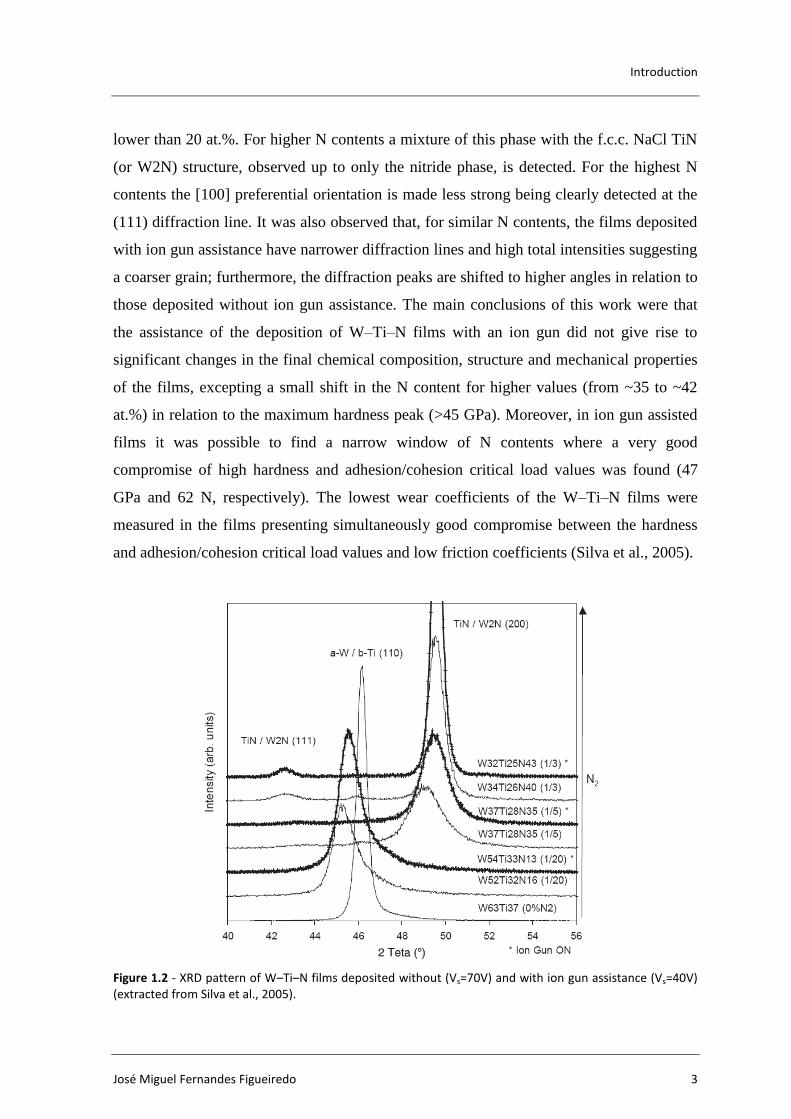
properties (Silva et al., 2005). In that study, the thin films of W–Ti–N were deposited by dc
reactive magnetron sputtering a W80+Ti20 (wt.%) target in a N2 and Ar atmosphere varying
the partial pressure ratio, pN2/pAr, in the range from 0 to 0.5. The total deposition pressure
was 0.3 Pa and the deposition time was 35 min (5 min for a W–Ti interlayer and 30 min for
the W–Ti–N layer which allowed reaching a final thickness in the range from 2.5 to 4.5
m). Figure 1.2 presents the X-ray diffraction (XRD) patterns obtained in that study,
which allowed to show that both types of film have the b.c.c. a(W,Ti) phase for N contents
Introduction
José Miguel Fernandes Figueiredo 3
lower than 20 at.%. For higher N contents a mixture of this phase with the f.c.c. NaCl TiN
(or W2N) structure, observed up to only the nitride phase, is detected. For the highest N
contents the [100] preferential orientation is made less strong being clearly detected at the
(111) diffraction line. It was also observed that, for similar N contents, the films deposited
with ion gun assistance have narrower diffraction lines and high total intensities suggesting
a coarser grain; furthermore, the diffraction peaks are shifted to higher angles in relation to
those deposited without ion gun assistance. The main conclusions of this work were that
the assistance of the deposition of W–Ti–N films with an ion gun did not give rise to
significant changes in the final chemical composition, structure and mechanical properties
of the films, excepting a small shift in the N content for higher values (from ~35 to ~42
at.%) in relation to the maximum hardness peak (>45 GPa). Moreover, in ion gun assisted
films it was possible to find a narrow window of N contents where a very good
compromise of high hardness and adhesion/cohesion critical load values was found (47
GPa and 62 N, respectively). The lowest wear coefficients of the W–Ti–N films were
measured in the films presenting simultaneously good compromise between the hardness
and adhesion/cohesion critical load values and low friction coefficients (Silva et al., 2005).
Figure 1.2 - XRD pattern of W–Ti–N films deposited without (Vs=70V) and with ion gun assistance (Vs=40V) (extracted from Silva et al., 2005).
Analysis of the tribological behaviour of W-Ti-N coatings
4 2013
In many sheet metal forming applications, the primary mechanism that
determines the quality of the part’ surfaces is the adhesion of the sheet material to the
tools. Furthermore, this effect leads to the formation of wear particles that in relative
motion may promote abrasion (two or three body), inducing scratches in the final
component. Usually, the adhesion gives rise to unstable and high friction coefficients and it
preferentially occurs for soft and ductile blanks (e.g. with Al, Zn or Au alloys) (Silva et al.,
2008). The tribological performance of thin films of the W–Ti-(N) system deposited onto
heat treated 100Cr6 bearing balls, used as a pin, sliding against four stamping sheet
materials in dry and lubrication conditions, was studied by Silva et al. (2008). That work
showed that, in the lubricated tests, an oil for corrosion protection could be used with
advantage in relation to other processing lubricants, with amounts as low as 10% of what is
usually applied (only 0.2 g/m2). Nevertheless, even with lubrication, adhesion was
observed during testing against Al alloy sheets. The best wear resistance was found for W–
Ti-N (1/5) coated ball (N contents in the range from 35 at.% to 40 at.%.), result explained
by the highest hardness of this sample. Very good tribological results were reached with
this sample tested with the corrosion protection oil even with amounts of only 25% (0.5
g/m2) of the total usually utilized.
Based on the good indications, drawn by the work of Silva et al. (2008), about
the N content for achieving the best compromise between a very high wear resistance and a
reduced friction coefficient, a work was developed to study the potentiality of
implementing coatings of the W–Ti–N system in industrial applications (Severo, 2009;
Severo et al., 2009). These work involved the scale up of the process, by using a sputtering
apparatus with industrial dimensions and the analysis of the tribological behaviour of the
coatings in a semi-industrial test (i.e. the strip-drawing test). The scale up of the process is
not a straightforward task, due to the enormous amount of parameters involved in the
production of thin films with PVD techniques. In fact, a significant difference was
observer in the trends obtained by the two equipments, for the evolution of W/Ti ratio with
increasing N contents. In fact, for the industrial dimensions equipment the W/Ti increases
with the N content whereas an inverse trend was found in the laboratory apparatus. This
difference was attributed to the target types used in each equipment: an alloy of W and Ti,
in the laboratory process, a puzzle of parts of W inserted in a big part of Ti, in the
industrial process. By this reason, the target poisoning process is quite different: it is
Introduction
José Miguel Fernandes Figueiredo 5
uniform in the alloyed target and heterogeneous in the puzzle target, occurring much faster
in the Ti parts than in the W parts due to the much higher affinity for N of Ti than W.
Nevertheless, similar evolution of the structure as a function of the N content was found in
industrially deposited films, in relation to those deposited by Cavaleiro et al. (2003) and
Silva et al. (2005) in the laboratory equipment. The hardness was lower for industrially
deposited films, which was attributed to a lower residual stress value induced by a lower
deposition temperature. Both industrially and laboratory deposited coatings showed an
excellent behaviour in strip-drawing tests. Tests without lubrication could be run without
adhesion for all the steel sheet materials. Only when an Aluminium alloy was used
adhesion could be observed. With uncoated tools adhesion always occurred independently
of the testing loads and antagonist sheet material. In lubricated conditions, the friction
coefficients were always lower with coated tools even if the lubricant amount was reduced
(0.5 against 2 g/m2 for the uncoated sample) (Severo, 2009; Severo et al., 2009).
As previously mentioned, the contact conditions in deep drawing processes are
critical when forming soft and ductile materials, particularly aluminium alloys. However,
the continuous demand for higher fuel efficiency and lower emission vehicles is driving
many automotive manufacturers to increasingly use aluminium alloys sheets. In that
context and for economic reasons, 5000 series (Al-Mg) alloys could advantageously
replace more expensive 6000 (Al-Mg-Si) alloys, but most of the time, Portevin-Le
Chatelier (PLC) effect is facing the use of these alloys. Due to this effect, the formability is
less at room temperature and it generates non-aesthetic stretcher lines on the sheets under
plastic deformation. In the case of the automotive industry, this disadvantage limits the
applications of Al-Mg alloys to interior panels, whereas the Al-Mg-Si alloys are used to
perform outer door panel. As the PLC effect is known to be temperature dependent, a first
issue could be to form these alloys at warmer temperature in order to suppress it. However,
this may not be consistent with a cost reduction, depending on the optimization of the
process parameters. In this context, it is important to improve the knowledge about the
conditions of appearance of the PLC under different stress states (recently it was shown
that PLC effect is also strain path dependent (Coër at al., 2013), in order to propose
alternatives for the forming processes. Therefore, several studies have been performed in
order to better characterize the behaviour of the 5754-O aluminium alloy (AA5754-O) in
deep drawing processes, at room and warm temperature. In fact, at warm temperature,
Analysis of the tribological behaviour of W-Ti-N coatings
6 2013
some phenomena, as the springback and the PLC effect are considerably lower (Coër et al.,
2010; Laurent et al., 2008; Laurent et al., 2010; Laurent et al., 2011; Oliveira et al., 2011a).
The deep drawing part selected to perform the analysis of the formability and springback,
in warm forming conditions, was a cylindrical cup, which is one of the most widely studied
processes. This geometry allows analysing the effect of different process parameters in
phenomena such as earing, springback and ironing. This geometry is widely used to
evaluate the springback phenomena, in a benchmark test normally designated by split-ring
test. This test consists of four steps: (i) deep drawing of a cylindrical cup from a circular
blank with a constant blank-holder force; (ii) release the formed cup from the tooling
restraints; (iii) cut a circular ring from the mid-section of the drawn cup; and (iv) split the
ring along a pre-defined direction to release residual stresses and measure the opening
displacement of the ring. This test has several desirable features: (i) the experimental setup
and procedure are relatively simple and highly repeatable; (ii) the deformation involves
both bending and stretching, which closely represents actual stamping operations; and (iii)
the amplitude of springback is relatively large and easy to measure, thus avoiding
experimental errors found in some other tests (Laurent at al., 2010). Moreover, during the
deep drawing of a cylindrical cup the blank thickness gradually increases as the blank outer
diameter is reduced to the die inner diameter, resulting in a thickness increase from a point
near the bottom radius until the maximum value at the top of the cup. Therefore, if the gap
between the punch and the die is not sufficiently large to allow the blank material to flow,
ironing of the cup wall will occur. The ironing process typically imposes high contact
forces, normal to the surface of the punch and the die, which can lead to the occurrence of
galling, particularly for aluminium alloys. Ironing operations are quite challenging also for
the numerical simulation of the process using the finite element method, due to the
complex contact with friction phenomenon and stress conditions that occur. The gap
selected for the tools geometry used to test the AA5754-O 1 mm thick blanks lead to the
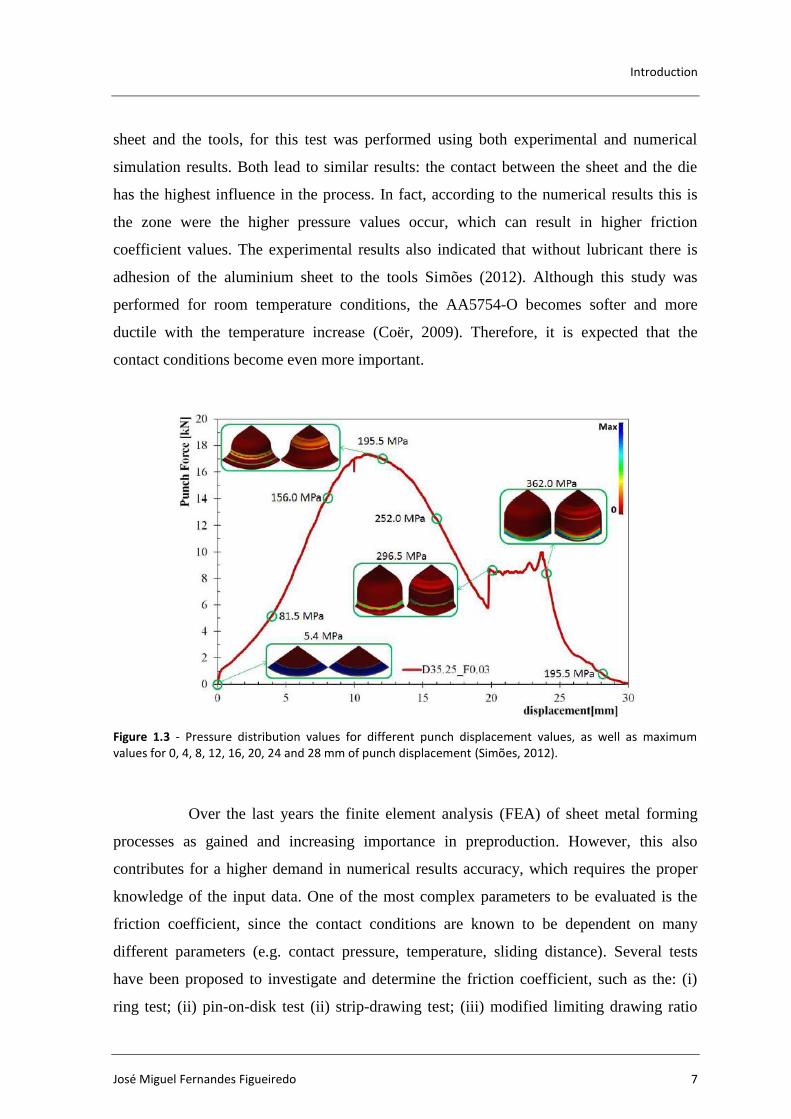
occurrence of ironing at the end of the forming process, as shown in Figure 1.3 (Simões,
2012). This figure also shows the numerically predicted values for the maximum contact
pressure, assuming a constant friction coefficient value of 0.03. In the figure it is possible
to observe the increase of the contact pressure as a result of the ironing operation. It is also
possible to observe the contact zones evolution, during the deep drawing process. The
analysis of the contribution of the contact conditions, in each contact zone between the
Introduction
José Miguel Fernandes Figueiredo 7
sheet and the tools, for this test was performed using both experimental and numerical
simulation results. Both lead to similar results: the contact between the sheet and the die
has the highest influence in the process. In fact, according to the numerical results this is
the zone were the higher pressure values occur, which can result in higher friction
coefficient values. The experimental results also indicated that without lubricant there is
adhesion of the aluminium sheet to the tools Simões (2012). Although this study was
performed for room temperature conditions, the AA5754-O becomes softer and more
ductile with the temperature increase (Coër, 2009). Therefore, it is expected that the
contact conditions become even more important.
Figure 1.3 - Pressure distribution values for different punch displacement values, as well as maximum values for 0, 4, 8, 12, 16, 20, 24 and 28 mm of punch displacement (Simões, 2012).
Over the last years the finite element analysis (FEA) of sheet metal forming
processes as gained and increasing importance in preproduction. However, this also
contributes for a higher demand in numerical results accuracy, which requires the proper
knowledge of the input data. One of the most complex parameters to be evaluated is the
friction coefficient, since the contact conditions are known to be dependent on many
different parameters (e.g. contact pressure, temperature, sliding distance). Several tests
have been proposed to investigate and determine the friction coefficient, such as the: (i)
ring test; (ii) pin-on-disk test (ii) strip-drawing test; (iii) modified limiting drawing ratio
Analysis of the tribological behaviour of W-Ti-N coatings
8 2013
test, (iv) twist compression test; and (v) technological tests (cup test) that model the
stressing of material in real stamping process (Ceretti et al., 2008). The use of complex
technological tests typically relies on inverse analysis strategies for estimating the friction
coefficient. However, it is know that there is a straight correlation between the rheological
and tribological properties of the materials. Therefore, the same strain distribution can be
achieved using different yield criteria combined with different friction coefficient values
(Fromentina et al., 2001). Among the other types of tests, the pin-on-disk has the
advantage of allowing a direct measurement of the normal and friction forces, being the
friction coefficient estimated using one single couple of surfaces in contact (Ceretti et al.,
2008). However, due to the cyclic characteristics of pin-on-disk tests they are considered to
be unsuitable for the tribological characterization of forming processes. Also, according to
some authors, it is not possible to directly apply the results of local contact tests to sheet
metal forming processes, due to the high contact pressure values that occur (Oliveira et al.,
2011b). Nonetheless, the pin-on-disk test is widely applied, due to its availability, easiness
of use and reproducibility. Therefore, many researchers resort to this test to characterize
the tribological conditions that occur in sheet metal forming processes. In fact, some
authors resort to this experimental test for finding the necessary input data for more
complex friction models, which take into account the anisotropic behaviour of the friction
coefficient (Stachowicz and Trzepieciński, 2010; Trzepieciński, 2010).
1.1. Framework
This research results from a collaboration work between the ECAT
(Experimental and Computer Aided Technology) and the SE (Surface Engineering) groups
from CEMUC (Centro de Engenharia Mecânica da Universidade de Coimbra). The ECAT
has been working in a partnership with the LIMATB (Laboratoire d'Ingénierie des
MATériaux de Bretagne, University of Bretagne-Sud) in the development of warm
forming processes for AA5754-O aluminium alloys. In this partnership, LIMATB is
responsible for the experimental part and ECAT for the development of numerical tools
aimed to support the design of the process. Based on previously reported experimental
results for the cylindrical cup deep drawing process, selected for the experimental analysis
(Simões, 2012), the use of W-Ti-N coatings seemed quite promising for reducing adhesion
problems, while guaranteeing the use of a low amount of lubricant. Therefore, a new set of
Introduction
José Miguel Fernandes Figueiredo 9
tools was constructed and it was decided to coat the plane surfaces of the blank-holder and
die, as well as the die radii. The same tool will be used for performing the cylindrical cup
deep drawing operation, under isothermal conditions, at room temperature, 100ºC, 150ºC
and 200ºC. Therefore, in order to be able to improve the numerical simulation results, it
was considered important to characterize the contact conditions for all these temperatures.
Following the previous works performed by the SE group, the coatings were
performed in a four cathodes semi-industrial TEER equipment, working in unbalanced
mode using Ti targets embedded with round W pellets, following the procedure presented
in Severo et al. (2009) and Severo (2009). Unfortunately, the results for this deposition
conditions were not in agreement with the expectations (may be because of some changes
in the target geometrical characteristics). Therefore, it was necessary to perform several
depositions, varying the partial pressure ratio between N2 and Ar (pN2/pAr). For eight of
these deposition conditions, it was decided to analyse the tribological behaviour of the
coatings (samples labelled N2 to N9, in the following chapters). The deep drawing tools
were coated together with the samples labelled N9. The pin-on-disk experimental tests
were performed at the Advanced Materials Group laboratory, of the Czech Technical
University, with which the SE group maintains a strong collaboration.
1.2. Objectives
The aim objective of this work is to provide an experimental database for the
tribological characteristics, at room and warm temperature, between the AA5754-O
aluminium alloy and a steel (H13) coated with a thin film (W-Ti-N). The experimental
database was built based on pin-on-disk tests. The results for this type of tests are known to
be influenced by the transfer layer formed during the test. This may limit the extension of
the wear resistance results to non-cyclic sliding contact. Therefore, in order to avoid this
situation, some authors propose to perform the tests inverting the element of the pair to be
coated, i.e. coating the ball and running the test against the uncoated disk (Silva et al.,
2008).
In order to reproduce the different contact conditions associated to sheet metal
forming processes, two types of steel samples were coated: planar and spherical. The first
type of samples was tested using as counter-body of aluminium pins. These conditions are
similar to the ones observed in the deep drawing process in the contact area between the
Analysis of the tribological behaviour of W-Ti-N coatings
10 2013
sheet and the punch. The second type of samples was the counter-body of the tests
performed with aluminium sheets. These conditions are similar to the ones observed in the
deep drawing process in the contact area between the sheet and the blank holder and the
sheet and the die, since the aluminium sheet slides along these areas.
1.3. Manuscript Organization
This first chapter, were the work performed was contextualized, is followed by
the second chapter that describes the materials, equipments and methods applied. The third
chapter presents the experimental details, including the ones referring some preliminary
tests performed and the final test plan designed for the tribological characterization of the
W-Ti-N coatings. In the fourth chapter the friction coefficient results are analysed in terms
of their evolution with time and with the relative angular position. Finally, in chapter five
some conclusions are drawn as well as some suggestions for further works.
Materials, Equipments and Methods
José Miguel Fernandes Figueiredo 11
2. MATERIALS, EQUIPMENTS AND METHODS
2.1. Materials
The materials under study were the AA5754-O aluminium alloy and the W-Ti-
N thin films. The coatings were deposited on H13 (AISI) high speed steel, trying to
resemble the conditions used for the deep drawing tool. All substrates were surface
finishing with mirror-like polishment. The substrate sample had a radius of approximately
12.5 mm.
As previously mentioned, the aluminium alloy selected is often used in
automotive industry applications, such as inner door panels. The AA5754-O 1 mm
thickness sheet is manufactured by rolling operations and its composition in weight is
presented in Table 3. The disk samples had a radius of approximately 25 mm. The pins
were produced from AA5754 rods (EN AW 5754 H111), which was the more similar
material that was commercially available, with a 10 mm diameter and 78 mm length,
which were metallographically polished.
Table 2.1 - Composition in weight % of AA5754-O.
Cu Mn Mg Si Fe Cr Al
≤0.10 ≤0.50 2.60-3.60 ≤0.40 ≤0.40 ≤0.30 93.6-97.3
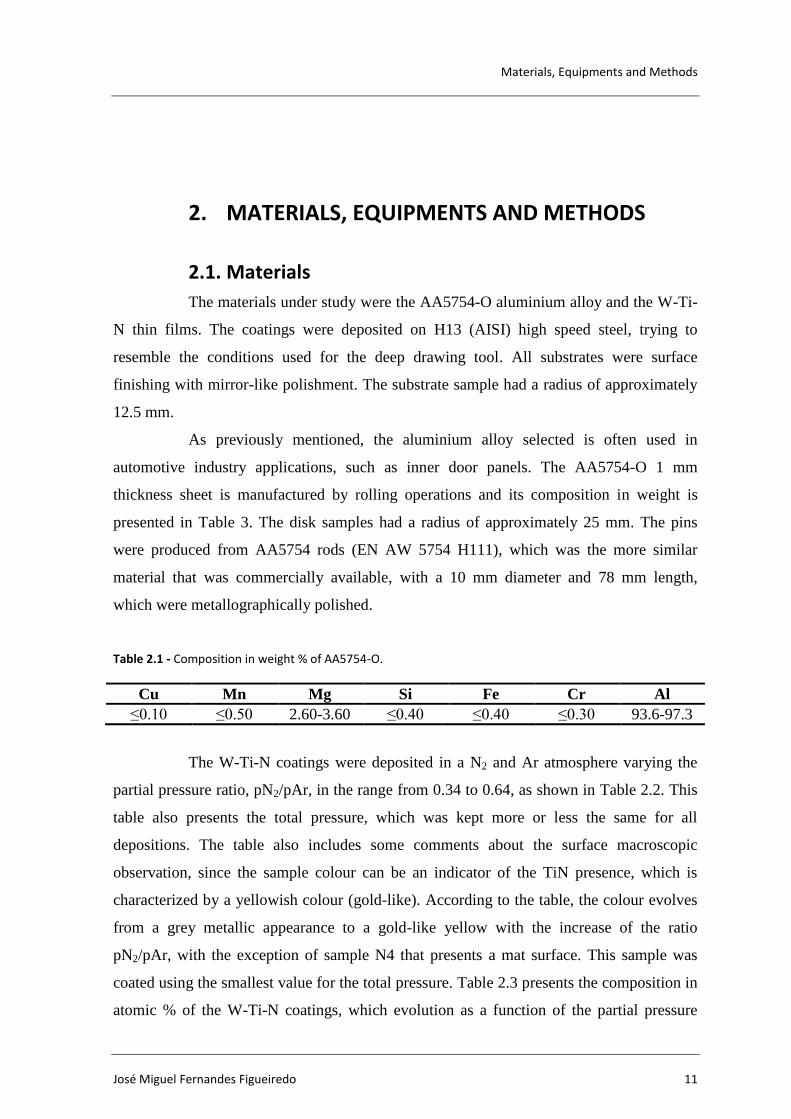
The W-Ti-N coatings were deposited in a N2 and Ar atmosphere varying the
partial pressure ratio, pN2/pAr, in the range from 0.34 to 0.64, as shown in Table 2.2. This
table also presents the total pressure, which was kept more or less the same for all
depositions. The table also includes some comments about the surface macroscopic
observation, since the sample colour can be an indicator of the TiN presence, which is
characterized by a yellowish colour (gold-like). According to the table, the colour evolves
from a grey metallic appearance to a gold-like yellow with the increase of the ratio
pN2/pAr, with the exception of sample N4 that presents a mat surface. This sample was
coated using the smallest value for the total pressure. Table 2.3 presents the composition in
atomic % of the W-Ti-N coatings, which evolution as a function of the partial pressure
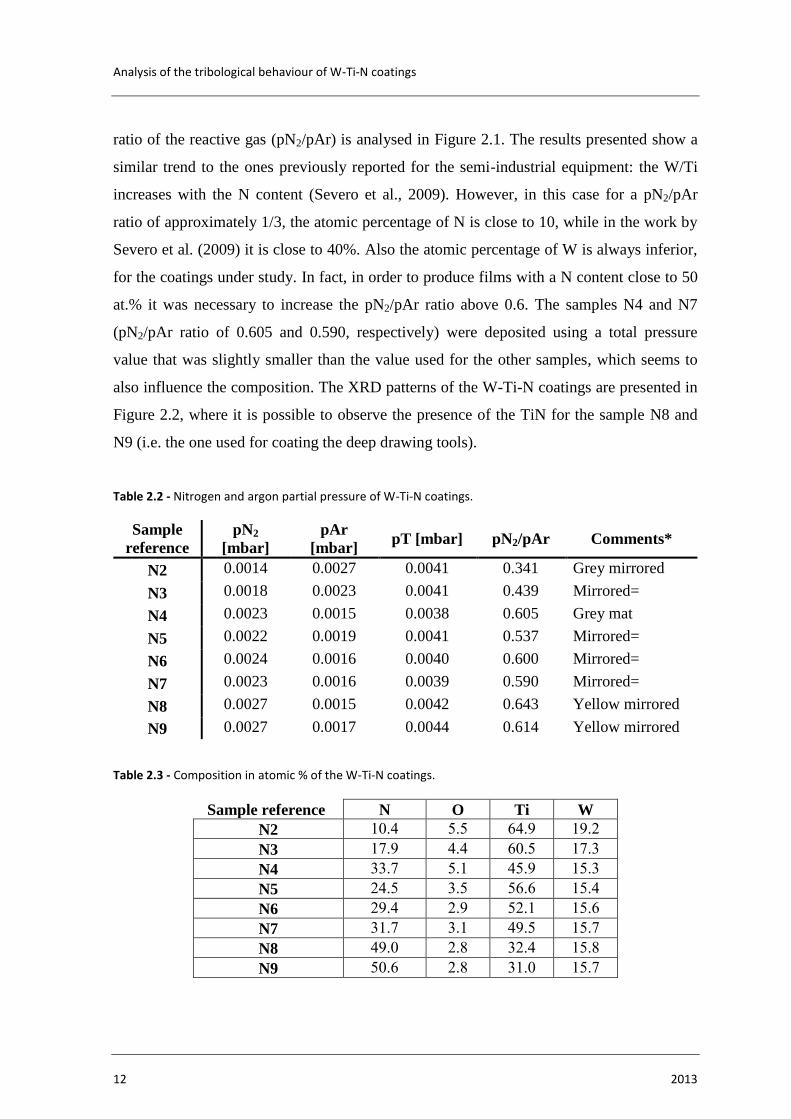
Analysis of the tribological behaviour of W-Ti-N coatings
12 2013
ratio of the reactive gas (pN2/pAr) is analysed in Figure 2.1. The results presented show a
similar trend to the ones previously reported for the semi-industrial equipment: the W/Ti
increases with the N content (Severo et al., 2009). However, in this case for a pN2/pAr
ratio of approximately 1/3, the atomic percentage of N is close to 10, while in the work by
Severo et al. (2009) it is close to 40%. Also the atomic percentage of W is always inferior,
for the coatings under study. In fact, in order to produce films with a N content close to 50
at.% it was necessary to increase the pN2/pAr ratio above 0.6. The samples N4 and N7
(pN2/pAr ratio of 0.605 and 0.590, respectively) were deposited using a total pressure
value that was slightly smaller than the value used for the other samples, which seems to
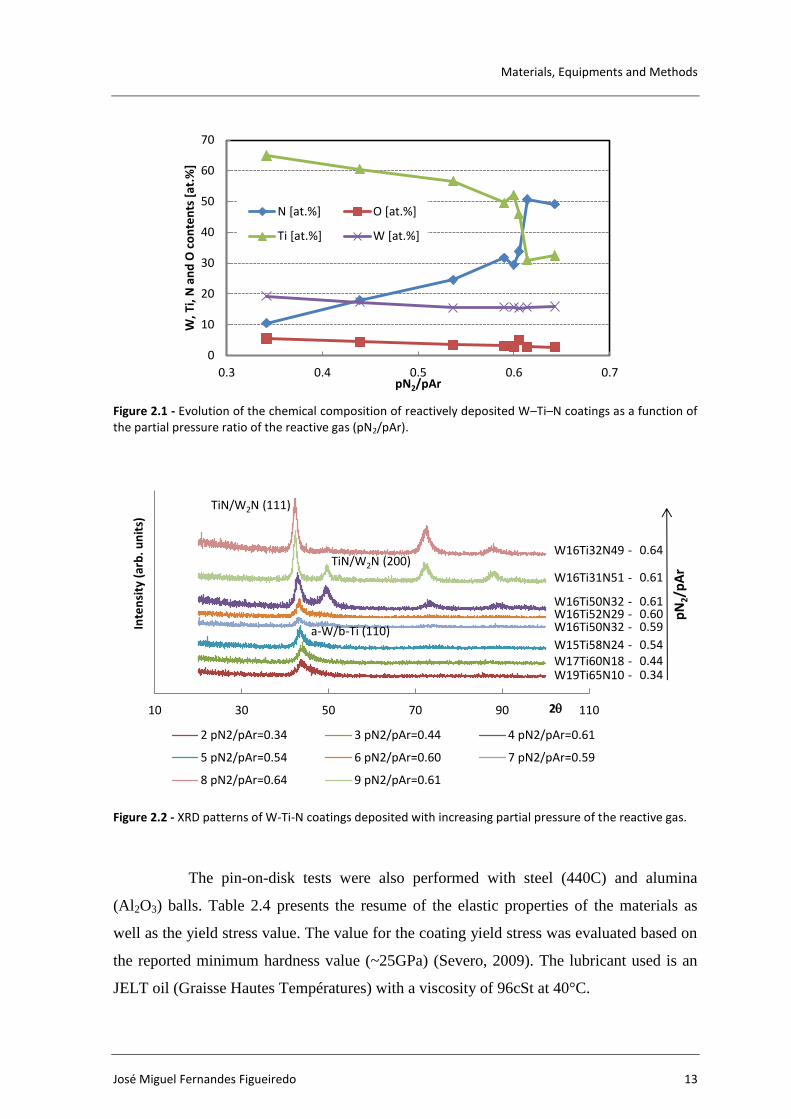
also influence the composition. The XRD patterns of the W-Ti-N coatings are presented in
Figure 2.2, where it is possible to observe the presence of the TiN for the sample N8 and
N9 (i.e. the one used for coating the deep drawing tools).
Table 2.2 - Nitrogen and argon partial pressure of W-Ti-N coatings.
Sample
reference
pN2
[mbar]
pAr
[mbar] pT [mbar] pN2/pAr Comments*
N2 0.0014 0.0027 0.0041 0.341 Grey mirrored
N3 0.0018 0.0023 0.0041 0.439 Mirrored=
N4 0.0023 0.0015 0.0038 0.605 Grey mat
N5 0.0022 0.0019 0.0041 0.537 Mirrored=
N6 0.0024 0.0016 0.0040 0.600 Mirrored=
N7 0.0023 0.0016 0.0039 0.590 Mirrored=
N8 0.0027 0.0015 0.0042 0.643 Yellow mirrored
N9 0.0027 0.0017 0.0044 0.614 Yellow mirrored
Table 2.3 - Composition in atomic % of the W-Ti-N coatings.
Sample reference N O Ti W
N2 10.4 5.5 64.9 19.2
N3 17.9 4.4 60.5 17.3
N4 33.7 5.1 45.9 15.3
N5 24.5 3.5 56.6 15.4
N6 29.4 2.9 52.1 15.6
N7 31.7 3.1 49.5 15.7
N8 49.0 2.8 32.4 15.8
N9 50.6 2.8 31.0 15.7
Materials, Equipments and Methods
José Miguel Fernandes Figueiredo 13
Figure 2.1 - Evolution of the chemical composition of reactively deposited W–Ti–N coatings as a function of the partial pressure ratio of the reactive gas (pN2/pAr).
Figure 2.2 - XRD patterns of W-Ti-N coatings deposited with increasing partial pressure of the reactive gas.
The pin-on-disk tests were also performed with steel (440C) and alumina
(Al2O3) balls. Table 2.4 presents the resume of the elastic properties of the materials as
well as the yield stress value. The value for the coating yield stress was evaluated based on
the reported minimum hardness value (~25GPa) (Severo, 2009). The lubricant used is an
JELT oil (Graisse Hautes Températures) with a viscosity of 96cSt at 40°C.
0
10
20
30
40
50
60
70
0.3 0.4 0.5 0.6 0.7
W, T
i, N
an
d O
co
nte
nts
[at
.%]
pN2/pAr
N [at.%] O [at.%]
Ti [at.%] W [at.%]
10 30 50 70 90 110
Inte
nsi
ty (
arb
. un
its)
2q
2 pN2/pAr=0.34 3 pN2/pAr=0.44 4 pN2/pAr=0.61
5 pN2/pAr=0.54 6 pN2/pAr=0.60 7 pN2/pAr=0.59
8 pN2/pAr=0.64 9 pN2/pAr=0.61
TiN/W2N (200)
TiN/W2N (111)
a-W/b-Ti (110)
pN
2/p
Ar
0.34
0.54
0.60
0.61
0.64
0.61
0.59
0.44W19Ti65N10 -W17Ti60N18 -W15Ti58N24 -
W16Ti50N32 -W16Ti52N29 -W16Ti50N32 -
W16Ti31N51 -
W16Ti32N49 -
Analysis of the tribological behaviour of W-Ti-N coatings
14 2013
Table 2.4 - Mechanical properties of the materials and pin radius.
[GPa] [MPa] Pin radius [mm]
440C* 215 0.283 - 3.0
Al2O3* 370 0.22 - 3.0
AA5754-O 74.6 0.33 50 5.0
W-Ti-N 250 0.25 850 5.0 * Values extracted from www.matweb.com
2.2. Equipments and Methods
In this chapter the equipments and methods used in the research are described,
mainly focusing on the tribometer, since this was the crucial instrument used in the work.
2.2.1. Tribometer
The analysis of friction and wear properties of materials at elevated
temperatures, in moving machine parts or forming processes, is a critical issue facing all
manufacturers. It can be crucial to have quantitative data obtained at varying humidity and
temperature and in the presence of lubricants (CMS Instruments, 2012). The equipment
typically used for this analysis is a tribometer, were the probe (a sphere, a pin or a flat
section) is loaded onto the test sample with a precisely known force. The probe is mounted
on a stiff lever, designed as a frictionless force transducer. The friction coefficient is
determined during the test by measuring the deflection of the elastic arm (CMS
Instruments, catalogue, 2012).
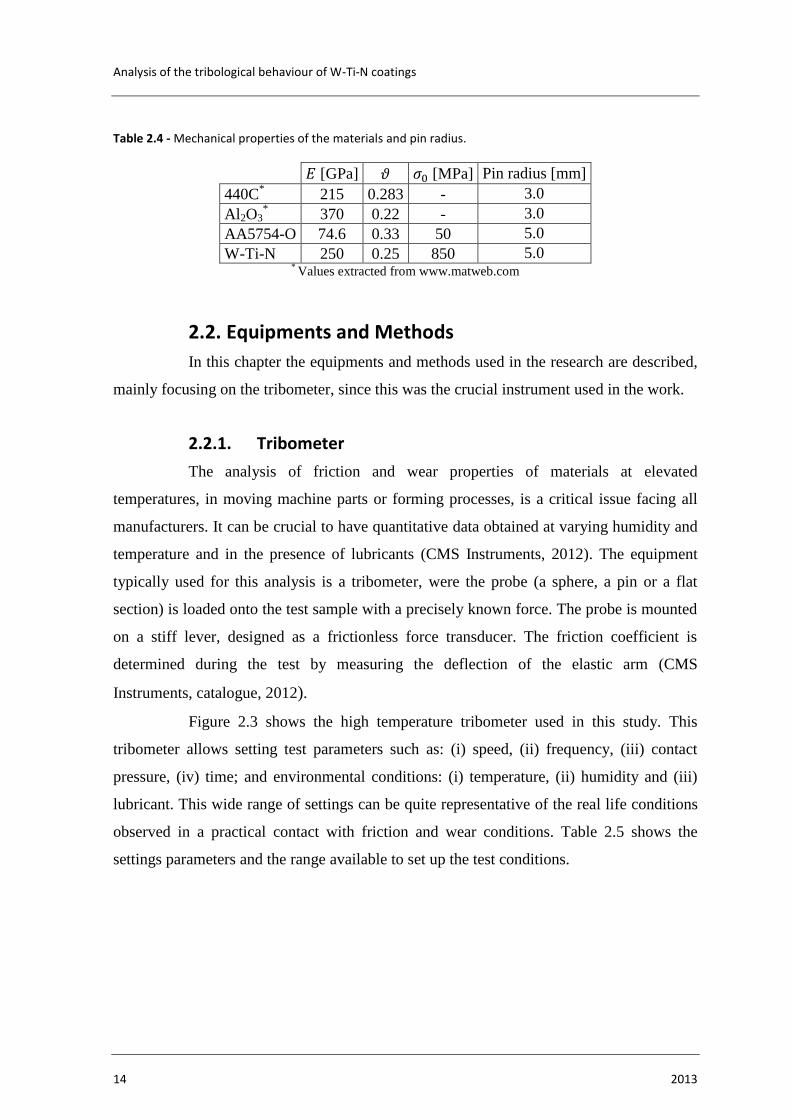
Figure 2.3 shows the high temperature tribometer used in this study. This
tribometer allows setting test parameters such as: (i) speed, (ii) frequency, (iii) contact
pressure, (iv) time; and environmental conditions: (i) temperature, (ii) humidity and (iii)
lubricant. This wide range of settings can be quite representative of the real life conditions
observed in a practical contact with friction and wear conditions. Table 2.5 shows the
settings parameters and the range available to set up the test conditions.
Materials, Equipments and Methods
José Miguel Fernandes Figueiredo 15
Figure 2.3 - High Temperature Tribometer (CMS Instruments, catalogue, 2012).
Table 2.5 - Tribometer settings range (CMS Instruments, catalogue, 2012).
Load range up to 60 N
Load resolution 30 mN
Maximum Friction force 10 N
Friction resolution 5 mN
Maximum temperature 1000 °C
Rotation Speed 0.3 - 500 rpm
Maximum test radius 30 mm
Maximum torque 450 mN.m
Stroke length 60 mm
Speed up to 100 mms-1
Frequency 0.1 - 10 Hz
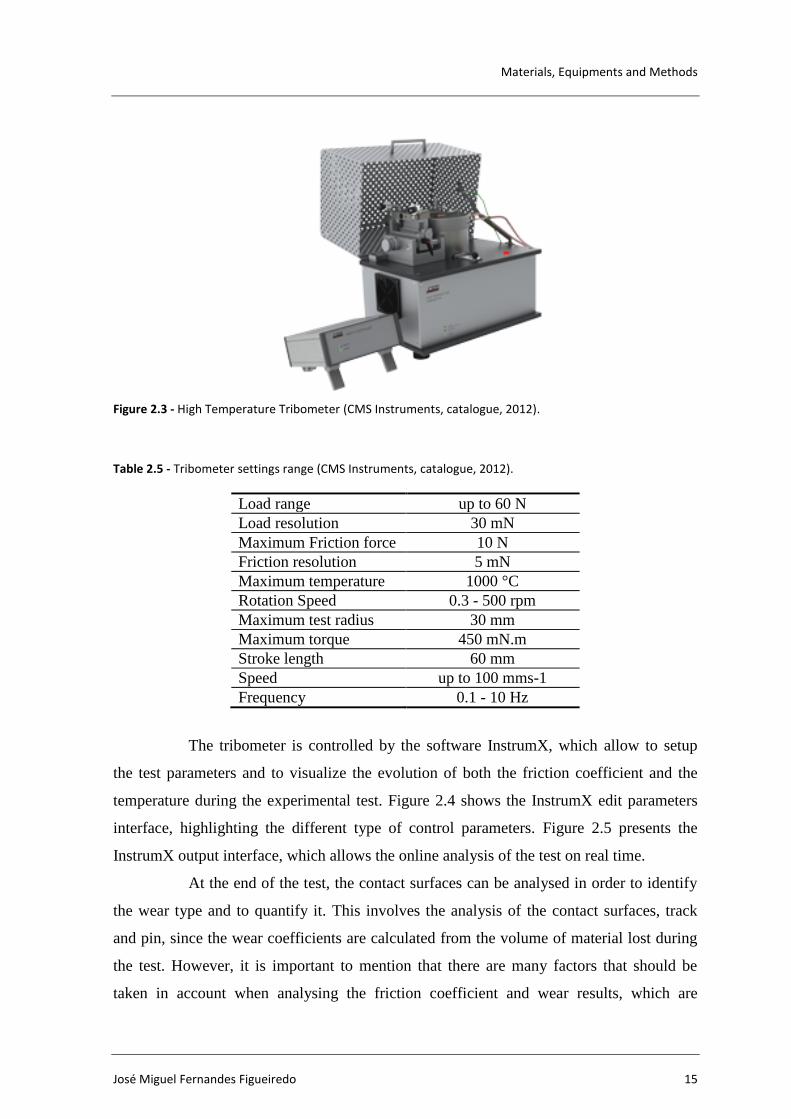
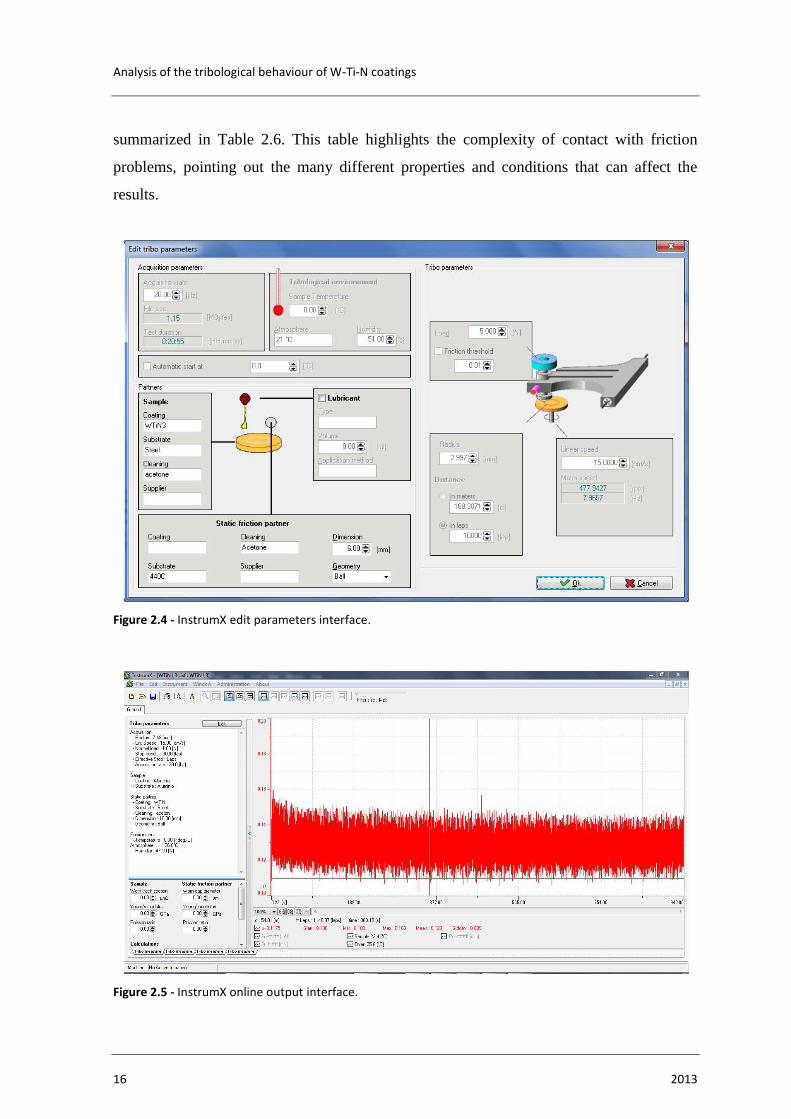
The tribometer is controlled by the software InstrumX, which allow to setup
the test parameters and to visualize the evolution of both the friction coefficient and the
temperature during the experimental test. Figure 2.4 shows the InstrumX edit parameters
interface, highlighting the different type of control parameters. Figure 2.5 presents the
InstrumX output interface, which allows the online analysis of the test on real time.
At the end of the test, the contact surfaces can be analysed in order to identify
the wear type and to quantify it. This involves the analysis of the contact surfaces, track
and pin, since the wear coefficients are calculated from the volume of material lost during
the test. However, it is important to mention that there are many factors that should be
taken in account when analysing the friction coefficient and wear results, which are
Analysis of the tribological behaviour of W-Ti-N coatings
16 2013
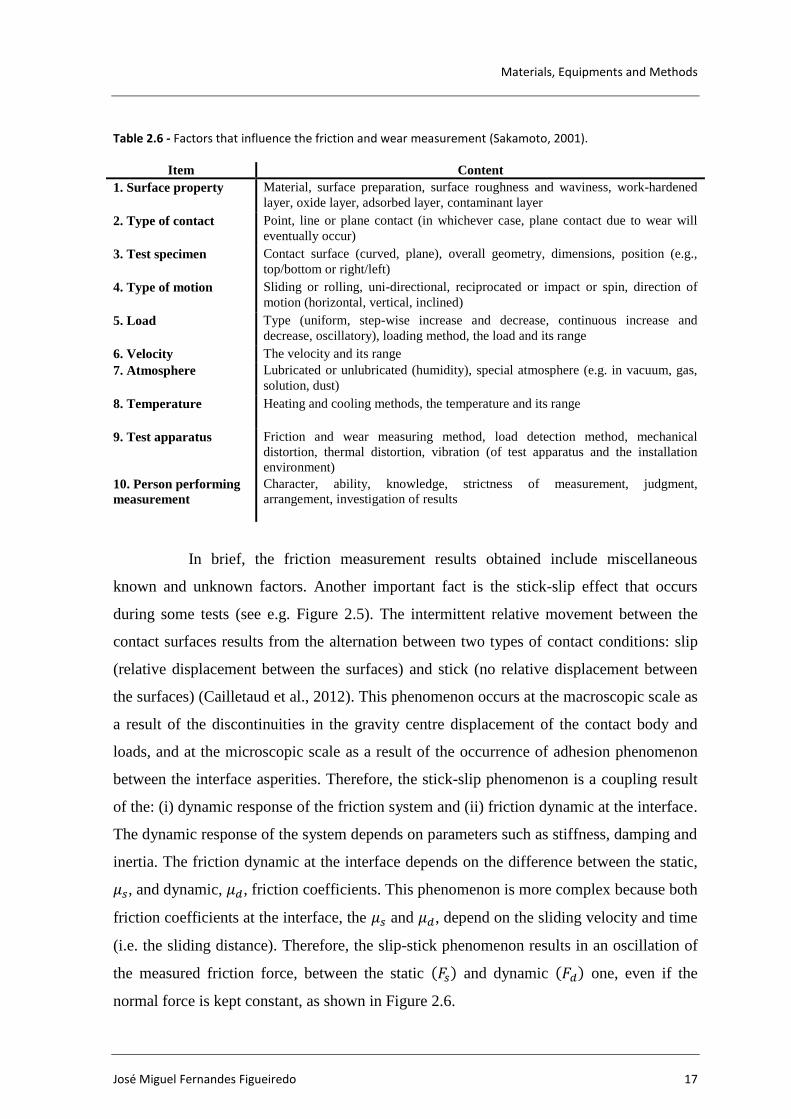
summarized in Table 2.6. This table highlights the complexity of contact with friction
problems, pointing out the many different properties and conditions that can affect the
results.
Figure 2.4 - InstrumX edit parameters interface.
Figure 2.5 - InstrumX online output interface.
Materials, Equipments and Methods
José Miguel Fernandes Figueiredo 17
Table 2.6 - Factors that influence the friction and wear measurement (Sakamoto, 2001).
Item Content
1. Surface property
Material, surface preparation, surface roughness and waviness, work-hardened
layer, oxide layer, adsorbed layer, contaminant layer
2. Type of contact
Point, line or plane contact (in whichever case, plane contact due to wear will
eventually occur)
3. Test specimen
Contact surface (curved, plane), overall geometry, dimensions, position (e.g.,
top/bottom or right/left)
4. Type of motion
Sliding or rolling, uni-directional, reciprocated or impact or spin, direction of
motion (horizontal, vertical, inclined)
5. Load
Type (uniform, step-wise increase and decrease, continuous increase and
decrease, oscillatory), loading method, the load and its range
6. Velocity The velocity and its range
7. Atmosphere
Lubricated or unlubricated (humidity), special atmosphere (e.g. in vacuum, gas,
solution, dust)
8. Temperature
Heating and cooling methods, the temperature and its range
9. Test apparatus
Friction and wear measuring method, load detection method, mechanical
distortion, thermal distortion, vibration (of test apparatus and the installation
environment)
10. Person performing
measurement
Character, ability, knowledge, strictness of measurement, judgment,
arrangement, investigation of results
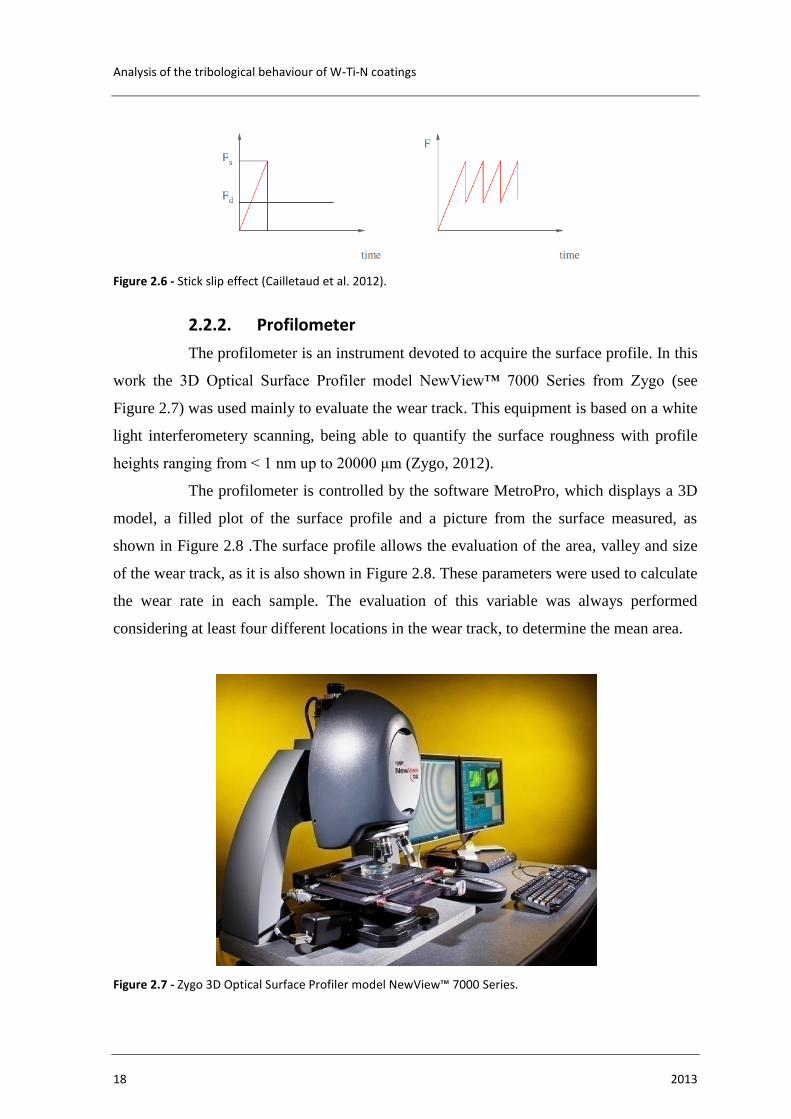
In brief, the friction measurement results obtained include miscellaneous
known and unknown factors. Another important fact is the stick-slip effect that occurs
during some tests (see e.g. Figure 2.5). The intermittent relative movement between the
contact surfaces results from the alternation between two types of contact conditions: slip
(relative displacement between the surfaces) and stick (no relative displacement between
the surfaces) (Cailletaud et al., 2012). This phenomenon occurs at the macroscopic scale as
a result of the discontinuities in the gravity centre displacement of the contact body and
loads, and at the microscopic scale as a result of the occurrence of adhesion phenomenon
between the interface asperities. Therefore, the stick-slip phenomenon is a coupling result
of the: (i) dynamic response of the friction system and (ii) friction dynamic at the interface.
The dynamic response of the system depends on parameters such as stiffness, damping and
inertia. The friction dynamic at the interface depends on the difference between the static,
, and dynamic, , friction coefficients. This phenomenon is more complex because both
friction coefficients at the interface, the and , depend on the sliding velocity and time
(i.e. the sliding distance). Therefore, the slip-stick phenomenon results in an oscillation of
the measured friction force, between the static ( ) and dynamic ( ) one, even if the
normal force is kept constant, as shown in Figure 2.6.
Analysis of the tribological behaviour of W-Ti-N coatings
18 2013
Figure 2.6 - Stick slip effect (Cailletaud et al. 2012).
2.2.2. Profilometer
The profilometer is an instrument devoted to acquire the surface profile. In this
work the 3D Optical Surface Profiler model NewView™ 7000 Series from Zygo (see
Figure 2.7) was used mainly to evaluate the wear track. This equipment is based on a white
light interferometery scanning, being able to quantify the surface roughness with profile
heights ranging from < 1 nm up to 20000 μm (Zygo, 2012).
The profilometer is controlled by the software MetroPro, which displays a 3D
model, a filled plot of the surface profile and a picture from the surface measured, as
shown in Figure 2.8 .The surface profile allows the evaluation of the area, valley and size
of the wear track, as it is also shown in Figure 2.8. These parameters were used to calculate
the wear rate in each sample. The evaluation of this variable was always performed
considering at least four different locations in the wear track, to determine the mean area.
Figure 2.7 - Zygo 3D Optical Surface Profiler model NewView™ 7000 Series.
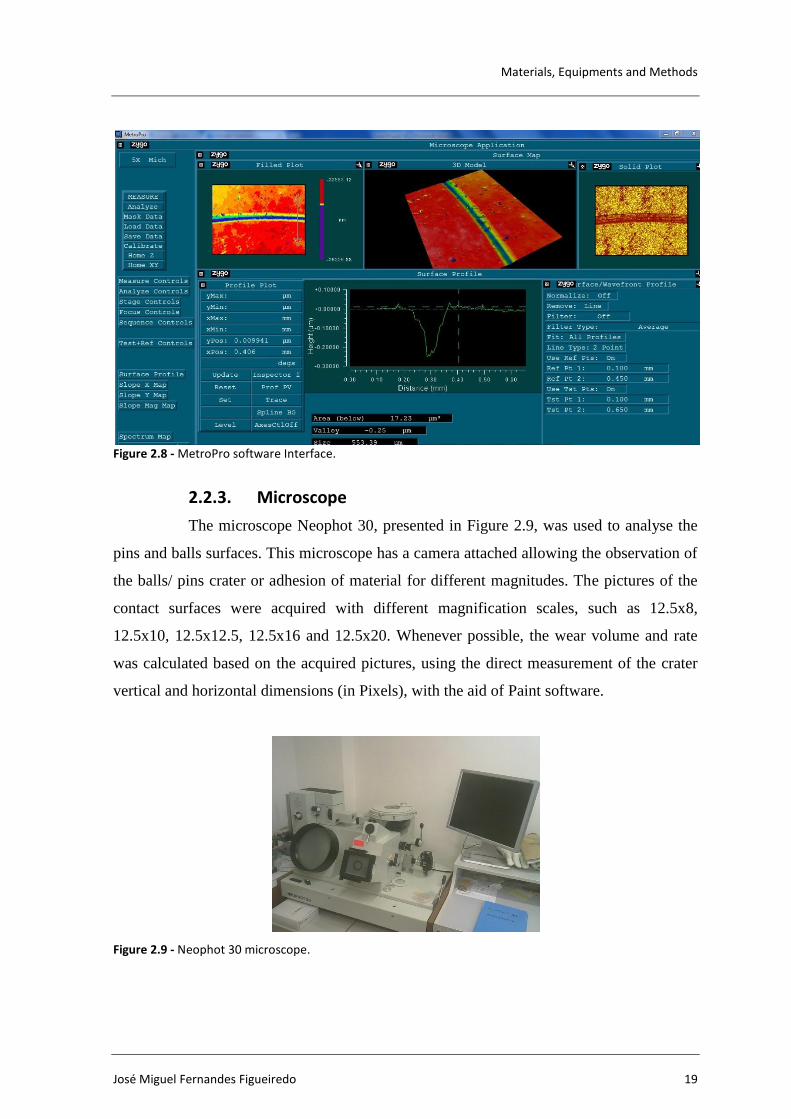
Materials, Equipments and Methods
José Miguel Fernandes Figueiredo 19
Figure 2.8 - MetroPro software Interface.
2.2.3. Microscope
The microscope Neophot 30, presented in Figure 2.9, was used to analyse the
pins and balls surfaces. This microscope has a camera attached allowing the observation of
the balls/ pins crater or adhesion of material for different magnitudes. The pictures of the
contact surfaces were acquired with different magnification scales, such as 12.5x8,
12.5x10, 12.5x12.5, 12.5x16 and 12.5x20. Whenever possible, the wear volume and rate
was calculated based on the acquired pictures, using the direct measurement of the crater
vertical and horizontal dimensions (in Pixels), with the aid of Paint software.
Figure 2.9 - Neophot 30 microscope.
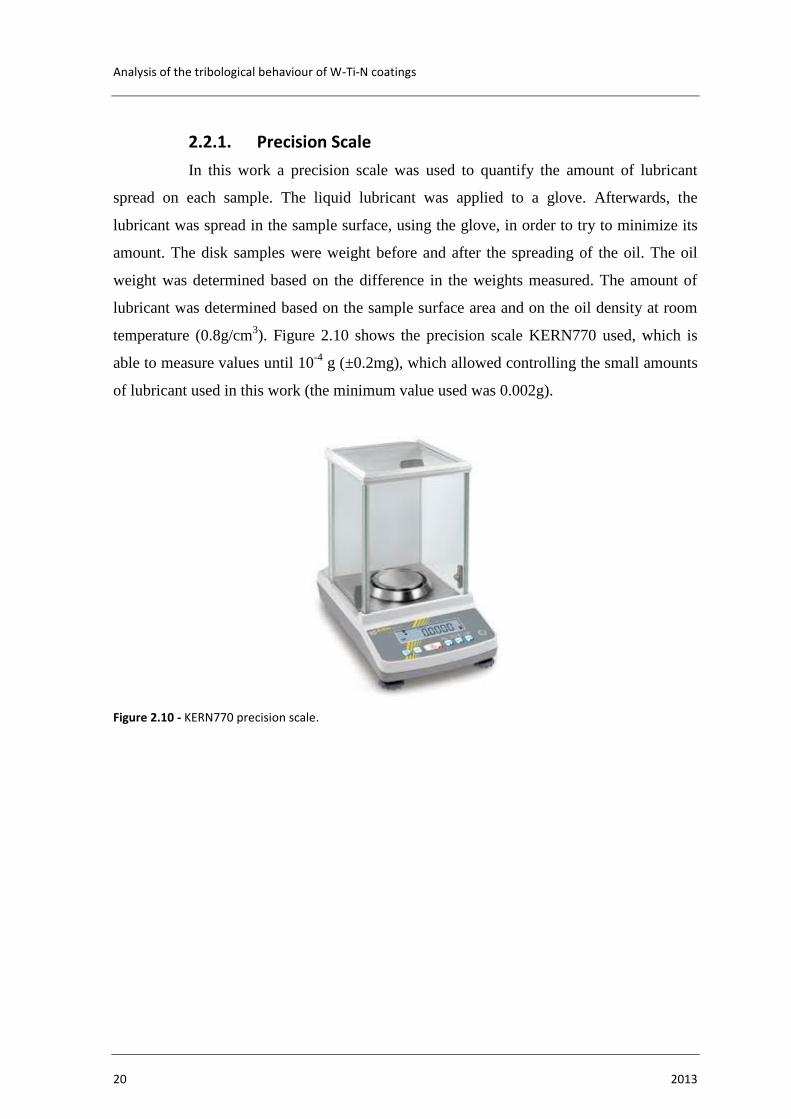
Analysis of the tribological behaviour of W-Ti-N coatings
20 2013
2.2.1. Precision Scale
In this work a precision scale was used to quantify the amount of lubricant
spread on each sample. The liquid lubricant was applied to a glove. Afterwards, the
lubricant was spread in the sample surface, using the glove, in order to try to minimize its
amount. The disk samples were weight before and after the spreading of the oil. The oil
weight was determined based on the difference in the weights measured. The amount of
lubricant was determined based on the sample surface area and on the oil density at room
temperature (0.8g/cm3). Figure 2.10 shows the precision scale KERN770 used, which is
able to measure values until 10-4
g (±0.2mg), which allowed controlling the small amounts
of lubricant used in this work (the minimum value used was 0.002g).
Figure 2.10 - KERN770 precision scale.
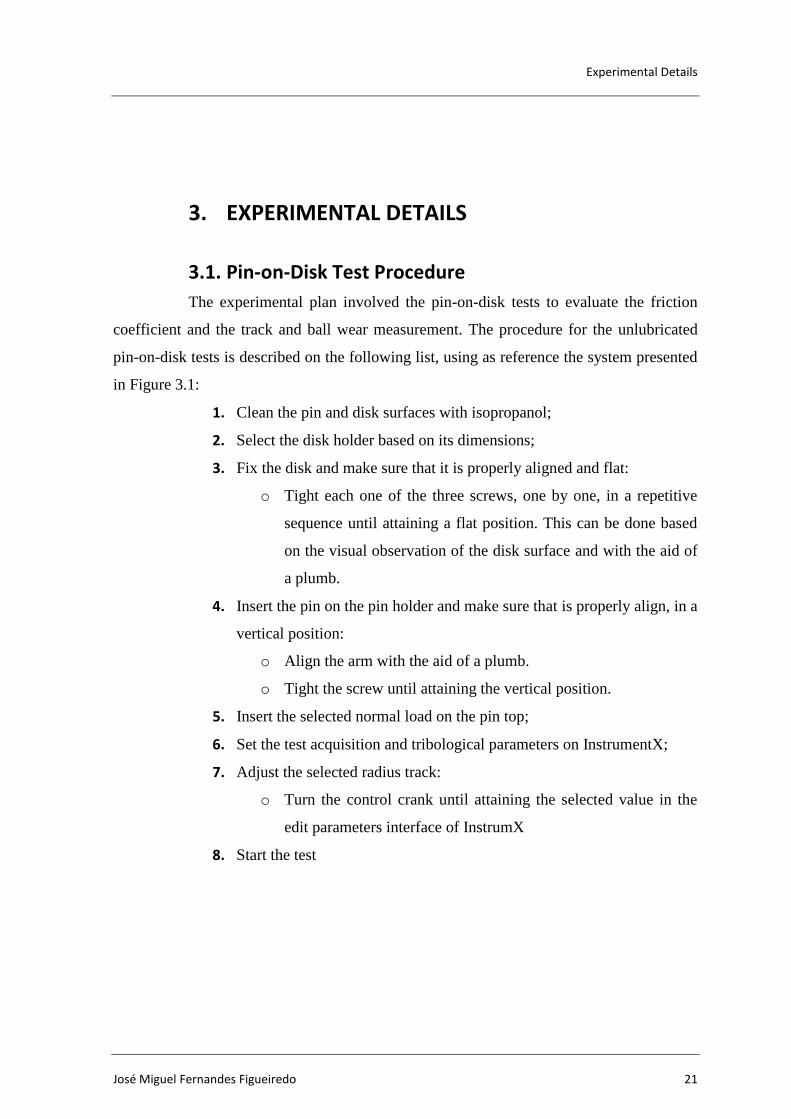
Experimental Details
José Miguel Fernandes Figueiredo 21
3. EXPERIMENTAL DETAILS
3.1. Pin-on-Disk Test Procedure
The experimental plan involved the pin-on-disk tests to evaluate the friction
coefficient and the track and ball wear measurement. The procedure for the unlubricated
pin-on-disk tests is described on the following list, using as reference the system presented
in Figure 3.1:
1. Clean the pin and disk surfaces with isopropanol;
2. Select the disk holder based on its dimensions;
3. Fix the disk and make sure that it is properly aligned and flat:
o Tight each one of the three screws, one by one, in a repetitive
sequence until attaining a flat position. This can be done based
on the visual observation of the disk surface and with the aid of
a plumb.
4. Insert the pin on the pin holder and make sure that is properly align, in a
vertical position:
o Align the arm with the aid of a plumb.
o Tight the screw until attaining the vertical position.
5. Insert the selected normal load on the pin top;
6. Set the test acquisition and tribological parameters on InstrumentX;
7. Adjust the selected radius track:
o Turn the control crank until attaining the selected value in the
edit parameters interface of InstrumX
8. Start the test
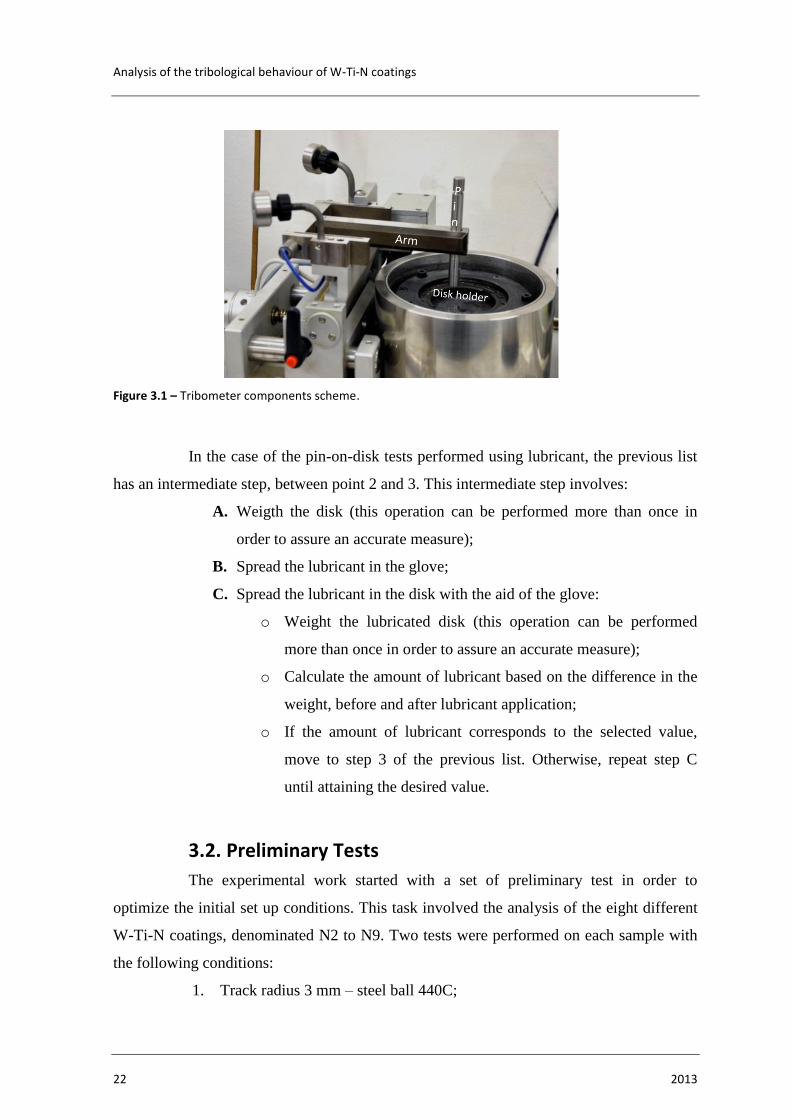
Analysis of the tribological behaviour of W-Ti-N coatings
22 2013
Figure 3.1 – Tribometer components scheme.
In the case of the pin-on-disk tests performed using lubricant, the previous list
has an intermediate step, between point 2 and 3. This intermediate step involves:
A. Weigth the disk (this operation can be performed more than once in
order to assure an accurate measure);
B. Spread the lubricant in the glove;
C. Spread the lubricant in the disk with the aid of the glove:
o Weight the lubricated disk (this operation can be performed
more than once in order to assure an accurate measure);
o Calculate the amount of lubricant based on the difference in the
weight, before and after lubricant application;
o If the amount of lubricant corresponds to the selected value,
move to step 3 of the previous list. Otherwise, repeat step C
until attaining the desired value.
3.2. Preliminary Tests
The experimental work started with a set of preliminary test in order to
optimize the initial set up conditions. This task involved the analysis of the eight different
W-Ti-N coatings, denominated N2 to N9. Two tests were performed on each sample with
the following conditions:
1. Track radius 3 mm – steel ball 440C;
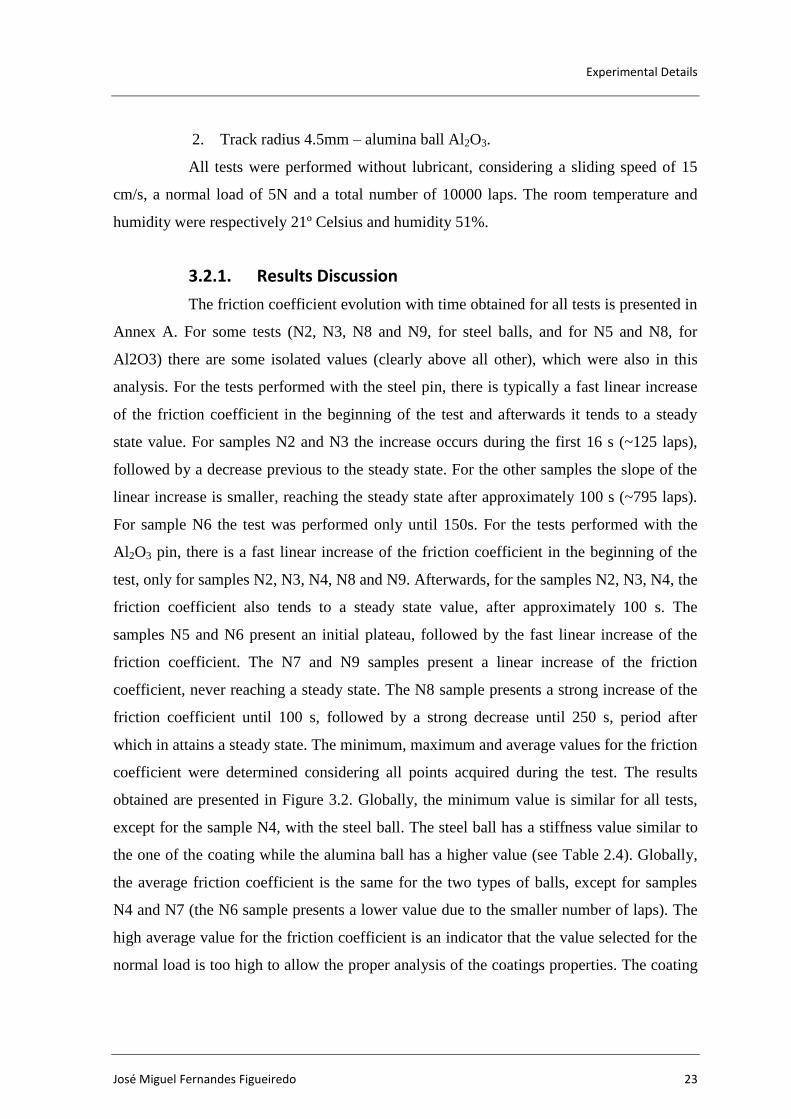
Experimental Details
José Miguel Fernandes Figueiredo 23
2. Track radius 4.5mm – alumina ball Al2O3.
All tests were performed without lubricant, considering a sliding speed of 15
cm/s, a normal load of 5N and a total number of 10000 laps. The room temperature and
humidity were respectively 21º Celsius and humidity 51%.
3.2.1. Results Discussion
The friction coefficient evolution with time obtained for all tests is presented in
Annex A. For some tests (N2, N3, N8 and N9, for steel balls, and for N5 and N8, for
Al2O3) there are some isolated values (clearly above all other), which were also in this
analysis. For the tests performed with the steel pin, there is typically a fast linear increase
of the friction coefficient in the beginning of the test and afterwards it tends to a steady
state value. For samples N2 and N3 the increase occurs during the first 16 s (~125 laps),
followed by a decrease previous to the steady state. For the other samples the slope of the
linear increase is smaller, reaching the steady state after approximately 100 s (~795 laps).
For sample N6 the test was performed only until 150s. For the tests performed with the
Al2O3 pin, there is a fast linear increase of the friction coefficient in the beginning of the
test, only for samples N2, N3, N4, N8 and N9. Afterwards, for the samples N2, N3, N4, the
friction coefficient also tends to a steady state value, after approximately 100 s. The
samples N5 and N6 present an initial plateau, followed by the fast linear increase of the
friction coefficient. The N7 and N9 samples present a linear increase of the friction
coefficient, never reaching a steady state. The N8 sample presents a strong increase of the
friction coefficient until 100 s, followed by a strong decrease until 250 s, period after
which in attains a steady state. The minimum, maximum and average values for the friction
coefficient were determined considering all points acquired during the test. The results
obtained are presented in Figure 3.2. Globally, the minimum value is similar for all tests,
except for the sample N4, with the steel ball. The steel ball has a stiffness value similar to
the one of the coating while the alumina ball has a higher value (see Table 2.4). Globally,
the average friction coefficient is the same for the two types of balls, except for samples
N4 and N7 (the N6 sample presents a lower value due to the smaller number of laps). The
high average value for the friction coefficient is an indicator that the value selected for the
normal load is too high to allow the proper analysis of the coatings properties. The coating
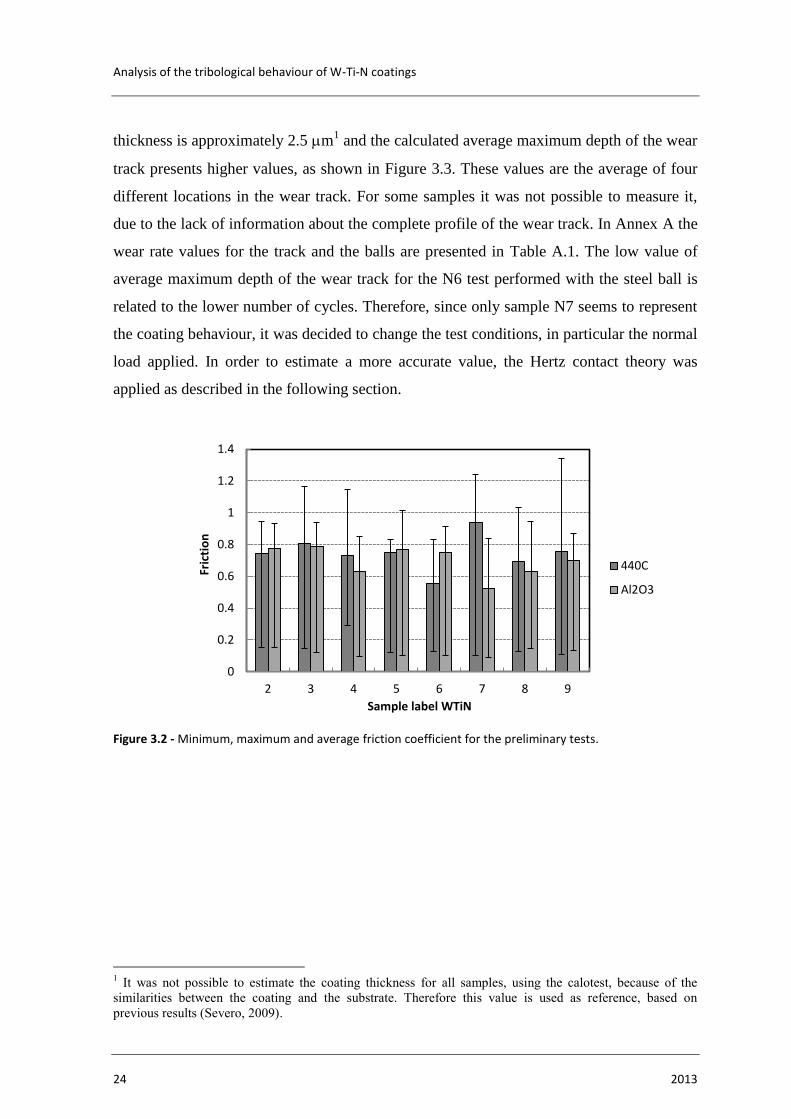
Analysis of the tribological behaviour of W-Ti-N coatings
24 2013
thickness is approximately 2.5 m1 and the calculated average maximum depth of the wear
track presents higher values, as shown in Figure 3.3. These values are the average of four
different locations in the wear track. For some samples it was not possible to measure it,
due to the lack of information about the complete profile of the wear track. In Annex A the
wear rate values for the track and the balls are presented in Table A.1. The low value of
average maximum depth of the wear track for the N6 test performed with the steel ball is
related to the lower number of cycles. Therefore, since only sample N7 seems to represent
the coating behaviour, it was decided to change the test conditions, in particular the normal
load applied. In order to estimate a more accurate value, the Hertz contact theory was
applied as described in the following section.
Figure 3.2 - Minimum, maximum and average friction coefficient for the preliminary tests.
1 It was not possible to estimate the coating thickness for all samples, using the calotest, because of the
similarities between the coating and the substrate. Therefore this value is used as reference, based on
previous results (Severo, 2009).
0
0.2
0.4
0.6
0.8
1
1.2
1.4
2 3 4 5 6 7 8 9
Fric
tio
n
Sample label WTiN
440C
Al2O3
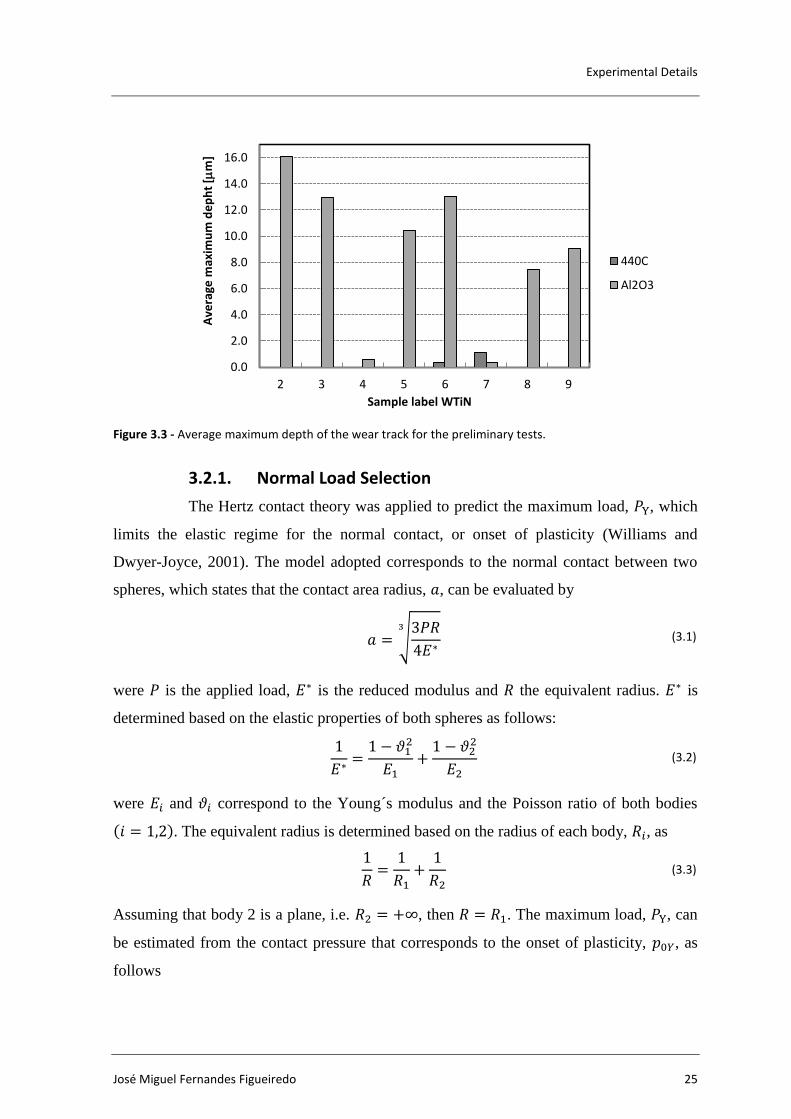
Experimental Details
José Miguel Fernandes Figueiredo 25
Figure 3.3 - Average maximum depth of the wear track for the preliminary tests.
3.2.1. Normal Load Selection
The Hertz contact theory was applied to predict the maximum load, , which
limits the elastic regime for the normal contact, or onset of plasticity (Williams and
Dwyer-Joyce, 2001). The model adopted corresponds to the normal contact between two
spheres, which states that the contact area radius, , can be evaluated by
√
(3.1)
were is the applied load, is the reduced modulus and the equivalent radius. is
determined based on the elastic properties of both spheres as follows:
(3.2)
were and correspond to the Young´s modulus and the Poisson ratio of both bodies
( ). The equivalent radius is determined based on the radius of each body, , as
(3.3)
Assuming that body 2 is a plane, i.e. , then . The maximum load, , can
be estimated from the contact pressure that corresponds to the onset of plasticity, , as
follows
0.0
2.0
4.0
6.0
8.0
10.0
12.0
14.0
16.0
2 3 4 5 6 7 8 9
Ave
rage
max
imu
m d
ep
ht
[m
]
Sample label WTiN
440C
Al2O3
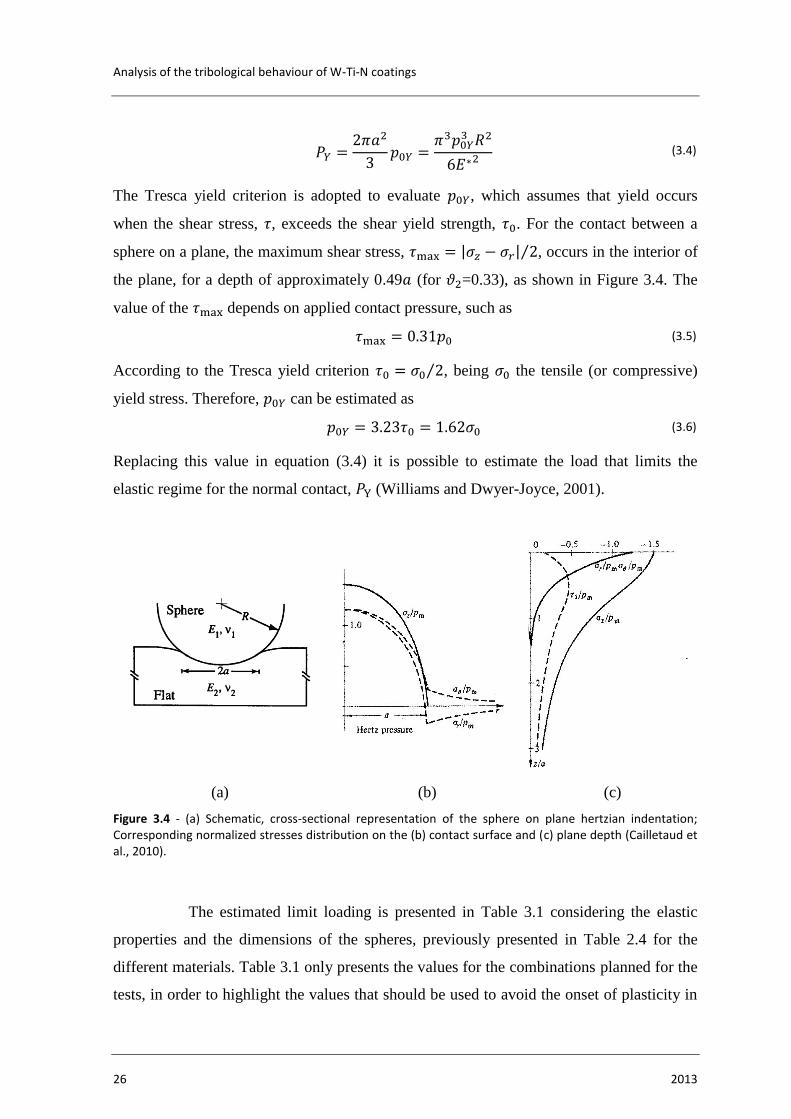
Analysis of the tribological behaviour of W-Ti-N coatings
26 2013
(3.4)
The Tresca yield criterion is adopted to evaluate , which assumes that yield occurs
when the shear stress, , exceeds the shear yield strength, . For the contact between a
sphere on a plane, the maximum shear stress, | | ⁄ , occurs in the interior of
the plane, for a depth of approximately 0.49 (for =0.33), as shown in Figure 3.4. The
value of the depends on applied contact pressure, such as
(3.5)
According to the Tresca yield criterion ⁄ , being the tensile (or compressive)
yield stress. Therefore, can be estimated as
(3.6)
Replacing this value in equation (3.4) it is possible to estimate the load that limits the
elastic regime for the normal contact, (Williams and Dwyer-Joyce, 2001).
(a) (b) (c)
Figure 3.4 - (a) Schematic, cross-sectional representation of the sphere on plane hertzian indentation; Corresponding normalized stresses distribution on the (b) contact surface and (c) plane depth (Cailletaud et al., 2010).
The estimated limit loading is presented in Table 3.1 considering the elastic
properties and the dimensions of the spheres, previously presented in Table 2.4 for the
different materials. Table 3.1 only presents the values for the combinations planned for the
tests, in order to highlight the values that should be used to avoid the onset of plasticity in
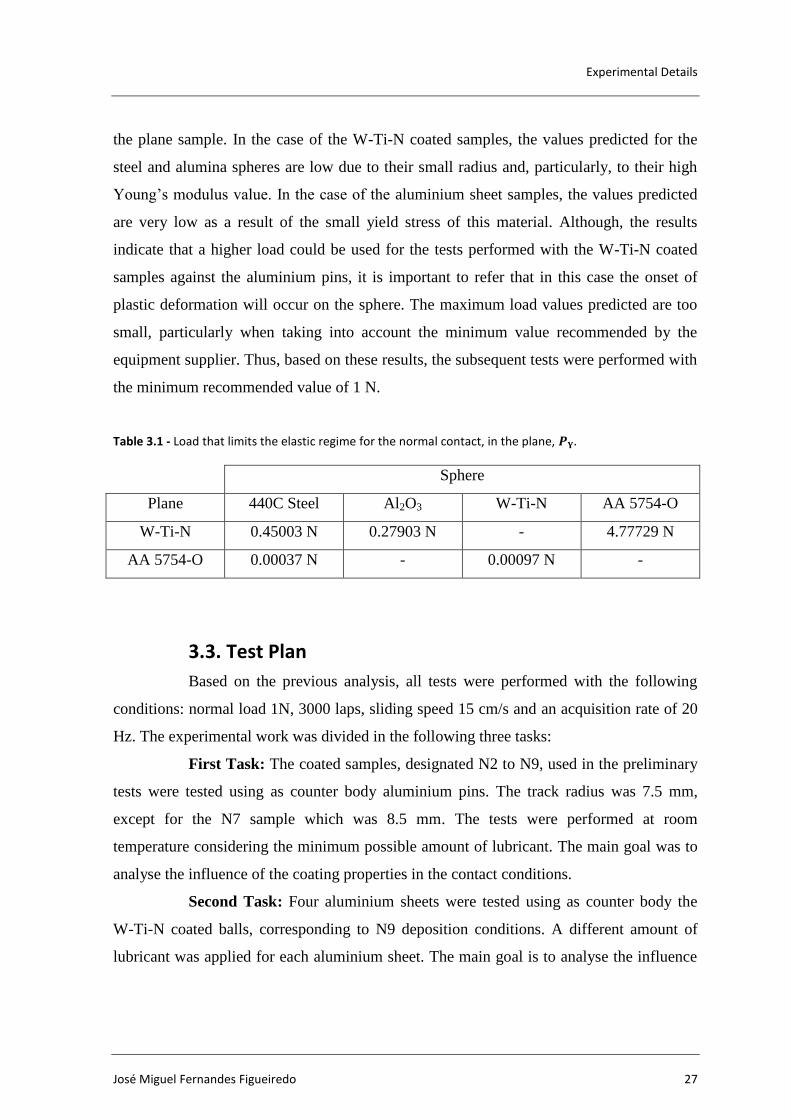
Experimental Details
José Miguel Fernandes Figueiredo 27
the plane sample. In the case of the W-Ti-N coated samples, the values predicted for the
steel and alumina spheres are low due to their small radius and, particularly, to their high
Young’s modulus value. In the case of the aluminium sheet samples, the values predicted
are very low as a result of the small yield stress of this material. Although, the results
indicate that a higher load could be used for the tests performed with the W-Ti-N coated
samples against the aluminium pins, it is important to refer that in this case the onset of
plastic deformation will occur on the sphere. The maximum load values predicted are too
small, particularly when taking into account the minimum value recommended by the
equipment supplier. Thus, based on these results, the subsequent tests were performed with
the minimum recommended value of 1 N.
Table 3.1 - Load that limits the elastic regime for the normal contact, in the plane,
Sphere
Plane 440C Steel Al2O3 W-Ti-N AA 5754-O
W-Ti-N 0.45003 N 0.27903 N - 4.77729 N
AA 5754-O 0.00037 N - 0.00097 N -
3.3. Test Plan
Based on the previous analysis, all tests were performed with the following
conditions: normal load 1N, 3000 laps, sliding speed 15 cm/s and an acquisition rate of 20
Hz. The experimental work was divided in the following three tasks:
First Task: The coated samples, designated N2 to N9, used in the preliminary
tests were tested using as counter body aluminium pins. The track radius was 7.5 mm,
except for the N7 sample which was 8.5 mm. The tests were performed at room
temperature considering the minimum possible amount of lubricant. The main goal was to
analyse the influence of the coating properties in the contact conditions.
Second Task: Four aluminium sheets were tested using as counter body the
W-Ti-N coated balls, corresponding to N9 deposition conditions. A different amount of
lubricant was applied for each aluminium sheet. The main goal is to analyse the influence
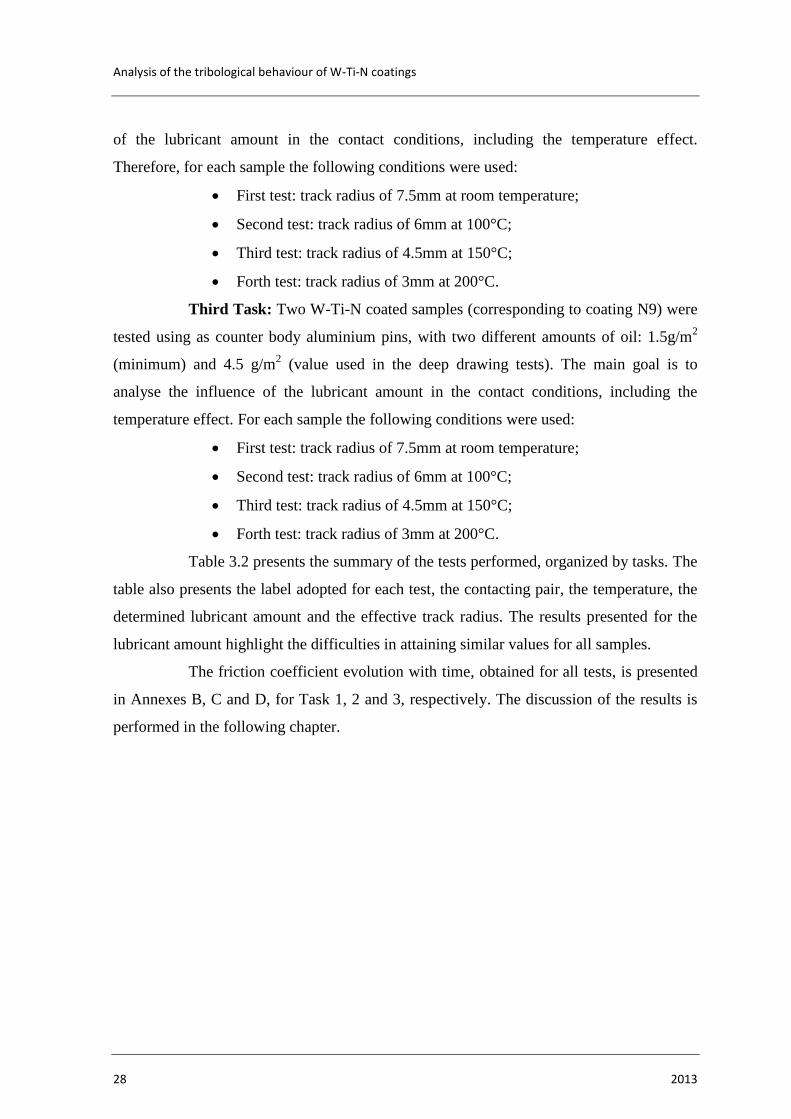
Analysis of the tribological behaviour of W-Ti-N coatings
28 2013
of the lubricant amount in the contact conditions, including the temperature effect.
Therefore, for each sample the following conditions were used:
First test: track radius of 7.5mm at room temperature;
Second test: track radius of 6mm at 100°C;
Third test: track radius of 4.5mm at 150°C;
Forth test: track radius of 3mm at 200°C.
Third Task: Two W-Ti-N coated samples (corresponding to coating N9) were
tested using as counter body aluminium pins, with two different amounts of oil: 1.5g/m2
(minimum) and 4.5 g/m2 (value used in the deep drawing tests). The main goal is to
analyse the influence of the lubricant amount in the contact conditions, including the
temperature effect. For each sample the following conditions were used:
First test: track radius of 7.5mm at room temperature;
Second test: track radius of 6mm at 100°C;
Third test: track radius of 4.5mm at 150°C;
Forth test: track radius of 3mm at 200°C.
Table 3.2 presents the summary of the tests performed, organized by tasks. The
table also presents the label adopted for each test, the contacting pair, the temperature, the
determined lubricant amount and the effective track radius. The results presented for the
lubricant amount highlight the difficulties in attaining similar values for all samples.
The friction coefficient evolution with time, obtained for all tests, is presented
in Annexes B, C and D, for Task 1, 2 and 3, respectively. The discussion of the results is
performed in the following chapter.
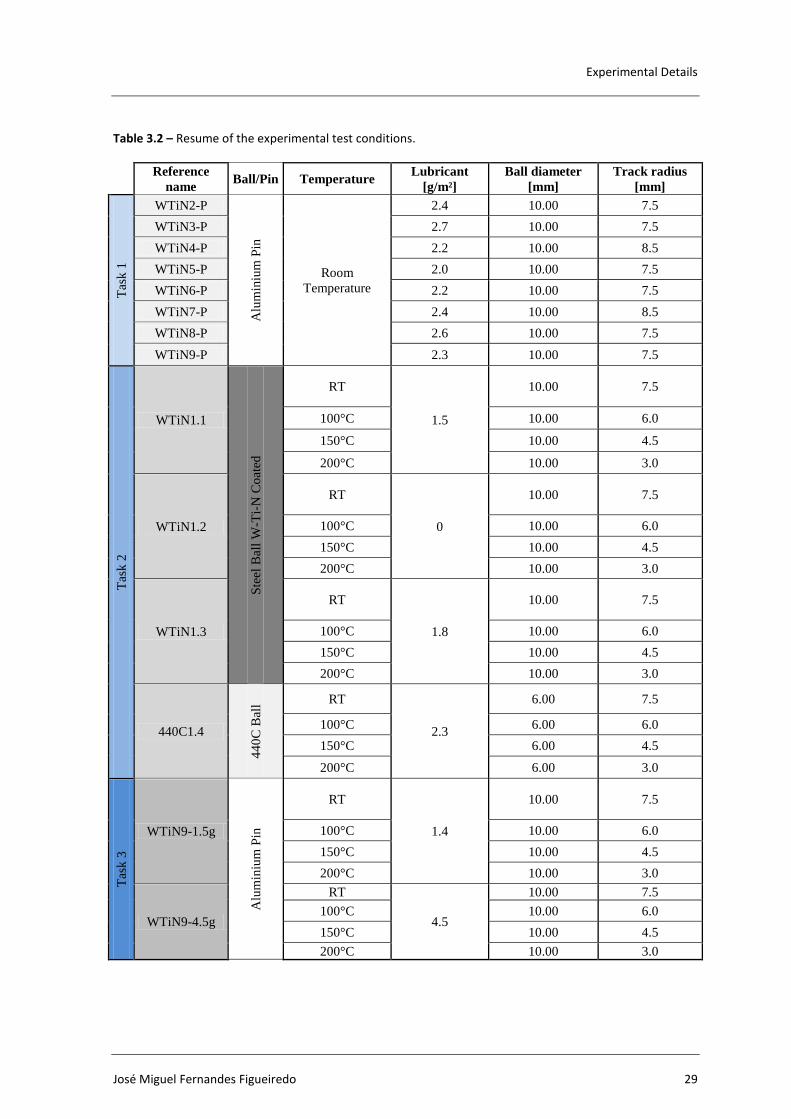
Experimental Details
José Miguel Fernandes Figueiredo 29
Table 3.2 – Resume of the experimental test conditions.
Reference
name Ball/Pin Temperature
Lubricant
[g/m²]
Ball diameter
[mm]
Track radius
[mm]
Tas
k 1
WTiN2-P
Alu
min
ium
Pin
Room
Temperature
2.4 10.00 7.5
WTiN3-P 2.7 10.00 7.5
WTiN4-P 2.2 10.00 8.5
WTiN5-P 2.0 10.00 7.5
WTiN6-P 2.2 10.00 7.5
WTiN7-P 2.4 10.00 8.5
WTiN8-P 2.6 10.00 7.5
WTiN9-P 2.3 10.00 7.5
Tas
k 2
WTiN1.1
Ste
el B
all
W-T
i-N
Co
ated
RT
1.5
10.00 7.5
100°C 10.00 6.0
150°C 10.00 4.5
200°C 10.00 3.0
WTiN1.2
RT
0
10.00 7.5
100°C 10.00 6.0
150°C 10.00 4.5
200°C 10.00 3.0
WTiN1.3
RT
1.8
10.00 7.5
100°C 10.00 6.0
150°C 10.00 4.5
200°C 10.00 3.0
440C1.4
44
0C
Bal
l RT
2.3
6.00 7.5
100°C 6.00 6.0
150°C 6.00 4.5
200°C 6.00 3.0
Tas
k 3
WTiN9-1.5g
Alu
min
ium
Pin
RT
1.4
10.00 7.5
100°C 10.00 6.0
150°C 10.00 4.5
200°C 10.00 3.0
WTiN9-4.5g
RT
4.5
10.00 7.5
100°C 10.00 6.0
150°C 10.00 4.5
200°C 10.00 3.0

Analysis of the tribological behaviour of W-Ti-N coatings
30 2013
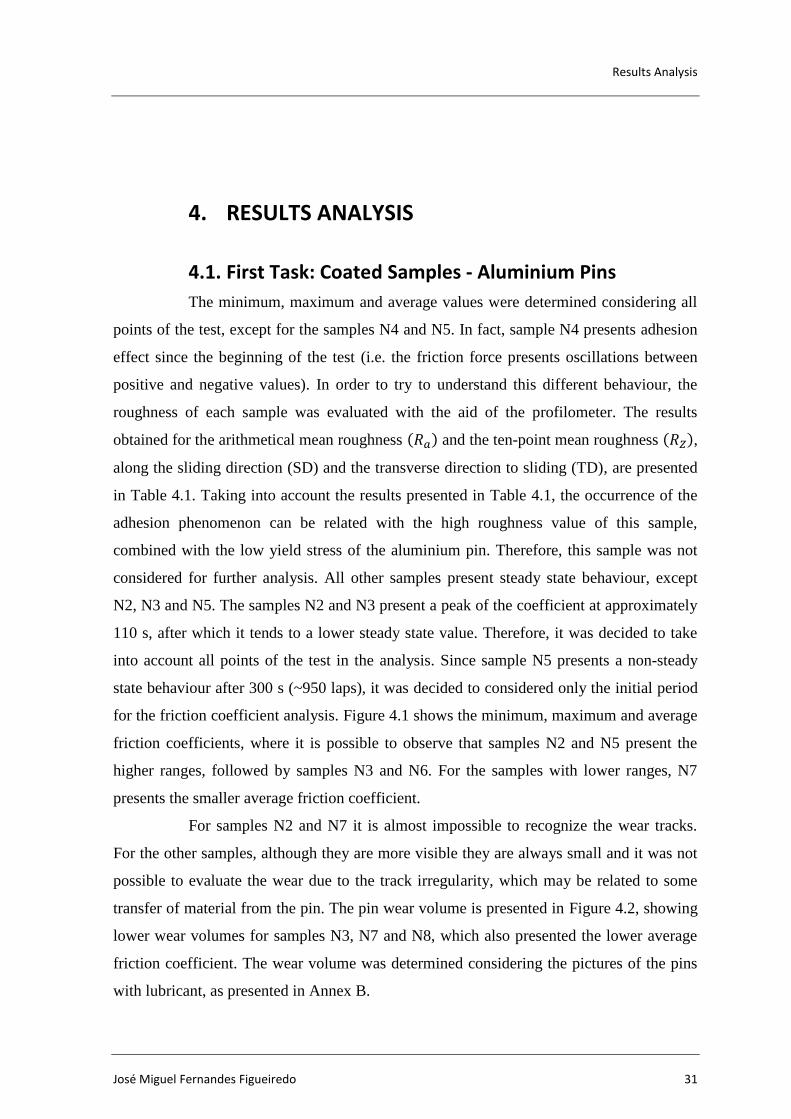
Results Analysis
José Miguel Fernandes Figueiredo 31
4. RESULTS ANALYSIS
4.1. First Task: Coated Samples - Aluminium Pins
The minimum, maximum and average values were determined considering all
points of the test, except for the samples N4 and N5. In fact, sample N4 presents adhesion
effect since the beginning of the test (i.e. the friction force presents oscillations between
positive and negative values). In order to try to understand this different behaviour, the
roughness of each sample was evaluated with the aid of the profilometer. The results
obtained for the arithmetical mean roughness ( ) and the ten-point mean roughness ( ),
along the sliding direction (SD) and the transverse direction to sliding (TD), are presented
in Table 4.1. Taking into account the results presented in Table 4.1, the occurrence of the
adhesion phenomenon can be related with the high roughness value of this sample,
combined with the low yield stress of the aluminium pin. Therefore, this sample was not
considered for further analysis. All other samples present steady state behaviour, except
N2, N3 and N5. The samples N2 and N3 present a peak of the coefficient at approximately
110 s, after which it tends to a lower steady state value. Therefore, it was decided to take
into account all points of the test in the analysis. Since sample N5 presents a non-steady
state behaviour after 300 s (~950 laps), it was decided to considered only the initial period
for the friction coefficient analysis. Figure 4.1 shows the minimum, maximum and average
friction coefficients, where it is possible to observe that samples N2 and N5 present the
higher ranges, followed by samples N3 and N6. For the samples with lower ranges, N7
presents the smaller average friction coefficient.
For samples N2 and N7 it is almost impossible to recognize the wear tracks.
For the other samples, although they are more visible they are always small and it was not
possible to evaluate the wear due to the track irregularity, which may be related to some
transfer of material from the pin. The pin wear volume is presented in Figure 4.2, showing
lower wear volumes for samples N3, N7 and N8, which also presented the lower average
friction coefficient. The wear volume was determined considering the pictures of the pins
with lubricant, as presented in Annex B.
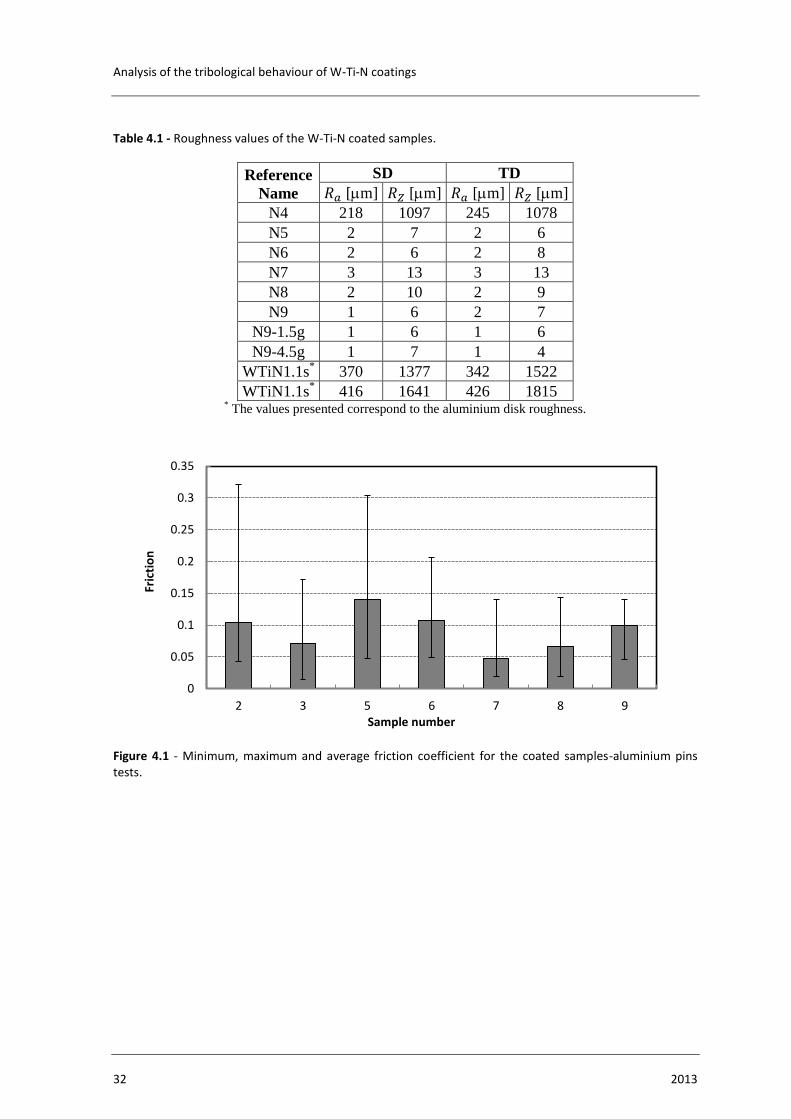
Analysis of the tribological behaviour of W-Ti-N coatings
32 2013
Table 4.1 - Roughness values of the W-Ti-N coated samples.
Reference
Name
SD TD
[m] [m] [m] [m]
N4 218 1097 245 1078
N5 2 7 2 6
N6 2 6 2 8
N7 3 13 3 13
N8 2 10 2 9
N9 1 6 2 7
N9-1.5g 1 6 1 6
N9-4.5g 1 7 1 4
WTiN1.1s* 370 1377 342 1522
WTiN1.1s* 416 1641 426 1815
* The values presented correspond to the aluminium disk roughness.
Figure 4.1 - Minimum, maximum and average friction coefficient for the coated samples-aluminium pins tests.
0
0.05
0.1
0.15
0.2
0.25
0.3
0.35
2 3 5 6 7 8 9
Fric
tio
n
Sample number
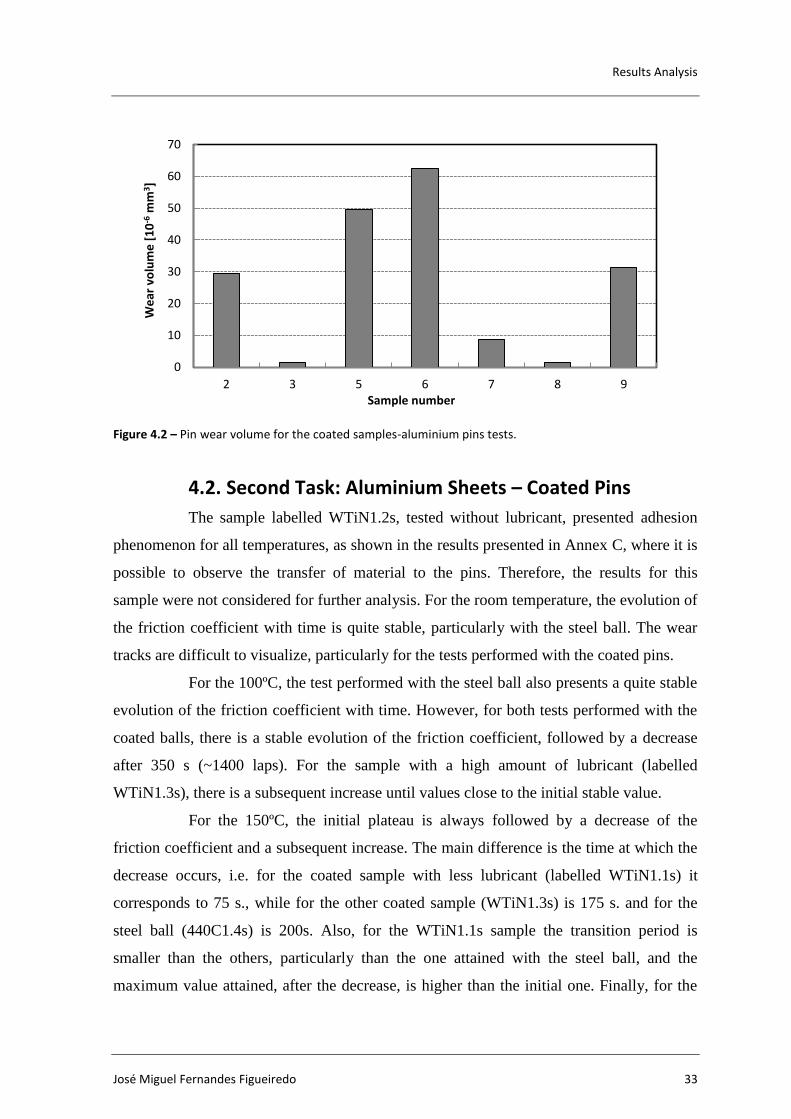
Results Analysis
José Miguel Fernandes Figueiredo 33
Figure 4.2 – Pin wear volume for the coated samples-aluminium pins tests.
4.2. Second Task: Aluminium Sheets – Coated Pins
The sample labelled WTiN1.2s, tested without lubricant, presented adhesion
phenomenon for all temperatures, as shown in the results presented in Annex C, where it is
possible to observe the transfer of material to the pins. Therefore, the results for this
sample were not considered for further analysis. For the room temperature, the evolution of
the friction coefficient with time is quite stable, particularly with the steel ball. The wear
tracks are difficult to visualize, particularly for the tests performed with the coated pins.
For the 100ºC, the test performed with the steel ball also presents a quite stable
evolution of the friction coefficient with time. However, for both tests performed with the
coated balls, there is a stable evolution of the friction coefficient, followed by a decrease
after 350 s (~1400 laps). For the sample with a high amount of lubricant (labelled
WTiN1.3s), there is a subsequent increase until values close to the initial stable value.
For the 150ºC, the initial plateau is always followed by a decrease of the
friction coefficient and a subsequent increase. The main difference is the time at which the
decrease occurs, i.e. for the coated sample with less lubricant (labelled WTiN1.1s) it
corresponds to 75 s., while for the other coated sample (WTiN1.3s) is 175 s. and for the
steel ball (440C1.4s) is 200s. Also, for the WTiN1.1s sample the transition period is
smaller than the others, particularly than the one attained with the steel ball, and the
maximum value attained, after the decrease, is higher than the initial one. Finally, for the
0
10
20
30
40
50
60
70
2 3 5 6 7 8 9
We
ar v
olu
me
[1
0-6
mm
3 ]
Sample number
Analysis of the tribological behaviour of W-Ti-N coatings
34 2013
200ºC, there is an initial decrease of the friction coefficient until approximately 20 s.
followed by a stable increase until 50s. After this, the friction coefficient strongly increases
and the adhesion phenomenon occurs.
The decrease of the friction coefficient observed for all samples, with the
increase of temperature, can be related with the alteration of the lubricant characteristics,
mainly its viscosity. Although, it was not possible to have access to more information
about the lubricant, since it is a lubricant for high temperatures it is assumed that it is
mainly constituted by long carbon chains, which are known to be less volatile with
temperature than the shorter ones. This type of lubricants typically present higher viscosity
values than the ones with shorter carbon chains. The tests were all performed considering a
low load and a high velocity. According to the typical Stribeck curve, presented in Figure
4.3, these conditions can be associated with the hydrodynamic lubrication regime, for
which the contact load is mainly supported by the lubricant film. This is in accordance with
the low wear observed for both the track and the pin for the room temperature results. With
the increase of the temperature, the long carbon chains can break, dealing to shorter chains,
which can be related with a viscosity decrease. Thus, according to the Stribeck curve, the
decrease of the viscosity can lead to a decrease of the friction coefficient. However, the
shorter carbon chains are more likely to evaporate, leading to the subsequent increase of
the friction coefficient. In fact, as shown in Annex C, for 100ºC, the sample 440C1.4s
presents a steady state friction coefficient and the pin clearly shows the presence of
lubricant in the contact area. For the sample WTiN1.1s it is also visible the presence of
lubricant in the pin, while for the WTiN1.3s there is already some transfer of material to
the pin, although the lubricant is still visible.
Despite the effort to try to guarantee similar lubricant amounts, the sample
WTiN1.1s has the smallest amount (1.5g/m2), followed by the sample WTiN1.3s (1.8g/m
2)
and, finally, by the sample 440C1.4s (2.3g/m2). The results indicate that the small increase
of the lubricant amount lead to the decrease of the friction coefficient for a higher number
of laps. Also the transition from a decrease to an increase of the friction coefficient is
smoother for slightly higher lubricant amounts. However, for the 100ºC, the sample
WTiN1.3s seems to contradict this global behaviour. Nonetheless, the initial friction
coefficient value is higher (~0.16) than in the WTiN1.1s sample (~0.13). The higher
friction coefficient can increase the frictional heat generation and, consequently, the
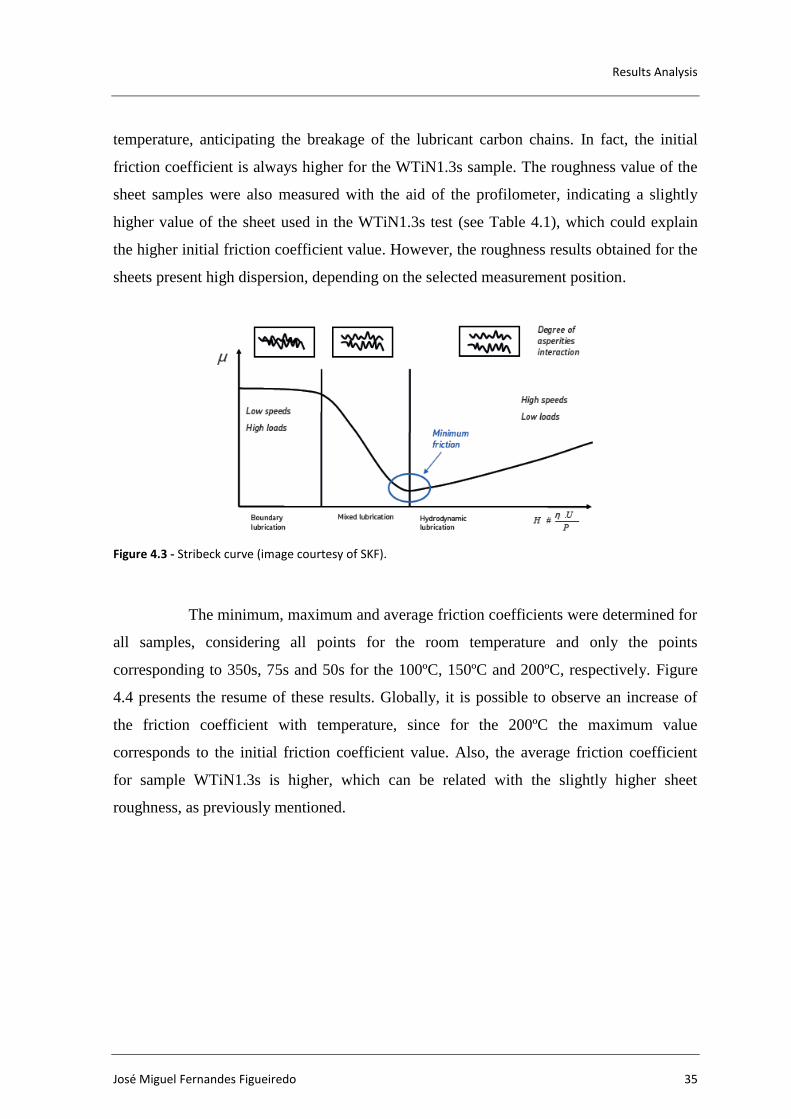
Results Analysis
José Miguel Fernandes Figueiredo 35
temperature, anticipating the breakage of the lubricant carbon chains. In fact, the initial
friction coefficient is always higher for the WTiN1.3s sample. The roughness value of the
sheet samples were also measured with the aid of the profilometer, indicating a slightly
higher value of the sheet used in the WTiN1.3s test (see Table 4.1), which could explain
the higher initial friction coefficient value. However, the roughness results obtained for the
sheets present high dispersion, depending on the selected measurement position.
Figure 4.3 - Stribeck curve (image courtesy of SKF).
The minimum, maximum and average friction coefficients were determined for
all samples, considering all points for the room temperature and only the points
corresponding to 350s, 75s and 50s for the 100ºC, 150ºC and 200ºC, respectively. Figure
4.4 presents the resume of these results. Globally, it is possible to observe an increase of
the friction coefficient with temperature, since for the 200ºC the maximum value
corresponds to the initial friction coefficient value. Also, the average friction coefficient
for sample WTiN1.3s is higher, which can be related with the slightly higher sheet
roughness, as previously mentioned.
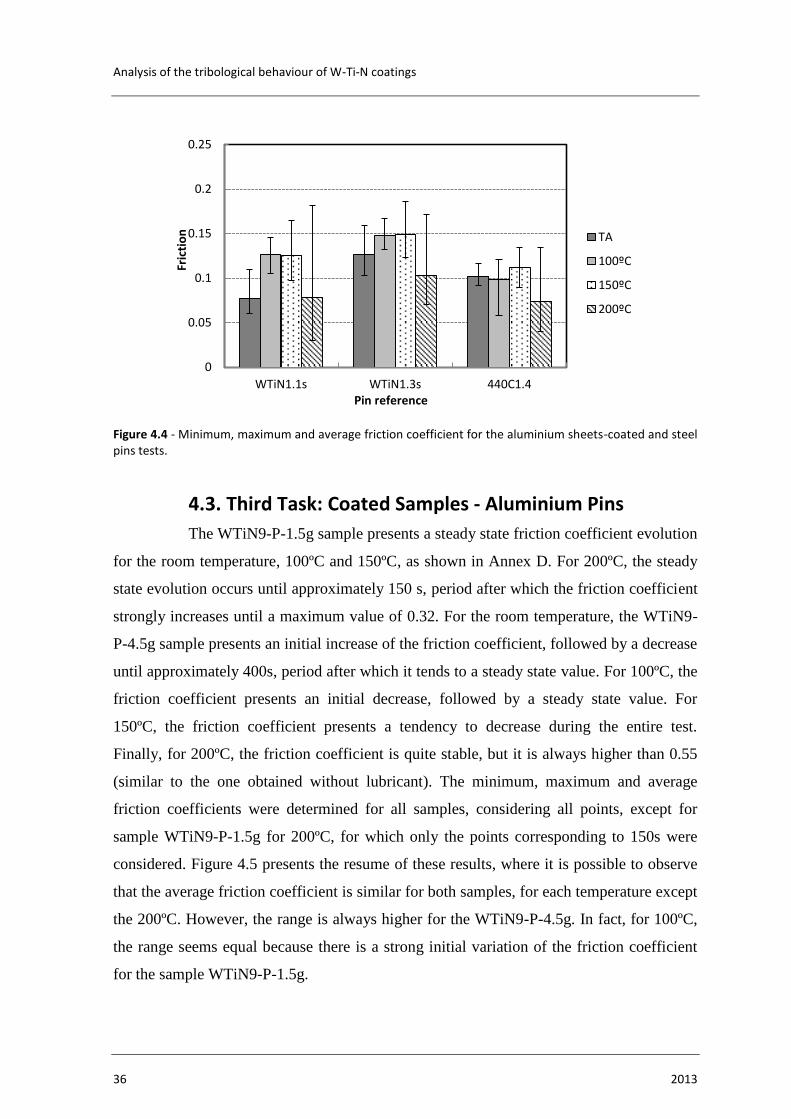
Analysis of the tribological behaviour of W-Ti-N coatings
36 2013
Figure 4.4 - Minimum, maximum and average friction coefficient for the aluminium sheets-coated and steel pins tests.
4.3. Third Task: Coated Samples - Aluminium Pins
The WTiN9-P-1.5g sample presents a steady state friction coefficient evolution
for the room temperature, 100ºC and 150ºC, as shown in Annex D. For 200ºC, the steady
state evolution occurs until approximately 150 s, period after which the friction coefficient
strongly increases until a maximum value of 0.32. For the room temperature, the WTiN9-
P-4.5g sample presents an initial increase of the friction coefficient, followed by a decrease
until approximately 400s, period after which it tends to a steady state value. For 100ºC, the
friction coefficient presents an initial decrease, followed by a steady state value. For
150ºC, the friction coefficient presents a tendency to decrease during the entire test.
Finally, for 200ºC, the friction coefficient is quite stable, but it is always higher than 0.55
(similar to the one obtained without lubricant). The minimum, maximum and average
friction coefficients were determined for all samples, considering all points, except for
sample WTiN9-P-1.5g for 200ºC, for which only the points corresponding to 150s were
considered. Figure 4.5 presents the resume of these results, where it is possible to observe
that the average friction coefficient is similar for both samples, for each temperature except
the 200ºC. However, the range is always higher for the WTiN9-P-4.5g. In fact, for 100ºC,
the range seems equal because there is a strong initial variation of the friction coefficient
for the sample WTiN9-P-1.5g.
0
0.05
0.1
0.15
0.2
0.25
WTiN1.1s WTiN1.3s 440C1.4
Fric
tio
n
Pin reference
TA
100ºC
150ºC
200ºC
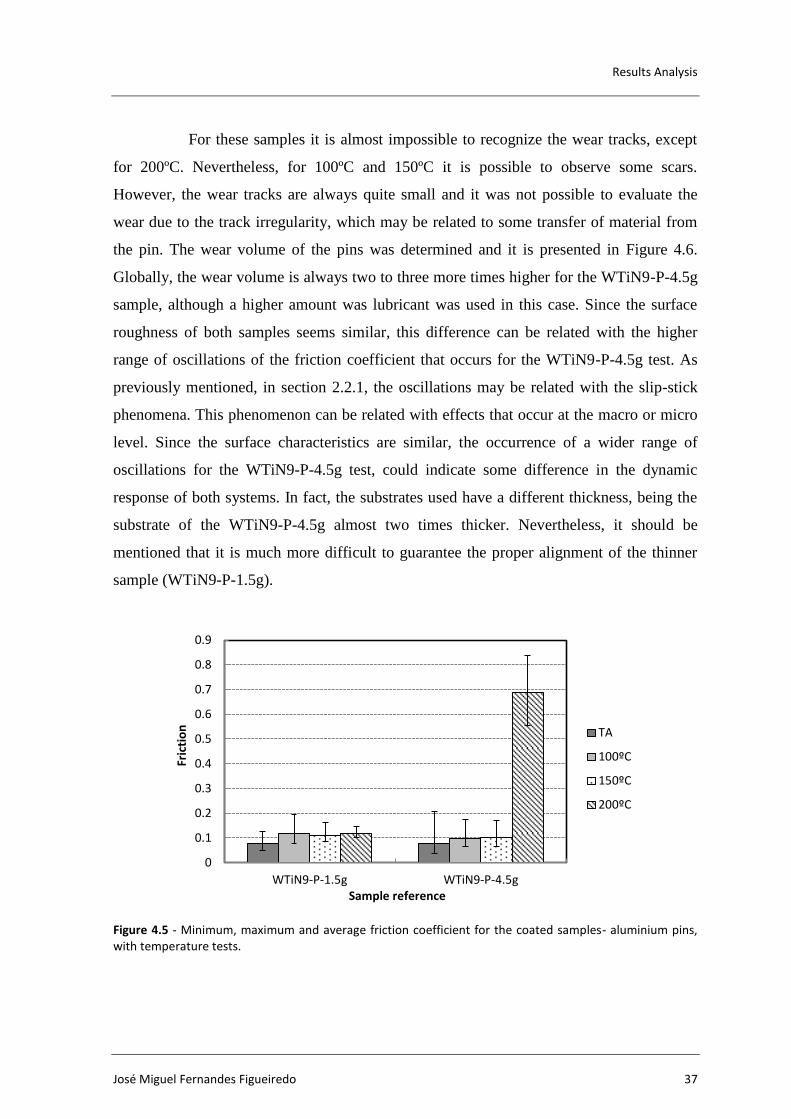
Results Analysis
José Miguel Fernandes Figueiredo 37
For these samples it is almost impossible to recognize the wear tracks, except
for 200ºC. Nevertheless, for 100ºC and 150ºC it is possible to observe some scars.
However, the wear tracks are always quite small and it was not possible to evaluate the
wear due to the track irregularity, which may be related to some transfer of material from
the pin. The wear volume of the pins was determined and it is presented in Figure 4.6.
Globally, the wear volume is always two to three more times higher for the WTiN9-P-4.5g
sample, although a higher amount was lubricant was used in this case. Since the surface
roughness of both samples seems similar, this difference can be related with the higher
range of oscillations of the friction coefficient that occurs for the WTiN9-P-4.5g test. As
previously mentioned, in section 2.2.1, the oscillations may be related with the slip-stick
phenomena. This phenomenon can be related with effects that occur at the macro or micro
level. Since the surface characteristics are similar, the occurrence of a wider range of
oscillations for the WTiN9-P-4.5g test, could indicate some difference in the dynamic
response of both systems. In fact, the substrates used have a different thickness, being the
substrate of the WTiN9-P-4.5g almost two times thicker. Nevertheless, it should be
mentioned that it is much more difficult to guarantee the proper alignment of the thinner
sample (WTiN9-P-1.5g).
Figure 4.5 - Minimum, maximum and average friction coefficient for the coated samples- aluminium pins, with temperature tests.
0
0.1
0.2
0.3
0.4
0.5
0.6
0.7
0.8
0.9
WTiN9-P-1.5g WTiN9-P-4.5g
Fric
tio
n
Sample reference
TA
100ºC
150ºC
200ºC
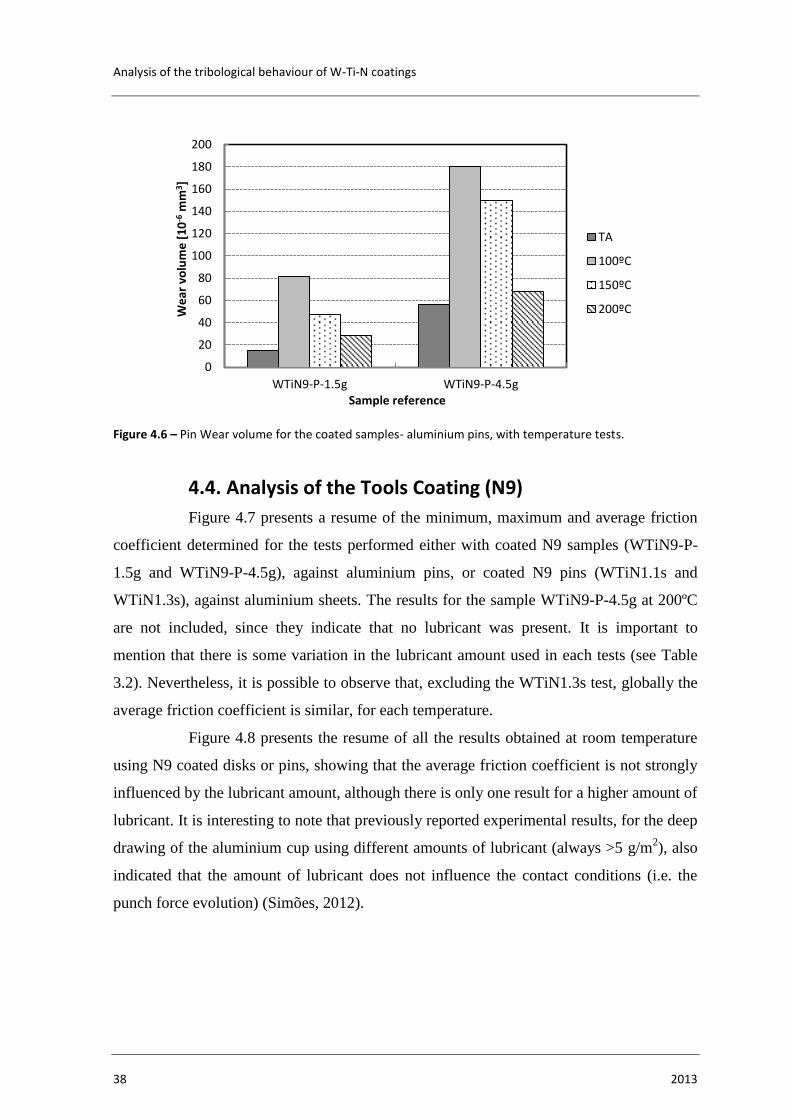
Analysis of the tribological behaviour of W-Ti-N coatings
38 2013
Figure 4.6 – Pin Wear volume for the coated samples- aluminium pins, with temperature tests.
4.4. Analysis of the Tools Coating (N9)
Figure 4.7 presents a resume of the minimum, maximum and average friction
coefficient determined for the tests performed either with coated N9 samples (WTiN9-P-
1.5g and WTiN9-P-4.5g), against aluminium pins, or coated N9 pins (WTiN1.1s and
WTiN1.3s), against aluminium sheets. The results for the sample WTiN9-P-4.5g at 200ºC
are not included, since they indicate that no lubricant was present. It is important to
mention that there is some variation in the lubricant amount used in each tests (see Table
3.2). Nevertheless, it is possible to observe that, excluding the WTiN1.3s test, globally the
average friction coefficient is similar, for each temperature.
Figure 4.8 presents the resume of all the results obtained at room temperature
using N9 coated disks or pins, showing that the average friction coefficient is not strongly
influenced by the lubricant amount, although there is only one result for a higher amount of
lubricant. It is interesting to note that previously reported experimental results, for the deep
drawing of the aluminium cup using different amounts of lubricant (always >5 g/m2), also
indicated that the amount of lubricant does not influence the contact conditions (i.e. the
punch force evolution) (Simões, 2012).
0
20
40
60
80
100
120
140
160
180
200
WTiN9-P-1.5g WTiN9-P-4.5g
We
ar v
olu
me
[1
0-6
mm
3 ]
Sample reference
TA
100ºC
150ºC
200ºC
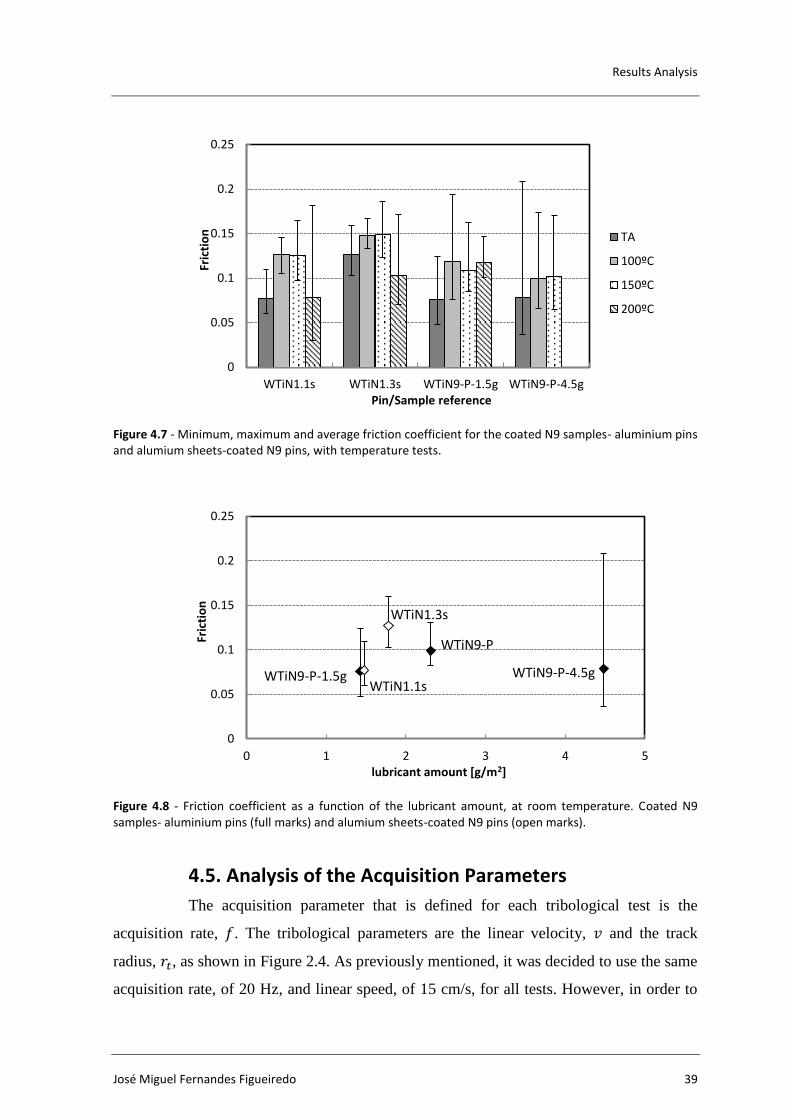
Results Analysis
José Miguel Fernandes Figueiredo 39
Figure 4.7 - Minimum, maximum and average friction coefficient for the coated N9 samples- aluminium pins and alumium sheets-coated N9 pins, with temperature tests.
Figure 4.8 - Friction coefficient as a function of the lubricant amount, at room temperature. Coated N9 samples- aluminium pins (full marks) and alumium sheets-coated N9 pins (open marks).
4.5. Analysis of the Acquisition Parameters
The acquisition parameter that is defined for each tribological test is the
acquisition rate, . The tribological parameters are the linear velocity, and the track
radius, , as shown in Figure 2.4. As previously mentioned, it was decided to use the same
acquisition rate, of 20 Hz, and linear speed, of 15 cm/s, for all tests. However, in order to
0
0.05
0.1
0.15
0.2
0.25
WTiN1.1s WTiN1.3s WTiN9-P-1.5g WTiN9-P-4.5g
Fric
tio
n
Pin/Sample reference
TA
100ºC
150ºC
200ºC
0
0.05
0.1
0.15
0.2
0.25
0 1 2 3 4 5
Fric
tio
n
lubricant amount [g/m2]
WTiN9-P
WTiN9-P-4.5gWTiN9-P-1.5g
WTiN1.3s
WTiN1.1s
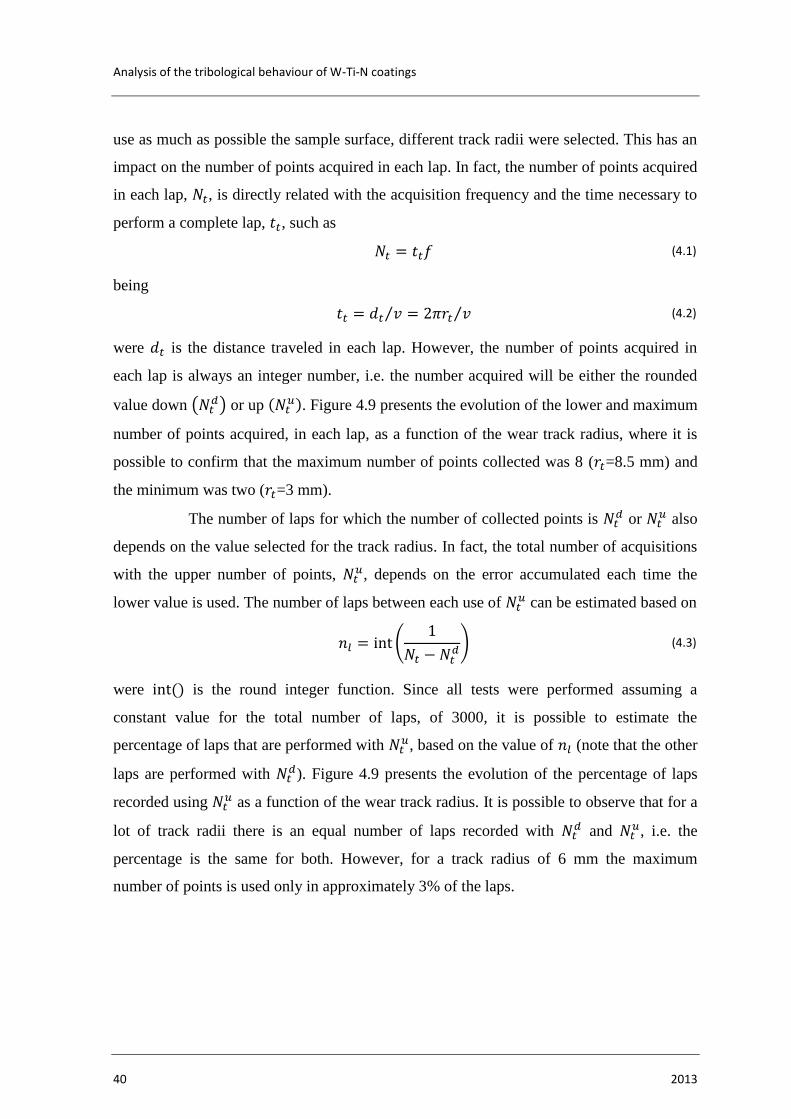
Analysis of the tribological behaviour of W-Ti-N coatings
40 2013
use as much as possible the sample surface, different track radii were selected. This has an
impact on the number of points acquired in each lap. In fact, the number of points acquired
in each lap, , is directly related with the acquisition frequency and the time necessary to
perform a complete lap, , such as
(4.1)
being
⁄⁄ (4.2)
were is the distance traveled in each lap. However, the number of points acquired in
each lap is always an integer number, i.e. the number acquired will be either the rounded
value down ( ) or up (
). Figure 4.9 presents the evolution of the lower and maximum
number of points acquired, in each lap, as a function of the wear track radius, where it is
possible to confirm that the maximum number of points collected was 8 ( =8.5 mm) and
the minimum was two ( =3 mm).
The number of laps for which the number of collected points is or
also
depends on the value selected for the track radius. In fact, the total number of acquisitions
with the upper number of points, , depends on the error accumulated each time the
lower value is used. The number of laps between each use of can be estimated based on
(
) (4.3)
were () is the round integer function. Since all tests were performed assuming a
constant value for the total number of laps, of 3000, it is possible to estimate the
percentage of laps that are performed with , based on the value of (note that the other
laps are performed with ). Figure 4.9 presents the evolution of the percentage of laps
recorded using as a function of the wear track radius. It is possible to observe that for a
lot of track radii there is an equal number of laps recorded with and
, i.e. the
percentage is the same for both. However, for a track radius of 6 mm the maximum
number of points is used only in approximately 3% of the laps.
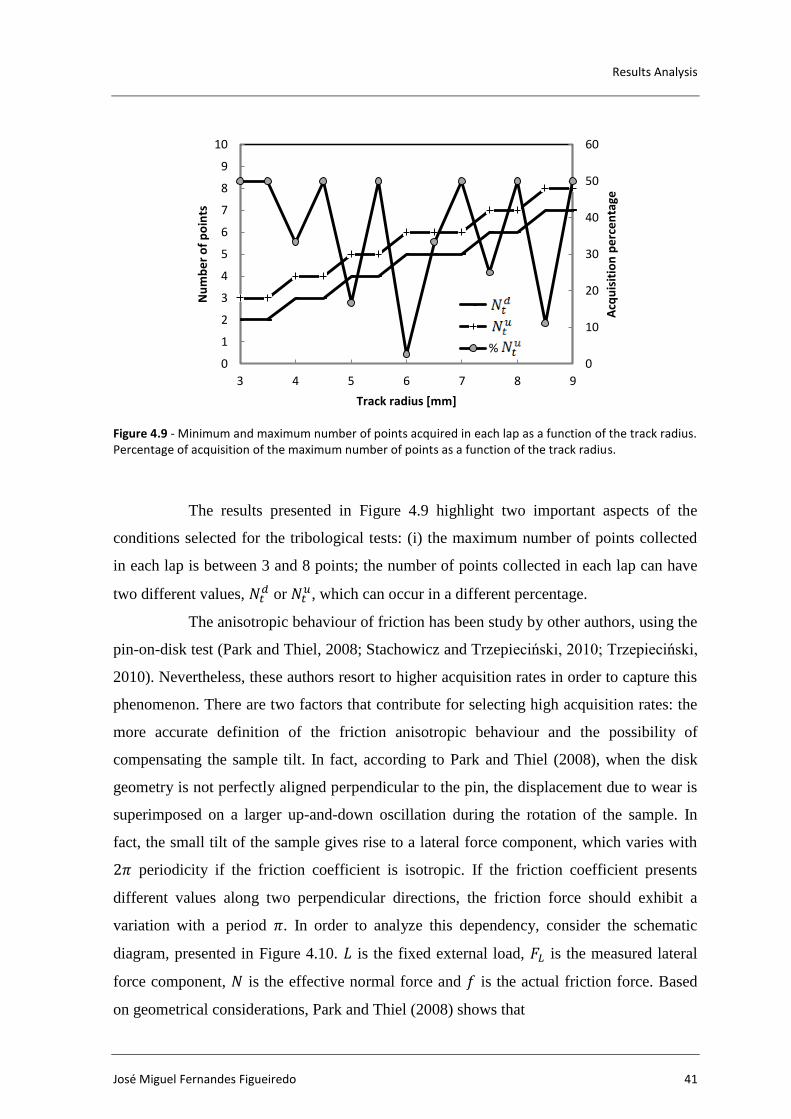
Results Analysis
José Miguel Fernandes Figueiredo 41
Figure 4.9 - Minimum and maximum number of points acquired in each lap as a function of the track radius. Percentage of acquisition of the maximum number of points as a function of the track radius.
The results presented in Figure 4.9 highlight two important aspects of the
conditions selected for the tribological tests: (i) the maximum number of points collected
in each lap is between 3 and 8 points; the number of points collected in each lap can have
two different values, or
, which can occur in a different percentage.
The anisotropic behaviour of friction has been study by other authors, using the
pin-on-disk test (Park and Thiel, 2008; Stachowicz and Trzepieciński, 2010; Trzepieciński,
2010). Nevertheless, these authors resort to higher acquisition rates in order to capture this
phenomenon. There are two factors that contribute for selecting high acquisition rates: the
more accurate definition of the friction anisotropic behaviour and the possibility of
compensating the sample tilt. In fact, according to Park and Thiel (2008), when the disk
geometry is not perfectly aligned perpendicular to the pin, the displacement due to wear is
superimposed on a larger up-and-down oscillation during the rotation of the sample. In
fact, the small tilt of the sample gives rise to a lateral force component, which varies with
periodicity if the friction coefficient is isotropic. If the friction coefficient presents
different values along two perpendicular directions, the friction force should exhibit a
variation with a period . In order to analyze this dependency, consider the schematic
diagram, presented in Figure 4.10. is the fixed external load, is the measured lateral
force component, is the effective normal force and is the actual friction force. Based
on geometrical considerations, Park and Thiel (2008) shows that
0
10
20
30
40
50
60
0
1
2
3
4
5
6
7
8
9
10
3 4 5 6 7 8 9
Track radius [mm]
Acq
uis
itio
n p
erc
en
tage
Nu
mb
er
of
po
ints
%
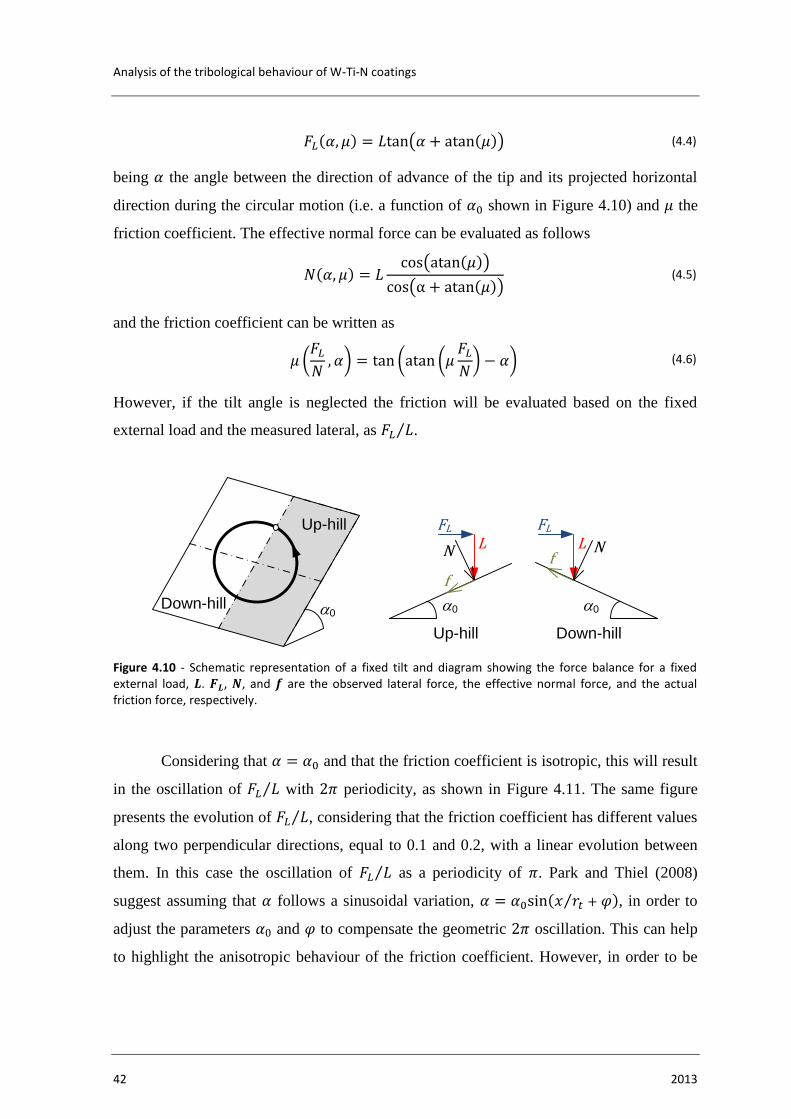
Analysis of the tribological behaviour of W-Ti-N coatings
42 2013
( ) ( ( )) (4.4)
being the angle between the direction of advance of the tip and its projected horizontal
direction during the circular motion (i.e. a function of shown in Figure 4.10) and the
friction coefficient. The effective normal force can be evaluated as follows
( ) ( ( ))
( ( )) (4.5)
and the friction coefficient can be written as
( ) ( (
) ) (4.6)
However, if the tilt angle is neglected the friction will be evaluated based on the fixed
external load and the measured lateral, as ⁄ .
Figure 4.10 - Schematic representation of a fixed tilt and diagram showing the force balance for a fixed external load, . , , and are the observed lateral force, the effective normal force, and the actual friction force, respectively.
Considering that and that the friction coefficient is isotropic, this will result
in the oscillation of ⁄ with periodicity, as shown in Figure 4.11. The same figure
presents the evolution of ⁄ , considering that the friction coefficient has different values
along two perpendicular directions, equal to 0.1 and 0.2, with a linear evolution between
them. In this case the oscillation of ⁄ as a periodicity of . Park and Thiel (2008)
suggest assuming that follows a sinusoidal variation, ( ⁄ ), in order to
adjust the parameters and to compensate the geometric oscillation. This can help
to highlight the anisotropic behaviour of the friction coefficient. However, in order to be
a0
Up-hill
Down-hill a0
LFL
N
f
a0
LFL
Nf
Up-hill Down-hill
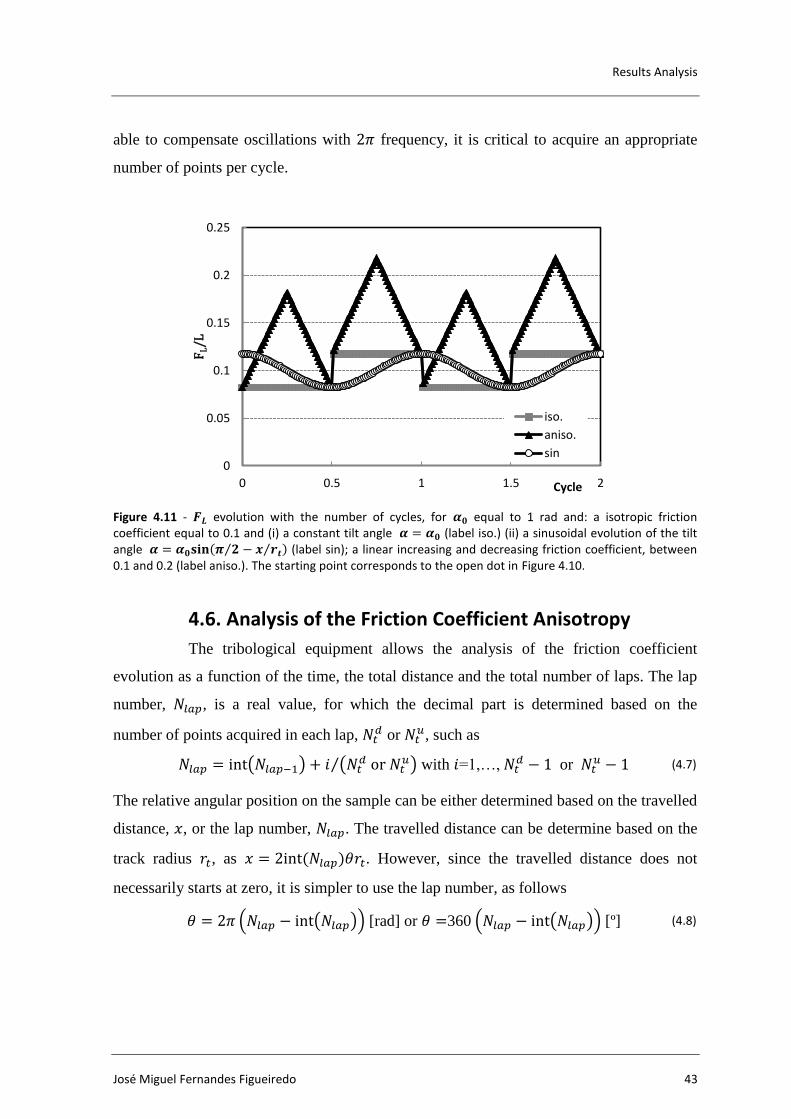
Results Analysis
José Miguel Fernandes Figueiredo 43
able to compensate oscillations with frequency, it is critical to acquire an appropriate
number of points per cycle.
Figure 4.11 - evolution with the number of cycles, for equal to 1 rad and: a isotropic friction coefficient equal to 0.1 and (i) a constant tilt angle (label iso.) (ii) a sinusoidal evolution of the tilt angle ( ⁄ ⁄ ) (label sin); a linear increasing and decreasing friction coefficient, between 0.1 and 0.2 (label aniso.). The starting point corresponds to the open dot in Figure 4.10.
4.6. Analysis of the Friction Coefficient Anisotropy
The tribological equipment allows the analysis of the friction coefficient
evolution as a function of the time, the total distance and the total number of laps. The lap
number, , is a real value, for which the decimal part is determined based on the
number of points acquired in each lap, or
, such as
( ) (
)⁄ with =1,…, or
(4.7)
The relative angular position on the sample can be either determined based on the travelled
distance, , or the lap number, . The travelled distance can be determine based on the
track radius , as ( ) . However, since the travelled distance does not
necessarily starts at zero, it is simpler to use the lap number, as follows
( ( )) [rad] or 360 ( ( )) [º] (4.8)
0
0.05
0.1
0.15
0.2
0.25
0 0.5 1 1.5 2
FL/L
Cycle
iso.
aniso.
sin
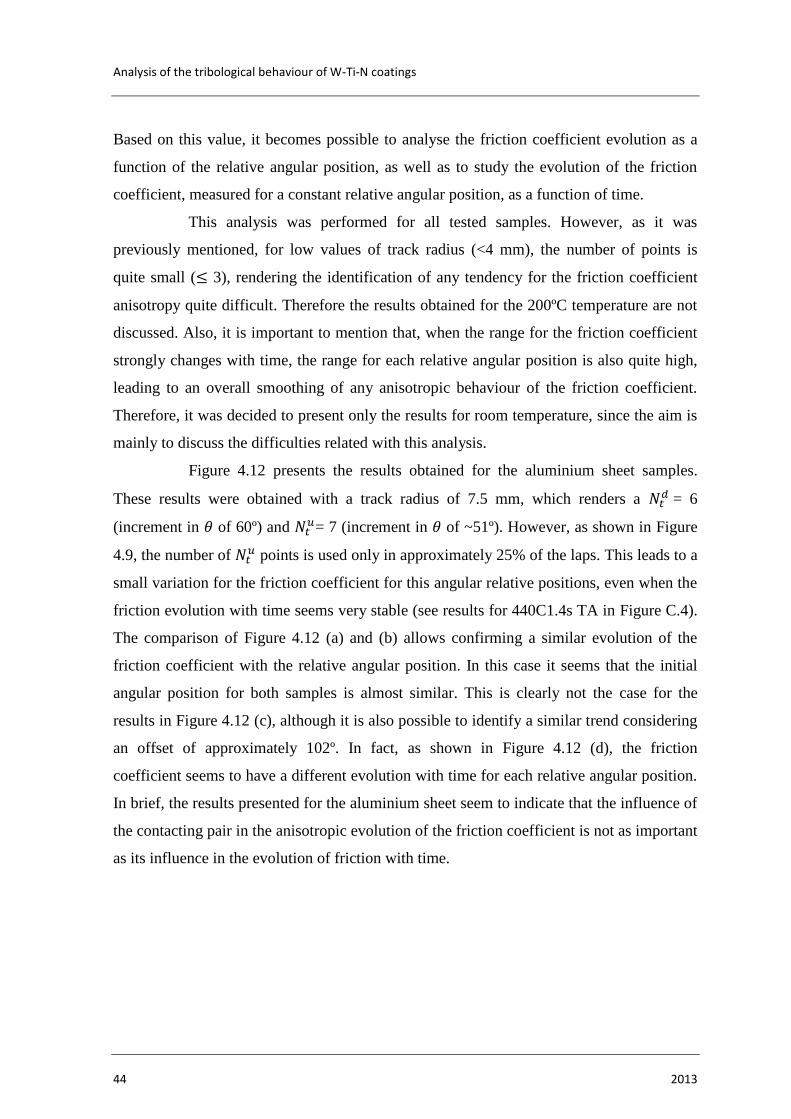
Analysis of the tribological behaviour of W-Ti-N coatings
44 2013
Based on this value, it becomes possible to analyse the friction coefficient evolution as a
function of the relative angular position, as well as to study the evolution of the friction
coefficient, measured for a constant relative angular position, as a function of time.
This analysis was performed for all tested samples. However, as it was
previously mentioned, for low values of track radius (<4 mm), the number of points is
quite small ( 3), rendering the identification of any tendency for the friction coefficient
anisotropy quite difficult. Therefore the results obtained for the 200ºC temperature are not
discussed. Also, it is important to mention that, when the range for the friction coefficient
strongly changes with time, the range for each relative angular position is also quite high,
leading to an overall smoothing of any anisotropic behaviour of the friction coefficient.
Therefore, it was decided to present only the results for room temperature, since the aim is
mainly to discuss the difficulties related with this analysis.
Figure 4.12 presents the results obtained for the aluminium sheet samples.
These results were obtained with a track radius of 7.5 mm, which renders a = 6
(increment in of 60º) and = 7 (increment in of ~51º). However, as shown in Figure
4.9, the number of points is used only in approximately 25% of the laps. This leads to a
small variation for the friction coefficient for this angular relative positions, even when the
friction evolution with time seems very stable (see results for 440C1.4s TA in Figure C.4).
The comparison of Figure 4.12 (a) and (b) allows confirming a similar evolution of the
friction coefficient with the relative angular position. In this case it seems that the initial
angular position for both samples is almost similar. This is clearly not the case for the
results in Figure 4.12 (c), although it is also possible to identify a similar trend considering
an offset of approximately 102º. In fact, as shown in Figure 4.12 (d), the friction
coefficient seems to have a different evolution with time for each relative angular position.
In brief, the results presented for the aluminium sheet seem to indicate that the influence of
the contacting pair in the anisotropic evolution of the friction coefficient is not as important
as its influence in the evolution of friction with time.
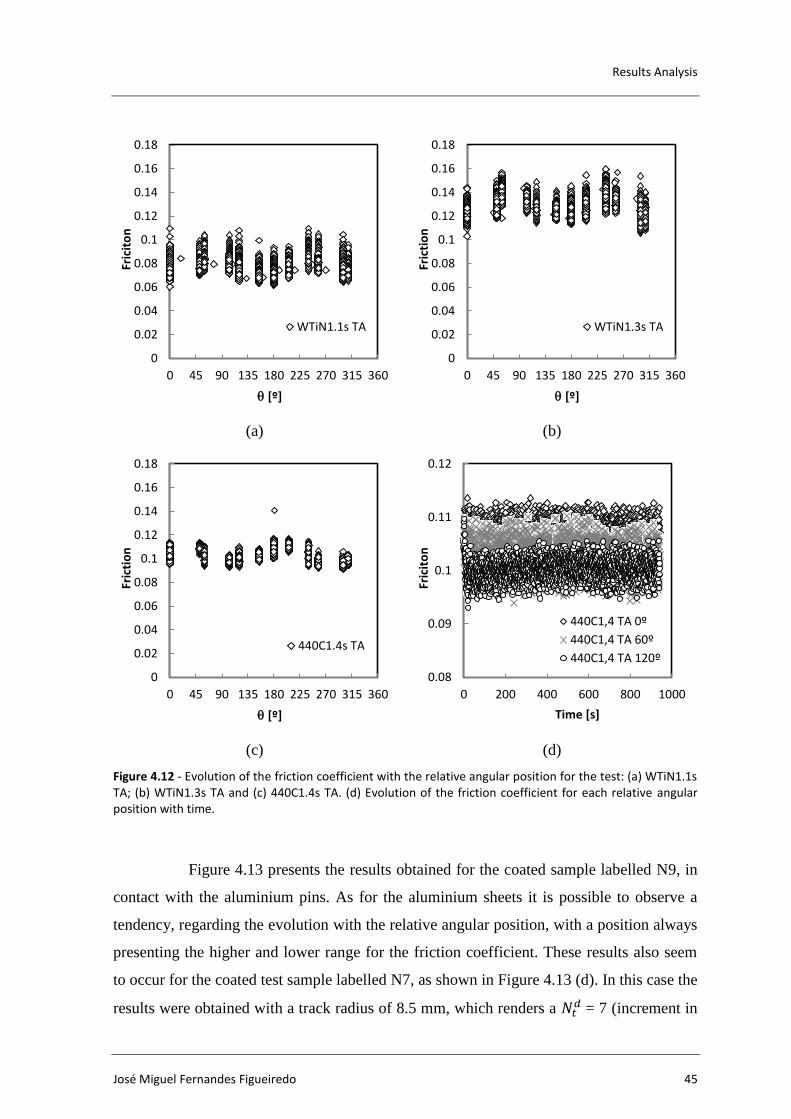
Results Analysis
José Miguel Fernandes Figueiredo 45
(a) (b)
(c) (d)
Figure 4.12 - Evolution of the friction coefficient with the relative angular position for the test: (a) WTiN1.1s TA; (b) WTiN1.3s TA and (c) 440C1.4s TA. (d) Evolution of the friction coefficient for each relative angular position with time.
Figure 4.13 presents the results obtained for the coated sample labelled N9, in
contact with the aluminium pins. As for the aluminium sheets it is possible to observe a
tendency, regarding the evolution with the relative angular position, with a position always
presenting the higher and lower range for the friction coefficient. These results also seem
to occur for the coated test sample labelled N7, as shown in Figure 4.13 (d). In this case the
results were obtained with a track radius of 8.5 mm, which renders a = 7 (increment in
0
0.02
0.04
0.06
0.08
0.1
0.12
0.14
0.16
0.18
0 45 90 135 180 225 270 315 360
Fric
ito
n
q [º]
WTiN1.1s TA
0
0.02
0.04
0.06
0.08
0.1
0.12
0.14
0.16
0.18
0 45 90 135 180 225 270 315 360
Fric
tio
n
q [º]
WTiN1.3s TA
0
0.02
0.04
0.06
0.08
0.1
0.12
0.14
0.16
0.18
0 45 90 135 180 225 270 315 360
Fric
tio
n
q [º]
440C1.4s TA
0.08
0.09
0.1
0.11
0.12
0 200 400 600 800 1000
Fric
ito
n
Time [s]
440C1,4 TA 0º
440C1,4 TA 60º
440C1,4 TA 120º
Analysis of the tribological behaviour of W-Ti-N coatings
46 2013
of ~51º) and = 8 (increment in of 45º). As shown in Figure 4.9, the number of
points is used only in approximately 11% of the laps. Nonetheless, these results are
presented to highlight the impact of a higher number of points in the trend definition.
(a) (b)
(c) (d)
Figure 4.13 - Evolution of the friction coefficient with the relative angular position for the test: (a) WTiN9-P-1.5g TA; (b) WTiN9-P-4.5g TA; (c) WTiN9-P and (d) WTiN7-P.
0
0.05
0.1
0.15
0.2
0.25
0 45 90 135 180 225 270 315 360
Fric
tio
n
q [º]
WTiN9-P-1.5g-TA
0
0.05
0.1
0.15
0.2
0.25
0 45 90 135 180 225 270 315 360
Fric
tio
n
q [º]
WTiN9-P-4.5g-TA
0
0.05
0.1
0.15
0.2
0.25
0 45 90 135 180 225 270 315 360
Fric
tio
n
q [º]
WTiN9-P
0
0.05
0.1
0.15
0.2
0.25
0 45 90 135 180 225 270 315 360
Fric
tio
n
q [º]
WTiN7-P
Conclusions, Remarks and Future Work Suggestions
José Miguel Fernandes Figueiredo 47
5. CONCLUSIONS, REMARKS AND FUTURE WORK SUGGESTIONS
The analysis of the minimum, maximum and average friction coefficients
determined for each test, allowed to draw the following conclusions:
For the tests performed with the different W-Ti-N coatings under
lubricated conditions, the samples N7, N8 and N9 presented the lower ranges for the
friction coefficients, being the smaller average friction coefficient value obtained for
sample N7. The same sample also presented a low wear volume for the pin, although better
results were obtained for sample N3 and N8.
For the tests performed with aluminium sheets against coated and steel
balls, it was observed a different evolution of the friction coefficient with time, associated
to the temperature increase. Typically, after a steady state period, there is a decrease of the
friction coefficient, which can be related with the alteration of the lubricant characteristics,
mainly its viscosity. Afterwards, the lubricant seems to gradually evaporate, resulting in an
increase of the friction coefficient. Globally, the average friction coefficient increases with
temperature.
For the tests performed with coated samples against the aluminium pins,
for different temperatures, the alteration of the lubricant characteristics was not observed.
This can be related with the fact that the aluminium sheet presents a roughness value much
higher than the W-Ti-N samples, allowing retaining a larger amount of lubricant. For these
tests it was not possible to determine the influence of the lubricant amount, since the
average friction coefficient is similar for both samples, for each temperature.
Besides these specific conclusions, the experience and knowledge acquired
during this work also constitutes and important database for allowing the improving of the
experimental procedure, results analysis and test planning of future works. The remarks for
each one of the previous topics are here listed.
Procedure:
o In order to determine the friction coefficient evolution with the
relative angular position it is necessary to resort to higher values for the acquisition rate.
Analysis of the tribological behaviour of W-Ti-N coatings
48 2013
However, the higher acquisition rates lead to another problem, related with the amount of
data. Therefore, the number of laps should be correlated with the acquisition rate, trying to
guarantee a reasonable amount of data.
o When analysing the cylindrical cup deep drawing process, the
sliding distance for a point located in the exterior blank surface will be inferior to 20 mm
(Simões, 2012). Thus, a quite low number of laps can be applied (e.g. approximately 100
laps for a track radius of 8.5 mm).
o The maximum punch velocity typically used in deep drawing
operations is approximately 25 mm/s. The cylindrical cup deep drawing process was
performed with 1 mm/s and 11 mm/s (Simões, 2012). Although these values are not
necessarily the material sliding velocity, the value used in tests (15cm/s) seems to be quite
high. The use of a lower velocity can be compensated by the lower number of laps, leading
to the same total time of each test.
o For the lubricated tests, it can be important to keep figures of the
contact surfaces without cleaning the lubricant as well as after cleaning. This will help the
results interpretation.
o The use of the same lubricated sample for performing several
tests can also influence the results. In fact, it was observed that the lubricant distribution in
the sample surface could be affect by the previous results. Therefore, if the option of using
the same sample is adopted, the track should be distant enough to avoid this interference.
o The results shown dispersion in the lubricant amount, which
results from the application method. Although, this method does not seems suitable, it is
not easy to suggest a method that will guarantee a more homogeneous layer of lubricant
over the sample surface.
Test planning:
o The use of a constant acquisition rate for different track radius
results in poorer definitions of the friction coefficient evolution with the relative angular
position for smaller track dimensions. Therefore, it is recommended to determine the
acquisition rate according to the track radius, to improve the results comparison.
o The results obtained were not always conclusive, due to the
limited number of tested samples. In order to guarantee the results reproducibility at least 3
replications should be performed.
Conclusions, Remarks and Future Work Suggestions
José Miguel Fernandes Figueiredo 49
Results analysis:
o Based on the results analysis performed, it was observed that the
average friction coefficient is not totally representative of the test. Therefore, it is
important to perform some statistical analysis of the results. Since the results do not
typically follow a normal distribution, it was decided to always present the minimum and
maximum friction coefficient. In some tests, isolated values of friction coefficient were
observed. In order to avoid the interpretation of probable system errors, the isolated points
were typically removed from the analysis.

Analysis of the tribological behaviour of W-Ti-N coatings
50 2013
References
José Miguel Fernandes Figueiredo 51
REFERENCES
Cailletaud G., Basseville S., Yastrebov V.A., (2010), “Contact mechanics I: basics”,
WEMESURF short course on contact mechanics and tribology, Paris, France, 21-
24 June 2010
Cavaleiro A., Trindade B., Vieira M.T., (2003), “Influence of Ti addiction on the
properties of W-Ti-C/N sputtered films”, Surface & Coatings Technology, 68,
174–175.
Ceretti E., Fiorentino A., Giardini C., (2008), “Process parameters influence on friction
coefficient in sheet forming operations”, International Journal of Materials
Forming, 1, 1219 –1222.
CMS Instruments, Catalogue (2012), “Instrumented Indentation, Scratch and Tribology”,
Accessed at 4 of August 2012 on:
http://www.stinstruments.com/uploads/editor/brochures/CSM%20company.pdf
CMS Instruments, (2012), “High Temperature Tribometer”, Accessed on 2 of August
2012 in: http://www.csm-instruments.com/en/High-Temperature-Tribometer
Coër J., (2009), "Comportement élasto-plastique d'une tôle métallique à haute
température", Rapport de stage de Université de Bretagne-Sud.
Coër J., Bernard C., Laurent H., Andrade-Campos A., Thuillier S., (2010), "The effect of
temperature on anisotropy properties of an aluminium alloy", Experimental
Mechanics, 51, 1185-1195.
Coër J., Manach P.Y., Laurent H., Menezes L.F., Oliveira M.C., (2013), “Piobert-Lüders
plateau and Portevin-Le Chatelier effect in an Al-Mg alloy in simple shear”,
Mechanics Research Communications, 48, 1-7.
Fromentina S., Martiny M., Ferron G., Tourkic Z., Moreira L.P, Ferran G., (2001)
“Finite element simulations of sheet-metal forming processes for planar-
anisotropic materials”, International Journal of Mechanical Sciences, 43, 1833–
1852.
Laurent H., Grèze R., Manach P.Y., Thuillier S., (2008), "Influence of constitutive
model in springback prediction using the split-ring test", International Journal of
Mechanical Sciences, 51, 233 – 245.
Laurent H., Grèze R., Oliveira M.C., Menezes L.F., Manach P.Y., Alves J.L., (2010)
"Numerical study of springback using the split-ring test for an AA5754
aluminum alloy", Finite Elements in Analysis and Design, 46, 751-759.
Laurent H., Coër J., Grèze R., Manach P.Y., Andrade-Campos A., Oliveira M.C.,
Menezes L.F., (2011), "Mechanical behaviour and springback study of an
aluminium alloy in warm forming conditions", ISRN Mechanical Engineering,
2011, Article ID 381615.
Le H.R., Sutcliffe M.P.F., (2002), “Measurements of friction in strip drawing under thin
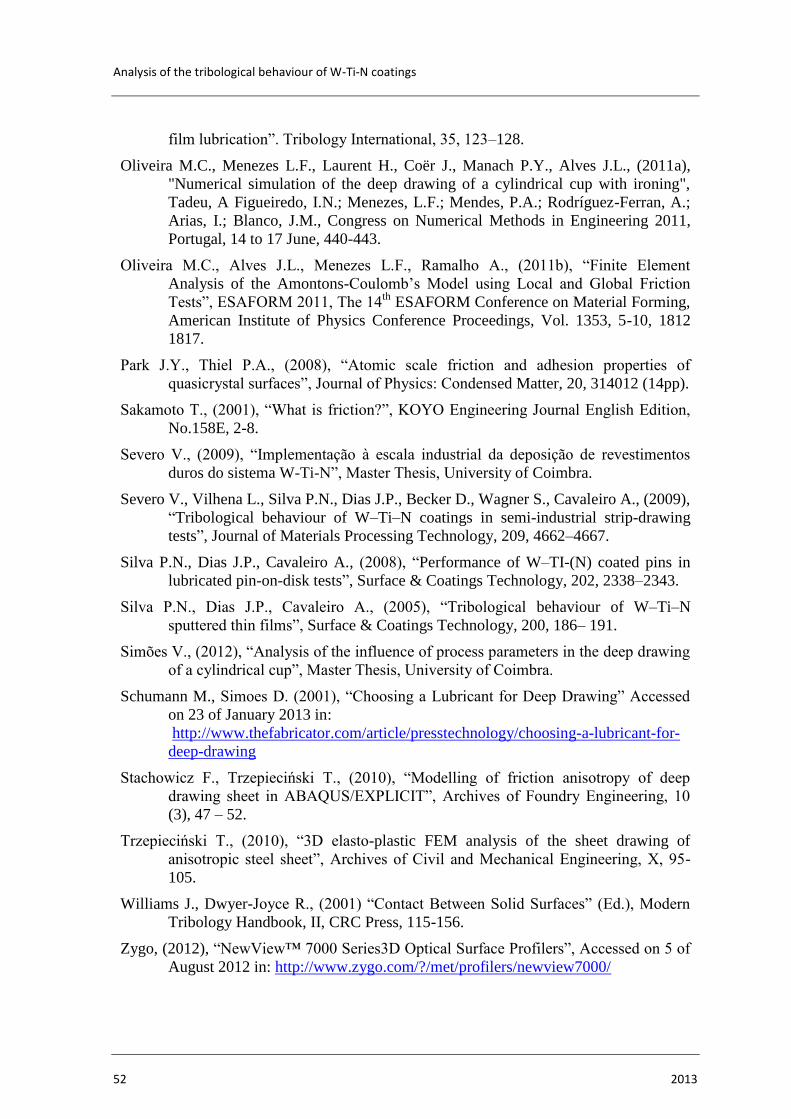
Analysis of the tribological behaviour of W-Ti-N coatings
52 2013
film lubrication”. Tribology International, 35, 123–128.
Oliveira M.C., Menezes L.F., Laurent H., Coër J., Manach P.Y., Alves J.L., (2011a),
"Numerical simulation of the deep drawing of a cylindrical cup with ironing",
Tadeu, A Figueiredo, I.N.; Menezes, L.F.; Mendes, P.A.; Rodríguez-Ferran, A.;
Arias, I.; Blanco, J.M., Congress on Numerical Methods in Engineering 2011,
Portugal, 14 to 17 June, 440-443.
Oliveira M.C., Alves J.L., Menezes L.F., Ramalho A., (2011b), “Finite Element
Analysis of the Amontons-Coulomb’s Model using Local and Global Friction
Tests”, ESAFORM 2011, The 14th
ESAFORM Conference on Material Forming,
American Institute of Physics Conference Proceedings, Vol. 1353, 5-10, 1812
1817.
Park J.Y., Thiel P.A., (2008), “Atomic scale friction and adhesion properties of
quasicrystal surfaces”, Journal of Physics: Condensed Matter, 20, 314012 (14pp).
Sakamoto T., (2001), “What is friction?”, KOYO Engineering Journal English Edition,
No.158E, 2-8.
Severo V., (2009), “Implementação à escala industrial da deposição de revestimentos
duros do sistema W-Ti-N”, Master Thesis, University of Coimbra.
Severo V., Vilhena L., Silva P.N., Dias J.P., Becker D., Wagner S., Cavaleiro A., (2009),
“Tribological behaviour of W–Ti–N coatings in semi-industrial strip-drawing
tests”, Journal of Materials Processing Technology, 209, 4662–4667.
Silva P.N., Dias J.P., Cavaleiro A., (2008), “Performance of W–TI-(N) coated pins in
lubricated pin-on-disk tests”, Surface & Coatings Technology, 202, 2338–2343.
Silva P.N., Dias J.P., Cavaleiro A., (2005), “Tribological behaviour of W–Ti–N
sputtered thin films”, Surface & Coatings Technology, 200, 186– 191.
Simões V., (2012), “Analysis of the influence of process parameters in the deep drawing
of a cylindrical cup”, Master Thesis, University of Coimbra.
Schumann M., Simoes D. (2001), “Choosing a Lubricant for Deep Drawing” Accessed
on 23 of January 2013 in:
http://www.thefabricator.com/article/presstechnology/choosing-a-lubricant-for-
deep-drawing
Stachowicz F., Trzepieciński T., (2010), “Modelling of friction anisotropy of deep
drawing sheet in ABAQUS/EXPLICIT”, Archives of Foundry Engineering, 10
(3), 47 – 52.
Trzepieciński T., (2010), “3D elasto-plastic FEM analysis of the sheet drawing of
anisotropic steel sheet”, Archives of Civil and Mechanical Engineering, X, 95-
105.
Williams J., Dwyer-Joyce R., (2001) “Contact Between Solid Surfaces” (Ed.), Modern
Tribology Handbook, II, CRC Press, 115-156.
Zygo, (2012), “NewView™ 7000 Series3D Optical Surface Profilers”, Accessed on 5 of
August 2012 in: http://www.zygo.com/?/met/profilers/newview7000/
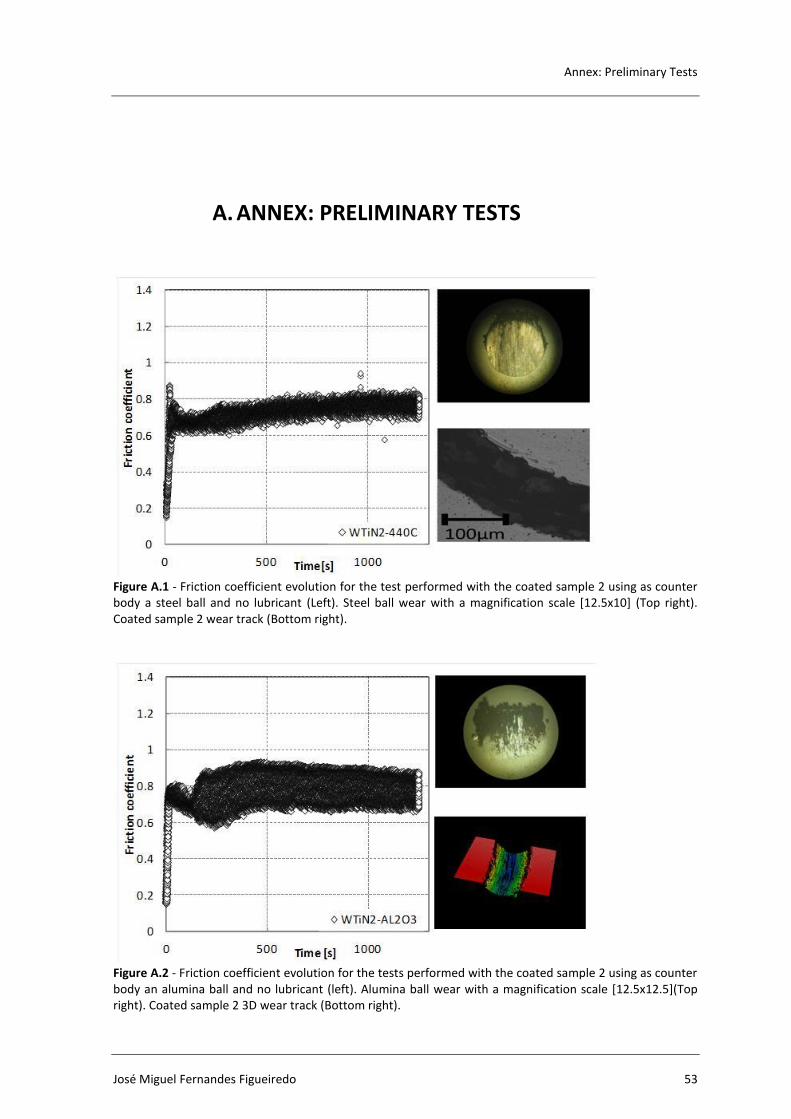
Annex: Preliminary Tests
José Miguel Fernandes Figueiredo 53
A. ANNEX: PRELIMINARY TESTS
Figure A.1 - Friction coefficient evolution for the test performed with the coated sample 2 using as counter body a steel ball and no lubricant (Left). Steel ball wear with a magnification scale [12.5x10] (Top right). Coated sample 2 wear track (Bottom right).
Figure A.2 - Friction coefficient evolution for the tests performed with the coated sample 2 using as counter body an alumina ball and no lubricant (left). Alumina ball wear with a magnification scale [12.5x12.5](Top right). Coated sample 2 3D wear track (Bottom right).
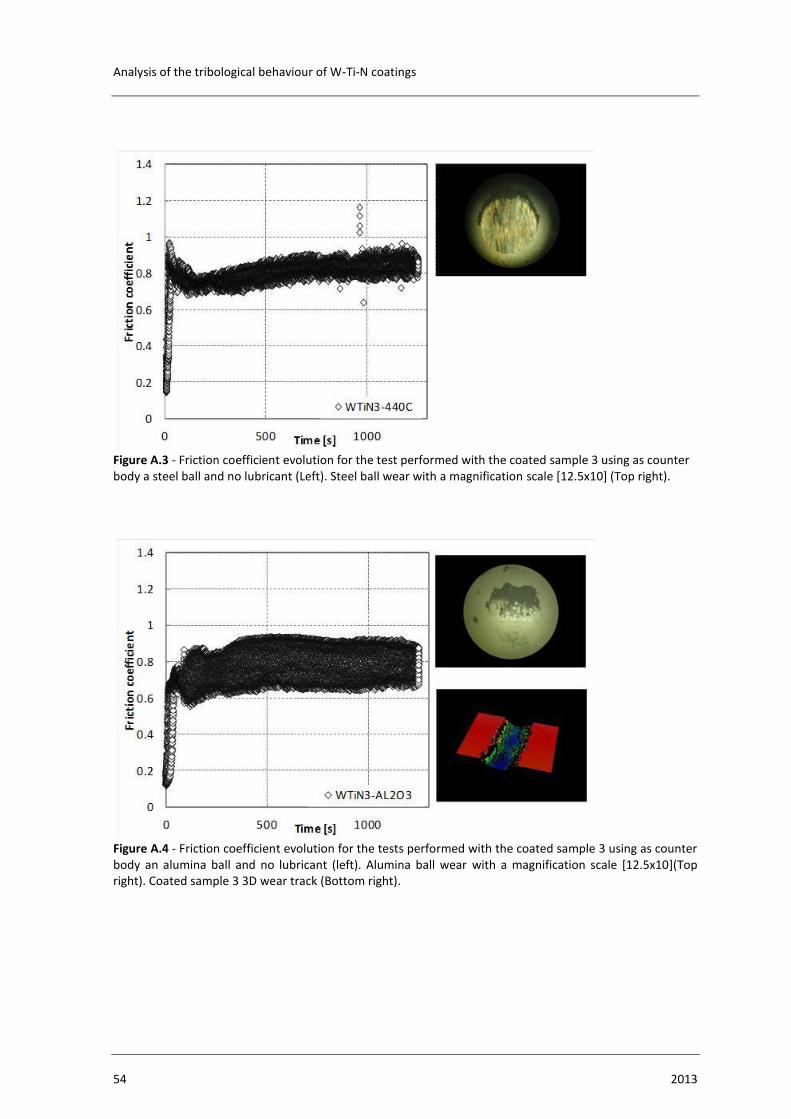
Analysis of the tribological behaviour of W-Ti-N coatings
54 2013
Figure A.3 - Friction coefficient evolution for the test performed with the coated sample 3 using as counter body a steel ball and no lubricant (Left). Steel ball wear with a magnification scale [12.5x10] (Top right).
Figure A.4 - Friction coefficient evolution for the tests performed with the coated sample 3 using as counter body an alumina ball and no lubricant (left). Alumina ball wear with a magnification scale [12.5x10](Top right). Coated sample 3 3D wear track (Bottom right).
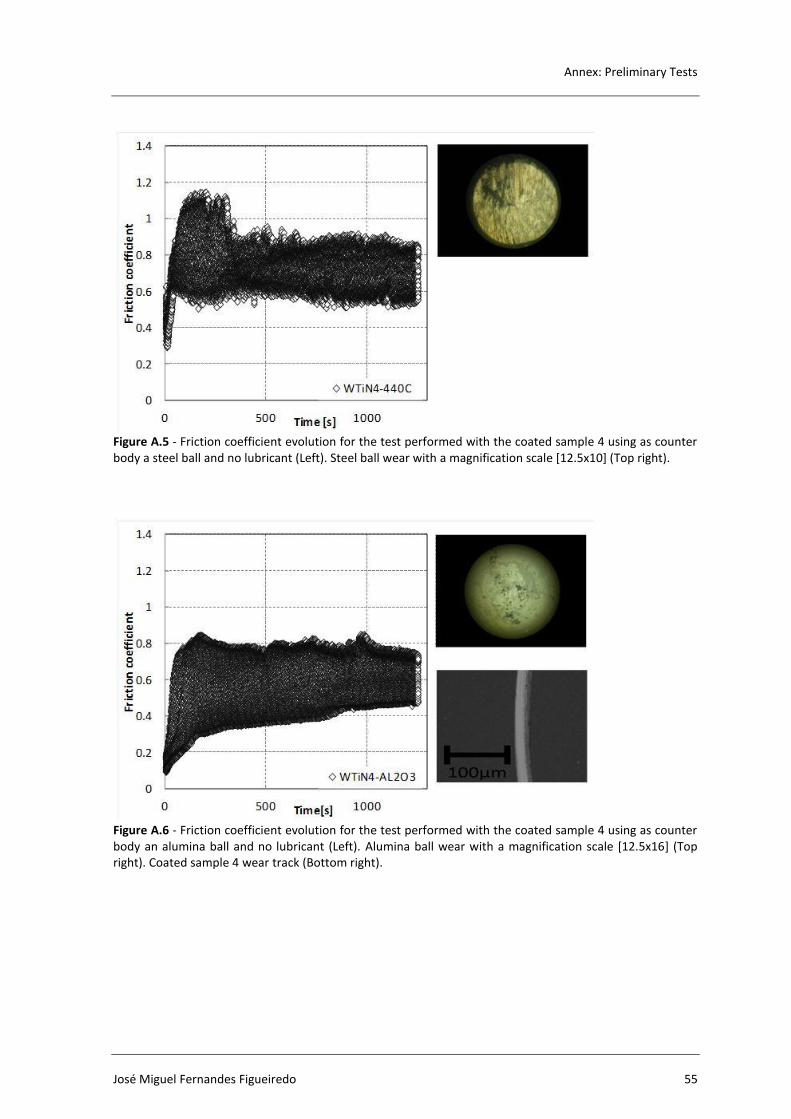
Annex: Preliminary Tests
José Miguel Fernandes Figueiredo 55
Figure A.5 - Friction coefficient evolution for the test performed with the coated sample 4 using as counter body a steel ball and no lubricant (Left). Steel ball wear with a magnification scale [12.5x10] (Top right).
Figure A.6 - Friction coefficient evolution for the test performed with the coated sample 4 using as counter body an alumina ball and no lubricant (Left). Alumina ball wear with a magnification scale [12.5x16] (Top right). Coated sample 4 wear track (Bottom right).
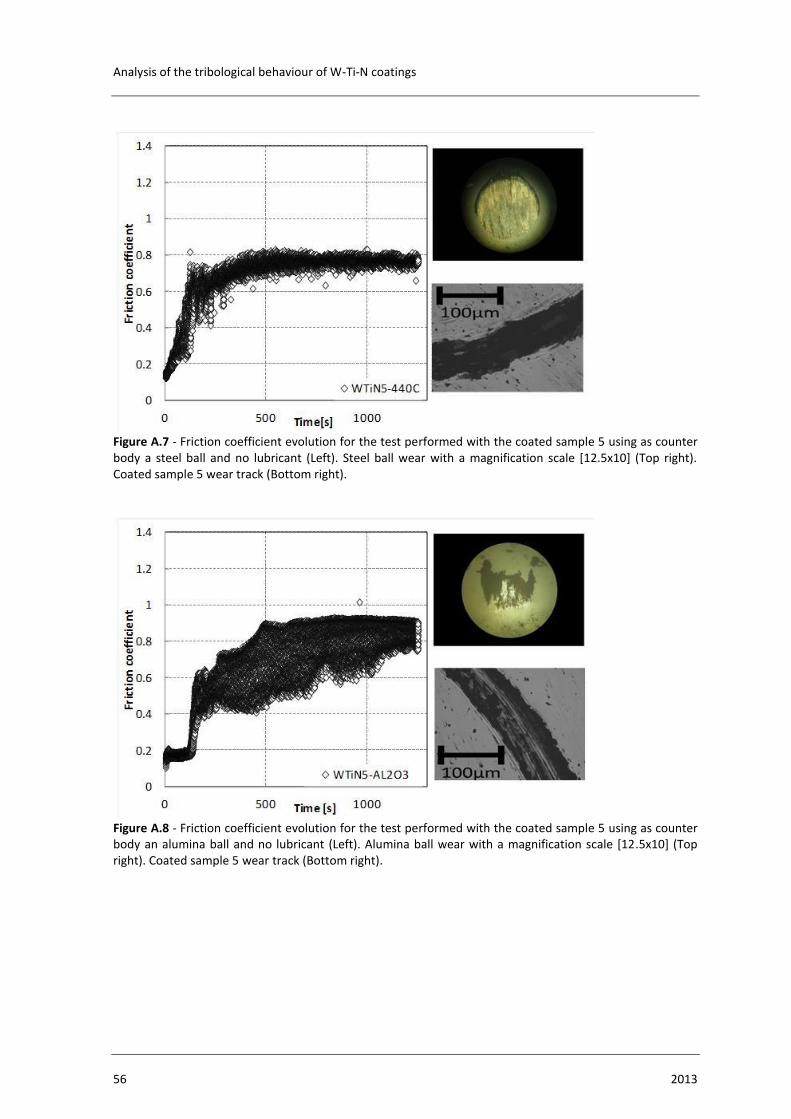
Analysis of the tribological behaviour of W-Ti-N coatings
56 2013
Figure A.7 - Friction coefficient evolution for the test performed with the coated sample 5 using as counter body a steel ball and no lubricant (Left). Steel ball wear with a magnification scale [12.5x10] (Top right). Coated sample 5 wear track (Bottom right).
Figure A.8 - Friction coefficient evolution for the test performed with the coated sample 5 using as counter body an alumina ball and no lubricant (Left). Alumina ball wear with a magnification scale [12.5x10] (Top right). Coated sample 5 wear track (Bottom right).
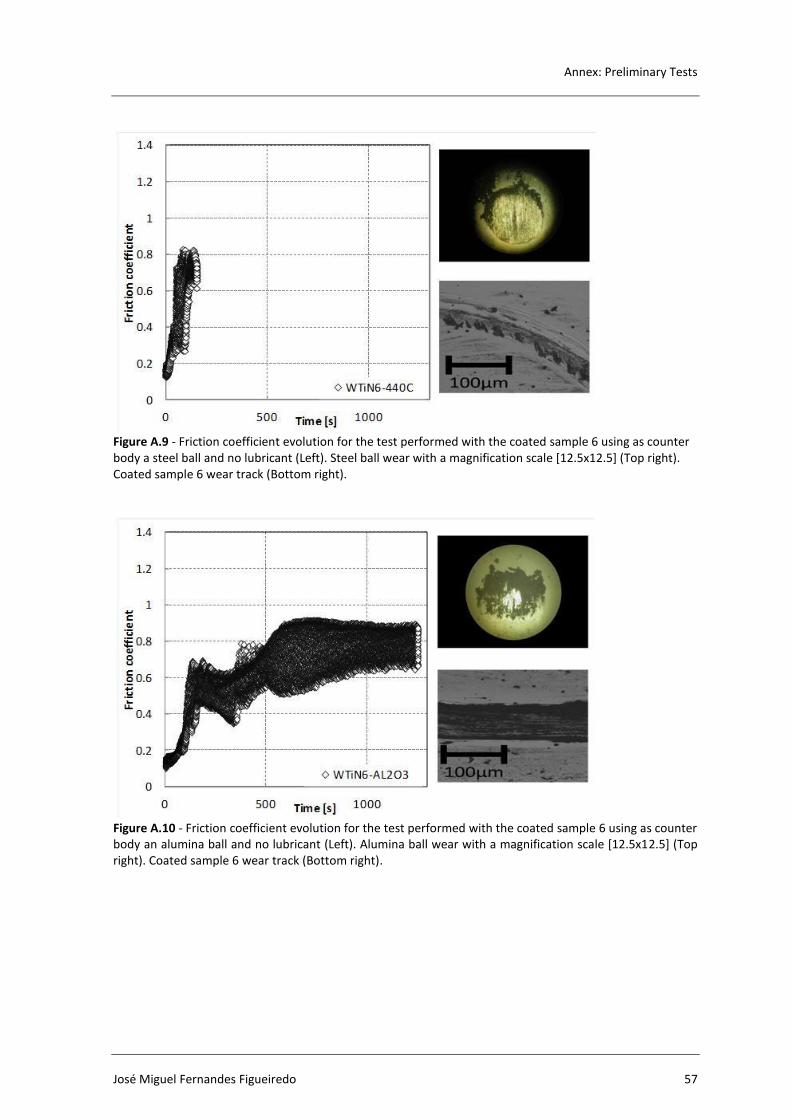
Annex: Preliminary Tests
José Miguel Fernandes Figueiredo 57
Figure A.9 - Friction coefficient evolution for the test performed with the coated sample 6 using as counter body a steel ball and no lubricant (Left). Steel ball wear with a magnification scale [12.5x12.5] (Top right). Coated sample 6 wear track (Bottom right).
Figure A.10 - Friction coefficient evolution for the test performed with the coated sample 6 using as counter body an alumina ball and no lubricant (Left). Alumina ball wear with a magnification scale [12.5x12.5] (Top right). Coated sample 6 wear track (Bottom right).
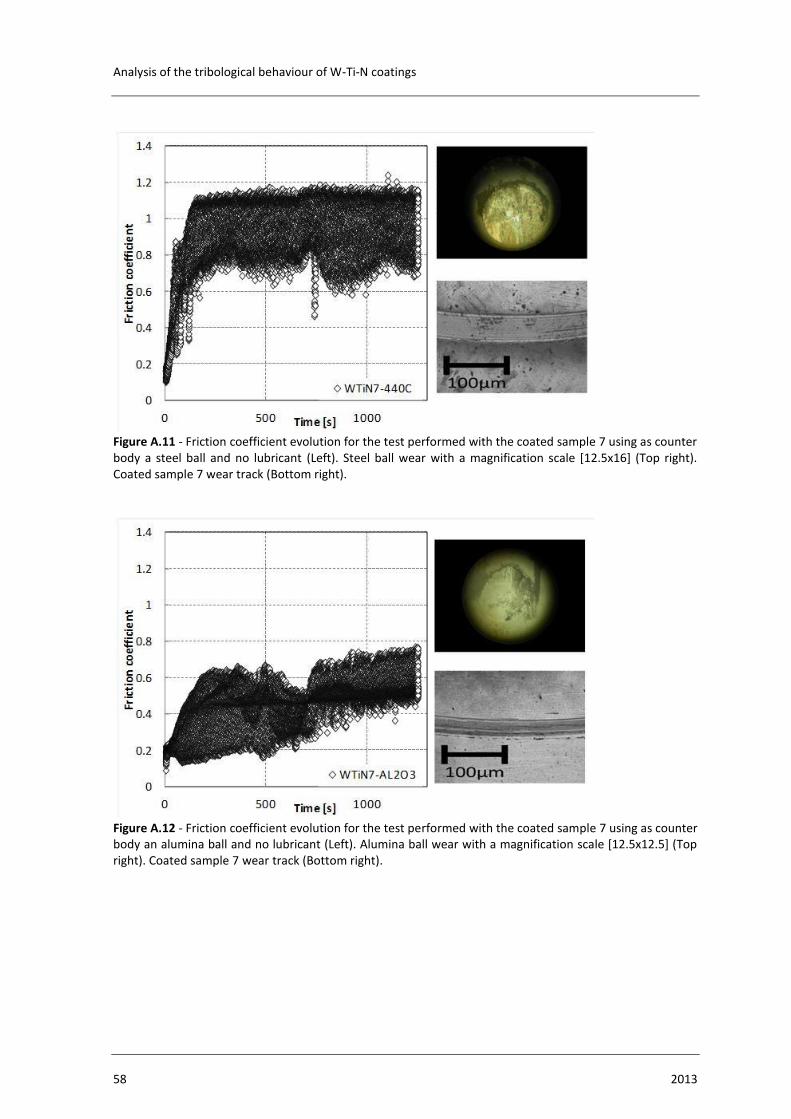
Analysis of the tribological behaviour of W-Ti-N coatings
58 2013
Figure A.11 - Friction coefficient evolution for the test performed with the coated sample 7 using as counter body a steel ball and no lubricant (Left). Steel ball wear with a magnification scale [12.5x16] (Top right). Coated sample 7 wear track (Bottom right).
Figure A.12 - Friction coefficient evolution for the test performed with the coated sample 7 using as counter body an alumina ball and no lubricant (Left). Alumina ball wear with a magnification scale [12.5x12.5] (Top right). Coated sample 7 wear track (Bottom right).
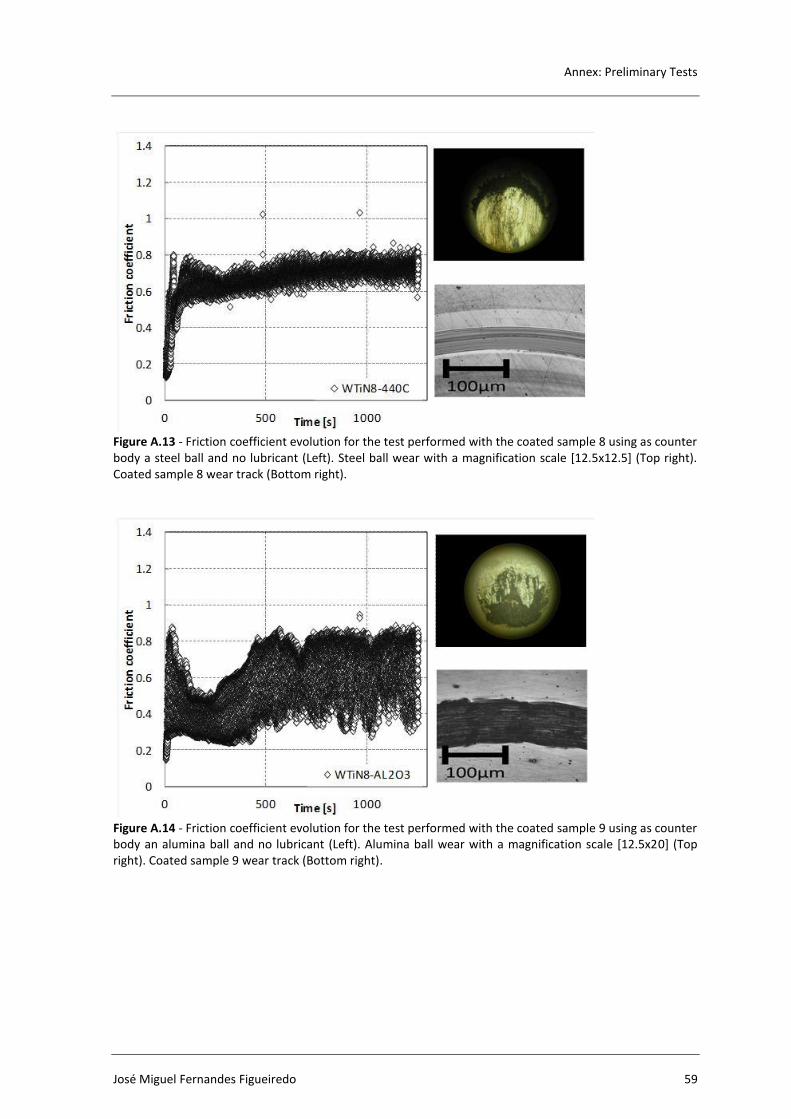
Annex: Preliminary Tests
José Miguel Fernandes Figueiredo 59
Figure A.13 - Friction coefficient evolution for the test performed with the coated sample 8 using as counter body a steel ball and no lubricant (Left). Steel ball wear with a magnification scale [12.5x12.5] (Top right). Coated sample 8 wear track (Bottom right).
Figure A.14 - Friction coefficient evolution for the test performed with the coated sample 9 using as counter body an alumina ball and no lubricant (Left). Alumina ball wear with a magnification scale [12.5x20] (Top right). Coated sample 9 wear track (Bottom right).
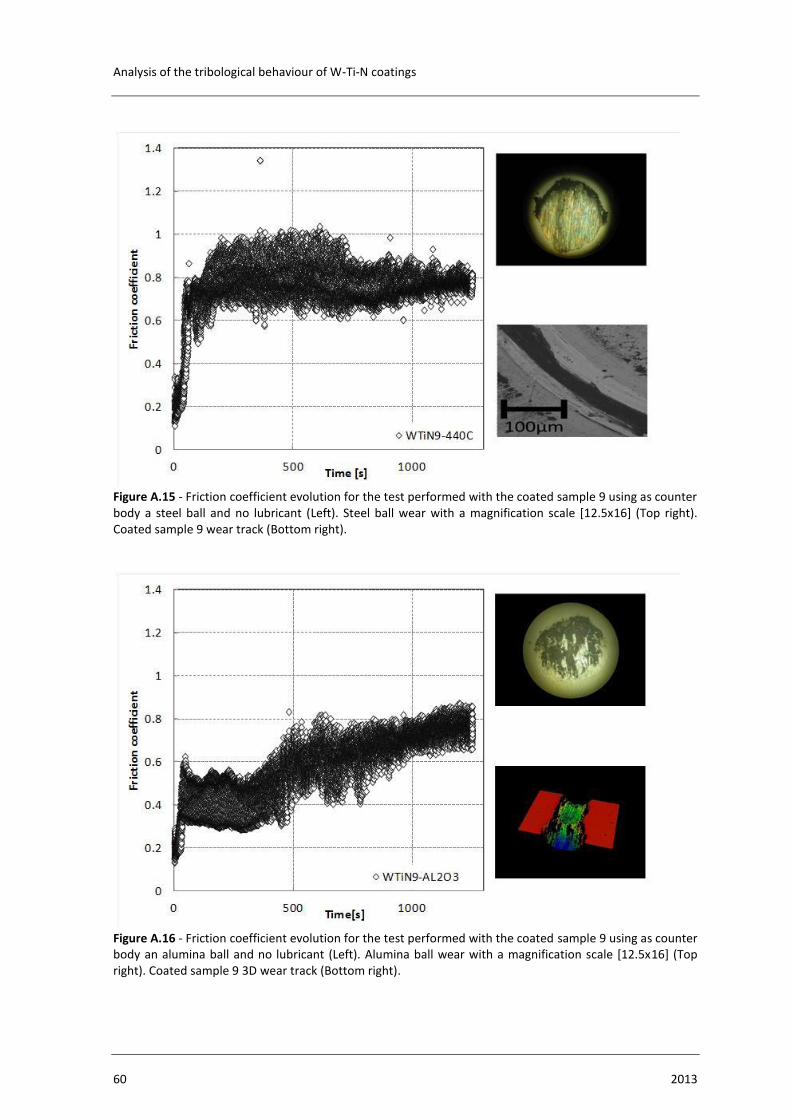
Analysis of the tribological behaviour of W-Ti-N coatings
60 2013
Figure A.15 - Friction coefficient evolution for the test performed with the coated sample 9 using as counter body a steel ball and no lubricant (Left). Steel ball wear with a magnification scale [12.5x16] (Top right). Coated sample 9 wear track (Bottom right).
Figure A.16 - Friction coefficient evolution for the test performed with the coated sample 9 using as counter body an alumina ball and no lubricant (Left). Alumina ball wear with a magnification scale [12.5x16] (Top right). Coated sample 9 3D wear track (Bottom right).
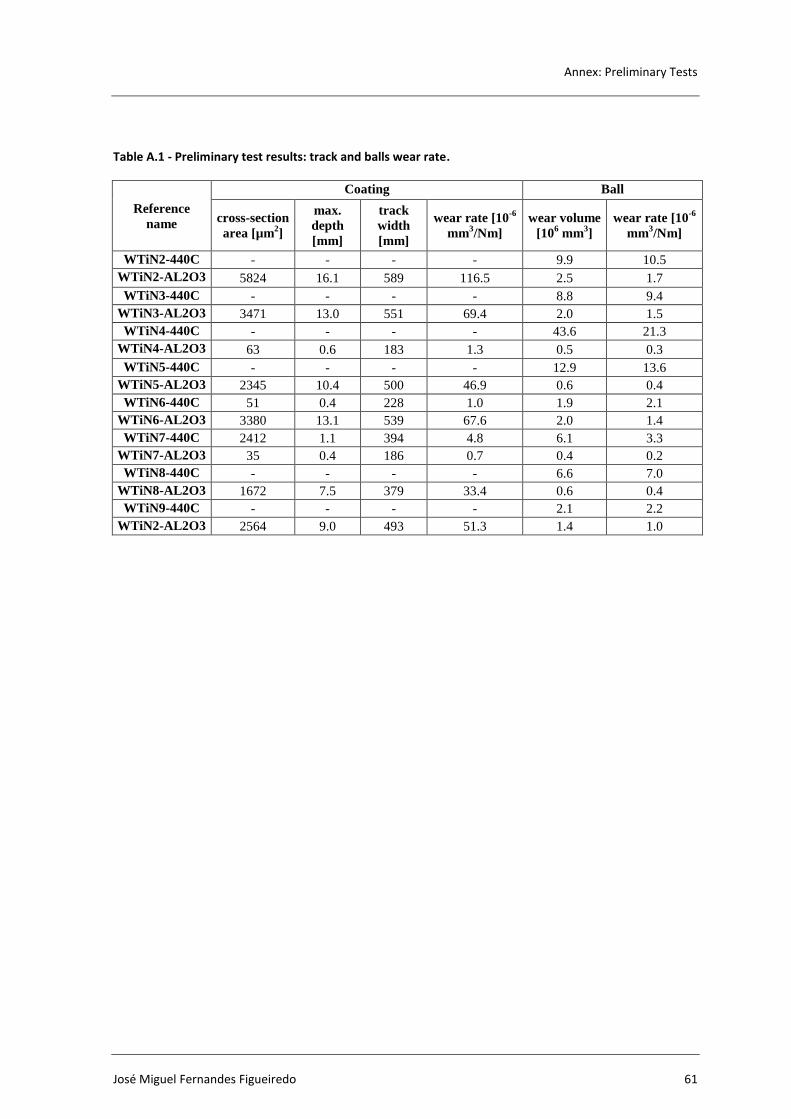
Annex: Preliminary Tests
José Miguel Fernandes Figueiredo 61
Table A.1 - Preliminary test results: track and balls wear rate.
Reference
name
Coating Ball
cross-section
area [µm2]
max.
depth
[mm]
track
width
[mm]
wear rate [10-6
mm3/Nm]
wear volume
[106 mm
3]
wear rate [10-6
mm3/Nm]
WTiN2-440C - - - - 9.9 10.5
WTiN2-AL2O3 5824 16.1 589 116.5 2.5 1.7
WTiN3-440C - - - - 8.8 9.4
WTiN3-AL2O3 3471 13.0 551 69.4 2.0 1.5
WTiN4-440C - - - - 43.6 21.3
WTiN4-AL2O3 63 0.6 183 1.3 0.5 0.3
WTiN5-440C - - - - 12.9 13.6
WTiN5-AL2O3 2345 10.4 500 46.9 0.6 0.4
WTiN6-440C 51 0.4 228 1.0 1.9 2.1
WTiN6-AL2O3 3380 13.1 539 67.6 2.0 1.4
WTiN7-440C 2412 1.1 394 4.8 6.1 3.3
WTiN7-AL2O3 35 0.4 186 0.7 0.4 0.2
WTiN8-440C - - - - 6.6 7.0
WTiN8-AL2O3 1672 7.5 379 33.4 0.6 0.4
WTiN9-440C - - - - 2.1 2.2
WTiN2-AL2O3 2564 9.0 493 51.3 1.4 1.0

Analysis of the tribological behaviour of W-Ti-N coatings
62 2013
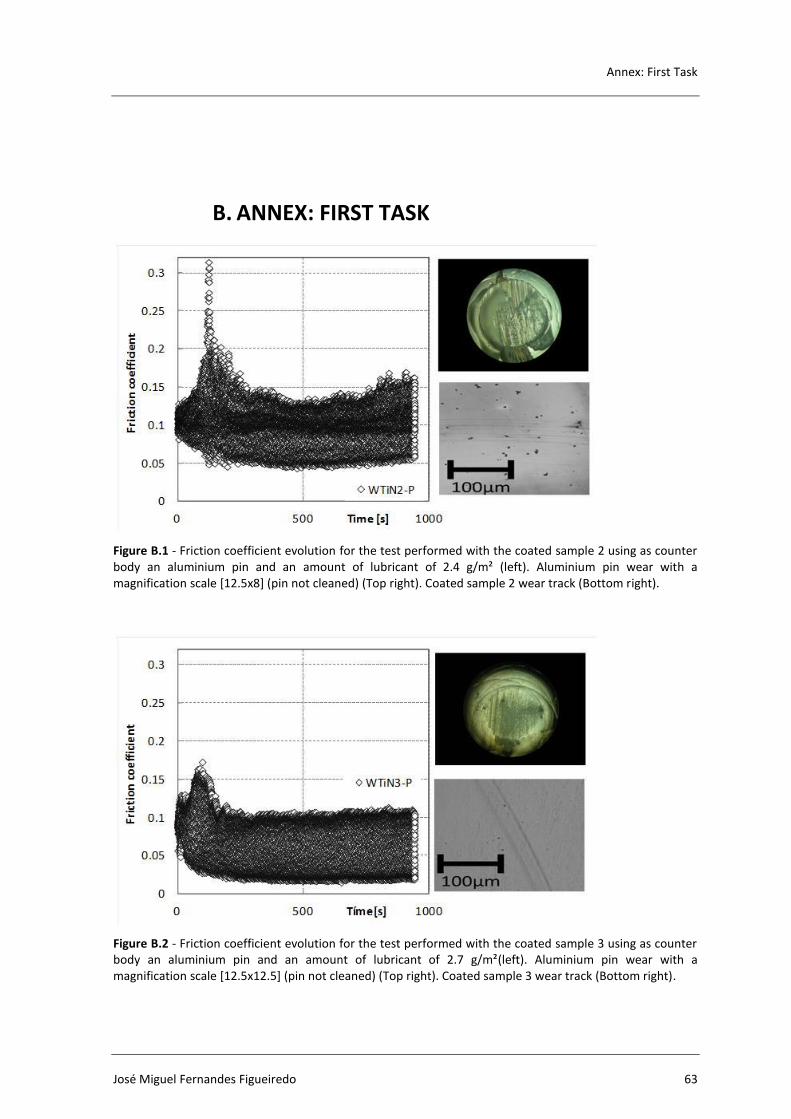
Annex: First Task
José Miguel Fernandes Figueiredo 63
B. ANNEX: FIRST TASK
Figure B.1 - Friction coefficient evolution for the test performed with the coated sample 2 using as counter body an aluminium pin and an amount of lubricant of 2.4 g/m² (left). Aluminium pin wear with a magnification scale [12.5x8] (pin not cleaned) (Top right). Coated sample 2 wear track (Bottom right).
Figure B.2 - Friction coefficient evolution for the test performed with the coated sample 3 using as counter body an aluminium pin and an amount of lubricant of 2.7 g/m²(left). Aluminium pin wear with a magnification scale [12.5x12.5] (pin not cleaned) (Top right). Coated sample 3 wear track (Bottom right).
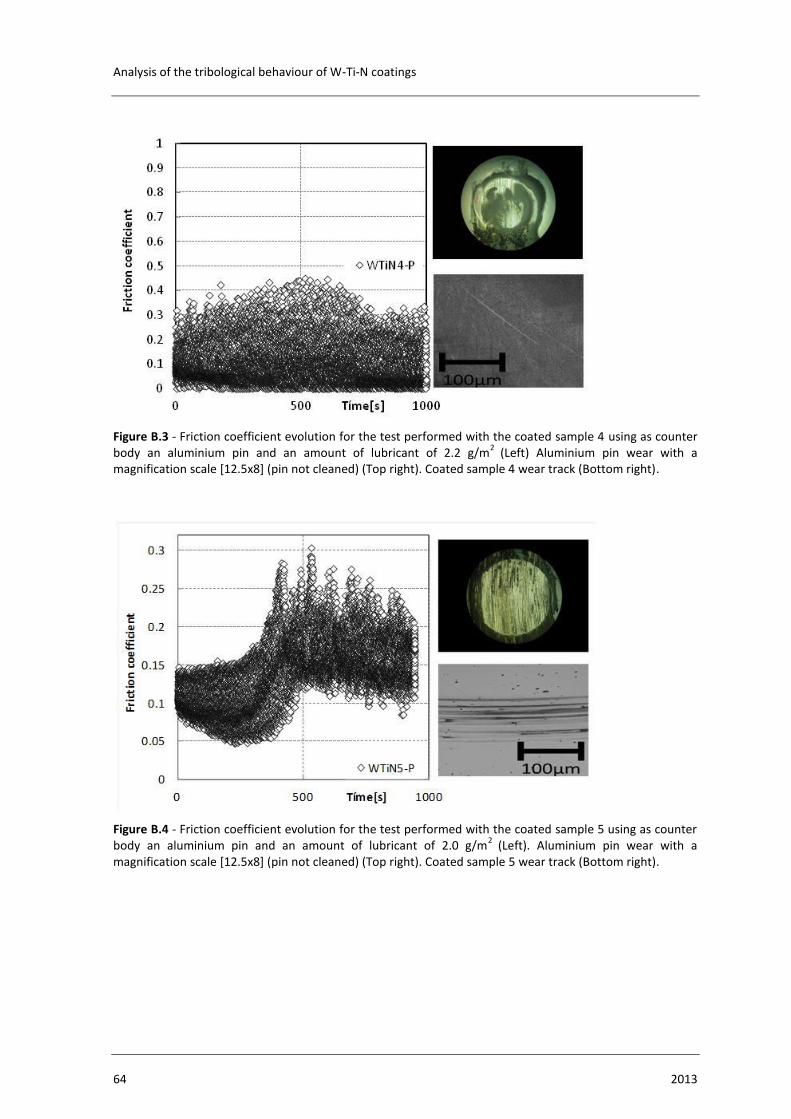
Analysis of the tribological behaviour of W-Ti-N coatings
64 2013
Figure B.3 - Friction coefficient evolution for the test performed with the coated sample 4 using as counter body an aluminium pin and an amount of lubricant of 2.2 g/m
2 (Left) Aluminium pin wear with a
magnification scale [12.5x8] (pin not cleaned) (Top right). Coated sample 4 wear track (Bottom right).
Figure B.4 - Friction coefficient evolution for the test performed with the coated sample 5 using as counter body an aluminium pin and an amount of lubricant of 2.0 g/m
2 (Left). Aluminium pin wear with a
magnification scale [12.5x8] (pin not cleaned) (Top right). Coated sample 5 wear track (Bottom right).
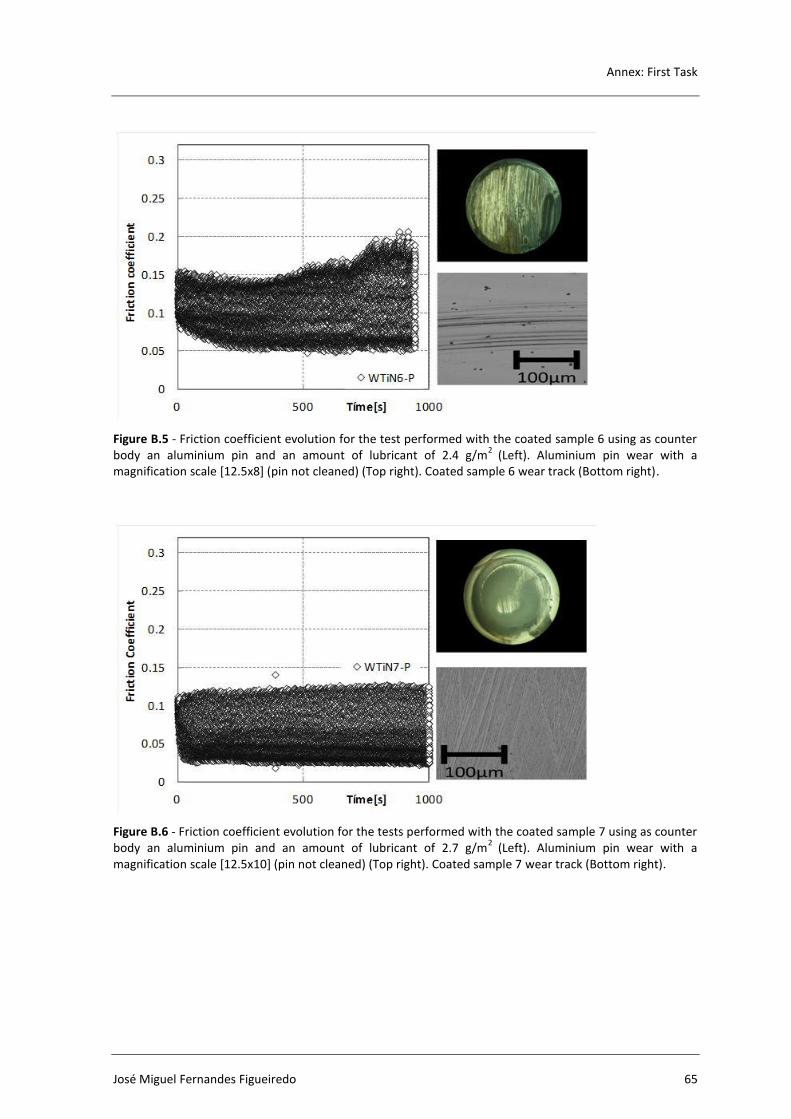
Annex: First Task
José Miguel Fernandes Figueiredo 65
Figure B.5 - Friction coefficient evolution for the test performed with the coated sample 6 using as counter body an aluminium pin and an amount of lubricant of 2.4 g/m
2 (Left). Aluminium pin wear with a
magnification scale [12.5x8] (pin not cleaned) (Top right). Coated sample 6 wear track (Bottom right).
Figure B.6 - Friction coefficient evolution for the tests performed with the coated sample 7 using as counter body an aluminium pin and an amount of lubricant of 2.7 g/m
2 (Left). Aluminium pin wear with a
magnification scale [12.5x10] (pin not cleaned) (Top right). Coated sample 7 wear track (Bottom right).
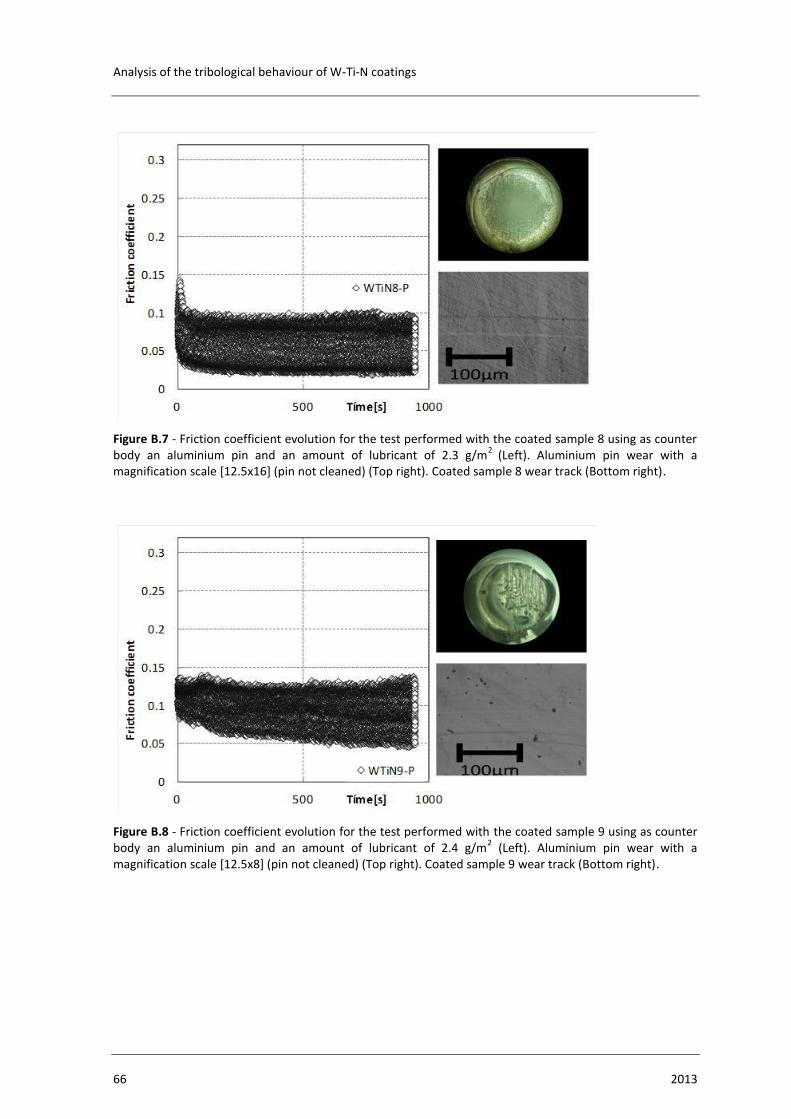
Analysis of the tribological behaviour of W-Ti-N coatings
66 2013
Figure B.7 - Friction coefficient evolution for the test performed with the coated sample 8 using as counter body an aluminium pin and an amount of lubricant of 2.3 g/m
2 (Left). Aluminium pin wear with a
magnification scale [12.5x16] (pin not cleaned) (Top right). Coated sample 8 wear track (Bottom right).
Figure B.8 - Friction coefficient evolution for the test performed with the coated sample 9 using as counter body an aluminium pin and an amount of lubricant of 2.4 g/m
2 (Left). Aluminium pin wear with a
magnification scale [12.5x8] (pin not cleaned) (Top right). Coated sample 9 wear track (Bottom right).
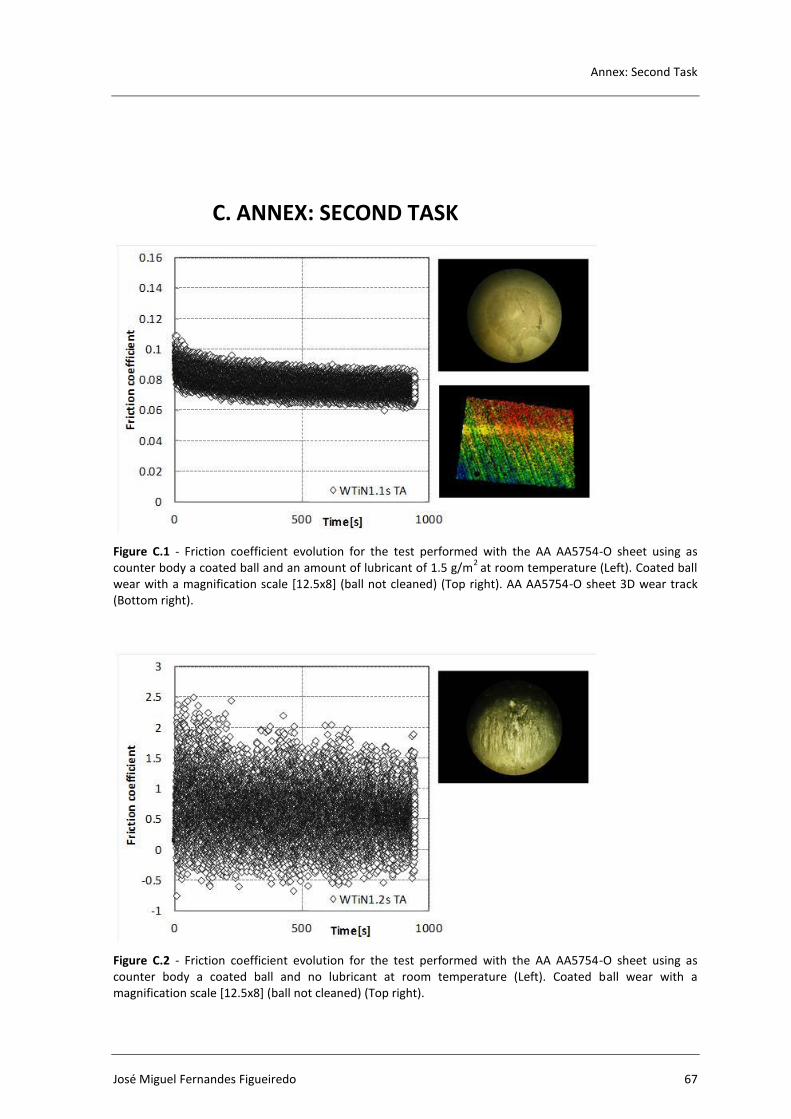
Annex: Second Task
José Miguel Fernandes Figueiredo 67
C. ANNEX: SECOND TASK
Figure C.1 - Friction coefficient evolution for the test performed with the AA AA5754-O sheet using as counter body a coated ball and an amount of lubricant of 1.5 g/m
2 at room temperature (Left). Coated ball
wear with a magnification scale [12.5x8] (ball not cleaned) (Top right). AA AA5754-O sheet 3D wear track (Bottom right).
Figure C.2 - Friction coefficient evolution for the test performed with the AA AA5754-O sheet using as counter body a coated ball and no lubricant at room temperature (Left). Coated ball wear with a magnification scale [12.5x8] (ball not cleaned) (Top right).
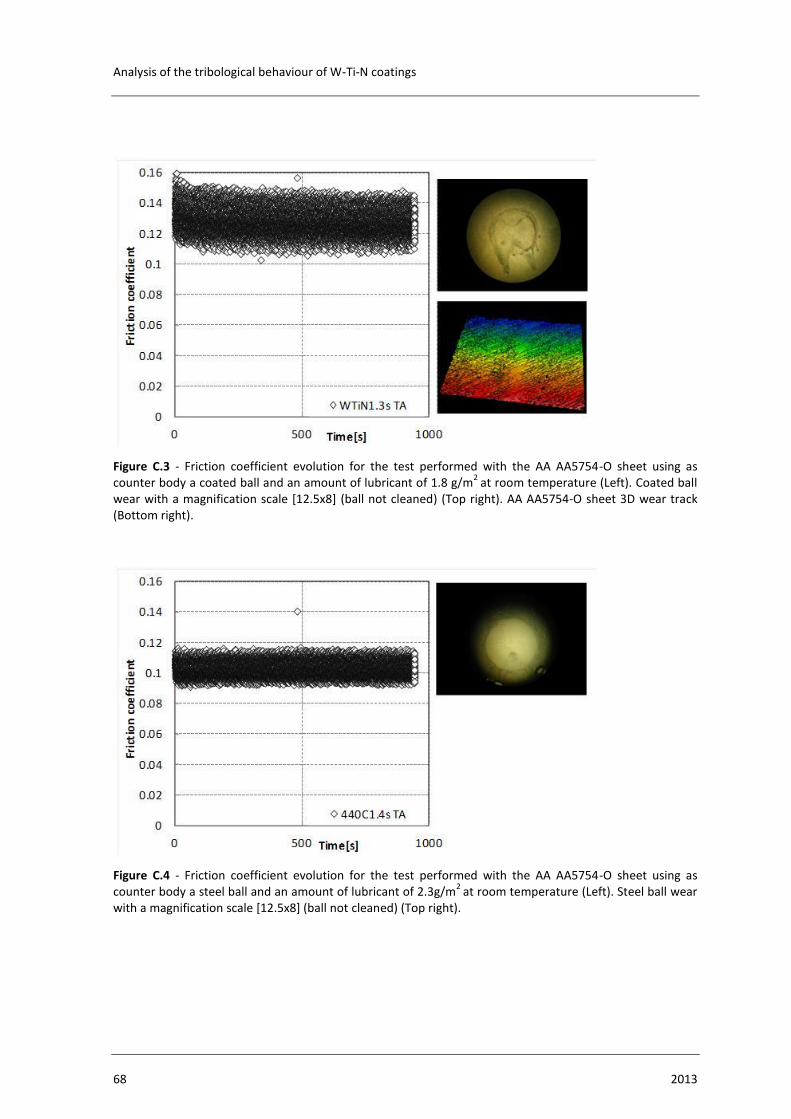
Analysis of the tribological behaviour of W-Ti-N coatings
68 2013
Figure C.3 - Friction coefficient evolution for the test performed with the AA AA5754-O sheet using as counter body a coated ball and an amount of lubricant of 1.8 g/m
2 at room temperature (Left). Coated ball
wear with a magnification scale [12.5x8] (ball not cleaned) (Top right). AA AA5754-O sheet 3D wear track (Bottom right).
Figure C.4 - Friction coefficient evolution for the test performed with the AA AA5754-O sheet using as counter body a steel ball and an amount of lubricant of 2.3g/m
2 at room temperature (Left). Steel ball wear
with a magnification scale [12.5x8] (ball not cleaned) (Top right).
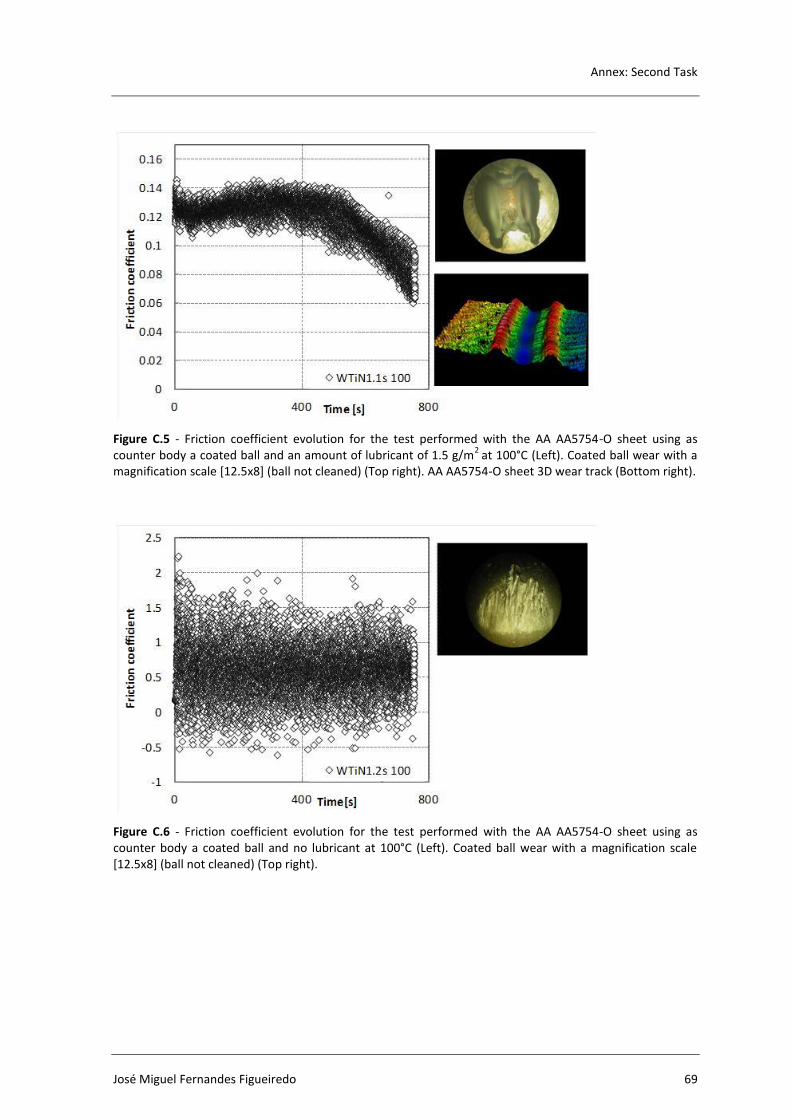
Annex: Second Task
José Miguel Fernandes Figueiredo 69
Figure C.5 - Friction coefficient evolution for the test performed with the AA AA5754-O sheet using as counter body a coated ball and an amount of lubricant of 1.5 g/m
2 at 100°C (Left). Coated ball wear with a
magnification scale [12.5x8] (ball not cleaned) (Top right). AA AA5754-O sheet 3D wear track (Bottom right).
Figure C.6 - Friction coefficient evolution for the test performed with the AA AA5754-O sheet using as counter body a coated ball and no lubricant at 100°C (Left). Coated ball wear with a magnification scale [12.5x8] (ball not cleaned) (Top right).
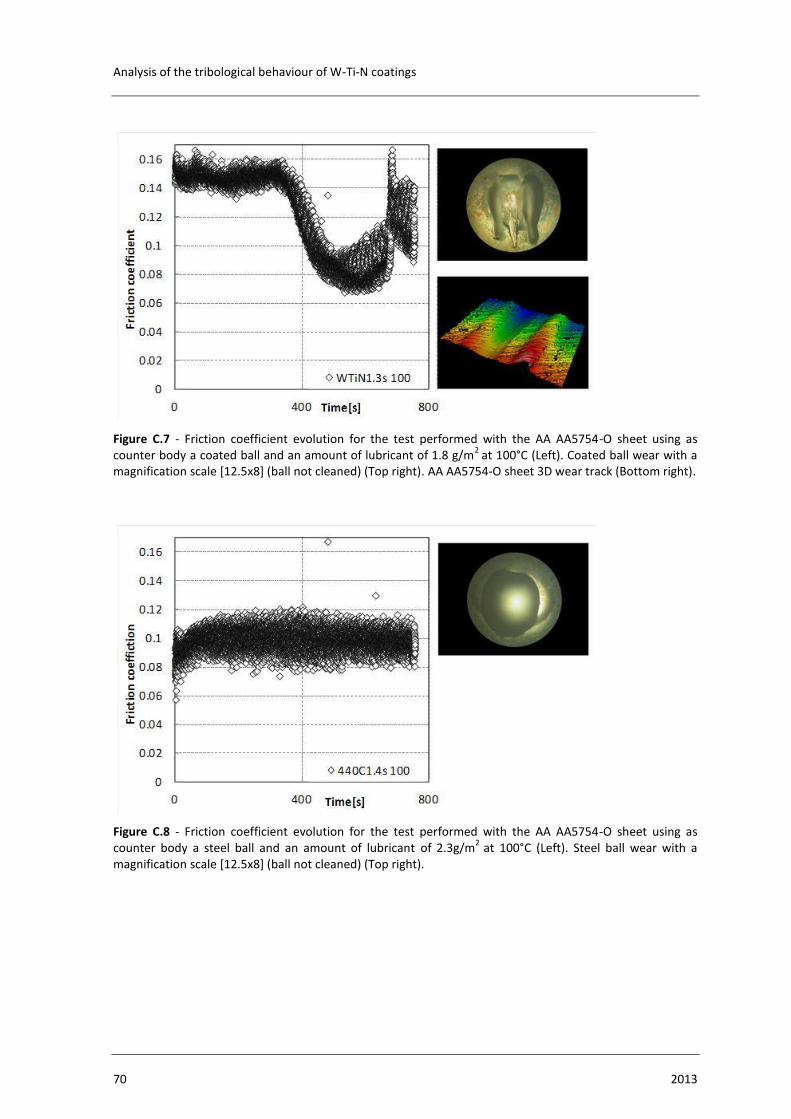
Analysis of the tribological behaviour of W-Ti-N coatings
70 2013
Figure C.7 - Friction coefficient evolution for the test performed with the AA AA5754-O sheet using as counter body a coated ball and an amount of lubricant of 1.8 g/m
2 at 100°C (Left). Coated ball wear with a
magnification scale [12.5x8] (ball not cleaned) (Top right). AA AA5754-O sheet 3D wear track (Bottom right).
Figure C.8 - Friction coefficient evolution for the test performed with the AA AA5754-O sheet using as counter body a steel ball and an amount of lubricant of 2.3g/m
2 at 100°C (Left). Steel ball wear with a
magnification scale [12.5x8] (ball not cleaned) (Top right).
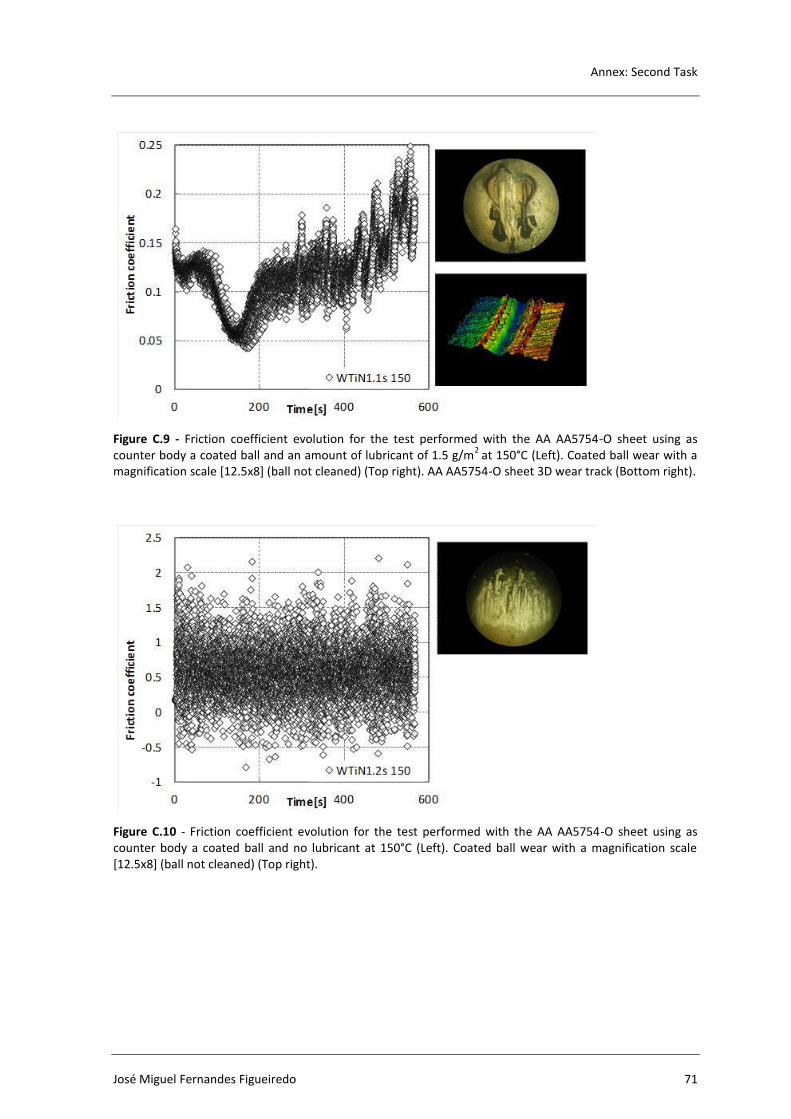
Annex: Second Task
José Miguel Fernandes Figueiredo 71
Figure C.9 - Friction coefficient evolution for the test performed with the AA AA5754-O sheet using as counter body a coated ball and an amount of lubricant of 1.5 g/m
2 at 150°C (Left). Coated ball wear with a
magnification scale [12.5x8] (ball not cleaned) (Top right). AA AA5754-O sheet 3D wear track (Bottom right).
Figure C.10 - Friction coefficient evolution for the test performed with the AA AA5754-O sheet using as counter body a coated ball and no lubricant at 150°C (Left). Coated ball wear with a magnification scale [12.5x8] (ball not cleaned) (Top right).
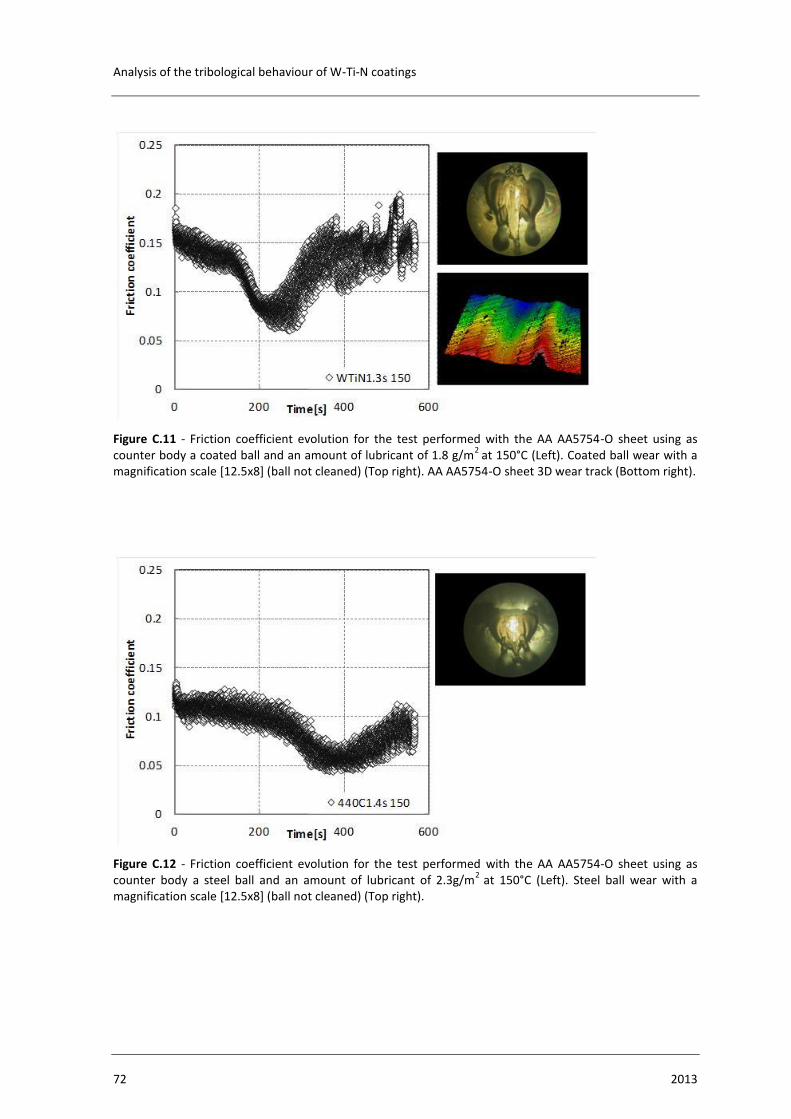
Analysis of the tribological behaviour of W-Ti-N coatings
72 2013
Figure C.11 - Friction coefficient evolution for the test performed with the AA AA5754-O sheet using as counter body a coated ball and an amount of lubricant of 1.8 g/m
2 at 150°C (Left). Coated ball wear with a
magnification scale [12.5x8] (ball not cleaned) (Top right). AA AA5754-O sheet 3D wear track (Bottom right).
Figure C.12 - Friction coefficient evolution for the test performed with the AA AA5754-O sheet using as counter body a steel ball and an amount of lubricant of 2.3g/m
2 at 150°C (Left). Steel ball wear with a
magnification scale [12.5x8] (ball not cleaned) (Top right).
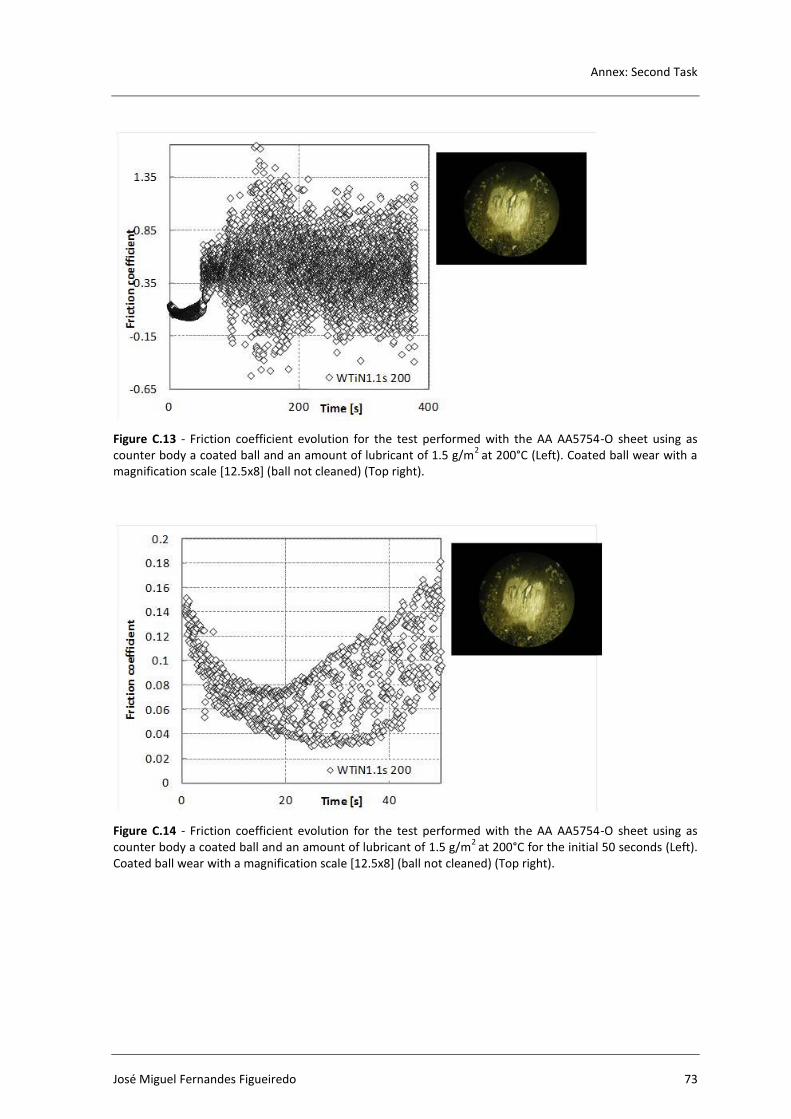
Annex: Second Task
José Miguel Fernandes Figueiredo 73
Figure C.13 - Friction coefficient evolution for the test performed with the AA AA5754-O sheet using as counter body a coated ball and an amount of lubricant of 1.5 g/m
2 at 200°C (Left). Coated ball wear with a
magnification scale [12.5x8] (ball not cleaned) (Top right).
Figure C.14 - Friction coefficient evolution for the test performed with the AA AA5754-O sheet using as counter body a coated ball and an amount of lubricant of 1.5 g/m
2 at 200°C for the initial 50 seconds (Left).
Coated ball wear with a magnification scale [12.5x8] (ball not cleaned) (Top right).
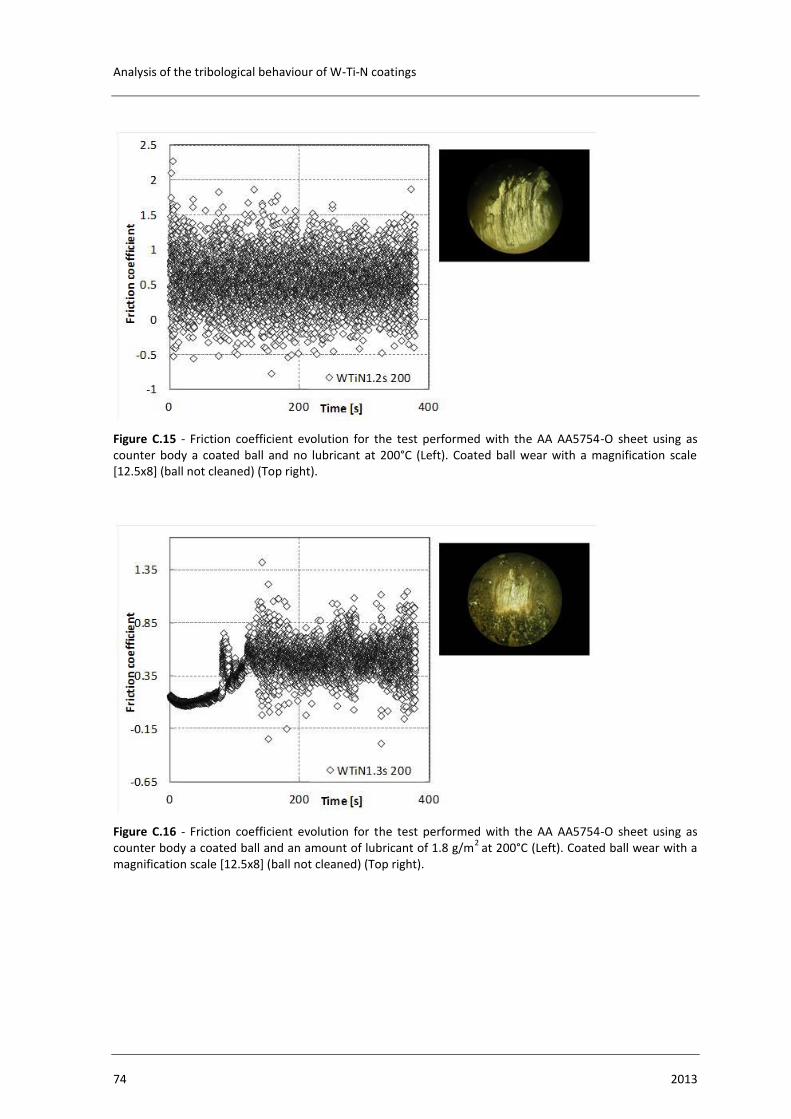
Analysis of the tribological behaviour of W-Ti-N coatings
74 2013
Figure C.15 - Friction coefficient evolution for the test performed with the AA AA5754-O sheet using as counter body a coated ball and no lubricant at 200°C (Left). Coated ball wear with a magnification scale [12.5x8] (ball not cleaned) (Top right).
Figure C.16 - Friction coefficient evolution for the test performed with the AA AA5754-O sheet using as counter body a coated ball and an amount of lubricant of 1.8 g/m
2 at 200°C (Left). Coated ball wear with a
magnification scale [12.5x8] (ball not cleaned) (Top right).
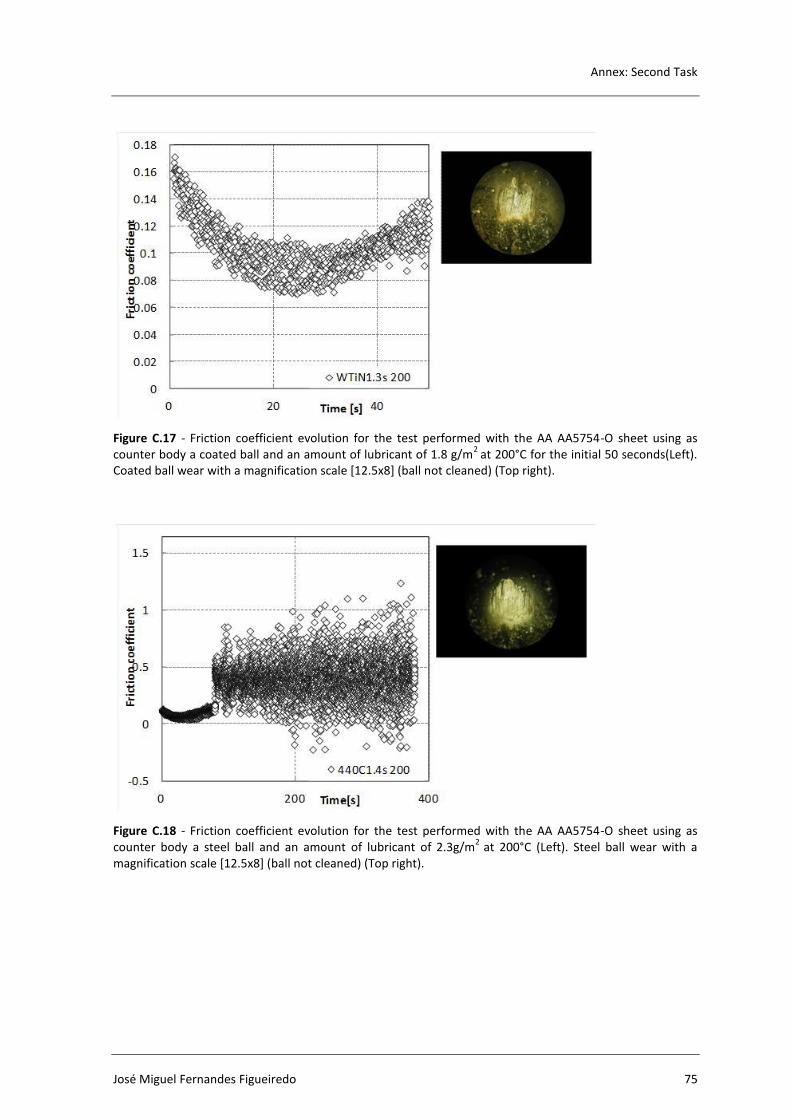
Annex: Second Task
José Miguel Fernandes Figueiredo 75
Figure C.17 - Friction coefficient evolution for the test performed with the AA AA5754-O sheet using as counter body a coated ball and an amount of lubricant of 1.8 g/m
2 at 200°C for the initial 50 seconds(Left).
Coated ball wear with a magnification scale [12.5x8] (ball not cleaned) (Top right).
Figure C.18 - Friction coefficient evolution for the test performed with the AA AA5754-O sheet using as counter body a steel ball and an amount of lubricant of 2.3g/m
2 at 200°C (Left). Steel ball wear with a
magnification scale [12.5x8] (ball not cleaned) (Top right).
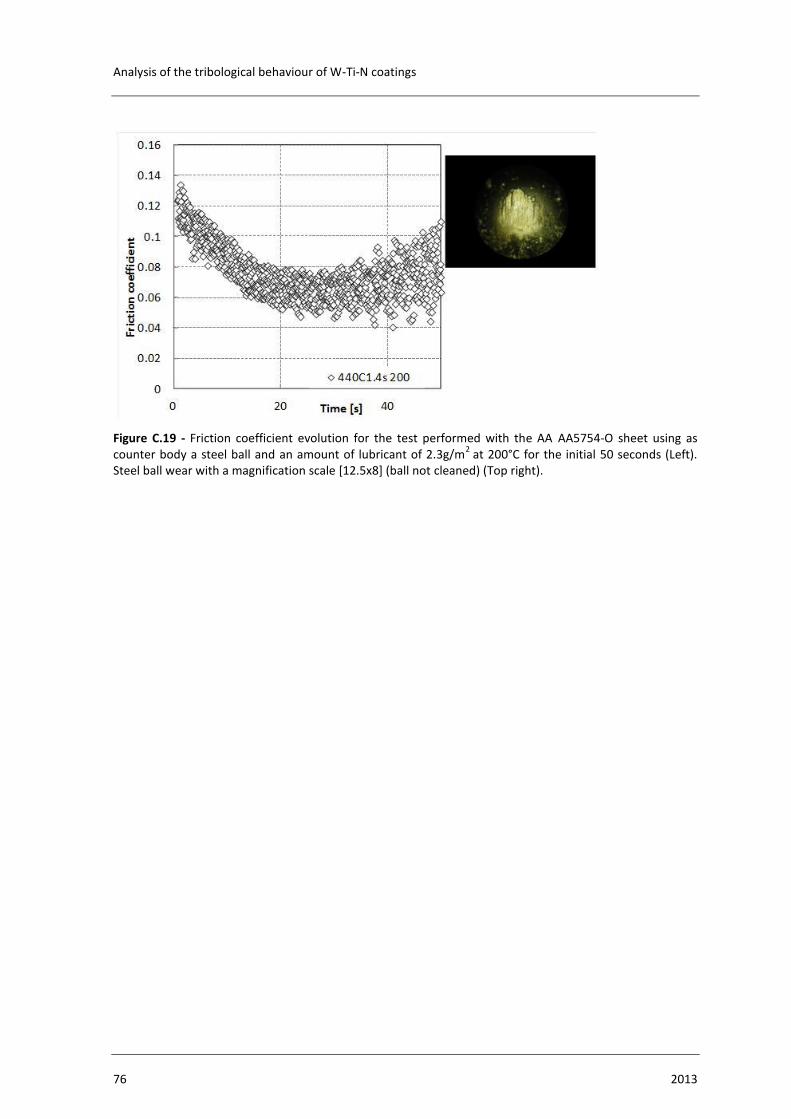
Analysis of the tribological behaviour of W-Ti-N coatings
76 2013
Figure C.19 - Friction coefficient evolution for the test performed with the AA AA5754-O sheet using as counter body a steel ball and an amount of lubricant of 2.3g/m
2 at 200°C for the initial 50 seconds (Left).
Steel ball wear with a magnification scale [12.5x8] (ball not cleaned) (Top right).
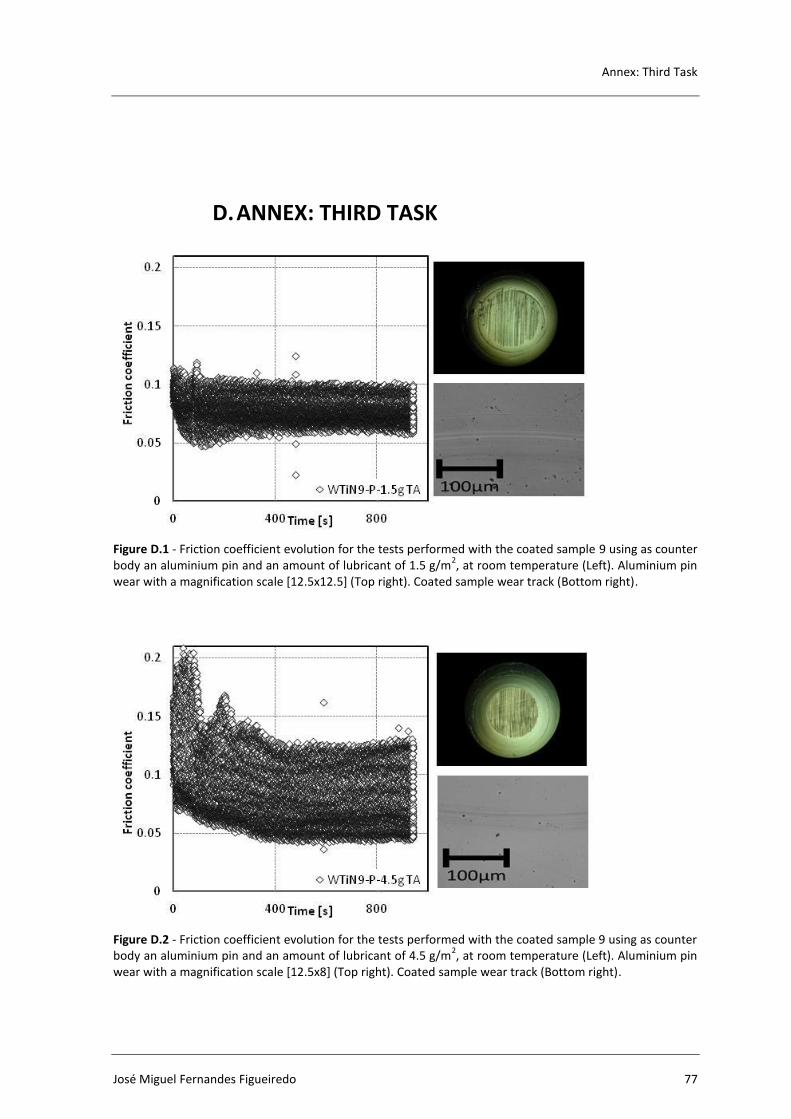
Annex: Third Task
José Miguel Fernandes Figueiredo 77
D. ANNEX: THIRD TASK
Figure D.1 - Friction coefficient evolution for the tests performed with the coated sample 9 using as counter body an aluminium pin and an amount of lubricant of 1.5 g/m
2, at room temperature (Left). Aluminium pin
wear with a magnification scale [12.5x12.5] (Top right). Coated sample wear track (Bottom right).
Figure D.2 - Friction coefficient evolution for the tests performed with the coated sample 9 using as counter body an aluminium pin and an amount of lubricant of 4.5 g/m
2, at room temperature (Left). Aluminium pin
wear with a magnification scale [12.5x8] (Top right). Coated sample wear track (Bottom right).
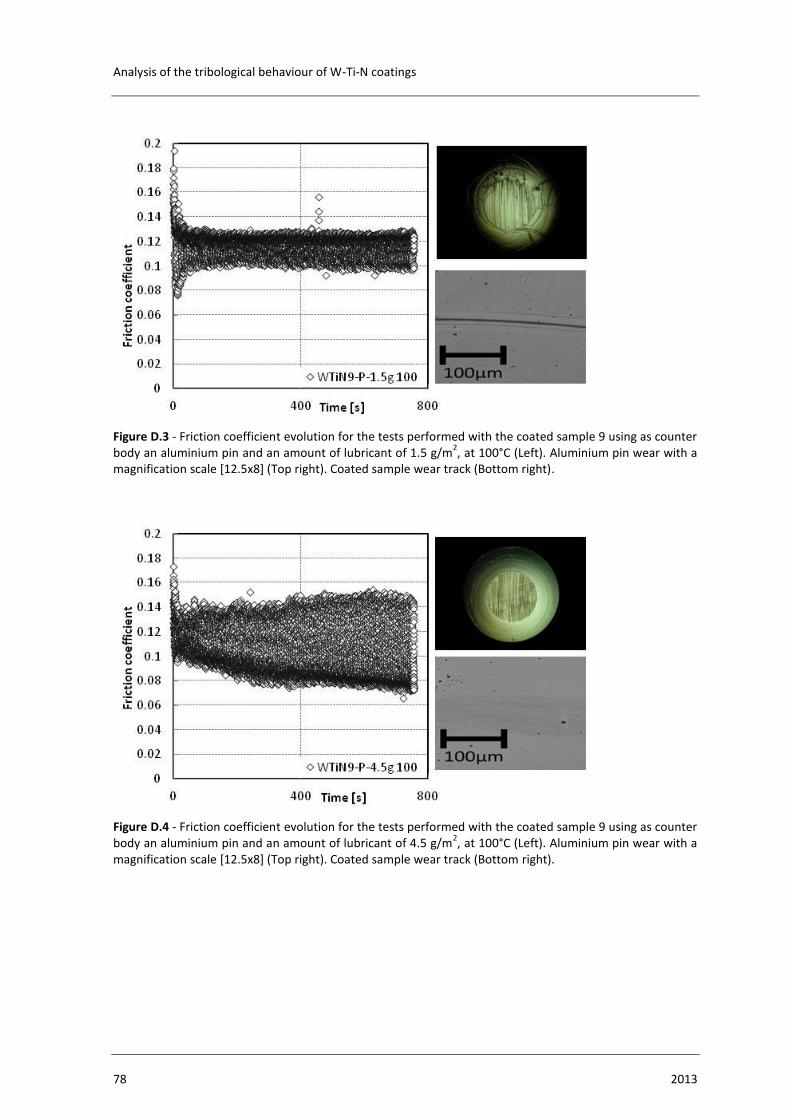
Analysis of the tribological behaviour of W-Ti-N coatings
78 2013
Figure D.3 - Friction coefficient evolution for the tests performed with the coated sample 9 using as counter body an aluminium pin and an amount of lubricant of 1.5 g/m
2, at 100°C (Left). Aluminium pin wear with a
magnification scale [12.5x8] (Top right). Coated sample wear track (Bottom right).
Figure D.4 - Friction coefficient evolution for the tests performed with the coated sample 9 using as counter body an aluminium pin and an amount of lubricant of 4.5 g/m
2, at 100°C (Left). Aluminium pin wear with a
magnification scale [12.5x8] (Top right). Coated sample wear track (Bottom right).
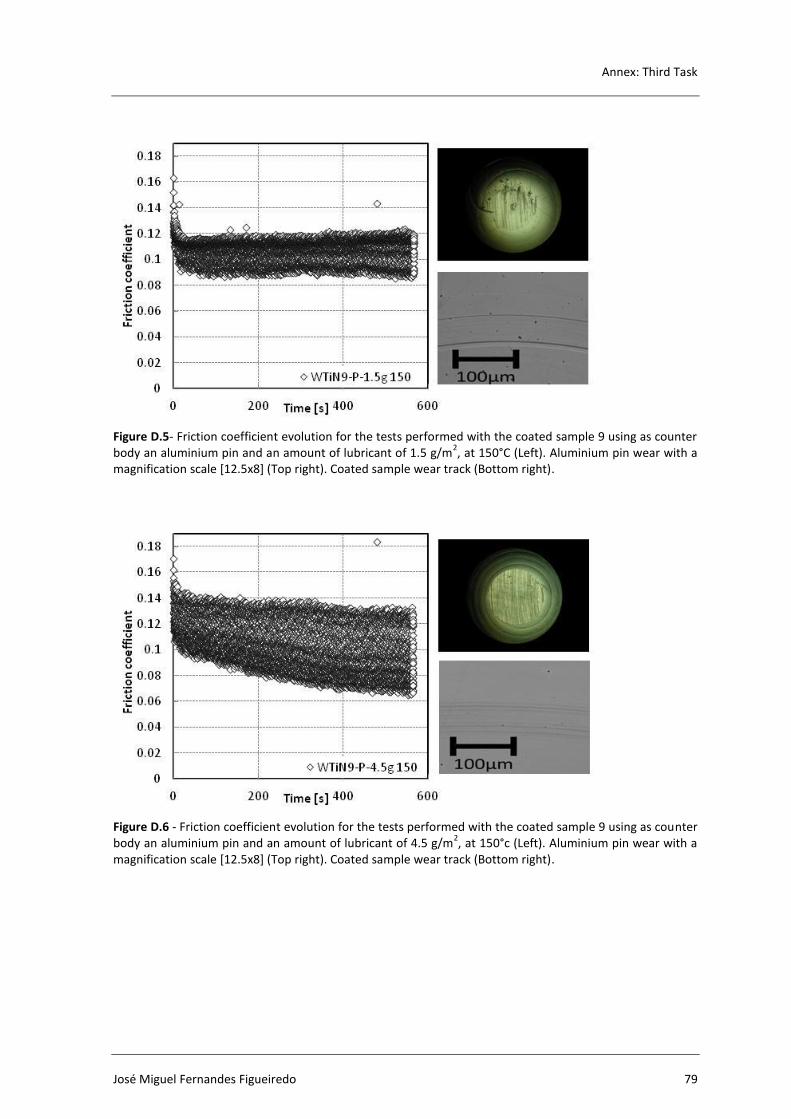
Annex: Third Task
José Miguel Fernandes Figueiredo 79
Figure D.5- Friction coefficient evolution for the tests performed with the coated sample 9 using as counter body an aluminium pin and an amount of lubricant of 1.5 g/m
2, at 150°C (Left). Aluminium pin wear with a
magnification scale [12.5x8] (Top right). Coated sample wear track (Bottom right).
Figure D.6 - Friction coefficient evolution for the tests performed with the coated sample 9 using as counter body an aluminium pin and an amount of lubricant of 4.5 g/m
2, at 150°c (Left). Aluminium pin wear with a
magnification scale [12.5x8] (Top right). Coated sample wear track (Bottom right).
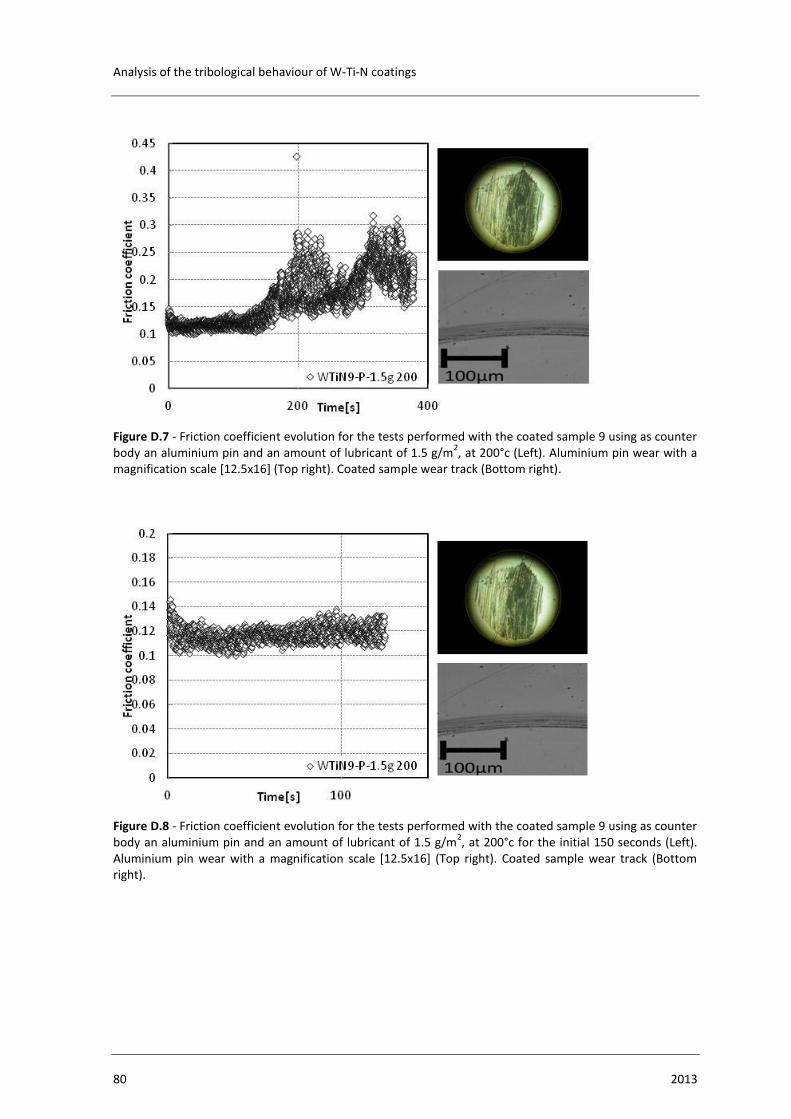
Analysis of the tribological behaviour of W-Ti-N coatings
80 2013
Figure D.7 - Friction coefficient evolution for the tests performed with the coated sample 9 using as counter body an aluminium pin and an amount of lubricant of 1.5 g/m
2, at 200°c (Left). Aluminium pin wear with a
magnification scale [12.5x16] (Top right). Coated sample wear track (Bottom right).
Figure D.8 - Friction coefficient evolution for the tests performed with the coated sample 9 using as counter body an aluminium pin and an amount of lubricant of 1.5 g/m
2, at 200°c for the initial 150 seconds (Left).
Aluminium pin wear with a magnification scale [12.5x16] (Top right). Coated sample wear track (Bottom right).
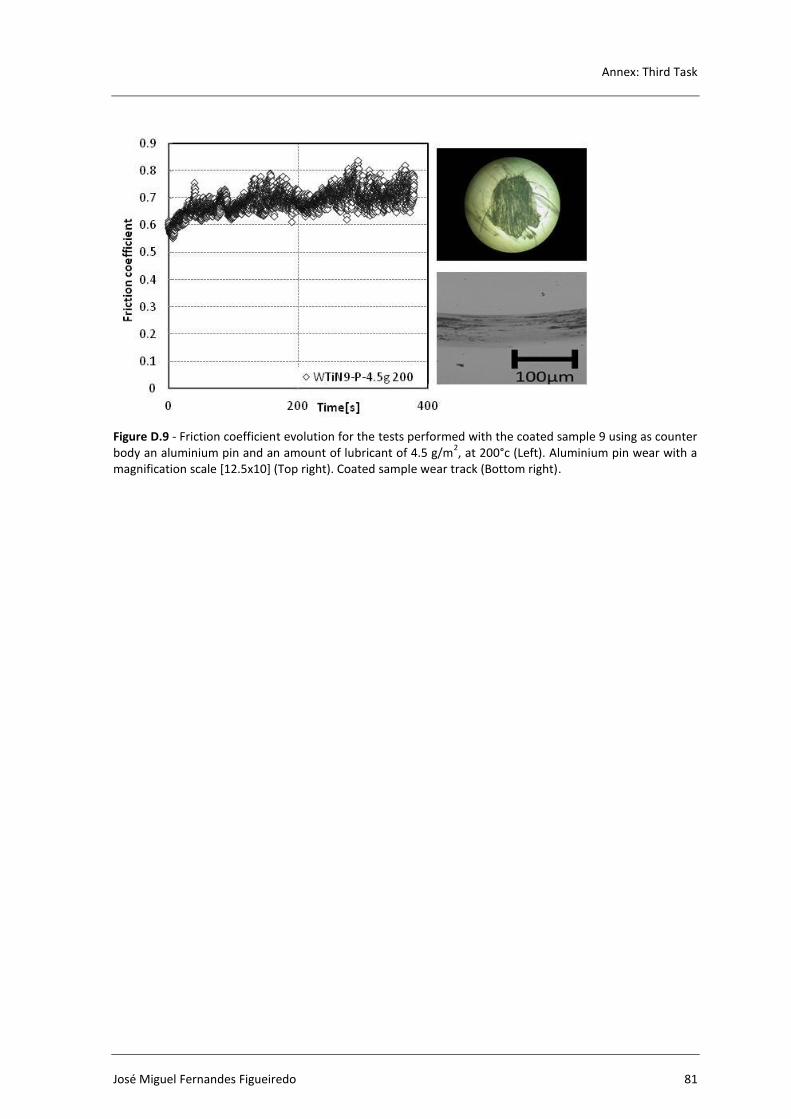
Annex: Third Task
José Miguel Fernandes Figueiredo 81
Figure D.9 - Friction coefficient evolution for the tests performed with the coated sample 9 using as counter body an aluminium pin and an amount of lubricant of 4.5 g/m
2, at 200°c (Left). Aluminium pin wear with a
magnification scale [12.5x10] (Top right). Coated sample wear track (Bottom right).

Analysis of the tribological behaviour of W-Ti-N coatings
82 2013
Recommended