Sepura Plc
Analyst Lunch
8 July 2014
2
1. The PMR market
2. Sepura’s position in the market
3. The opportunity
4. Financials
5. Conclusion
6. Q&A
2

3
1. The PMR market
2. Sepura’s position in the market
3. The opportunity
4. Financials
5. Conclusion
6. Q&A
3
4
0
104
180
63
144
198
142
193
227
151
169
191
190
220
239
190
220
239
192
192
192
237
186
30
0
71
156
0
178
89
0
130
200
253
187
48
Apps
Terminals
Systems
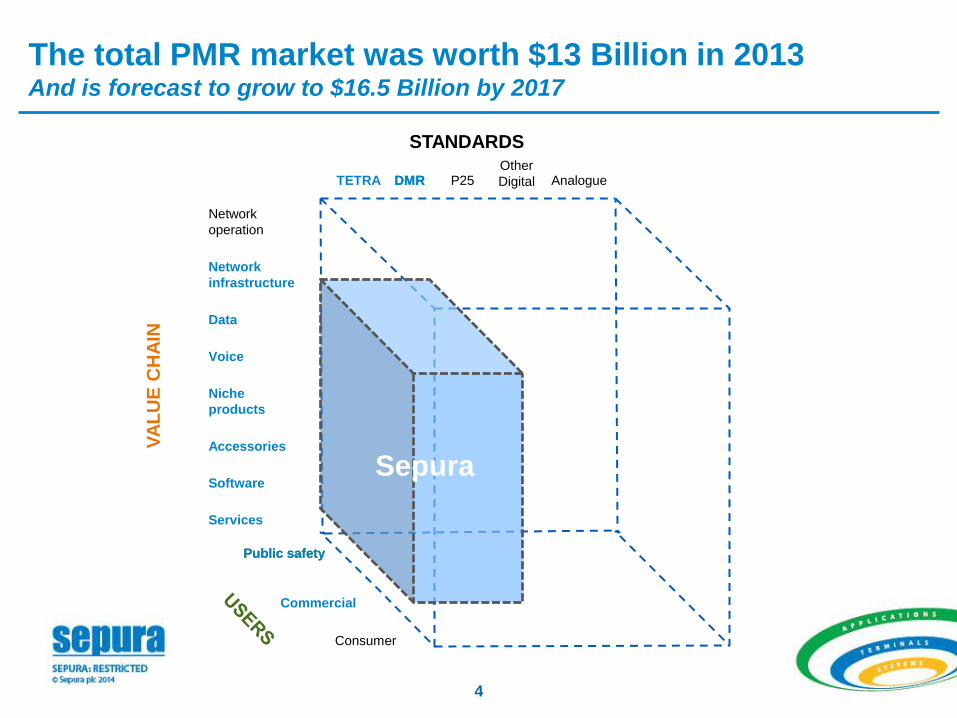
STANDARDS
TETRA DMR Analogue P25 Other
Digital
VA
LU
E C
HA
IN
Network
operation
Network
infrastructure
Voice
Data
Accessories
Software
Services
Niche
products
Commercial
Consumer
Public safety
The total PMR market was worth $13 Billion in 2013 And is forecast to grow to $16.5 Billion by 2017
STANDARDS
TETRA DMR Analogue P25 Other
Digital
VA
LU
E C
HA
IN
Network
operation
Network
infrastructure
Voice
Data
Accessories
Software
Services
Niche
products
Commercial
Consumer
Public safety
Sepura
0
104
180
63
144
198
142
193
227
151
169
191
190
220
239
190
220
239
192
192
192
237
186
30
0
71
156
0
178
89
0
130
200
253
187
48
Apps
Terminals
Systems
5
Analogue
Digital
6,000
5,000
4,000
3,000
2,000
1,000
0 09 10 11 12 13 14 15 16 17
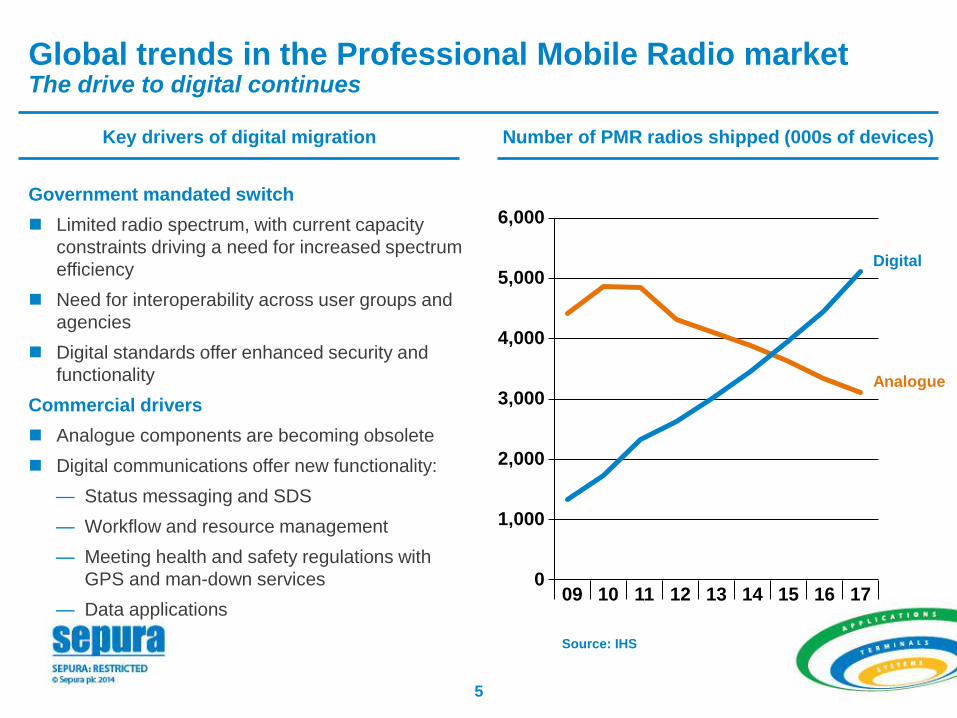
Source: IHS
Global trends in the Professional Mobile Radio market The drive to digital continues
Key drivers of digital migration Number of PMR radios shipped (000s of devices)
Government mandated switch
Limited radio spectrum, with current capacity
constraints driving a need for increased spectrum
efficiency
Need for interoperability across user groups and
agencies
Digital standards offer enhanced security and
functionality
Commercial drivers
Analogue components are becoming obsolete
Digital communications offer new functionality:
— Status messaging and SDS
— Workflow and resource management
— Meeting health and safety regulations with
GPS and man-down services
— Data applications
0
104
180
63
144
198
142
193
227
151
169
191
190
220
239
190
220
239
192
192
192
237
186
30
0
71
156
0
178
89
0
130
200
253
187
48
Apps
Terminals
Systems
6
Analogue
60,000
50,000
40,000
30,000
20,000
10,000
0 09 10 11 12 13 14 15 16 17
Source: IHS
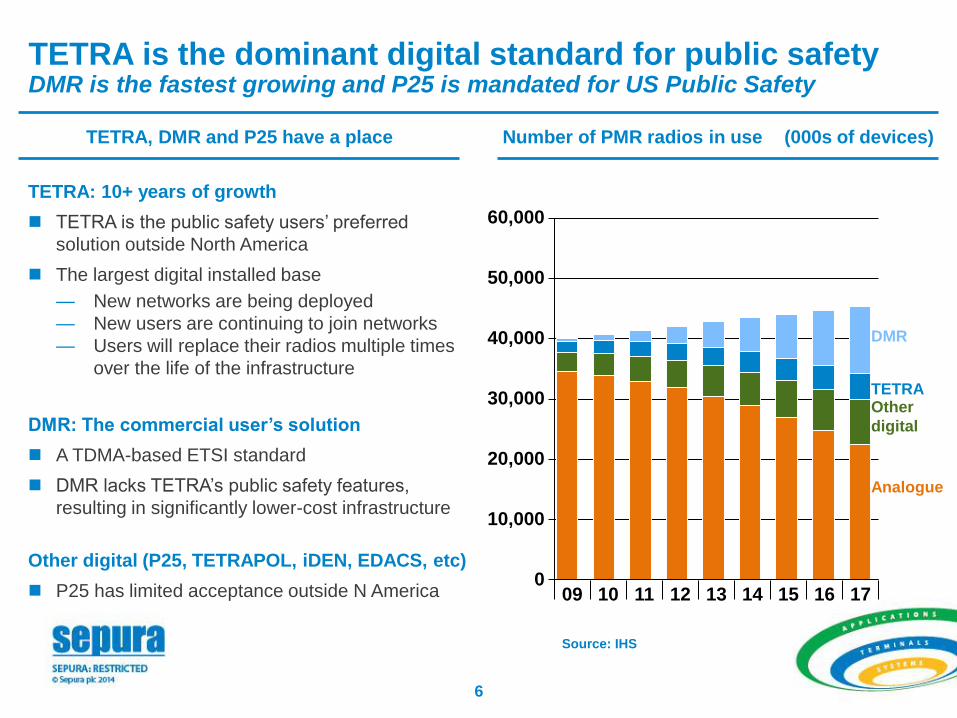
TETRA, DMR and P25 have a place
TETRA is the dominant digital standard for public safety DMR is the fastest growing and P25 is mandated for US Public Safety
Number of PMR radios shipped (000s of devices) in use
DMR
Other
digital
TETRA
TETRA: 10+ years of growth
TETRA is the public safety users’ preferred
solution outside North America
The largest digital installed base
— New networks are being deployed
— New users are continuing to join networks
— Users will replace their radios multiple times
over the life of the infrastructure
DMR: The commercial user’s solution
A TDMA-based ETSI standard
DMR lacks TETRA’s public safety features,
resulting in significantly lower-cost infrastructure
Other digital (P25, TETRAPOL, iDEN, EDACS, etc)
P25 has limited acceptance outside N America
7
0
104
180
63
144
198
142
193
227
151
169
191
190
220
239
190
220
239
192
192
192
237
186
30
0
71
156
0
178
89
0
130
200
253
187
48
Apps
Terminals
Systems
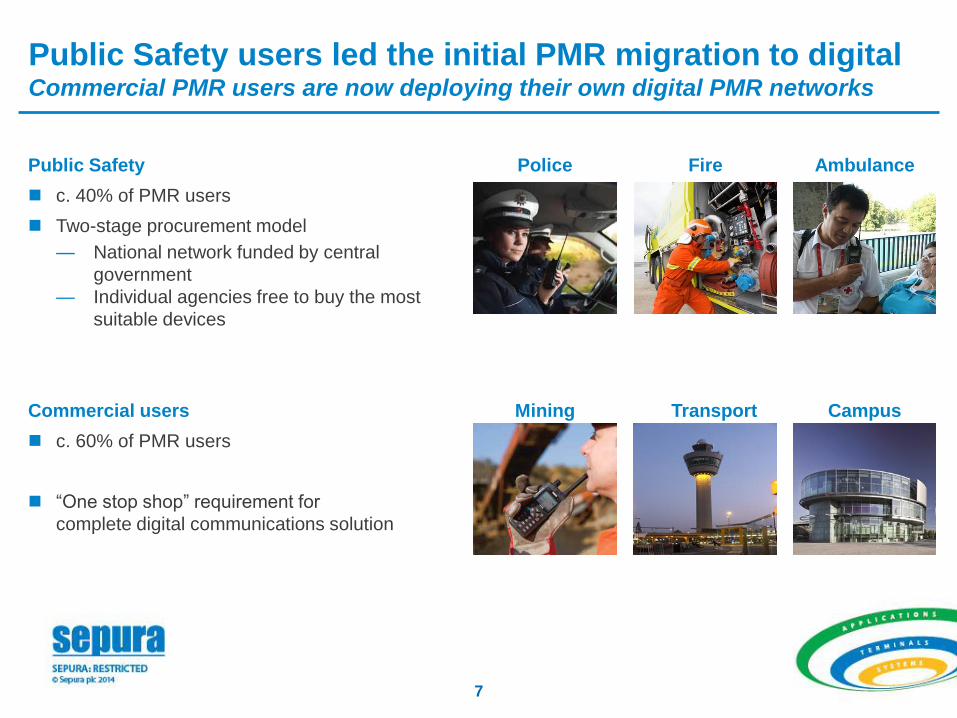
Public Safety users led the initial PMR migration to digital Commercial PMR users are now deploying their own digital PMR networks
Public Safety
c. 40% of PMR users
Two-stage procurement model
— National network funded by central
government
— Individual agencies free to buy the most
suitable devices
Police Fire Ambulance
Mining Commercial users
c. 60% of PMR users
“One stop shop” requirement for
complete digital communications solution
Campus Transport

8
1. The PMR market
2. Sepura’s position in the market
3. The opportunity
4. Financials
5. Conclusion
6. Q&A
8
9
0
104
180
63
144
198
142
193
227
151
169
191
190
220
239
190
220
239
192
192
192
237
186
30
0
71
156
0
178
89
0
130
200
253
187
48
Apps
Terminals
Systems
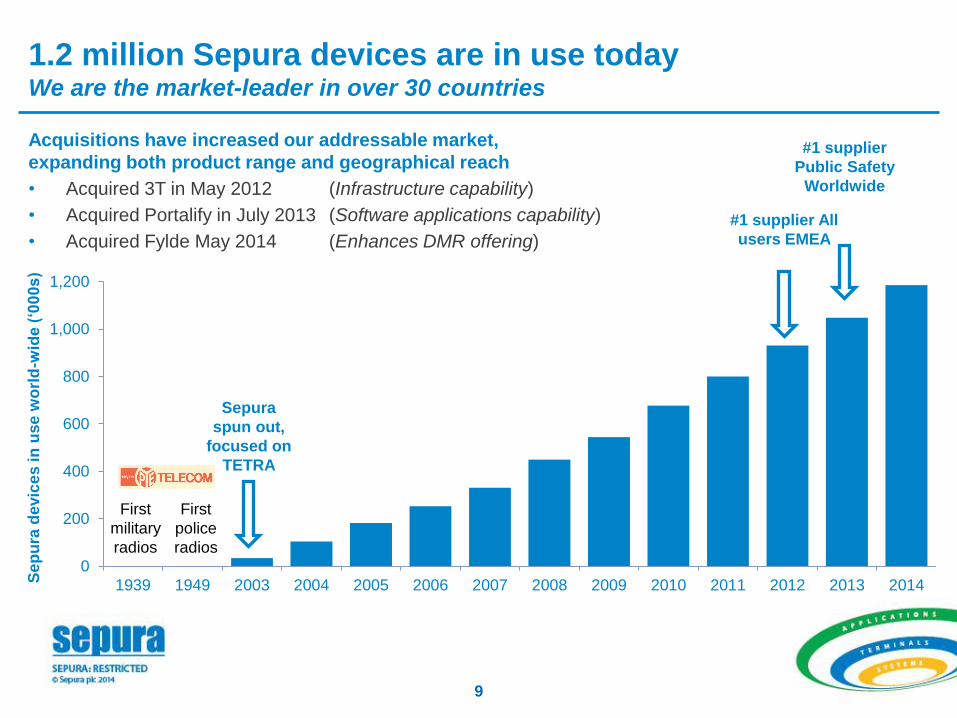
1.2 million Sepura devices are in use today We are the market-leader in over 30 countries
0
200
400
600
800
1,000
1,200
1939 1949 2003 2004 2005 2006 2007 2008 2009 2010 2011 2012 2013 2014
First
military
radios
First
police
radios
Se
pu
ra d
evic
es
in
use
wo
rld
-wid
e (
‘00
0s
)
Sepura
spun out,
focused on
TETRA
#1 supplier
Public Safety
Worldwide
#1 supplier All
users EMEA
Acquisitions have increased our addressable market,
expanding both product range and geographical reach
• Acquired 3T in May 2012 (Infrastructure capability)
• Acquired Portalify in July 2013 (Software applications capability)
• Acquired Fylde May 2014 (Enhances DMR offering)
0
104
180
63
144
198
142
193
227
151
169
191
190
220
239
190
220
239
192
192
192
237
186
30
0
71
156
0
178
89
0
130
200
253
187
48
Apps
Terminals
Systems
10
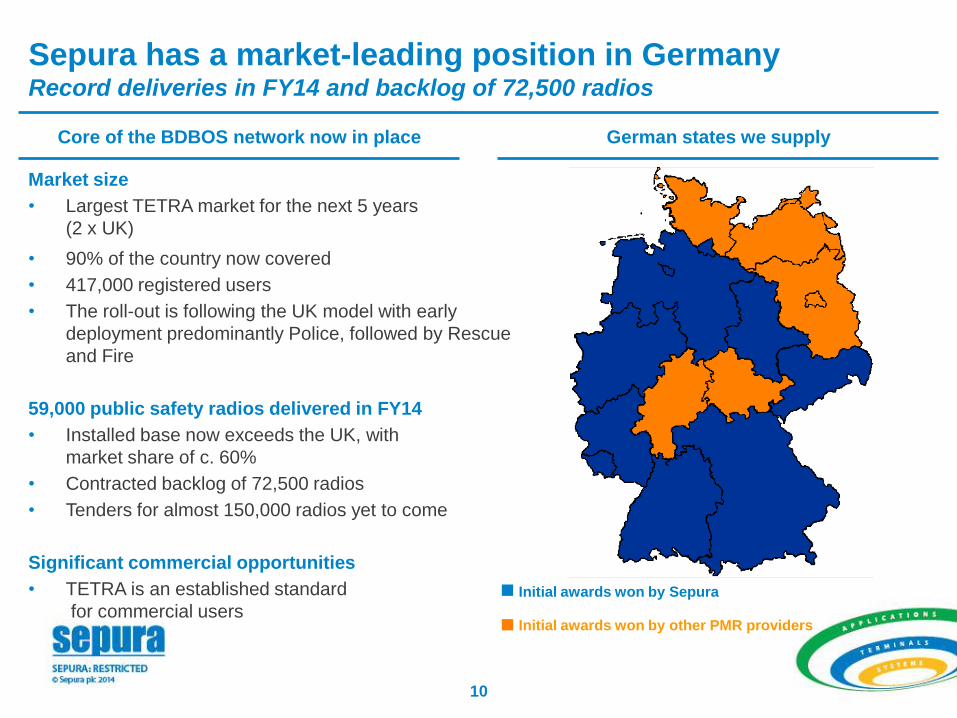
Sepura has a market-leading position in Germany Record deliveries in FY14 and backlog of 72,500 radios
Core of the BDBOS network now in place
German states we supply
Initial awards won by Sepura
Initial awards won by other PMR providers
Market size
• Largest TETRA market for the next 5 years
(2 x UK)
• 90% of the country now covered
• 417,000 registered users
• The roll-out is following the UK model with early
deployment predominantly Police, followed by Rescue
and Fire
59,000 public safety radios delivered in FY14
• Installed base now exceeds the UK, with
market share of c. 60%
• Contracted backlog of 72,500 radios
• Tenders for almost 150,000 radios yet to come
Significant commercial opportunities
• TETRA is an established standard
for commercial users
0
104
180
63
144
198
142
193
227
151
169
191
190
220
239
190
220
239
192
192
192
237
186
30
0
71
156
0
178
89
0
130
200
253
187
48
Apps
Terminals
Systems
11
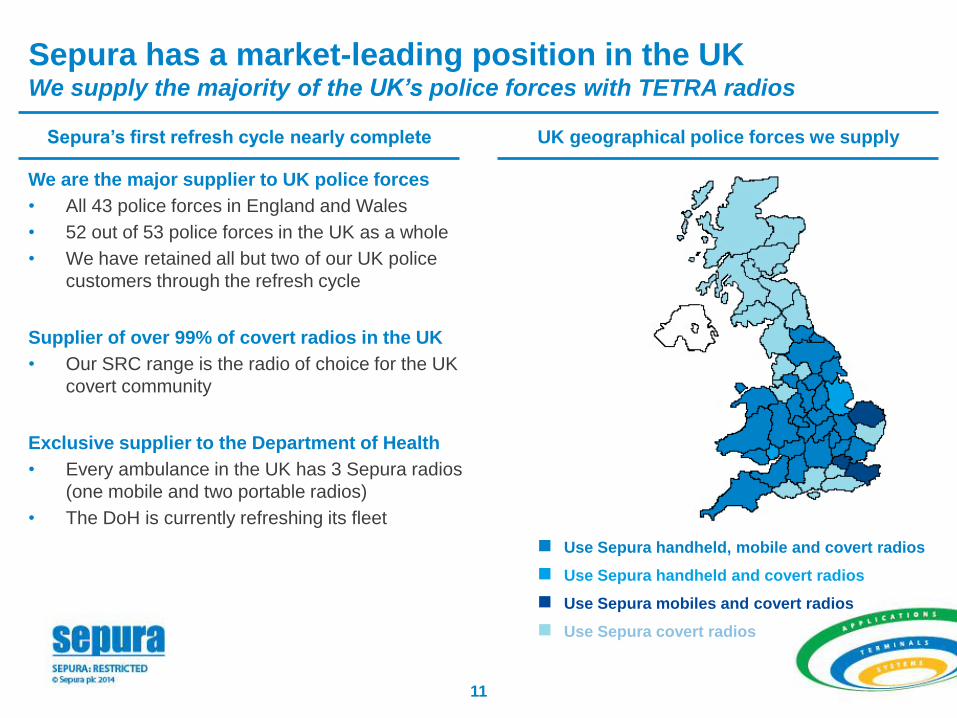
Sepura has a market-leading position in the UK We supply the majority of the UK’s police forces with TETRA radios
Sepura’s first refresh cycle nearly complete UK geographical police forces we supply
We are the major supplier to UK police forces
• All 43 police forces in England and Wales
• 52 out of 53 police forces in the UK as a whole
• We have retained all but two of our UK police
customers through the refresh cycle
Supplier of over 99% of covert radios in the UK
• Our SRC range is the radio of choice for the UK
covert community
Exclusive supplier to the Department of Health
• Every ambulance in the UK has 3 Sepura radios
(one mobile and two portable radios)
• The DoH is currently refreshing its fleet
Use Sepura handheld, mobile and covert radios
Use Sepura mobiles and covert radios
Use Sepura covert radios
Use Sepura handheld and covert radios
0
104
180
63
144
198
142
193
227
151
169
191
190
220
239
190
220
239
192
192
192
237
186
30
0
71
156
0
178
89
0
130
200
253
187
48
Apps
Terminals
Systems
12
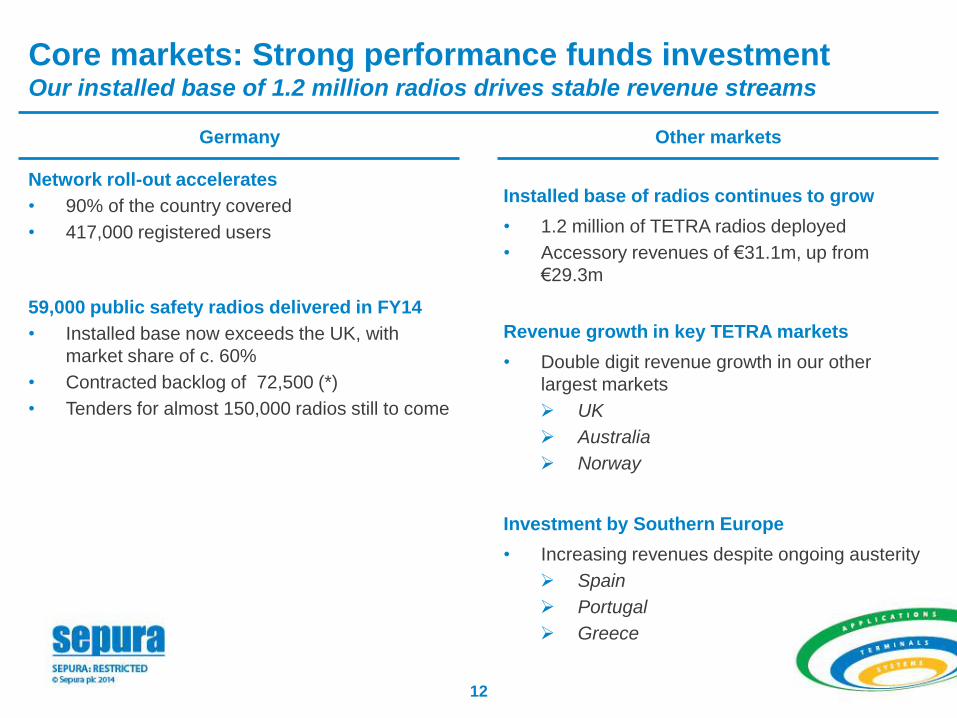
Core markets: Strong performance funds investment Our installed base of 1.2 million radios drives stable revenue streams
Germany
Other markets
Network roll-out accelerates
• 90% of the country covered
• 417,000 registered users
59,000 public safety radios delivered in FY14
• Installed base now exceeds the UK, with
market share of c. 60%
• Contracted backlog of 72,500 (*)
• Tenders for almost 150,000 radios still to come
Installed base of radios continues to grow
• 1.2 million of TETRA radios deployed
• Accessory revenues of €31.1m, up from
€29.3m
Revenue growth in key TETRA markets
• Double digit revenue growth in our other
largest markets
UK
Australia
Norway
Investment by Southern Europe
• Increasing revenues despite ongoing austerity
Spain
Portugal
Greece
0
104
180
63
144
198
142
193
227
151
169
191
190
220
239
190
220
239
192
192
192
237
186
30
0
71
156
0
178
89
0
130
200
253
187
48
Apps
Terminals
Systems
13
STANDARDS
TETRA DMR Analogue P25 Other
Digital
VA
LU
E C
HA
IN
Network
operation
Network
infrastructure
Voice
Data
Accessories
Software
Services
Niche
products
Commercial
Consumer
Public safety
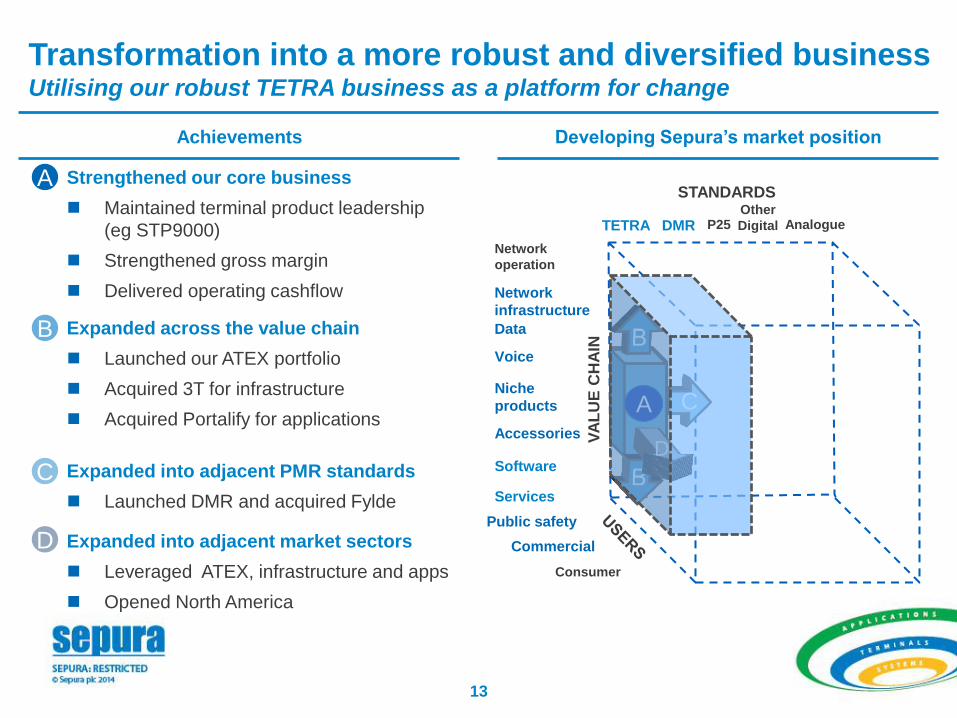
Achievements Developing Sepura’s market position
Transformation into a more robust and diversified business Utilising our robust TETRA business as a platform for change
Strengthened our core business
Maintained terminal product leadership
(eg STP9000)
Strengthened gross margin
Delivered operating cashflow
A
A
Expanded into adjacent PMR standards
Launched DMR and acquired Fylde
C
DMR
A C
Expanded across the value chain
Launched our ATEX portfolio
Acquired 3T for infrastructure
Acquired Portalify for applications
B
Software
Services
A
Data
Network
infrastructure
D Expanded into adjacent market sectors
Leveraged ATEX, infrastructure and apps
Opened North America
D
Commercial
14
0
104
180
63
144
198
142
193
227
151
169
191
190
220
239
190
220
239
192
192
192
237
186
30
0
71
156
0
178
89
0
130
200
253
187
48
Apps
Terminals
Systems
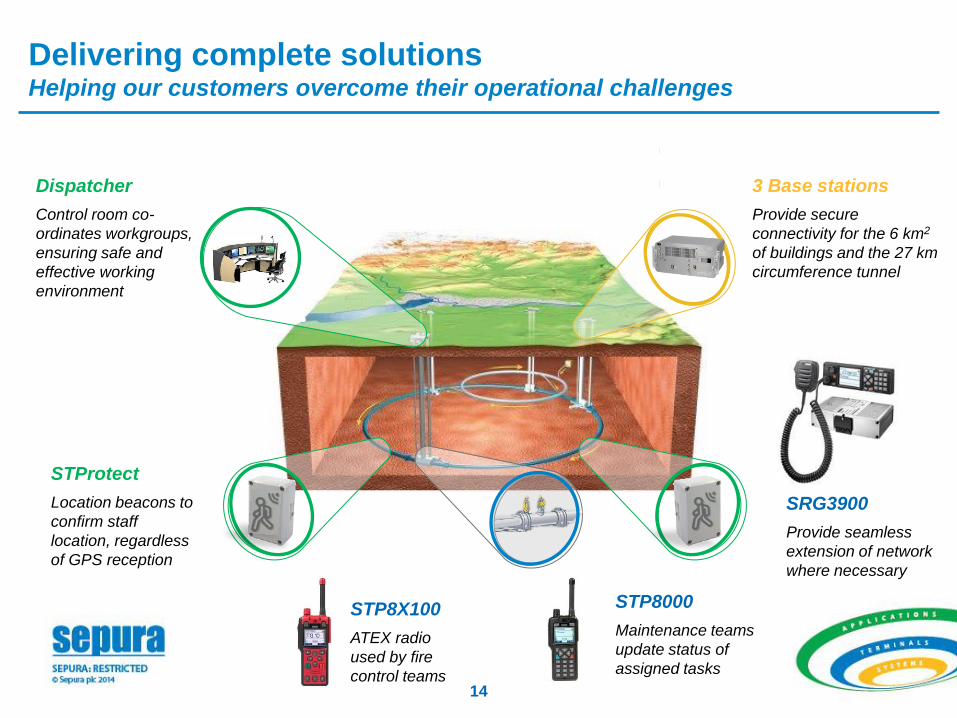
6 km2 of buildings
27 km circumference
tunnel,
50 - 175m below ground
Complex magnetic
environment
Delivering complete solutions Helping our customers overcome their operational challenges
STP8000
Maintenance teams
update status of
assigned tasks
SRG3900
Provide seamless
extension of network
where necessary
STP8X100
ATEX radio
used by fire
control teams
3 Base stations
Provide secure
connectivity for the 6 km2
of buildings and the 27 km
circumference tunnel
Dispatcher
Control room co-
ordinates workgroups,
ensuring safe and
effective working
environment
STProtect
Location beacons to
confirm staff
location, regardless
of GPS reception
0
104
180
63
144
198
142
193
227
151
169
191
190
220
239
190
220
239
192
192
192
237
186
30
0
71
156
0
178
89
0
130
200
253
187
48
Apps
Terminals
Systems
15
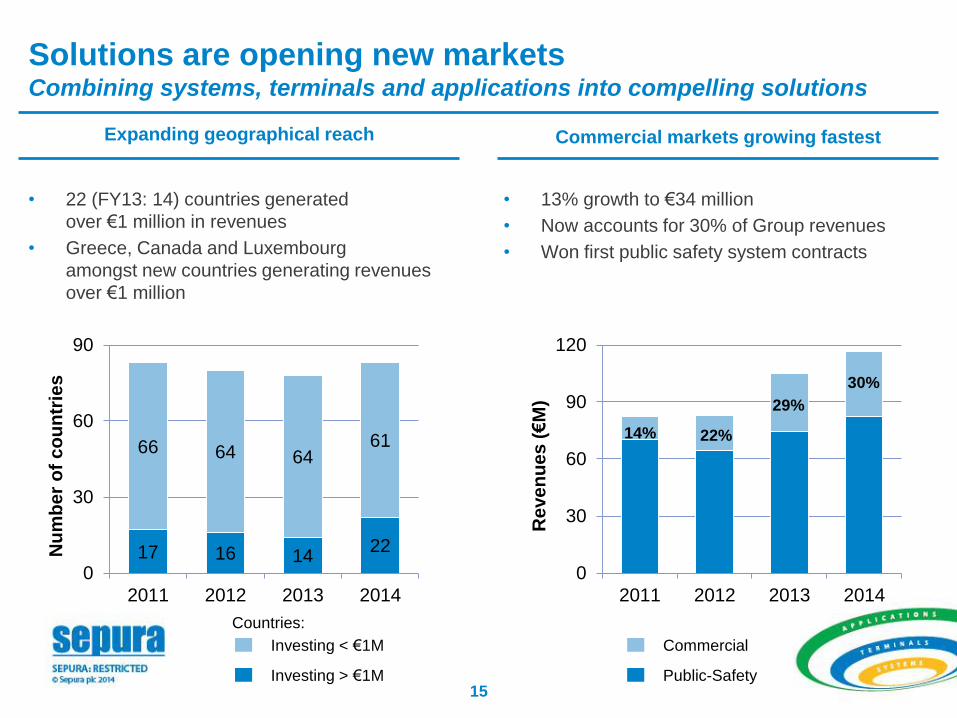
Commercial markets growing fastest
• 22 (FY13: 14) countries generated
over €1 million in revenues
• Greece, Canada and Luxembourg
amongst new countries generating revenues
over €1 million
Expanding geographical reach
• 13% growth to €34 million
• Now accounts for 30% of Group revenues
• Won first public safety system contracts
Investing < €1M
Investing > €1M
Commercial
Public-Safety
Re
ve
nu
es
(€M
)
0
30
60
90
120
2011 2012 2013 2014
29%
30%
22%
17 16 14 22
66 64 64 61
0
30
60
90
2011 2012 2013 2014
Nu
mb
er
of
co
un
trie
s
Solutions are opening new markets Combining systems, terminals and applications into compelling solutions
Countries:
14%
16
0
104
180
63
144
198
142
193
227
151
169
191
190
220
239
190
220
239
192
192
192
237
186
30
0
71
156
0
178
89
0
130
200
253
187
48
Apps
Terminals
Systems
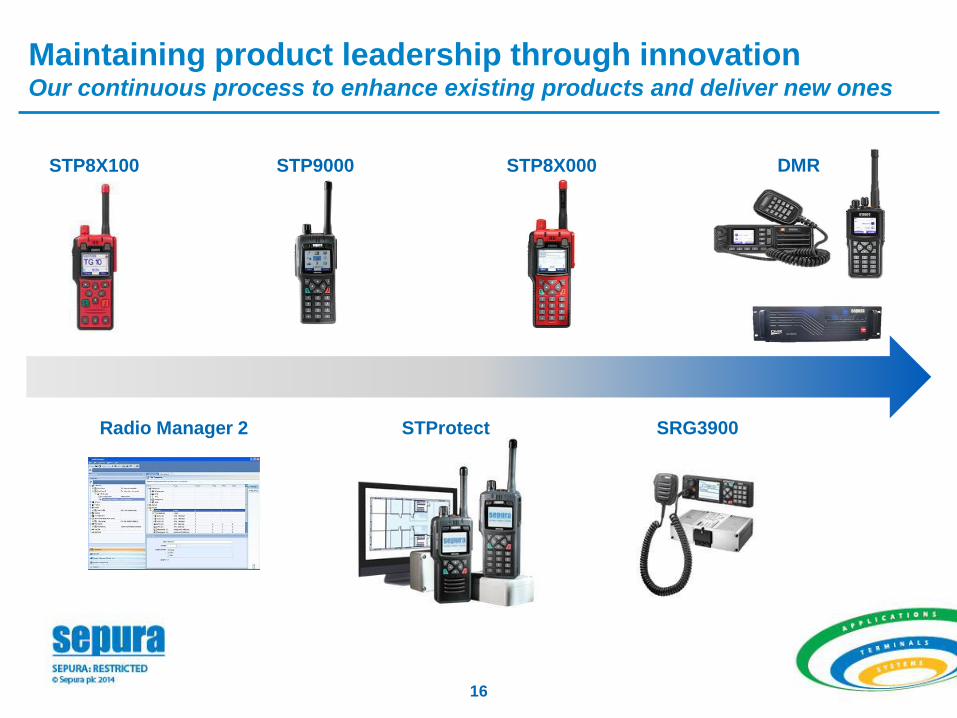
STProtect
STP8X000 STP9000 STP8X100
Radio Manager 2 SRG3900
Maintaining product leadership through innovation Our continuous process to enhance existing products and deliver new ones
DMR

17
1. The PMR market
2. Sepura’s position in the market
3. The opportunity
4. Financials
5. Conclusion
6. Q&A
17
18
0
104
180
63
144
198
142
193
227
151
169
191
190
220
239
190
220
239
192
192
192
237
186
30
0
71
156
0
178
89
0
130
200
253
187
48
Apps
Terminals
Systems
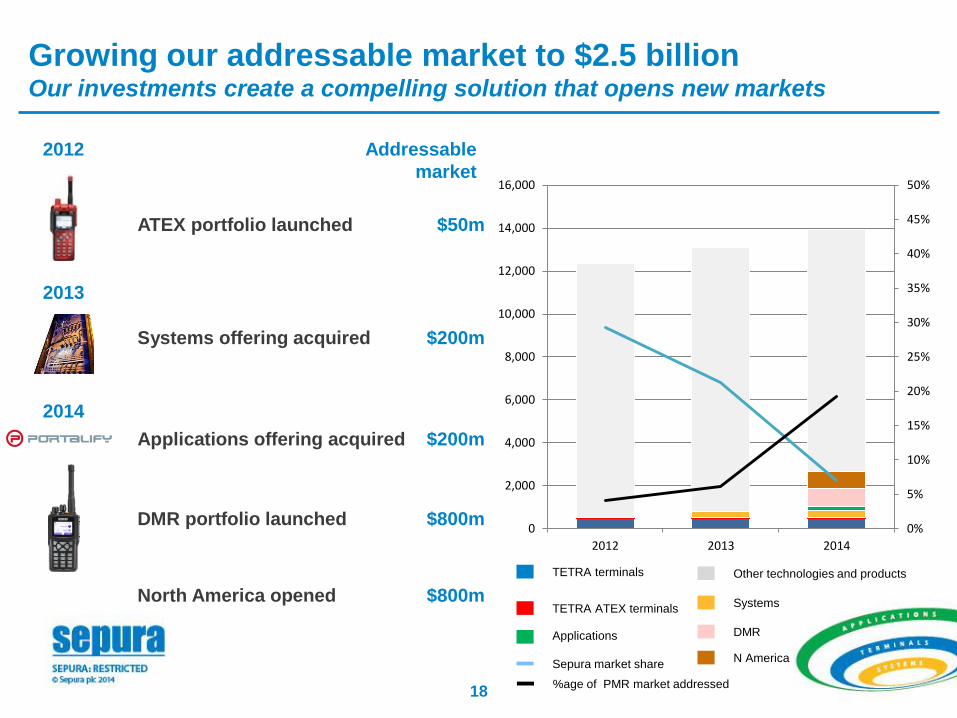
ATEX portfolio launched $50m
2012 Addressable
market
Systems offering acquired $200m
2013
Applications offering acquired $200m
2014
DMR portfolio launched $800m
North America opened $800m
Growing our addressable market to $2.5 billion Our investments create a compelling solution that opens new markets
0%
5%
10%
15%
20%
25%
30%
35%
40%
45%
50%
0
2,000
4,000
6,000
8,000
10,000
12,000
14,000
16,000
2012 2013 2014
DMR
TETRA terminals Other technologies and products
Applications
Sepura market share
Systems TETRA ATEX terminals
%age of PMR market addressed
N America
0
104
180
63
144
198
142
193
227
151
169
191
190
220
239
190
220
239
192
192
192
237
186
30
0
71
156
0
178
89
0
130
200
253
187
48
Apps
Terminals
Systems
19
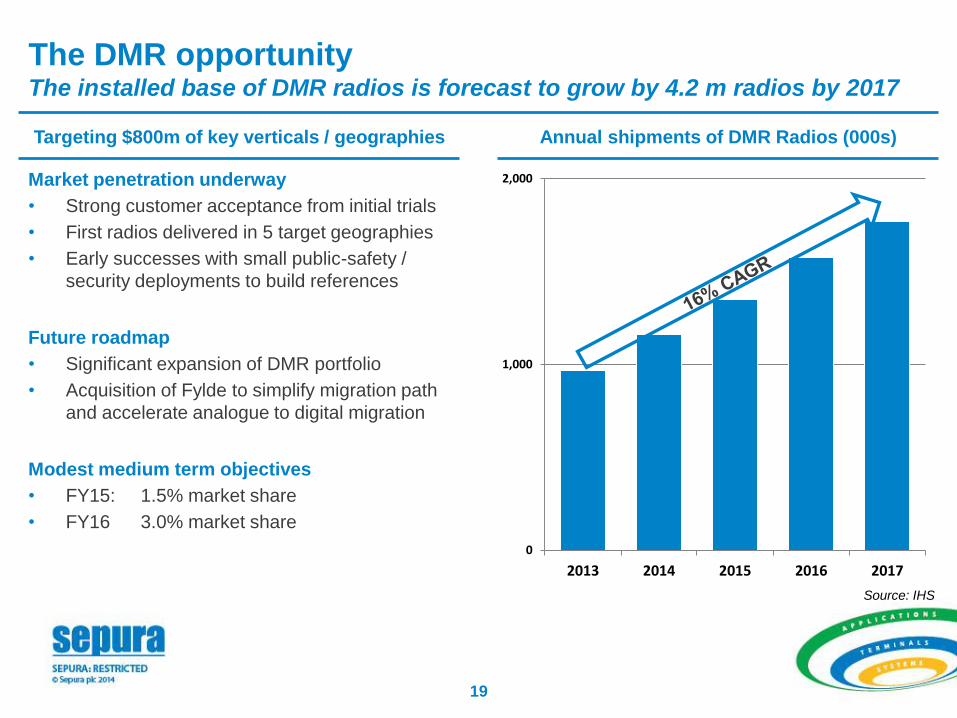
The DMR opportunity The installed base of DMR radios is forecast to grow by 4.2 m radios by 2017
0
1,000
2,000
2013 2014 2015 2016 2017
Annual shipments of DMR Radios (000s)
Market penetration underway
• Strong customer acceptance from initial trials
• First radios delivered in 5 target geographies
• Early successes with small public-safety /
security deployments to build references
Future roadmap
• Significant expansion of DMR portfolio
• Acquisition of Fylde to simplify migration path
and accelerate analogue to digital migration
Modest medium term objectives
• FY15: 1.5% market share
• FY16 3.0% market share
Targeting $800m of key verticals / geographies
Source: IHS
0
104
180
63
144
198
142
193
227
151
169
191
190
220
239
190
220
239
192
192
192
237
186
30
0
71
156
0
178
89
0
130
200
253
187
48
Apps
Terminals
Systems
20
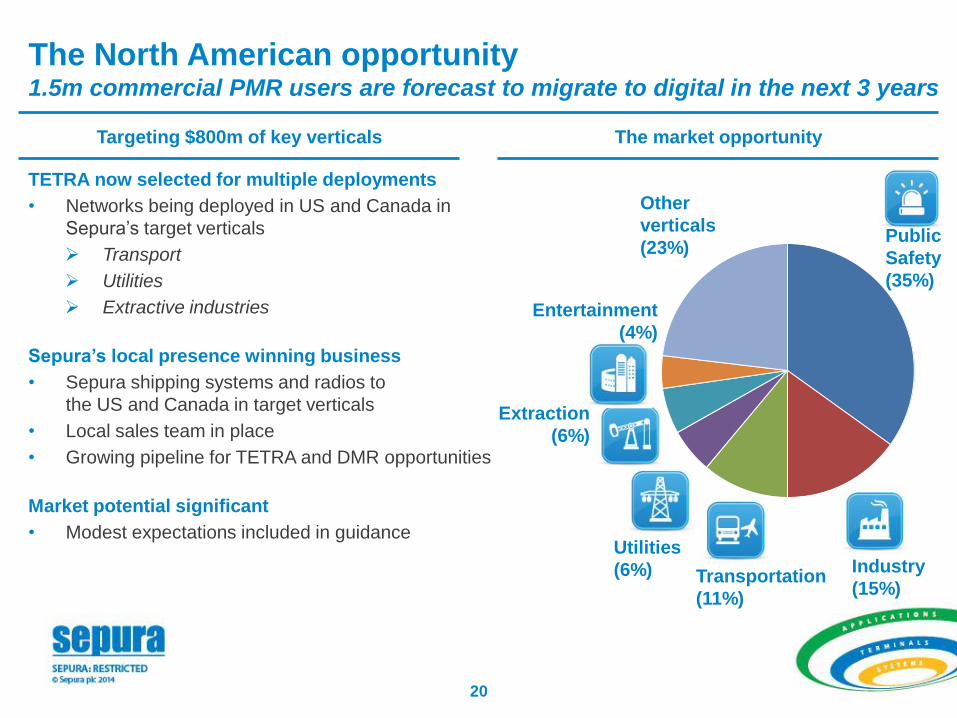
The North American opportunity 1.5m commercial PMR users are forecast to migrate to digital in the next 3 years
The market opportunity Targeting $800m of key verticals
Extraction
(6%)
Utilities
(6%) Transportation
(11%)
Public
Safety
(35%)
Industry
(15%)
Entertainment
(4%)
Other
verticals
(23%)
TETRA now selected for multiple deployments
• Networks being deployed in US and Canada in
Sepura’s target verticals
Transport
Utilities
Extractive industries
Sepura’s local presence winning business
• Sepura shipping systems and radios to
the US and Canada in target verticals
• Local sales team in place
• Growing pipeline for TETRA and DMR opportunities
Market potential significant
• Modest expectations included in guidance

21
1. The PMR market
2. Sepura’s position in the market
3. The opportunity
4. Financials
5. Conclusion
6. Q&A
21
22
0
104
180
63
144
198
142
193
227
151
169
191
190
220
239
190
220
239
192
192
192
237
186
30
0
71
156
0
178
89
0
130
200
253
187
48
Apps
Terminals
Systems
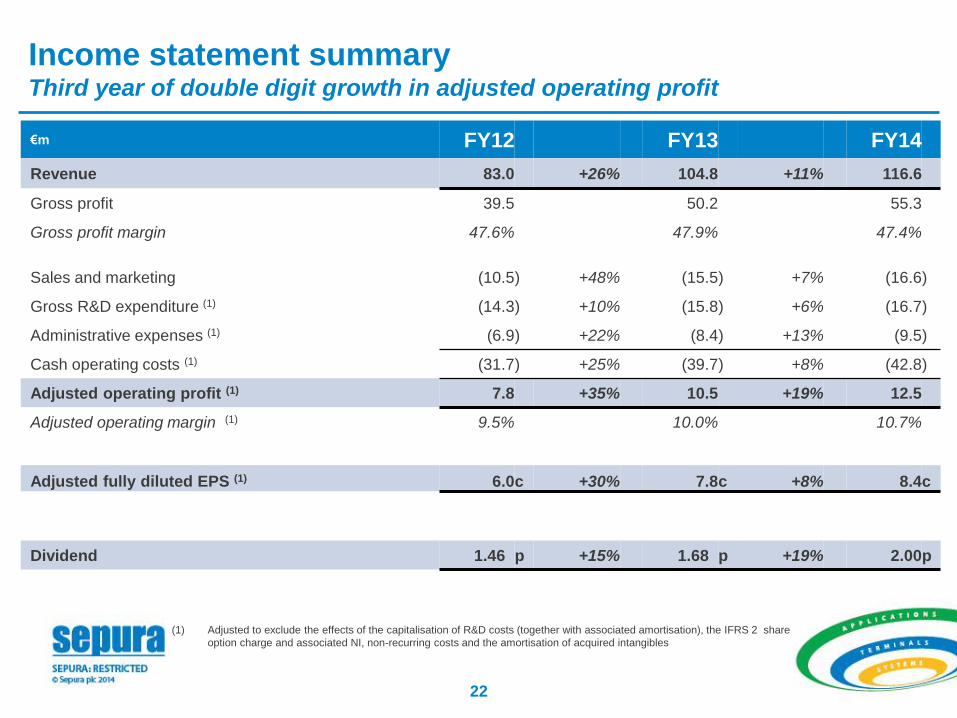
€m FY12 FY13 FY14
Revenue 83.0 +26% 104.8 +11% 116.6
Gross profit 39.5 50.2 55.3
Gross profit margin 47.6% 47.9% 47.4%
Sales and marketing (10.5 ) +48% (15.5 ) +7% (16.6 )
Gross R&D expenditure (1) (14.3 ) +10% (15.8 ) +6% (16.7 )
Administrative expenses (1) (6.9 ) +22% (8.4 ) +13% (9.5 )
Cash operating costs (1) (31.7 ) +25% (39.7 ) +8% (42.8 )
Adjusted operating profit (1) 7.8 +35% 10.5 +19% 12.5
Adjusted operating margin (1) 9.5% 10.0% 10.7%
Adjusted fully diluted EPS (1) 6.0 c +30% 7.8 c +8% 8.4 c
Dividend 1.46 p +15% 1.68 p +19% 2.00 p
(1) Adjusted to exclude the effects of the capitalisation of R&D costs (together with associated amortisation), the IFRS 2 share
option charge and associated NI, non-recurring costs and the amortisation of acquired intangibles
Income statement summary Third year of double digit growth in adjusted operating profit
23
0
104
180
63
144
198
142
193
227
151
169
191
190
220
239
190
220
239
192
192
192
237
186
30
0
71
156
0
178
89
0
130
200
253
187
48
Apps
Terminals
Systems
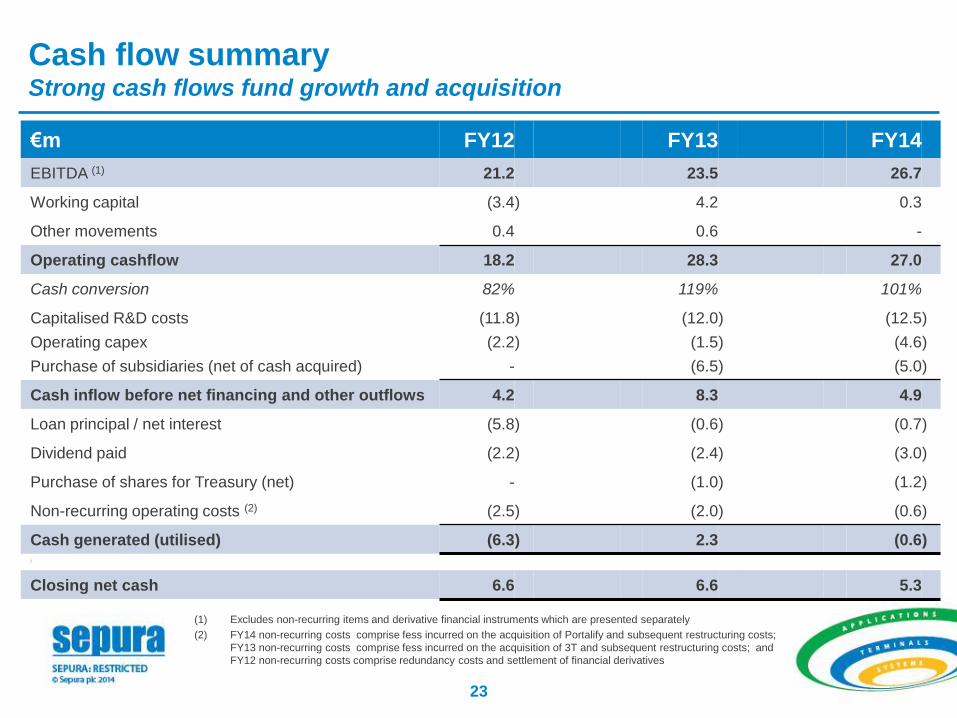
€m FY12 FY13 FY14
EBITDA (1) 21.2 23.5 26.7
Working capital (3.4 ) 4.2 0.3
Other movements 0.4 0.6 -
Operating cashflow 18.2 28.3 27.0
Cash conversion 82% 119% 101%
Capitalised R&D costs (11.8 ) (12.0 ) (12.5 )
Operating capex (2.2 ) (1.5 ) (4.6 )
Purchase of subsidiaries (net of cash acquired) - (6.5 ) (5.0 )
Cash inflow before net financing and other outflows 4.2 8.3 4.9
Loan principal / net interest (5.8 ) (0.6 ) (0.7 )
Dividend paid (2.2 ) (2.4 ) (3.0 )
Purchase of shares for Treasury (net) - (1.0 ) (1.2 )
Non-recurring operating costs (2) (2.5 ) (2.0 ) (0.6 )
Cash generated (utilised) (6.3 ) 2.3 (0.6 ) )
Closing net cash 6.6 6.6 5.3
(1) Excludes non-recurring items and derivative financial instruments which are presented separately
(2) FY14 non-recurring costs comprise fess incurred on the acquisition of Portalify and subsequent restructuring costs;
FY13 non-recurring costs comprise fess incurred on the acquisition of 3T and subsequent restructuring costs; and
FY12 non-recurring costs comprise redundancy costs and settlement of financial derivatives
Cash flow summary Strong cash flows fund growth and acquisition
24
0
104
180
63
144
198
142
193
227
151
169
191
190
220
239
190
220
239
192
192
192
237
186
30
0
71
156
0
178
89
0
130
200
253
187
48
Apps
Terminals
Systems
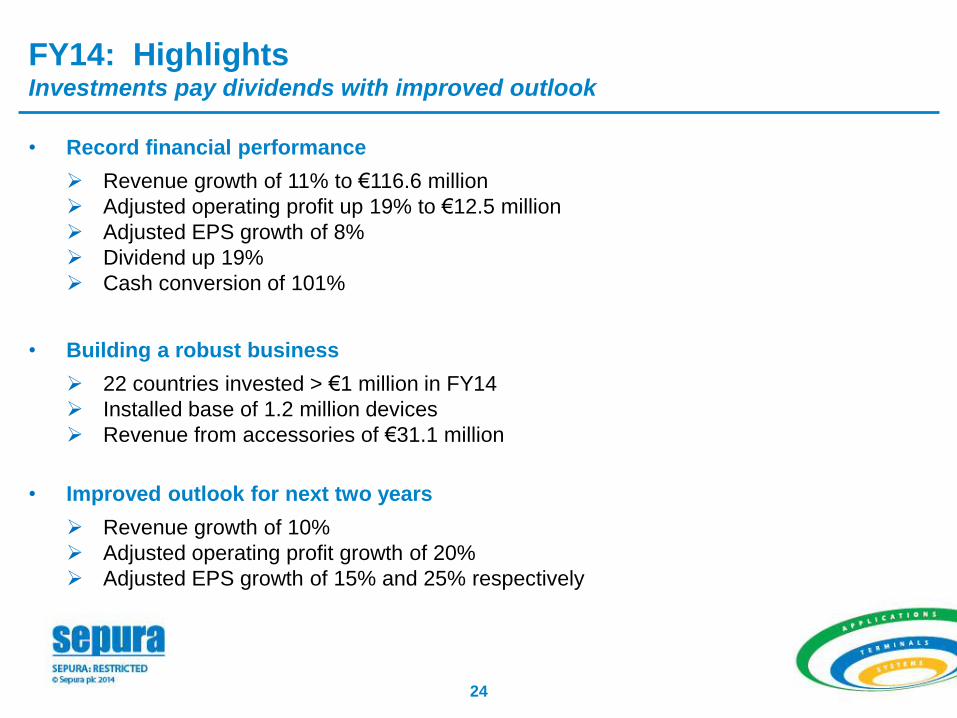
• Record financial performance
Revenue growth of 11% to €116.6 million
Adjusted operating profit up 19% to €12.5 million
Adjusted EPS growth of 8%
Dividend up 19%
Cash conversion of 101%
• Building a robust business
22 countries invested > €1 million in FY14
Installed base of 1.2 million devices
Revenue from accessories of €31.1 million
• Improved outlook for next two years
Revenue growth of 10%
Adjusted operating profit growth of 20%
Adjusted EPS growth of 15% and 25% respectively
FY14: Highlights Investments pay dividends with improved outlook
25
0
104
180
63
144
198
142
193
227
151
169
191
190
220
239
190
220
239
192
192
192
237
186
30
0
71
156
0
178
89
0
130
200
253
187
48
Apps
Terminals
Systems
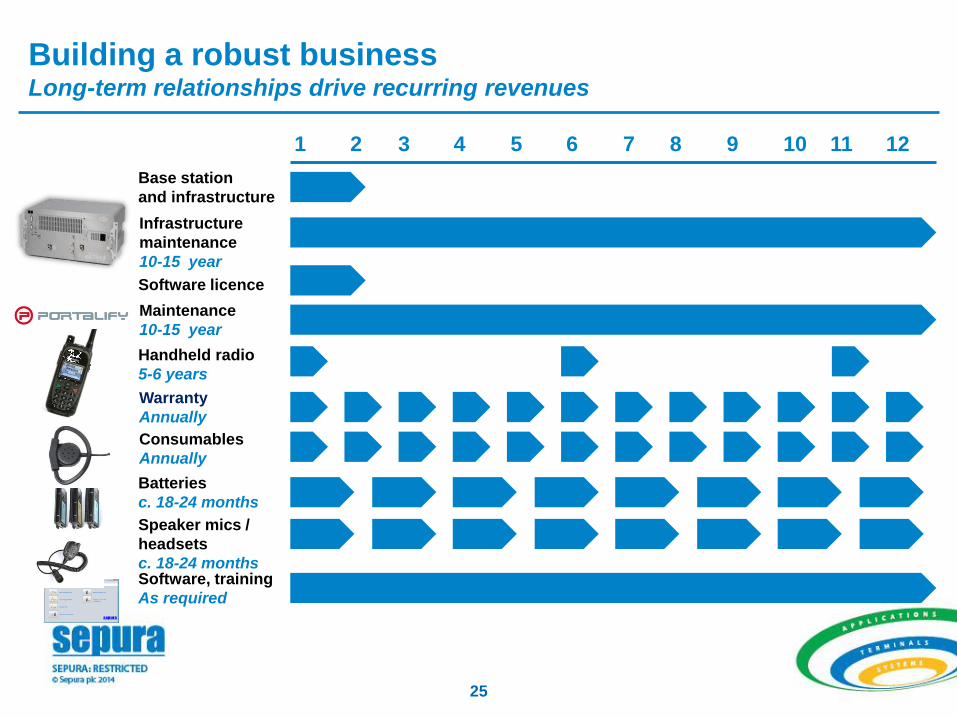
Building a robust business Long-term relationships drive recurring revenues
1 2 3 4 5 6 7 8 9 10 11 12
Base station
and infrastructure
Infrastructure
maintenance
10-15 year
Software, training
As required
Warranty
Annually
Batteries
c. 18-24 months
Speaker mics /
headsets
c. 18-24 months
Handheld radio
5-6 years
Consumables
Annually
Maintenance
10-15 year
Software licence
26
0
104
180
63
144
198
142
193
227
151
169
191
190
220
239
190
220
239
192
192
192
237
186
30
0
71
156
0
178
89
0
130
200
253
187
48
Apps
Terminals
Systems
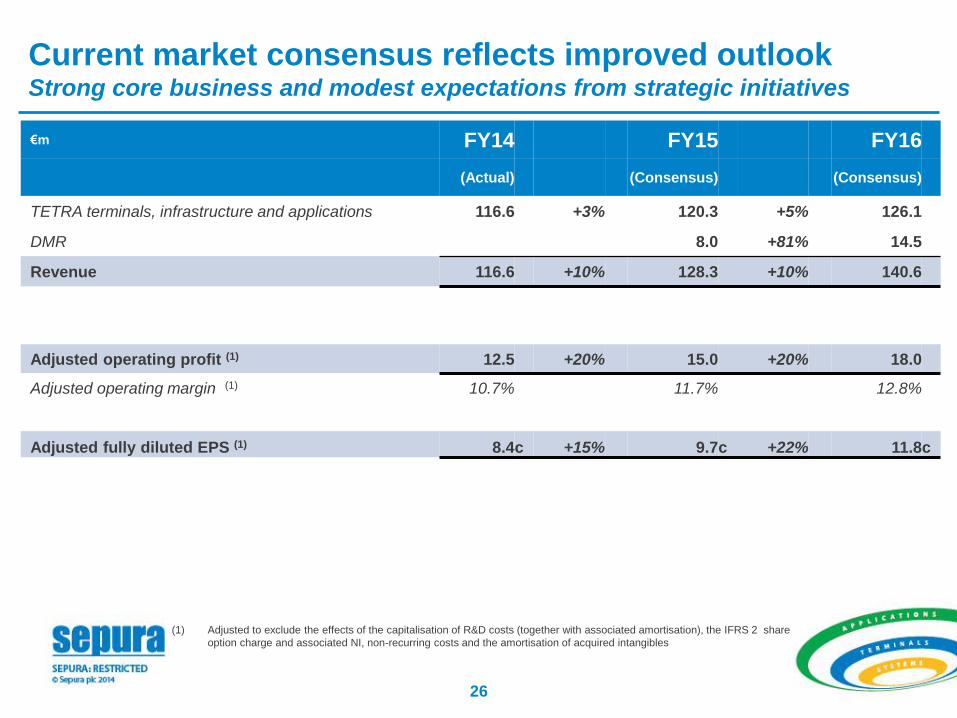
€m FY14 FY15 FY16
(Actual) (Consensus) (Consensus)
TETRA terminals, infrastructure and applications 116.6 +3% 120.3 +5% 126.1
DMR 8.0 +81% 14.5
Revenue 116.6 +10% 128.3 +10% 140.6
Adjusted operating profit (1) 12.5 +20% 15.0 +20% 18.0
Adjusted operating margin (1) 10.7% 11.7% 12.8%
Adjusted fully diluted EPS (1) 8.4 c +15% 9.7 c +22% 11.8 c
(1) Adjusted to exclude the effects of the capitalisation of R&D costs (together with associated amortisation), the IFRS 2 share
option charge and associated NI, non-recurring costs and the amortisation of acquired intangibles
Current market consensus reflects improved outlook Strong core business and modest expectations from strategic initiatives
27
1. The PMR market
2. Sepura’s position in the market
3. The opportunity
4. Financials
5. Conclusion
6. Q&A
27
0
104
180
63
144
198
142
193
227
151
169
191
190
220
239
190
220
239
192
192
192
237
186
30
0
71
156
0
178
89
0
130
200
253
187
48
Apps
Terminals
Systems
28
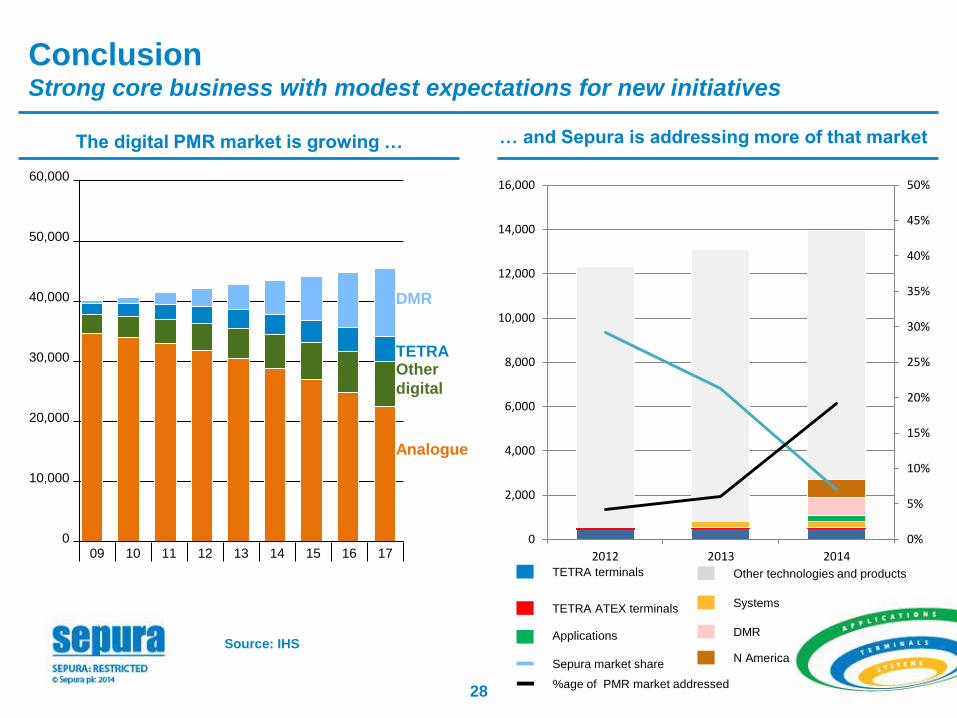
The digital PMR market is growing …
Conclusion Strong core business with modest expectations for new initiatives
… and Sepura is addressing more of that market
0%
5%
10%
15%
20%
25%
30%
35%
40%
45%
50%
0
2,000
4,000
6,000
8,000
10,000
12,000
14,000
16,000
2012 2013 2014
DMR
TETRA terminals Other technologies and products
Applications
Sepura market share
Systems TETRA ATEX terminals
%age of PMR market addressed
N America
Analogue
60,000
50,000
40,000
30,000
20,000
10,000
0 09 10 11 12 13 14 15 16 17
Source: IHS
DMR
Other
digital
TETRA
29
1. The PMR market
2. Sepura’s position in the market
3. The opportunity
4. Financials
5. Conclusion
6. Q&A
29
Recommended


![Presentation made to Analyst / Investor Meeting [Company Update]](https://img.pdfslide.net/doc/110x75/577c7c291a28abe054998a1b/presentation-made-to-analyst-investor-meeting-company-update.jpg)


![Analyst / Investor Meeting / Interaction - Presentation [Company Update]](https://img.pdfslide.net/doc/110x75/577c7a9d1a28abe05495a56e/analyst-investor-meeting-interaction-presentation-company-update.jpg)