Analyzing ICU Patient Room Environmental Quality through Unoccupied, Normal, and Emergency Procedure Modes
Participants Dr. Jennifer Wagner, Ph.D. - Principal- Prism Environmental Dr. Stephanie Taylor – Stephanie H. Taylor MD, M Architecture, CIC, FRSPH(UK) Harvard Medical School InciteHealth Fellow Damon G. Greeley -PE, CEM, HFDP, CBCP, EDAC, CHFM -Founder & Managing Partner Onsite-LLC John Ostojic – Industrial Hygienist, Artec Environmental Monitoring Support Dr. Troy Markel – Pediatric surgeon/Associate Professor- Indiana University Health Dr. Tom Gormley, Ph.D - Associate Professor – FGI Guidelines Committee Member, Construction Management Middle Tennessee State University “Luigi”- K9
EQI Research Team
Disclosure
This research was funded by Phoenix Controls. The
testing was administered by OnSite-LLC, an independent
healthcare spaces environmental quality testing and
research firm based in Indianapolis, IN. Both VAV and
Phoenix technical personnel were onsite and involved with
the configuration, programming, and execution of the
ventilation systems.
Purpose
Intensive care unit functions change over time and facilities could benefit from multi-use type
spaces that can be minimally altered to meet future needs.
Intensive care unit rooms that support a number of configurations and have the necessary
ventilation infrastructure are necessary to support continuously adaptive clinical uses.
This research would be of interest to healthcare administrators, ICU departments, infection
prevention, and other clinical leaders who are concerned with their ICU space designs being
applicable for today and an uncertain tomorrow.
It will go into depth on how surgical procedure adaptability can be accommodated without certain
ventilation restrictions.
Purpose
FACT: ‘Real’ procedures are performed in ICUs everyday
1. Besides emergencies or Code Blues what would be
different if an ICU had procedure capabilities?
2. “ICUs are the dirtiest areas in our hospitals”
- West Coast based multistate healthcare system
Chief Operating Officer
3. What might you find in a typical ICU corridor?
• Human – Staphylococcus and Micrococcus
• Environment - Bacillus, Aspergillus, and
Cladosporium
Background
Intensive Care Units (ICUs) are sometimes challenged to provide surgical
procedure quality indoor air environments when the patient has an abrupt
decompensation of a clinical status, i.e. "crashes" or is not able to be transferred
to an available operating room.
An environmental quality research team tested a modern ICU room design, per
Facility Guidelines Institute, to determine if a procedure mode during a Code
Blue condition could provide an improved level of sterility.
Why Hybrid Testing Environment
• Previous literature reviews or body of work was comprised of studies in clean or
empty rooms, staged in laboratories, or utilization of computation fluid dynamics
(computer modeling)
Dynamic Environment Testing or EQI Process
• In real everyday used ICUs with real bio load (turn around not terminally cleaned)
• Uses real doctors, nurses, and scrub techs
• Includes environmental engineers, mechanical engineers, and industrial hygiene
technicians trained in OR procedures, sterile techniques to both internally generate
particles and gather qualitative and quantitative data about them
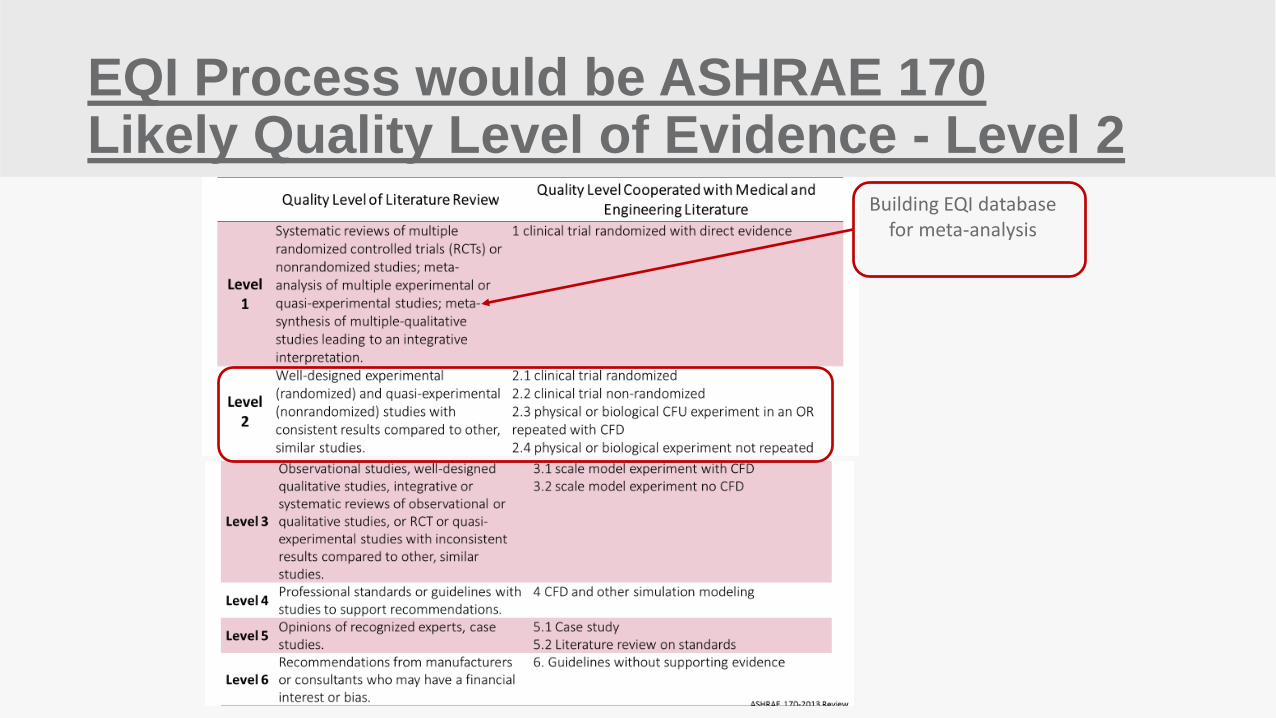
EQI Process would be ASHRAE 170 Likely Quality Level of Evidence - Level 2
Building EQI database for meta-analysis
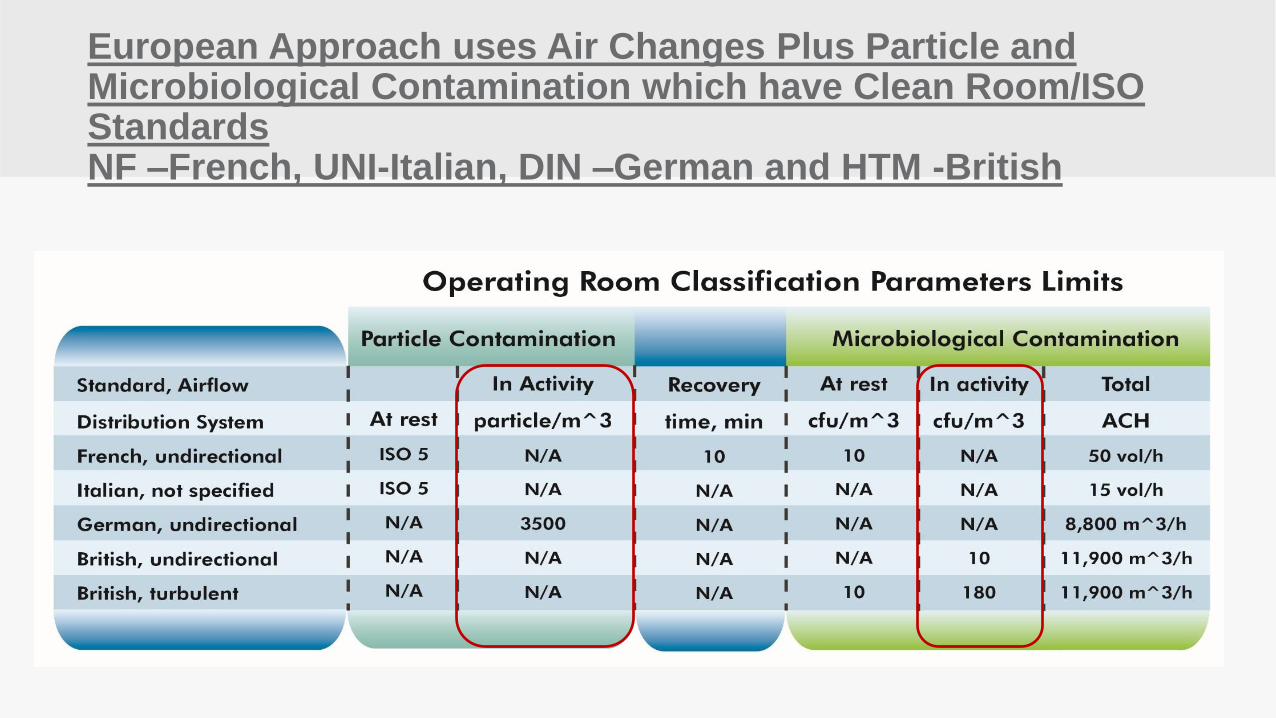
European Approach uses Air Changes Plus Particle and Microbiological Contamination which have Clean Room/ISO Standards NF –French, UNI-Italian, DIN –German and HTM -British
2x4 HEPA
66” Clear
Patient Bed
EA
Corridor
Return Grille
RA
SA
Toilet Room 56 SF
36” Clear
54” Clear 96”
40”
18’-0”
13’-0”
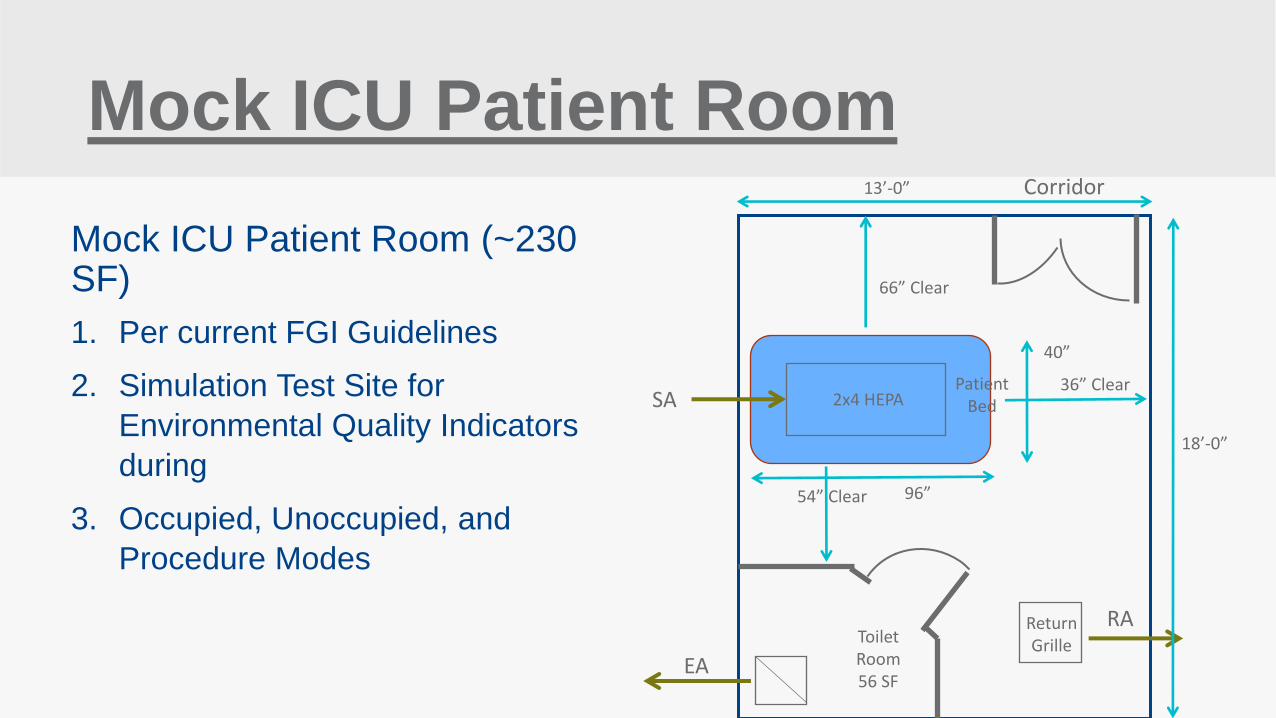
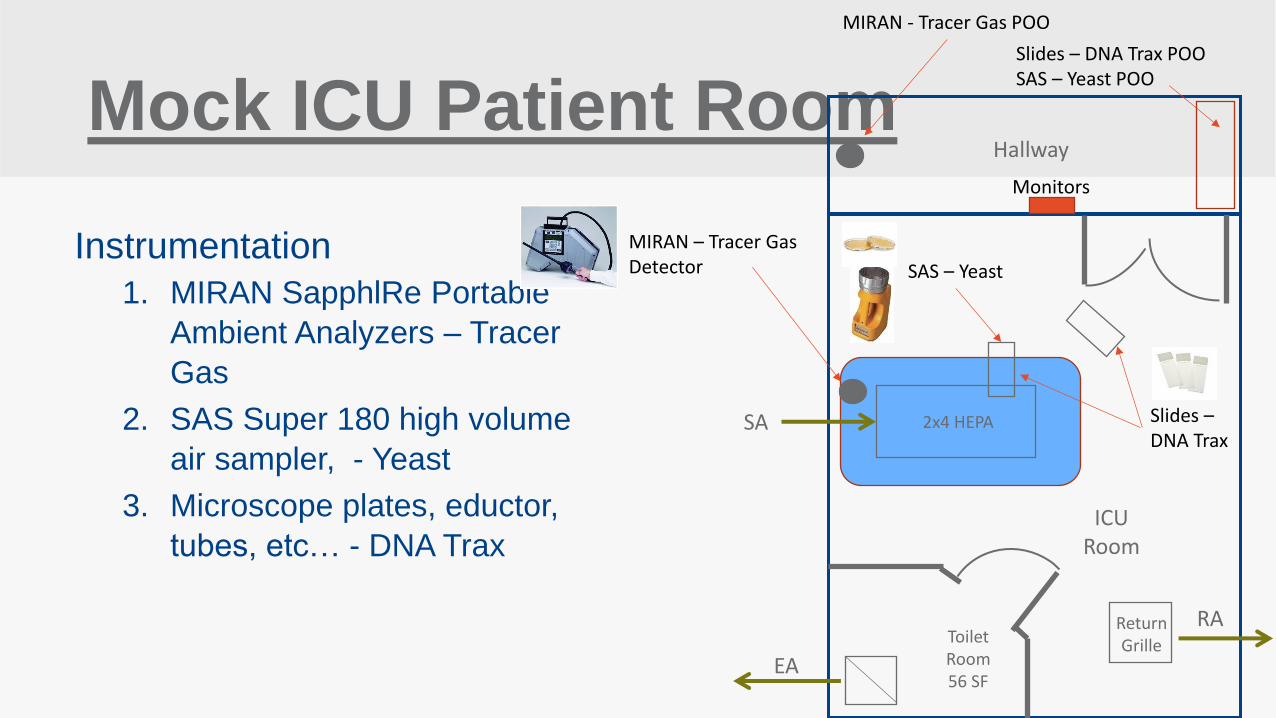
Mock ICU Patient Room
Mock ICU Patient Room (~230 SF)
1. Per current FGI Guidelines
2. Simulation Test Site for
Environmental Quality Indicators
during
3. Occupied, Unoccupied, and
Procedure Modes
`
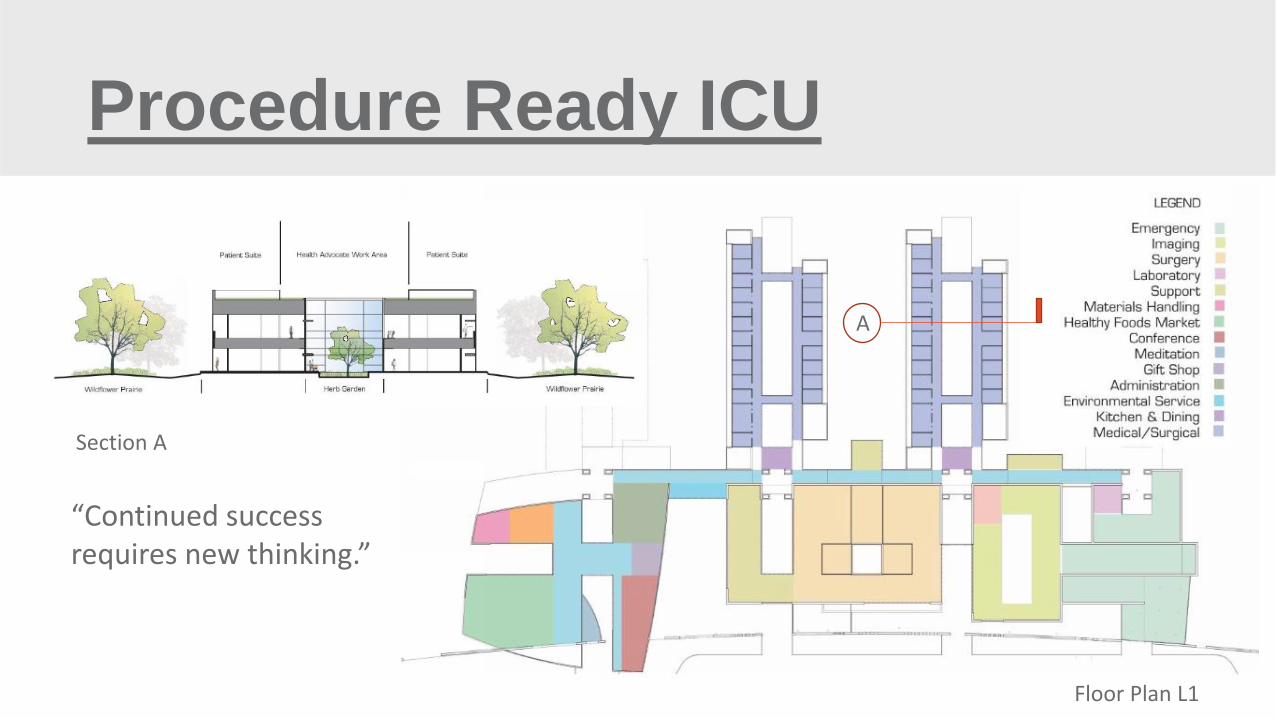
Procedure Ready ICU
“Continued success requires new thinking.”
Section A
Floor Plan L1
A
`
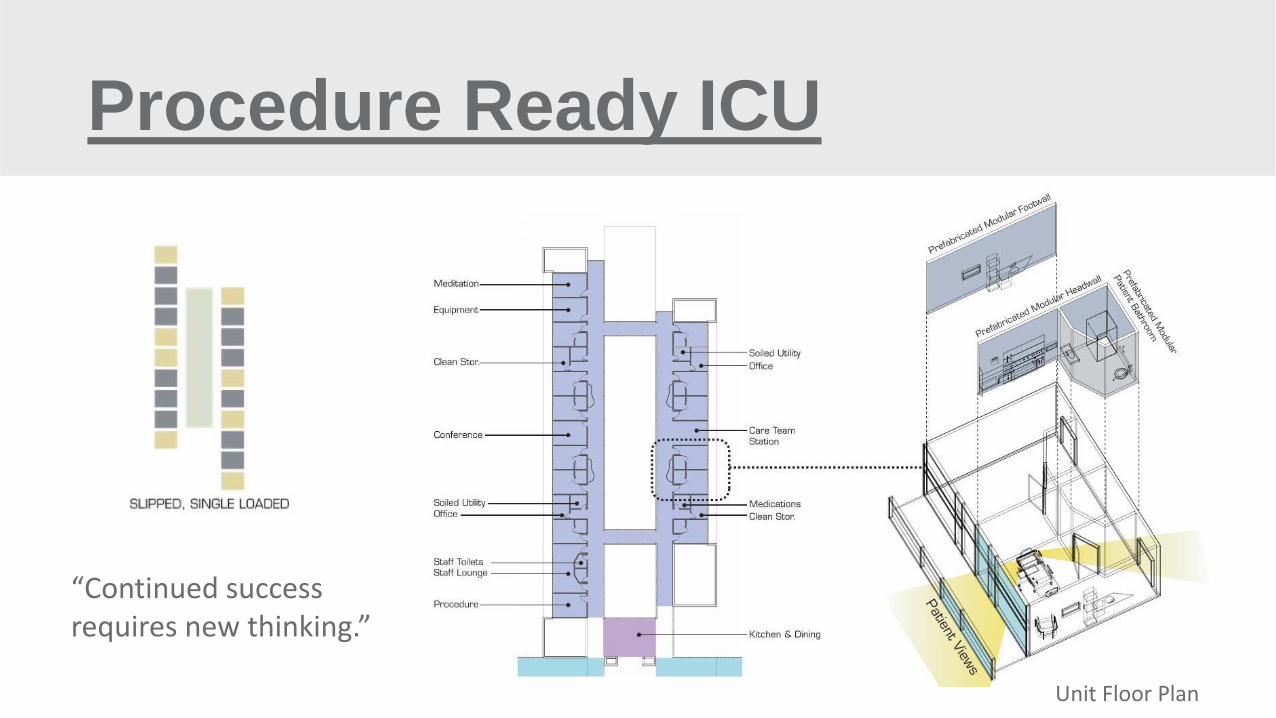
Procedure Ready ICU
Unit Floor Plan
“Continued success requires new thinking.”
Research Methodology
The team's methodology for analyzing this surgical procedure mode adaptable
ICU consisted of developing mock clinical patient care procedure methods
applied to three airflow operating modes; 1) unoccupied, 2) normal, and 3)
emergency procedure. Particulate (tracer gas) and fungal contaminant
generation and the instrumentation to quantify the levels were arranged in the
ICU room and adjacent corridor. Prior to the testing, particulate and microbial
levels were measured in an actual ICU room and adjacent corridor in order to
establish mock contaminant levels that would simulate realistic conditions.
2x4 HEPA
ICU Room
EA
Return Grille
RA
SA
Toilet Room 56 SF
Mock ICU Patient Room
Instrumentation
1. MIRAN SapphlRe Portable
Ambient Analyzers – Tracer
Gas
2. SAS Super 180 high volume
air sampler, - Yeast
3. Microscope plates, eductor,
tubes, etc… - DNA Trax
SAS – Yeast
Slides – DNA Trax POO SAS – Yeast POO
MIRAN – Tracer Gas Detector
MIRAN - Tracer Gas POO
Hallway
Monitors
Slides – DNA Trax
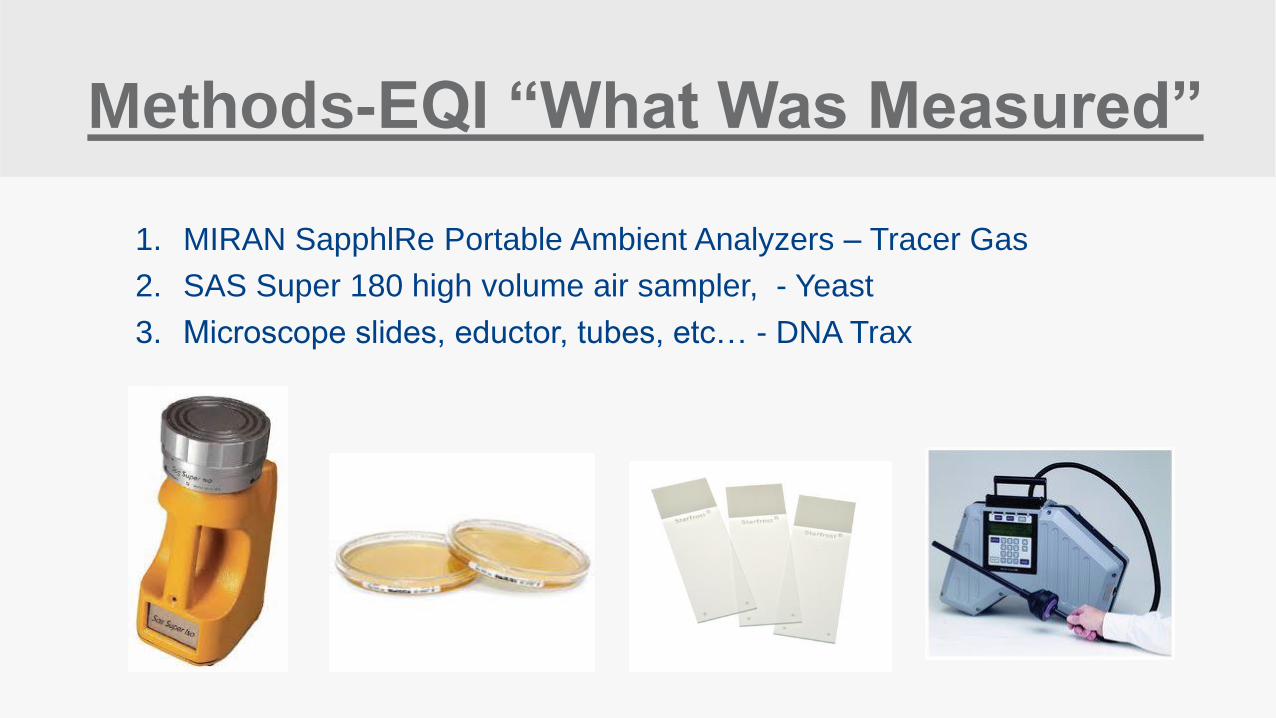
Methods-EQI “What Was Measured”
1. MIRAN SapphlRe Portable Ambient Analyzers – Tracer Gas
2. SAS Super 180 high volume air sampler, - Yeast
3. Microscope slides, eductor, tubes, etc… - DNA Trax
Research Methodology
Multiple and repeatable clinical patient care procedure tests were performed on
a mock patient (for necessary statistical significance purposes) utilizing two
commonly applied room airflow control technologies. During each particulate
(tracer gas) and fungal contaminant test, the room environment maintained
constant temperature, relative humidity, and pressure relationships during each
mode and for each room airflow control technology.
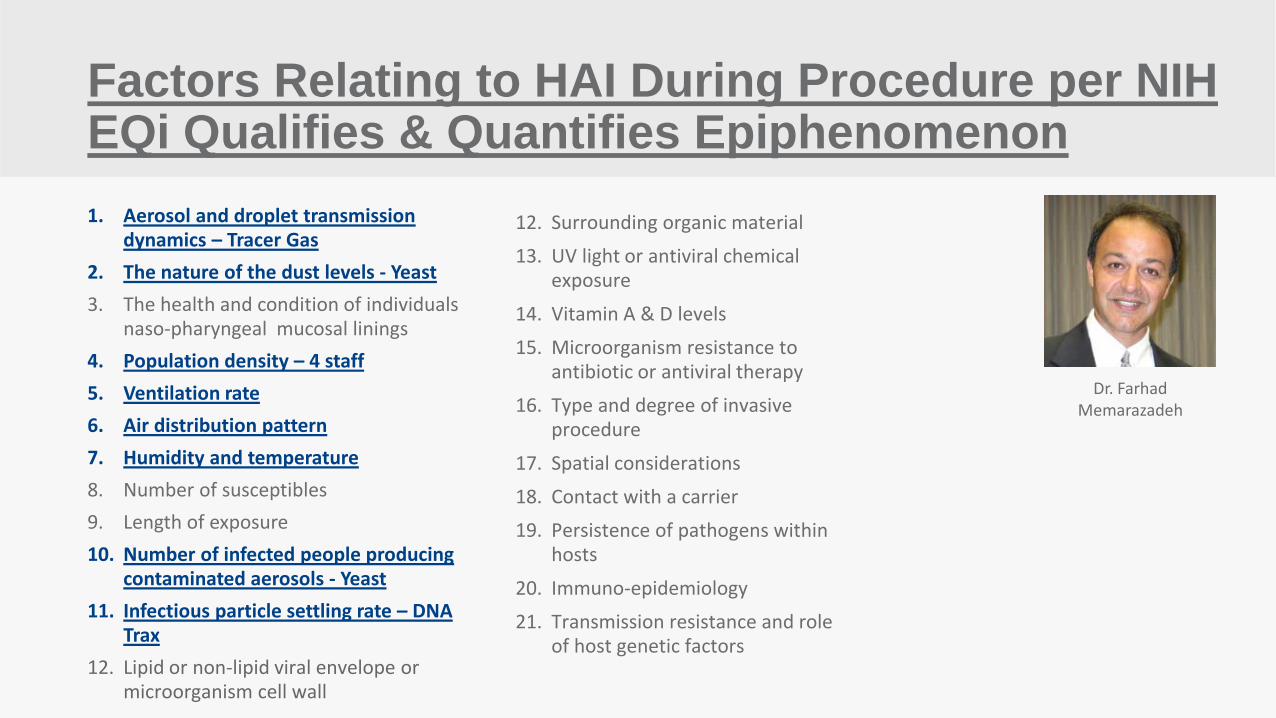
Factors Relating to HAI During Procedure per NIH EQi Qualifies & Quantifies Epiphenomenon
1. Aerosol and droplet transmission dynamics – Tracer Gas
2. The nature of the dust levels - Yeast
3. The health and condition of individuals naso-pharyngeal mucosal linings
4. Population density – 4 staff
5. Ventilation rate
6. Air distribution pattern
7. Humidity and temperature
8. Number of susceptibles
9. Length of exposure
10. Number of infected people producing contaminated aerosols - Yeast
11. Infectious particle settling rate – DNA Trax
12. Lipid or non-lipid viral envelope or microorganism cell wall
12. Surrounding organic material
13. UV light or antiviral chemical exposure
14. Vitamin A & D levels
15. Microorganism resistance to antibiotic or antiviral therapy
16. Type and degree of invasive procedure
17. Spatial considerations
18. Contact with a carrier
19. Persistence of pathogens within hosts
20. Immuno-epidemiology
21. Transmission resistance and role of host genetic factors
Dr. Farhad Memarazadeh
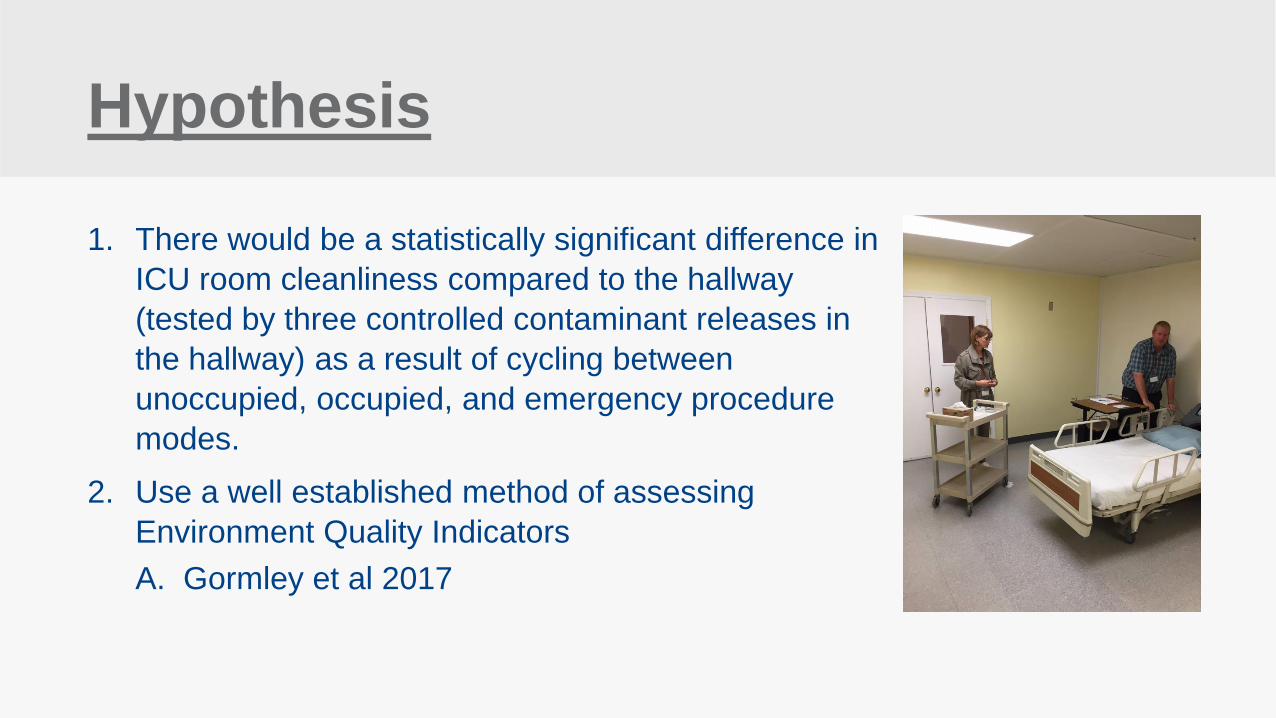
Hypothesis
1. There would be a statistically significant difference in
ICU room cleanliness compared to the hallway
(tested by three controlled contaminant releases in
the hallway) as a result of cycling between
unoccupied, occupied, and emergency procedure
modes.
2. Use a well established method of assessing
Environment Quality Indicators
A. Gormley et al 2017
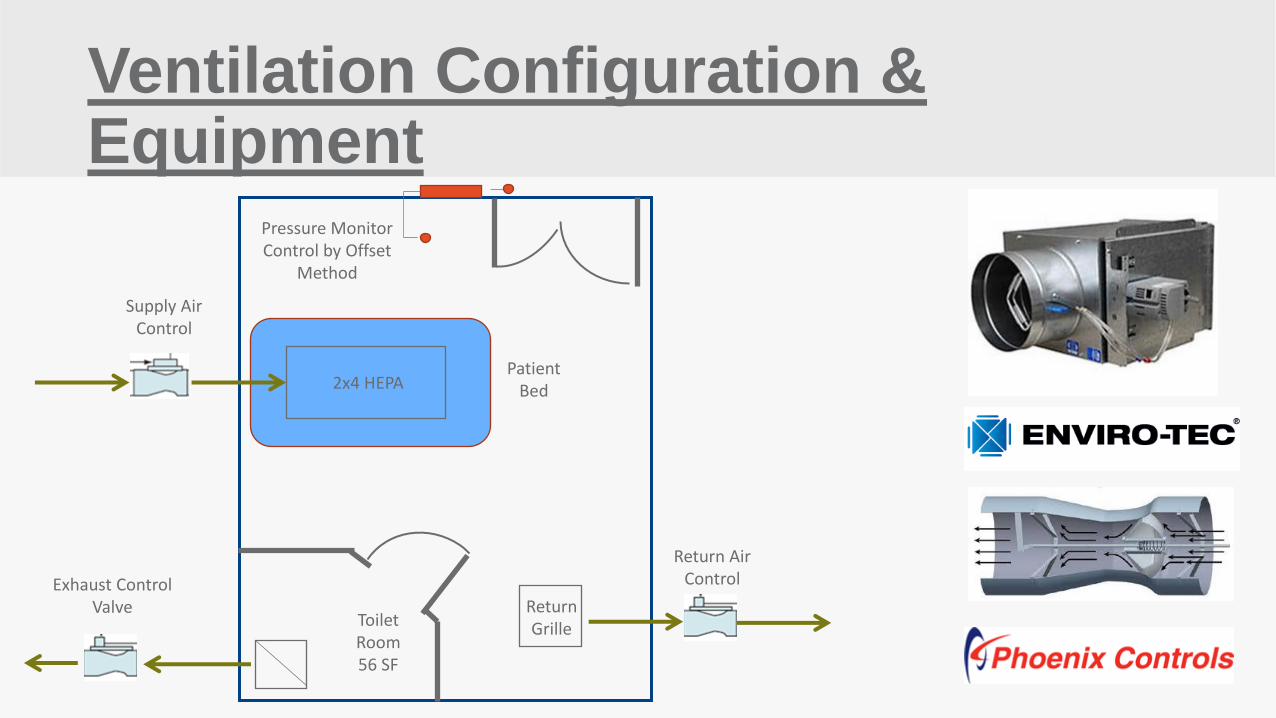
Ventilation Configuration & Equipment
2x4 HEPA Patient
Bed
Return Grille
Supply Air Control
Toilet Room 56 SF
Exhaust Control Valve
Return Air Control
Pressure Monitor Control by Offset
Method
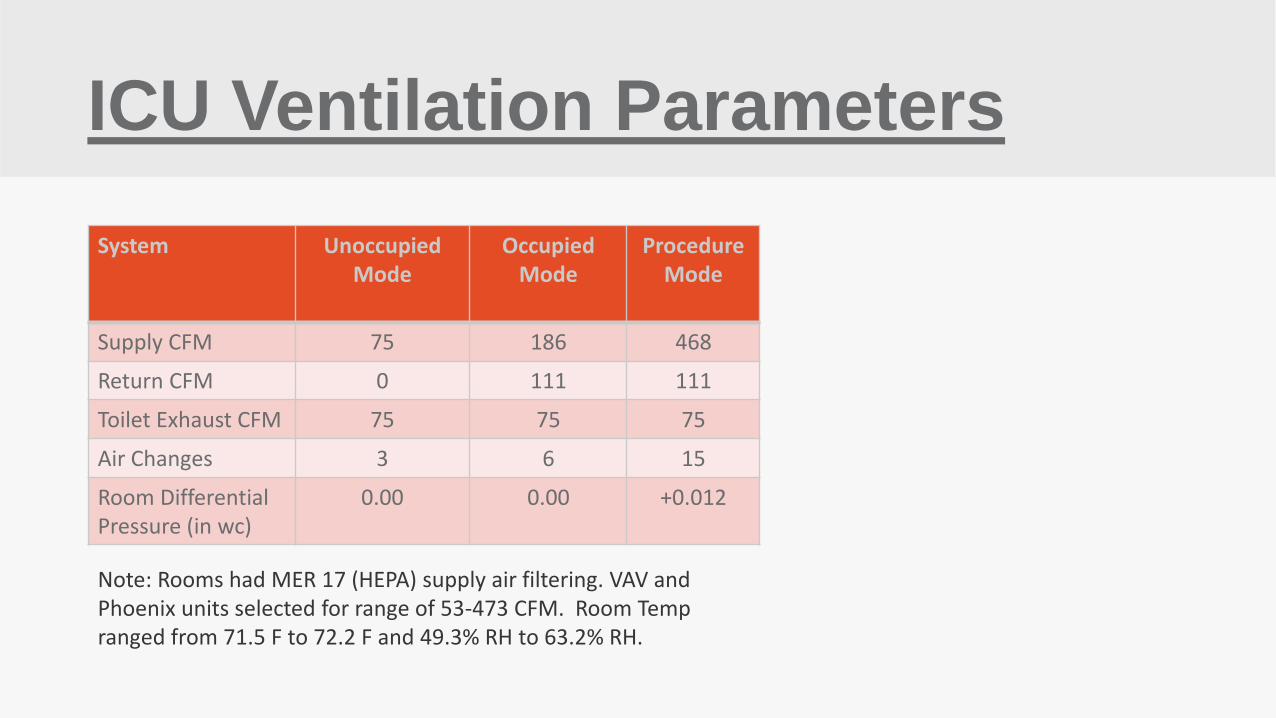
ICU Ventilation Parameters
System Unoccupied Mode
Occupied Mode
Procedure Mode
Supply CFM 75 186 468
Return CFM 0 111 111
Toilet Exhaust CFM 75 75 75
Air Changes 3 6 15
Room Differential Pressure (in wc)
0.00 0.00 +0.012
Note: Rooms had MER 17 (HEPA) supply air filtering. VAV and Phoenix units selected for range of 53-473 CFM. Room Temp ranged from 71.5 F to 72.2 F and 49.3% RH to 63.2% RH.
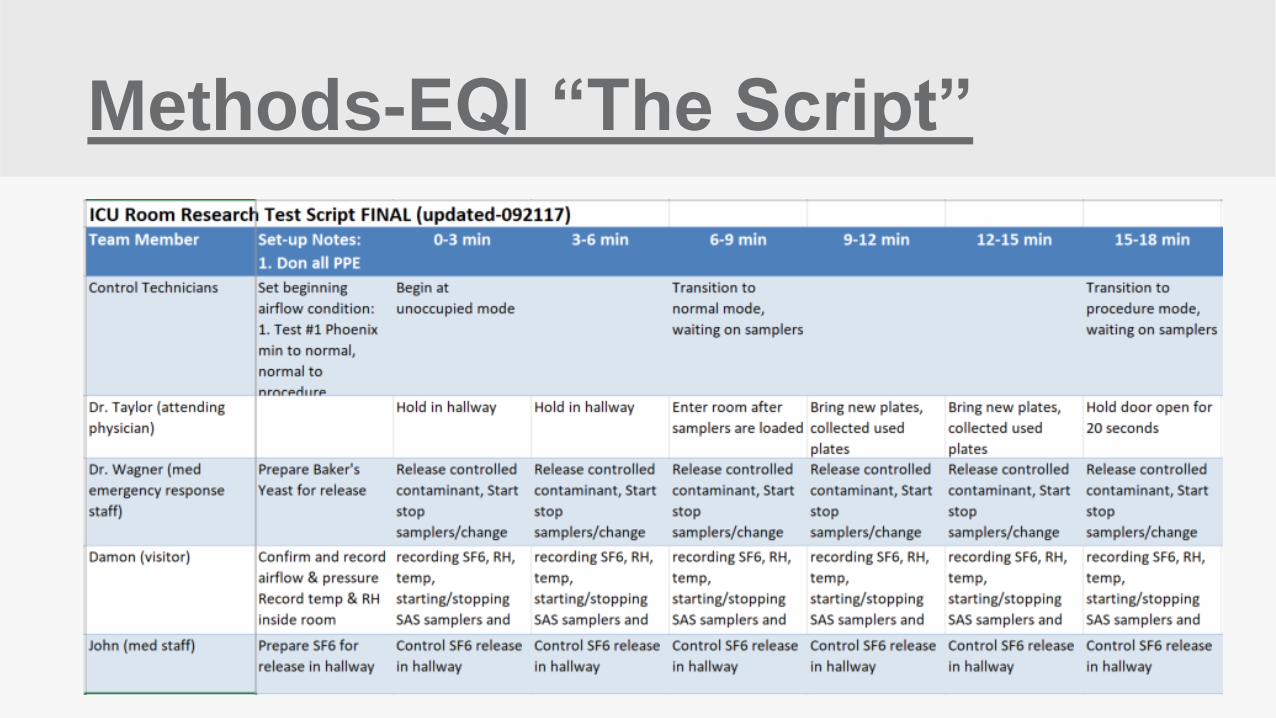
Methods-EQI “The Script”
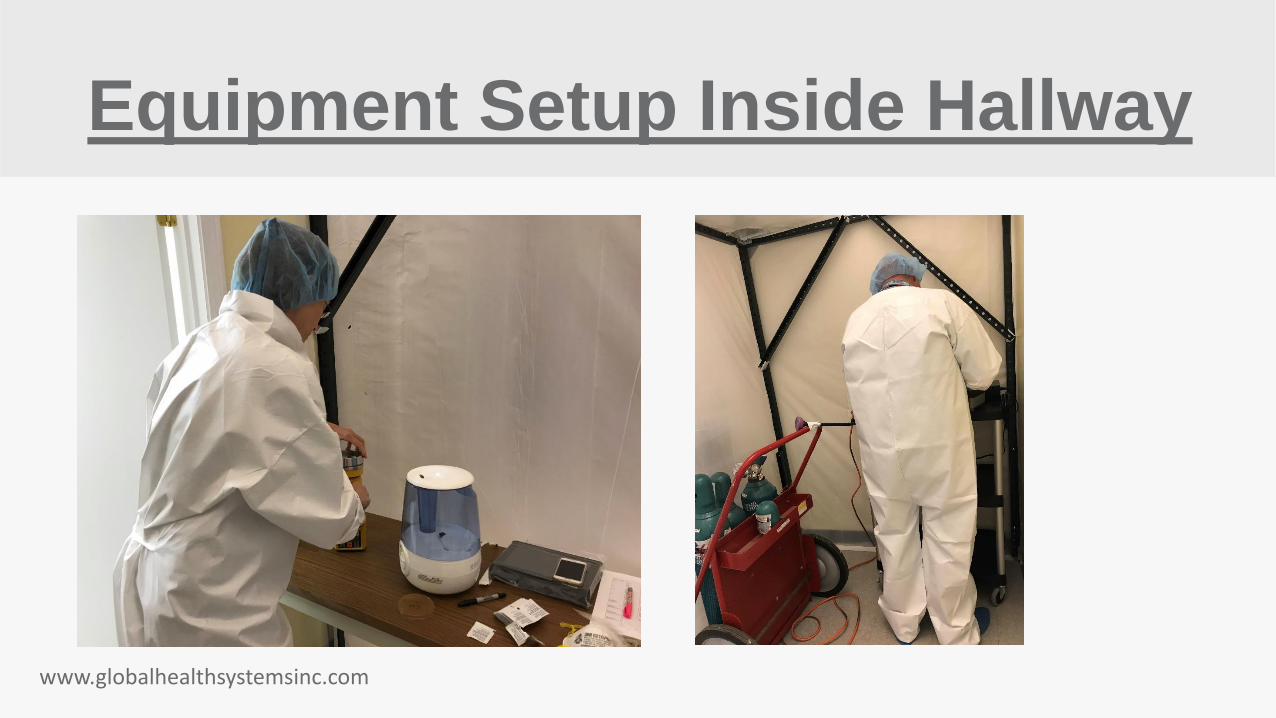
Equipment Setup Inside Hallway
www.globalhealthsystemsinc.com
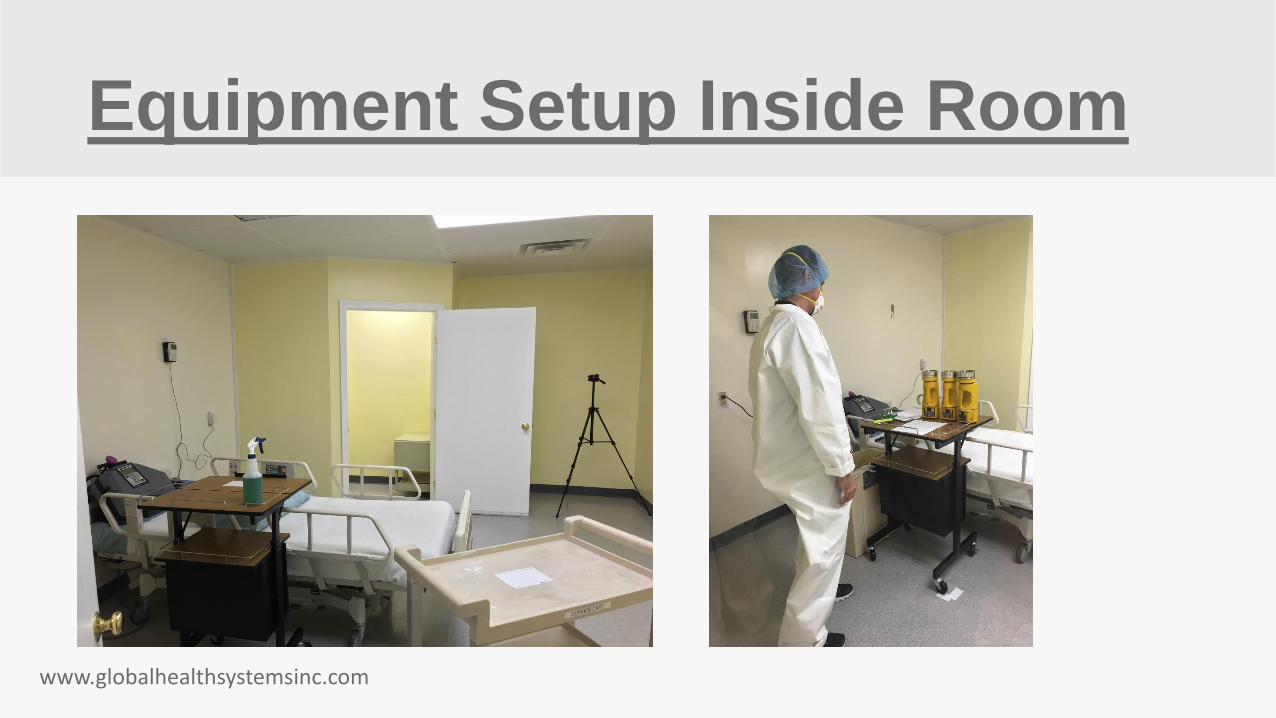
Equipment Setup Inside Room
www.globalhealthsystemsinc.com
Statistical Analysis Key
1. Hallway Levels by Run – compare values of tracer gas in hallway for
consistency of contamination levels between runs. Runs 1-2 were longer
time periods compared to Runs 3-6 due to sugar molecule settling time.
2. Hallway to Room Comparison – compares values in hallway (tracer gas and
yeast) to overall levels of contamination detected in the room by combining
air terminal (VAV) and Phoenix
3. In Room Comparison – compare levels of contamination detected in the
room by run 1-2 and 3-6 between air terminals (VAV) and Phoenix air valves
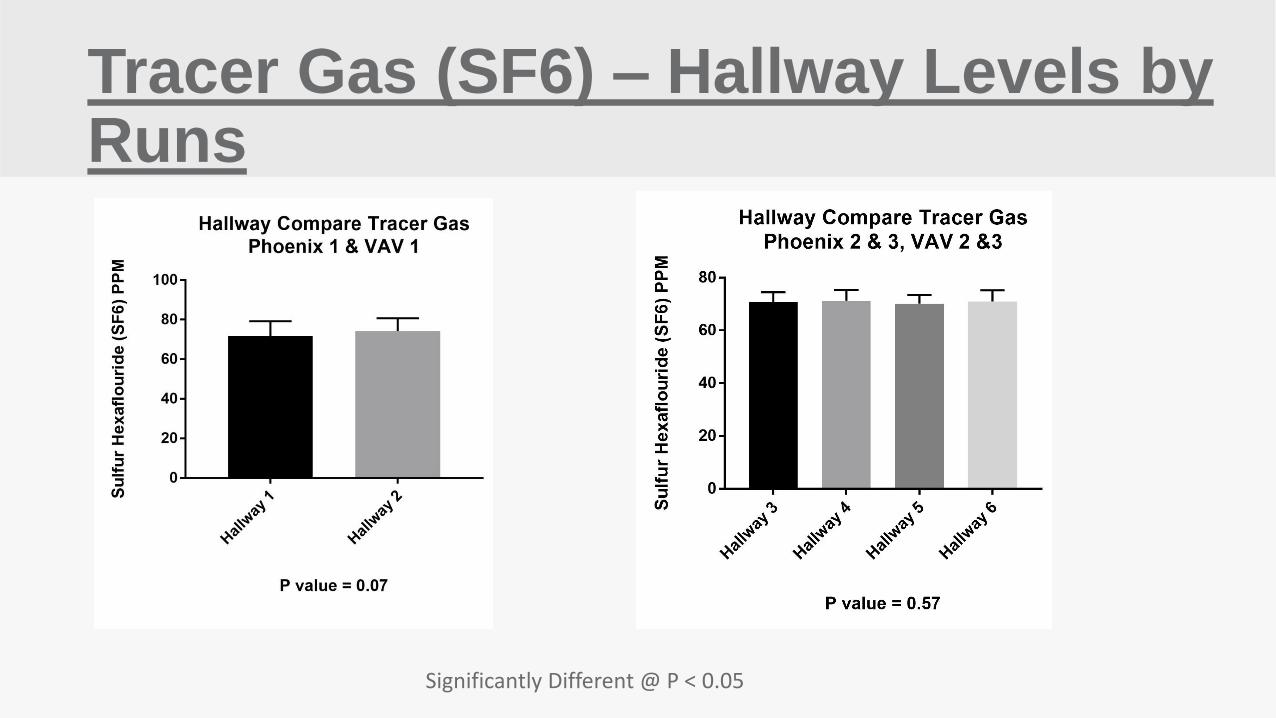
Tracer Gas (SF6) – Hallway Levels by Runs
Significantly Different @ P < 0.05
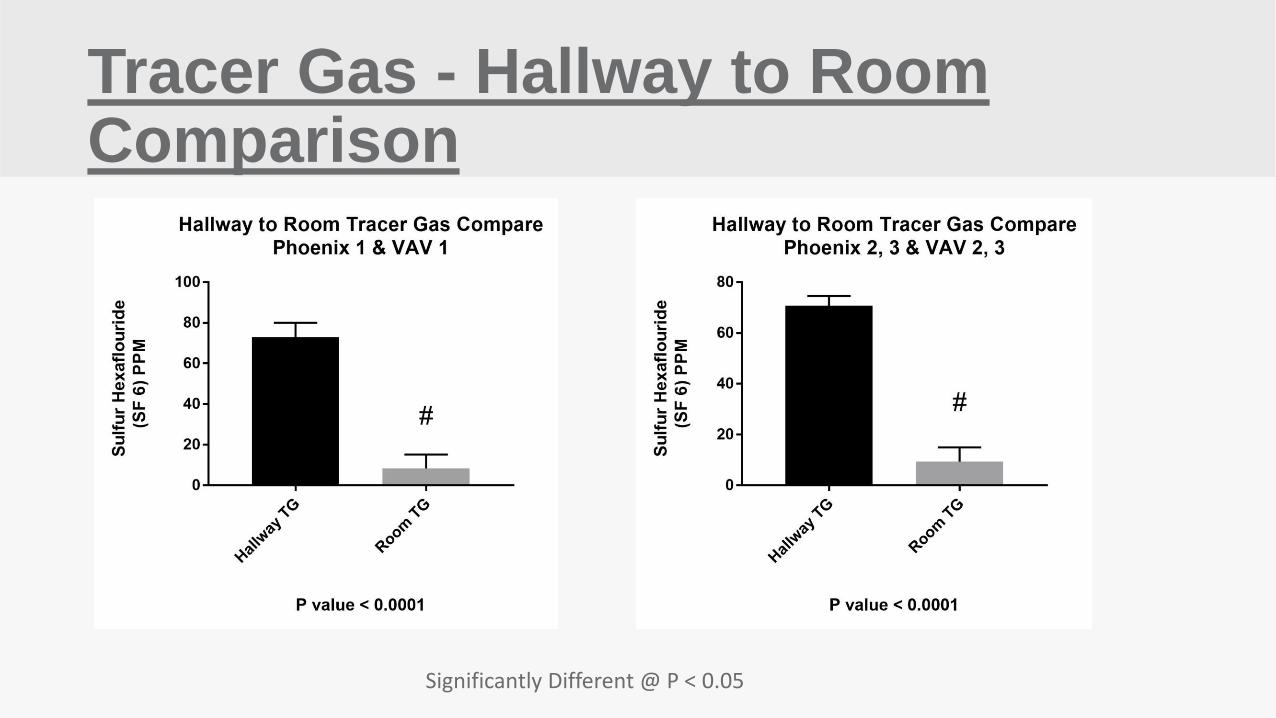
Tracer Gas - Hallway to Room Comparison
Significantly Different @ P < 0.05
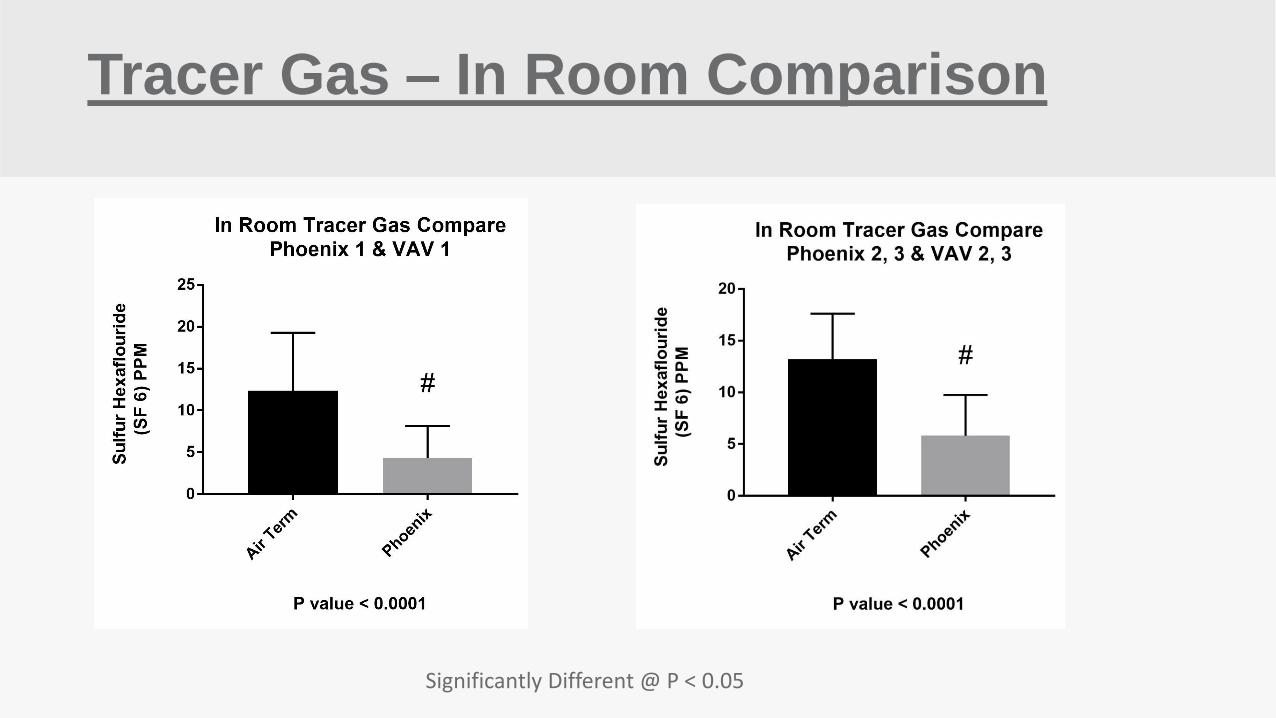
Tracer Gas – In Room Comparison
Significantly Different @ P < 0.05
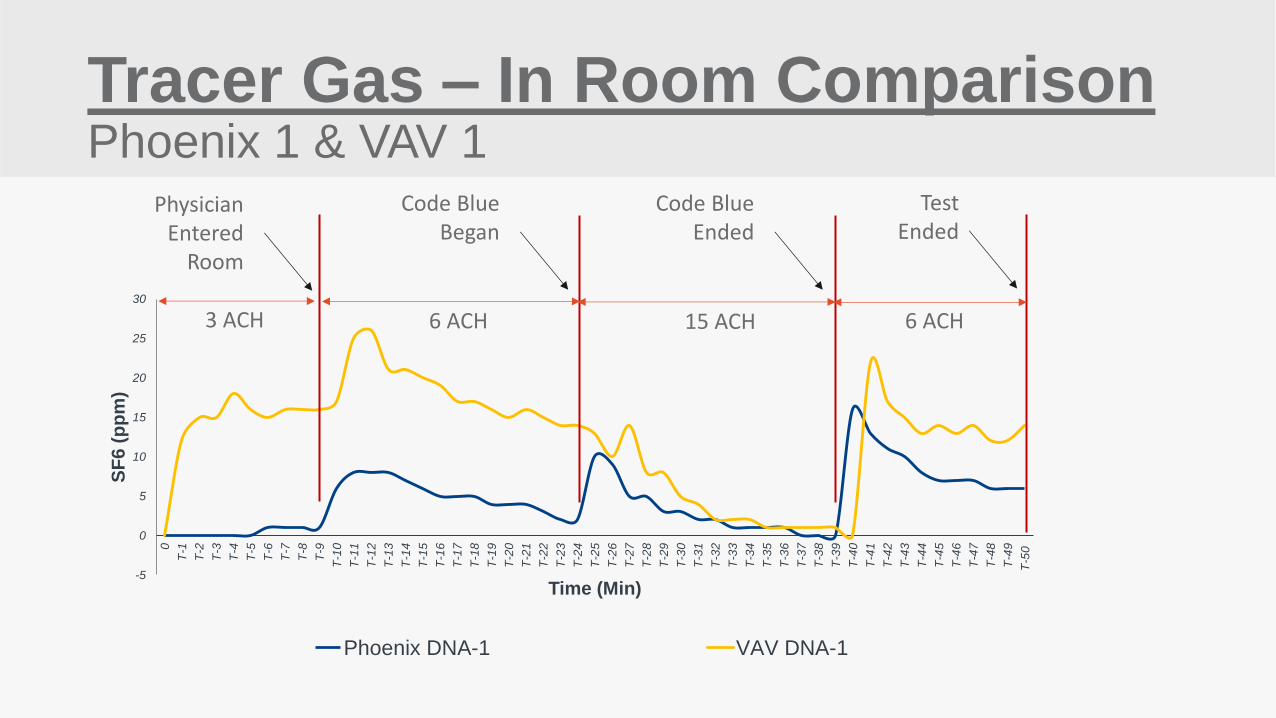
Tracer Gas – In Room Comparison Phoenix 1 & VAV 1
-5
0
5
10
15
20
25
30
0
T-1
T-2
T-3
T-4
T-5
T-6
T-7
T-8
T-9
T-1
0
T-1
1
T-1
2
T-1
3
T-1
4
T-1
5
T-1
6
T-1
7
T-1
8
T-1
9
T-2
0
T-2
1
T-2
2
T-2
3
T-2
4
T-2
5
T-2
6
T-2
7
T-2
8
T-2
9
T-3
0
T-3
1
T-3
2
T-3
3
T-3
4
T-3
5
T-3
6
T-3
7
T-3
8
T-3
9
T-4
0
T-4
1
T-4
2
T-4
3
T-4
4
T-4
5
T-4
6
T-4
7
T-4
8
T-4
9
T-5
0
SF
6 (
pp
m)
Time (Min)
Phoenix DNA-1 VAV DNA-1
3 ACH 6 ACH 15 ACH 6 ACH
Physician Entered
Room
Code Blue Began
Code Blue Ended
Test Ended
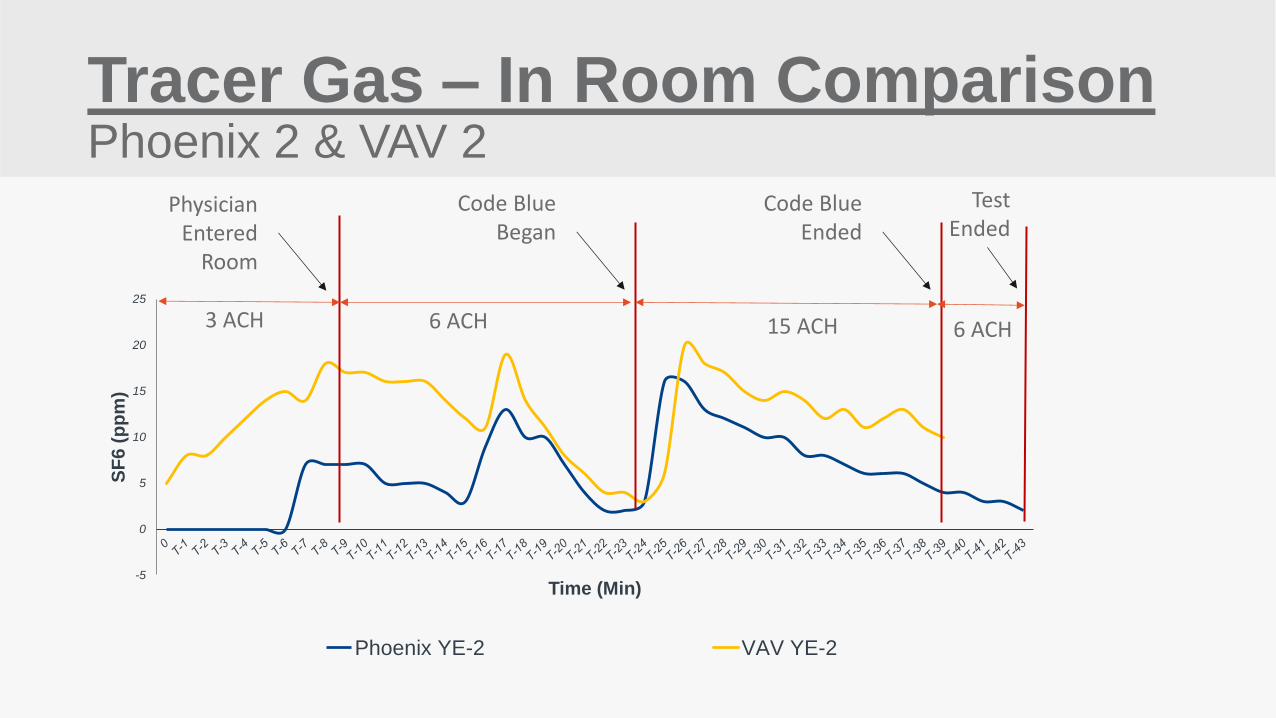
Tracer Gas – In Room Comparison Phoenix 2 & VAV 2
-5
0
5
10
15
20
25
SF
6 (
pp
m)
Time (Min)
Phoenix YE-2 VAV YE-2
3 ACH 6 ACH 15 ACH 6 ACH
Physician Entered
Room
Code Blue Began
Code Blue Ended
Test Ended
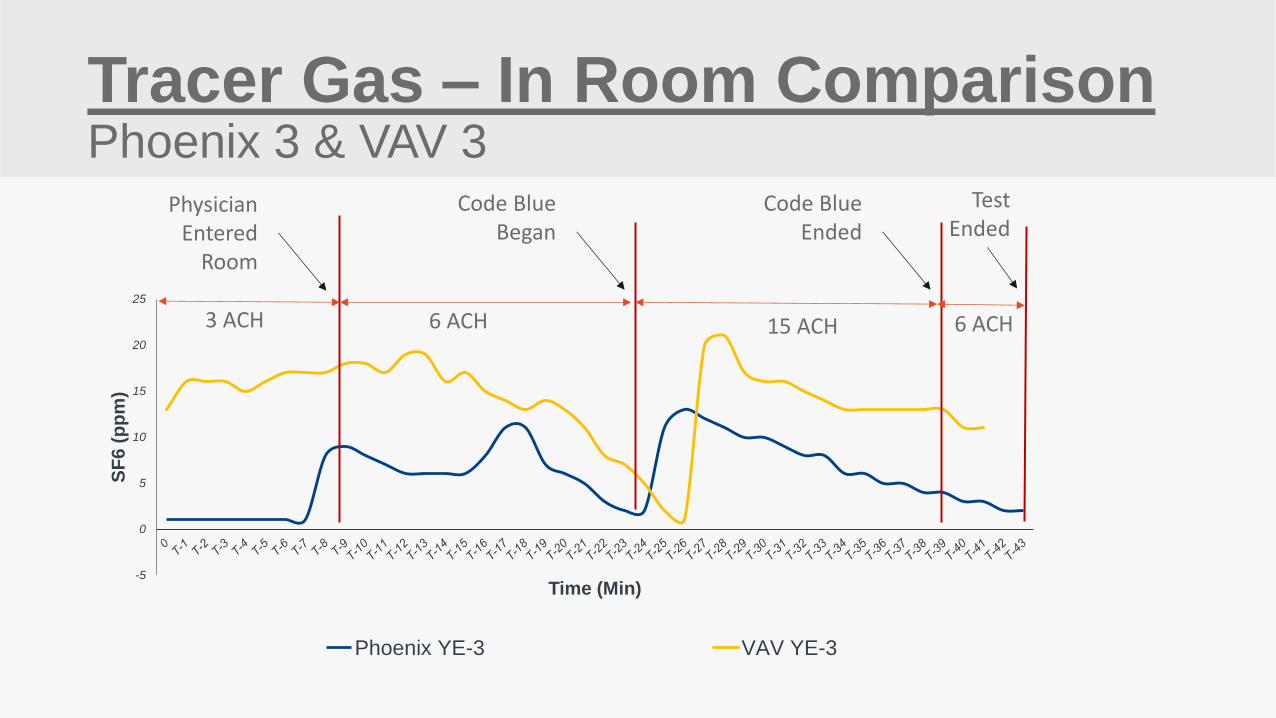
Tracer Gas – In Room Comparison Phoenix 3 & VAV 3
-5
0
5
10
15
20
25
SF
6 (
pp
m)
Time (Min)
Phoenix YE-3 VAV YE-3
3 ACH 6 ACH 15 ACH
Physician Entered
Room
Code Blue Began
Code Blue Ended
Test Ended
6 ACH
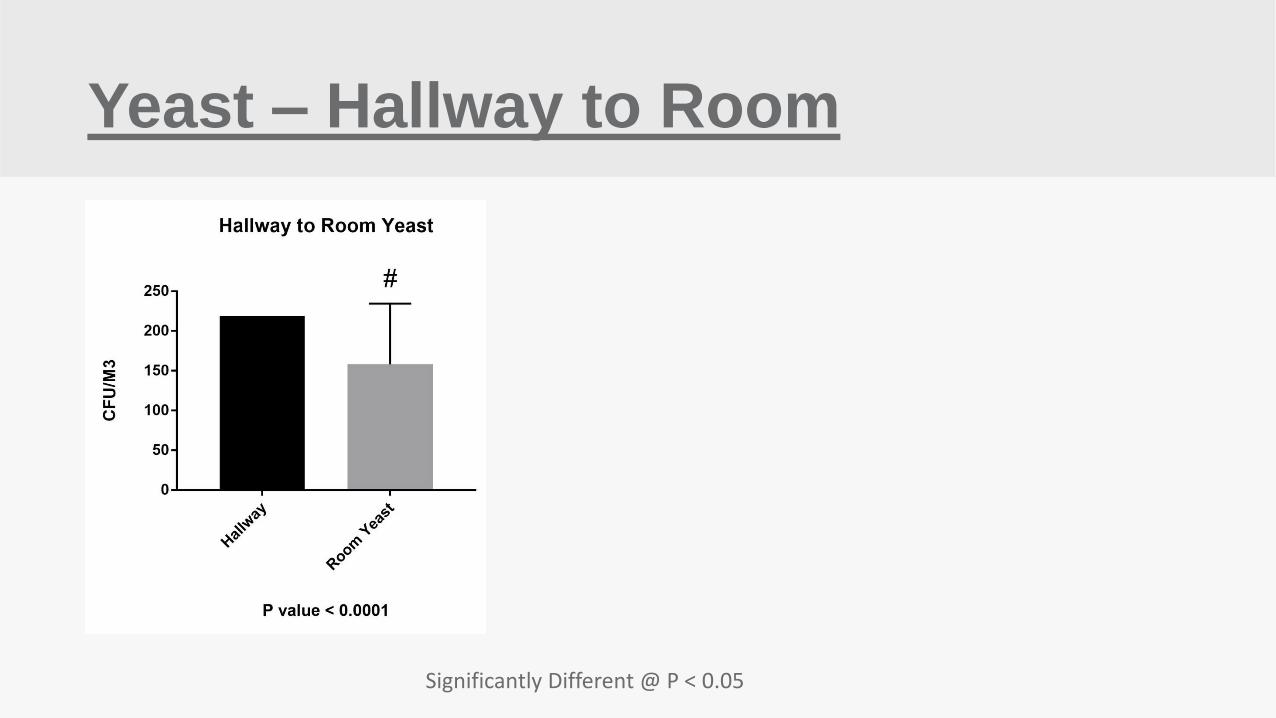
Yeast – Hallway to Room
Significantly Different @ P < 0.05
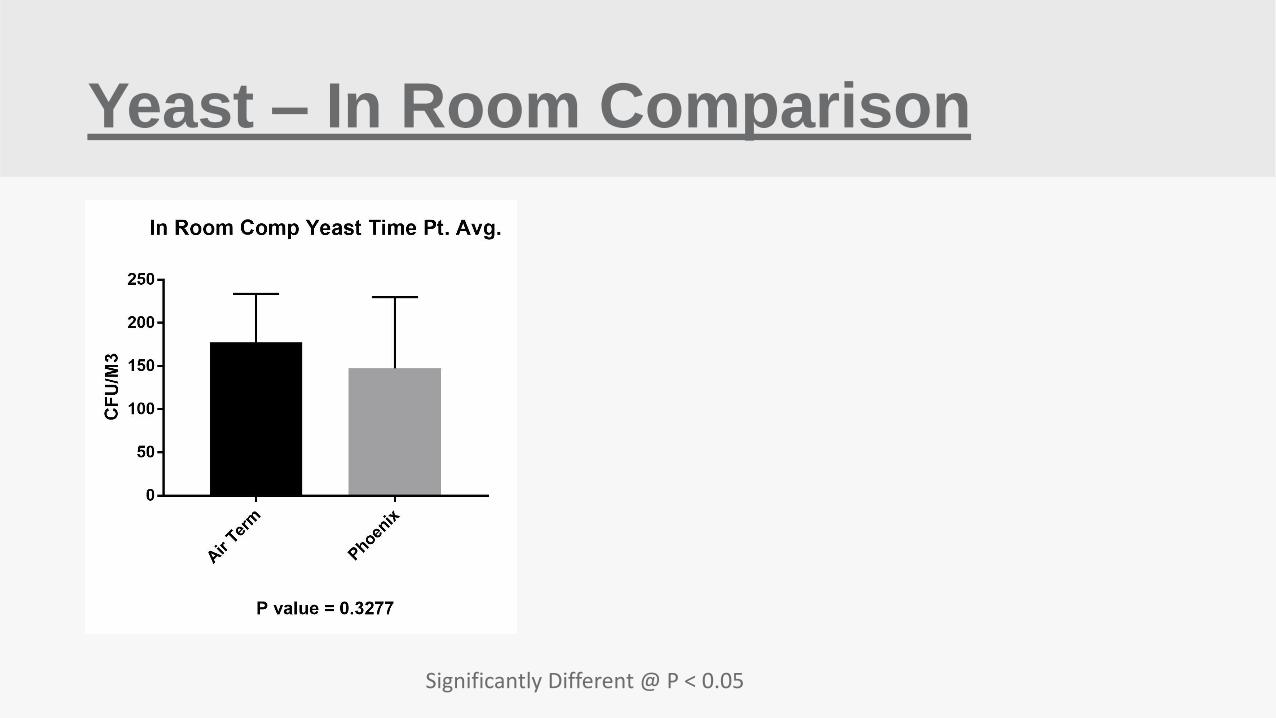
Yeast – In Room Comparison
Significantly Different @ P < 0.05
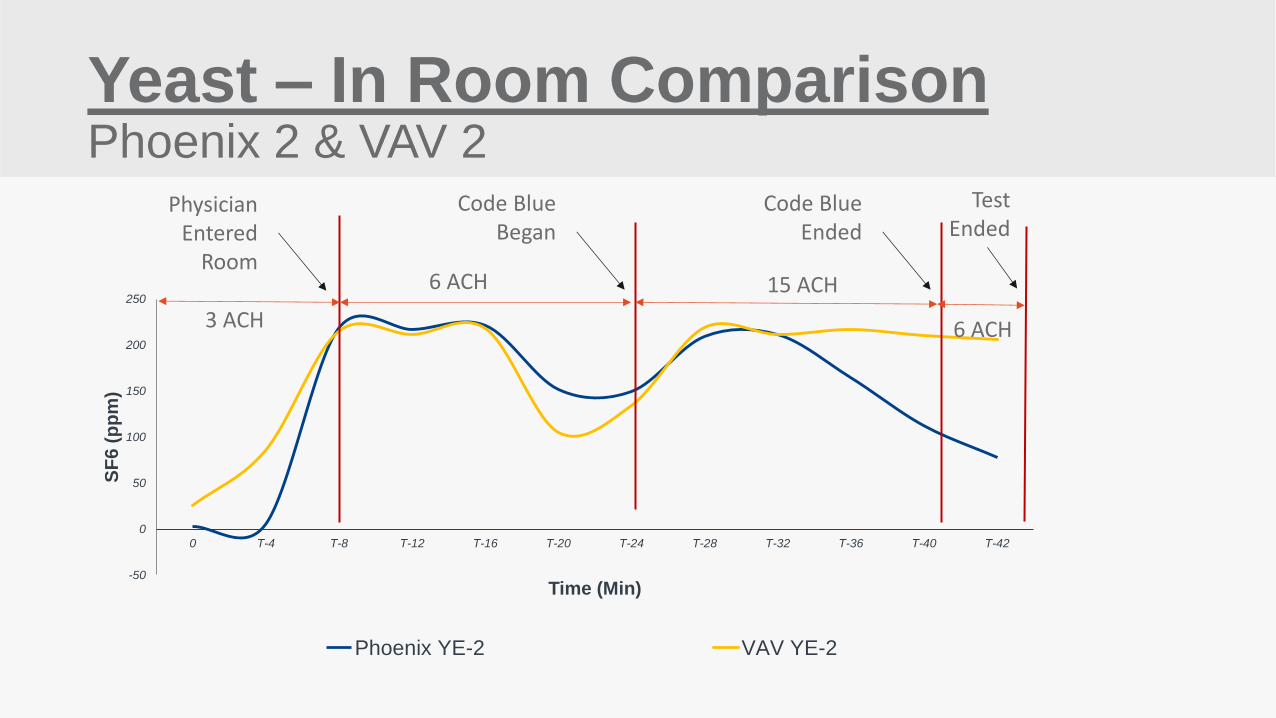
Yeast – In Room Comparison Phoenix 2 & VAV 2
-50
0
50
100
150
200
250
0 T-4 T-8 T-12 T-16 T-20 T-24 T-28 T-32 T-36 T-40 T-42
SF
6 (
pp
m)
Time (Min)
Phoenix YE-2 VAV YE-2
3 ACH
6 ACH 15 ACH
6 ACH
Physician Entered
Room
Code Blue Began
Code Blue Ended
Test Ended
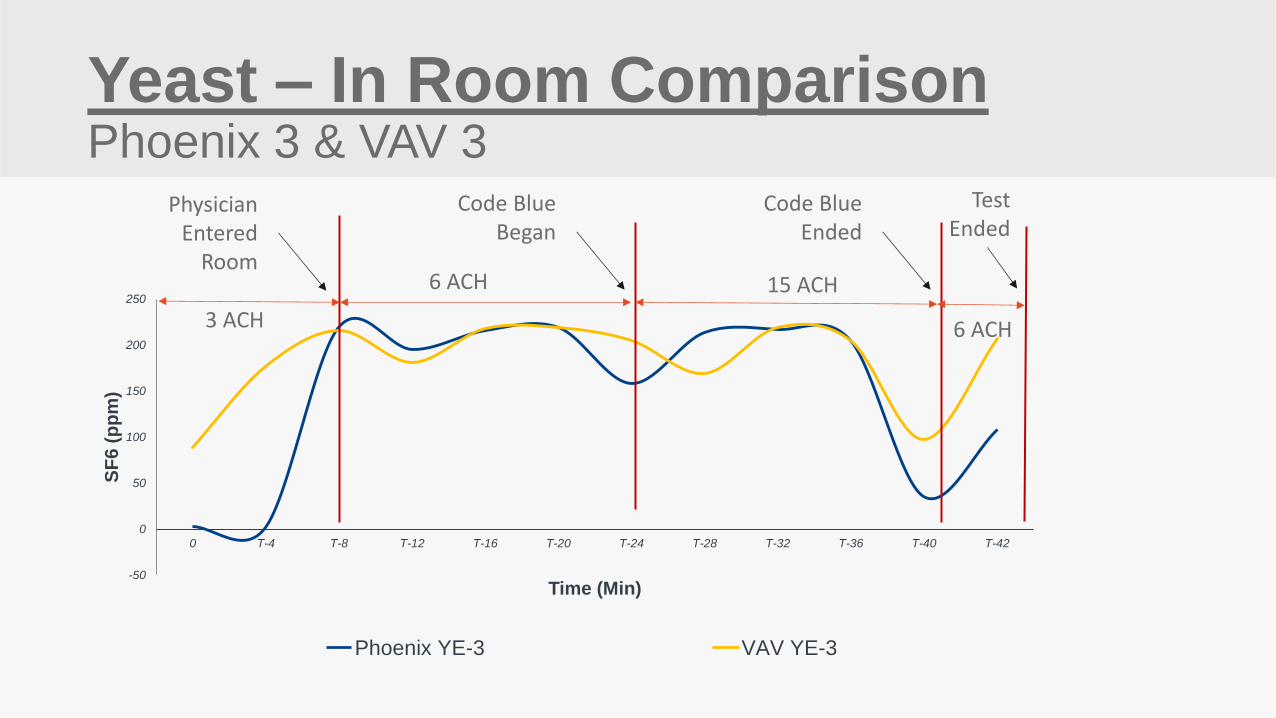
Yeast – In Room Comparison Phoenix 3 & VAV 3
-50
0
50
100
150
200
250
0 T-4 T-8 T-12 T-16 T-20 T-24 T-28 T-32 T-36 T-40 T-42
SF
6 (
pp
m)
Time (Min)
Phoenix YE-3 VAV YE-3
3 ACH
6 ACH 15 ACH
6 ACH
Physician Entered
Room
Code Blue Began
Code Blue Ended
Test Ended
Methods - “Statistics”
1. Data were assessed for normalcy by the Shapiro-Wilk and the KS normality
tests
2. Parametric data were compared with one way student’s t test or ANOVA with
post hoc multiple comparison’s test.
3. Nonparametric data were compared with the Kruskal Wallace test or Mann-
Whitney
4. P-values less than 0.05 were considered statistically significant.
ICU Room-Conclusions
1. ICU Room was statistically cleaner than the hallway during all occupancy
modes for both tracer gas and yeast.
2. Phoenix air valves kept the room statistically cleaner than the air terminal
(VAV) for all tracer gas tests.
3. Higher saturation levels of yeast in the hallway did not yield a statistically
significant cleaner “in room” comparison by either Phoenix or VAV
Cost Benefit Analysis
A cost benefit analysis was performed to provide information on the operational
benefits of setting up multiple ventilation operating modes based on occupancy
and room clinical acuities.
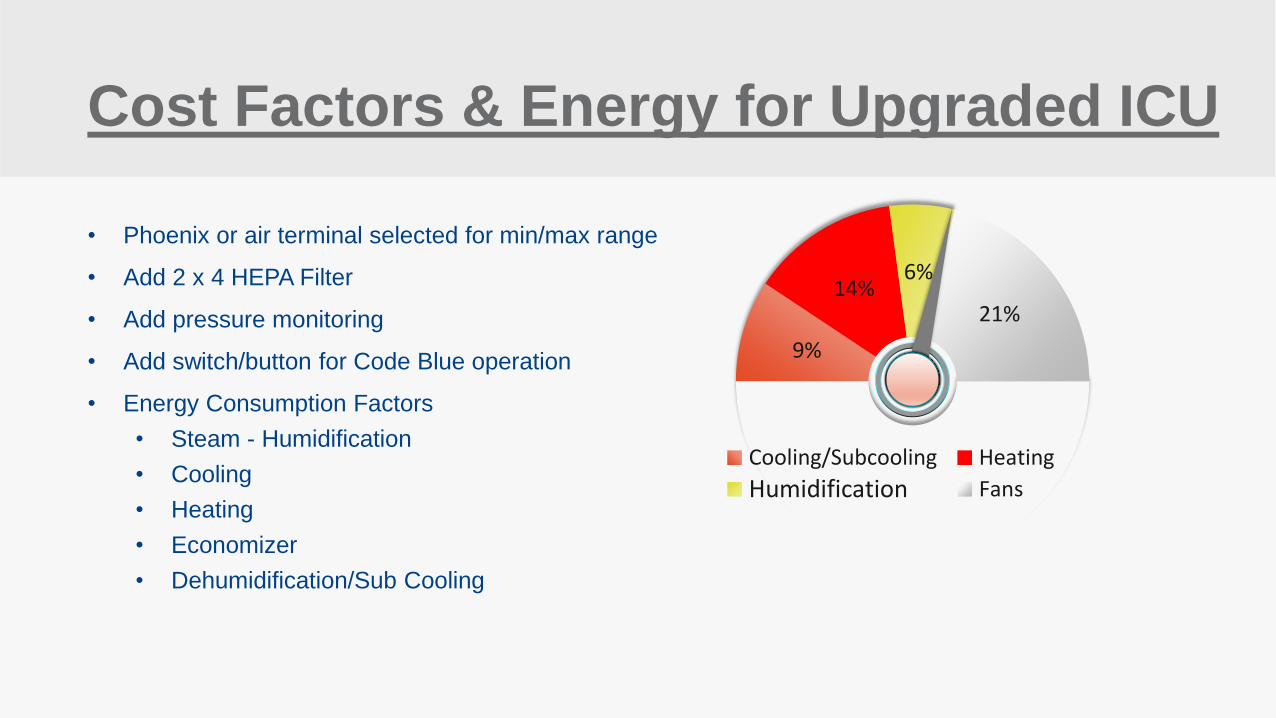
Cost Factors & Energy for Upgraded ICU
• Phoenix or air terminal selected for min/max range
• Add 2 x 4 HEPA Filter
• Add pressure monitoring
• Add switch/button for Code Blue operation
• Energy Consumption Factors
• Steam - Humidification
• Cooling
• Heating
• Economizer
• Dehumidification/Sub Cooling
9%
14% 6%
21%
50% Cooling/Subcooling Heating
Humidification Fans
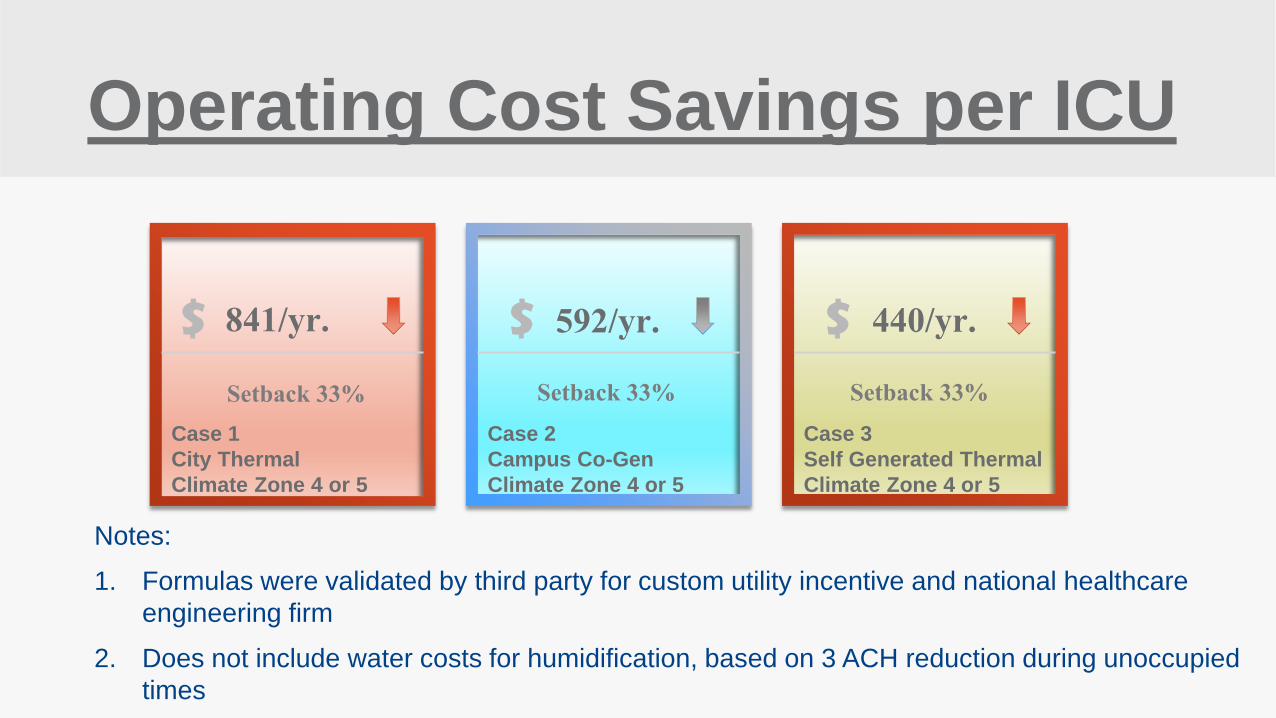
Notes:
1. Formulas were validated by third party for custom utility incentive and national healthcare
engineering firm
2. Does not include water costs for humidification, based on 3 ACH reduction during unoccupied
times
Case 1
City Thermal
Climate Zone 4 or 5
841/yr. Setback 33%
$
Case 2
Campus Co-Gen
Climate Zone 4 or 5
$
Case 3
Self Generated Thermal
Climate Zone 4 or 5
$ 592/yr. 440/yr. Setback 33% Setback 33%
Operating Cost Savings per ICU
Thank You! Questions?
EQI Team –
“Applying Research to help
Improve
Everyday Healthcare”
Recommended