19 February 2018
ANGLO AMERICAN PLATINUM 2017 ANNUAL RESULTS PRESENTATION
Mogalakwena mine
2
CAUTIONARY STATEMENT
Front cover image: Mogalakwena mine
Disclaimer: This presentation has been prepared by Anglo American Platinum Limited (“Anglo American Platinum”) and comprises the written materials/slides for a presentation concerning Anglo
American Platinum. By attending this presentation and/or reviewing the slides you agree to be bound by the following conditions.
This presentation is for information purposes only and does not constitute an offer to sell or the solicitation of an offer to buy shares in Anglo American Platinum. Further, it does not constitute a
recommendation by Anglo American Platinum or any other party to sell or buy shares in Anglo American Platinum or any other securities. All written or oral forward-looking statements attributable to
Anglo American Platinum or persons acting on their behalf are qualified in their entirety by these cautionary statements.
Forward-Looking Statements
This presentation includes forward-looking statements. All statements, other than statements of historical facts included in this presentation, including, without limitation, those regarding Anglo
American Platinum’s financial position, business, acquisition and divestment strategy, plans and objectives of management for future operations (including development plans and objectives relating
to Anglo American Platinum’s products, production forecasts and reserve and resource positions), are forward-looking statements. By their nature, such forward-looking statements involve known and
unknown risks, uncertainties and other factors which may cause the actual results, performance or achievements of Anglo American Platinum, or industry results, to be materially different from any
future results, performance or achievements expressed or implied by such forward-looking statements.
Such forward-looking statements are based on numerous assumptions regarding Anglo American Platinum’s present and future business strategies and the environment in which
Anglo American Platinum will operate in the future. Important factors that could cause Anglo American Platinum’s actual results, performance or achievements to differ materially from those in the
forward-looking statements include, among others, levels of actual production during any period, levels of global demand and commodity market prices, mineral resource exploration and development
capabilities, recovery rates and other operational capabilities, the availability of mining and processing equipment, the ability to produce and transport products profitably, the impact of foreign
currency exchange rates on market prices and operating costs, the availability of sufficient credit, the effects of inflation, political uncertainty and economic conditions in relevant areas of the world, the
actions of competitors, activities by governmental authorities such as changes in taxation or safety, health, environmental or other types of regulation in the countries where Anglo American Platinum
operates, conflicts over land and resource ownership rights and such other risk factors identified in Anglo American Platinum’s most recent Annual Report. Forward-looking statements should,
therefore, be construed in light of such risk factors and undue reliance should not be placed on forward-looking statements. These forward-looking statements speak only as of the date of this
presentation. Anglo American Platinum expressly disclaims any obligation or undertaking (except as required by applicable law, the Listings Requirements of the securities exchange of the JSE
Limited in South Africa and any other applicable regulations) to release publicly any updates or revisions to any forward-looking statement contained herein to reflect any change in Anglo American
Platinum’s expectations with regard thereto or any change in events, conditions or circumstances on which any such statement is based.
Nothing in this presentation should be interpreted to mean that future earnings per share of Anglo American Platinum will necessarily match or exceed its historical published earnings per share.
Certain statistical and other information about Anglo American Platinum included in this presentation is sourced from publicly available third party sources. As such it presents the views of those third
parties, but may not necessarily correspond to the views held by Anglo American Platinum.
No Investment Advice
This presentation has been prepared without reference to your particular investment objectives, financial situation, taxation position and particular needs. It is important that you view this presentation
in its entirety. If you are in any doubt in relation to these matters, you should consult your stockbroker, bank manager, solicitor, accountant, taxation adviser or other independent financial adviser
(where applicable, as authorised in South Africa, under the Financial Advisory and Intermediary Services Act 37 of 2002).
Alternative performance measures
Throughout this presentation a range of financial and non-financial measures are used to assess our performance, including a number of the financial measures that are not defined under IFRS,
which are termed ‘alternative performance measures’ (APMs). Management uses these measures to monitor Anglo American Platinum’s financial performance alongside IFRS measures because they
help illustrate the underlying financial performance and position of the Anglo American Platinum. These APMs should be considered in addition to, and not as a substitute for, or as superior to,
measures of financial performance, financial position or cash flows reported in accordance with IFRS. APMs are not uniformly defined by all companies, including those in Anglo American Platinum’s
industry. Accordingly, it may not be comparable with similarly titled measures and disclosures by other companies.
3
1. Safety & sustainability performance Chris Griffith
2017 ANNUAL RESULTS AGENDA
1. Business performance Chris Griffith
3. Positioning for the future Chris Griffith
2. Financial results Ian Botha
3.P
G
M
PGM market review Chris Griffith
4
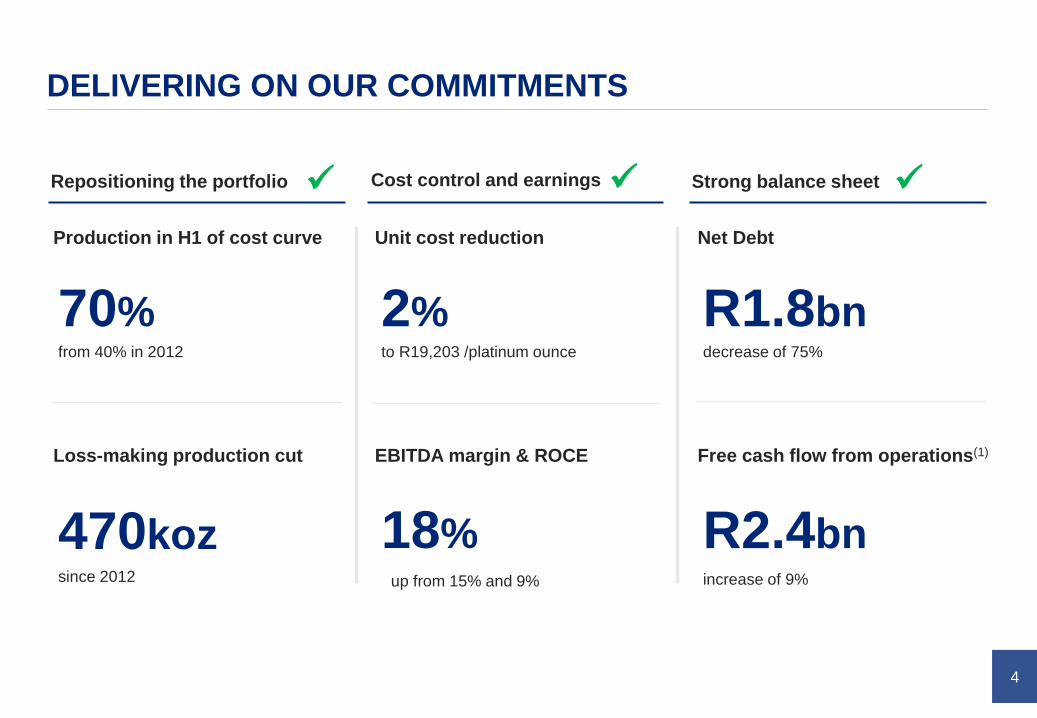
DELIVERING ON OUR COMMITMENTS
18%
70%
Production in H1 of cost curve
R2.4bn
R1.8bn
Cost control and earningsRepositioning the portfolio Strong balance sheet
470koz
Loss-making production cut
2%from 40% in 2012 to R19,203 /platinum ounce decrease of 75%
increase of 9%
✓ ✓ ✓
since 2012 up from 15% and 9%
Unit cost reduction Net Debt
EBITDA margin & ROCE Free cash flow from operations(1)
2017 RESULTS
Chris Griffith
SAFETY & SUSTAINABILITY PERFORMANCE
Groenfontein vegetable project at Mogalakwena
6
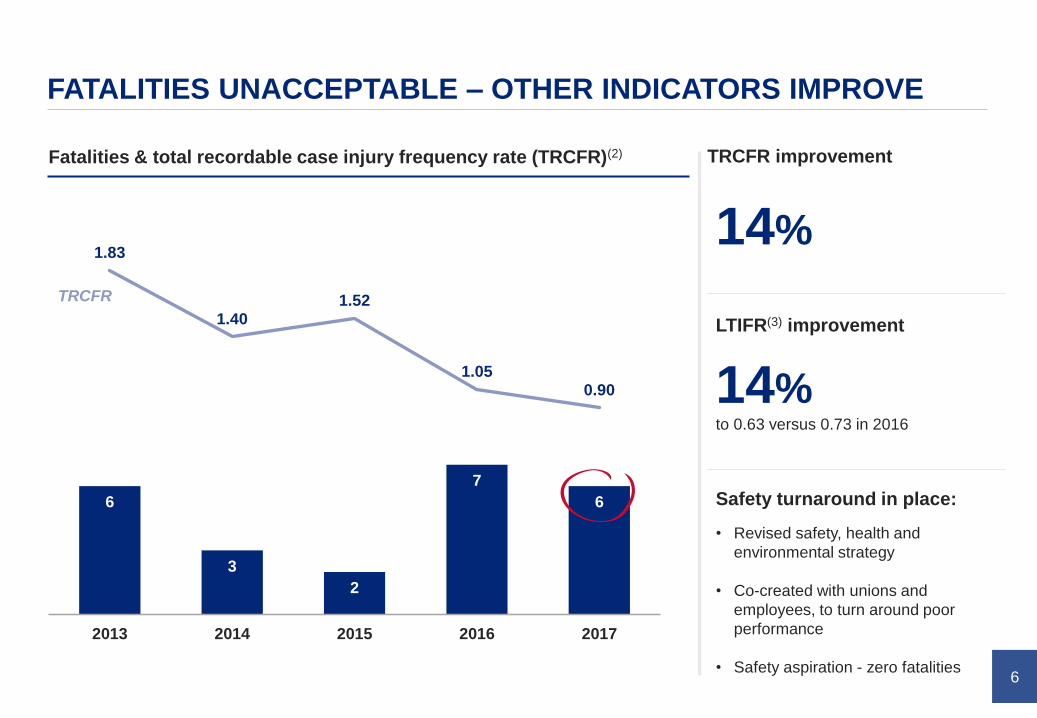
FATALITIES UNACCEPTABLE – OTHER INDICATORS IMPROVE
Fatalities & total recordable case injury frequency rate (TRCFR)(2) TRCFR improvement
6
3
2
7
6
1.83
1.401.52
1.050.90
-0.4
0.1
0.6
1.1
1.6
2.1
0
2
4
6
8
10
12
14
16
18
2013 2014 2015 2016 2017
14%
Safety turnaround in place:
• Revised safety, health and
environmental strategy
• Co-created with unions and
employees, to turn around poor
performance
• Safety aspiration - zero fatalities
14%
LTIFR(3) improvement
to 0.63 versus 0.73 in 2016
TRCFR
7
63
51
27
14
4
1,340
1,020 987
660582
-1,500
-1,000
-500
0
500
1,000
1,500
0
10
20
30
40
50
60
70
2013 2014 2015 2017 2017
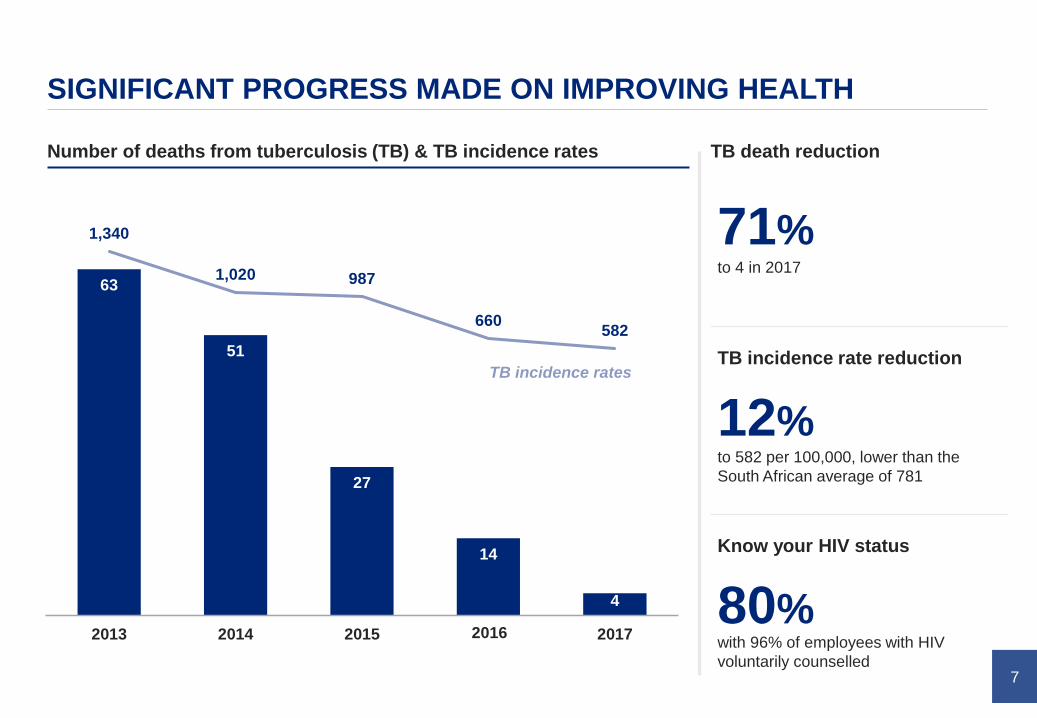
SIGNIFICANT PROGRESS MADE ON IMPROVING HEALTH
71%
TB death reduction
12%
TB incidence rate reduction
80%
Know your HIV status
to 4 in 2017
to 582 per 100,000, lower than the
South African average of 781
with 96% of employees with HIV
voluntarily counselled
TB incidence rates
Number of deaths from tuberculosis (TB) & TB incidence rates
2016
8
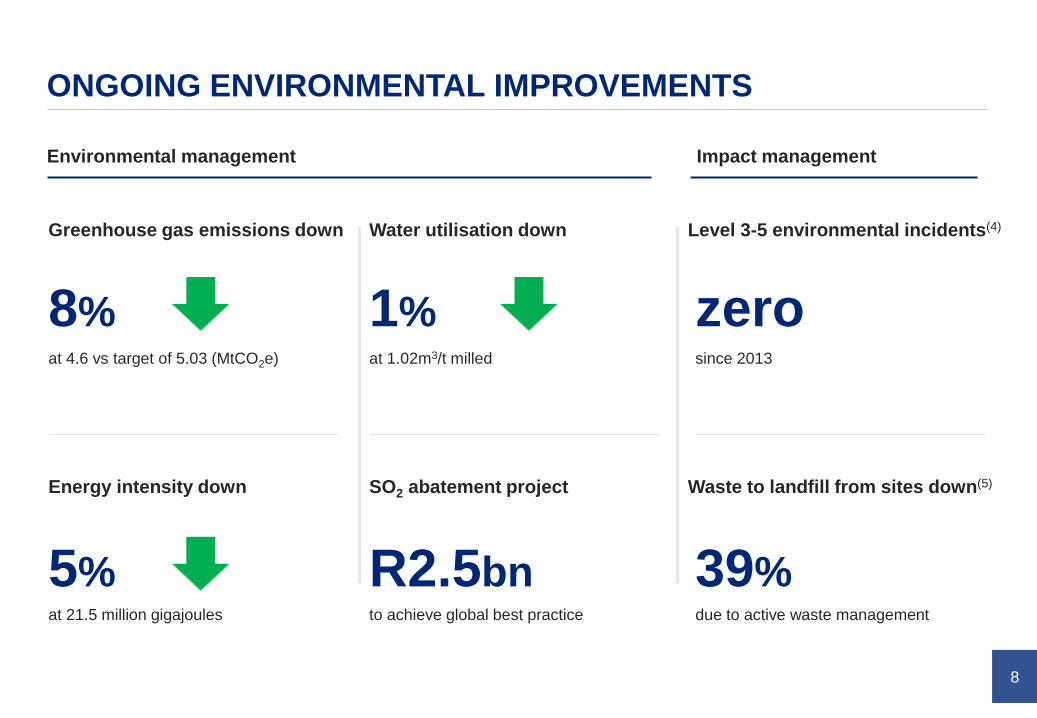
ONGOING ENVIRONMENTAL IMPROVEMENTS
1%
Water utilisation down
5%
Energy intensity down
zero
39%
Environmental management
at 21.5 million gigajoules
at 1.02m3/t milled since 2013
Impact management
8%
Greenhouse gas emissions down
at 4.6 vs target of 5.03 (MtCO2e)
Level 3-5 environmental incidents(4)
to achieve global best practice due to active waste management
SO2 abatement project
R2.5bn
Waste to landfill from sites down(5)
9
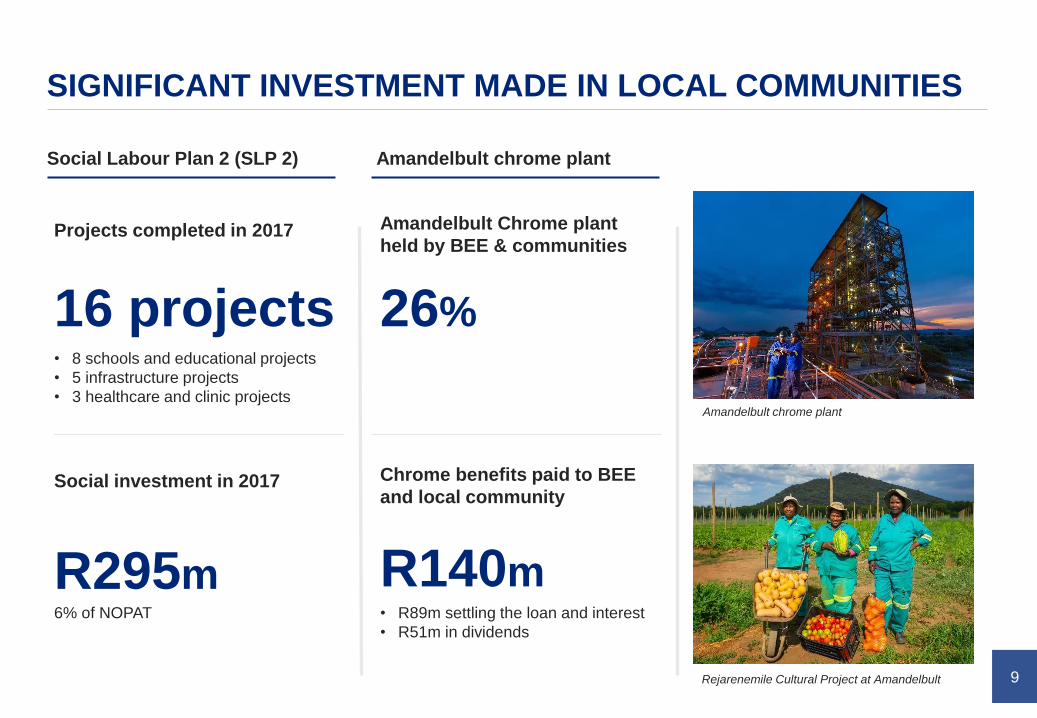
SIGNIFICANT INVESTMENT MADE IN LOCAL COMMUNITIES
16 projects
Projects completed in 2017
Chrome benefits paid to BEE
and local community
R295m
Social investment in 2017
Amandelbult Chrome plant
held by BEE & communities
26%
R140m
Social Labour Plan 2 (SLP 2)
6% of NOPAT
• 8 schools and educational projects
• 5 infrastructure projects
• 3 healthcare and clinic projects
Amandelbult chrome plant
• R89m settling the loan and interest
• R51m in dividends
Amandelbult chrome plant
Rejarenemile Cultural Project at Amandelbult
2017 RESULTS
Chris Griffith
BUSINESS PERFORMANCE
Amandelbult chrome spiral plant
11
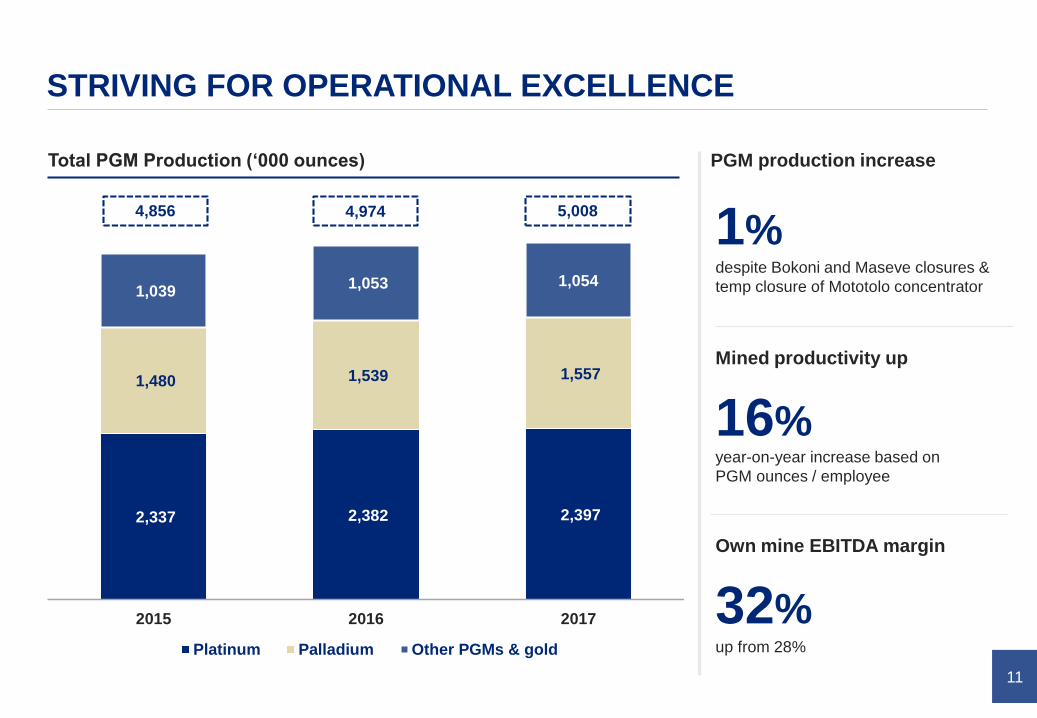
2,337 2,382 2,397
1,480 1,539 1,557
1,039 1,053 1,054
2015 2016 2017
Platinum Palladium Other PGMs & gold
STRIVING FOR OPERATIONAL EXCELLENCE
1%
PGM production increase
5,0084,9744,856
16%
Mined productivity up
32%
Own mine EBITDA margin
up from 28%
despite Bokoni and Maseve closures &
temp closure of Mototolo concentrator
year-on-year increase based on
PGM ounces / employee
Total PGM Production (‘000 ounces)
12
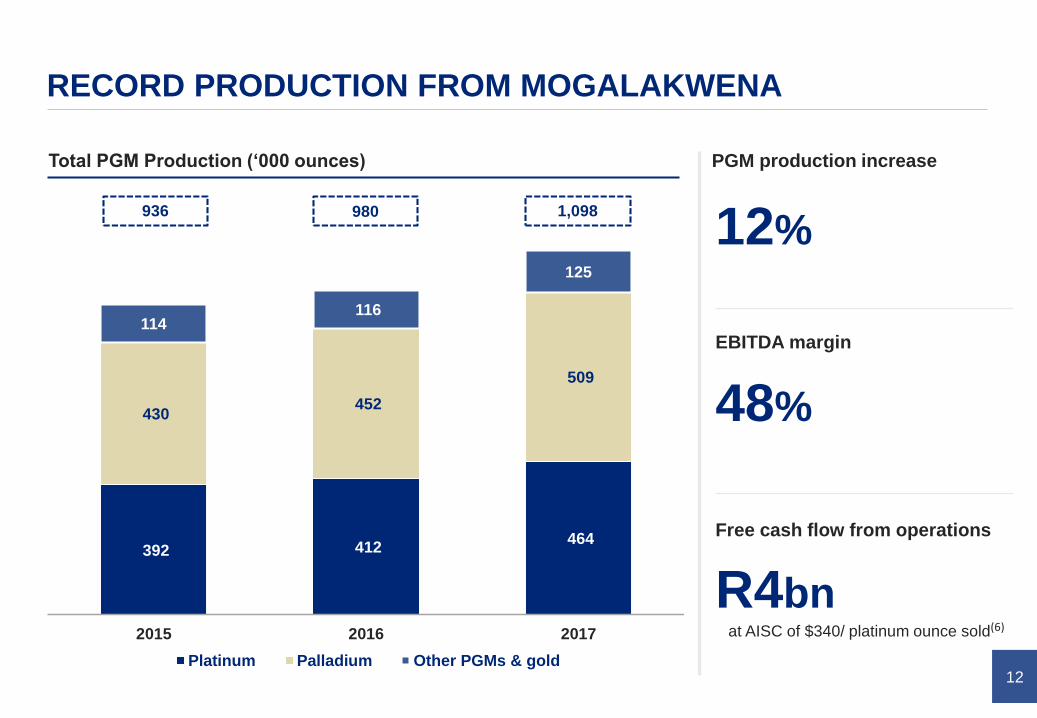
RECORD PRODUCTION FROM MOGALAKWENA
12%
PGM production increase
1,098980936
392 412 464
430 452
509
114116
125
2015 2016 2017
Platinum Palladium Other PGMs & gold
48%
EBITDA margin
R4bn
Free cash flow from operations
at AISC of $340/ platinum ounce sold(6)
Total PGM Production (‘000 ounces)
13
AMANDELBULT TURNAROUND PLAN ADVANCING
3%
Total PGM production decrease
654kt
Chrome production
10%
EBITDA margin
generating R577 million of attributable
operating FCF
to 858,000 PGM ounces
~25%
generating R91 million attributable
operating FCF
All-in sustaining cost ($/platinum ounce sold)
1,072
955
820
Actual 2016H1 2017
achieved prices
Actual 2017 Operationalimprovements& Dishab UG2
Chromeexpansions
62E 15E Potential 2022H1 2017
achieved prices
1,046(7)
(8) (9)End result
H1 2017
achieved prices
14
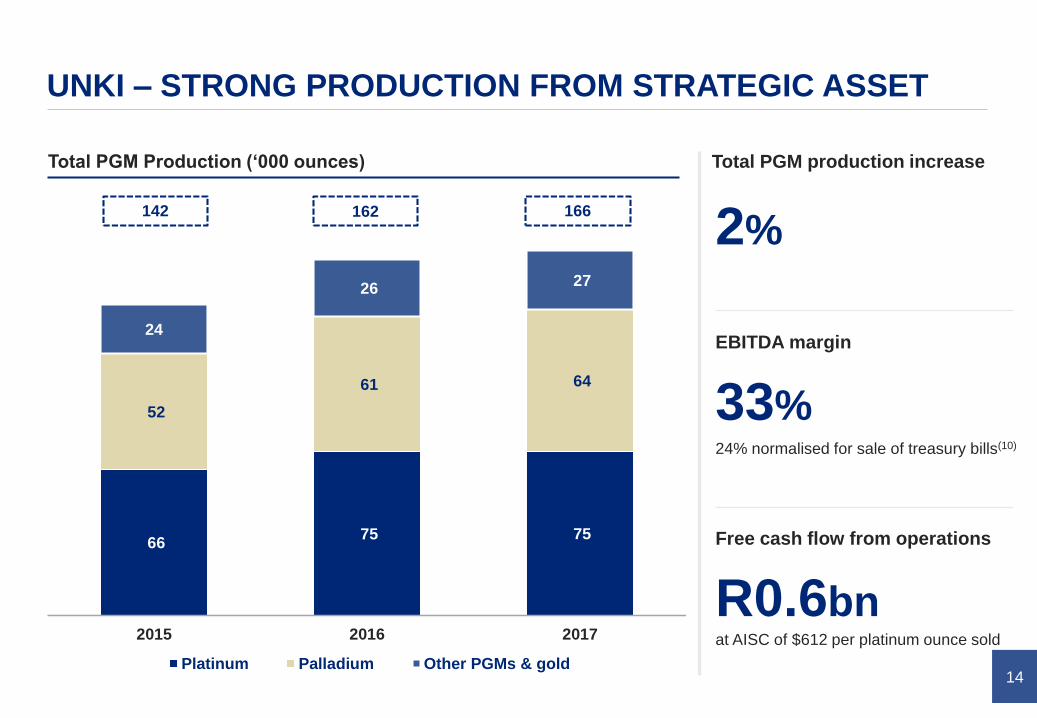
UNKI – STRONG PRODUCTION FROM STRATEGIC ASSET
2%
Total PGM production increase
33%
EBITDA margin
66 75 75
52
61 64
24
26 27
2015 2016 2017
Platinum Palladium Other PGMs & gold
166162142
R0.6bn
Free cash flow from operations
at AISC of $612 per platinum ounce sold
24% normalised for sale of treasury bills(10)
Total PGM Production (‘000 ounces)
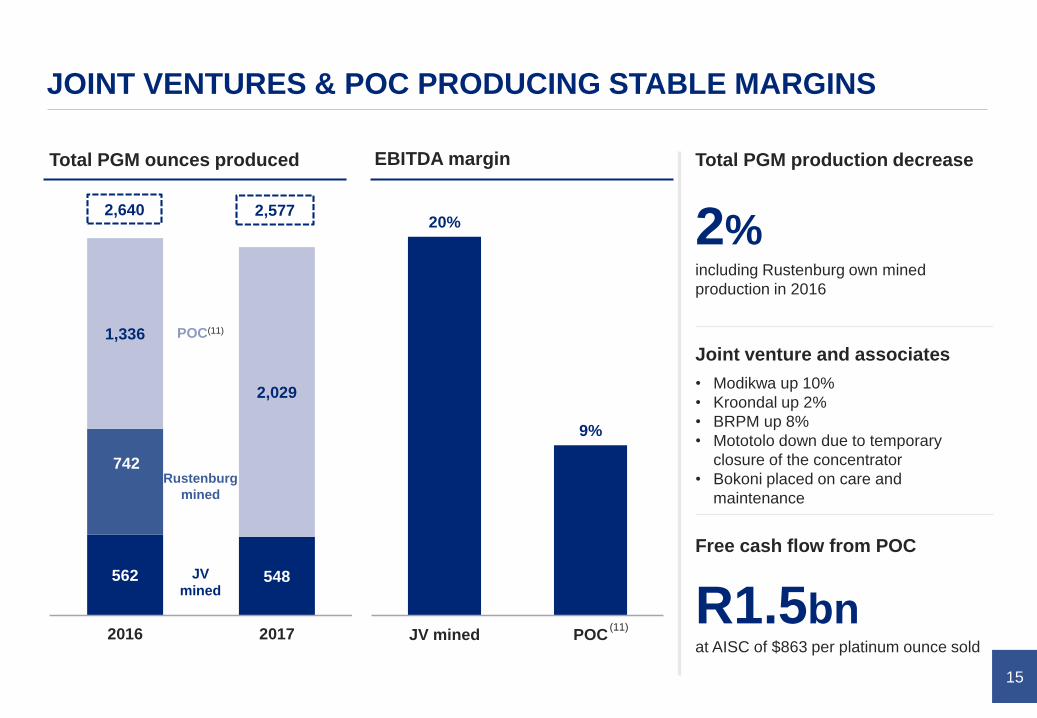
15
20%
9%
JV mined POC
562 548
742
1,336
2,029
2016 2017
JOINT VENTURES & POC PRODUCING STABLE MARGINS
2%
Total PGM production decrease
Joint venture and associates
R1.5bn
Free cash flow from POC
Total PGM ounces produced EBITDA margin
JV
mined
POC(11)
including Rustenburg own mined
production in 2016
at AISC of $863 per platinum ounce sold
Rustenburg
mined
2,5772,640
• Modikwa up 10%
• Kroondal up 2%
• BRPM up 8%
• Mototolo down due to temporary
closure of the concentrator
• Bokoni placed on care and
maintenance
(11)
16
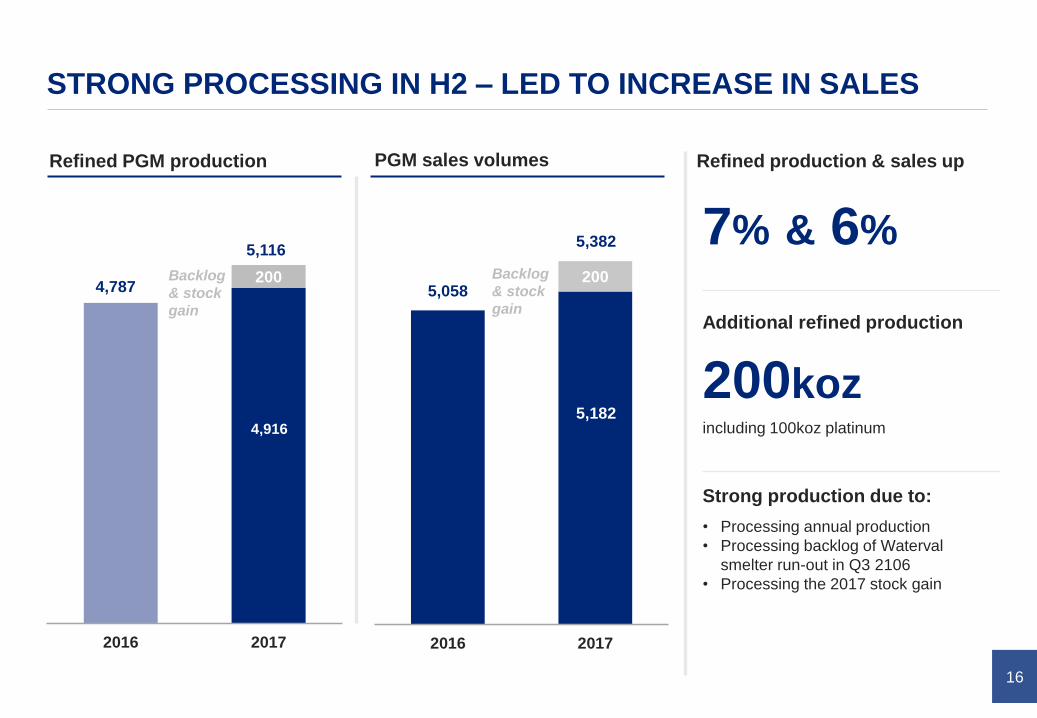
2005,058
2016 2017
STRONG PROCESSING IN H2 – LED TO INCREASE IN SALES
Refined PGM production PGM sales volumes
• Processing annual production
• Processing backlog of Waterval
smelter run-out in Q3 2106
• Processing the 2017 stock gain
Strong production due to:
7% & 6%
Refined production & sales up
200koz
Additional refined production
4,787
5,116
200
2016 2017
Backlog
& stock
gain
Backlog
& stock
gain
including 100koz platinum4,9165,182
5,382
2017 RESULTS
Ian Botha
FINANCIALS
Inserting explosives into drill holes - Mogalakwena
18
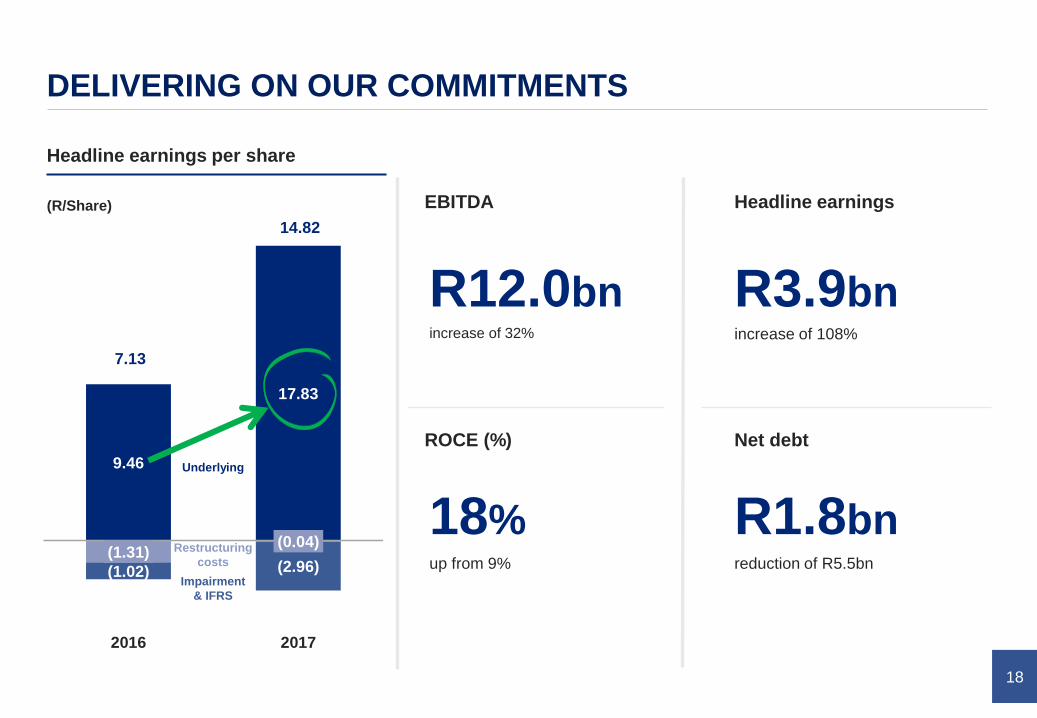
9.46
17.83
(1.31)(0.04)
(1.02) (2.96)
2016 2017
DELIVERING ON OUR COMMITMENTS
R3.9bn
ROCE (%)
Headline earnings
increase of 108%
R12.0bnincrease of 32%
EBITDA
18%up from 9%
Net debt
R1.8bnreduction of R5.5bn
14.82
7.13
Headline earnings per share
(R/Share)
Underlying
Impairment
& IFRS
Restructuring
costs
19
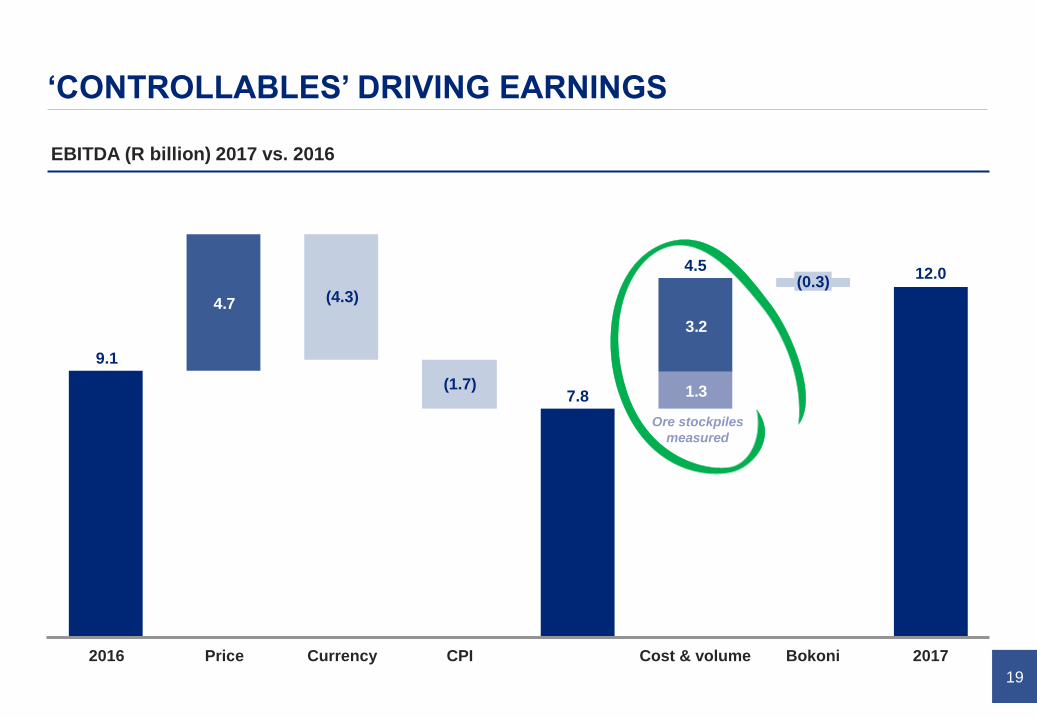
1.3
4.7
3.2
9.1
4.5(0.3)
CPIPrice2016 2017
(1.7)
Bokoni
7.8
12.0
Currency
(4.3)
Cost & volume
‘CONTROLLABLES’ DRIVING EARNINGS
108
EBITDA (R billion) 2017 vs. 2016
Ore stockpiles
measured
20
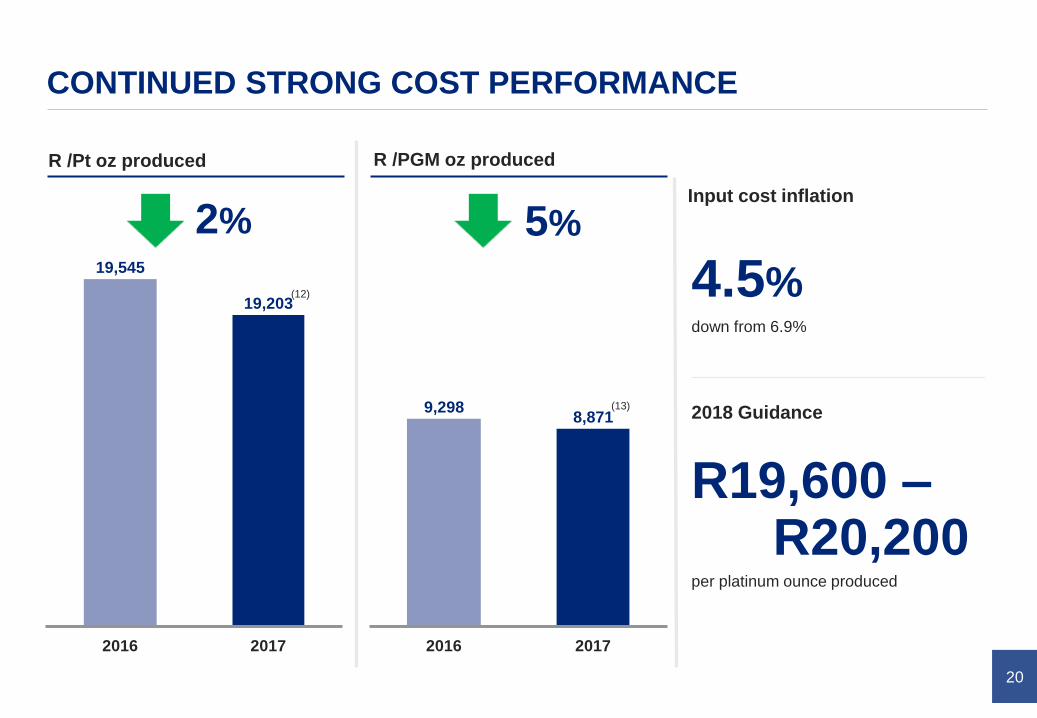
CONTINUED STRONG COST PERFORMANCE
R /Pt oz produced
Input cost inflation
R /PGM oz produced
4.5%
2018 Guidance
R19,600 –
per platinum ounce produced
19,203
20172016
19,545
9,298
2016 2017
8,871
(12)
(13)
2% 5%
down from 6.9%
R20,200
21
40%
70%
60%
30%
2012 2017
70% OF AAP PRODUCTION NOW IN H1 OF COST CURVE
AAP production on cost curve
Overhead reduction guidance
Rightsizing overheads (Rbn)
R0.3bnH2
H1
48%
post Union exit
• Restructured cost base
• Outperforming peer group
• Less exposure to inflationary cost
pressures – e.g. labour through
increased mechanisation
Structurally changed cost base
6.3
3.3
2012 2017
22
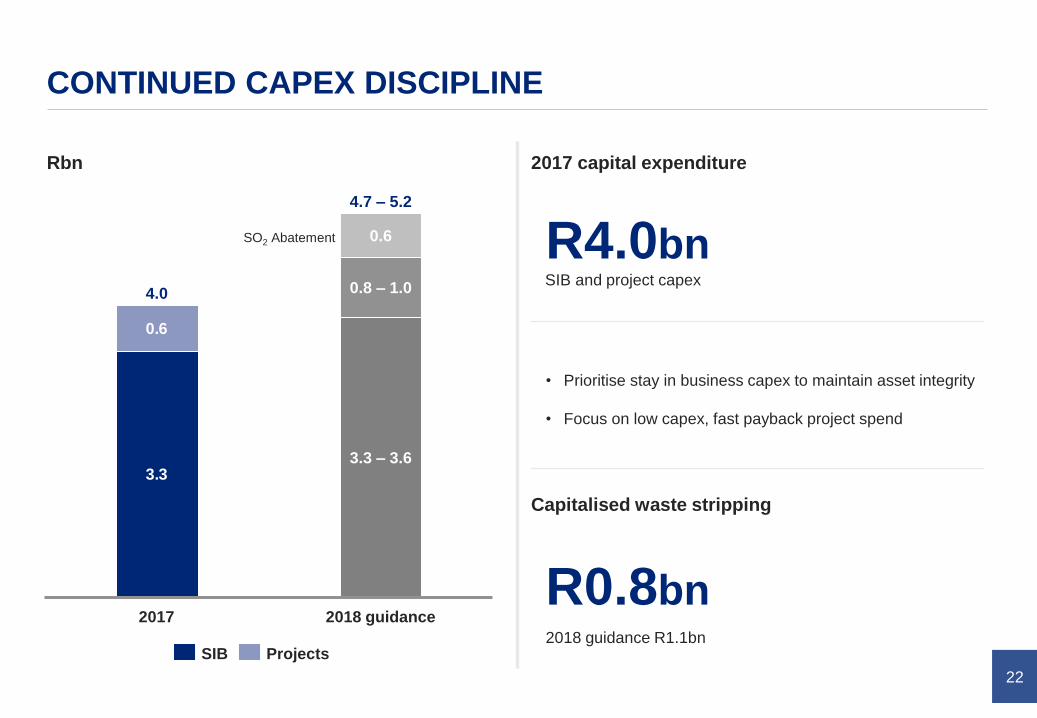
CONTINUED CAPEX DISCIPLINE
R4.0bn
R0.8bn
3.3
0.6
0.6
4.0
4.7 – 5.2
0.8 – 1.0
3.3 – 3.6
2018 guidance2017
Rbn
• Prioritise stay in business capex to maintain asset integrity
• Focus on low capex, fast payback project spend
2018 guidance R1.1bn
SO2 Abatement
2017 capital expenditure
Capitalised waste stripping
ProjectsSIB
SIB and project capex
23
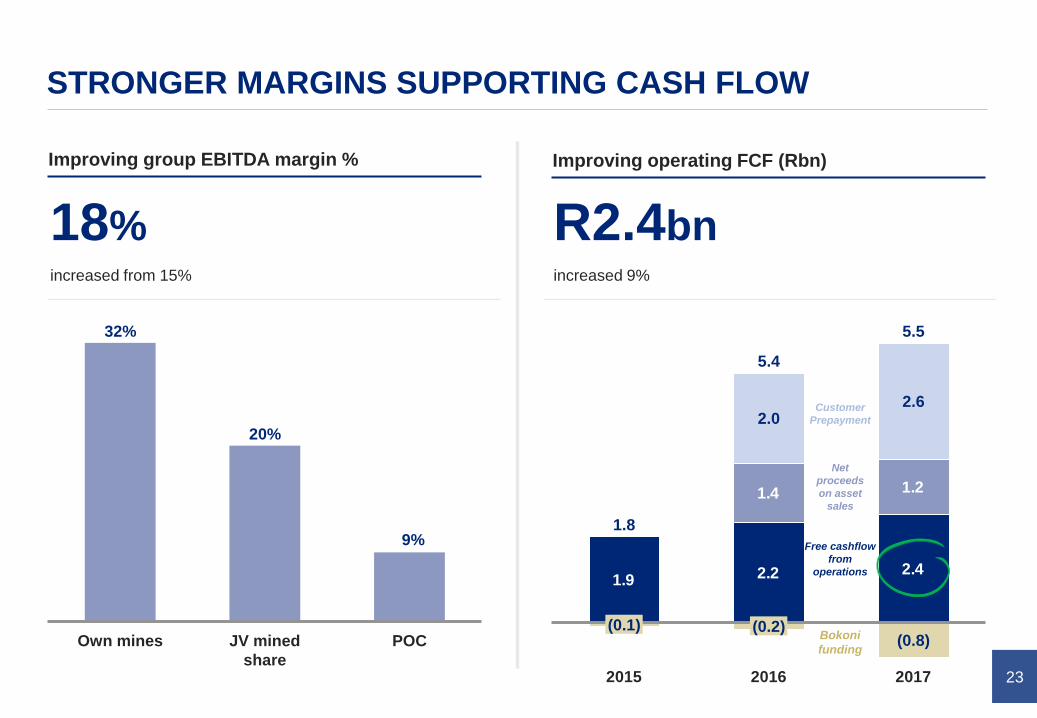
R2.4bn
STRONGER MARGINS SUPPORTING CASH FLOW
POC
8%
JV mined
share
20%
Own mines
32%
Improving group EBITDA margin %
2.2 2.4
1.4 1.2
1.9
(0.2)
2.0
2015
(0.8)
2017
5.4
5.5
2016
2.6
1.8
(0.1)
Improving operating FCF (Rbn)
18%increased from 15% increased 9%
Free cashflow
from
operations
Net
proceeds
on asset
sales
Bokoni
funding
Customer
Prepayment
9%
24
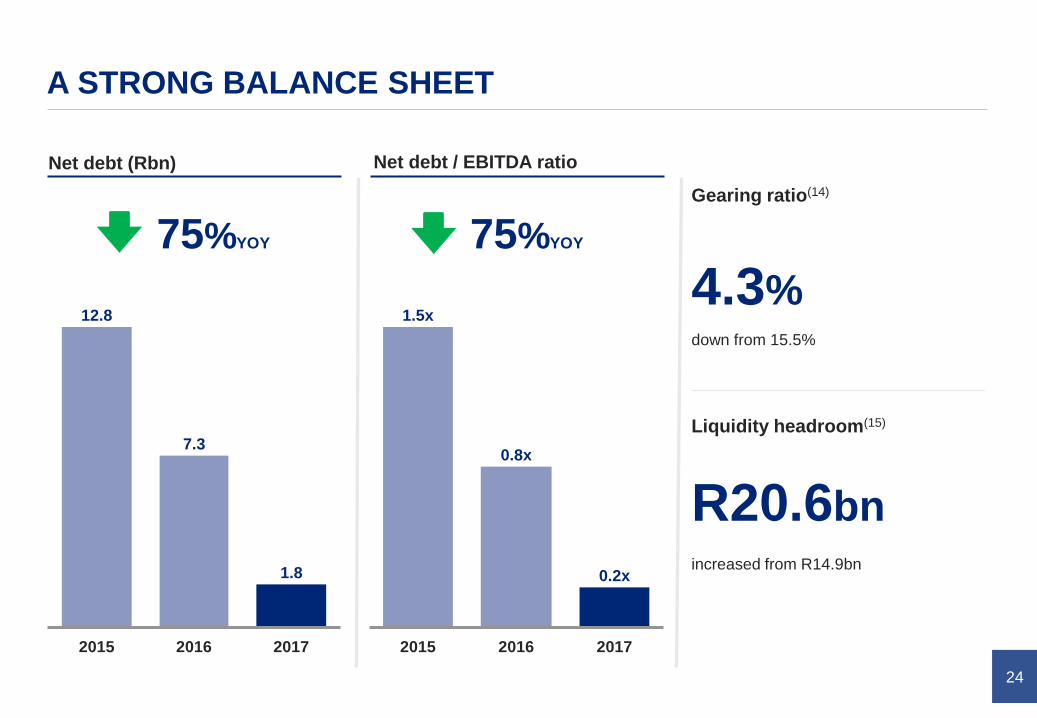
A STRONG BALANCE SHEET
2016
12.8
2017
7.3
1.8
2015
0.2x
1.5x
201720162015
0.8x
Net debt (Rbn)
Gearing ratio(14)
Net debt / EBITDA ratio
75%YOY 75%YOY
4.3%
Liquidity headroom(15)
R20.6bn
down from 15.5%
increased from R14.9bn
25
DISCIPLINED CAPITAL ALLOCATION
R10.2bn
(R5.5bn)
(R0.6bn)
• Free cash flow
• Reduction in net debt
• Discretionary capital
Capital allocation framework Focus on sustaining capex & net debt reduction
(R4.1bn) • Sustaining capex
Discretionary capital options
Cash flow after
sustaining capital
Balance sheet flexibility to support
base dividend
Discretionary capital options
Low cost, fast
payback project
spend
Future project
options
Additional
shareholder
returns
(16)
26
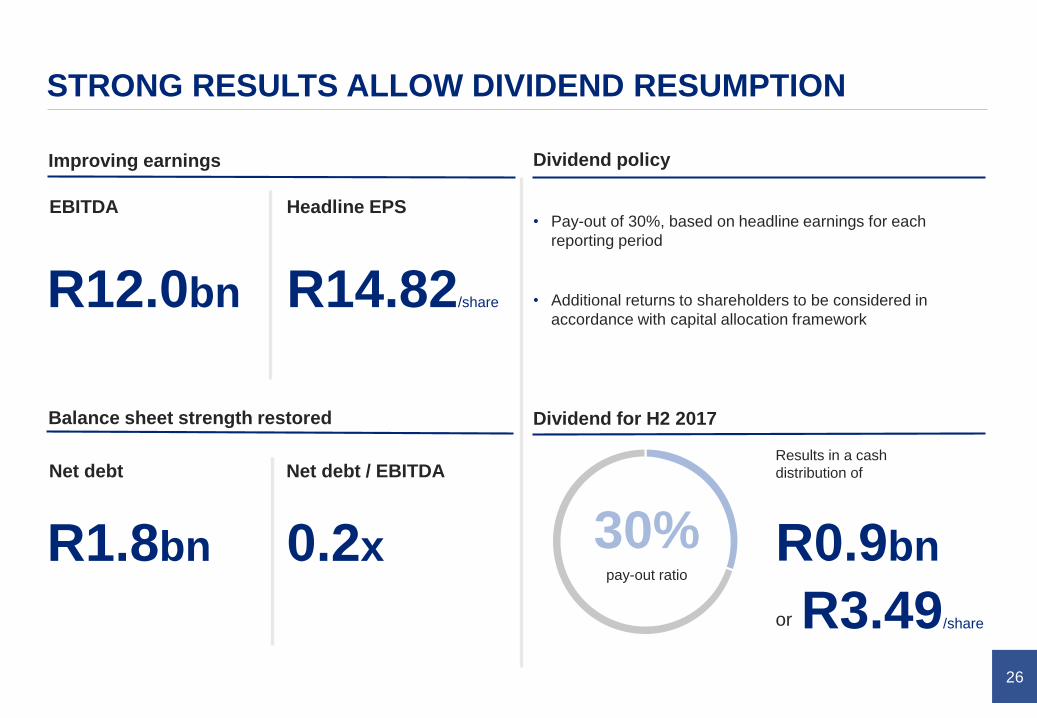
STRONG RESULTS ALLOW DIVIDEND RESUMPTION
R12.0bn R14.82/share
R1.8bn 0.2x
Dividend for H2 2017
30%pay-out ratio
R0.9bn
Results in a cash
distribution of
or R3.49/share
• Pay-out of 30%, based on headline earnings for each
reporting period
• Additional returns to shareholders to be considered in
accordance with capital allocation framework
Improving earnings
Balance sheet strength restored
Dividend policy
Headline EPSEBITDA
Net debt / EBITDANet debt
2017 RESULTS
Chris Griffith
PGM MARKET REVIEW
Platinum grain
28
75
100
125
150
175
200
225
Ja
n 1
7
Fe
b 1
7
Ma
r 1
7
Apr
17
Ma
y 1
7
Ju
n 1
7
Ju
l 17
Aug
17
Sep
17
Oct 1
7
Nov 1
7
Dec 1
7
Pt Pd Rh USD basket ZAR basket
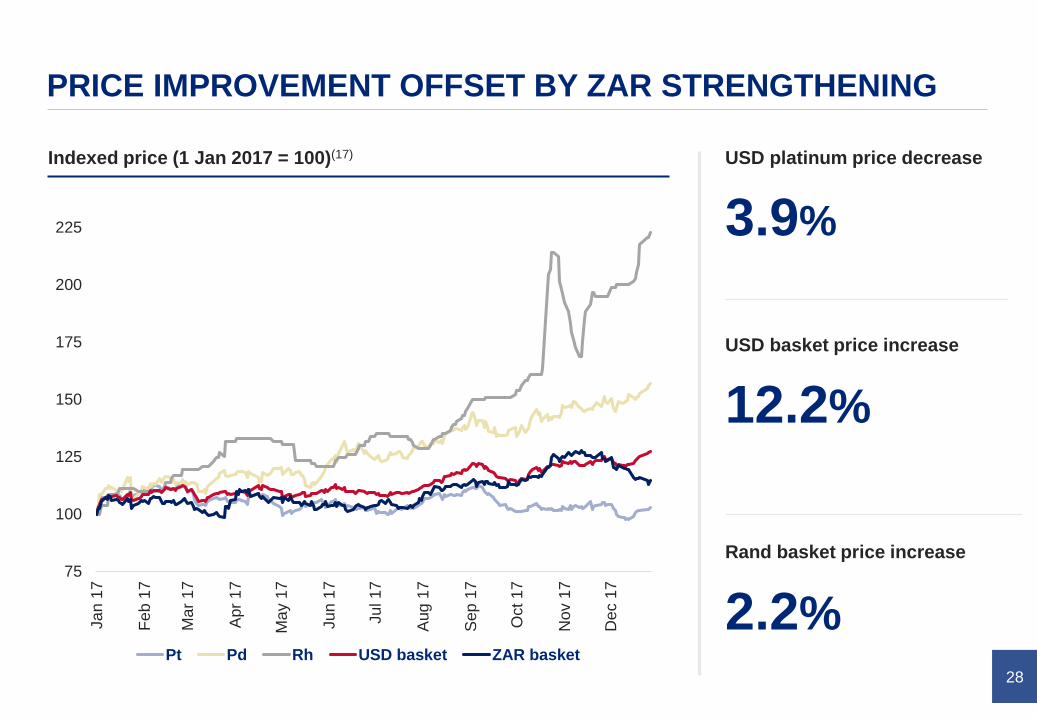
PRICE IMPROVEMENT OFFSET BY ZAR STRENGTHENING
12.2%
USD basket price increase
2.2%
Rand basket price increase
3.9%
USD platinum price decreaseIndexed price (1 Jan 2017 = 100)(17)
29
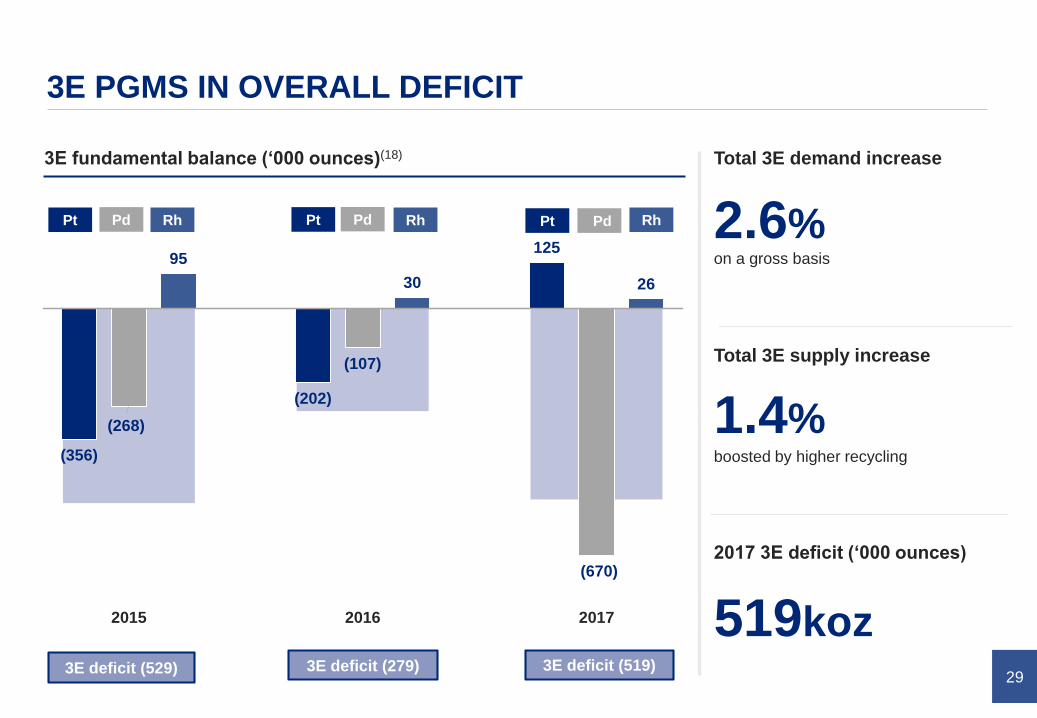
3E PGMS IN OVERALL DEFICIT
(356)
(202)
125
(268)
(107)
(670)
95
30 26
2015 2016 2017
Pt Pd Rh Pt Pd Rh Pt Pd Rh
3E deficit (519)3E deficit (279)3E deficit (529)
519koz
2017 3E deficit (‘000 ounces)
2.6%
Total 3E demand increase
1.4%
Total 3E supply increase
boosted by higher recycling
on a gross basis
3E fundamental balance (‘000 ounces)(18)
30
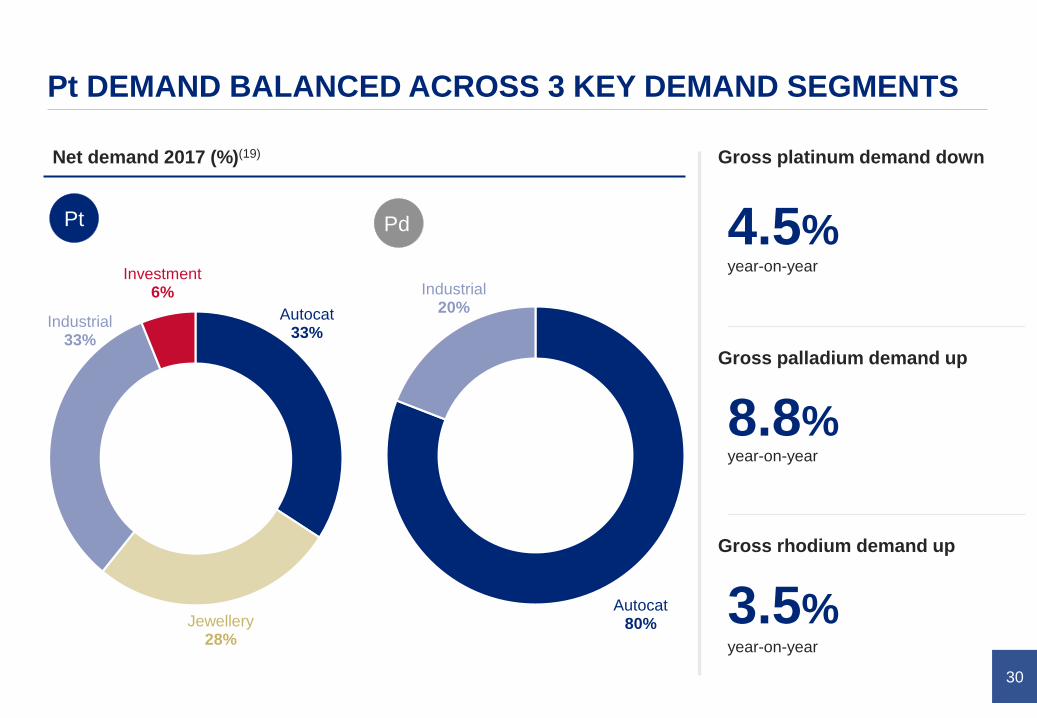
Pt DEMAND BALANCED ACROSS 3 KEY DEMAND SEGMENTS
4.5%
Gross platinum demand down
8.8%
Gross palladium demand up
3.5%
Gross rhodium demand up
year-on-year
year-on-year
year-on-year
Net demand 2017 (%)(19)
Autocat80%
Industrial20%Autocat
33%
Jewellery28%
Industrial33%
Investment6%
Pt Pd
31
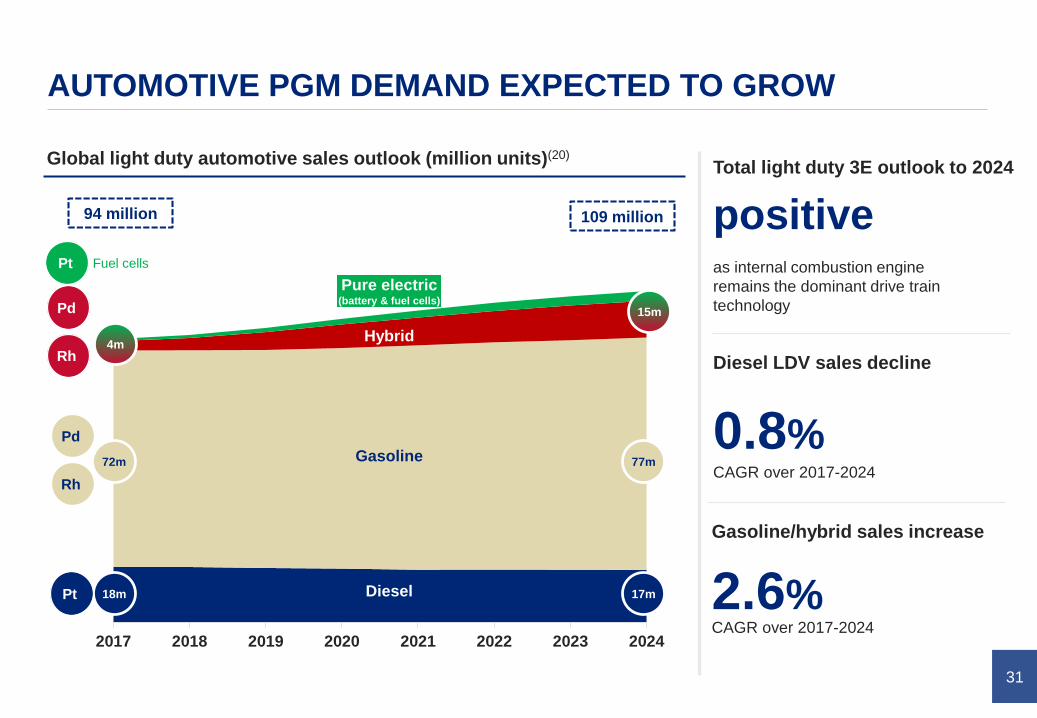
2017 2018 2019 2020 2021 2022 2023 2024
AUTOMOTIVE PGM DEMAND EXPECTED TO GROW
18m
Gasoline
DieselPt 17m
Pd
Rh
72m 77m
4m
15mHybrid
Pure electric(battery & fuel cells)
Pd
Rh
2.6%
Gasoline/hybrid sales increase
positive94 million 109 million
CAGR over 2017-2024
as internal combustion engine
remains the dominant drive train
technology
Hybrid
Total light duty 3E outlook to 2024Global light duty automotive sales outlook (million units)(20)
Pt Fuel cells
0.8%
Diesel LDV sales decline
CAGR over 2017-2024
32
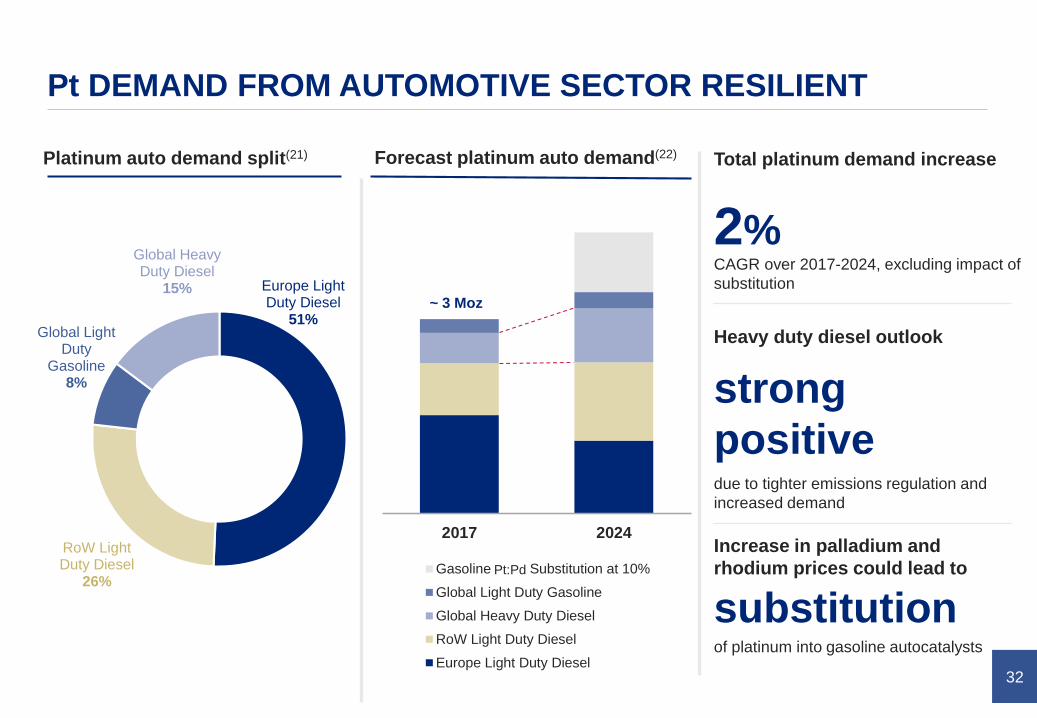
Pt DEMAND FROM AUTOMOTIVE SECTOR RESILIENT
2%
Total platinum demand increase
strong
positive
substitution
Increase in palladium and
rhodium prices could lead to
of platinum into gasoline autocatalysts
Forecast platinum auto demand(22)
CAGR over 2017-2024, excluding impact of
substitution
due to tighter emissions regulation and
increased demand
Platinum auto demand split(21)
Heavy duty diesel outlook
Europe Light Duty Diesel
51%
RoW Light Duty Diesel
26%
Global Light Duty
Gasoline8%
Global Heavy Duty Diesel
15%
2017 2024
Gasoline pt:pd Substitution at 10%
Global Light Duty Gasoline
Global Heavy Duty Diesel
RoW Light Duty Diesel
Europe Light Duty Diesel
~ 3 Moz
Pt:Pd
33
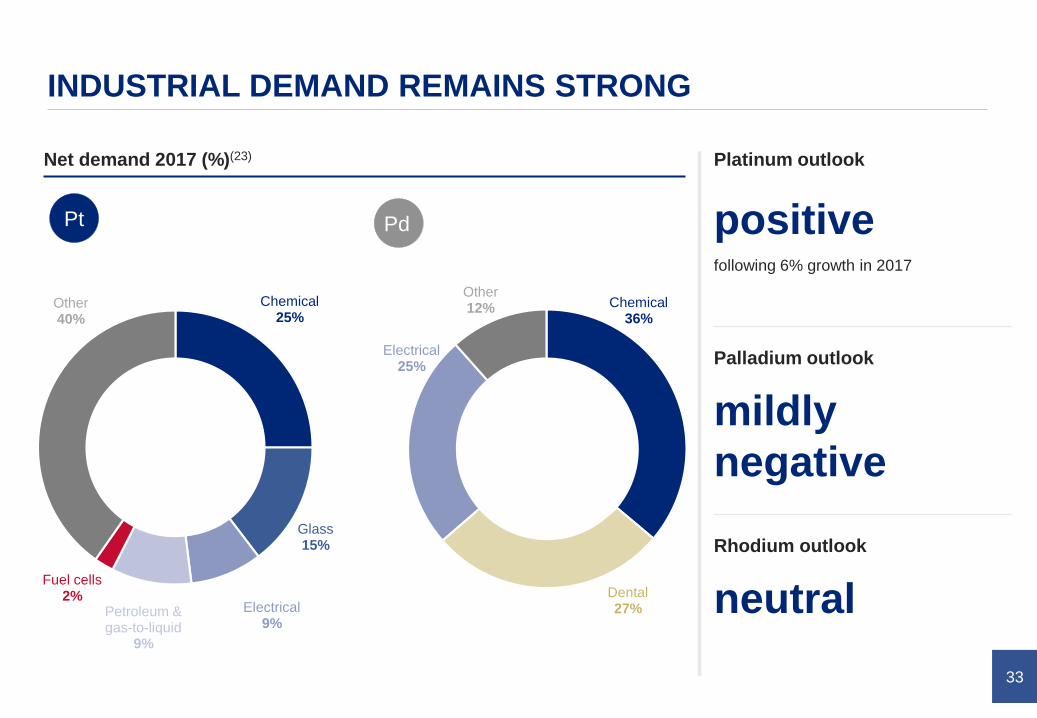
INDUSTRIAL DEMAND REMAINS STRONG
Pt Pd positive
Platinum outlook
mildly
negative
Palladium outlook
neutral
Rhodium outlook
following 6% growth in 2017
Net demand 2017 (%)(23)
Chemical25%
Glass15%
Electrical9%
Petroleum & gas-to-liquid
9%
Fuel cells2%
Other40%
Chemical36%
Dental27%
Electrical25%
Other12%
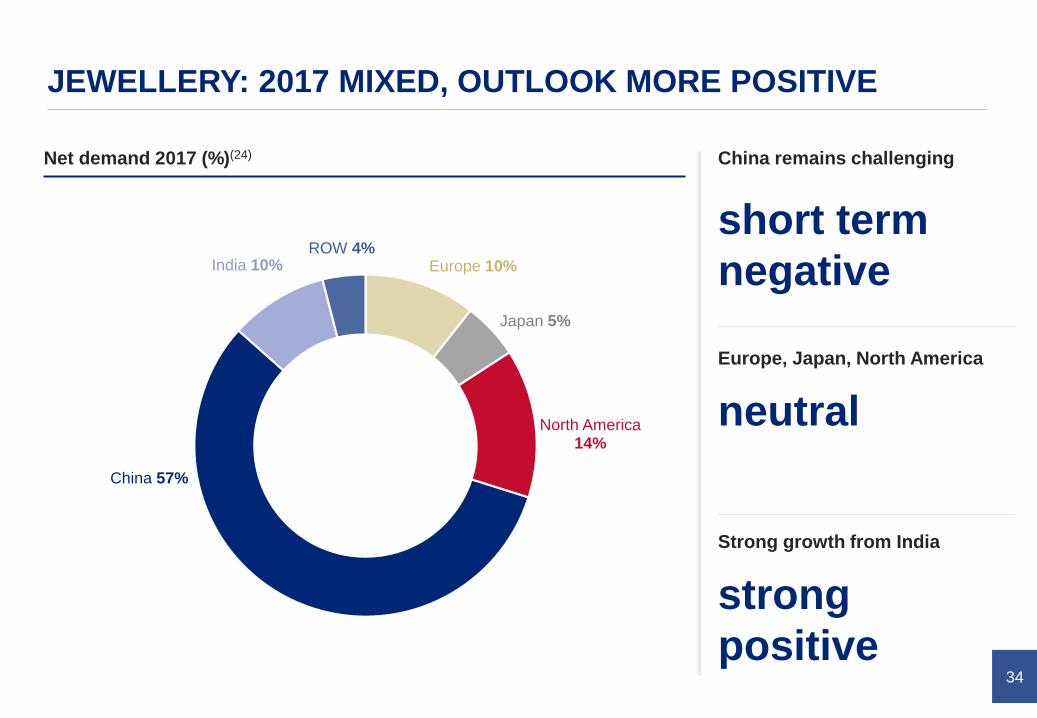
34
Europe 10%
Japan 5%
North America 14%
China 57%
India 10%ROW 4%
JEWELLERY: 2017 MIXED, OUTLOOK MORE POSITIVE
short term
negative
China remains challenging
strong
positive
Strong growth from India
neutral
Europe, Japan, North America
Net demand 2017 (%)(24)
35
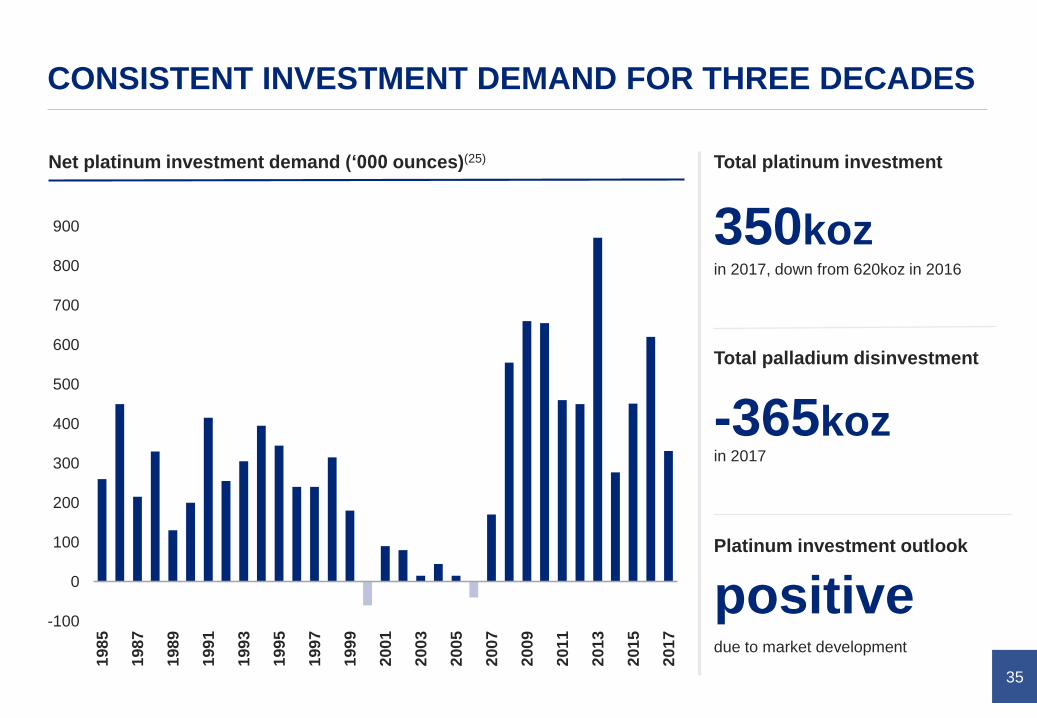
CONSISTENT INVESTMENT DEMAND FOR THREE DECADES
350koz
Total platinum investment
-365koz
Total palladium disinvestment
positivePlatinum investment outlook
due to market development
in 2017
in 2017, down from 620koz in 2016
Net platinum investment demand (‘000 ounces)(25)
-100
0
100
200
300
400
500
600
700
800
900
198
5
198
7
198
9
199
1
199
3
199
5
199
7
199
9
200
1
200
3
200
5
200
7
200
9
201
1
201
3
201
5
201
7
36
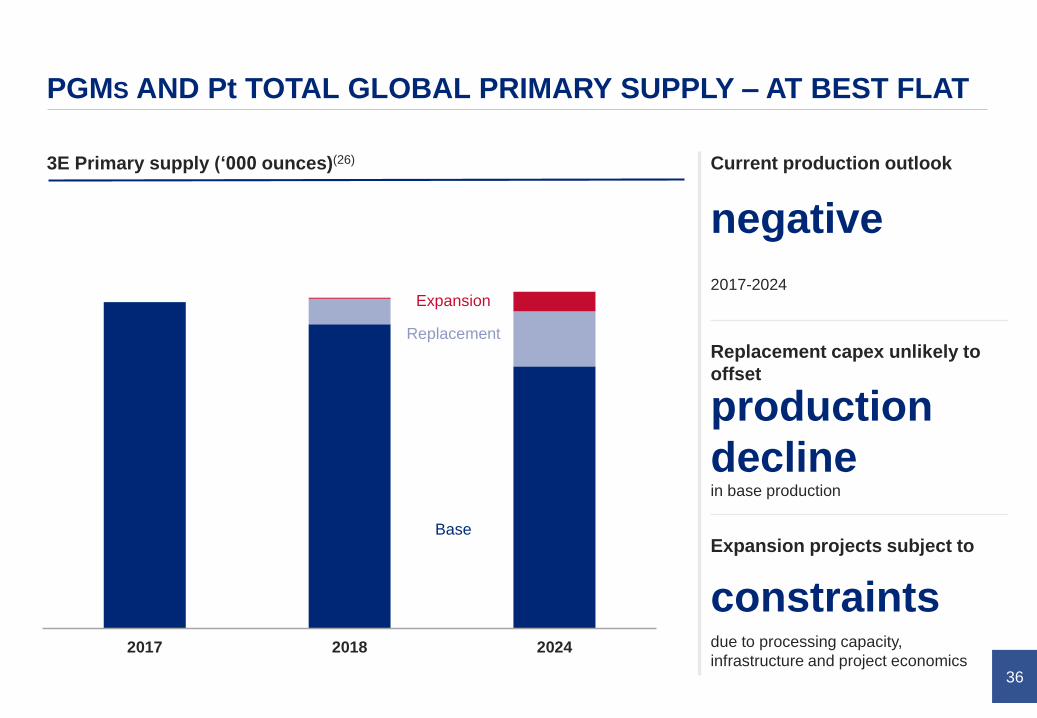
PGMS AND Pt TOTAL GLOBAL PRIMARY SUPPLY – AT BEST FLAT
negative
Current production outlook
production
decline
Replacement capex unlikely to
offset
constraints
Expansion projects subject to
2017-2024
in base production
2017 2018 2024
3E Primary supply (‘000 ounces)(26)
Base
Replacement
Expansion
due to processing capacity,
infrastructure and project economics
37
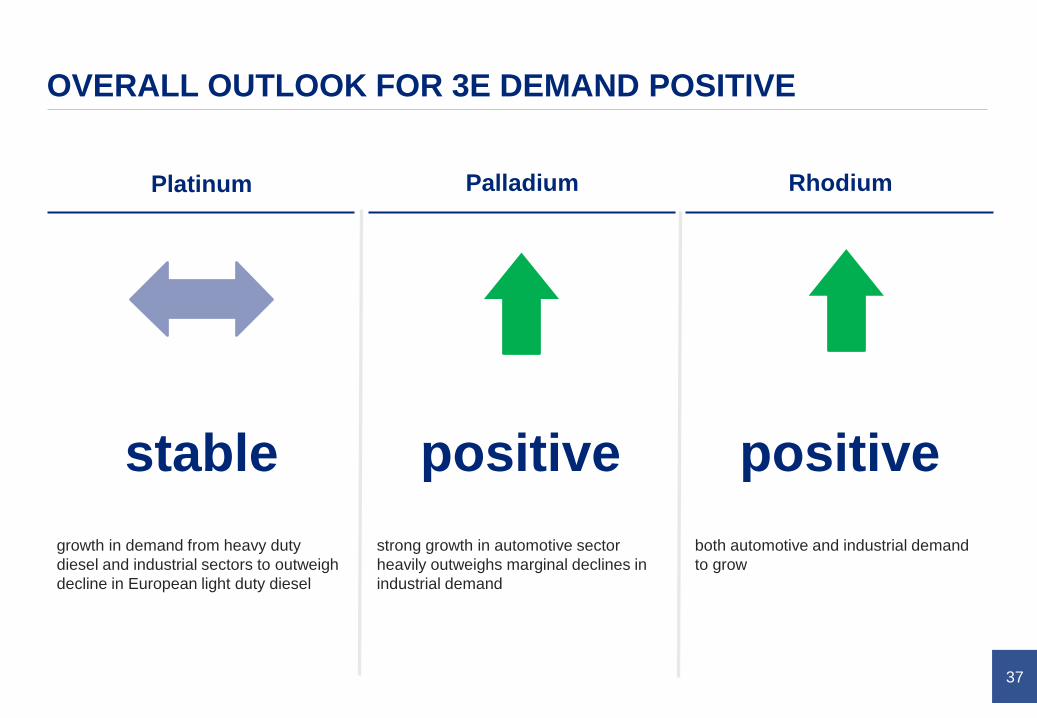
OVERALL OUTLOOK FOR 3E DEMAND POSITIVE
Platinum Palladium Rhodium
stable positive positive
growth in demand from heavy duty
diesel and industrial sectors to outweigh
decline in European light duty diesel
strong growth in automotive sector
heavily outweighs marginal declines in
industrial demand
both automotive and industrial demand
to grow
Chris Griffith
Robotics arm at the laboratory at Polokwane smelter
POSITIONING
FOR THE FUTURE
39
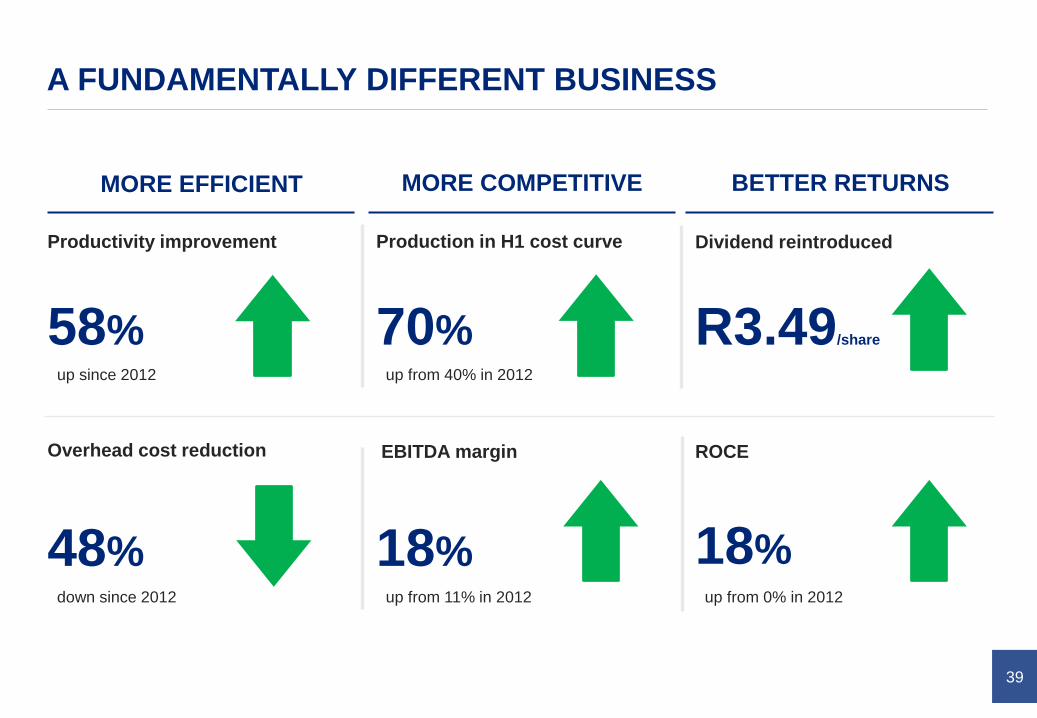
A FUNDAMENTALLY DIFFERENT BUSINESS
MORE EFFICIENT MORE COMPETITIVE BETTER RETURNS
Productivity improvement Production in H1 cost curve
ROCE
Dividend reintroduced
70%
Overhead cost reduction
58%
EBITDA margin
18% 18%
R3.49/share
48%
up since 2012
down since 2012
up from 40% in 2012
up from 0% in 2012up from 11% in 2012
40
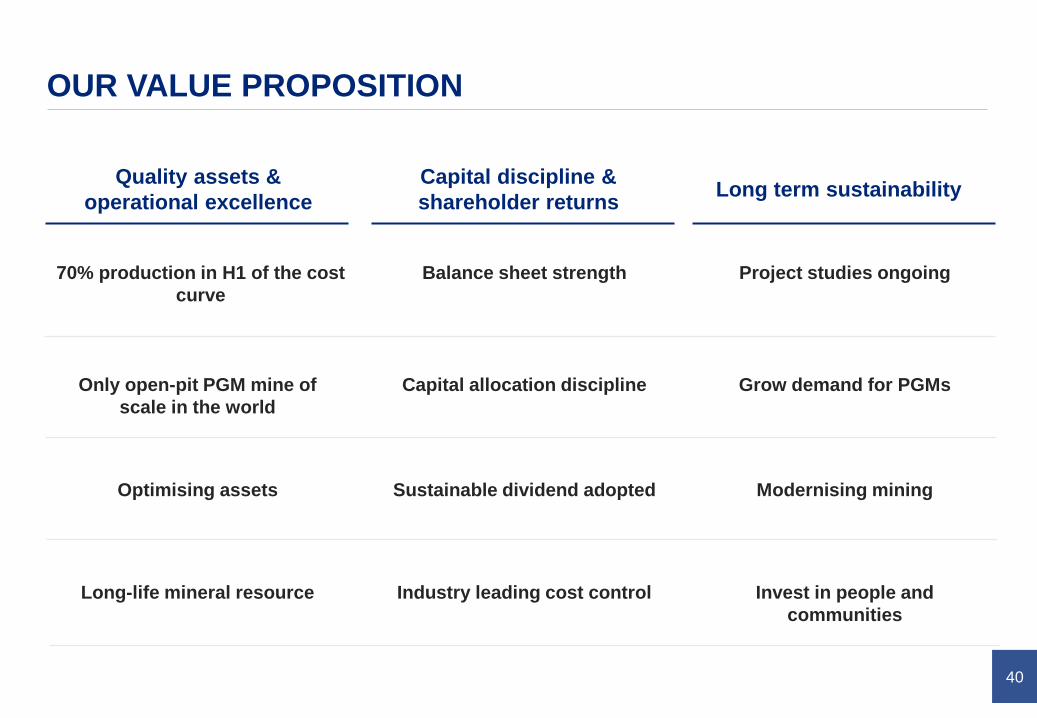
OUR VALUE PROPOSITION
Quality assets &
operational excellenceLong term sustainability
Capital discipline &
shareholder returns
Long-life mineral resource
70% production in H1 of the cost
curve
Only open-pit PGM mine of
scale in the world
Optimising assets
Industry leading cost control
Balance sheet strength
Capital allocation discipline
Sustainable dividend adopted
Invest in people and
communities
Project studies ongoing
Grow demand for PGMs
Modernising mining
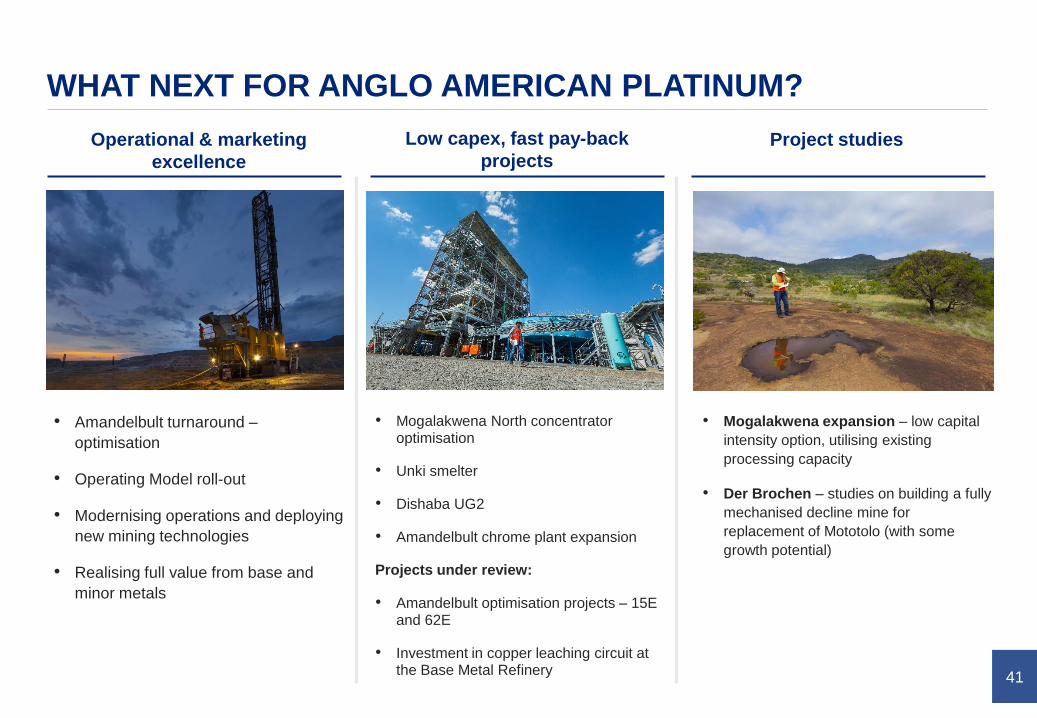
41
Operational & marketing
excellence
Project studiesLow capex, fast pay-back
projects
WHAT NEXT FOR ANGLO AMERICAN PLATINUM?
• Mogalakwena North concentrator optimisation
• Unki smelter
• Dishaba UG2
• Amandelbult chrome plant expansion
Projects under review:
• Amandelbult optimisation projects – 15E and 62E
• Investment in copper leaching circuit at the Base Metal Refinery
• Amandelbult turnaround –
optimisation
• Operating Model roll-out
• Modernising operations and deploying
new mining technologies
• Realising full value from base and
minor metals
• Mogalakwena expansion – low capital
intensity option, utilising existing
processing capacity
• Der Brochen – studies on building a fully
mechanised decline mine for
replacement of Mototolo (with some
growth potential)
42
• 3E basket in deficit again in 2018
• Platinum in small surplus, rhodium in balance, and palladium set to be in large deficit
2018 GUIDANCE
• Produce, refine and sell 4.75 to 5.00 million PGM ounces
- Including 2.3 to 2.4 million platinum ounces and 1.5 to 1.6 million palladium ounces
• Unit cost guidance – R19,600 to R20,200 per produced platinum ounce
• Capital expenditure guidance – R4.7 to R5.2 billion
• Base dividend pay-out-ratio of 30% of headline earnings
• Risk of strengthening rand prevails
43
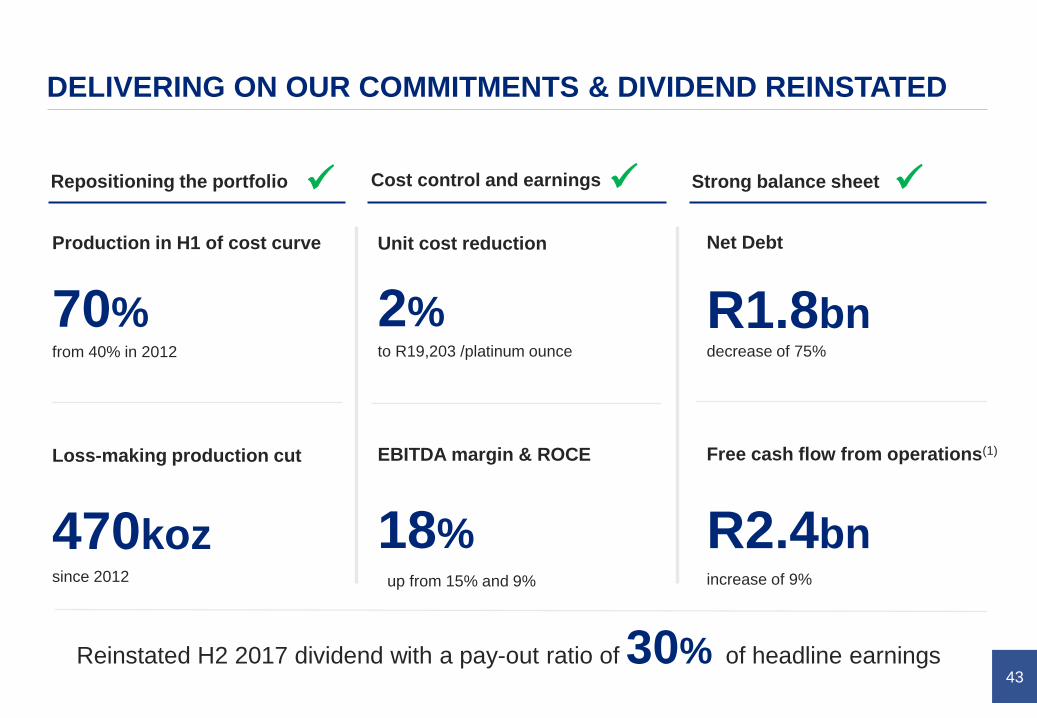
DELIVERING ON OUR COMMITMENTS & DIVIDEND REINSTATED
18%
Net Debt
70%
Free cash flow from operations(1)
Production in H1 of cost curve
R2.4bn
R1.8bn
EBITDA margin & ROCE
Cost control and earningsRepositioning the portfolio Strong balance sheet
470koz
Loss-making production cut
Unit cost reduction
2%from 40% in 2012 to R19,203 /platinum ounce decrease of 75%
increase of 9%
✓ ✓ ✓
since 2012 up from 15% and 9%
Reinstated H2 2017 dividend with a pay-out ratio of 30% of headline earnings
Polokwane smelter
Q&A
Truck at Mogalakwena
APPENDIX
46
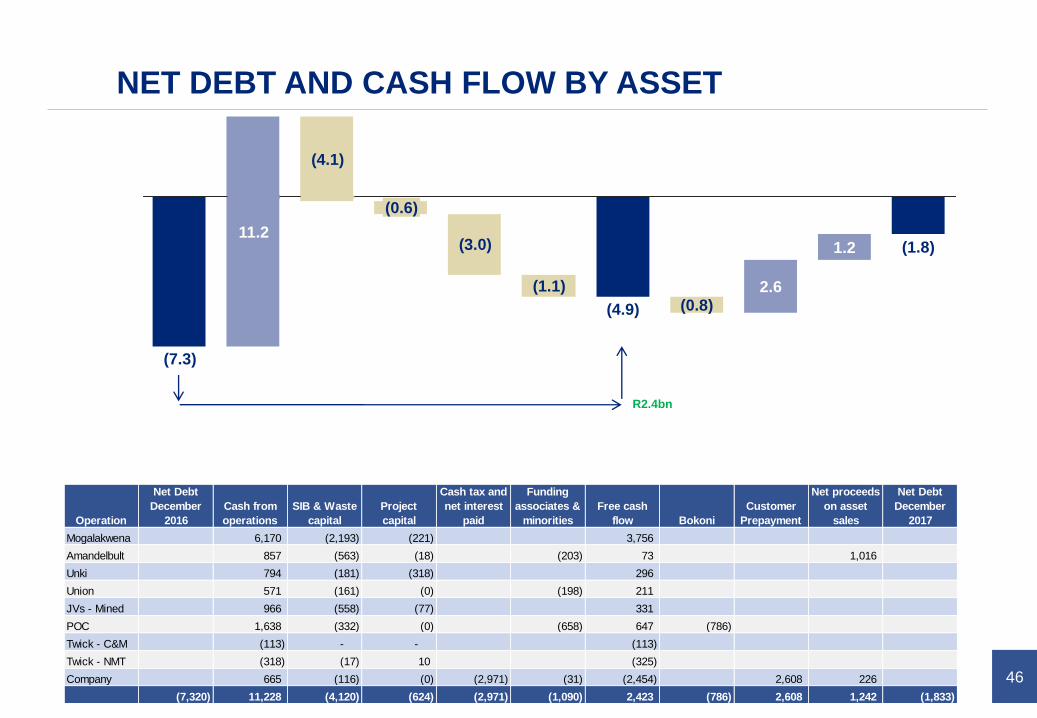
NET DEBT AND CASH FLOW BY ASSET
1.2 (1.8)
2.6(0.8)(4.9)
(3.0)
(0.6)
(4.1)
(1.1)
11.2
(7.3)
R2.4bn
Operation
Net Debt
December
2016
Cash from
operations
SIB & Waste
capital
Project
capital
Cash tax and
net interest
paid
Funding
associates &
minorities
Free cash
flow Bokoni
Customer
Prepayment
Net proceeds
on asset
sales
Net Debt
December
2017
Mogalakwena 6,170 (2,193) (221) 3,756
Amandelbult 857 (563) (18) (203) 73 1,016
Unki 794 (181) (318) 296
Union 571 (161) (0) (198) 211
JVs - Mined 966 (558) (77) 331
POC 1,638 (332) (0) (658) 647 (786)
Twick - C&M (113) - - (113)
Twick - NMT (318) (17) 10 (325)
Company 665 (116) (0) (2,971) (31) (2,454) 2,608 226
(7,320) 11,228 (4,120) (624) (2,971) (1,090) 2,423 (786) 2,608 1,242 (1,833)
47
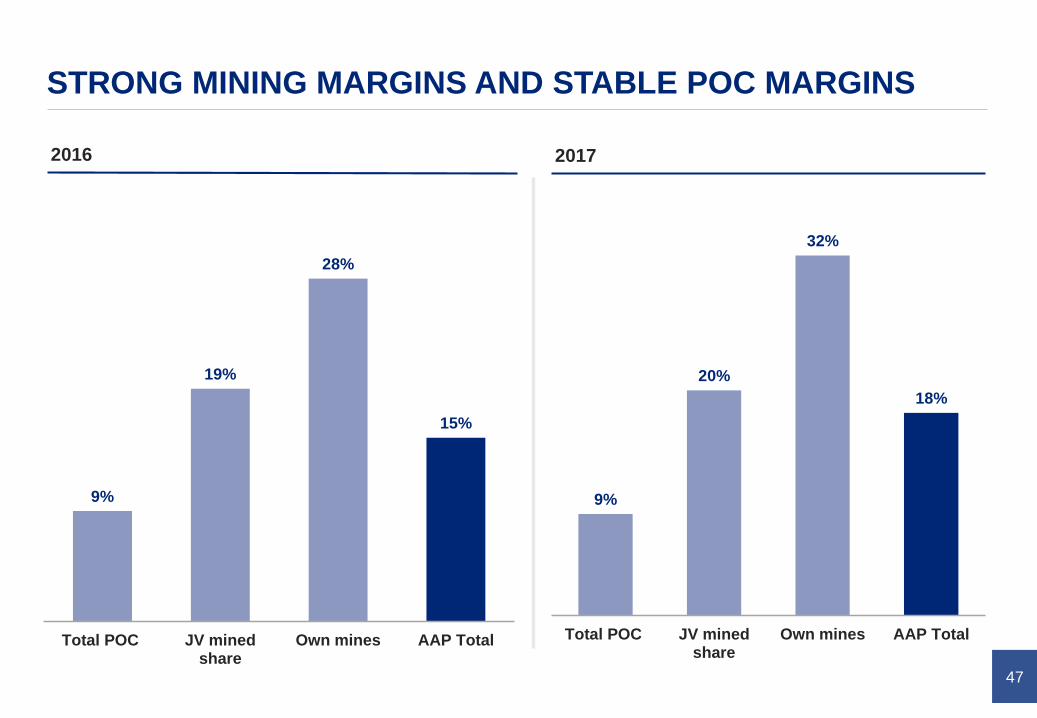
STRONG MINING MARGINS AND STABLE POC MARGINS
2016 2017
9%
19%
28%
15%
Total POC JV minedshare
Own mines AAP Total
9%
20%
32%
18%
Total POC JV minedshare
Own mines AAP Total
48
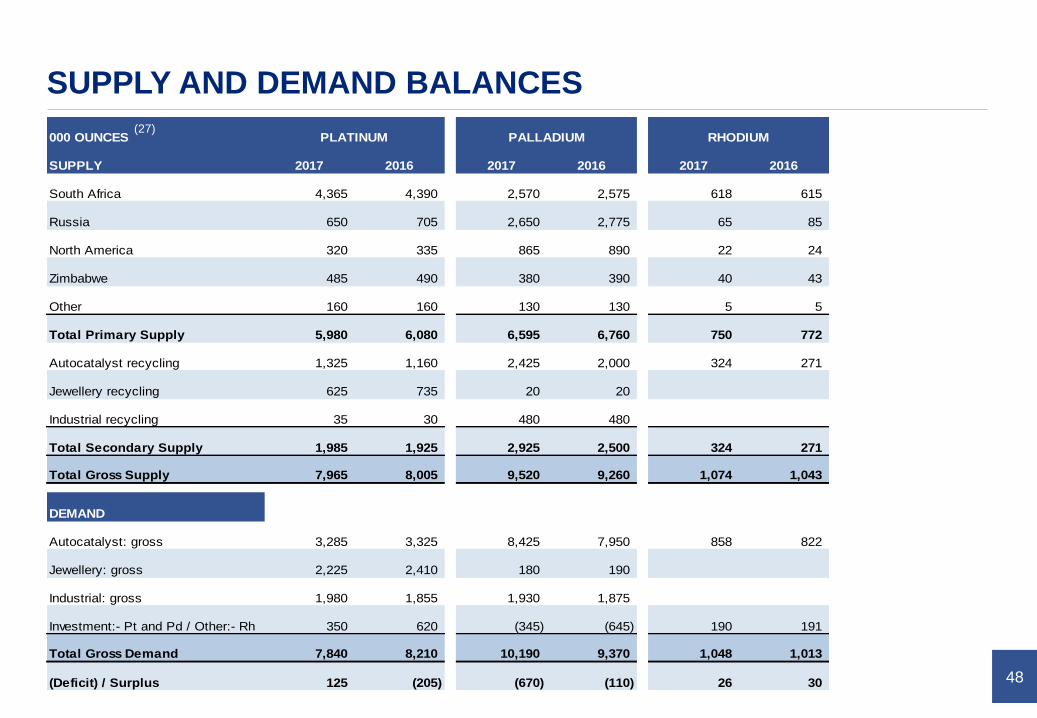
SUPPLY AND DEMAND BALANCES
000 OUNCES
SUPPLY 2017 2016 2017 2016 2017 2016
South Africa 4,365 4,390 2,570 2,575 618 615
Russia 650 705 2,650 2,775 65 85
North America 320 335 865 890 22 24
Zimbabwe 485 490 380 390 40 43
Other 160 160 130 130 5 5
Total Primary Supply 5,980 6,080 6,595 6,760 750 772
Autocatalyst recycling 1,325 1,160 2,425 2,000 324 271
Jewellery recycling 625 735 20 20
Industrial recycling 35 30 480 480
Total Secondary Supply 1,985 1,925 2,925 2,500 324 271
Total Gross Supply 7,965 8,005 9,520 9,260 1,074 1,043
DEMAND
Autocatalyst: gross 3,285 3,325 8,425 7,950 858 822
Jewellery: gross 2,225 2,410 180 190
Industrial: gross 1,980 1,855 1,930 1,875
Investment:- Pt and Pd / Other:- Rh 350 620 (345) (645) 190 191
Total Gross Demand 7,840 8,210 10,190 9,370 1,048 1,013
(Deficit) / Surplus 125 (205) (670) (110) 26 30
PLATINUM PALLADIUM RHODIUM(27)
49
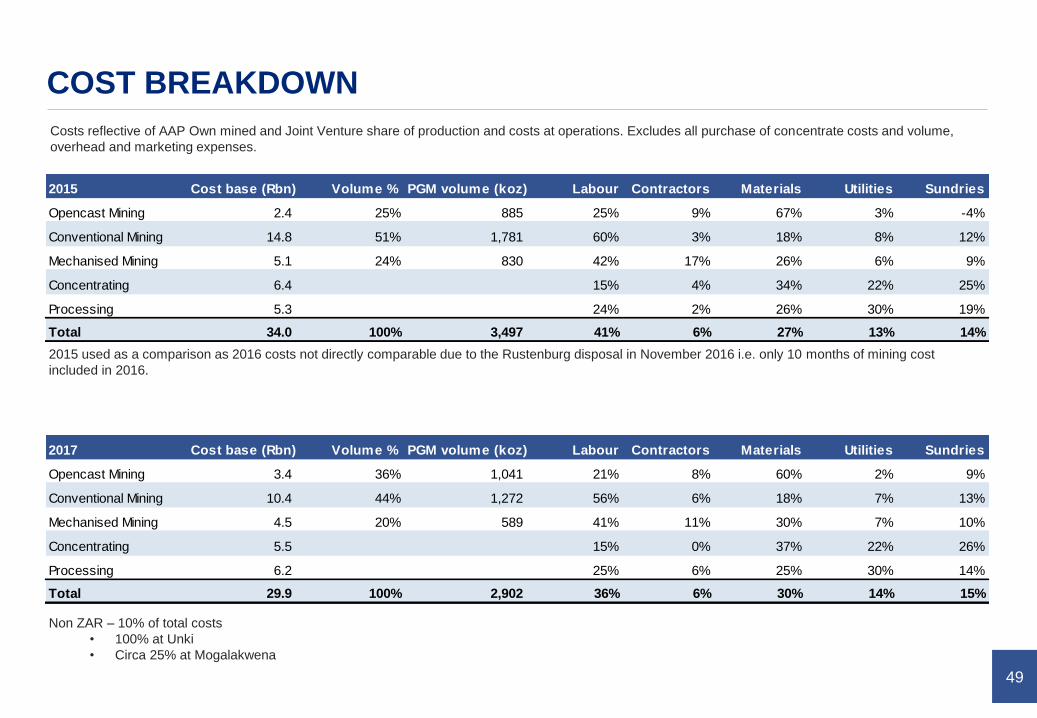
COST BREAKDOWN
Non ZAR – 10% of total costs
• 100% at Unki
• Circa 25% at Mogalakwena
Costs reflective of AAP Own mined and Joint Venture share of production and costs at operations. Excludes all purchase of concentrate costs and volume,
overhead and marketing expenses.
2015 used as a comparison as 2016 costs not directly comparable due to the Rustenburg disposal in November 2016 i.e. only 10 months of mining cost
included in 2016.
2017 Cost base (Rbn) Volume % PGM volume (koz) Labour Contractors Materials Utilities Sundries
Opencast Mining 3.4 36% 1,041 21% 8% 60% 2% 9%
Conventional Mining 10.4 44% 1,272 56% 6% 18% 7% 13%
Mechanised Mining 4.5 20% 589 41% 11% 30% 7% 10%
Concentrating 5.5 15% 0% 37% 22% 26%
Processing 6.2 25% 6% 25% 30% 14%
Total 29.9 100% 2,902 36% 6% 30% 14% 15%
2015 Cost base (Rbn) Volume % PGM volume (koz) Labour Contractors Materials Utilities Sundries
Opencast Mining 2.4 25% 885 25% 9% 67% 3% -4%
Conventional Mining 14.8 51% 1,781 60% 3% 18% 8% 12%
Mechanised Mining 5.1 24% 830 42% 17% 26% 6% 9%
Concentrating 6.4 15% 4% 34% 22% 25%
Processing 5.3 24% 2% 26% 30% 19%
Total 34.0 100% 3,497 41% 6% 27% 13% 14%
50
FOOT NOTES
(1) Excludes funding to Bokoni of R0.8 billion
(2) TRCFR is a measure of the rate of all injuries requiring treatment above first aid per 200,000 hours worked
(3) LTIFR stands for lost time injury frequency rate and is measured as number of injuries for every 200,000 hours worked
(4) Level 3-5 environmental incident is defined as any large incident at least restricted to site, through to a Level 5 incident which has a
regional impact, or threatens a sensitive environment or species
(5) Waste to landfill is measured per 1,000 tonnes
(6) AISC – all-in sustaining costs: defined as cash operating costs, overhead costs, other income and expenses, all sustaining capital
expenditure, capitalised waste stripping and allocated marketing and market development costs net of revenue from all metals other
than platinum
(7) $1,046 is the AISC for 2017, based on H1 2017 achieved prices. $955 is the AISC based on 2017 achieved prices
(8) 62E – establishing a raise bore to surface to increase existing shaft hoisting capacity
(9) 15E Project – sinking of a decline shaft with fully mechanised operations from current shaft bottom position to access deeper reserves
(10) Treasury bills: Monetising of treasury bills issued by the Zimbabwean Reserve Bank (ZRB) for government debt
(11) POC refers to purchase of concentrate comprising 50% purchased production from joint ventures and all purchase of concentrate from
associates and third parties.
(12) 2017 unit cost per produced ounce is R20,482 before ore measurement, compared to guidance of R20,350 to R20,850 / Pt oz
(13) 2017 unit cost per PGM ounce is R9,462 before ore measurement
(14) Gearing ratio is calculated as Net Debt / (Equity plus Net debt)
(15) Cash includes cash held offshore that can be repatriated at a forex and tax cost as well as cash in joint operations
(16) Sustaining capital refers to SIB capex and capitalised waste stripping
(17) Johnson Matthey, LBMA, Bloomberg, Company analysis
(18) Johnson Matthey
(19) Johnson Matthey
(20) LMC Automotive
(21) Johnson Matthey
(22) Johnson Matthey, LMC Automotive, Company analysis
(23) Johnson Matthey
(24) Johnson Matthey, Platinum Guild International
(25) Johnson Matthey, Bloomberg, Company analysis
(26) Johnson Matthey, SNL, Company analysis
(27) Johnson Matthey, Company analysis
Recommended