Annex 5: Statistical data
analysis
Exchangeable cations (SA10)
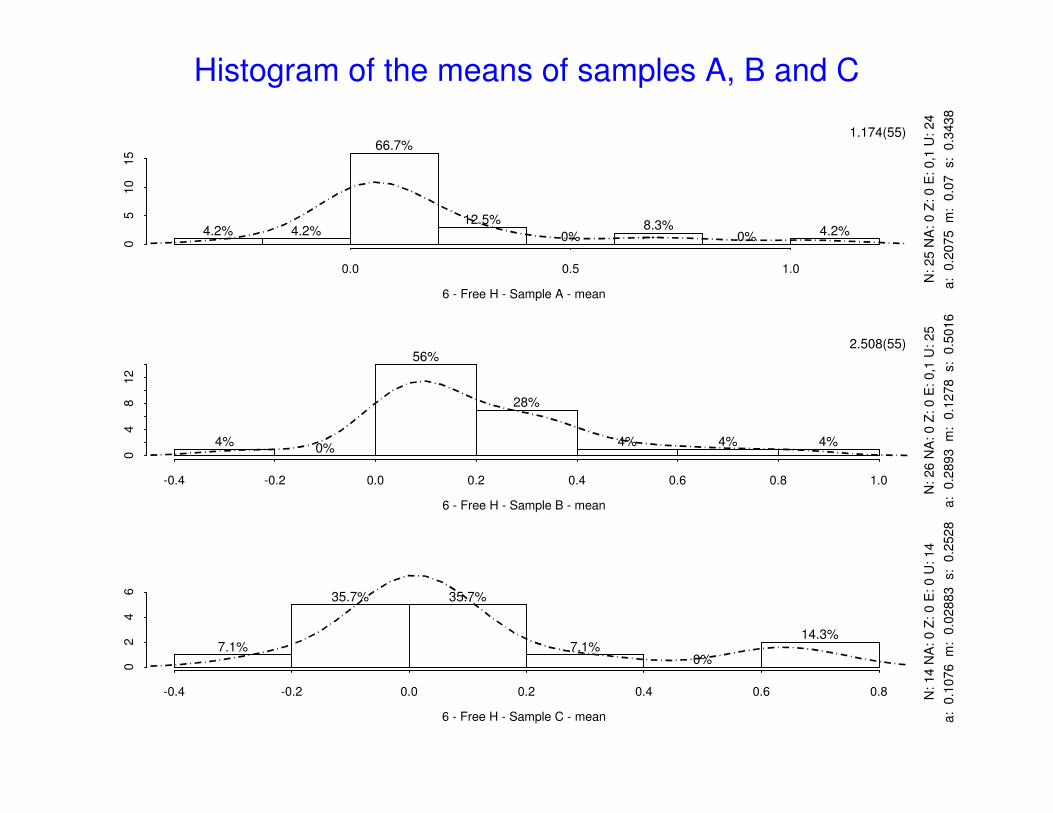
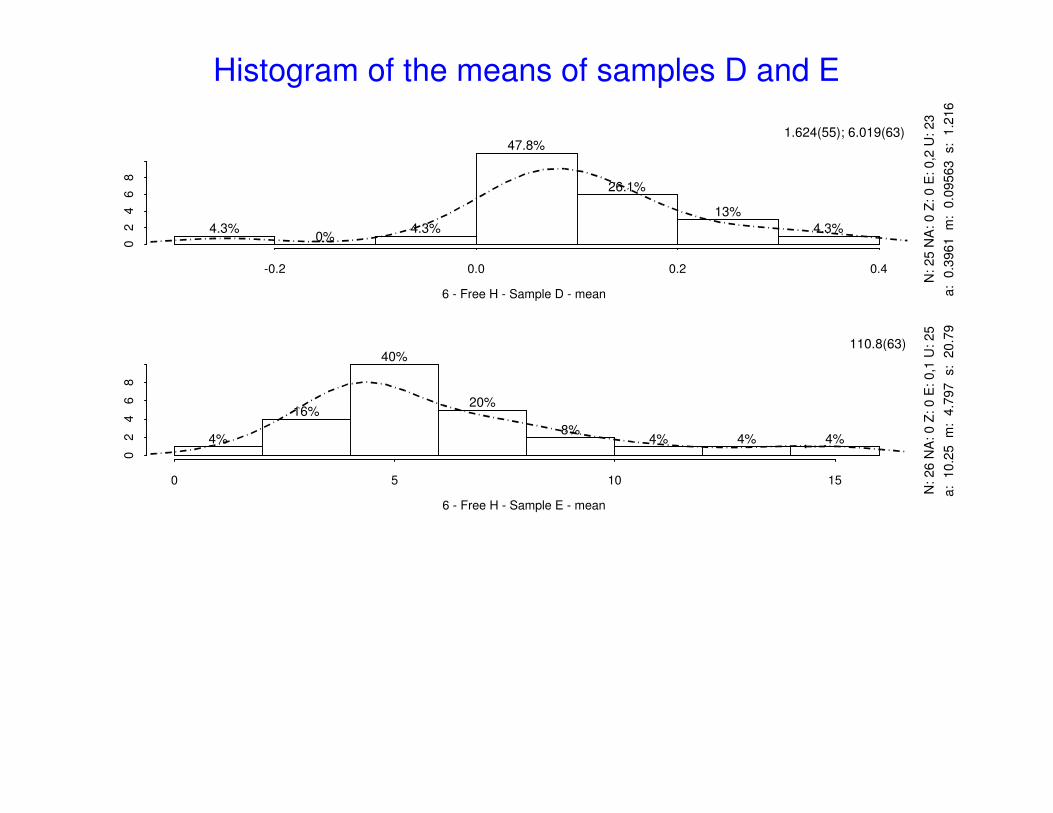
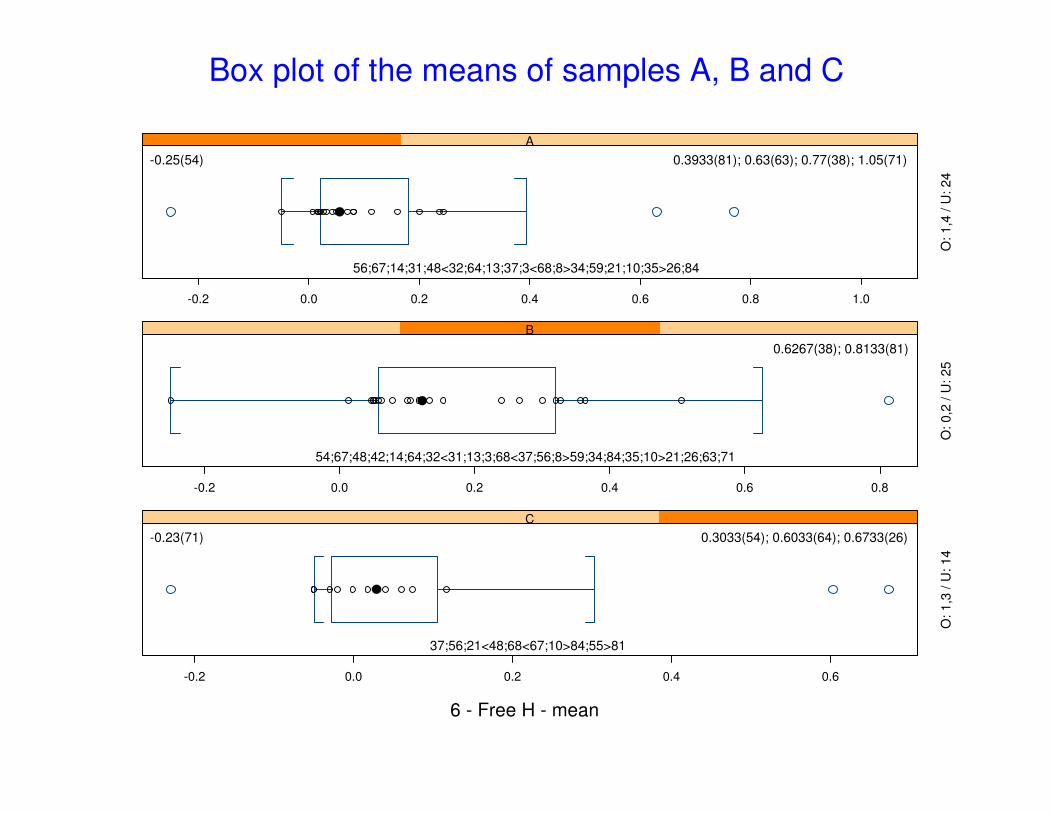
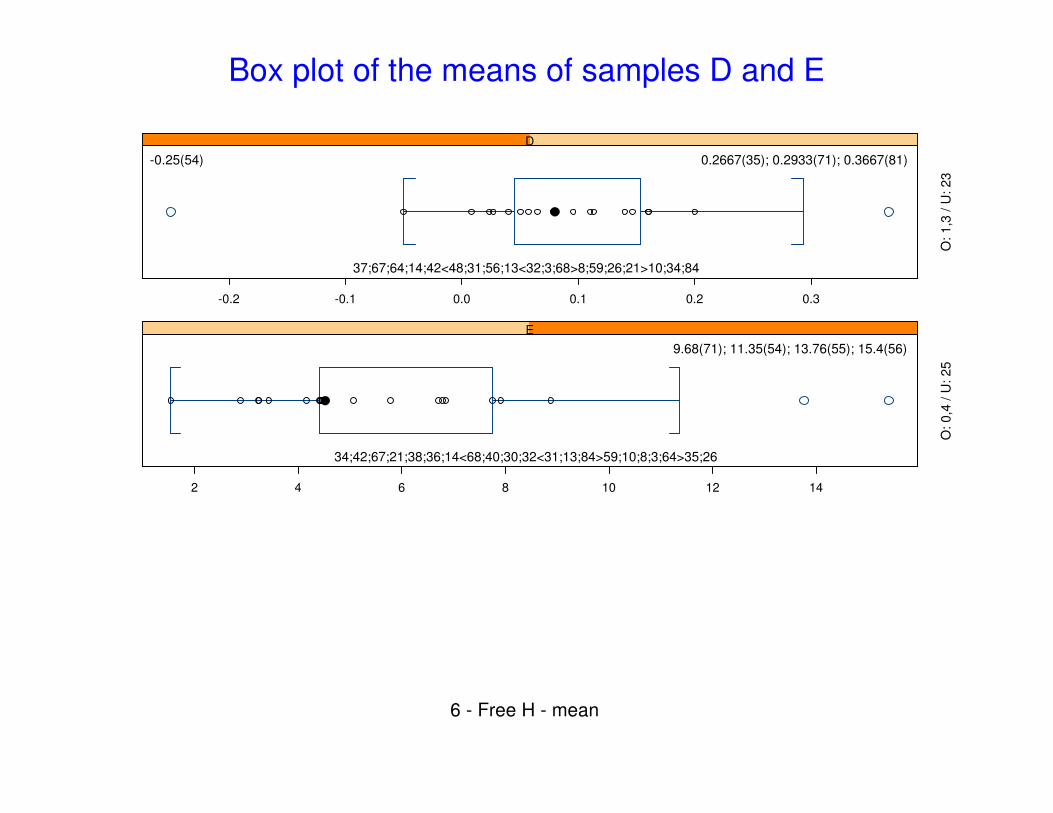
Acid cations, exchangeable acidity
and Free H+
5th FSCC Interlaboratory Comparison 2007
Exchangeable acidity
327
8442373436
3141330678135566845543164102160
8554059833826716311
0.0 0.5 1.0 1.5 2.0 2.5
Location
Labora
tory
Num
ber
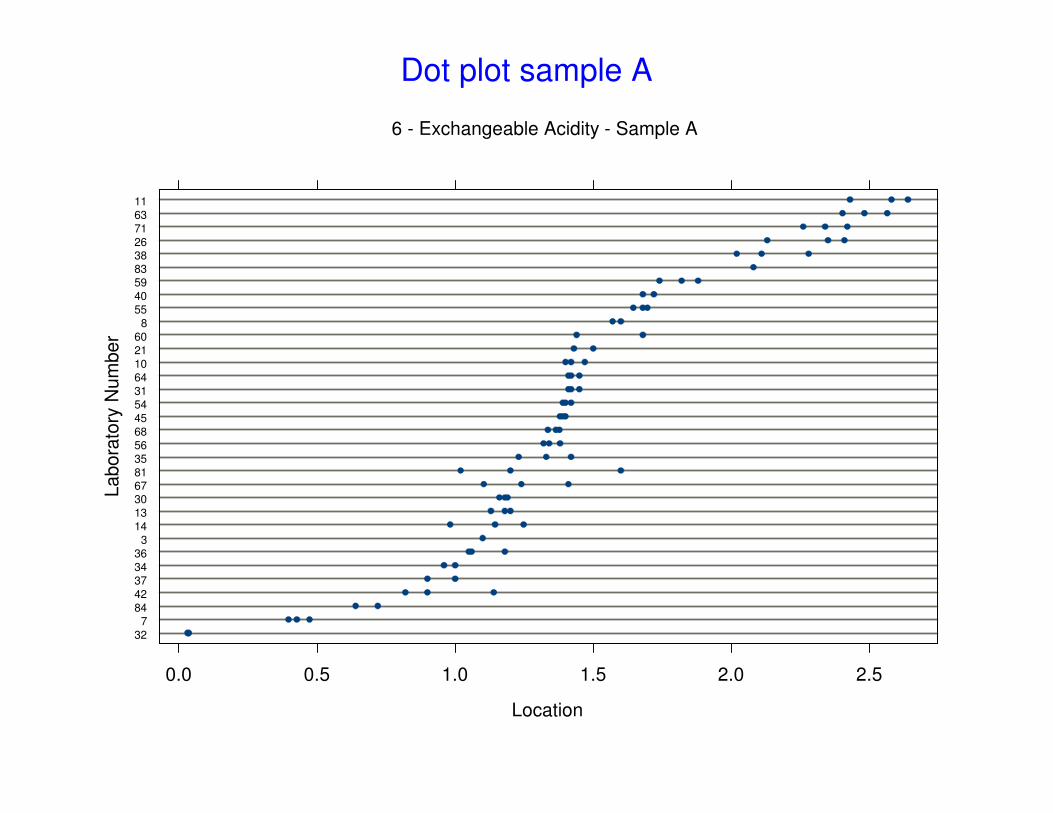
6 - Exchangeable Acidity - Sample A
Dot plot sample A
327
843736
342303413671468214540548164563563
831605559108311387126
0 1 2 3 4
Location
Labora
tory
Num
ber
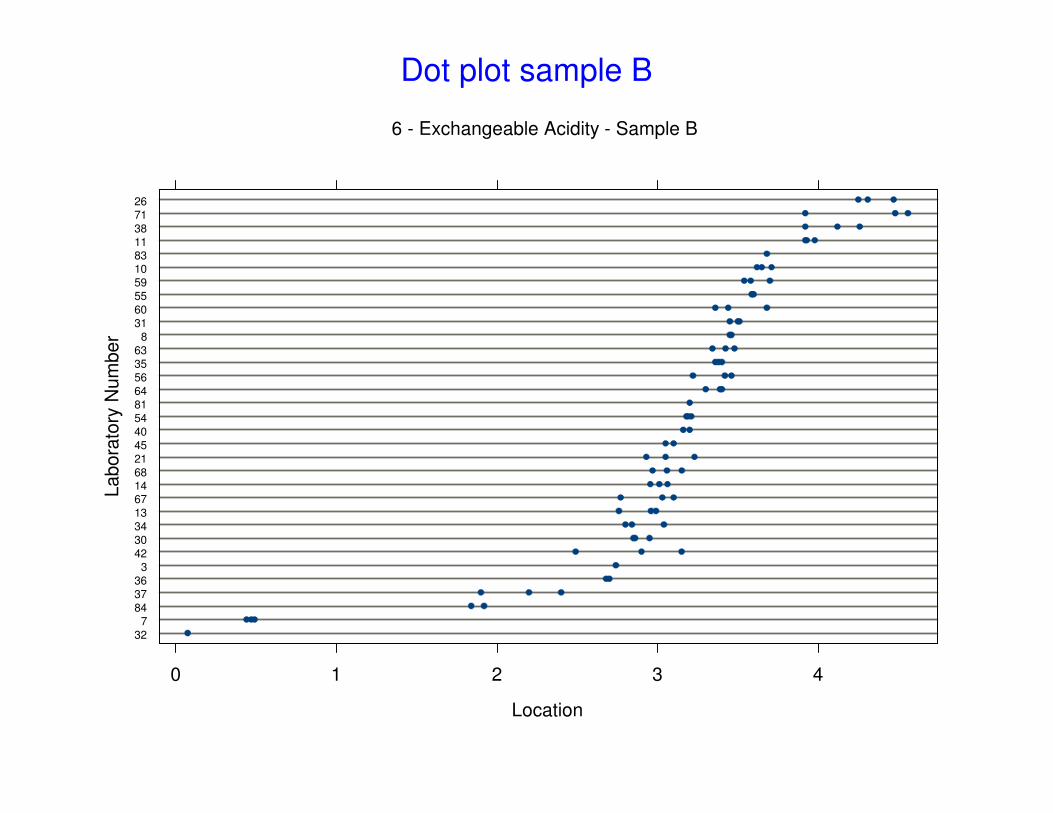
6 - Exchangeable Acidity - Sample B
Dot plot sample B
30
64
59
84
10
34
55
36
63
26
83
81
67
0.0 0.2 0.4 0.6 0.8
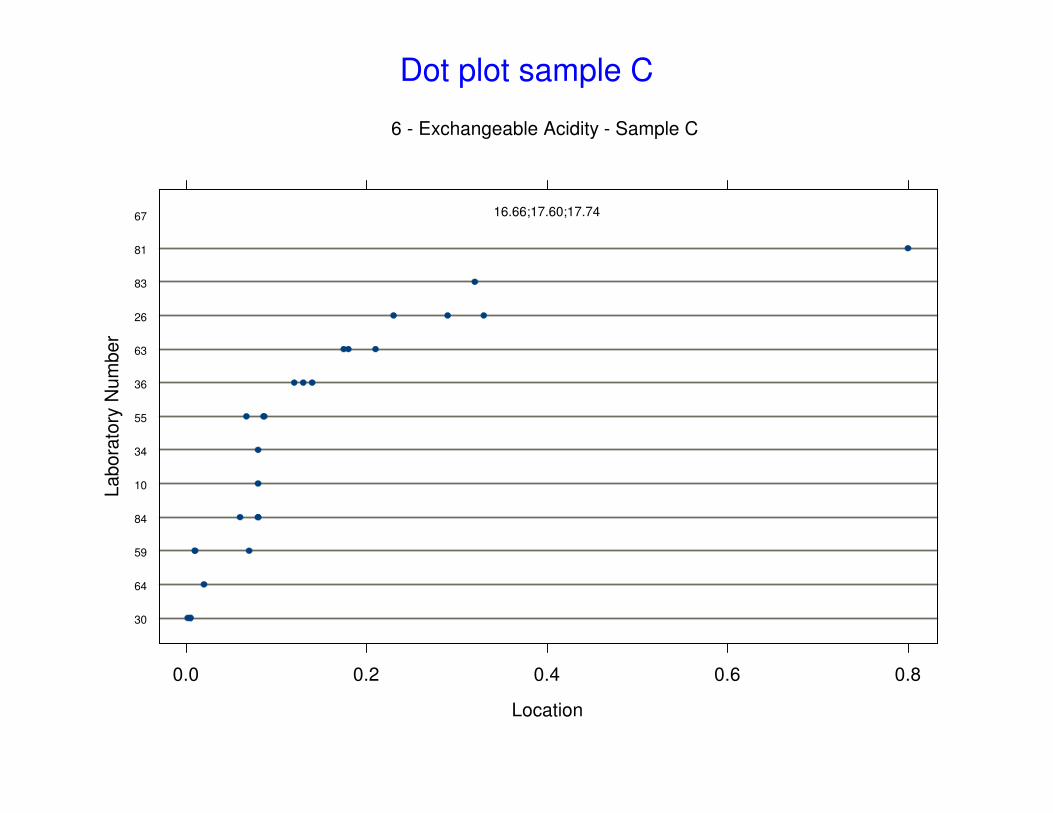
16.66;17.60;17.74
Location
Labora
tory
Num
ber
6 - Exchangeable Acidity - Sample C
Dot plot sample C
327
843442378136
3146430211310355468453831714067
85526116059638356
0.0 0.5 1.0 1.5 2.0 2.5 3.0
Location
Labora
tory
Num
ber
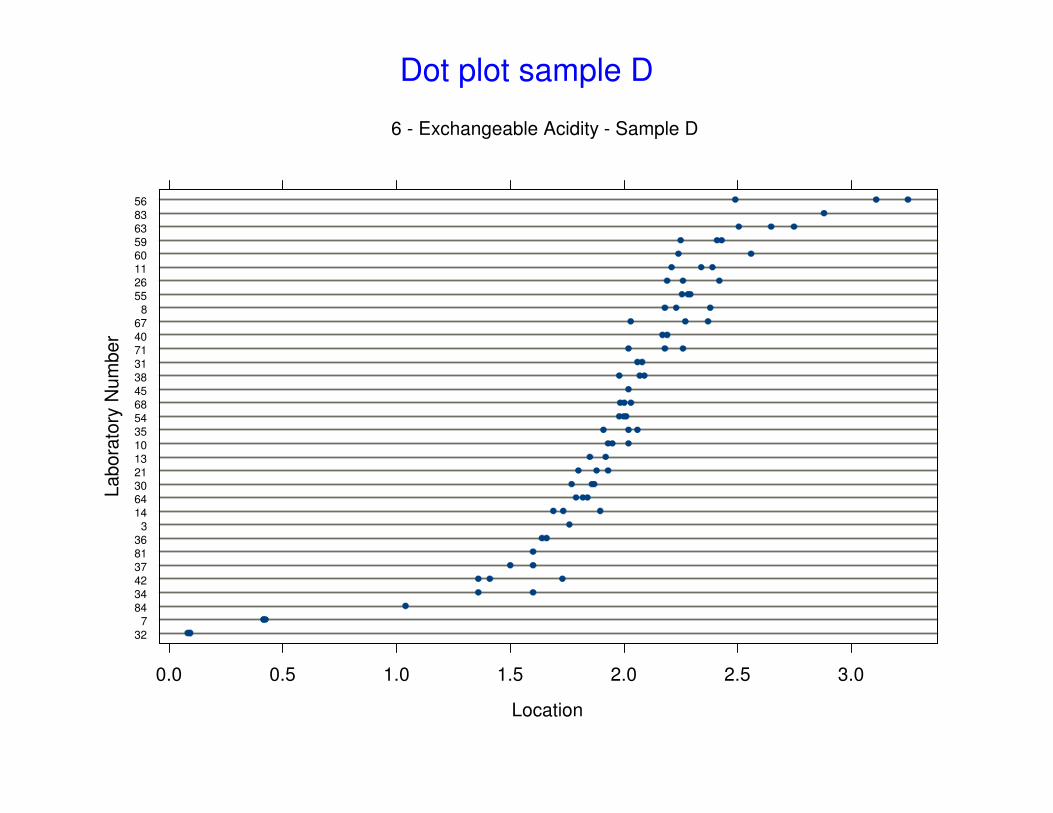
6 - Exchangeable Acidity - Sample D
Dot plot sample D
34
11
42
38
21
7
32
36
30
68
13
31
14
84
59
40
3
10
8
83
45
35
64
60
67
71
26
63
54
55
56
5 10 15 20
30.9
Location
Labora
tory
Num
ber
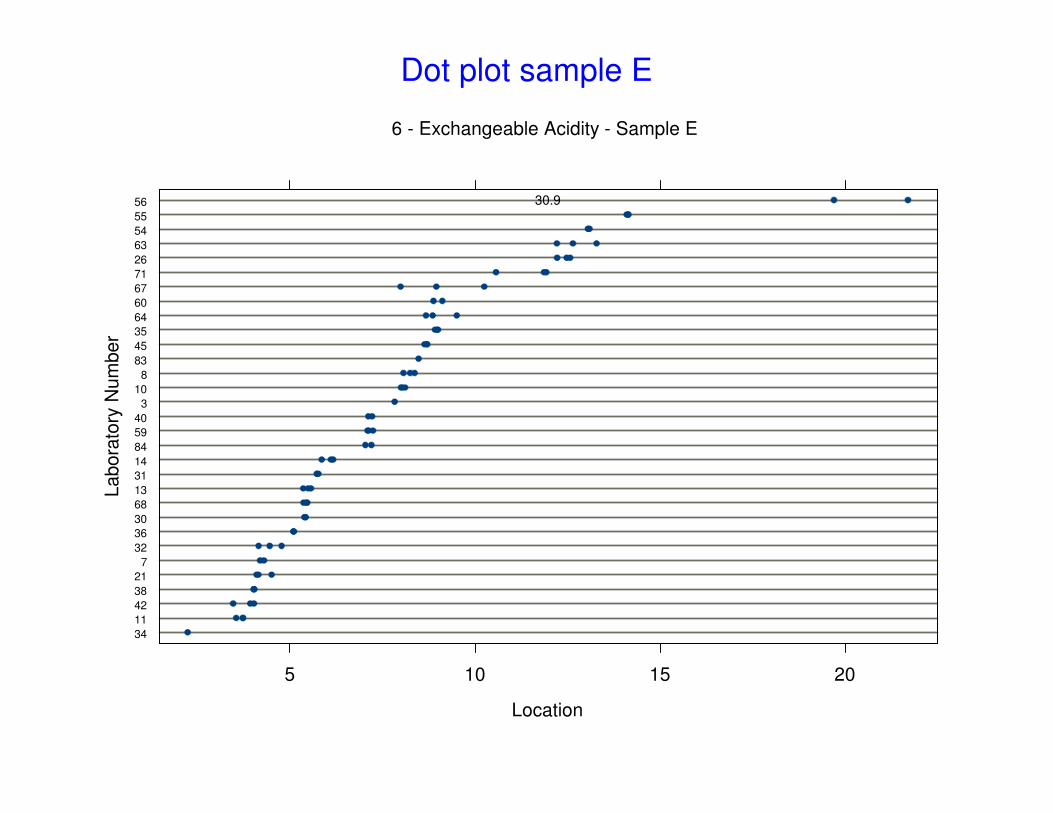
6 - Exchangeable Acidity - Sample E
Dot plot sample E
0.0 0.5 1.0 1.5 2.0 2.5 3.0
05
10
15
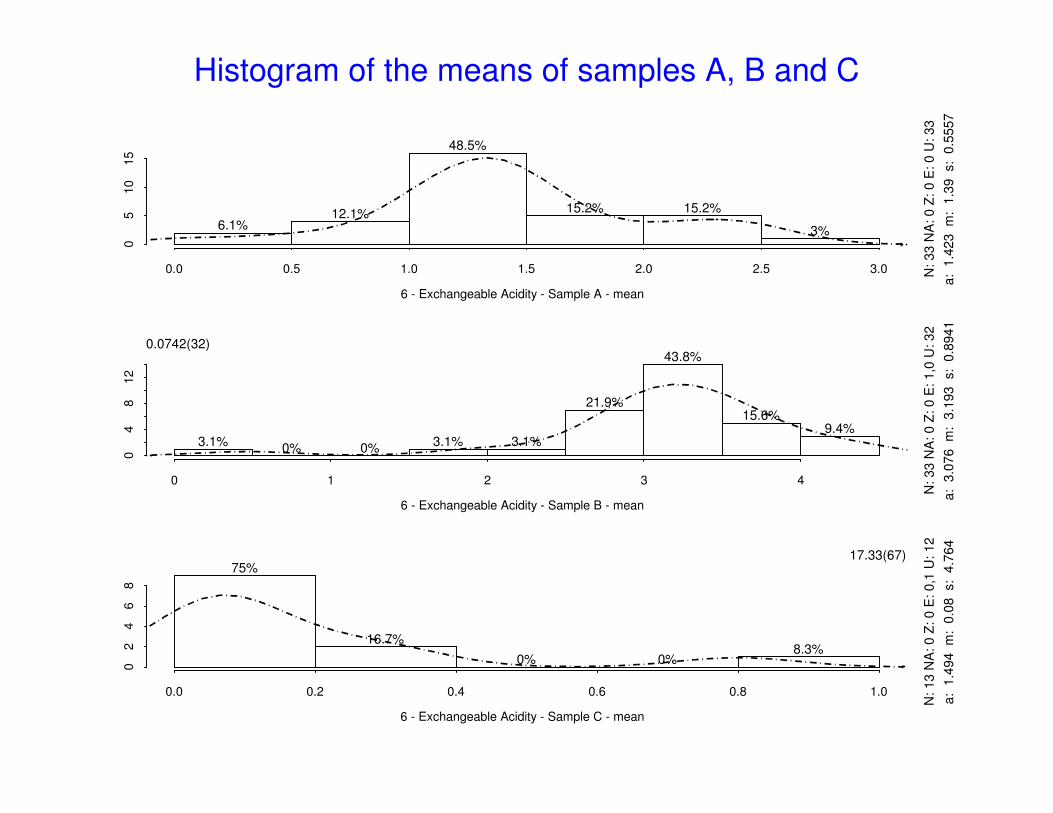
6 - Exchangeable Acidity - Sample A - mean
N:
33
NA
: 0
Z:
0 E
: 0
U:
33
a:
1.4
23
m
: 1
.39
s:
0.5
55
7
6.1%12.1%
48.5%
15.2% 15.2%
3%
0 1 2 3 4
04
812
6 - Exchangeable Acidity - Sample B - mean
N:
33
NA
: 0
Z:
0 E
: 1
,0 U
: 3
2
a:
3.0
76
m
: 3
.19
3
s:
0.8
94
1
3.1%0% 0%
3.1% 3.1%
21.9%
43.8%
15.6%9.4%
0.0742(32)
0.0 0.2 0.4 0.6 0.8 1.0
02
46
8
6 - Exchangeable Acidity - Sample C - mean
N:
13
NA
: 0
Z:
0 E
: 0
,1 U
: 1
2
a:
1.4
94
m
: 0
.08
s:
4.7
64
75%
16.7%
0% 0%8.3%
17.33(67)
Histogram of the means of samples A, B and C
0.0 0.5 1.0 1.5 2.0 2.5 3.0
04
812
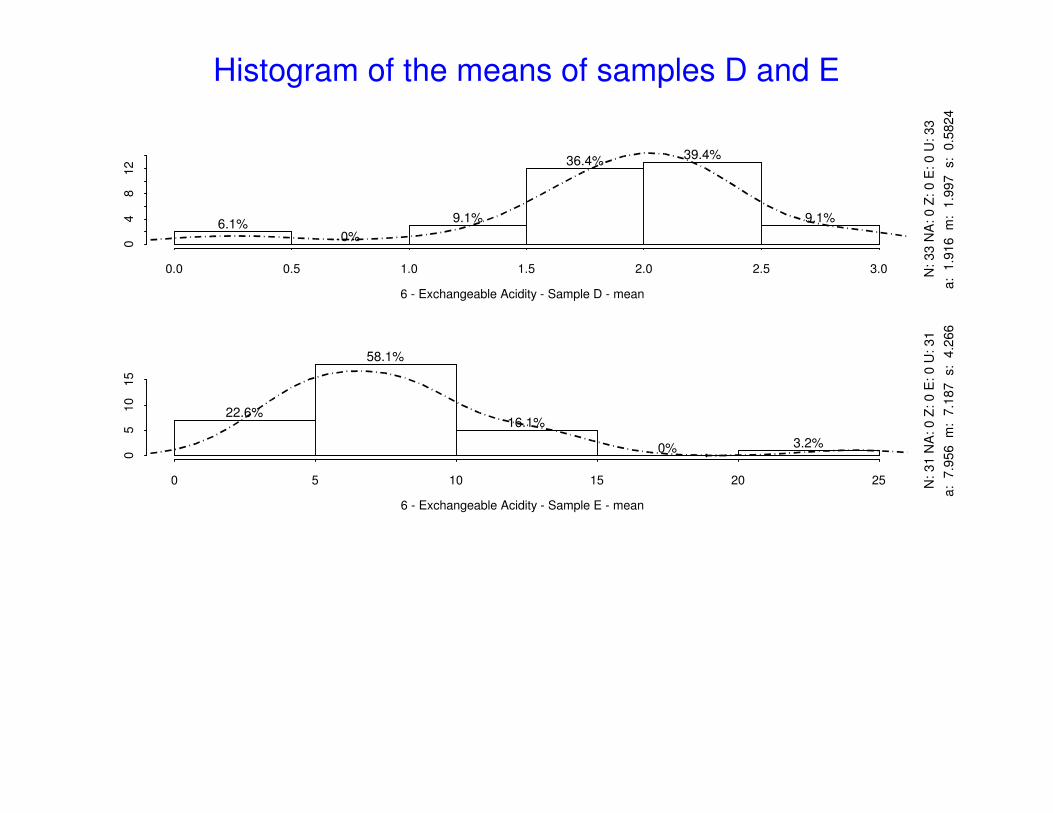
6 - Exchangeable Acidity - Sample D - mean
N:
33
NA
: 0
Z:
0 E
: 0
U:
33
a:
1.9
16
m
: 1
.99
7
s:
0.5
82
4
6.1%0%
9.1%
36.4% 39.4%
9.1%
0 5 10 15 20 25
05
10
15
6 - Exchangeable Acidity - Sample E - mean
N:
31
NA
: 0
Z:
0 E
: 0
U:
31
a:
7.9
56
m
: 7
.18
7
s:
4.2
66
22.6%
58.1%
16.1%
0% 3.2%
Histogram of the means of samples D and E
0.0 0.5 1.0 1.5 2.0 2.5
A
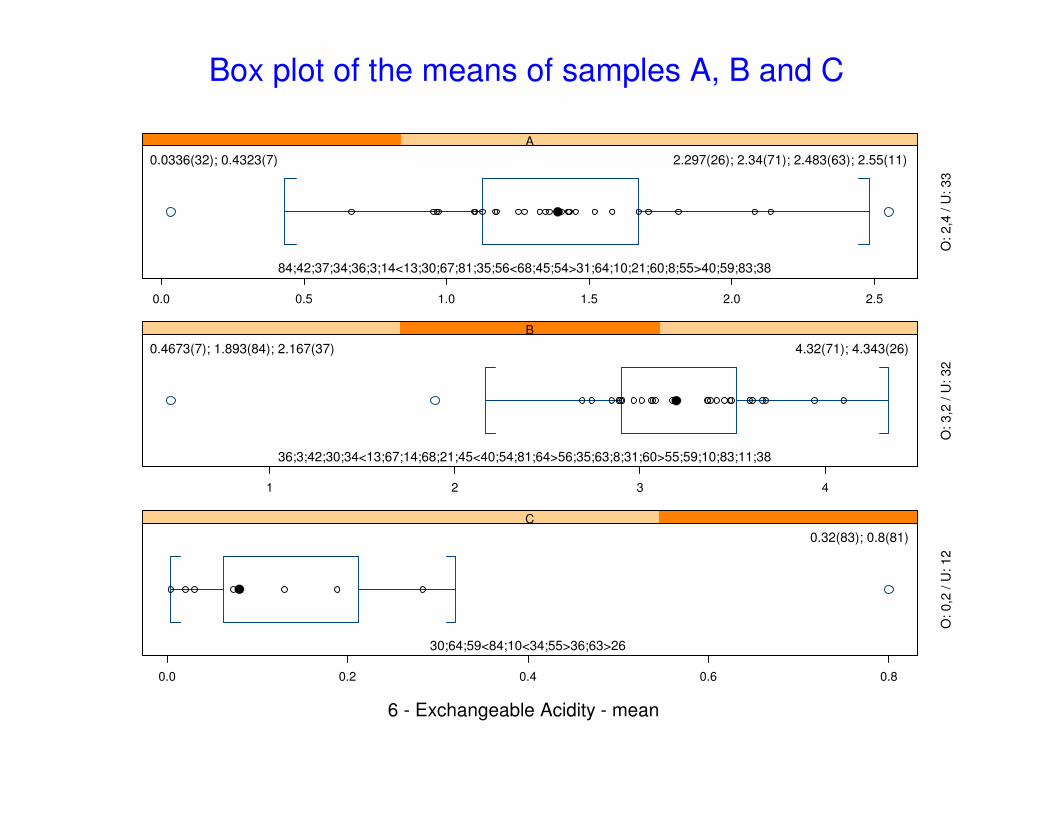
0.0336(32); 0.4323(7) 2.297(26); 2.34(71); 2.483(63); 2.55(11)
84;42;37;34;36;3;14<13;30;67;81;35;56<68;45;54>31;64;10;21;60;8;55>40;59;83;38
O:
2,4
/ U
: 3
3
1 2 3 4
B
0.4673(7); 1.893(84); 2.167(37) 4.32(71); 4.343(26)
36;3;42;30;34<13;67;14;68;21;45<40;54;81;64>56;35;63;8;31;60>55;59;10;83;11;38
O:
3,2
/ U
: 3
2
0.0 0.2 0.4 0.6 0.8
C
0.32(83); 0.8(81)
30;64;59<84;10<34;55>36;63>26
O:
0,2
/ U
: 1
2
6 - Exchangeable Acidity - mean
Box plot of the means of samples A, B and C
0.0 0.5 1.0 1.5 2.0 2.5 3.0
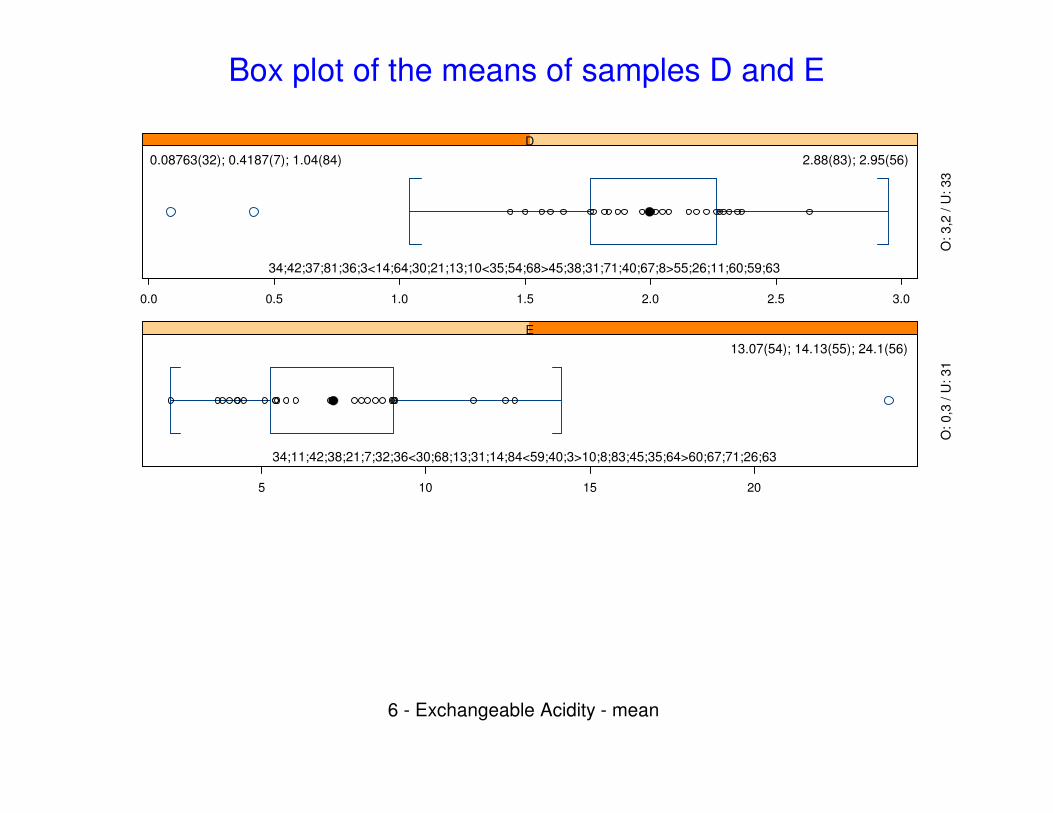
D
0.08763(32); 0.4187(7); 1.04(84) 2.88(83); 2.95(56)
34;42;37;81;36;3<14;64;30;21;13;10<35;54;68>45;38;31;71;40;67;8>55;26;11;60;59;63
O:
3,2
/ U
: 3
3
5 10 15 20
E
13.07(54); 14.13(55); 24.1(56)
34;11;42;38;21;7;32;36<30;68;13;31;14;84<59;40;3>10;8;83;45;35;64>60;67;71;26;63
O:
0,3
/ U
: 3
1
6 - Exchangeable Acidity - mean
Box plot of the means of samples D and E
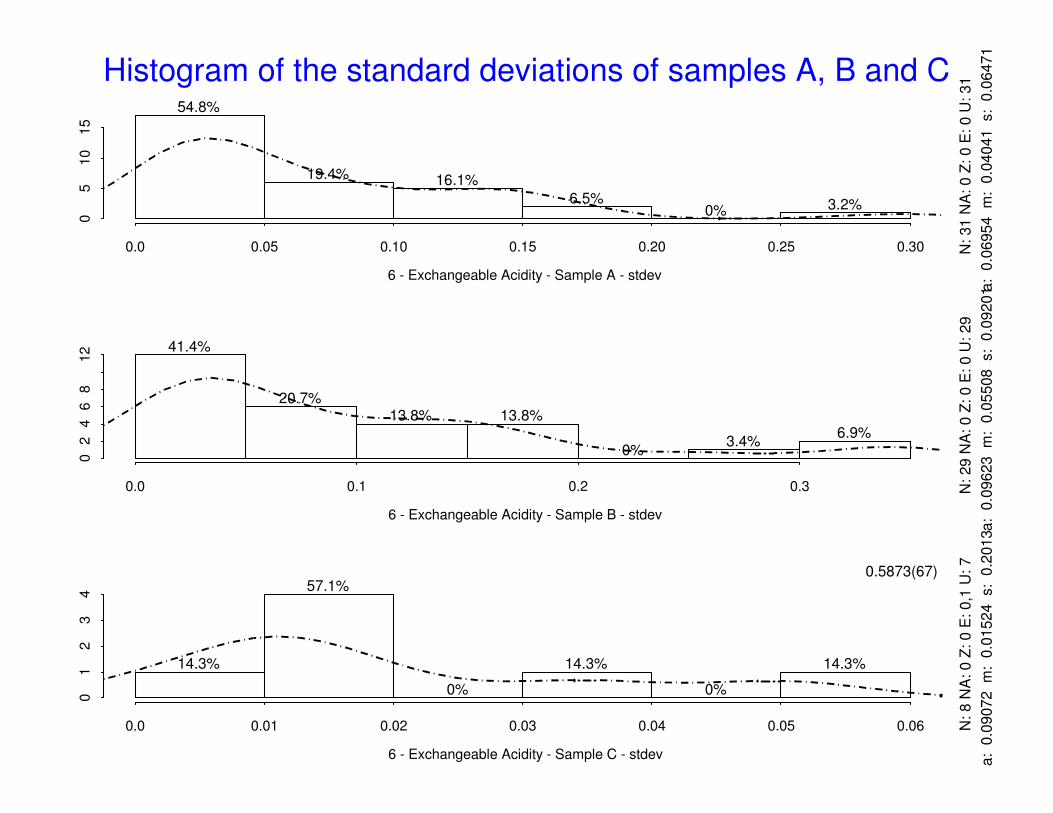
Histogram of the standard deviations of samples A, B and C
0.0 0.05 0.10 0.15 0.20 0.25 0.30
05
10
15
6 - Exchangeable Acidity - Sample A - stdev
N: 31 N
A: 0 Z
: 0 E
: 0 U
: 31
a: 0
.06954 m
: 0
.04041 s: 0
.06471
54.8%
19.4% 16.1%
6.5%0% 3.2%
0.0 0.1 0.2 0.3
02
46
812
6 - Exchangeable Acidity - Sample B - stdev
N: 29 N
A: 0 Z
: 0 E
: 0 U
: 29
a: 0
.09623 m
: 0
.05508 s: 0
.09201
41.4%
20.7%13.8% 13.8%
0%3.4%
6.9%
0.0 0.01 0.02 0.03 0.04 0.05 0.06
01
23
4
6 - Exchangeable Acidity - Sample C - stdev
N: 8 N
A: 0 Z
: 0 E
: 0,1
U: 7
a: 0
.09072 m
: 0
.01524 s: 0
.2013
14.3%
57.1%
0%
14.3%
0%
14.3%
0.5873(67)
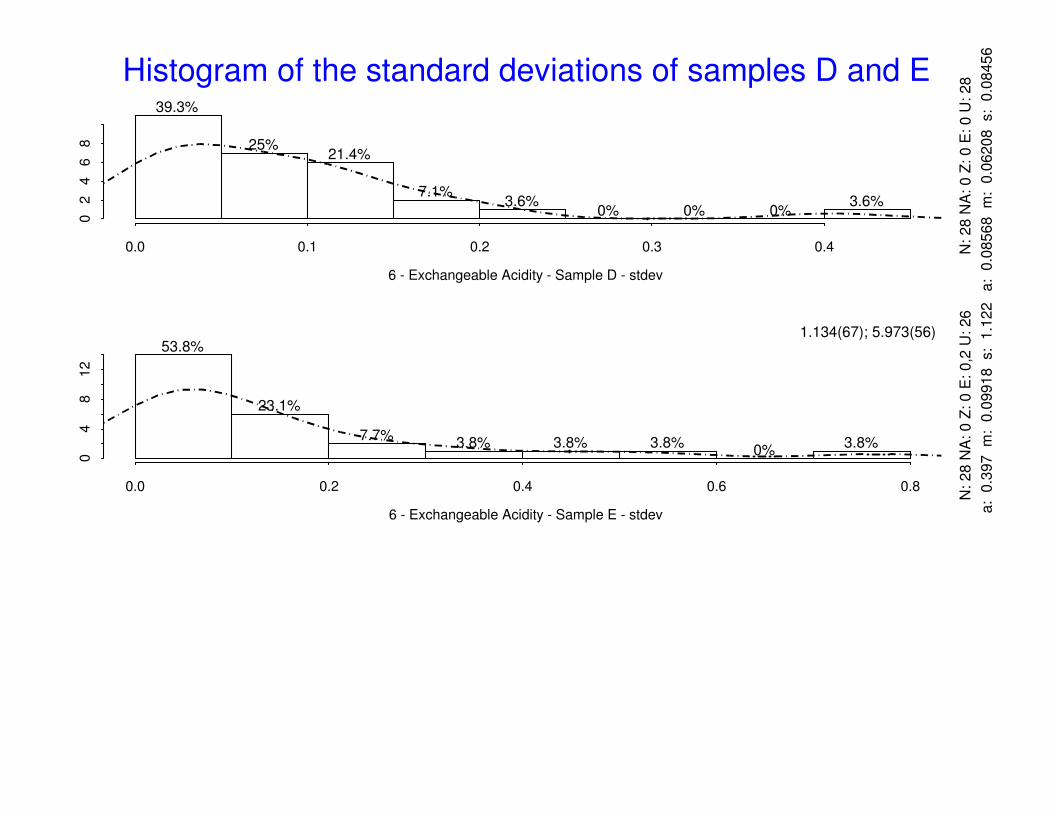
Histogram of the standard deviations of samples D and E
0.0 0.1 0.2 0.3 0.4
02
46
8
6 - Exchangeable Acidity - Sample D - stdev
N: 28 N
A: 0 Z
: 0 E
: 0 U
: 28
a: 0
.08568 m
: 0
.06208 s: 0
.08456
39.3%
25%21.4%
7.1%3.6%
0% 0% 0%3.6%
0.0 0.2 0.4 0.6 0.8
04
812
6 - Exchangeable Acidity - Sample E - stdev
N: 28 N
A: 0 Z
: 0 E
: 0,2
U: 26
a: 0
.397 m
: 0
.09918 s: 1
.122
53.8%
23.1%
7.7%3.8% 3.8% 3.8%
0%3.8%
1.134(67); 5.973(56)
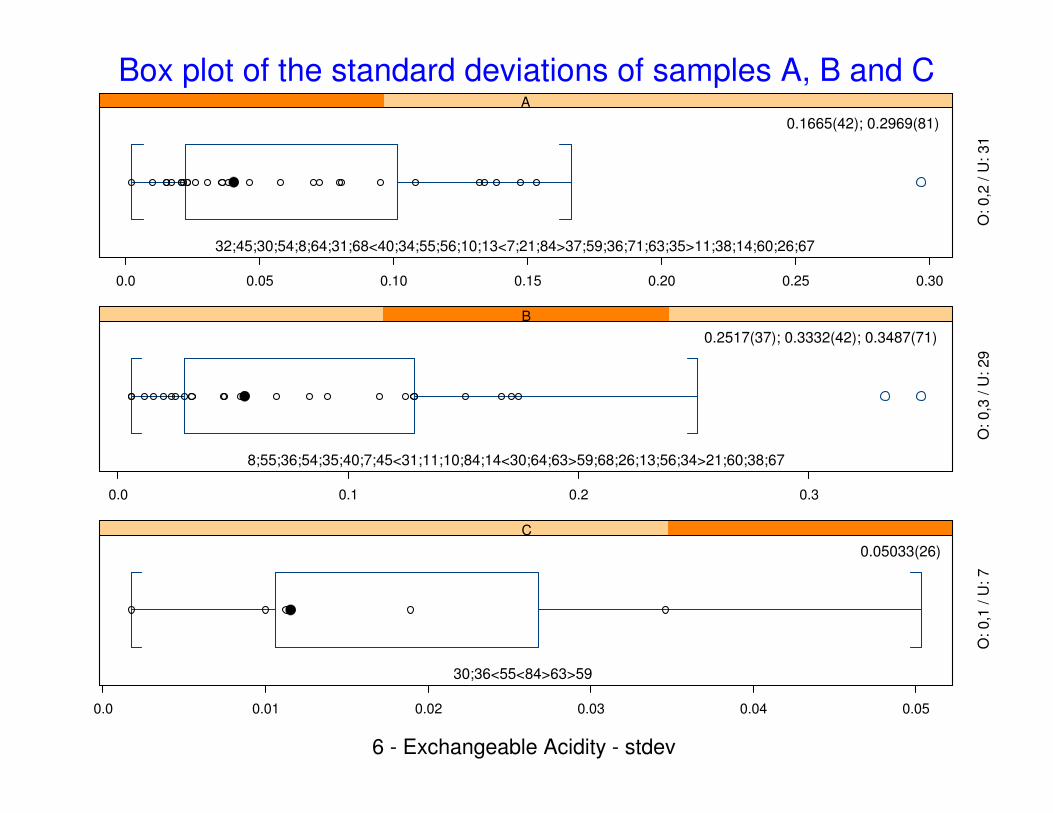
Box plot of the standard deviations of samples A, B and C
0.0 0.05 0.10 0.15 0.20 0.25 0.30
A
0.1665(42); 0.2969(81)
32;45;30;54;8;64;31;68<40;34;55;56;10;13<7;21;84>37;59;36;71;63;35>11;38;14;60;26;67
O: 0,2
/ U
: 31
0.0 0.1 0.2 0.3
B
0.2517(37); 0.3332(42); 0.3487(71)
8;55;36;54;35;40;7;45<31;11;10;84;14<30;64;63>59;68;26;13;56;34>21;60;38;67
O: 0,3
/ U
: 29
0.0 0.01 0.02 0.03 0.04 0.05
C
0.05033(26)
30;36<55<84>63>59
O: 0,1
/ U
: 7
6 - Exchangeable Acidity - stdev
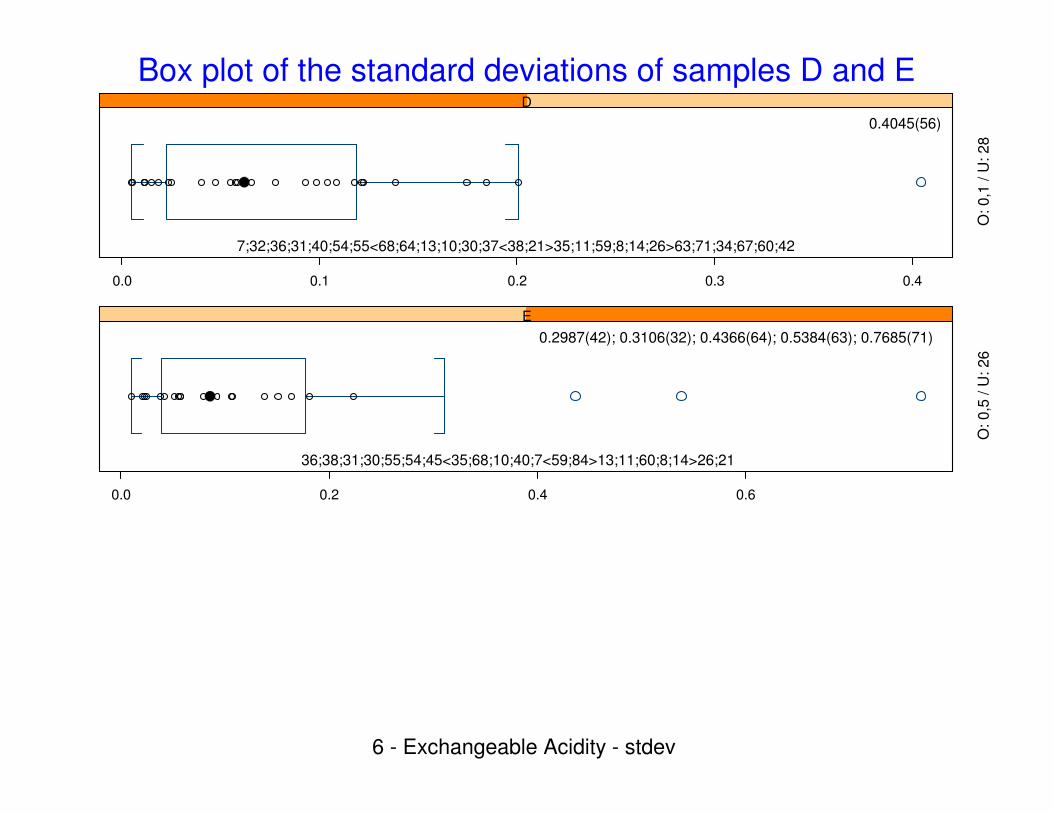
Box plot of the standard deviations of samples D and E
0.0 0.1 0.2 0.3 0.4
D
0.4045(56)
7;32;36;31;40;54;55<68;64;13;10;30;37<38;21>35;11;59;8;14;26>63;71;34;67;60;42
O: 0,1
/ U
: 28
0.0 0.2 0.4 0.6
E
0.2987(42); 0.3106(32); 0.4366(64); 0.5384(63); 0.7685(71)
36;38;31;30;55;54;45<35;68;10;40;7<59;84>13;11;60;8;14>26;21
O: 0,5
/ U
: 26
6 - Exchangeable Acidity - stdev
Laboratory
Mandel's
h
-3-2
-10
12
3
10
11
13
14
21
26 3
30
31
32
34
35
36
37
38
40
42
45
54
55
56
59
60
63
64
67
68 7
71 8
83
84
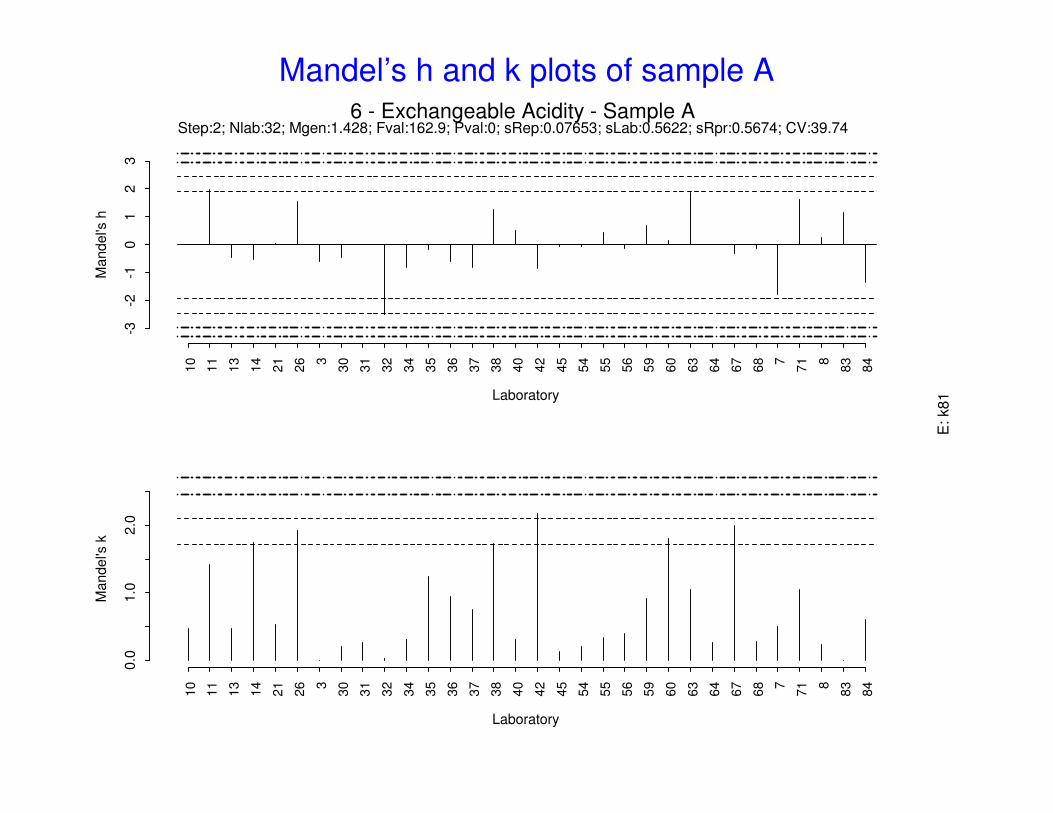
6 - Exchangeable Acidity - Sample AStep:2; Nlab:32; Mgen:1.428; Fval:162.9; Pval:0; sRep:0.07653; sLab:0.5622; sRpr:0.5674; CV:39.74
Laboratory
Mandel's
k
0.0
1.0
2.0
10
11
13
14
21
26 3
30
31
32
34
35
36
37
38
40
42
45
54
55
56
59
60
63
64
67
68 7
71 8
83
84
E: k81
Mandel’s h and k plots of sample A
Laboratory
Mandel's
h
-3-2
-10
12
3
10
11
13
14
21
26 3
30
31
34
35
36
37
38
40
45
54
55
56
59
60
63
64
67
68 8
81
83
84
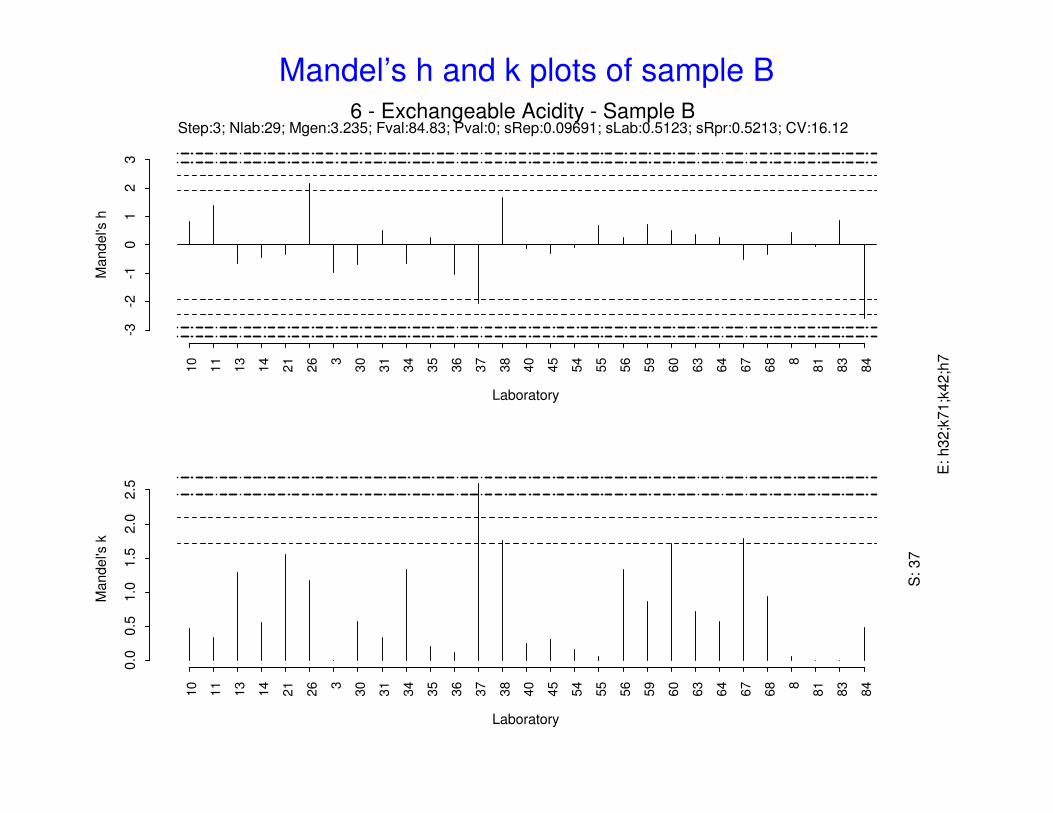
6 - Exchangeable Acidity - Sample BStep:3; Nlab:29; Mgen:3.235; Fval:84.83; Pval:0; sRep:0.09691; sLab:0.5123; sRpr:0.5213; CV:16.12
Laboratory
Mandel's
k
0.0
0.5
1.0
1.5
2.0
2.5
10
11
13
14
21
26 3
30
31
34
35
36
37
38
40
45
54
55
56
59
60
63
64
67
68 8
81
83
84
S: 37
E: h32;k
71;k
42;h
7
Mandel’s h and k plots of sample B
Laboratory
Mandel's
h
-2-1
01
2
10
30
34
36
55
63
83
84
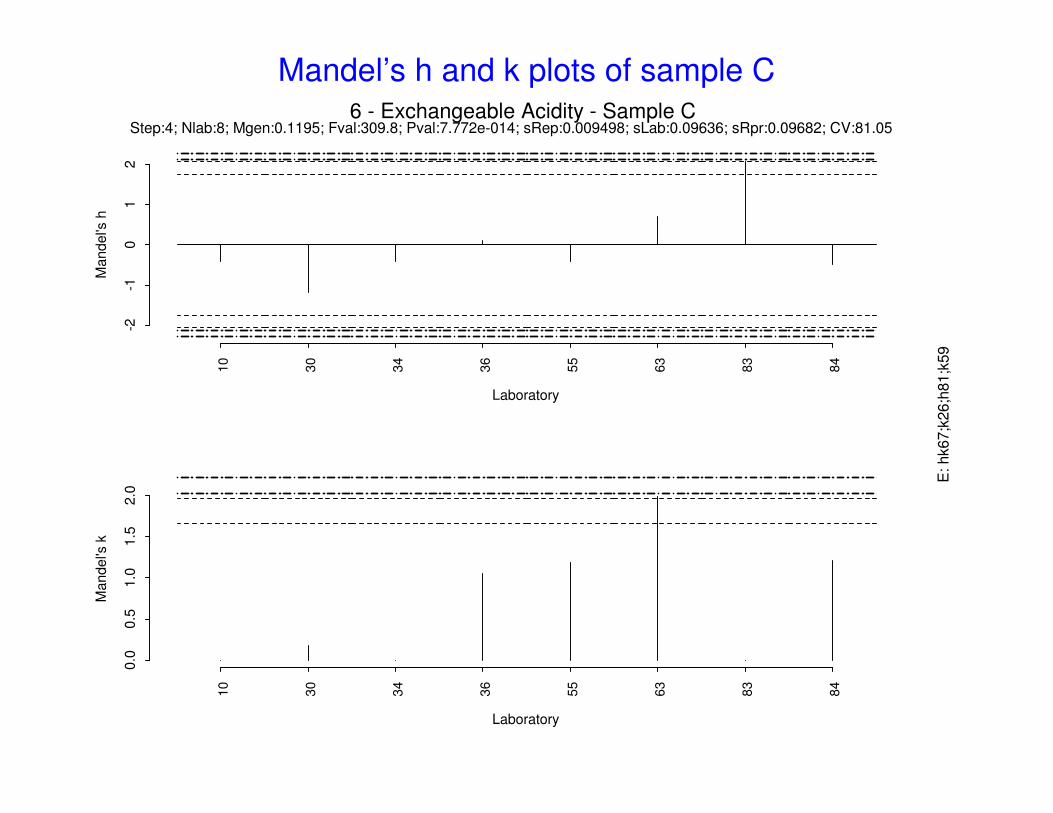
6 - Exchangeable Acidity - Sample CStep:4; Nlab:8; Mgen:0.1195; Fval:309.8; Pval:7.772e-014; sRep:0.009498; sLab:0.09636; sRpr:0.09682; CV:81.05
Laboratory
Mandel's
k
0.0
0.5
1.0
1.5
2.0
10
30
34
36
55
63
83
84
E: hk67;k
26;h
81;k
59
Mandel’s h and k plots of sample C
Laboratory
Mandel's
h
-3-2
-10
12
3
10
11
13
14
21
26 3
30
31
32
34
35
36
37
38
40
42
45
54
55
59
60
63
64
67
68 7
71 8
81
83
84
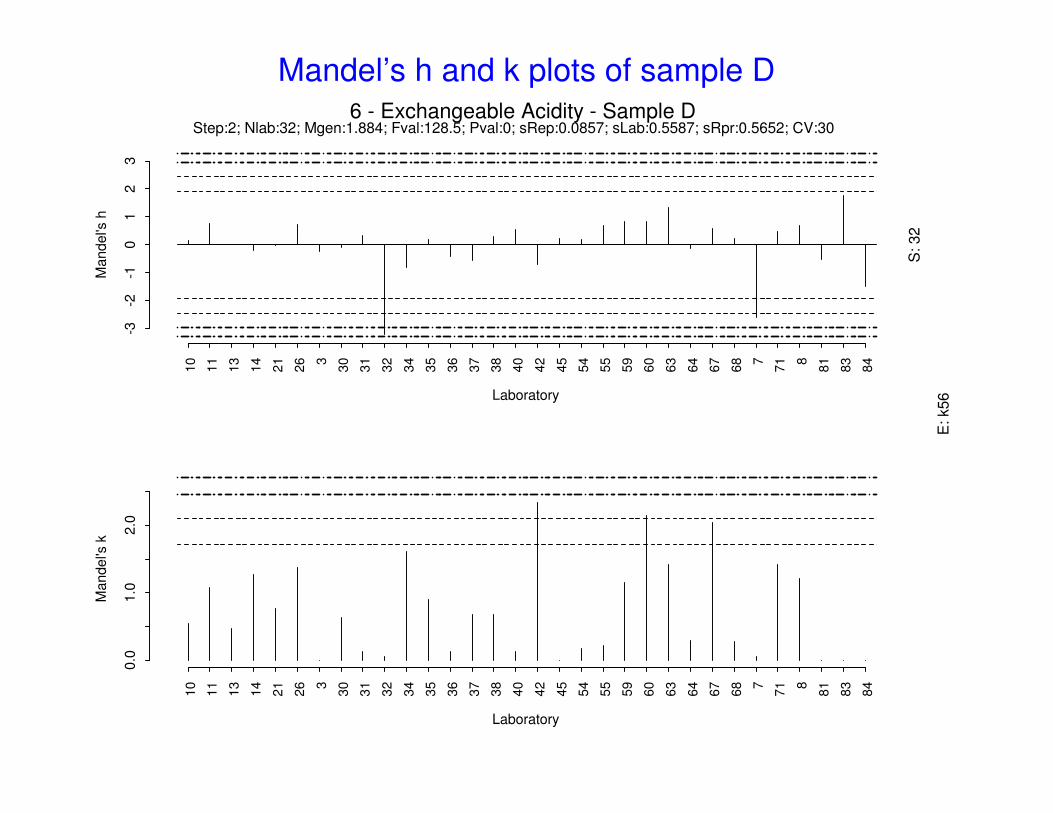
6 - Exchangeable Acidity - Sample DStep:2; Nlab:32; Mgen:1.884; Fval:128.5; Pval:0; sRep:0.0857; sLab:0.5587; sRpr:0.5652; CV:30
S: 32
Laboratory
Mandel's
k
0.0
1.0
2.0
10
11
13
14
21
26 3
30
31
32
34
35
36
37
38
40
42
45
54
55
59
60
63
64
67
68 7
71 8
81
83
84
E: k56
Mandel’s h and k plots of sample D
Laboratory
Mandel's
h
-3-2
-10
12
3
10
11
13
14
21
26 3
30
31
32
34
35
36
38
40
42
45
54
55
59
60
68 7 8
83
84
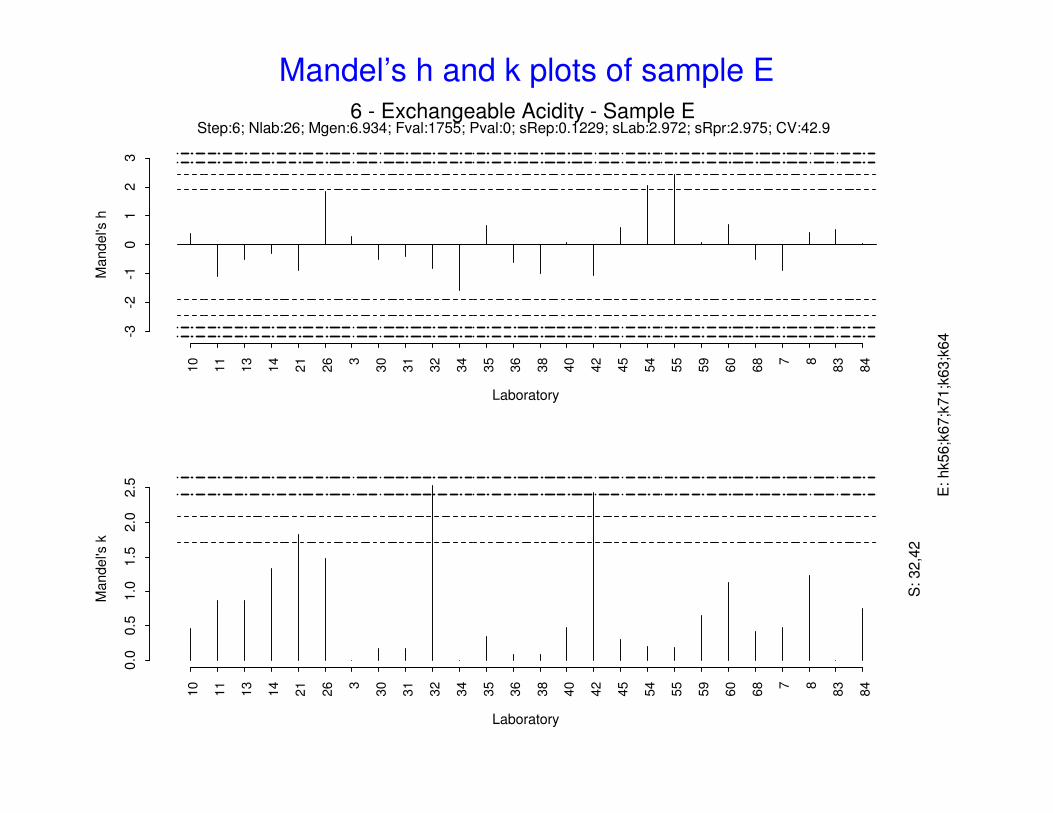
6 - Exchangeable Acidity - Sample EStep:6; Nlab:26; Mgen:6.934; Fval:1755; Pval:0; sRep:0.1229; sLab:2.972; sRpr:2.975; CV:42.9
Laboratory
Mandel's
k
0.0
0.5
1.0
1.5
2.0
2.5
10
11
13
14
21
26 3
30
31
32
34
35
36
38
40
42
45
54
55
59
60
68 7 8
83
84
S: 32,4
2
E: hk56;k
67;k
71;k
63;k
64
Mandel’s h and k plots of sample E
Exchangeable Aluminium
84644255858137346758
36
483638
73513301483826356106845403154322360
87121592611
0.5 1.0 1.5 2.0 2.5
Location
Labora
tory
Num
ber
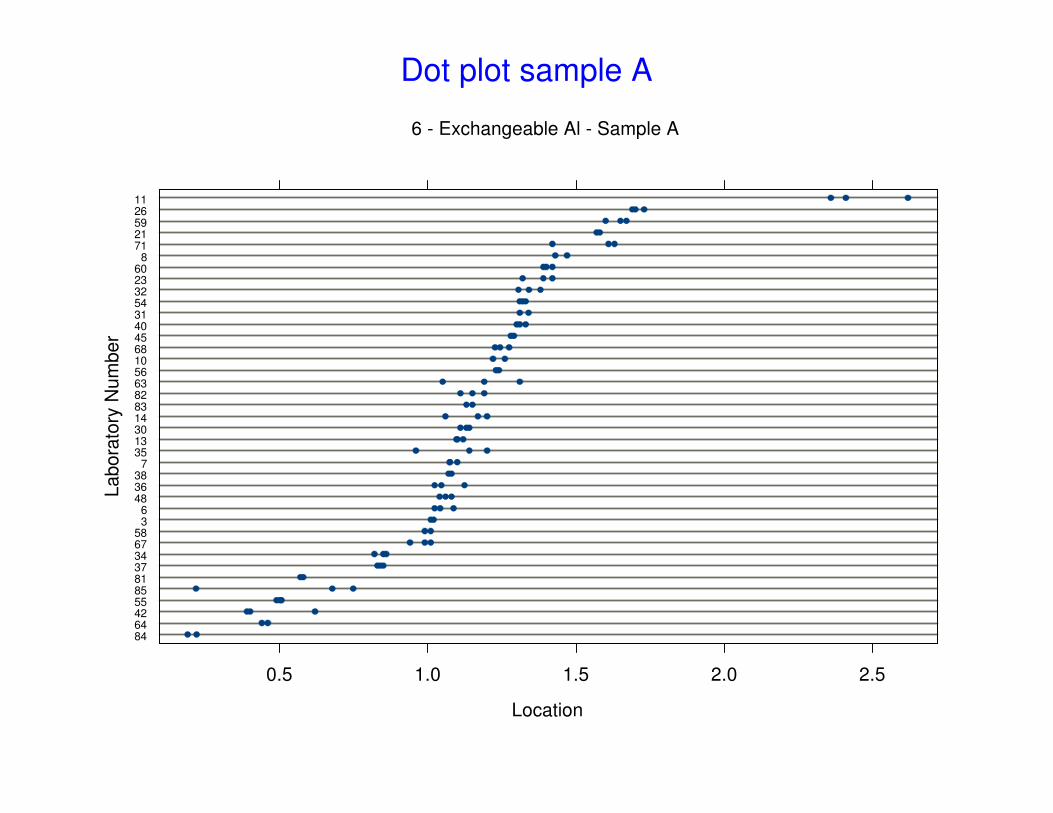
6 - Exchangeable Al - Sample A
Dot plot sample A
81556484423734586785
33682
76
30481383386823143556453263544060
810315971262111
1 2 3 4
Location
Labora
tory
Num
ber
6 - Exchangeable Al - Sample B
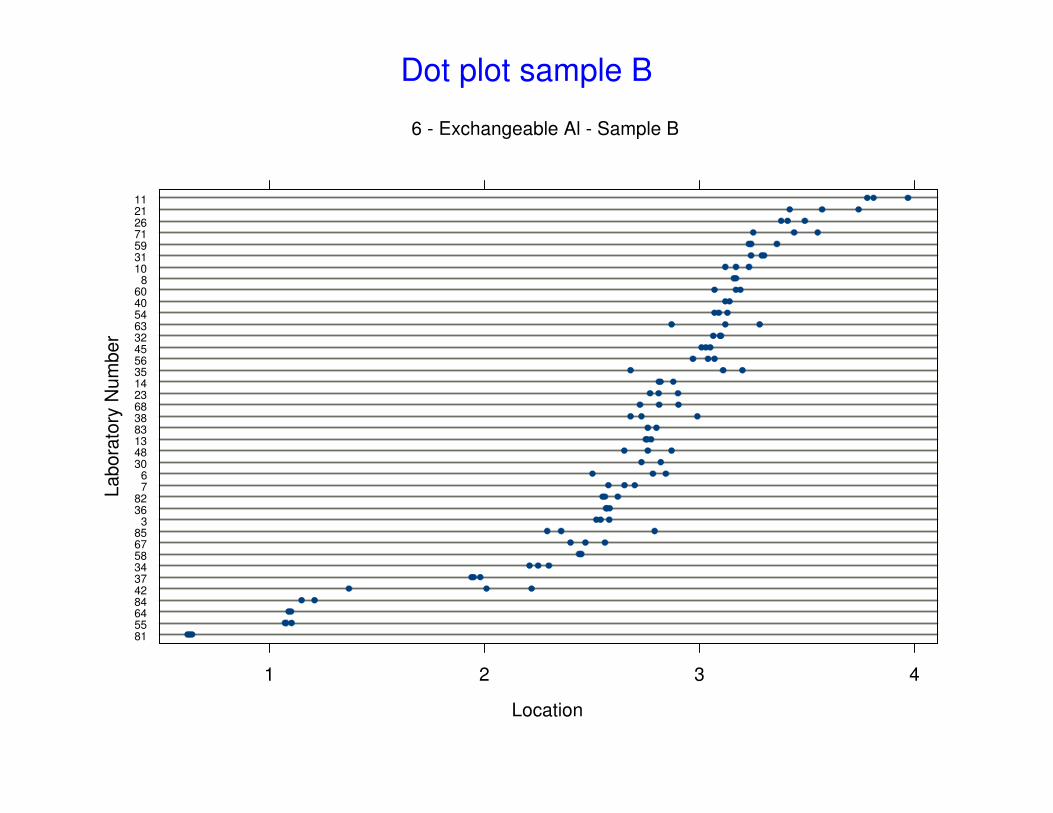
Dot plot sample B
85
30
6
55
67
13
64
10
40
59
60
83
26
7
36
82
81
0.0 0.05 0.10 0.15
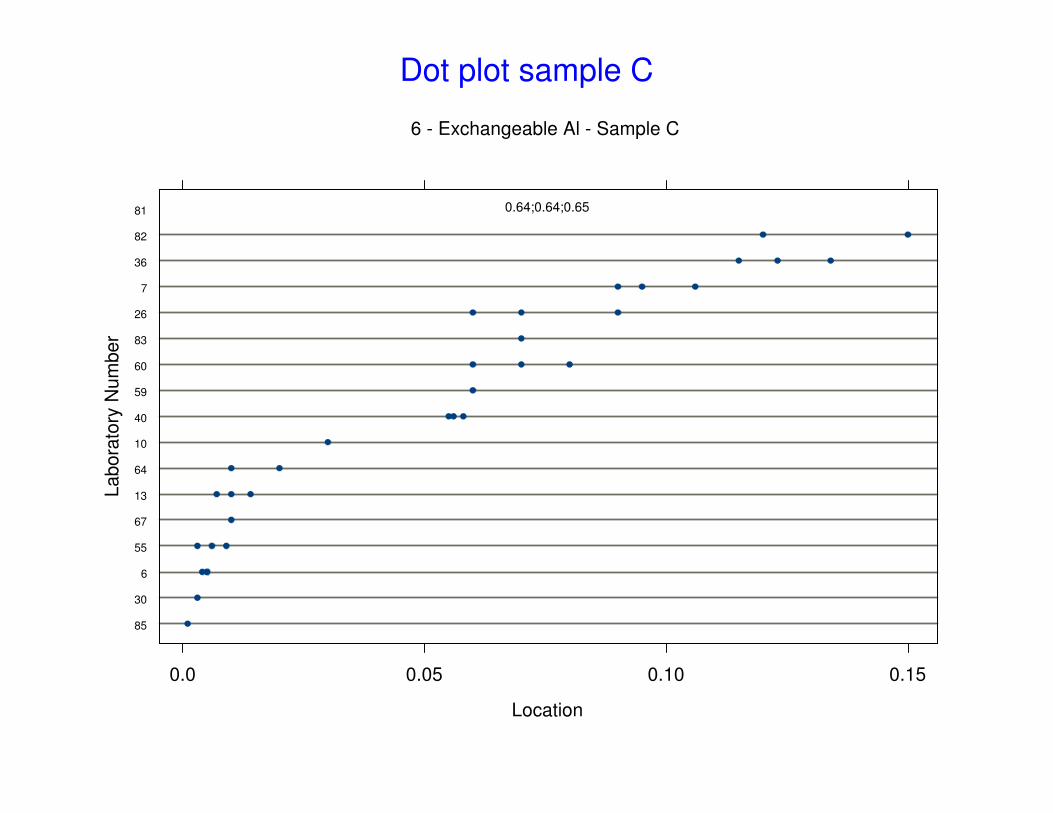
0.64;0.64;0.65
Location
Labora
tory
Num
ber
6 - Exchangeable Al - Sample C
Dot plot sample C
84645581428534378223145836
73
384867301310
66368355631408371325426
84521605911
0.5 1.0 1.5 2.0
Location
Labora
tory
Num
ber
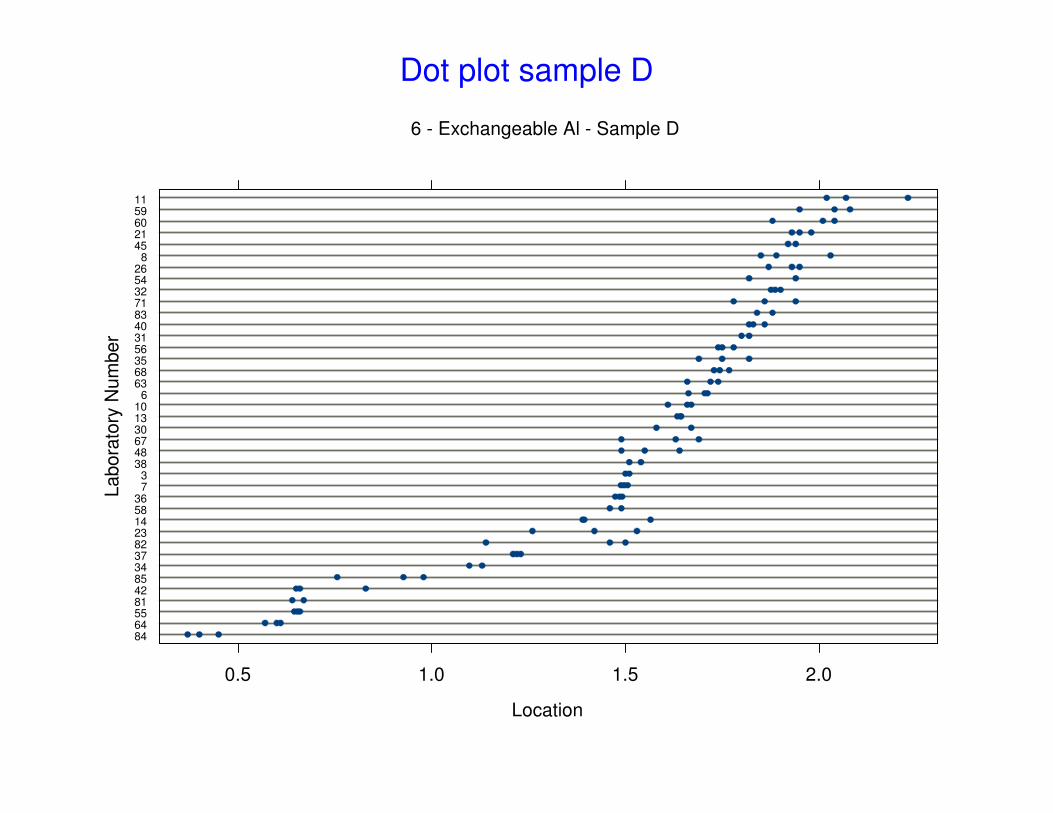
6 - Exchangeable Al - Sample D
Dot plot sample D
34641167
755428558381021836036
368133556458214
64831402663233259
8547130
0.4 0.6 0.8 1.0 1.2
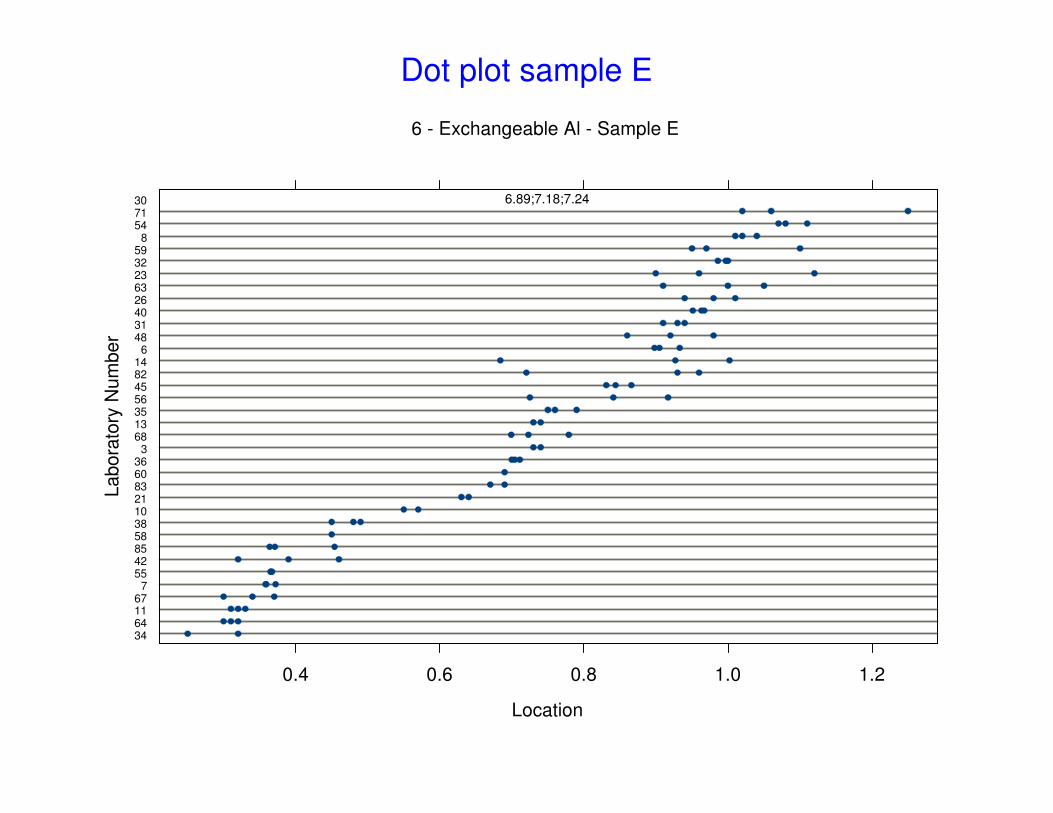
6.89;7.18;7.24
Location
Labora
tory
Num
ber
6 - Exchangeable Al - Sample E
Dot plot sample E
0.0 0.5 1.0 1.5 2.0 2.5
05
15
25
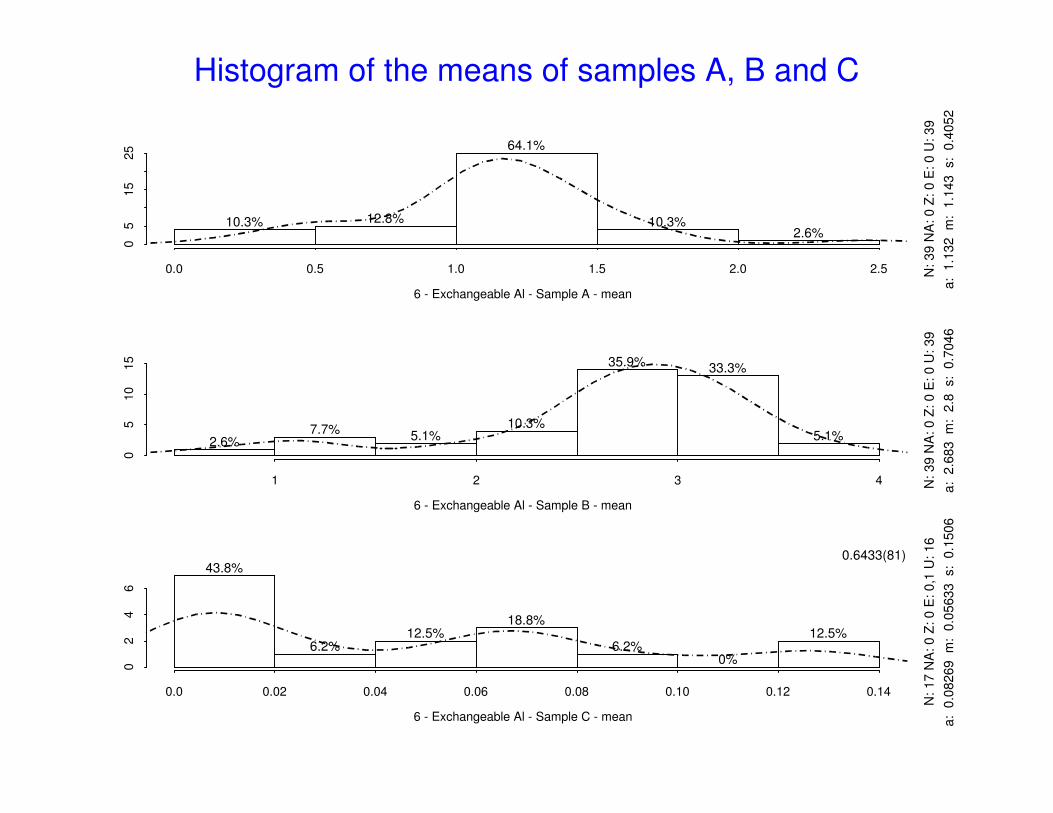
6 - Exchangeable Al - Sample A - mean
N:
39
NA
: 0
Z:
0 E
: 0
U:
39
a:
1.1
32
m
: 1
.14
3
s:
0.4
05
2
10.3% 12.8%
64.1%
10.3%2.6%
1 2 3 4
05
10
15
6 - Exchangeable Al - Sample B - mean
N:
39
NA
: 0
Z:
0 E
: 0
U:
39
a:
2.6
83
m
: 2
.8
s:
0.7
04
6
2.6%7.7%
5.1%10.3%
35.9% 33.3%
5.1%
0.0 0.02 0.04 0.06 0.08 0.10 0.12 0.14
02
46
6 - Exchangeable Al - Sample C - mean
N:
17
NA
: 0
Z:
0 E
: 0
,1 U
: 1
6
a:
0.0
82
69
m
: 0
.05
63
3
s:
0.1
50
6
43.8%
6.2%12.5%
18.8%
6.2%0%
12.5%
0.6433(81)
Histogram of the means of samples A, B and C
0.5 1.0 1.5 2.0
02
46
8
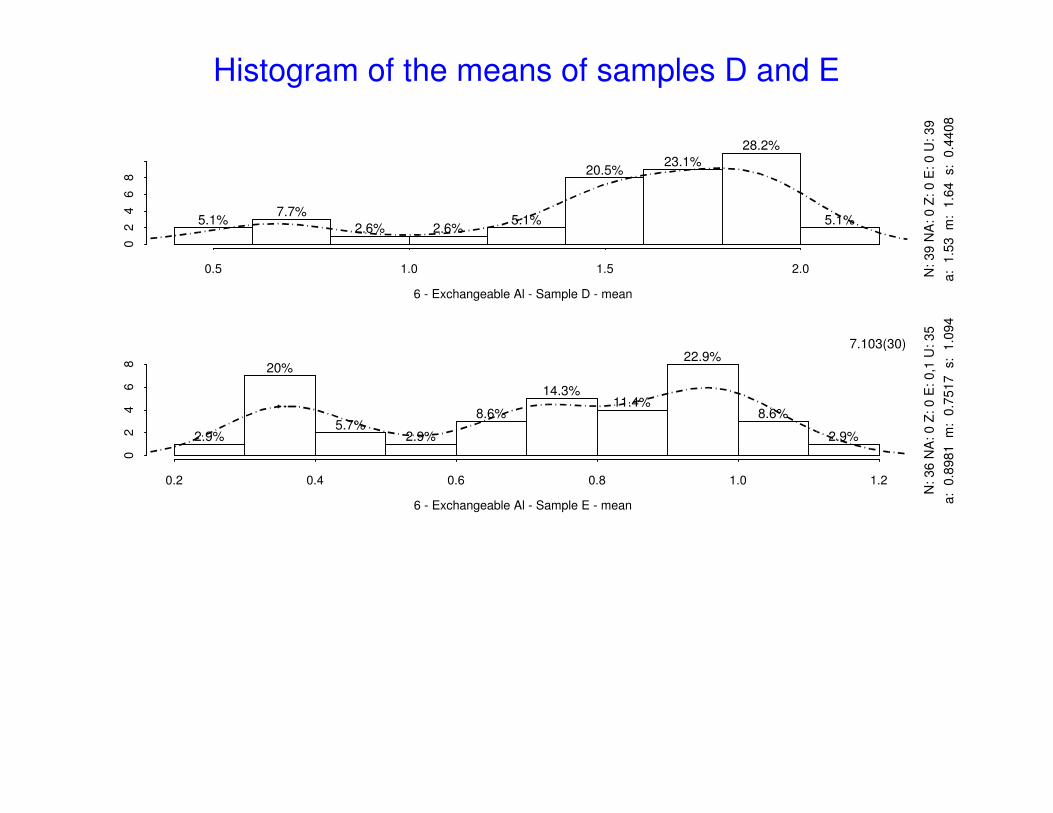
6 - Exchangeable Al - Sample D - mean
N:
39
NA
: 0
Z:
0 E
: 0
U:
39
a:
1.5
3
m:
1.6
4
s:
0.4
40
8
5.1%7.7%
2.6% 2.6%5.1%
20.5%23.1%
28.2%
5.1%
0.2 0.4 0.6 0.8 1.0 1.2
02
46
8
6 - Exchangeable Al - Sample E - mean
N:
36
NA
: 0
Z:
0 E
: 0
,1 U
: 3
5
a:
0.8
98
1
m:
0.7
51
7
s:
1.0
94
2.9%
20%
5.7%2.9%
8.6%
14.3%11.4%
22.9%
8.6%
2.9%
7.103(30)
Histogram of the means of samples D and E
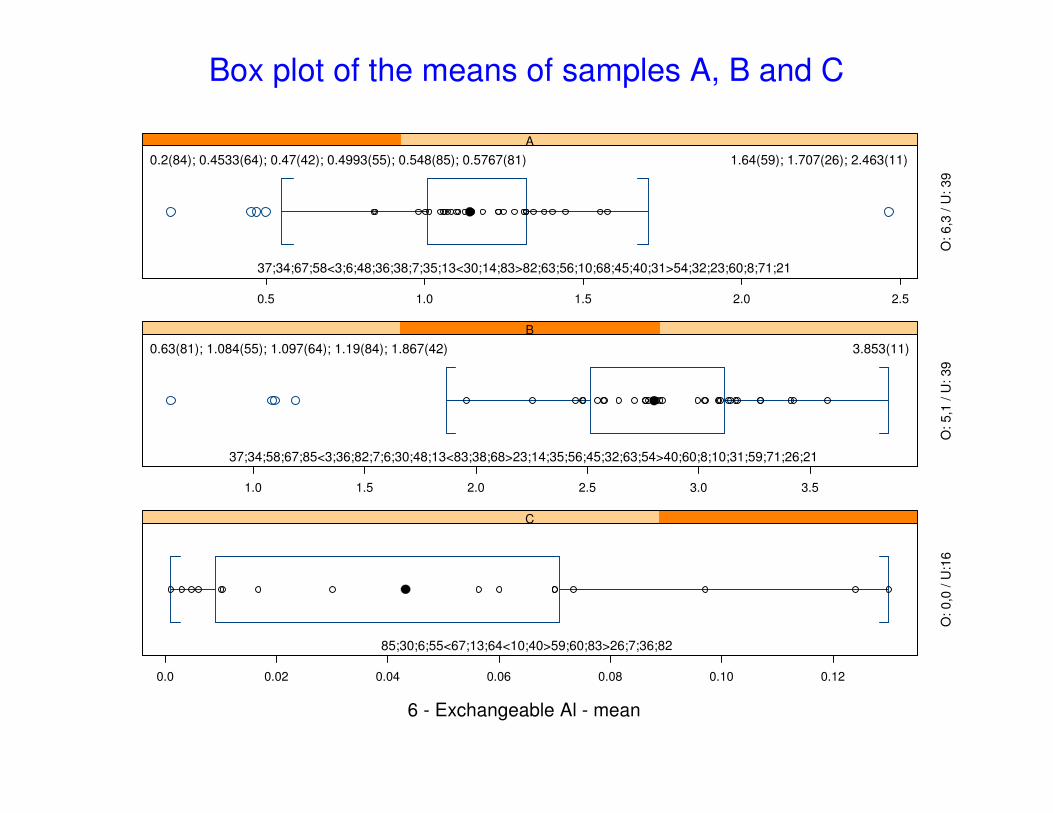
0.5 1.0 1.5 2.0 2.5
A
0.2(84); 0.4533(64); 0.47(42); 0.4993(55); 0.548(85); 0.5767(81) 1.64(59); 1.707(26); 2.463(11)
37;34;67;58<3;6;48;36;38;7;35;13<30;14;83>82;63;56;10;68;45;40;31>54;32;23;60;8;71;21
O:
6,3
/ U
: 3
9
1.0 1.5 2.0 2.5 3.0 3.5
B
0.63(81); 1.084(55); 1.097(64); 1.19(84); 1.867(42) 3.853(11)
37;34;58;67;85<3;36;82;7;6;30;48;13<83;38;68>23;14;35;56;45;32;63;54>40;60;8;10;31;59;71;26;21
O:
5,1
/ U
: 3
9
0.0 0.02 0.04 0.06 0.08 0.10 0.12
C
85;30;6;55<67;13;64<10;40>59;60;83>26;7;36;82
O:
0,0
/ U
:16
6 - Exchangeable Al - mean
Box plot of the means of samples A, B and C
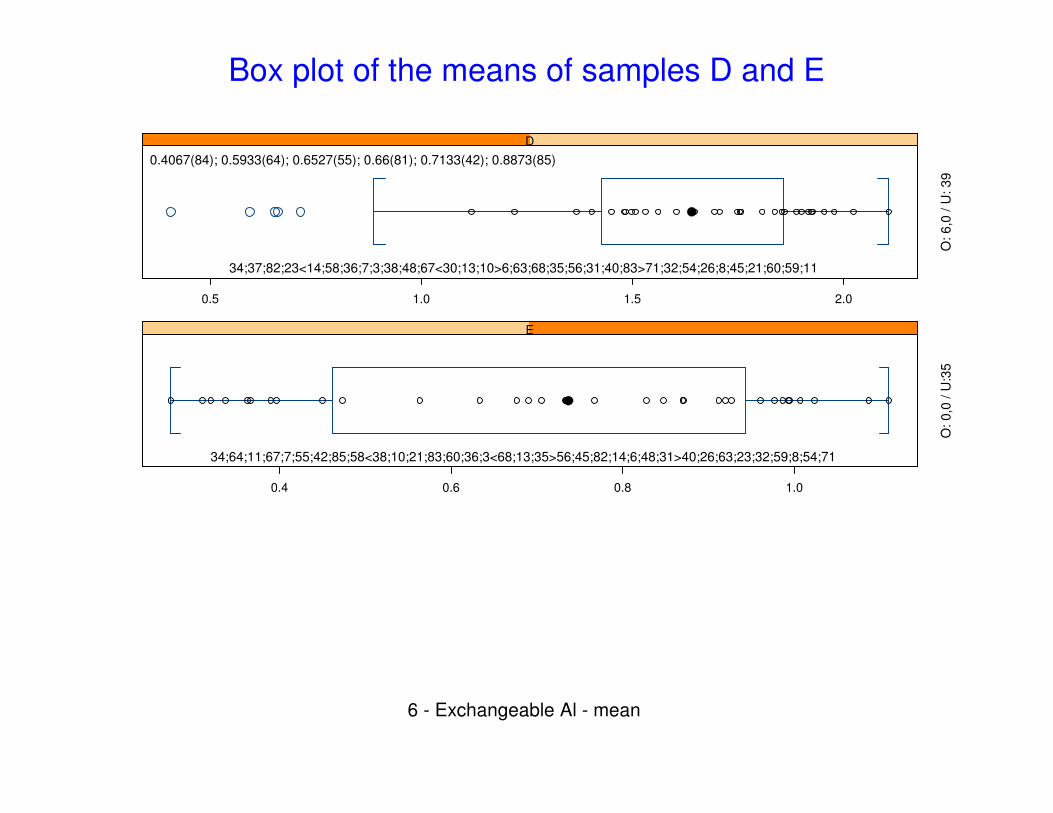
0.5 1.0 1.5 2.0
D
0.4067(84); 0.5933(64); 0.6527(55); 0.66(81); 0.7133(42); 0.8873(85)
34;37;82;23<14;58;36;7;3;38;48;67<30;13;10>6;63;68;35;56;31;40;83>71;32;54;26;8;45;21;60;59;11
O:
6,0
/ U
: 3
9
0.4 0.6 0.8 1.0
E
34;64;11;67;7;55;42;85;58<38;10;21;83;60;36;3<68;13;35>56;45;82;14;6;48;31>40;26;63;23;32;59;8;54;71
O:
0,0
/ U
:35
6 - Exchangeable Al - mean
Box plot of the means of samples D and E
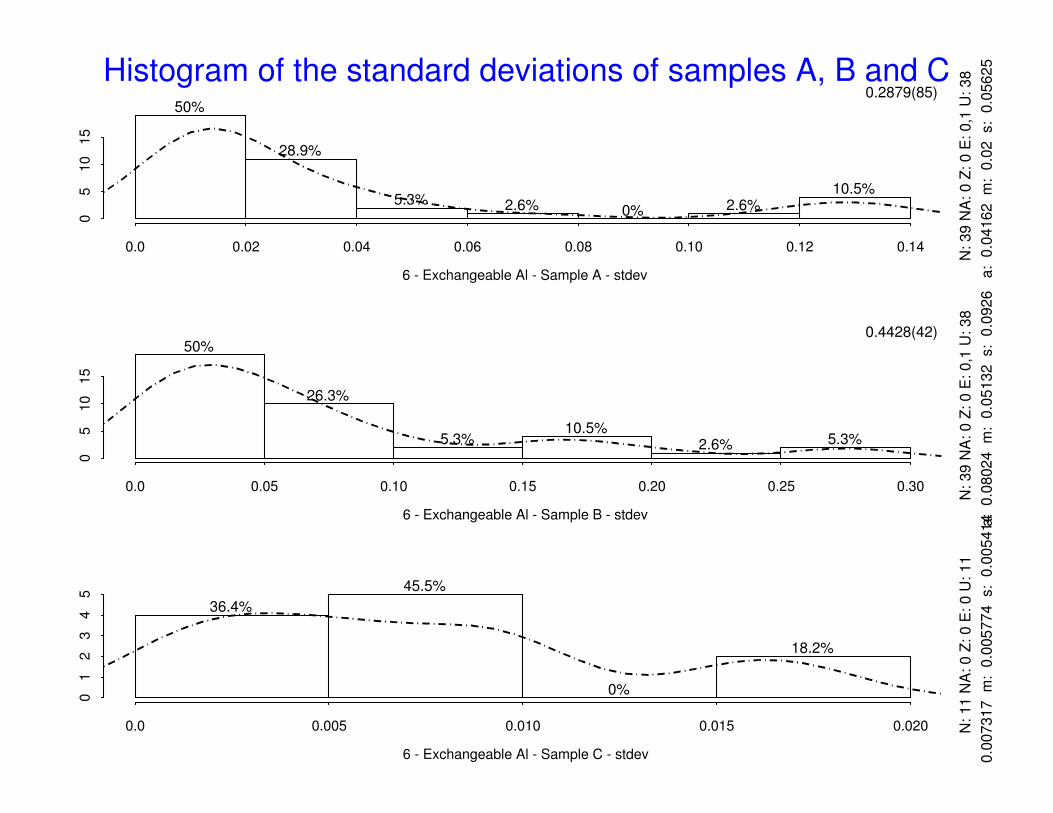
Histogram of the standard deviations of samples A, B and C
0.0 0.02 0.04 0.06 0.08 0.10 0.12 0.14
05
10
15
6 - Exchangeable Al - Sample A - stdev
N: 39 N
A: 0 Z
: 0 E
: 0,1
U: 38
a: 0
.04162 m
: 0
.02 s: 0
.05625
50%
28.9%
5.3% 2.6% 0% 2.6%10.5%
0.2879(85)
0.0 0.05 0.10 0.15 0.20 0.25 0.30
05
10
15
6 - Exchangeable Al - Sample B - stdev
N: 39 N
A: 0 Z
: 0 E
: 0,1
U: 38
a: 0
.08024 m
: 0
.05132 s: 0
.0926
50%
26.3%
5.3%10.5%
2.6% 5.3%
0.4428(42)
0.0 0.005 0.010 0.015 0.020
01
23
45
6 - Exchangeable Al - Sample C - stdev
N: 11 N
A: 0 Z
: 0 E
: 0 U
: 11
a: 0
.007317 m
: 0
.005774 s: 0
.005414
36.4%
45.5%
0%
18.2%
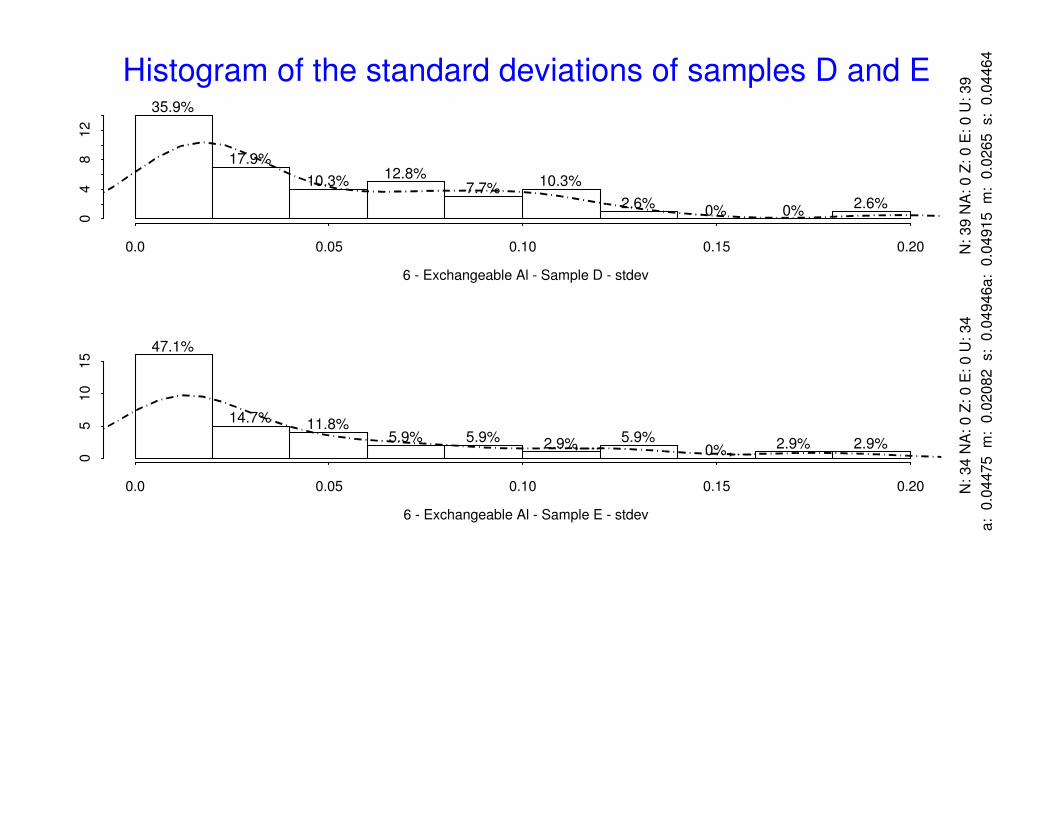
Histogram of the standard deviations of samples D and E
0.0 0.05 0.10 0.15 0.20
04
812
6 - Exchangeable Al - Sample D - stdev
N: 39 N
A: 0 Z
: 0 E
: 0 U
: 39
a: 0
.04915 m
: 0
.0265 s: 0
.04464
35.9%
17.9%
10.3%12.8%
7.7%10.3%
2.6%0% 0%
2.6%
0.0 0.05 0.10 0.15 0.20
05
10
15
6 - Exchangeable Al - Sample E - stdev
N: 34 N
A: 0 Z
: 0 E
: 0 U
: 34
a: 0
.04475 m
: 0
.02082 s: 0
.04946
47.1%
14.7% 11.8%5.9% 5.9% 2.9% 5.9%
0% 2.9% 2.9%
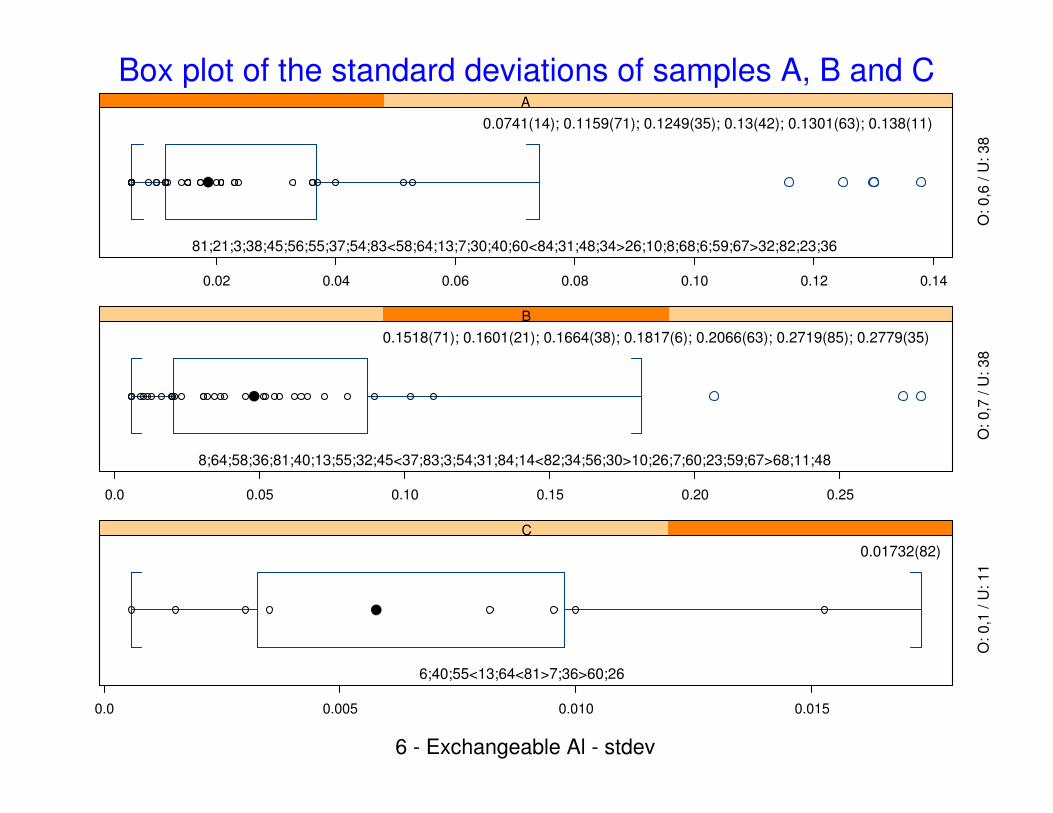
Box plot of the standard deviations of samples A, B and C
0.02 0.04 0.06 0.08 0.10 0.12 0.14
A
0.0741(14); 0.1159(71); 0.1249(35); 0.13(42); 0.1301(63); 0.138(11)
81;21;3;38;45;56;55;37;54;83<58;64;13;7;30;40;60<84;31;48;34>26;10;8;68;6;59;67>32;82;23;36
O: 0,6
/ U
: 38
0.0 0.05 0.10 0.15 0.20 0.25
B
0.1518(71); 0.1601(21); 0.1664(38); 0.1817(6); 0.2066(63); 0.2719(85); 0.2779(35)
8;64;58;36;81;40;13;55;32;45<37;83;3;54;31;84;14<82;34;56;30>10;26;7;60;23;59;67>68;11;48
O: 0,7
/ U
: 38
0.0 0.005 0.010 0.015
C
0.01732(82)
6;40;55<13;64<81>7;36>60;26
O: 0,1
/ U
: 11
6 - Exchangeable Al - stdev
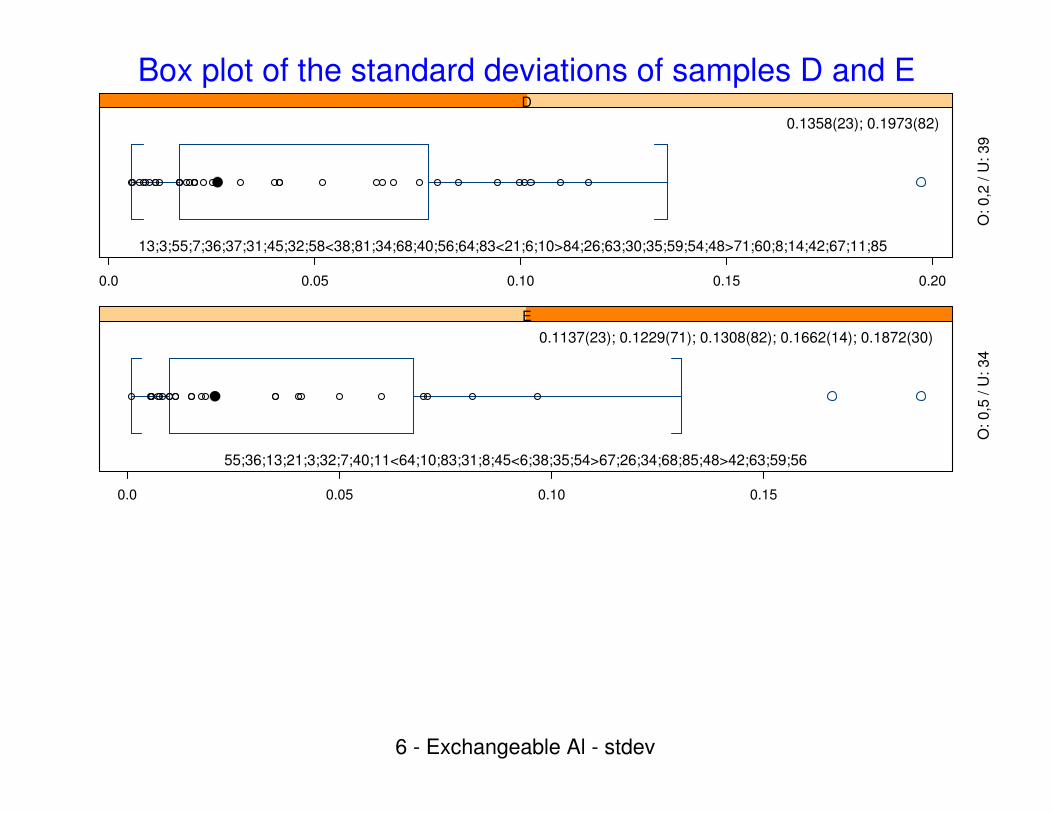
Box plot of the standard deviations of samples D and E
0.0 0.05 0.10 0.15 0.20
D
0.1358(23); 0.1973(82)
13;3;55;7;36;37;31;45;32;58<38;81;34;68;40;56;64;83<21;6;10>84;26;63;30;35;59;54;48>71;60;8;14;42;67;11;85
O: 0,2
/ U
: 39
0.0 0.05 0.10 0.15
E
0.1137(23); 0.1229(71); 0.1308(82); 0.1662(14); 0.1872(30)
55;36;13;21;3;32;7;40;11<64;10;83;31;8;45<6;38;35;54>67;26;34;68;85;48>42;63;59;56
O: 0,5
/ U
: 34
6 - Exchangeable Al - stdev
Labora
tory
Mandel's h
-2 0 2
10
11
13
14
21
23
26
3
30
31
32
34
35
36
37
38
40
42
45
48
54
55
56
58
59
6
60
63
64
67
68
7
71
8
81
82
83
84
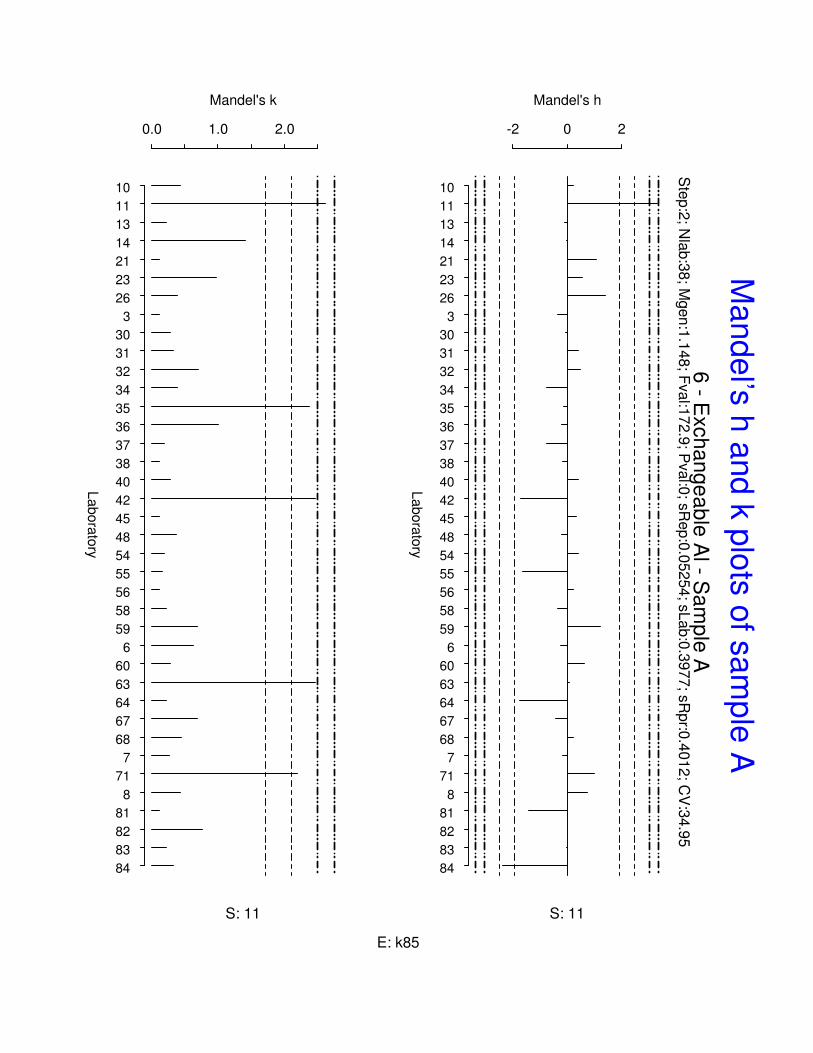
6 - E
xch
an
ge
ab
le A
l - Sa
mp
le A
Ste
p:2
; Nla
b:3
8; M
gen:1
.148; F
val:1
72.9
; Pval:0
; sR
ep:0
.05254; s
Lab:0
.3977; s
Rpr:0
.4012; C
V:3
4.9
5
S: 11
Labora
tory
Mandel's k
0.0 1.0 2.0
10
11
13
14
21
23
26
3
30
31
32
34
35
36
37
38
40
42
45
48
54
55
56
58
59
6
60
63
64
67
68
7
71
8
81
82
83
84
S: 11
E: k85
Mande
l’s h
and k
plo
ts o
f sam
ple
A
Labora
tory
Mandel's h
-2 0 2
10
11
13
14
21
23
26
3
30
31
32
34
36
37
38
40
45
48
54
55
56
58
59
6
60
63
64
67
68
7
71
8
81
82
83
84
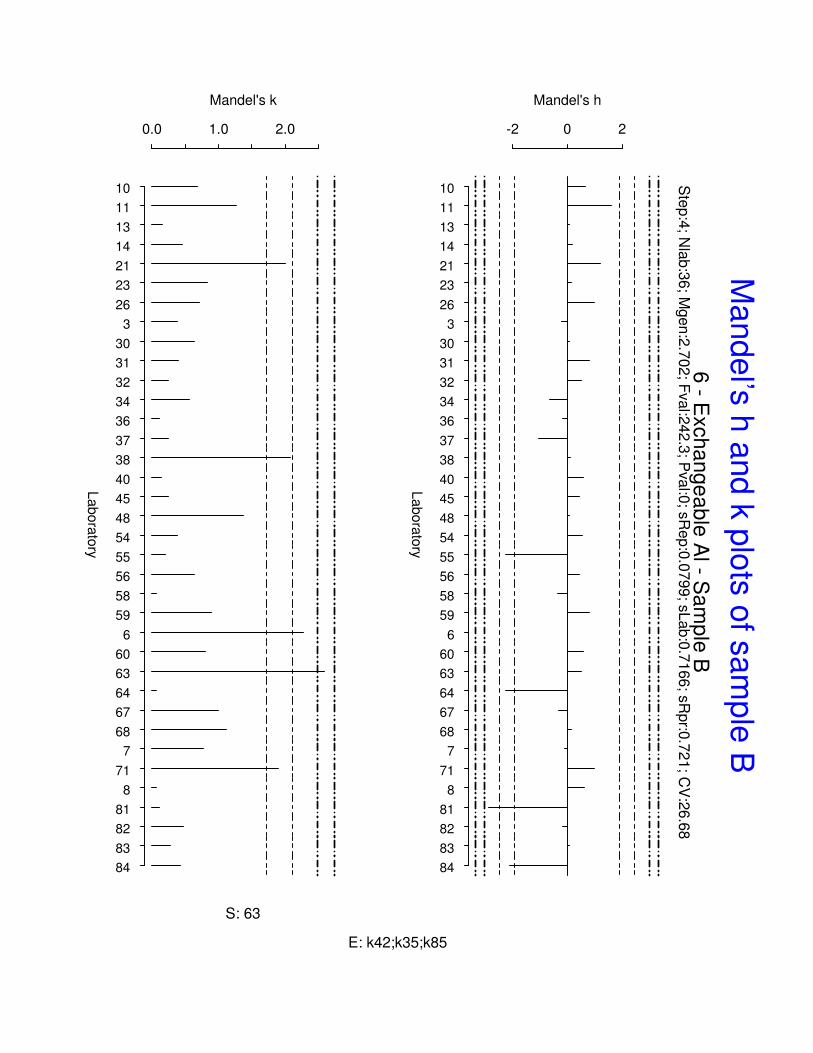
6 - E
xch
an
ge
ab
le A
l - Sa
mp
le B
Ste
p:4
; Nla
b:3
6; M
gen:2
.702; F
val:2
42.3
; Pval:0
; sR
ep:0
.0799; s
Lab:0
.7166; s
Rpr:0
.721; C
V:2
6.6
8
Labora
tory
Mandel's k
0.0 1.0 2.0
10
11
13
14
21
23
26
3
30
31
32
34
36
37
38
40
45
48
54
55
56
58
59
6
60
63
64
67
68
7
71
8
81
82
83
84
S: 63
E: k42;k35;k85
Mande
l’s h
and k
plo
ts o
f sam
ple
B
Laboratory
Mandel's
h
-2-1
01
2
10
13
26
30
36
40
55 6
60
64
67 7
82
83
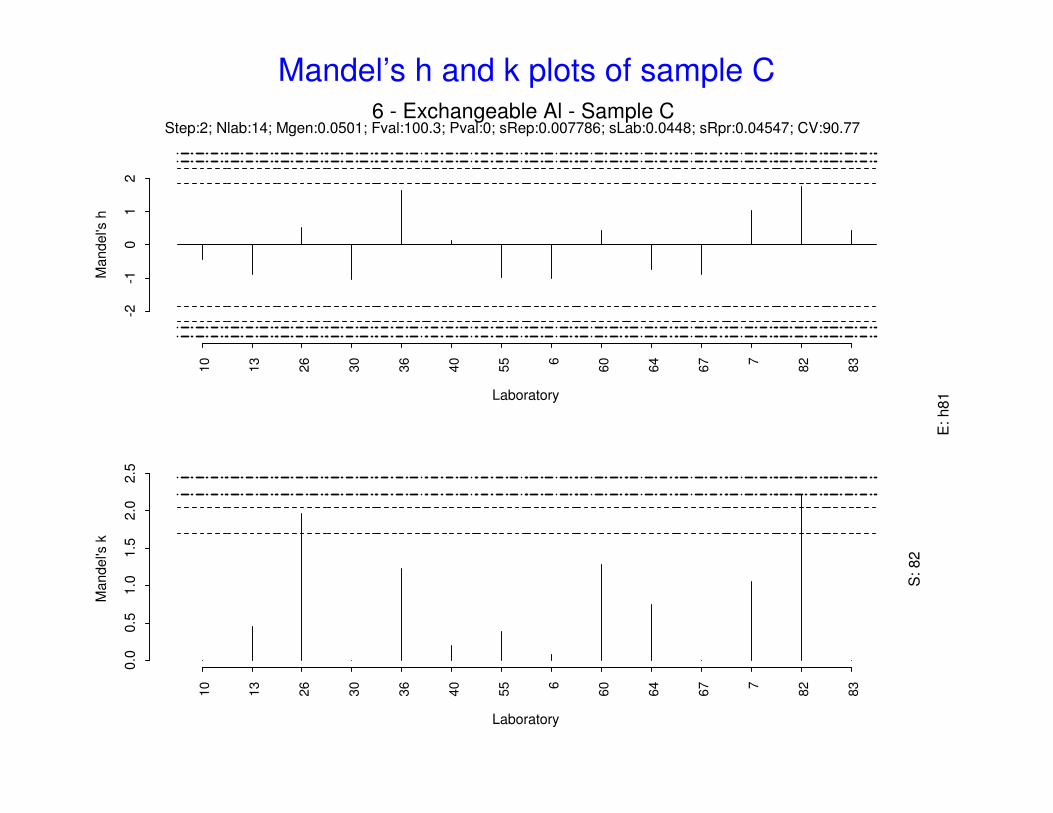
6 - Exchangeable Al - Sample CStep:2; Nlab:14; Mgen:0.0501; Fval:100.3; Pval:0; sRep:0.007786; sLab:0.0448; sRpr:0.04547; CV:90.77
Laboratory
Mandel's
k
0.0
0.5
1.0
1.5
2.0
2.5
10
13
26
30
36
40
55 6
60
64
67 7
82
83
S: 82
E: h81
Mandel’s h and k plots of sample C
Labora
tory
Mandel's h
-2 0 2
10
11
13
14
21
23
26
3
30
31
32
34
35
36
37
38
40
42
45
48
54
55
56
58
59
6
60
63
64
67
68
7
71
8
81
83
84
85
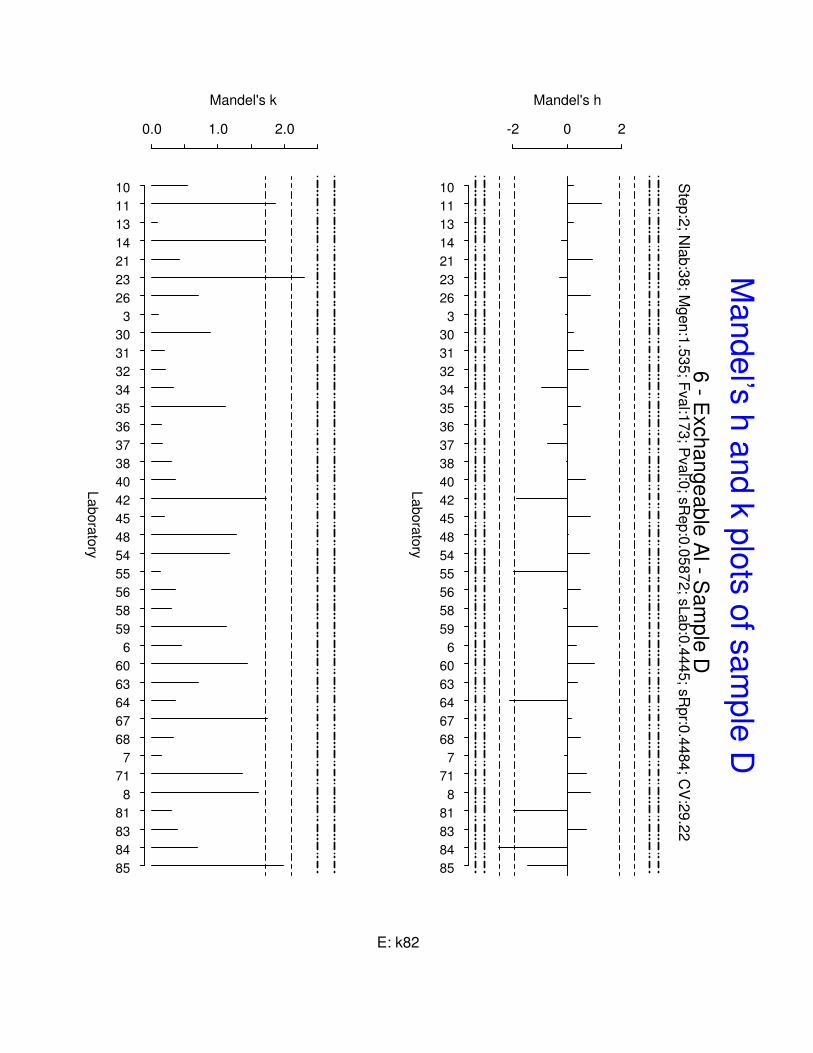
6 - E
xch
an
ge
ab
le A
l - Sa
mp
le D
Ste
p:2
; Nla
b:3
8; M
gen:1
.535; F
val:1
73; P
val:0
; sR
ep:0
.05872; s
Lab:0
.4445; s
Rpr:0
.4484; C
V:2
9.2
2
Labora
tory
Mandel's k
0.0 1.0 2.0
10
11
13
14
21
23
26
3
30
31
32
34
35
36
37
38
40
42
45
48
54
55
56
58
59
6
60
63
64
67
68
7
71
8
81
83
84
85
E: k82
Mande
l’s h
and k
plo
ts o
f sam
ple
D
Laboratory
Mandel's
h
-20
2
10
11
13
21
23
26 3
31
32
34
35
36
38
40
42
45
48
54
55
56
58
59 6
60
63
64
67
68 7
71 8
82
83
85
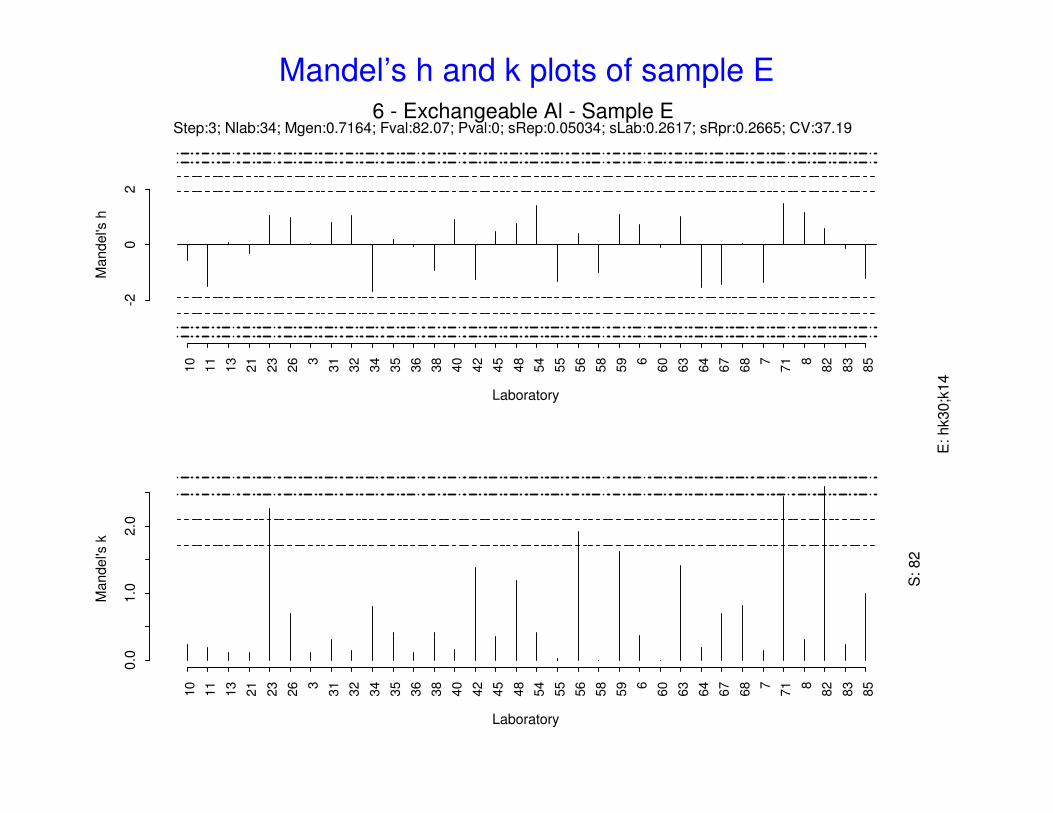
6 - Exchangeable Al - Sample EStep:3; Nlab:34; Mgen:0.7164; Fval:82.07; Pval:0; sRep:0.05034; sLab:0.2617; sRpr:0.2665; CV:37.19
Laboratory
Mandel's
k
0.0
1.0
2.0
10
11
13
21
23
26 3
31
32
34
35
36
38
40
42
45
48
54
55
56
58
59 6
60
63
64
67
68 7
71 8
82
83
85
S: 82
E: hk30;k
14
Mandel’s h and k plots of sample E
Exchangeable Fe
541330
632
3485864
8856845344283551135596756
7212331634026601271828177
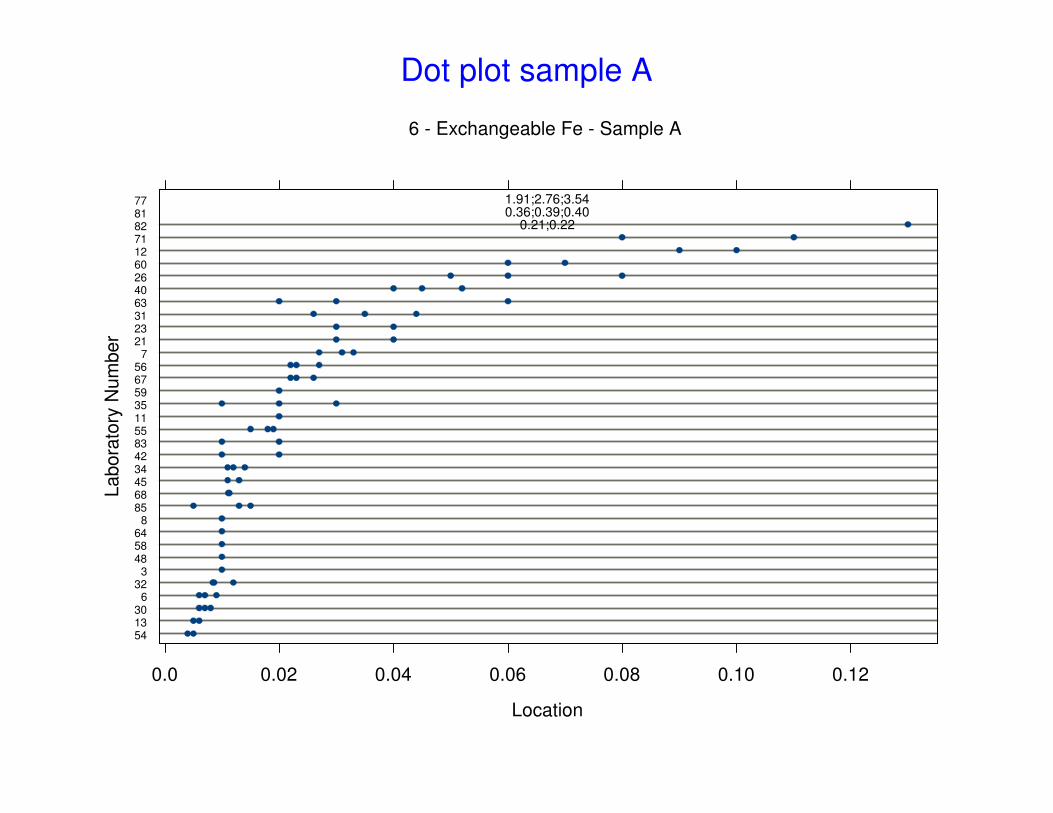
0.0 0.02 0.04 0.06 0.08 0.10 0.12
1.91;2.76;3.540.36;0.39;0.40
0.21;0.22
Location
Labora
tory
Num
ber
6 - Exchangeable Fe - Sample A
Dot plot sample A
64553742
38336
6143448305823456756132135635432
7316810
88559407126121160828177
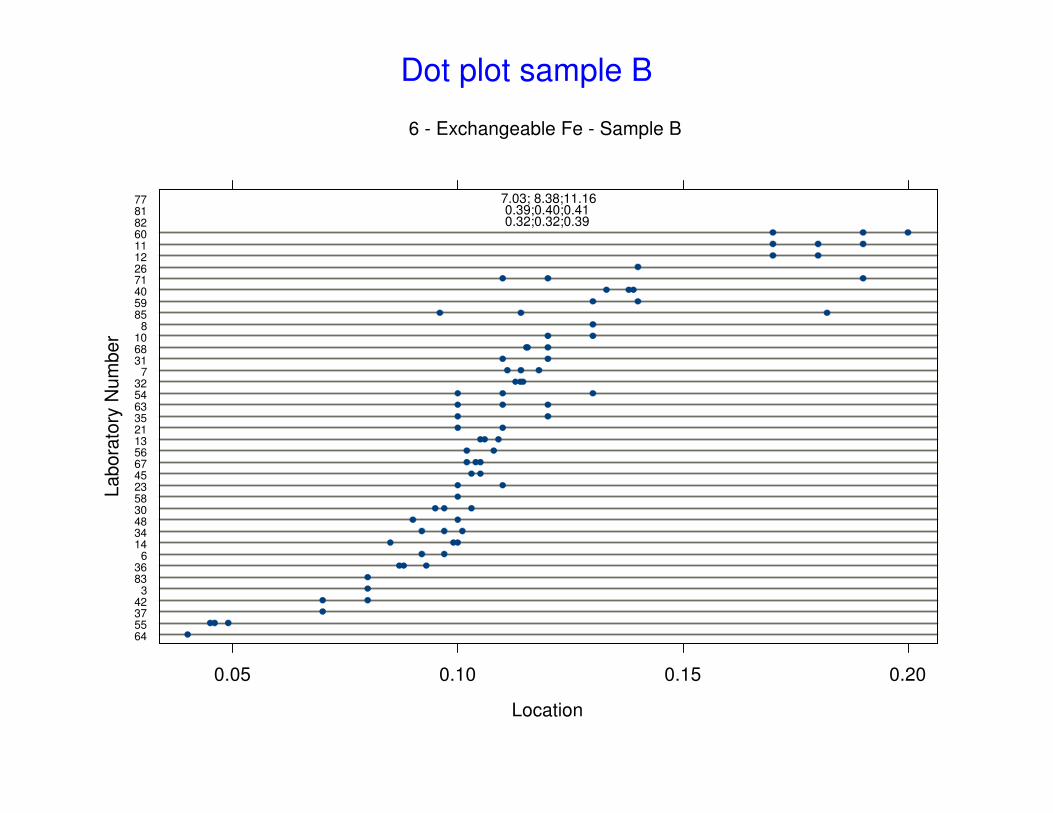
0.05 0.10 0.15 0.20
7.03; 8.38;11.160.39;0.40;0.410.32;0.32;0.39
Location
Labora
tory
Num
ber
6 - Exchangeable Fe - Sample B
Dot plot sample B
32
68
64
13
55
85
67
45
59
63
83
21
40
12
26
60
7
34
23
82
77
81
0.0 0.02 0.04 0.06 0.08 0.10 0.12
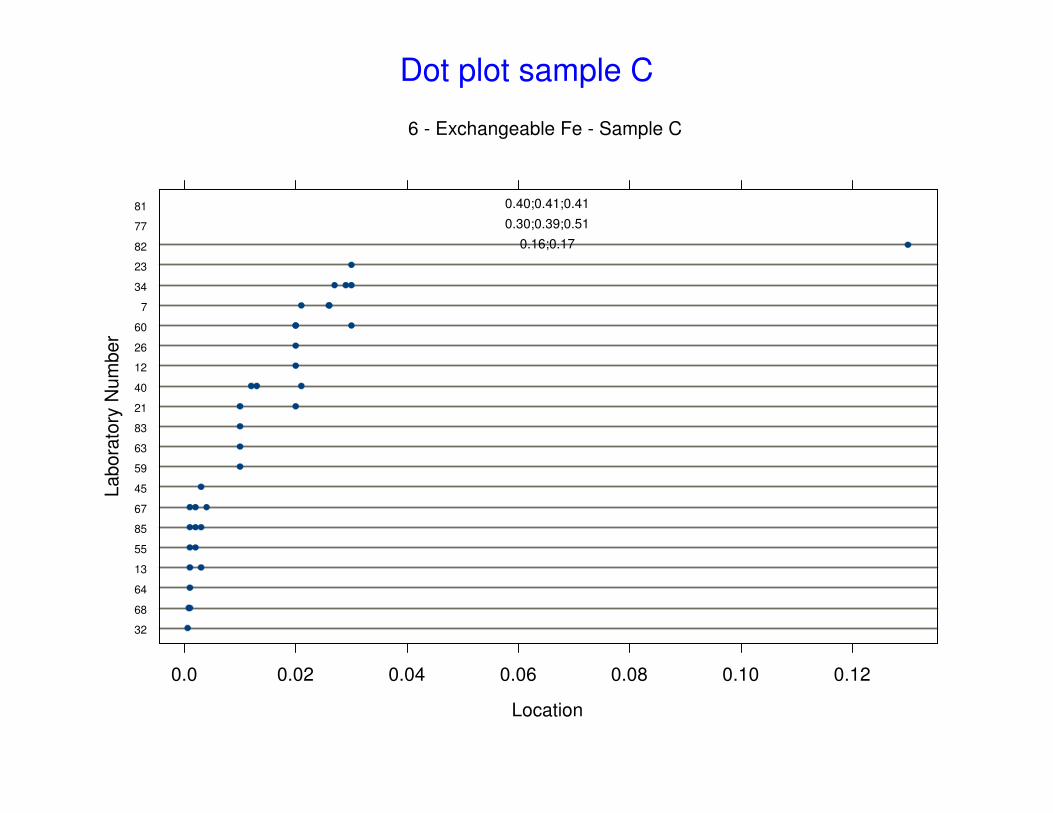
0.30;0.39;0.51
0.40;0.41;0.41
0.16;0.17
Location
Labora
tory
Num
ber
6 - Exchangeable Fe - Sample C
Dot plot sample C
32
30
85
68
13
64
55
67
63
83
40
7
35
54
21
26
23
12
60
82
81
77
0.0 0.02 0.04 0.06 0.08 0.10 0.12 0.14
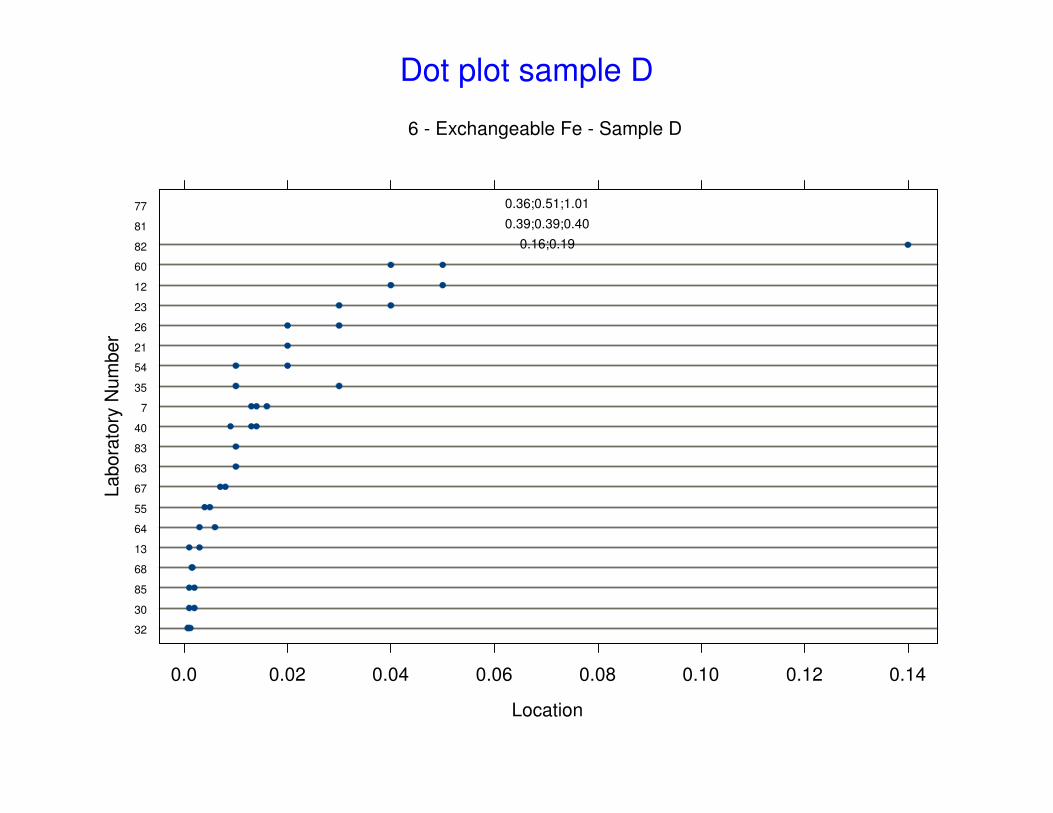
0.36;0.51;1.01
0.39;0.39;0.40
0.16;0.19
Location
Labora
tory
Num
ber
6 - Exchangeable Fe - Sample D
Dot plot sample D
64678555112134
74283581435362348306810
35613406063
626313271455954
8128277
0.1 0.2 0.3 0.4 0.5
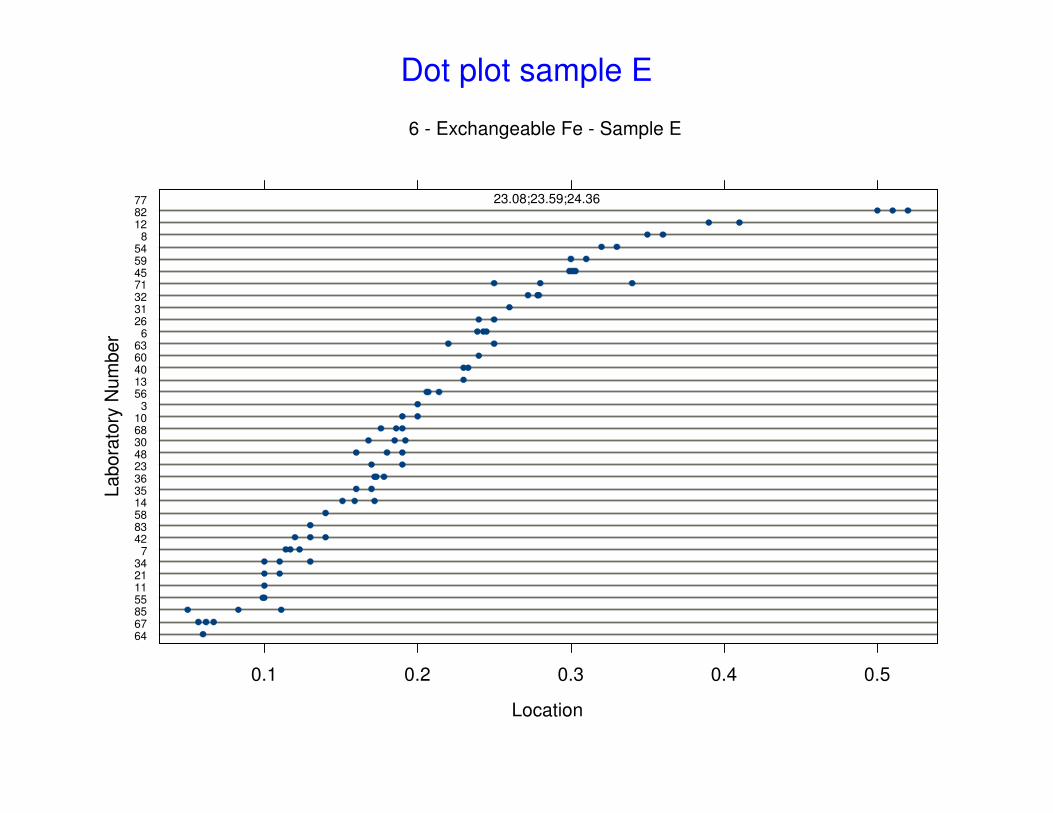
23.08;23.59;24.36
Location
Labora
tory
Num
ber
6 - Exchangeable Fe - Sample E
Dot plot sample E
0.0 0.02 0.04 0.06 0.08 0.10
05
10
15
20
6 - Exchangeable Fe - Sample A - mean
N:
35
NA
: 0
Z:
0 E
: 0
,3 U
: 3
2
a:
0.1
17
7
m:
0.0
2
s:
0.4
60
9
62.5%
21.9%
3.1% 6.2% 6.2%
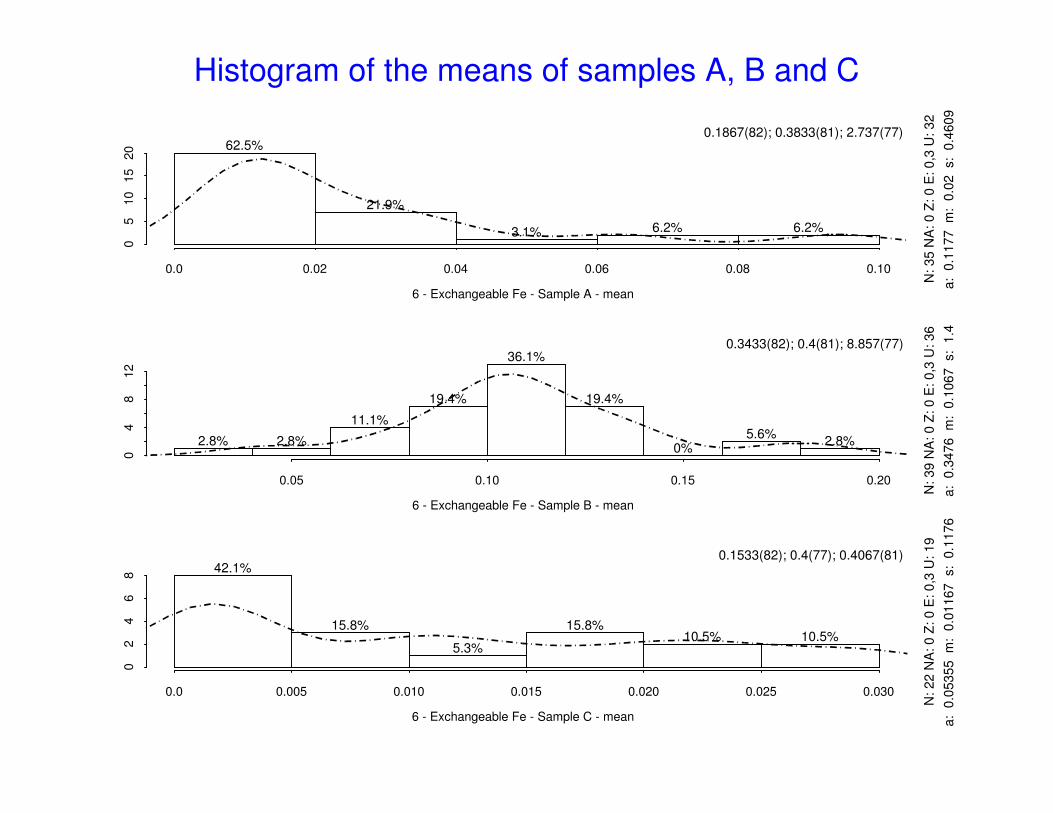
0.1867(82); 0.3833(81); 2.737(77)
0.05 0.10 0.15 0.20
04
812
6 - Exchangeable Fe - Sample B - mean
N:
39
NA
: 0
Z:
0 E
: 0
,3 U
: 3
6
a:
0.3
47
6
m:
0.1
06
7
s:
1.4
2.8% 2.8%
11.1%
19.4%
36.1%
19.4%
0%5.6%
2.8%
0.3433(82); 0.4(81); 8.857(77)
0.0 0.005 0.010 0.015 0.020 0.025 0.030
02
46
8
6 - Exchangeable Fe - Sample C - mean
N:
22
NA
: 0
Z:
0 E
: 0
,3 U
: 1
9
a:
0.0
53
55
m
: 0
.01
16
7
s:
0.1
17
6
42.1%
15.8%
5.3%
15.8%10.5% 10.5%
0.1533(82); 0.4(77); 0.4067(81)
Histogram of the means of samples A, B and C
0.0 0.01 0.02 0.03 0.04 0.05
02
46
8
6 - Exchangeable Fe - Sample D - mean
N:
22
NA
: 0
Z:
0 E
: 0
,3 U
: 1
9
a:
0.0
66
2
m:
0.0
13
17
s:
0.1
52
52.6%
26.3%
5.3% 5.3%10.5%
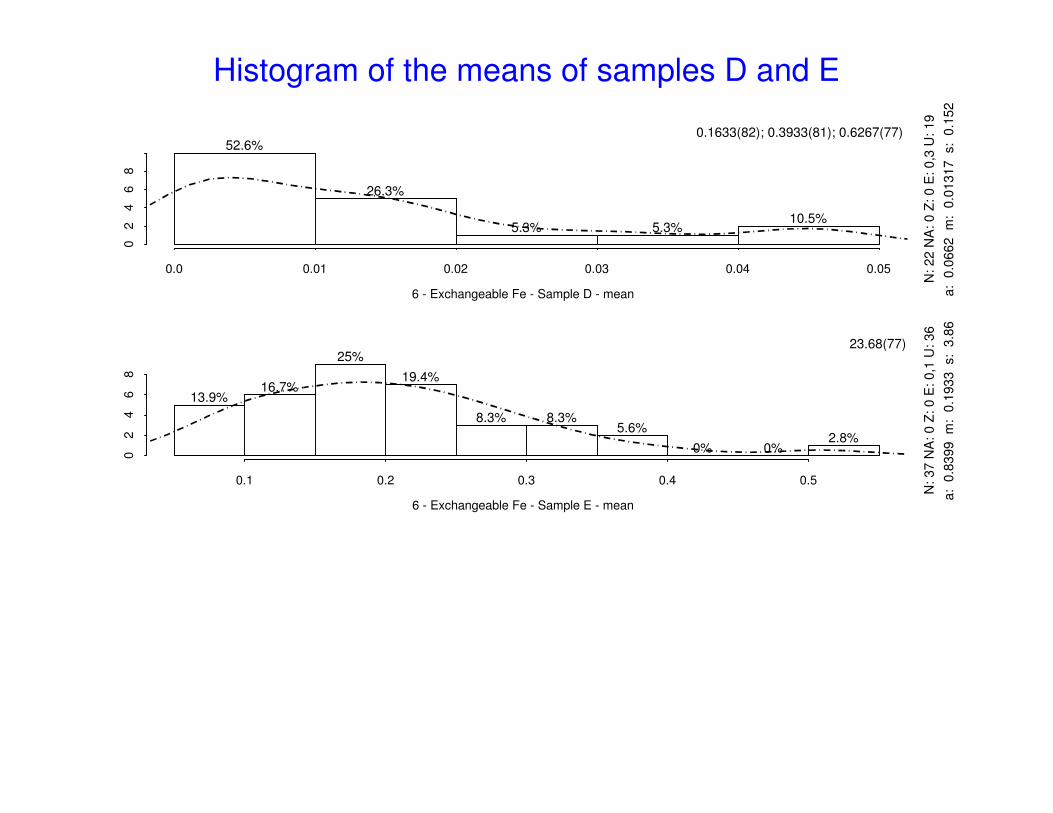
0.1633(82); 0.3933(81); 0.6267(77)
0.1 0.2 0.3 0.4 0.5
02
46
8
6 - Exchangeable Fe - Sample E - mean
N:
37
NA
: 0
Z:
0 E
: 0
,1 U
: 3
6
a:
0.8
39
9
m:
0.1
93
3
s:
3.8
6
13.9%16.7%
25%
19.4%
8.3% 8.3%5.6%
0% 0%2.8%
23.68(77)
Histogram of the means of samples D and E
0.02 0.04 0.06 0.08
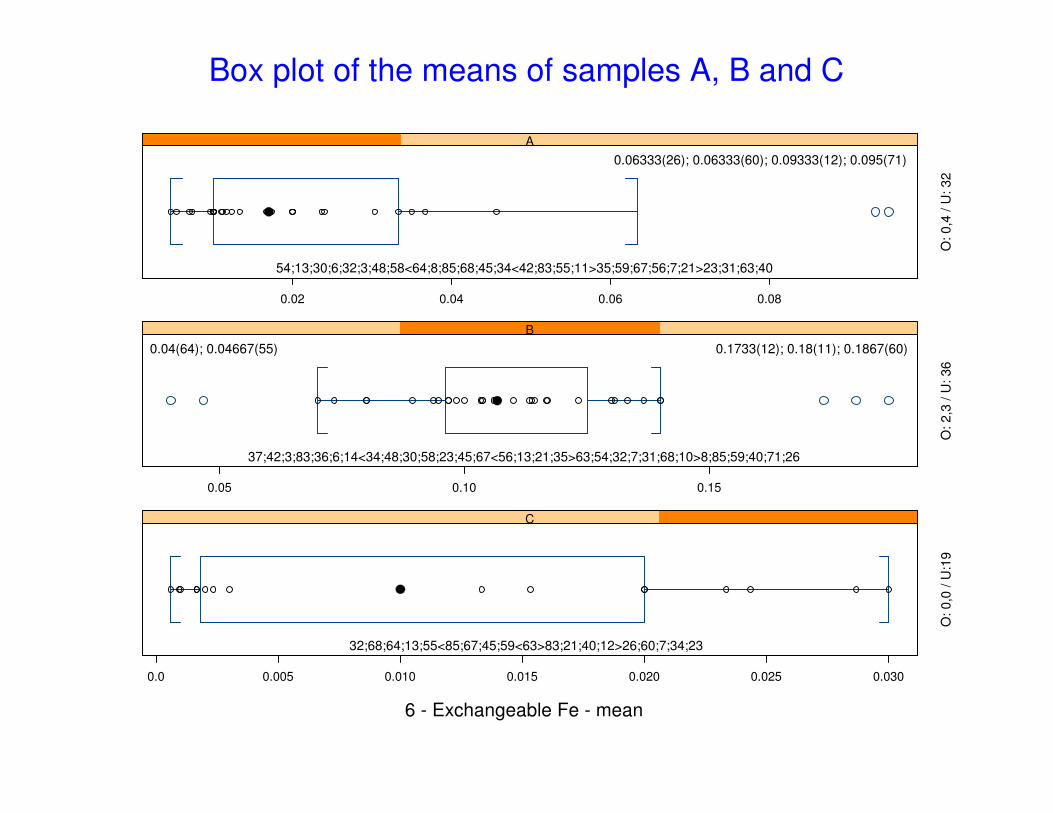
A
0.06333(26); 0.06333(60); 0.09333(12); 0.095(71)
54;13;30;6;32;3;48;58<64;8;85;68;45;34<42;83;55;11>35;59;67;56;7;21>23;31;63;40
O:
0,4
/ U
: 3
2
0.05 0.10 0.15
B
0.04(64); 0.04667(55) 0.1733(12); 0.18(11); 0.1867(60)
37;42;3;83;36;6;14<34;48;30;58;23;45;67<56;13;21;35>63;54;32;7;31;68;10>8;85;59;40;71;26
O:
2,3
/ U
: 3
6
0.0 0.005 0.010 0.015 0.020 0.025 0.030
C
32;68;64;13;55<85;67;45;59<63>83;21;40;12>26;60;7;34;23
O:
0,0
/ U
:19
6 - Exchangeable Fe - mean
Box plot of the means of samples A, B and C
0.0 0.01 0.02 0.03 0.04
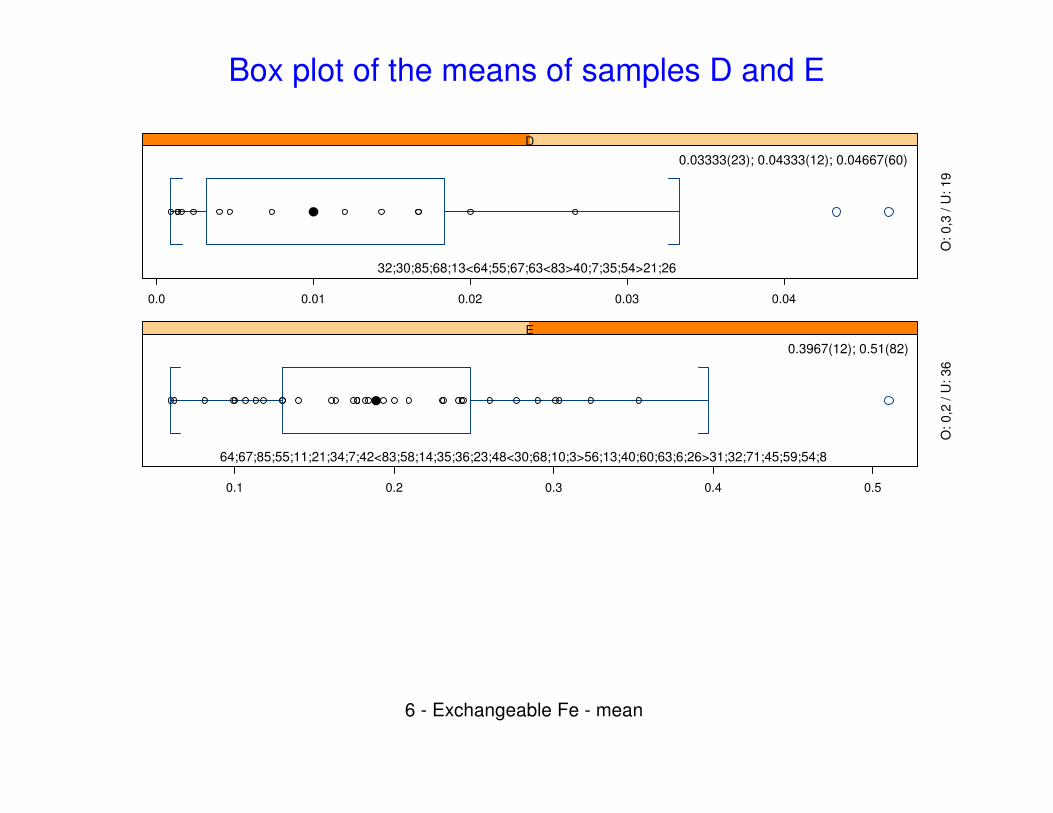
D
0.03333(23); 0.04333(12); 0.04667(60)
32;30;85;68;13<64;55;67;63<83>40;7;35;54>21;26
O:
0,3
/ U
: 1
9
0.1 0.2 0.3 0.4 0.5
E
0.3967(12); 0.51(82)
64;67;85;55;11;21;34;7;42<83;58;14;35;36;23;48<30;68;10;3>56;13;40;60;63;6;26>31;32;71;45;59;54;8
O:
0,2
/ U
: 3
6
6 - Exchangeable Fe - mean
Box plot of the means of samples D and E
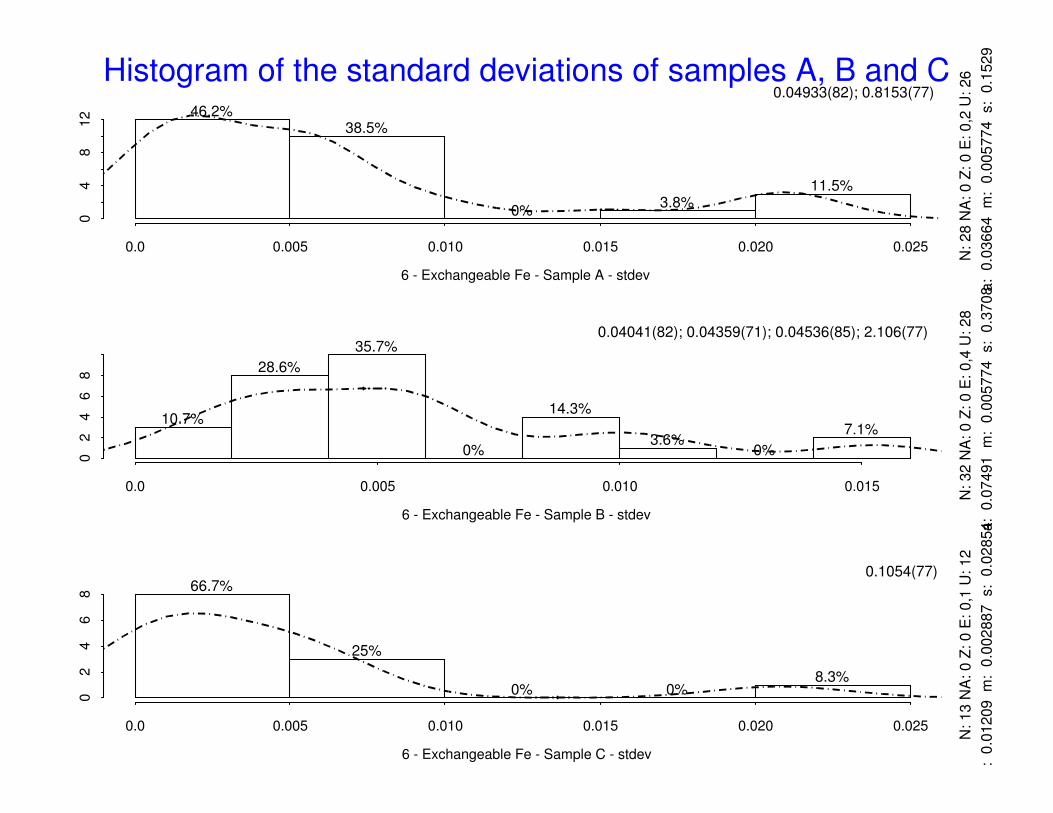
Histogram of the standard deviations of samples A, B and C
0.0 0.005 0.010 0.015 0.020 0.025
04
812
6 - Exchangeable Fe - Sample A - stdev
N: 28 N
A: 0 Z
: 0 E
: 0,2
U: 26
a: 0
.03664 m
: 0
.005774 s: 0
.1529
46.2%38.5%
0%3.8%
11.5%
0.04933(82); 0.8153(77)
0.0 0.005 0.010 0.015
02
46
8
6 - Exchangeable Fe - Sample B - stdev
N: 32 N
A: 0 Z
: 0 E
: 0,4
U: 28
a: 0
.07491 m
: 0
.005774 s: 0
.3708
10.7%
28.6%
35.7%
0%
14.3%
3.6%0%
7.1%
0.04041(82); 0.04359(71); 0.04536(85); 2.106(77)
0.0 0.005 0.010 0.015 0.020 0.025
02
46
8
6 - Exchangeable Fe - Sample C - stdev
N: 13 N
A: 0 Z
: 0 E
: 0,1
U: 12
a: 0
.01209 m
: 0
.002887 s: 0
.02854
66.7%
25%
0% 0%8.3%
0.1054(77)
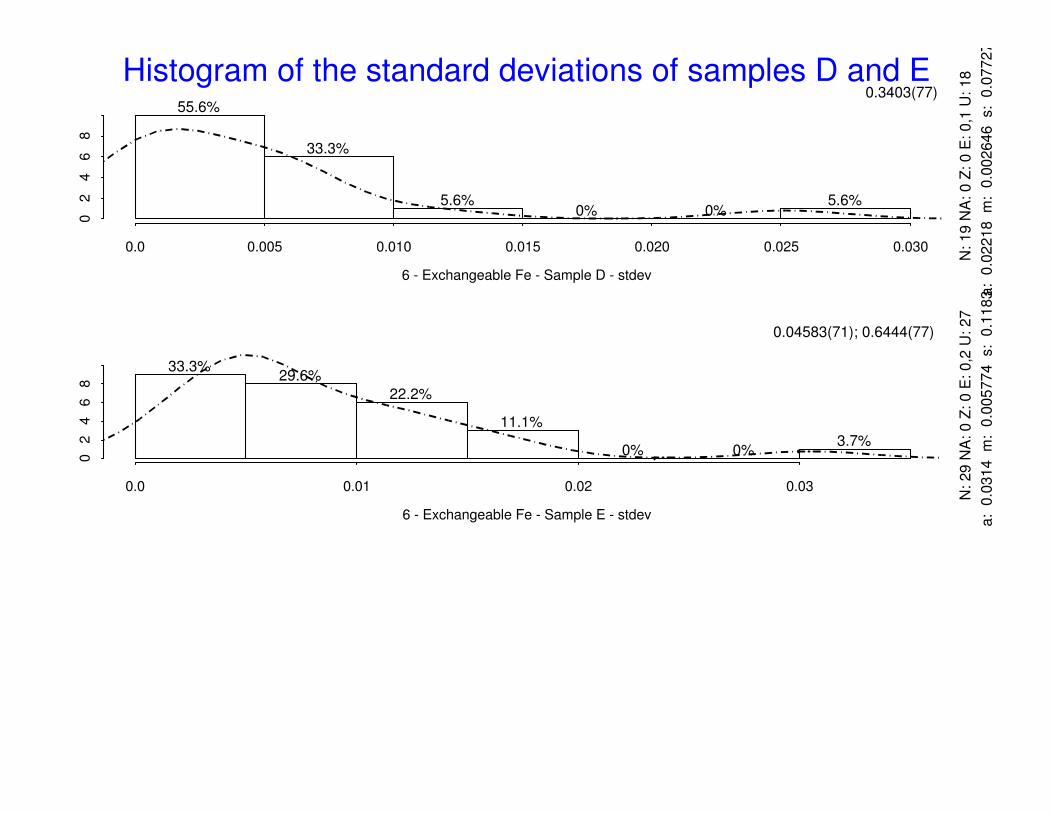
Histogram of the standard deviations of samples D and E
0.0 0.005 0.010 0.015 0.020 0.025 0.030
02
46
8
6 - Exchangeable Fe - Sample D - stdev
N: 19 N
A: 0 Z
: 0 E
: 0,1
U: 18
a: 0
.02218 m
: 0
.002646 s: 0
.07727
55.6%
33.3%
5.6%0% 0%
5.6%
0.3403(77)
0.0 0.01 0.02 0.03
02
46
8
6 - Exchangeable Fe - Sample E - stdev
N: 29 N
A: 0 Z
: 0 E
: 0,2
U: 27
a: 0
.0314 m
: 0
.005774 s: 0
.1183
33.3%29.6%
22.2%
11.1%
0% 0%3.7%
0.04583(71); 0.6444(77)
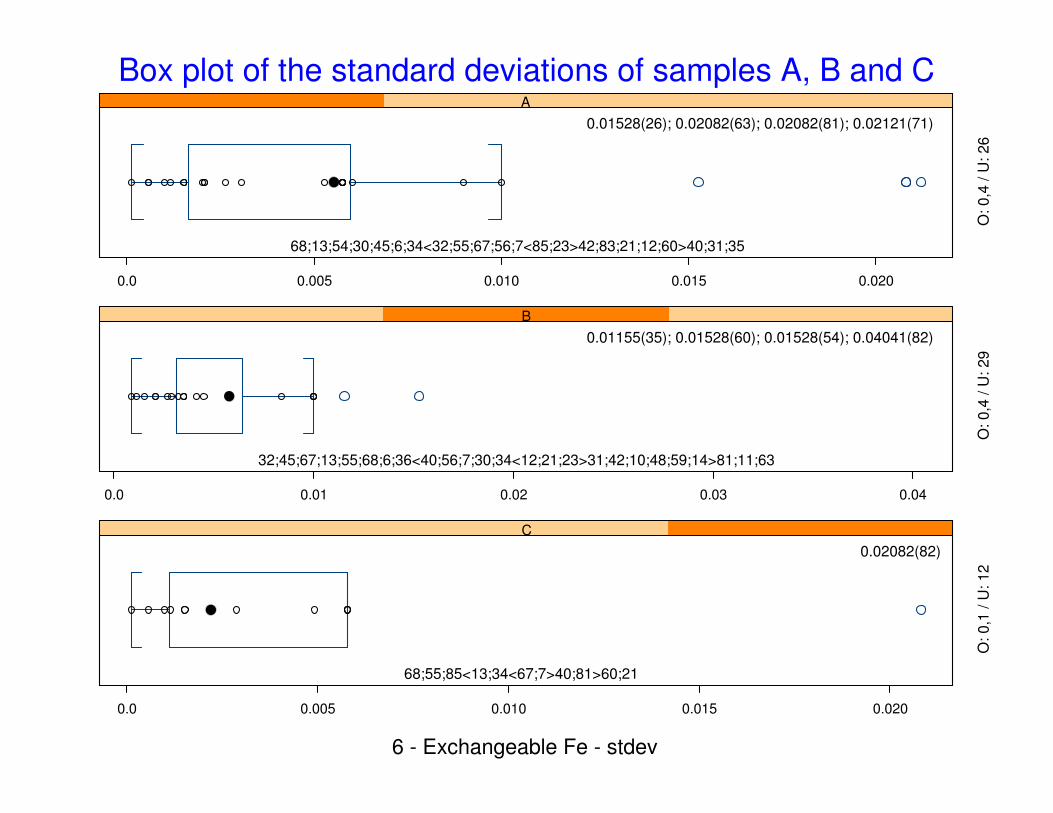
Box plot of the standard deviations of samples A, B and C
0.0 0.005 0.010 0.015 0.020
A
0.01528(26); 0.02082(63); 0.02082(81); 0.02121(71)
68;13;54;30;45;6;34<32;55;67;56;7<85;23>42;83;21;12;60>40;31;35
O: 0,4
/ U
: 26
0.0 0.01 0.02 0.03 0.04
B
0.01155(35); 0.01528(60); 0.01528(54); 0.04041(82)
32;45;67;13;55;68;6;36<40;56;7;30;34<12;21;23>31;42;10;48;59;14>81;11;63
O: 0,4
/ U
: 29
0.0 0.005 0.010 0.015 0.020
C
0.02082(82)
68;55;85<13;34<67;7>40;81>60;21
O: 0,1
/ U
: 12
6 - Exchangeable Fe - stdev
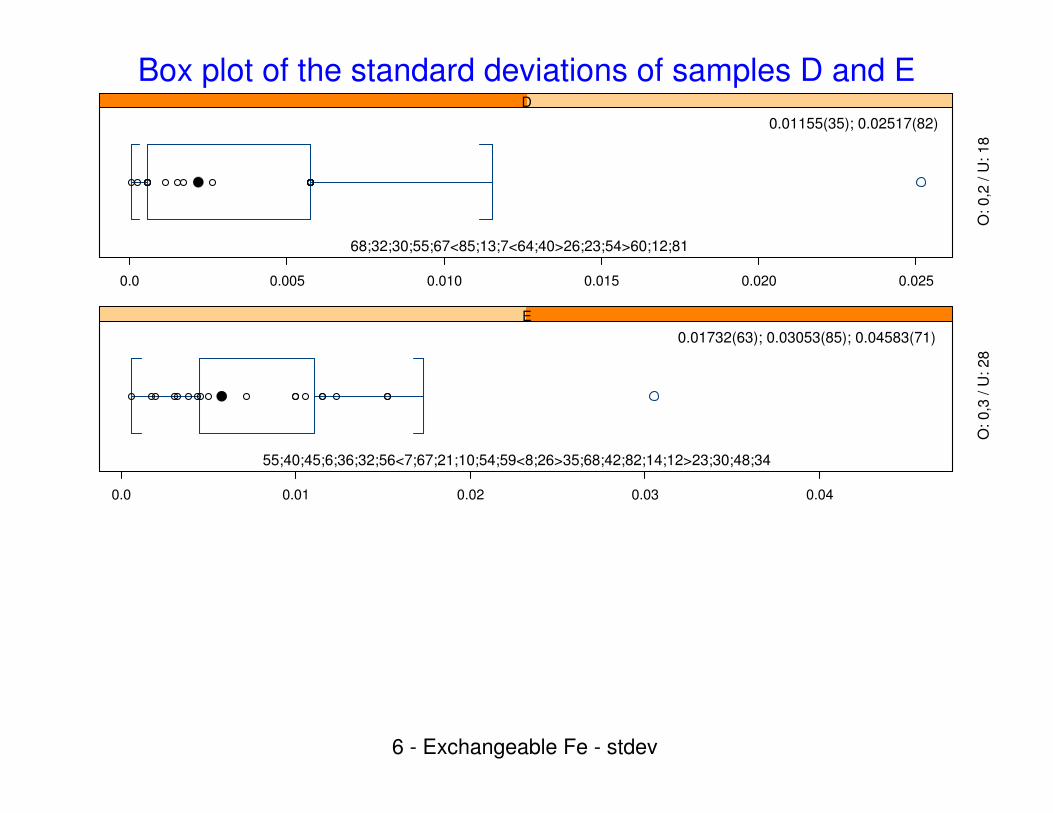
Box plot of the standard deviations of samples D and E
0.0 0.005 0.010 0.015 0.020 0.025
D
0.01155(35); 0.02517(82)
68;32;30;55;67<85;13;7<64;40>26;23;54>60;12;81
O: 0,2
/ U
: 18
0.0 0.01 0.02 0.03 0.04
E
0.01732(63); 0.03053(85); 0.04583(71)
55;40;45;6;36;32;56<7;67;21;10;54;59<8;26>35;68;42;82;14;12>23;30;48;34
O: 0,3
/ U
: 28
6 - Exchangeable Fe - stdev
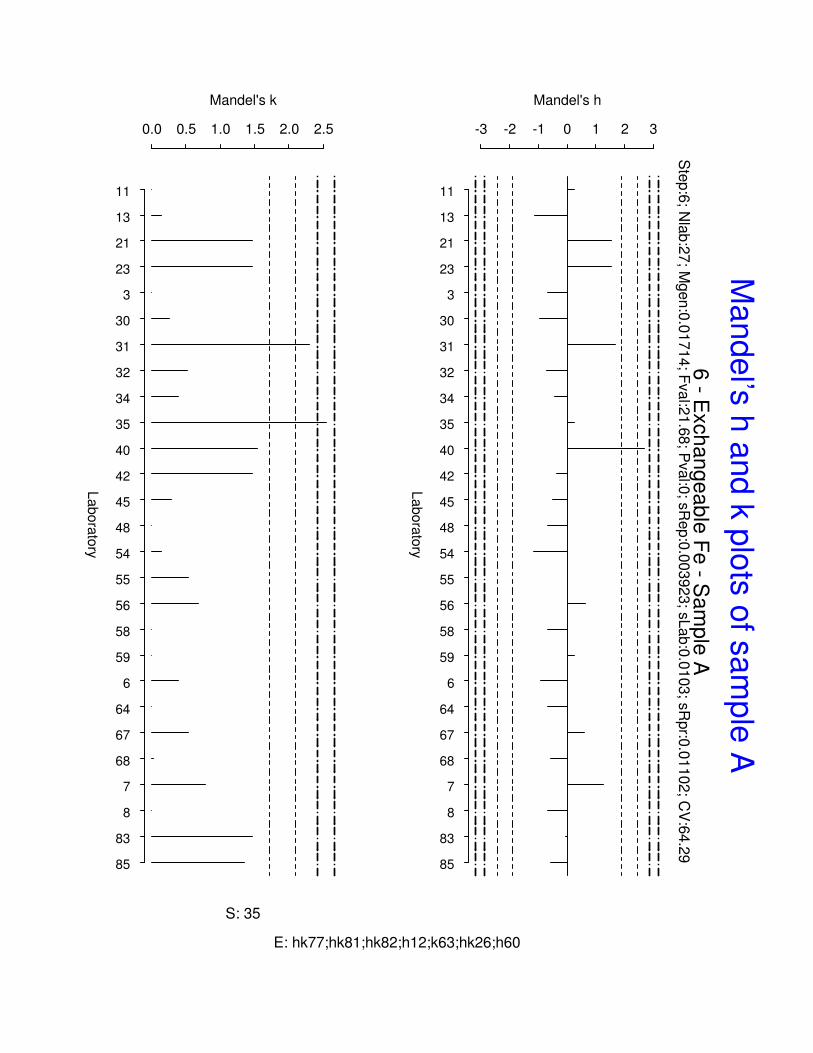
Labora
tory
Mandel's h
-3 -2 -1 0 1 2 3
11
13
21
23
3
30
31
32
34
35
40
42
45
48
54
55
56
58
59
6
64
67
68
7
8
83
85
6 - E
xch
an
ge
ab
le F
e - S
am
ple
AS
tep:6
; Nla
b:2
7; M
gen:0
.01714; F
val:2
1.6
8; P
val:0
; sR
ep:0
.003923; s
Lab:0
.0103; s
Rpr:0
.01102; C
V:6
4.2
9
Labora
tory
Mandel's k
0.0 0.5 1.0 1.5 2.0 2.5
11
13
21
23
3
30
31
32
34
35
40
42
45
48
54
55
56
58
59
6
64
67
68
7
8
83
85
S: 35
E: hk77;hk81;hk82;h12;k63;hk26;h60
Mande
l’s h
and k
plo
ts o
f sam
ple
A
Labora
tory
Mandel's h
-2 0 2
10
11
12
13
14
21
23
26
3
30
31
32
34
35
36
37
40
42
45
48
54
55
56
58
59
6
60
63
64
67
68
7
8
83
6 - E
xch
an
ge
ab
le F
e - S
am
ple
BS
tep:3
; Nla
b:3
4; M
gen:0
.1084; F
val:8
1.5
1; P
val:0
; sR
ep:0
.006059; s
Lab:0
.03139; s
Rpr:0
.03197; C
V:2
9.5
Labora
tory
Mandel's k
0.0 1.0 2.0
10
11
12
13
14
21
23
26
3
30
31
32
34
35
36
37
40
42
45
48
54
55
56
58
59
6
60
63
64
67
68
7
8
83
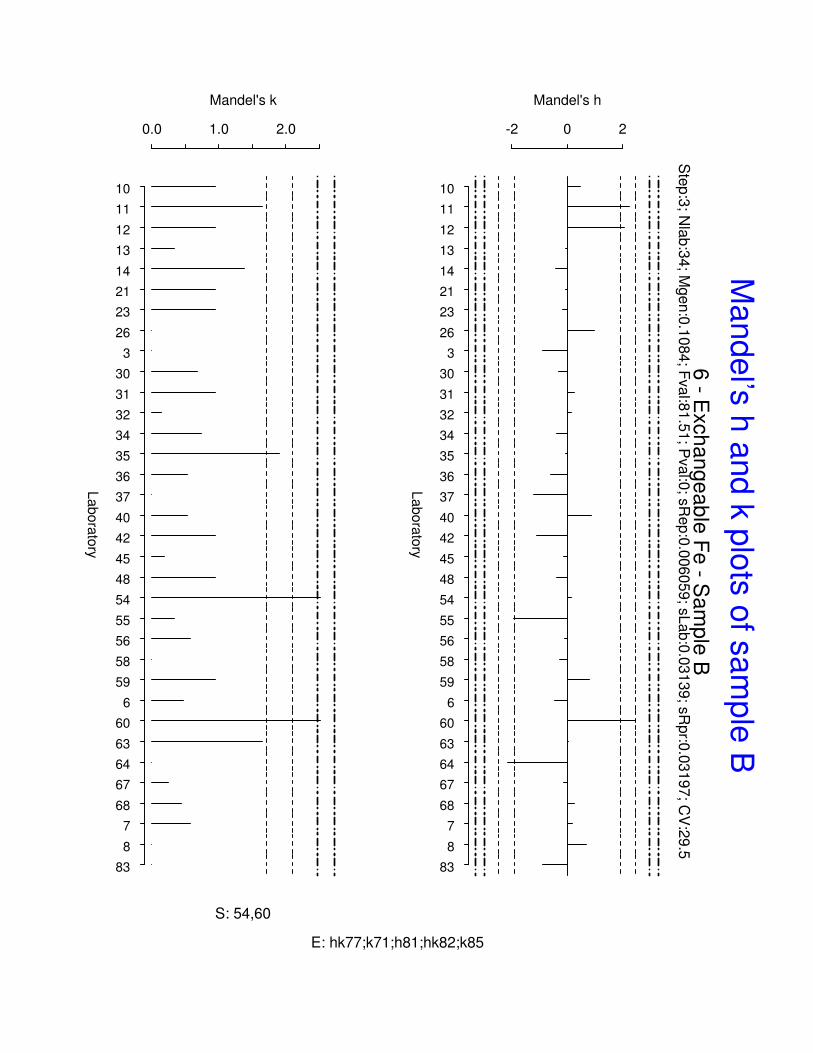
S: 54,60
E: hk77;k71;h81;hk82;k85
Mande
l’s h
and k
plo
ts o
f sam
ple
B
Laboratory
Mandel's
h
-3-2
-10
12
3
12
13
21
23
26
34
40
45
55
60
64
67
68 7
83
85
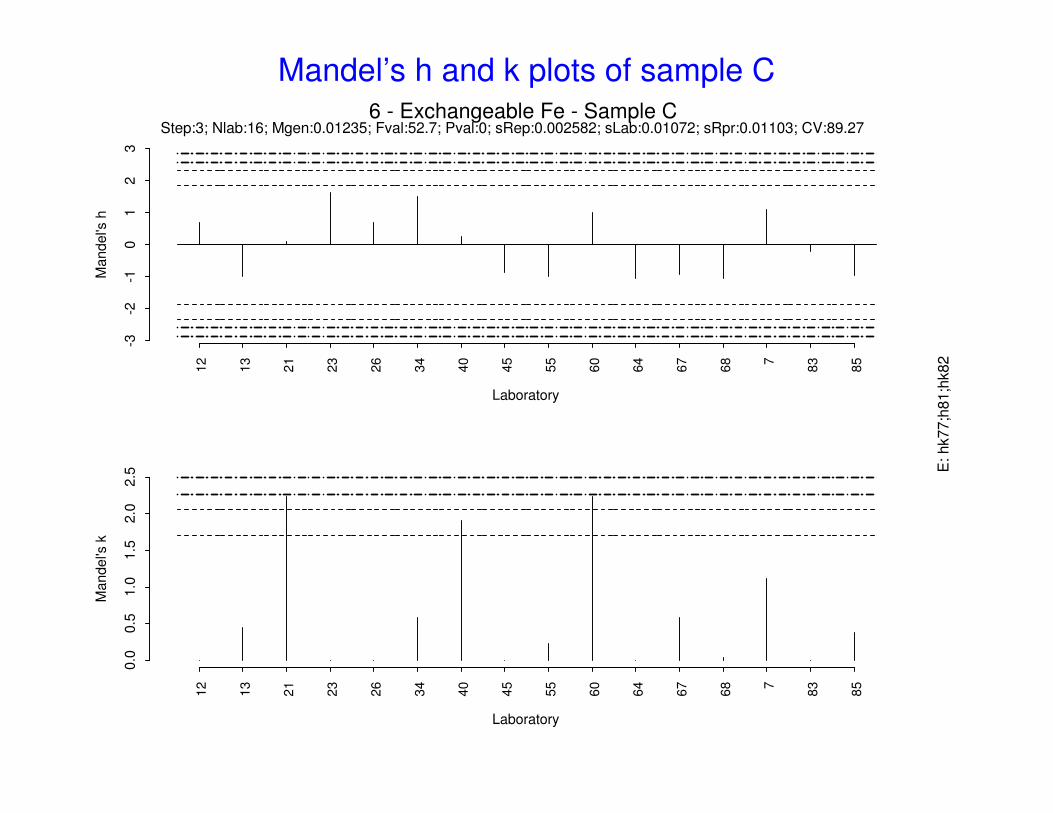
6 - Exchangeable Fe - Sample CStep:3; Nlab:16; Mgen:0.01235; Fval:52.7; Pval:0; sRep:0.002582; sLab:0.01072; sRpr:0.01103; CV:89.27
Laboratory
Mandel's
k
0.0
0.5
1.0
1.5
2.0
2.5
12
13
21
23
26
34
40
45
55
60
64
67
68 7
83
85
E: hk77;h
81;h
k82
Mandel’s h and k plots of sample C
Laboratory
Mandel's
h
-3-2
-10
12
3
12
13
21
23
26
30
32
40
54
55
60
63
64
67
68 7
83
85
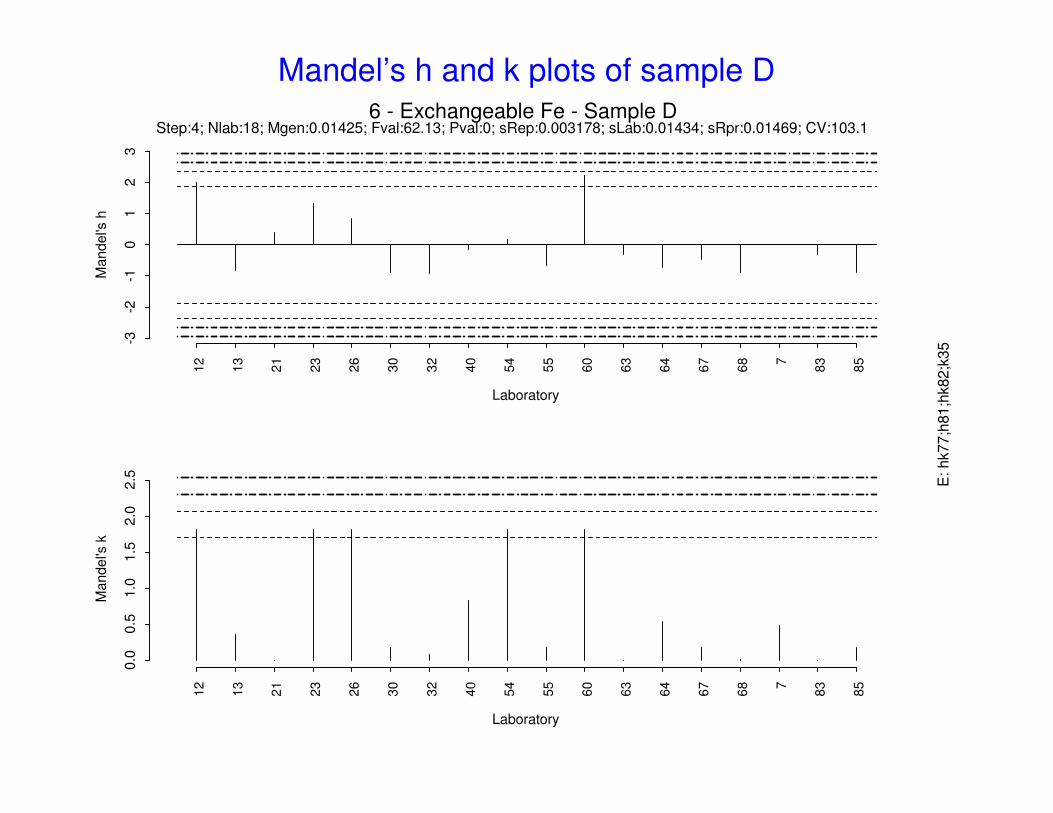
6 - Exchangeable Fe - Sample DStep:4; Nlab:18; Mgen:0.01425; Fval:62.13; Pval:0; sRep:0.003178; sLab:0.01434; sRpr:0.01469; CV:103.1
Laboratory
Mandel's
k
0.0
0.5
1.0
1.5
2.0
2.5
12
13
21
23
26
30
32
40
54
55
60
63
64
67
68 7
83
85
E: hk77;h
81;h
k82;k
35
Mandel’s h and k plots of sample D
Laboratory
Mandel's
h
-20
2
10
11
12
13
14
21
23
26 3
30
31
32
34
35
36
40
42
45
48
54
55
56
58
59 6
60
63
64
67
68 7 8
82
83
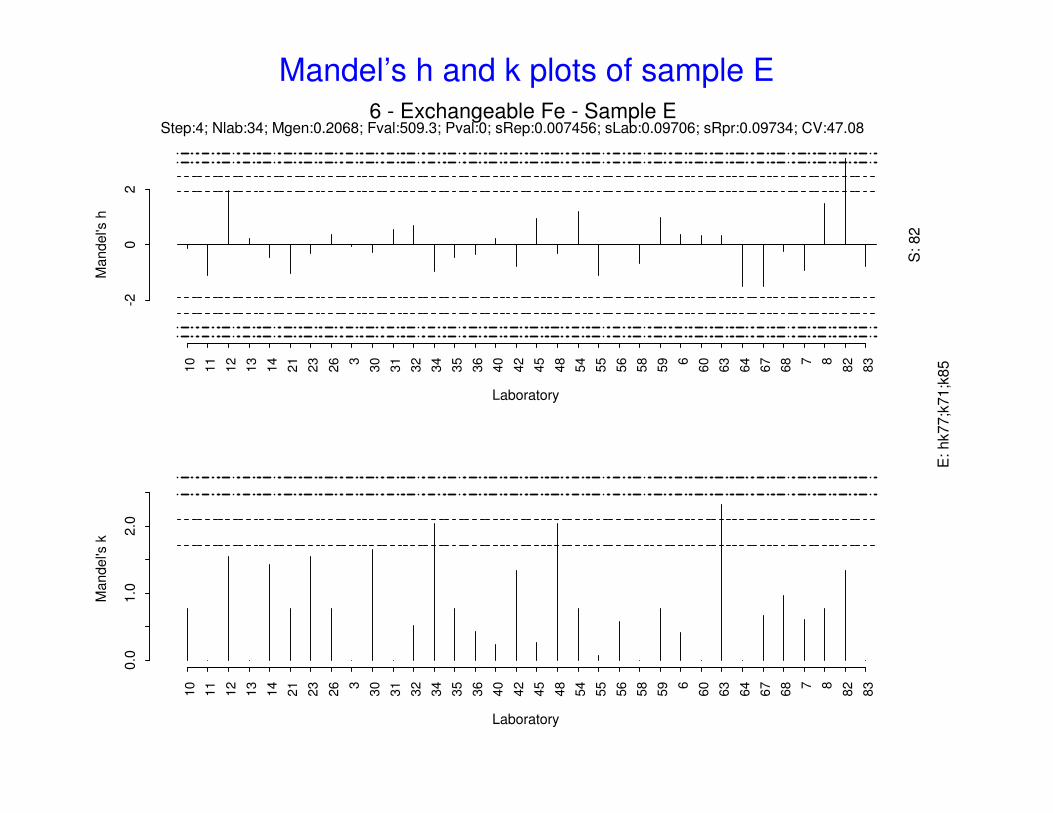
6 - Exchangeable Fe - Sample EStep:4; Nlab:34; Mgen:0.2068; Fval:509.3; Pval:0; sRep:0.007456; sLab:0.09706; sRpr:0.09734; CV:47.08
S: 82
Laboratory
Mandel's
k
0.0
1.0
2.0
10
11
12
13
14
21
23
26 3
30
31
32
34
35
36
40
42
45
48
54
55
56
58
59 6
60
63
64
67
68 7 8
82
83
E: hk77;k
71;k
85
Mandel’s h and k plots of sample E
Exchangeable Mn
644255853723
348563640671368106371
73034
63121265883123214
86045545981821177
0.02 0.04 0.06 0.08
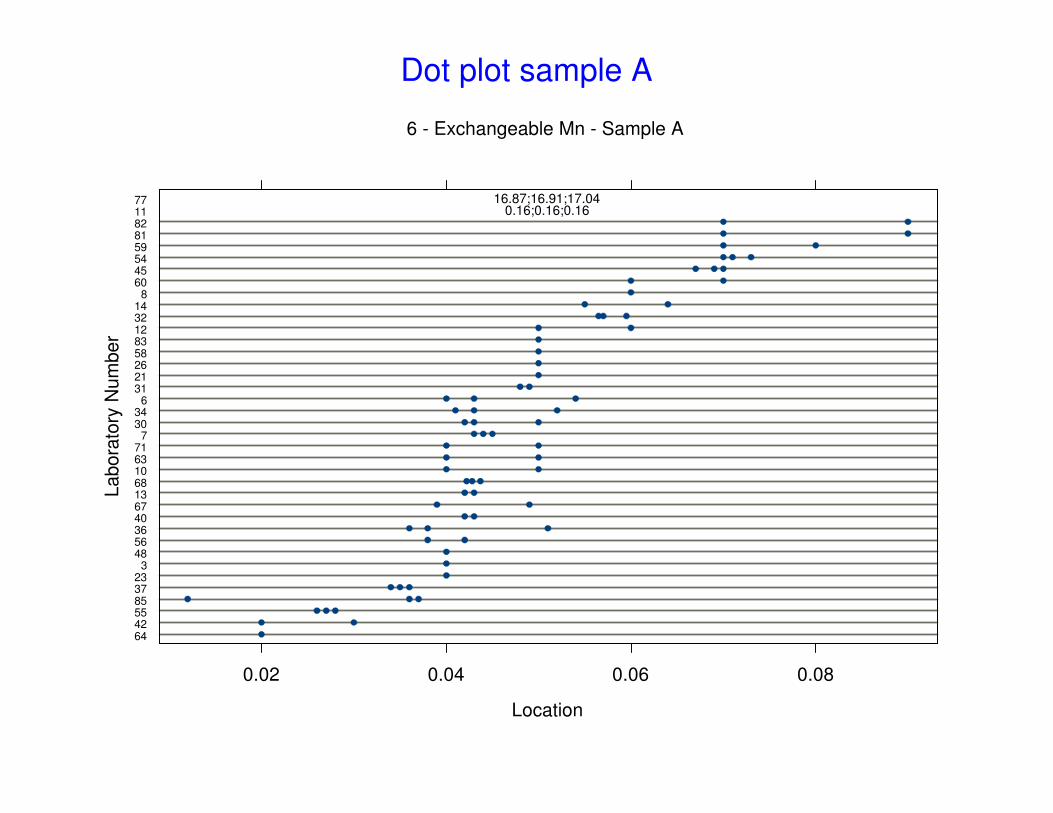
0.16;0.16;0.1616.87;16.91;17.04
Location
Labora
tory
Num
ber
6 - Exchangeable Mn - Sample A
Dot plot sample A
6455108342378568216334365667
726
34858
8133045
640542331321159601282148177
0.01 0.02 0.03 0.04 0.05 0.06
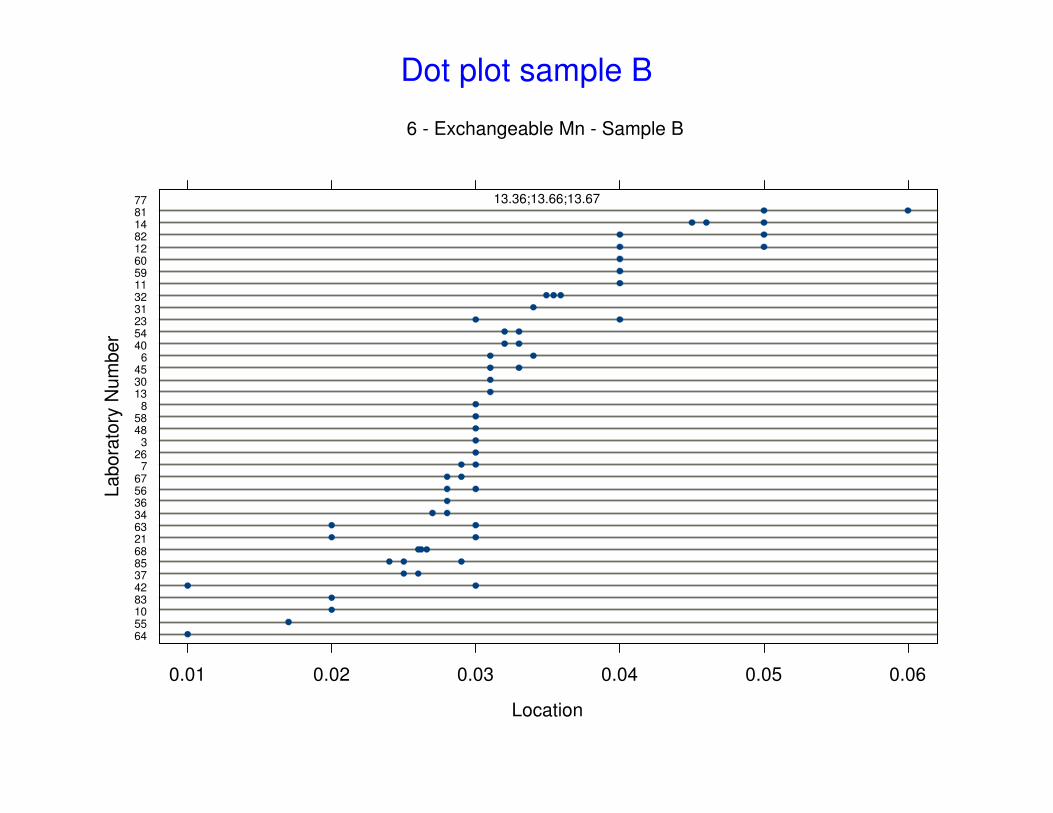
13.36;13.66;13.67
Location
Labora
tory
Num
ber
6 - Exchangeable Mn - Sample B
Dot plot sample B
64
85
68
13
30
31
40
55
54
6
60
67
7
32
34
23
63
82
45
81
11
12
77
0.0 0.01 0.02 0.03 0.04
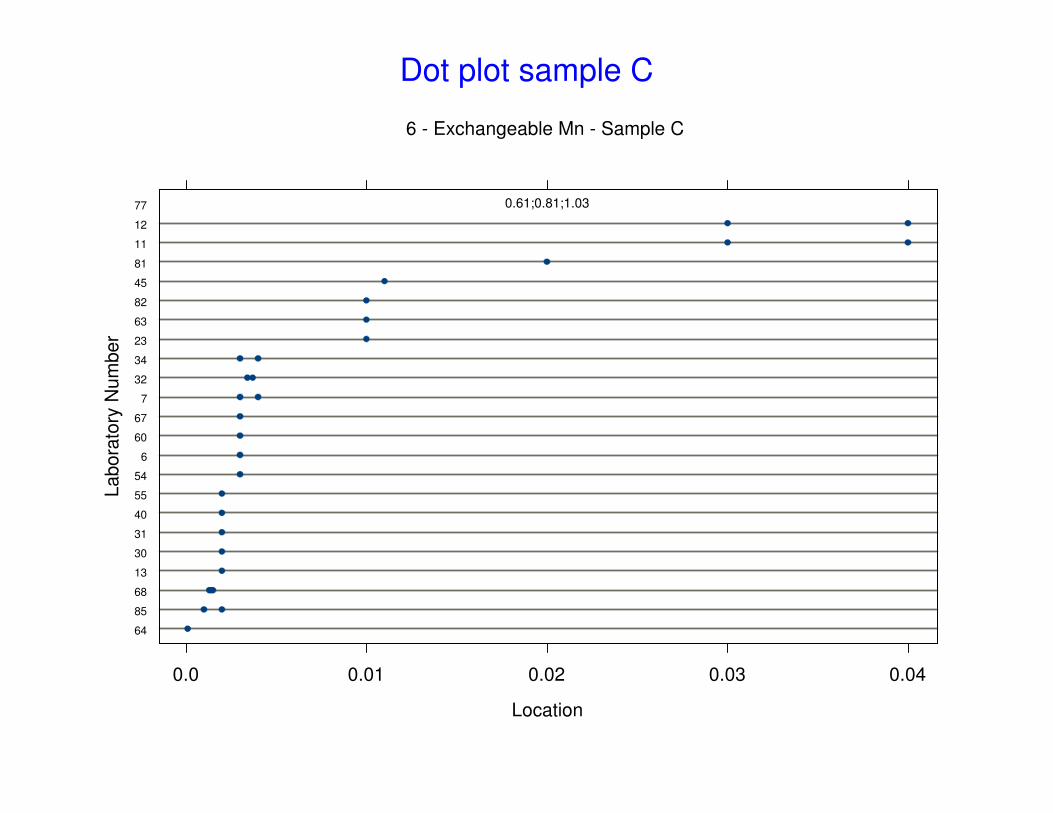
0.61;0.81;1.03
Location
Labora
tory
Num
ber
6 - Exchangeable Mn - Sample C
Dot plot sample C
8464558510234271343768
3633658213856
76730831340
6318132484526
85954601282111477
0.05 0.10 0.15 0.20 0.25 0.30
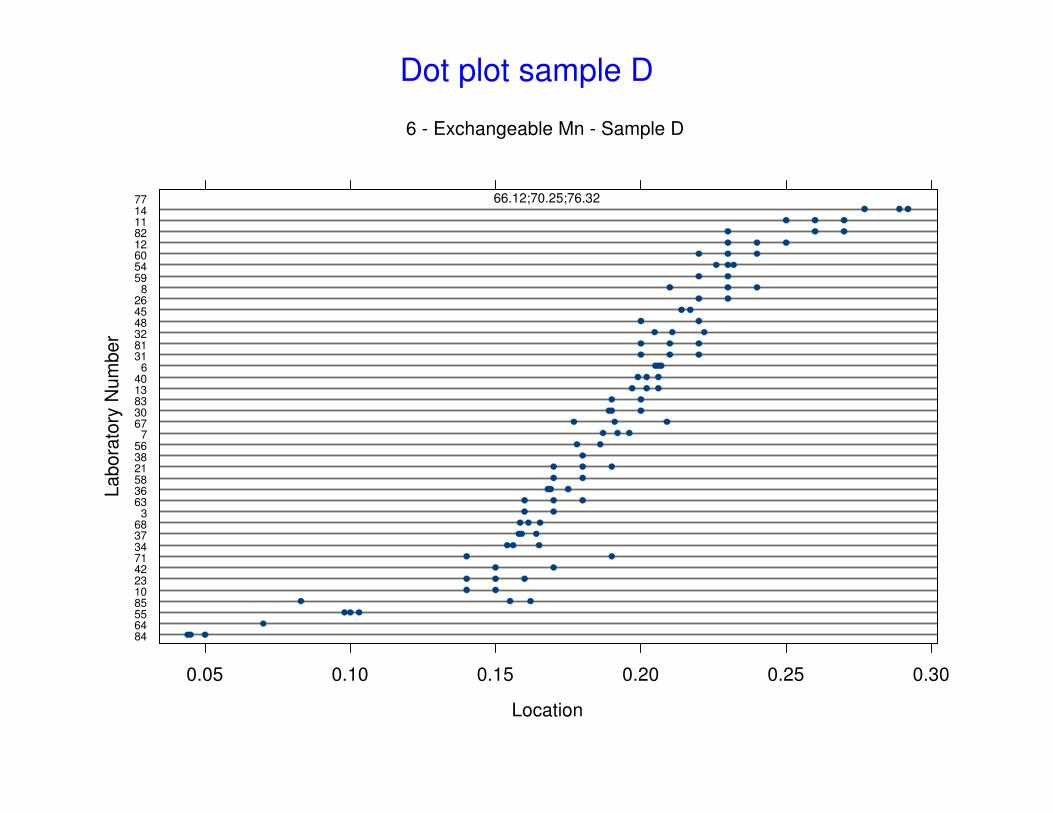
66.12;70.25;76.32
Location
Labora
tory
Num
ber
6 - Exchangeable Mn - Sample D
Dot plot sample D
112164348542
76855671058837156
34860632345361326543031
64059
83212821477
0.02 0.04 0.06 0.08
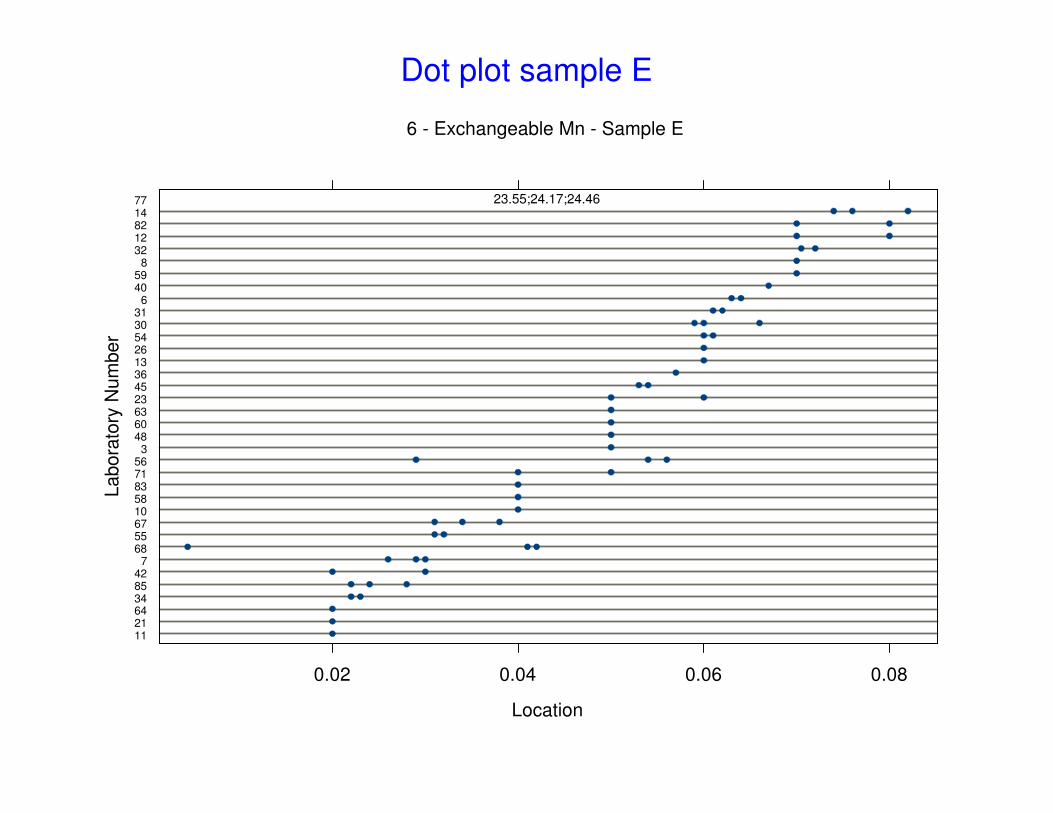
23.55;24.17;24.46
Location
Labora
tory
Num
ber
6 - Exchangeable Mn - Sample E
Dot plot sample E
0.02 0.04 0.06 0.08
05
10
15
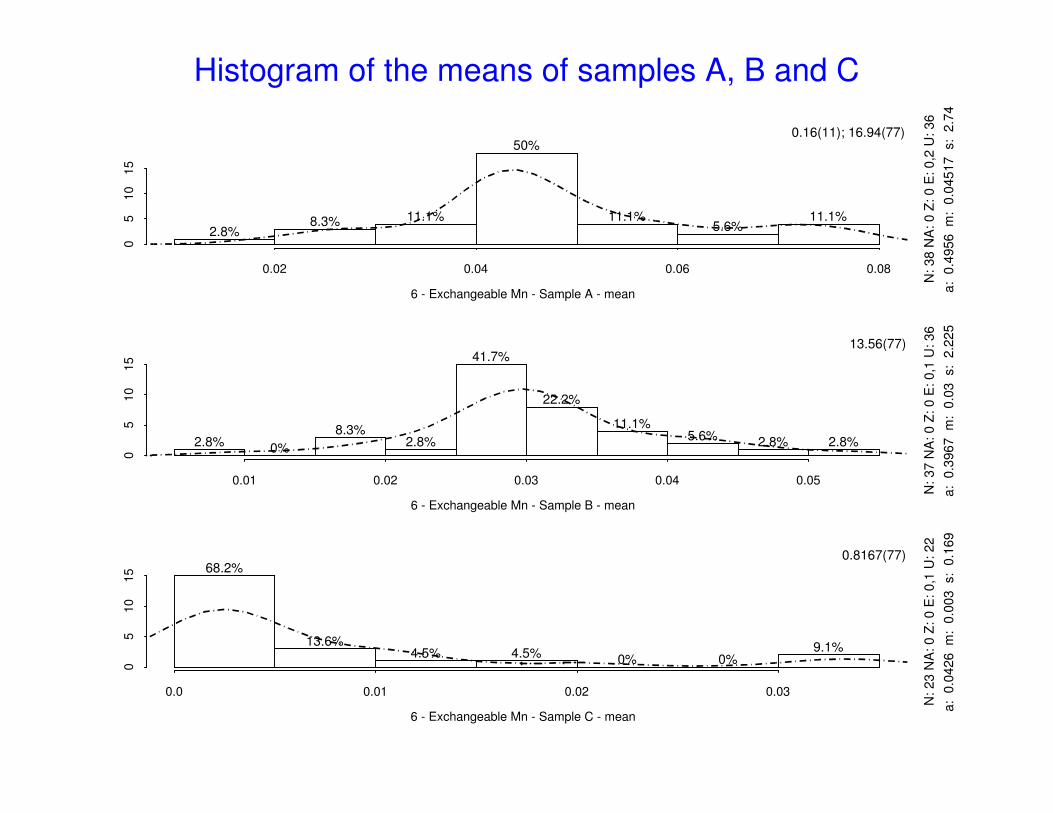
6 - Exchangeable Mn - Sample A - mean
N:
38
NA
: 0
Z:
0 E
: 0
,2 U
: 3
6
a:
0.4
95
6
m:
0.0
45
17
s:
2.7
4
2.8%8.3% 11.1%
50%
11.1%5.6%
11.1%
0.16(11); 16.94(77)
0.01 0.02 0.03 0.04 0.05
05
10
15
6 - Exchangeable Mn - Sample B - mean
N:
37
NA
: 0
Z:
0 E
: 0
,1 U
: 3
6
a:
0.3
96
7
m:
0.0
3
s:
2.2
25
2.8% 0%
8.3%2.8%
41.7%
22.2%
11.1%5.6% 2.8% 2.8%
13.56(77)
0.0 0.01 0.02 0.03
05
10
15
6 - Exchangeable Mn - Sample C - mean
N:
23
NA
: 0
Z:
0 E
: 0
,1 U
: 2
2
a:
0.0
42
6
m:
0.0
03
s:
0.1
69
68.2%
13.6%4.5% 4.5% 0% 0%
9.1%
0.8167(77)
Histogram of the means of samples A, B and C
0.0 0.05 0.10 0.15 0.20 0.25 0.30
05
10
15
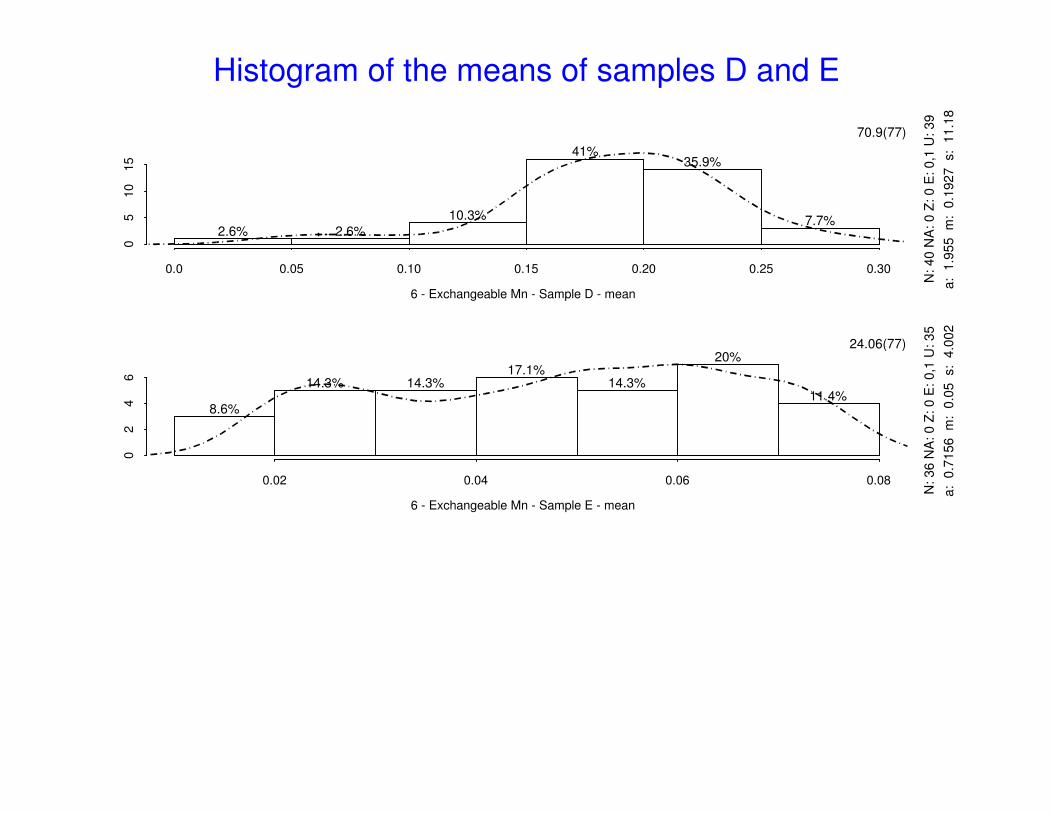
6 - Exchangeable Mn - Sample D - mean
N:
40
NA
: 0
Z:
0 E
: 0
,1 U
: 3
9
a:
1.9
55
m
: 0
.19
27
s:
11
.18
2.6% 2.6%
10.3%
41%35.9%
7.7%
70.9(77)
0.02 0.04 0.06 0.08
02
46
6 - Exchangeable Mn - Sample E - mean
N:
36
NA
: 0
Z:
0 E
: 0
,1 U
: 3
5
a:
0.7
15
6
m:
0.0
5
s:
4.0
02
8.6%
14.3% 14.3%17.1%
14.3%
20%
11.4%
24.06(77)
Histogram of the means of samples D and E
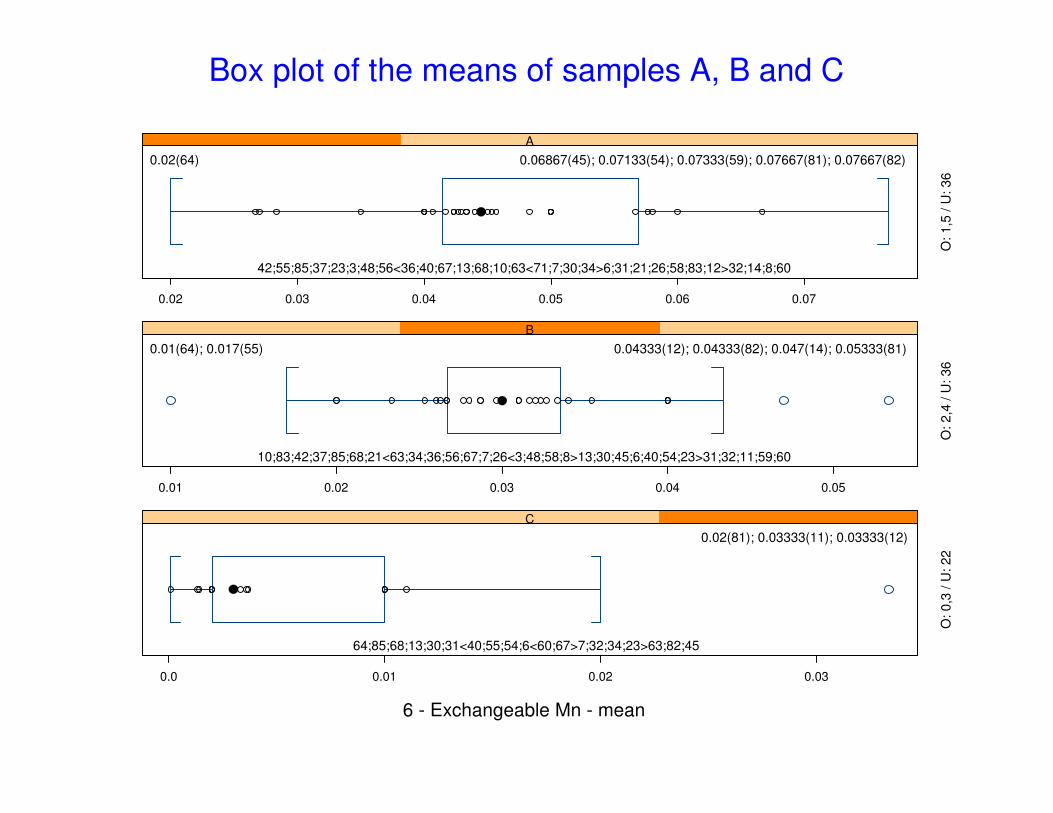
0.02 0.03 0.04 0.05 0.06 0.07
A
0.02(64) 0.06867(45); 0.07133(54); 0.07333(59); 0.07667(81); 0.07667(82)
42;55;85;37;23;3;48;56<36;40;67;13;68;10;63<71;7;30;34>6;31;21;26;58;83;12>32;14;8;60
O:
1,5
/ U
: 3
6
0.01 0.02 0.03 0.04 0.05
B
0.01(64); 0.017(55) 0.04333(12); 0.04333(82); 0.047(14); 0.05333(81)
10;83;42;37;85;68;21<63;34;36;56;67;7;26<3;48;58;8>13;30;45;6;40;54;23>31;32;11;59;60
O:
2,4
/ U
: 3
6
0.0 0.01 0.02 0.03
C
0.02(81); 0.03333(11); 0.03333(12)
64;85;68;13;30;31<40;55;54;6<60;67>7;32;34;23>63;82;45
O:
0,3
/ U
: 2
2
6 - Exchangeable Mn - mean
Box plot of the means of samples A, B and C
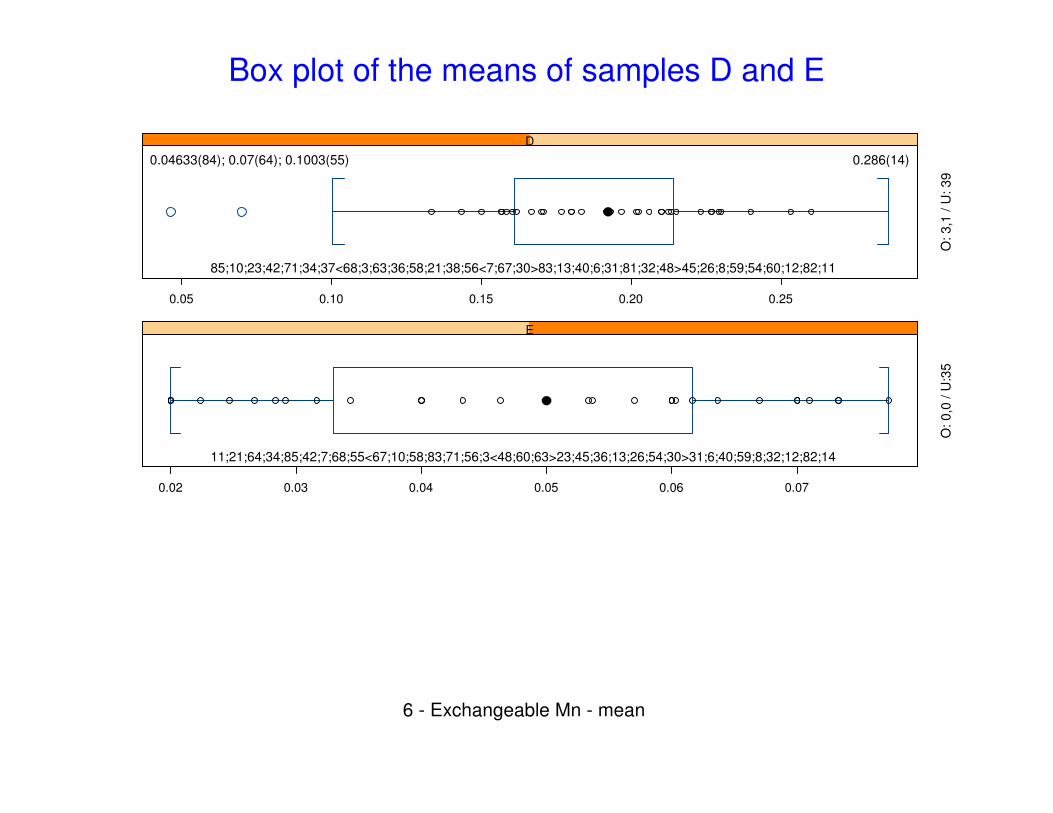
0.05 0.10 0.15 0.20 0.25
D
0.04633(84); 0.07(64); 0.1003(55) 0.286(14)
85;10;23;42;71;34;37<68;3;63;36;58;21;38;56<7;67;30>83;13;40;6;31;81;32;48>45;26;8;59;54;60;12;82;11
O:
3,1
/ U
: 3
9
0.02 0.03 0.04 0.05 0.06 0.07
E
11;21;64;34;85;42;7;68;55<67;10;58;83;71;56;3<48;60;63>23;45;36;13;26;54;30>31;6;40;59;8;32;12;82;14
O:
0,0
/ U
:35
6 - Exchangeable Mn - mean
Box plot of the means of samples D and E
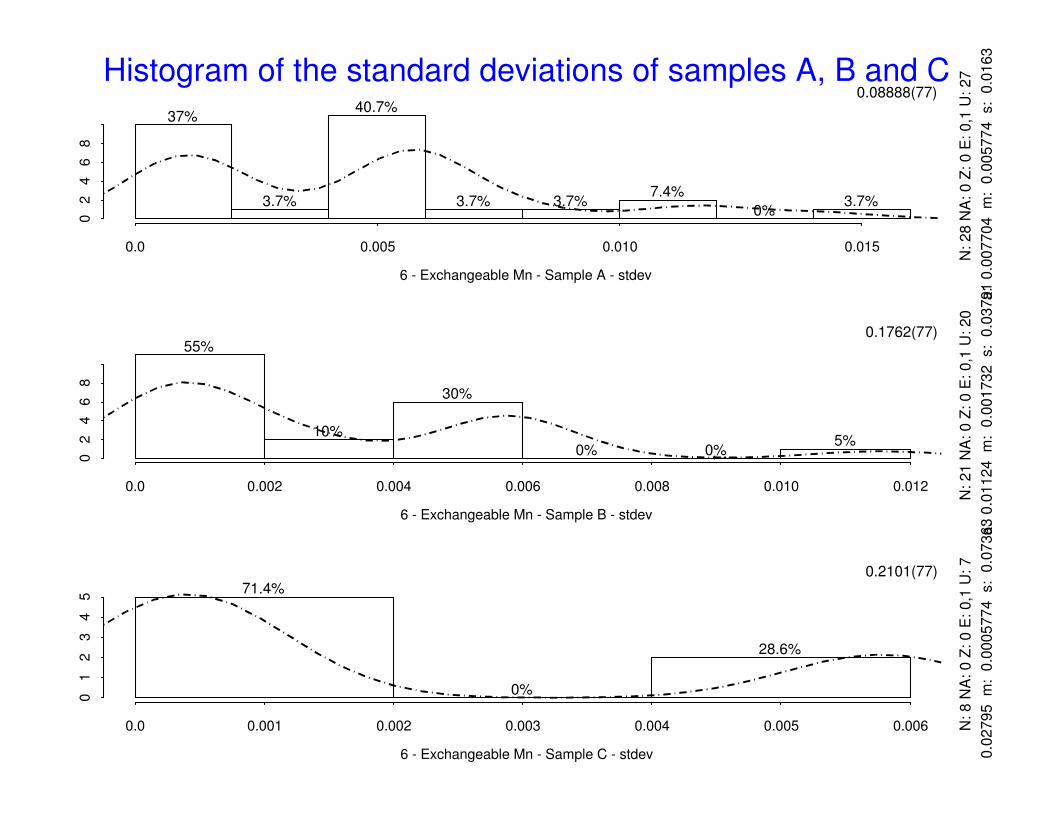
Histogram of the standard deviations of samples A, B and C
0.0 0.005 0.010 0.015
02
46
8
6 - Exchangeable Mn - Sample A - stdev
N: 28 N
A: 0 Z
: 0 E
: 0,1
U: 27
a: 0
.007704 m
: 0
.005774 s: 0
.01632
37%
3.7%
40.7%
3.7% 3.7%7.4%
0%3.7%
0.08888(77)
0.0 0.002 0.004 0.006 0.008 0.010 0.012
02
46
8
6 - Exchangeable Mn - Sample B - stdev
N: 21 N
A: 0 Z
: 0 E
: 0,1
U: 20
a: 0
.01124 m
: 0
.001732 s: 0
.03791
55%
10%
30%
0% 0%5%
0.1762(77)
0.0 0.001 0.002 0.003 0.004 0.005 0.006
01
23
45
6 - Exchangeable Mn - Sample C - stdev
N: 8 N
A: 0 Z
: 0 E
: 0,1
U: 7
a: 0
.02795 m
: 0
.0005774 s: 0
.07363
71.4%
0%
28.6%
0.2101(77)
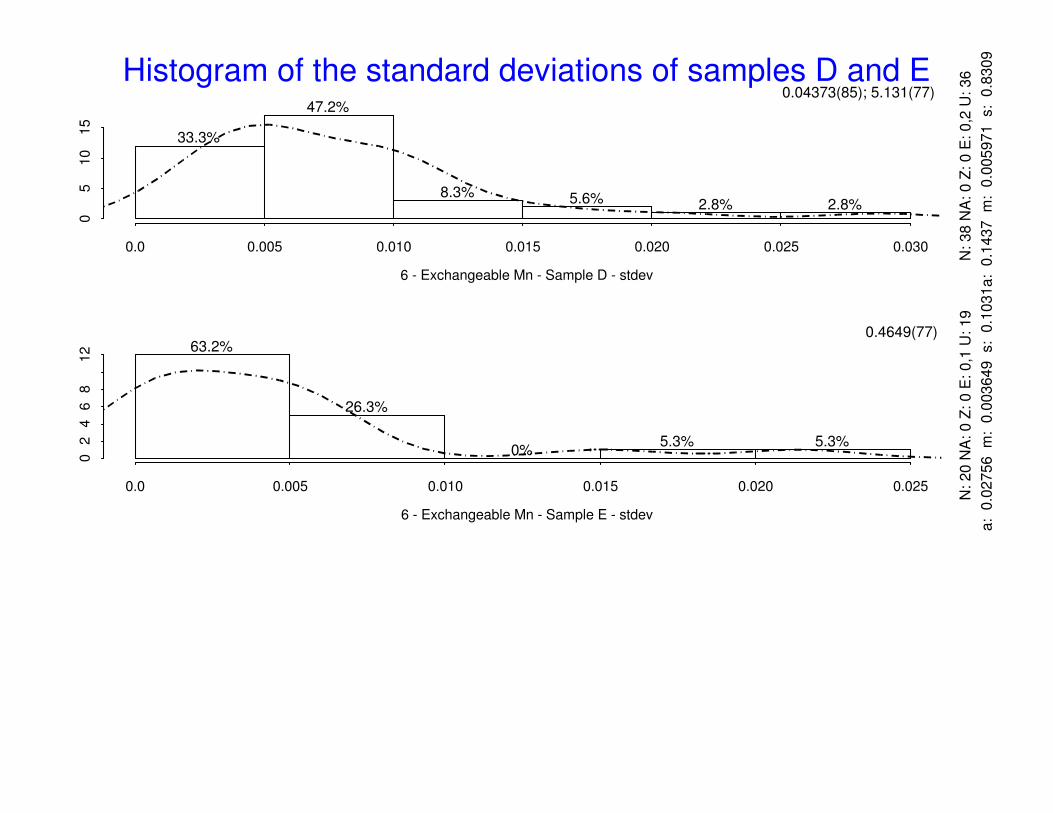
Histogram of the standard deviations of samples D and E
0.0 0.005 0.010 0.015 0.020 0.025 0.030
05
10
15
6 - Exchangeable Mn - Sample D - stdev
N: 38 N
A: 0 Z
: 0 E
: 0,2
U: 36
a: 0
.1437 m
: 0
.005971 s: 0
.8309
33.3%
47.2%
8.3% 5.6% 2.8% 2.8%
0.04373(85); 5.131(77)
0.0 0.005 0.010 0.015 0.020 0.025
02
46
812
6 - Exchangeable Mn - Sample E - stdev
N: 20 N
A: 0 Z
: 0 E
: 0,1
U: 19
a: 0
.02756 m
: 0
.003649 s: 0
.1031
63.2%
26.3%
0%5.3% 5.3%
0.4649(77)
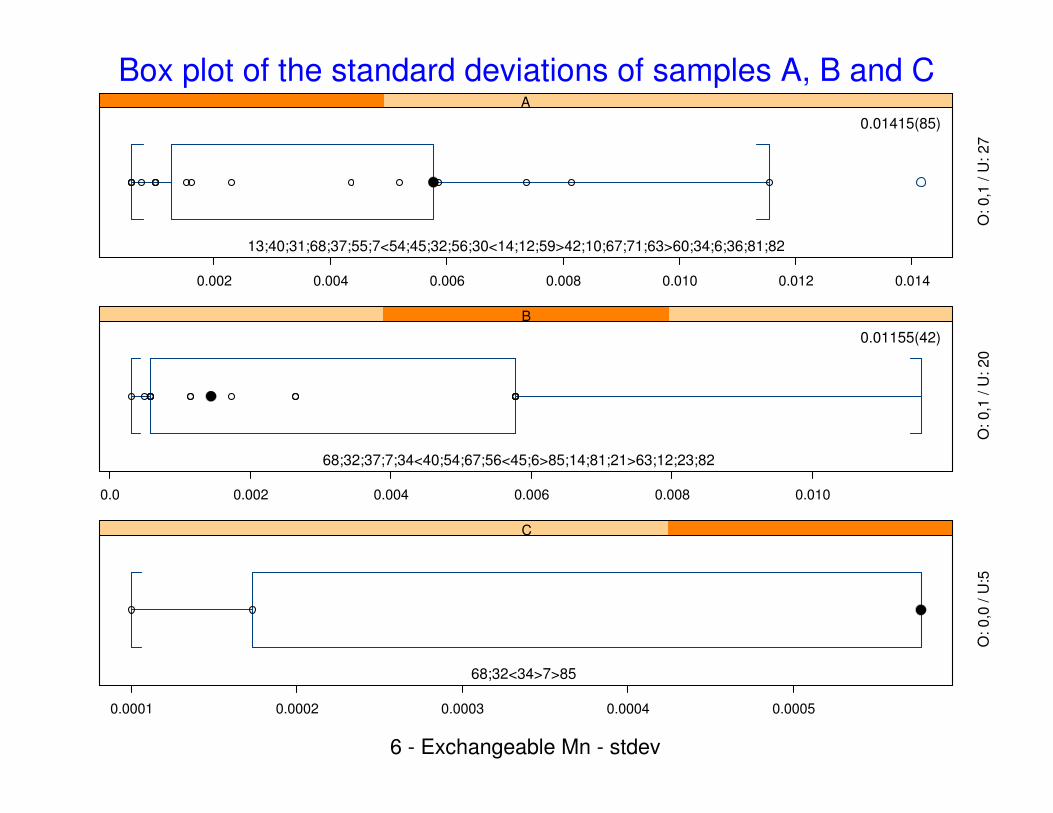
Box plot of the standard deviations of samples A, B and C
0.002 0.004 0.006 0.008 0.010 0.012 0.014
A
0.01415(85)
13;40;31;68;37;55;7<54;45;32;56;30<14;12;59>42;10;67;71;63>60;34;6;36;81;82
O: 0,1
/ U
: 27
0.0 0.002 0.004 0.006 0.008 0.010
B
0.01155(42)
68;32;37;7;34<40;54;67;56<45;6>85;14;81;21>63;12;23;82
O: 0,1
/ U
: 20
0.0001 0.0002 0.0003 0.0004 0.0005
C
68;32<34>7>85
O: 0,0
/ U
:5
6 - Exchangeable Mn - stdev
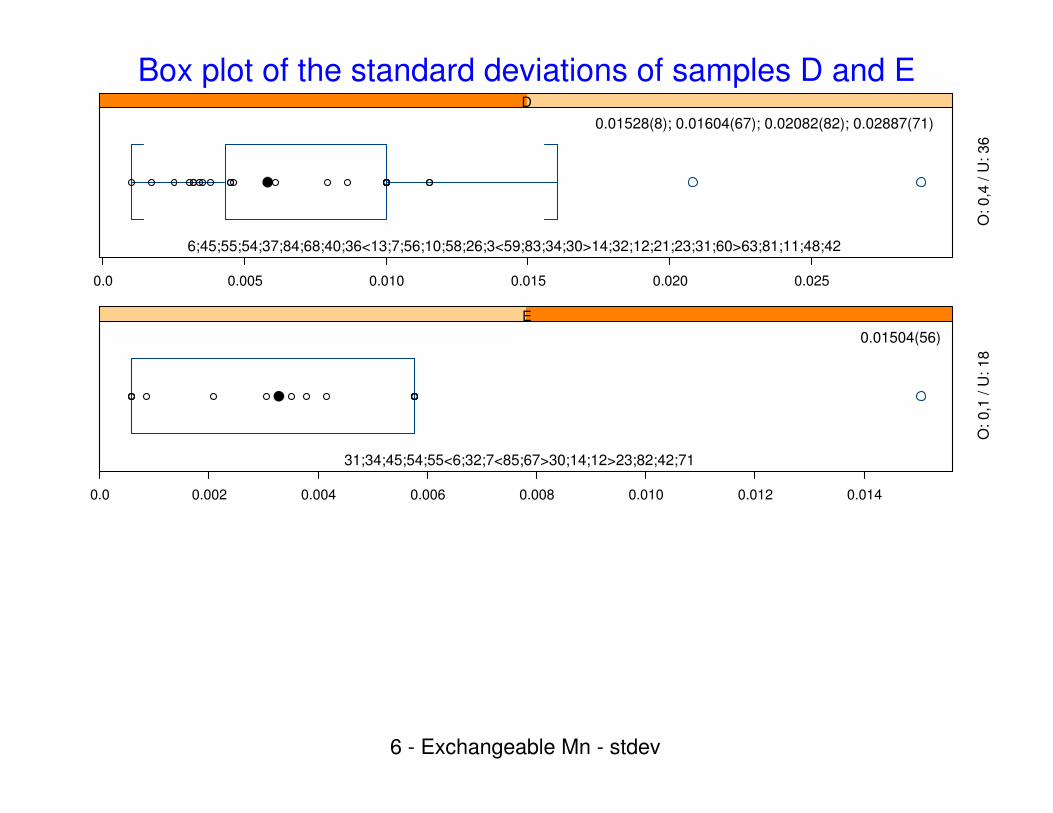
Box plot of the standard deviations of samples D and E
0.0 0.005 0.010 0.015 0.020 0.025
D
0.01528(8); 0.01604(67); 0.02082(82); 0.02887(71)
6;45;55;54;37;84;68;40;36<13;7;56;10;58;26;3<59;83;34;30>14;32;12;21;23;31;60>63;81;11;48;42
O: 0,4
/ U
: 36
0.0 0.002 0.004 0.006 0.008 0.010 0.012 0.014
E
0.01504(56)
31;34;45;54;55<6;32;7<85;67>30;14;12>23;82;42;71
O: 0,1
/ U
: 18
6 - Exchangeable Mn - stdev
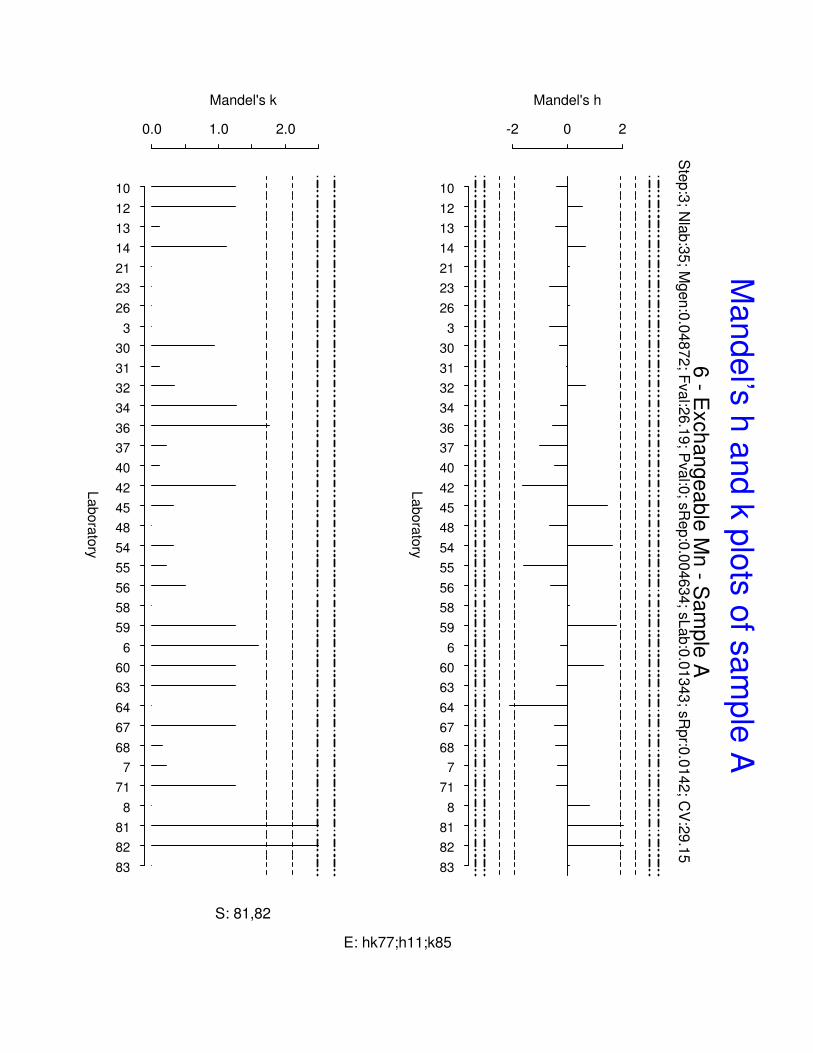
Labora
tory
Mandel's h
-2 0 2
10
12
13
14
21
23
26
3
30
31
32
34
36
37
40
42
45
48
54
55
56
58
59
6
60
63
64
67
68
7
71
8
81
82
83
6 - E
xch
an
ge
ab
le M
n - S
am
ple
AS
tep:3
; Nla
b:3
5; M
gen:0
.04872; F
val:2
6.1
9; P
val:0
; sR
ep:0
.004634; s
Lab:0
.01343; s
Rpr:0
.0142; C
V:2
9.1
5
Labora
tory
Mandel's k
0.0 1.0 2.0
10
12
13
14
21
23
26
3
30
31
32
34
36
37
40
42
45
48
54
55
56
58
59
6
60
63
64
67
68
7
71
8
81
82
83
S: 81,82
E: hk77;h11;k85
Mande
l’s h
and k
plo
ts o
f sam
ple
A
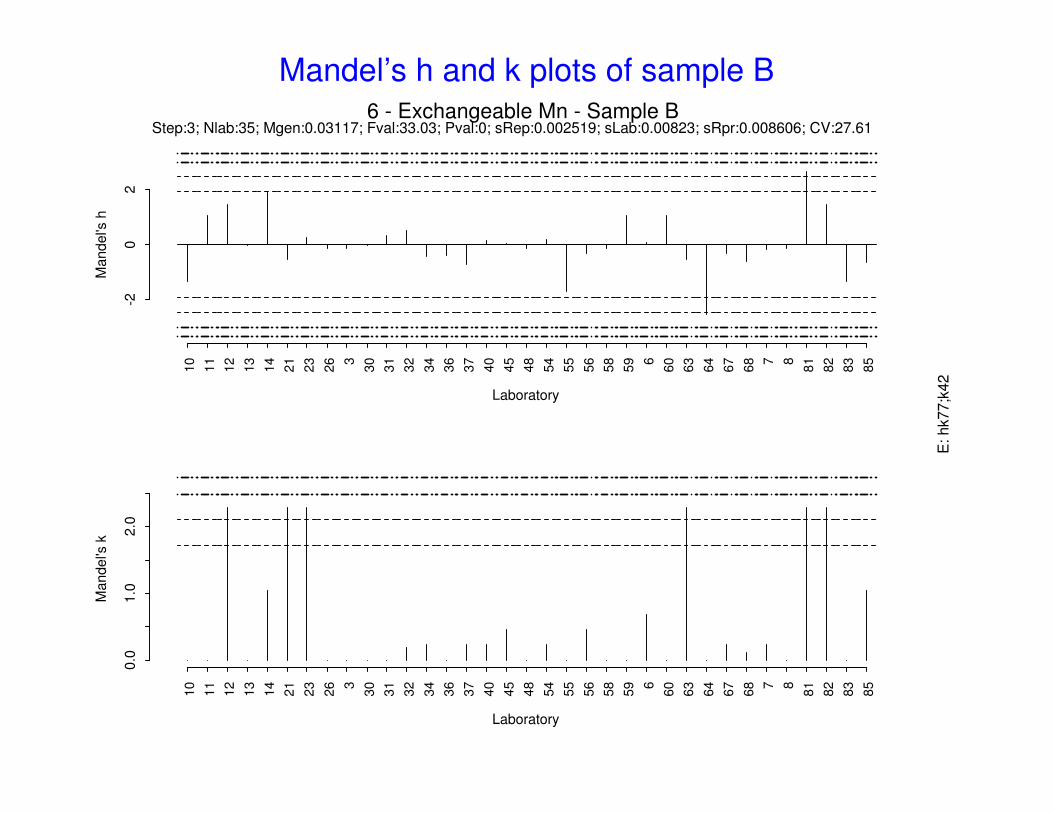
Laboratory
Mandel's
h
-20
2
10
11
12
13
14
21
23
26 3
30
31
32
34
36
37
40
45
48
54
55
56
58
59 6
60
63
64
67
68 7 8
81
82
83
85
6 - Exchangeable Mn - Sample BStep:3; Nlab:35; Mgen:0.03117; Fval:33.03; Pval:0; sRep:0.002519; sLab:0.00823; sRpr:0.008606; CV:27.61
Laboratory
Mandel's
k
0.0
1.0
2.0
10
11
12
13
14
21
23
26 3
30
31
32
34
36
37
40
45
48
54
55
56
58
59 6
60
63
64
67
68 7 8
81
82
83
85
E: hk77;k
42
Mandel’s h and k plots of sample B
Laboratory
Mandel's
h
-3-2
-10
12
3
13
23
30
31
32
34
40
45
54
55 6
60
63
64
67
68 7
82
85
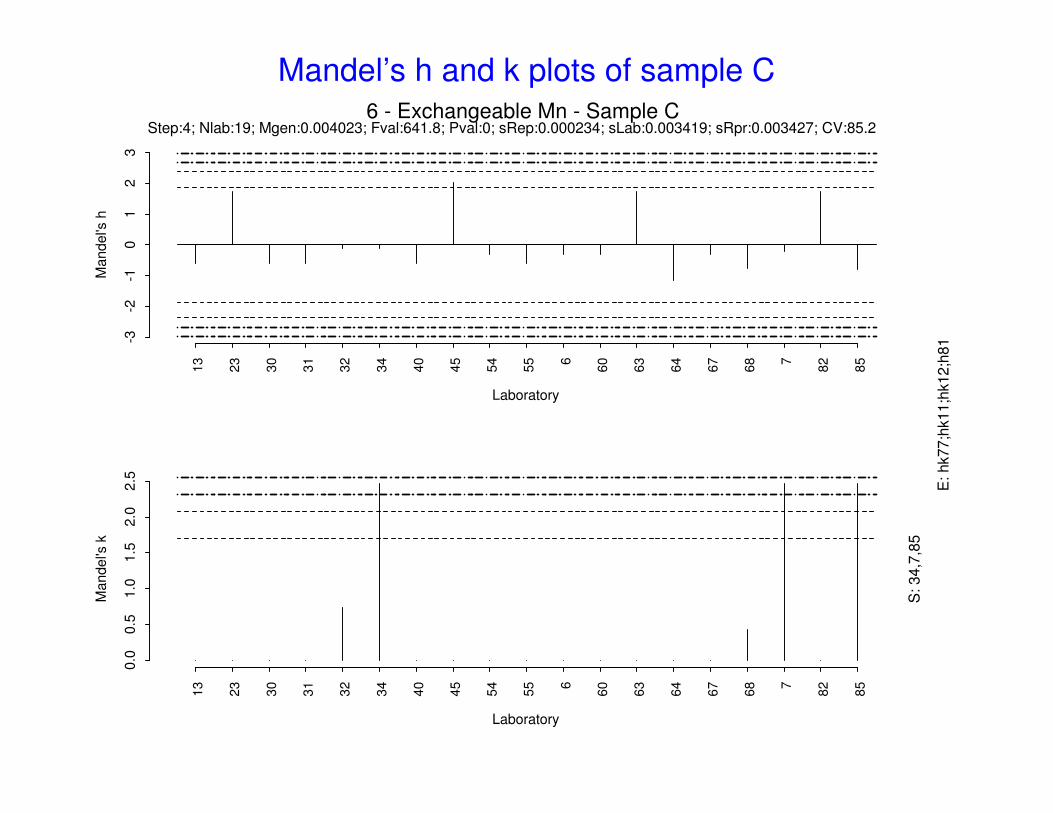
6 - Exchangeable Mn - Sample CStep:4; Nlab:19; Mgen:0.004023; Fval:641.8; Pval:0; sRep:0.000234; sLab:0.003419; sRpr:0.003427; CV:85.2
Laboratory
Mandel's
k
0.0
0.5
1.0
1.5
2.0
2.5
13
23
30
31
32
34
40
45
54
55 6
60
63
64
67
68 7
82
85
S: 34,7
,85
E: hk77;h
k11;h
k12;h
81
Mandel’s h and k plots of sample C
Labora
tory
Mandel's h
-2 0 2
10
11
12
13
14
21
23
26
3
30
31
32
34
36
37
38
40
42
45
48
54
55
56
58
59
6
60
63
64
67
68
7
8
81
82
83
84
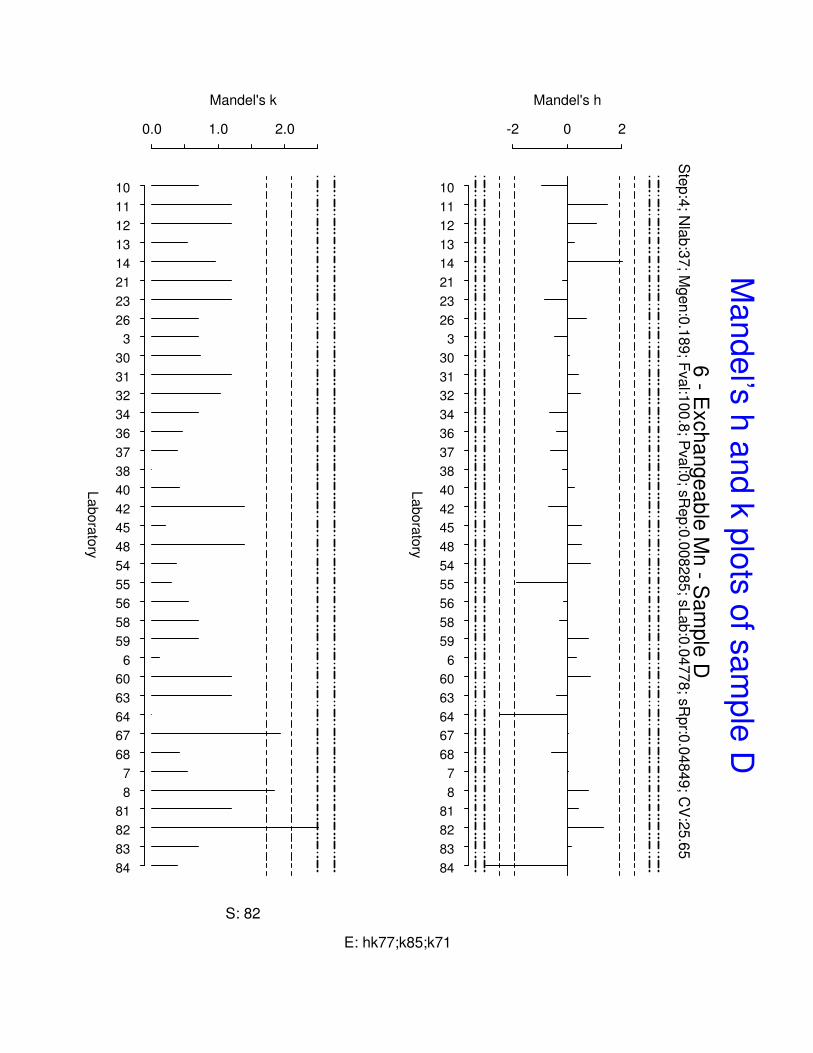
6 - E
xch
an
ge
ab
le M
n - S
am
ple
DS
tep:4
; Nla
b:3
7; M
gen:0
.189; F
val:1
00.8
; Pval:0
; sR
ep:0
.008285; s
Lab:0
.04778; s
Rpr:0
.04849; C
V:2
5.6
5
Labora
tory
Mandel's k
0.0 1.0 2.0
10
11
12
13
14
21
23
26
3
30
31
32
34
36
37
38
40
42
45
48
54
55
56
58
59
6
60
63
64
67
68
7
8
81
82
83
84
S: 82
E: hk77;k85;k71
Mande
l’s h
and k
plo
ts o
f sam
ple
D
Laboratory
Mandel's
h
-20
2
10
11
12
13
14
21
23
26 3
30
31
32
34
36
40
42
45
48
54
55
58
59 6
60
63
64
67 7
71 8
82
83
85
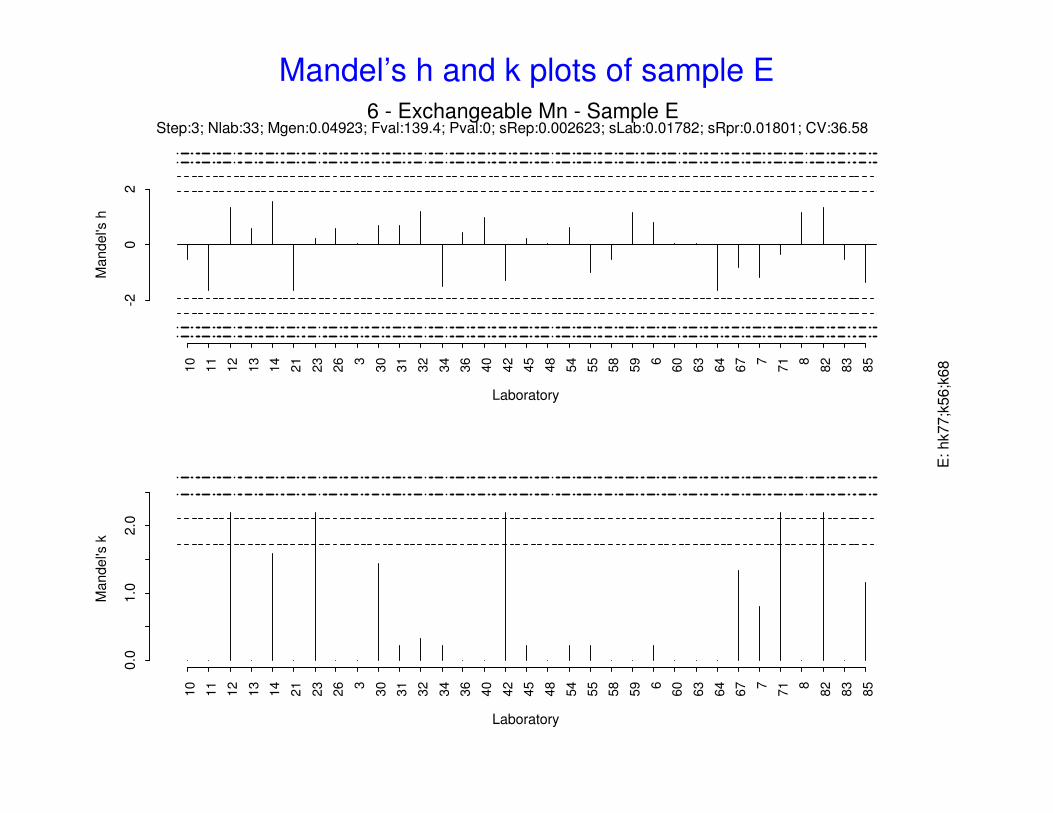
6 - Exchangeable Mn - Sample EStep:3; Nlab:33; Mgen:0.04923; Fval:139.4; Pval:0; sRep:0.002623; sLab:0.01782; sRpr:0.01801; CV:36.58
Laboratory
Mandel's
k
0.0
1.0
2.0
10
11
12
13
14
21
23
26 3
30
31
32
34
36
40
42
45
48
54
55
58
59 6
60
63
64
67 7
71 8
82
83
85
E: hk77;k
56;k
68
Mandel’s h and k plots of sample E

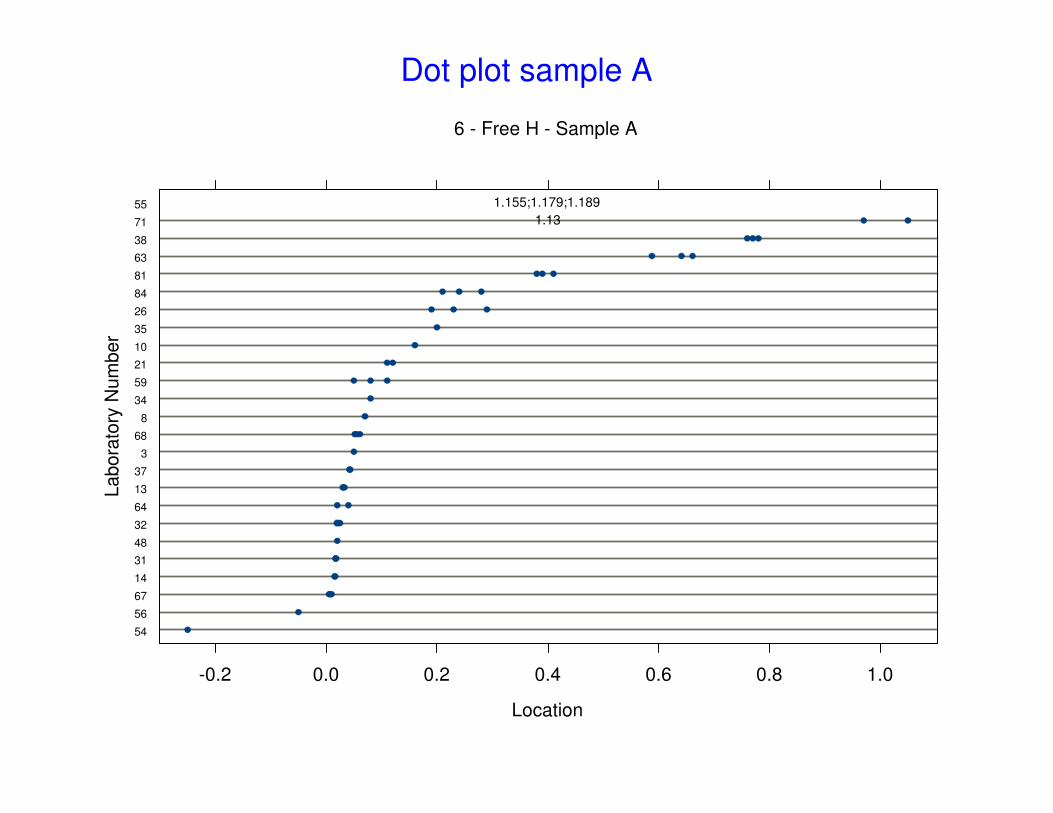
Free H+
54
56
67
14
31
48
32
64
13
37
3
68
8
34
59
21
10
35
26
84
81
63
38
71
55
-0.2 0.0 0.2 0.4 0.6 0.8 1.0
1.155;1.179;1.189
1.13
Location
Labora
tory
Num
ber
6 - Free H - Sample A
Dot plot sample A
54
67
48
42
14
64
32
31
13
3
68
37
56
8
59
34
84
35
10
21
26
63
71
38
81
55
-0.2 0.0 0.2 0.4 0.6 0.8
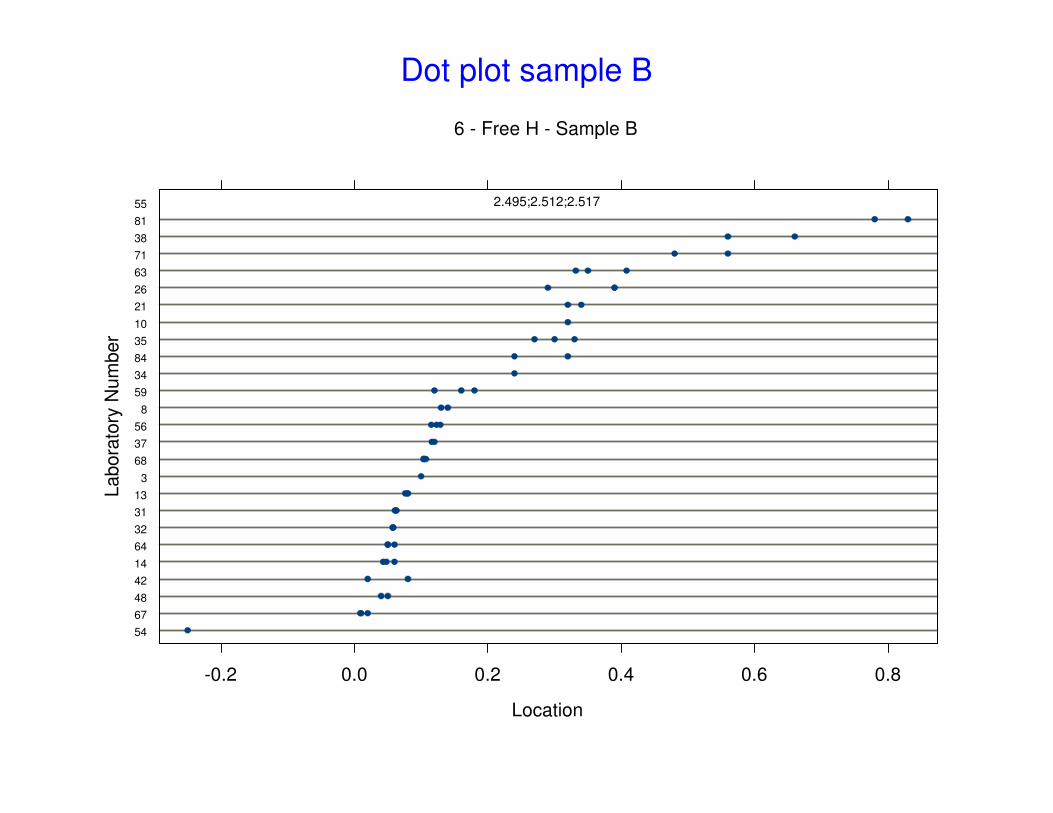
2.495;2.512;2.517
Location
Labora
tory
Num
ber
6 - Free H - Sample B
Dot plot sample B
71
37
56
21
48
68
67
10
84
55
81
54
64
26
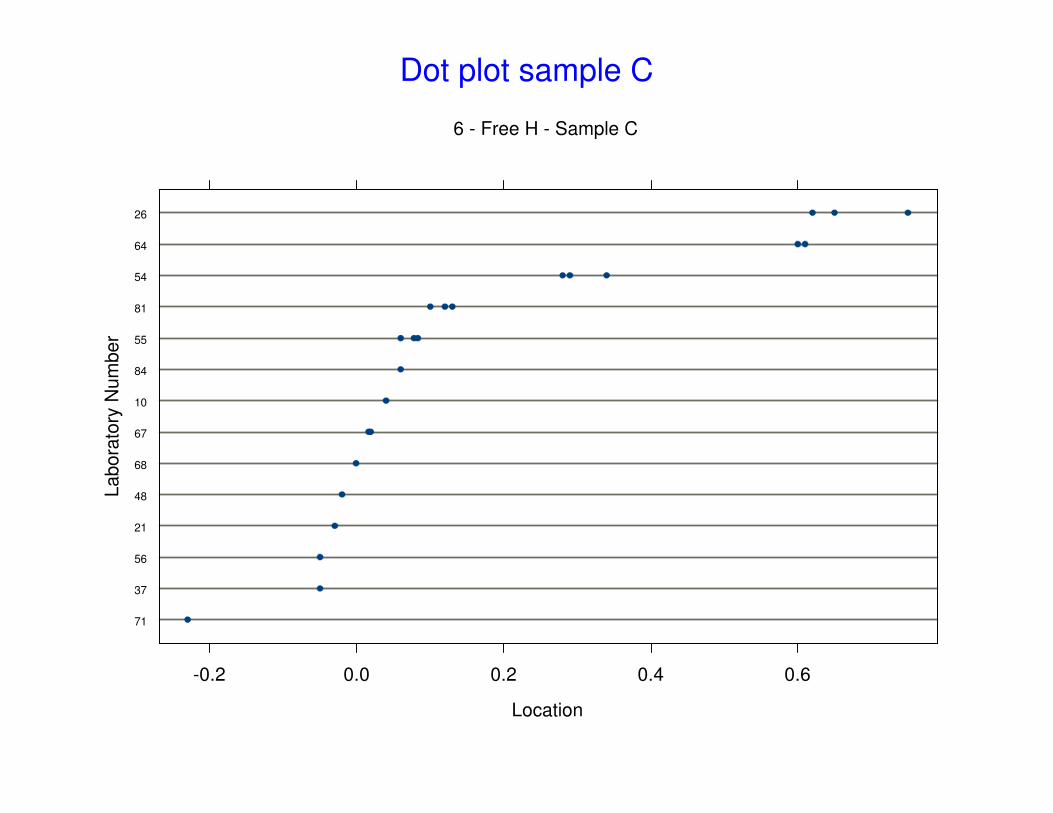
-0.2 0.0 0.2 0.4 0.6
Location
Labora
tory
Num
ber
6 - Free H - Sample C
Dot plot sample C
54
37
67
64
14
42
48
31
56
13
32
3
68
8
59
26
21
10
34
84
35
71
81
55
63
-0.2 0.0 0.2 0.4
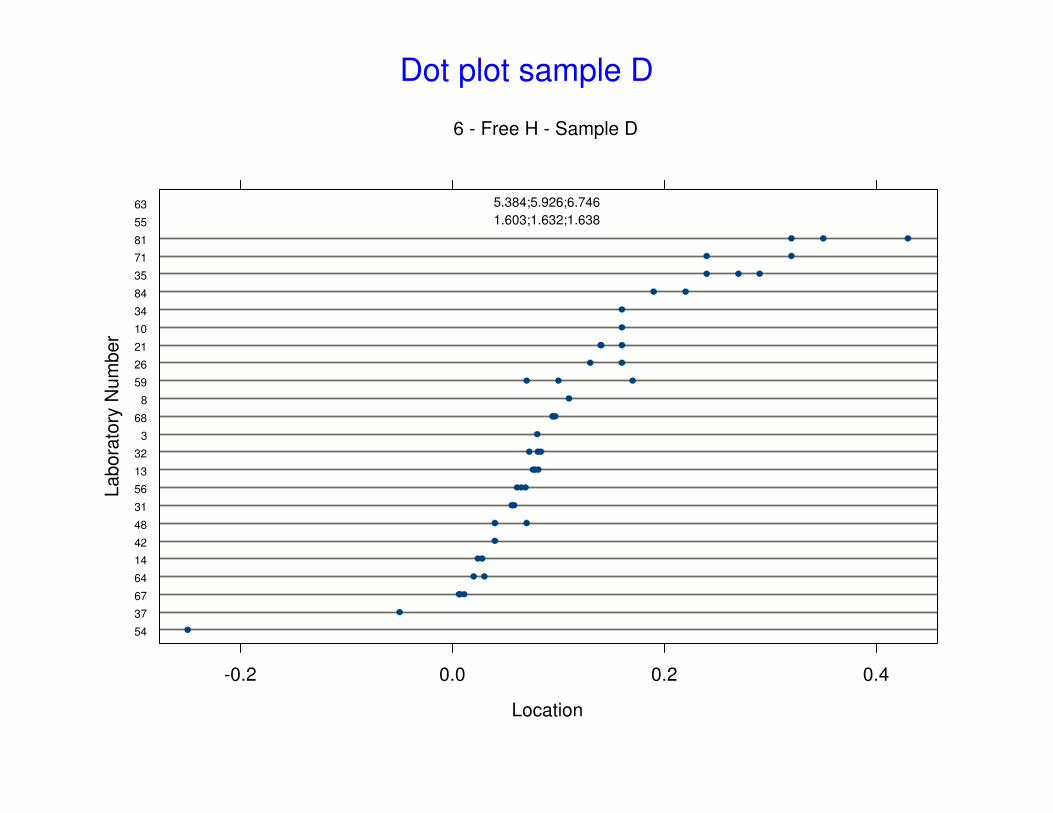
1.603;1.632;1.638
5.384;5.926;6.746
Location
Labora
tory
Num
ber
6 - Free H - Sample D
Dot plot sample D
37
34
42
67
21
38
36
14
68
40
30
32
31
13
84
59
10
8
3
64
35
26
71
54
55
56
63
0 5 10 15
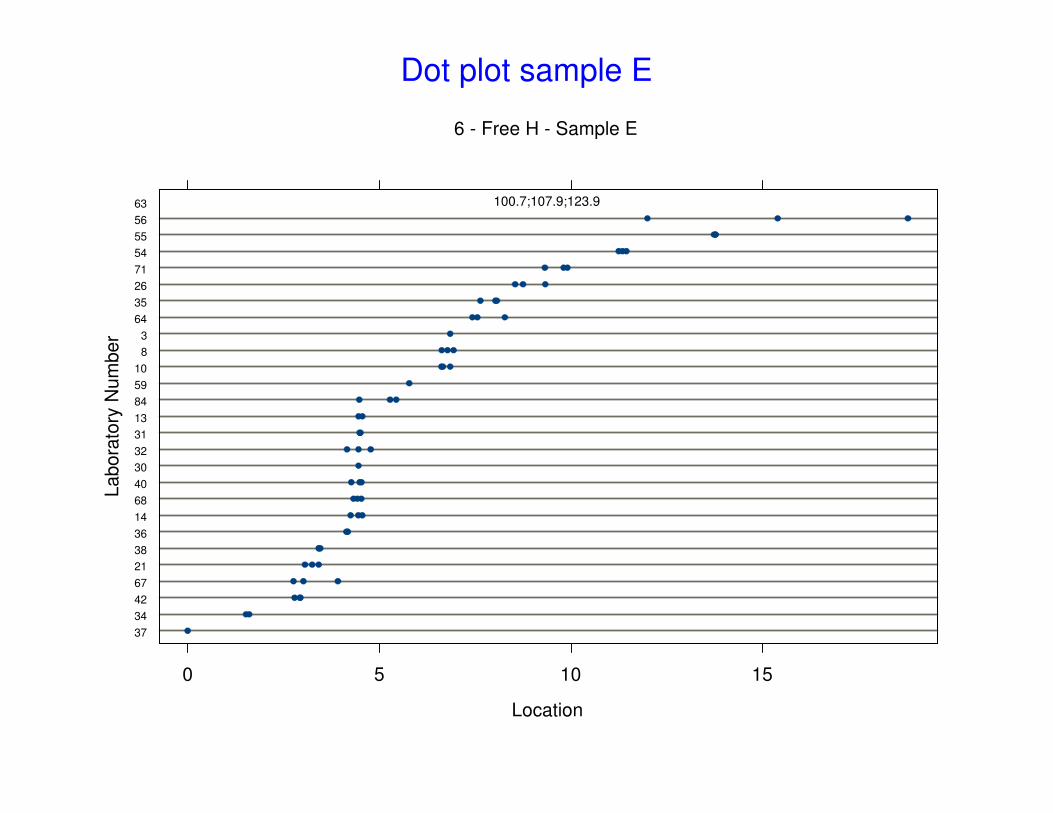
100.7;107.9;123.9
Location
Labora
tory
Num
ber
6 - Free H - Sample E
Dot plot sample E
0.0 0.5 1.0
05
10
15
6 - Free H - Sample A - mean
N:
25
NA
: 0
Z:
0 E
: 0
,1 U
: 2
4
a:
0.2
07
5
m:
0.0
7
s:
0.3
43
8
4.2% 4.2%
66.7%
12.5%
0%8.3%
0% 4.2%
1.174(55)
-0.4 -0.2 0.0 0.2 0.4 0.6 0.8 1.0
04
812
6 - Free H - Sample B - mean
N:
26
NA
: 0
Z:
0 E
: 0
,1 U
: 2
5
a:
0.2
89
3
m:
0.1
27
8
s:
0.5
01
6
4%0%
56%
28%
4% 4% 4%
2.508(55)
-0.4 -0.2 0.0 0.2 0.4 0.6 0.8
02
46
6 - Free H - Sample C - mean
N:
14
NA
: 0
Z:
0 E
: 0
U:
14
a:
0.1
07
6
m:
0.0
28
83
s:
0.2
52
8
7.1%
35.7% 35.7%
7.1%0%
14.3%
Histogram of the means of samples A, B and C
-0.2 0.0 0.2 0.4
02
46
8
6 - Free H - Sample D - mean
N:
25
NA
: 0
Z:
0 E
: 0
,2 U
: 2
3
a:
0.3
96
1
m:
0.0
95
63
s:
1.2
16
4.3%0%
4.3%
47.8%
26.1%
13%
4.3%
1.624(55); 6.019(63)
0 5 10 15
02
46
8
6 - Free H - Sample E - mean
N:
26
NA
: 0
Z:
0 E
: 0
,1 U
: 2
5
a:
10
.25
m
: 4
.79
7
s:
20
.79
4%
16%
40%
20%
8%4% 4% 4%
110.8(63)
Histogram of the means of samples D and E
-0.2 0.0 0.2 0.4 0.6 0.8 1.0
A
-0.25(54) 0.3933(81); 0.63(63); 0.77(38); 1.05(71)
56;67;14;31;48<32;64;13;37;3<68;8>34;59;21;10;35>26;84
O:
1,4
/ U
: 2
4
-0.2 0.0 0.2 0.4 0.6 0.8
B
0.6267(38); 0.8133(81)
54;67;48;42;14;64;32<31;13;3;68<37;56;8>59;34;84;35;10>21;26;63;71
O:
0,2
/ U
: 2
5
-0.2 0.0 0.2 0.4 0.6
C
-0.23(71) 0.3033(54); 0.6033(64); 0.6733(26)
37;56;21<48;68<67;10>84;55>81
O:
1,3
/ U
: 1
4
6 - Free H - mean
Box plot of the means of samples A, B and C
-0.2 -0.1 0.0 0.1 0.2 0.3
D
-0.25(54) 0.2667(35); 0.2933(71); 0.3667(81)
37;67;64;14;42<48;31;56;13<32;3;68>8;59;26;21>10;34;84
O:
1,3
/ U
: 2
3
2 4 6 8 10 12 14
E
9.68(71); 11.35(54); 13.76(55); 15.4(56)
34;42;67;21;38;36;14<68;40;30;32<31;13;84>59;10;8;3;64>35;26
O:
0,4
/ U
: 2
5
6 - Free H - mean
Box plot of the means of samples D and E
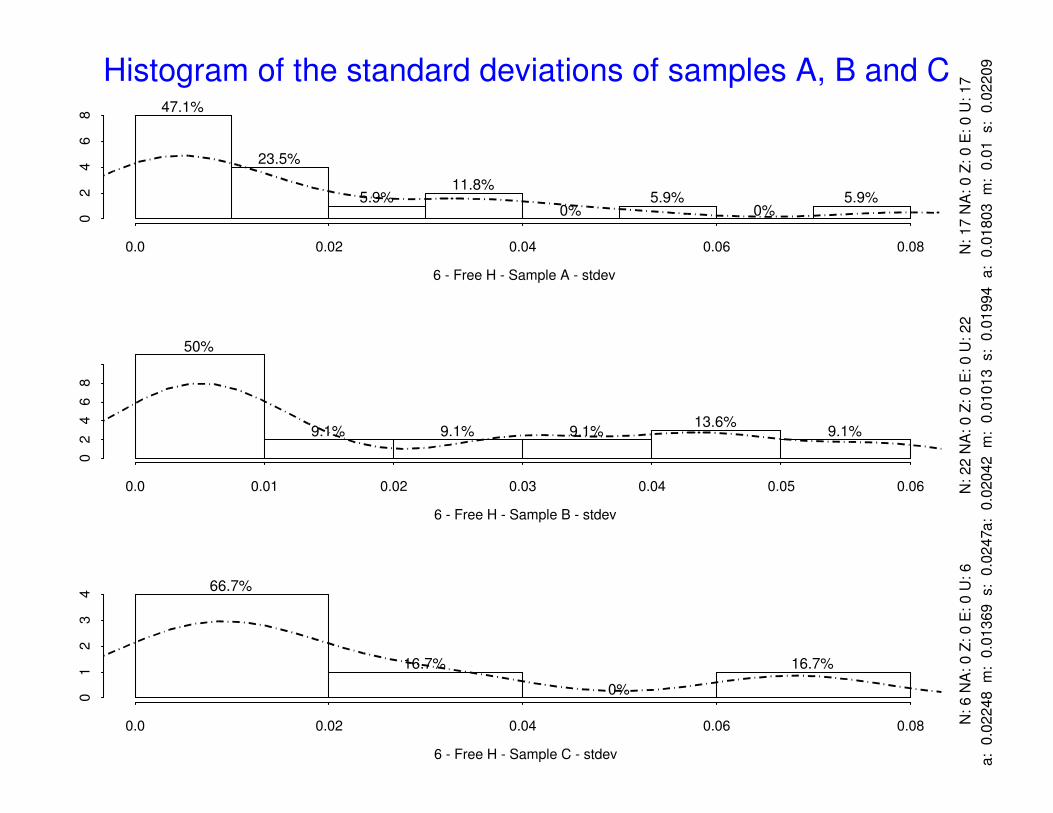
Histogram of the standard deviations of samples A, B and C
0.0 0.02 0.04 0.06 0.08
02
46
8
6 - Free H - Sample A - stdev
N: 17 N
A: 0 Z
: 0 E
: 0 U
: 17
a: 0
.01803 m
: 0
.01 s: 0
.02209
47.1%
23.5%
5.9%11.8%
0%5.9%
0%5.9%
0.0 0.01 0.02 0.03 0.04 0.05 0.06
02
46
8
6 - Free H - Sample B - stdev
N: 22 N
A: 0 Z
: 0 E
: 0 U
: 22
a: 0
.02042 m
: 0
.01013 s: 0
.01994
50%
9.1% 9.1% 9.1%13.6%
9.1%
0.0 0.02 0.04 0.06 0.08
01
23
4
6 - Free H - Sample C - stdev
N: 6 N
A: 0 Z
: 0 E
: 0 U
: 6
a: 0
.02248 m
: 0
.01369 s: 0
.0247
66.7%
16.7%
0%
16.7%
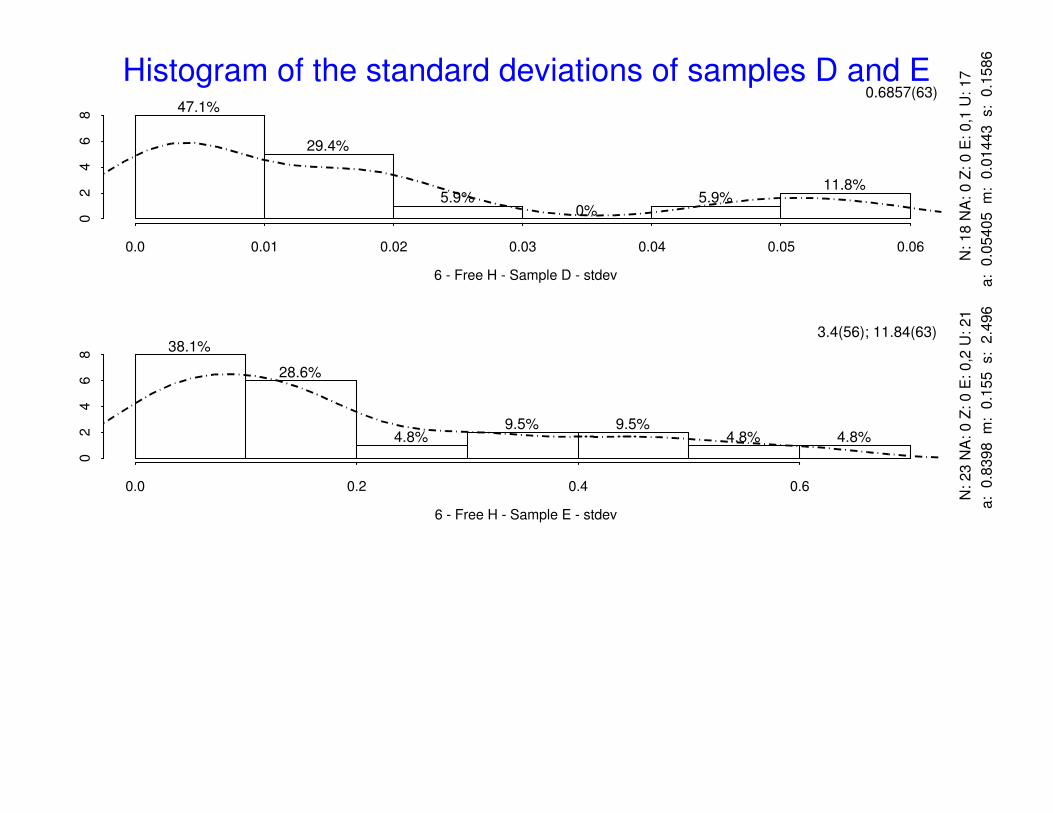
Histogram of the standard deviations of samples D and E
0.0 0.01 0.02 0.03 0.04 0.05 0.06
02
46
8
6 - Free H - Sample D - stdev
N: 18 N
A: 0 Z
: 0 E
: 0,1
U: 17
a: 0
.05405 m
: 0
.01443 s: 0
.1586
47.1%
29.4%
5.9%0%
5.9%11.8%
0.6857(63)
0.0 0.2 0.4 0.6
02
46
8
6 - Free H - Sample E - stdev
N: 23 N
A: 0 Z
: 0 E
: 0,2
U: 21
a: 0
.8398 m
: 0
.155 s: 2
.496
38.1%
28.6%
4.8%9.5% 9.5%
4.8% 4.8%
3.4(56); 11.84(63)
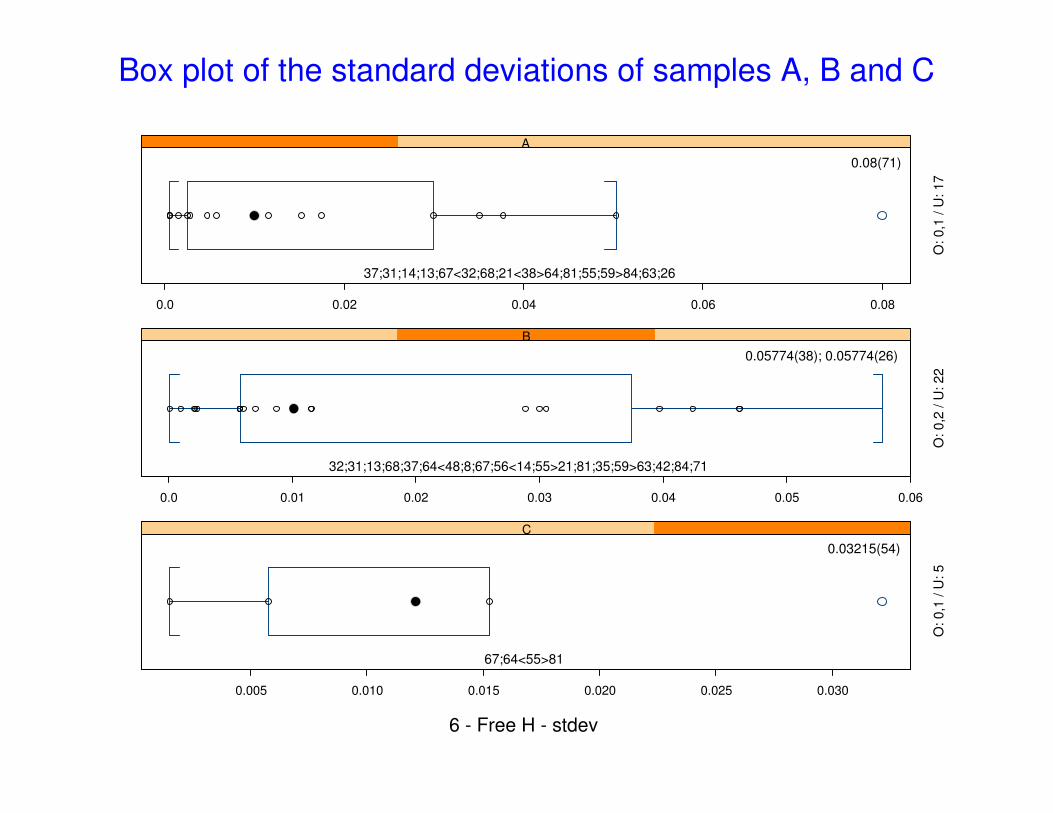
Box plot of the standard deviations of samples A, B and C
0.0 0.02 0.04 0.06 0.08
A
0.08(71)
37;31;14;13;67<32;68;21<38>64;81;55;59>84;63;26
O: 0
,1 / U
: 1
7
0.0 0.01 0.02 0.03 0.04 0.05 0.06
B
0.05774(38); 0.05774(26)
32;31;13;68;37;64<48;8;67;56<14;55>21;81;35;59>63;42;84;71
O: 0
,2 / U
: 2
2
0.005 0.010 0.015 0.020 0.025 0.030
C
0.03215(54)
67;64<55>81
O: 0
,1 / U
: 5
6 - Free H - stdev
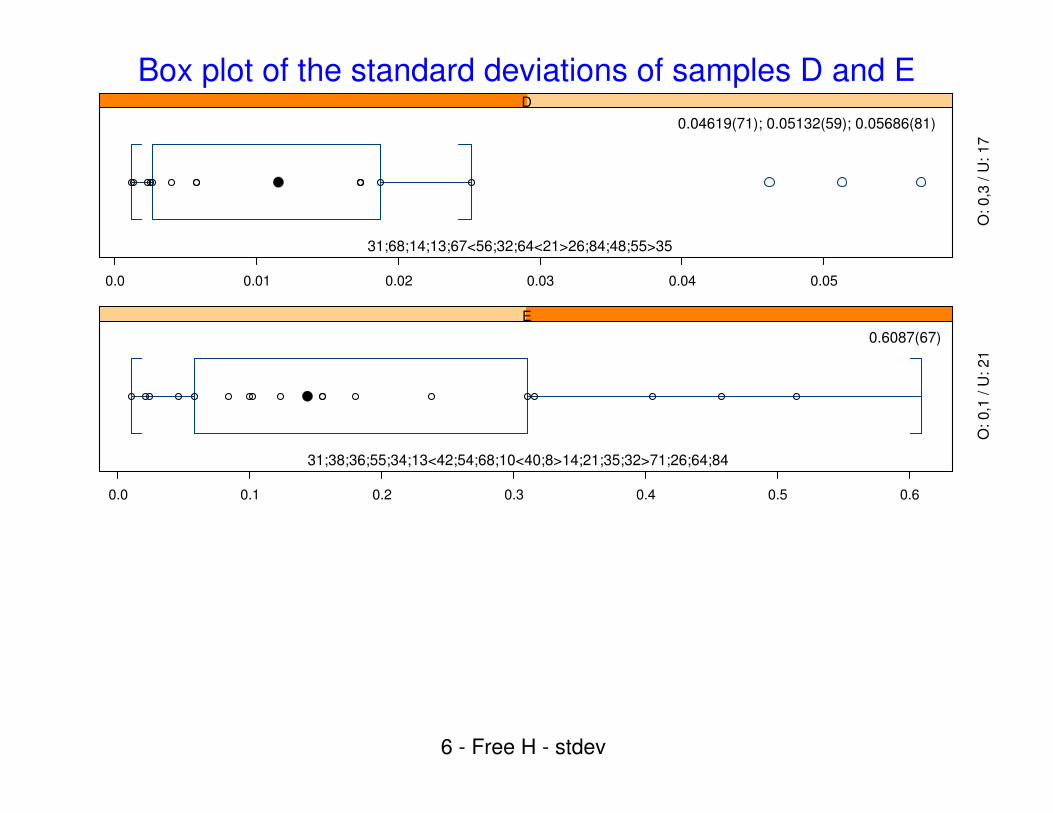
Box plot of the standard deviations of samples D and E
0.0 0.01 0.02 0.03 0.04 0.05
D
0.04619(71); 0.05132(59); 0.05686(81)
31;68;14;13;67<56;32;64<21>26;84;48;55>35
O: 0,3
/ U
: 17
0.0 0.1 0.2 0.3 0.4 0.5 0.6
E
0.6087(67)
31;38;36;55;34;13<42;54;68;10<40;8>14;21;35;32>71;26;64;84
O: 0,1
/ U
: 21
6 - Free H - stdev
Laboratory
Mandel's
h
-2-1
01
2
10
13
14
21 3
31
32
34
37
48
56
67
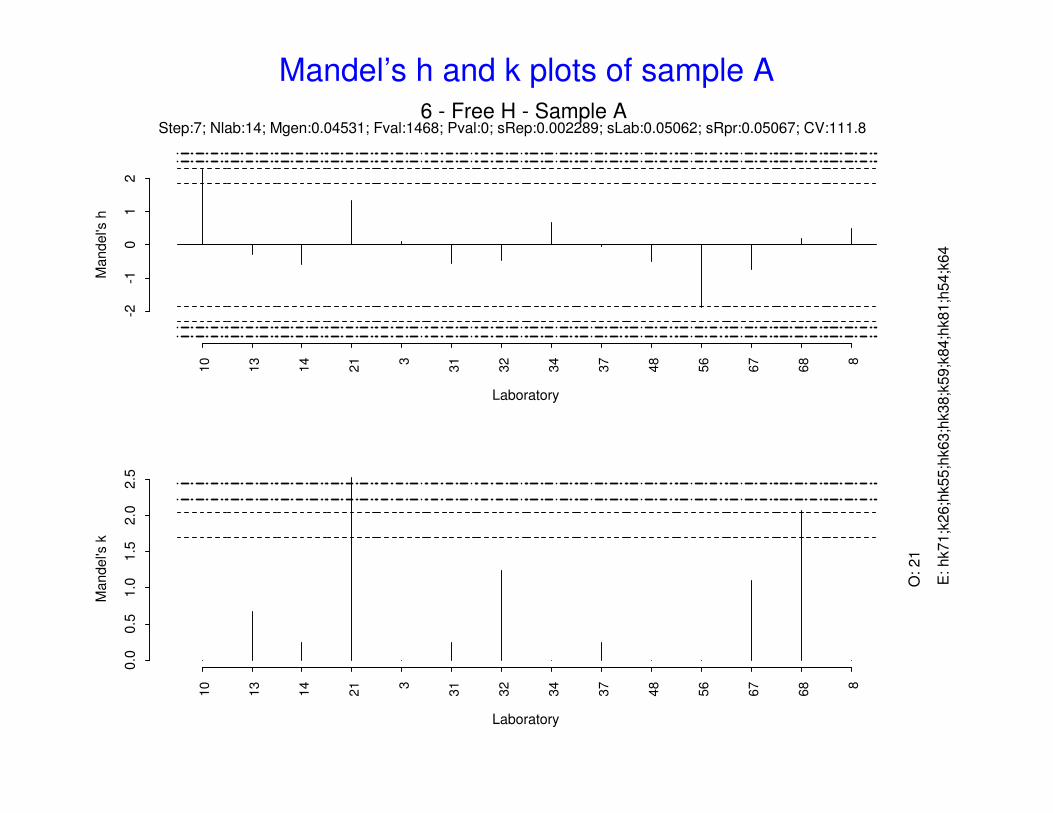
68 8
6 - Free H - Sample AStep:7; Nlab:14; Mgen:0.04531; Fval:1468; Pval:0; sRep:0.002289; sLab:0.05062; sRpr:0.05067; CV:111.8
Laboratory
Mandel's
k
0.0
0.5
1.0
1.5
2.0
2.5
10
13
14
21 3
31
32
34
37
48
56
67
68 8
O: 21
E: hk71;k
26;h
k55;h
k63;h
k38;k
59;k
84;h
k81;h
54;k
64
Mandel’s h and k plots of sample A
Laboratory
Mandel's
h
-3-2
-10
12
3
10
13
14
21
26 3
31
32
34
35
37
38
48
54
56
59
63
64
67
68
71 8
81
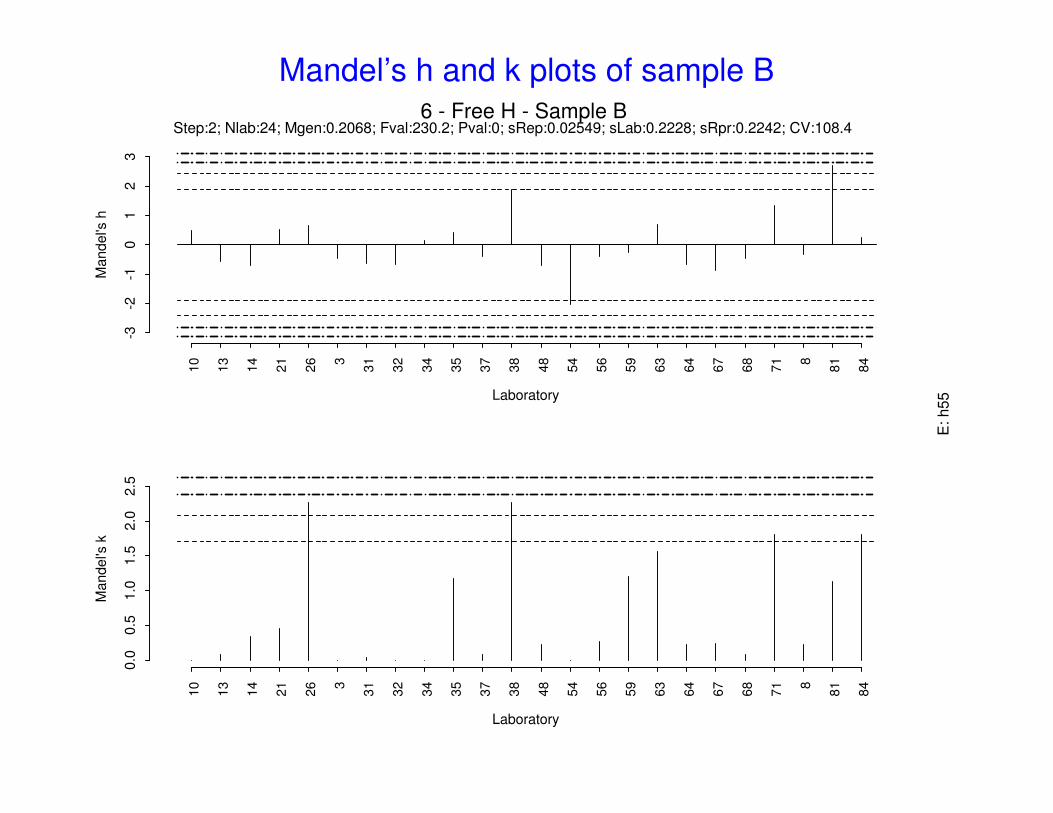
84
6 - Free H - Sample BStep:2; Nlab:24; Mgen:0.2068; Fval:230.2; Pval:0; sRep:0.02549; sLab:0.2228; sRpr:0.2242; CV:108.4
Laboratory
Mandel's
k
0.0
0.5
1.0
1.5
2.0
2.5
10
13
14
21
26 3
31
32
34
35
37
38
48
54
56
59
63
64
67
68
71 8
81
84
E: h55
Mandel’s h and k plots of sample B
Laboratory
Mandel's
h
-2-1
01
2
10
21
37
48
56
67
68
71
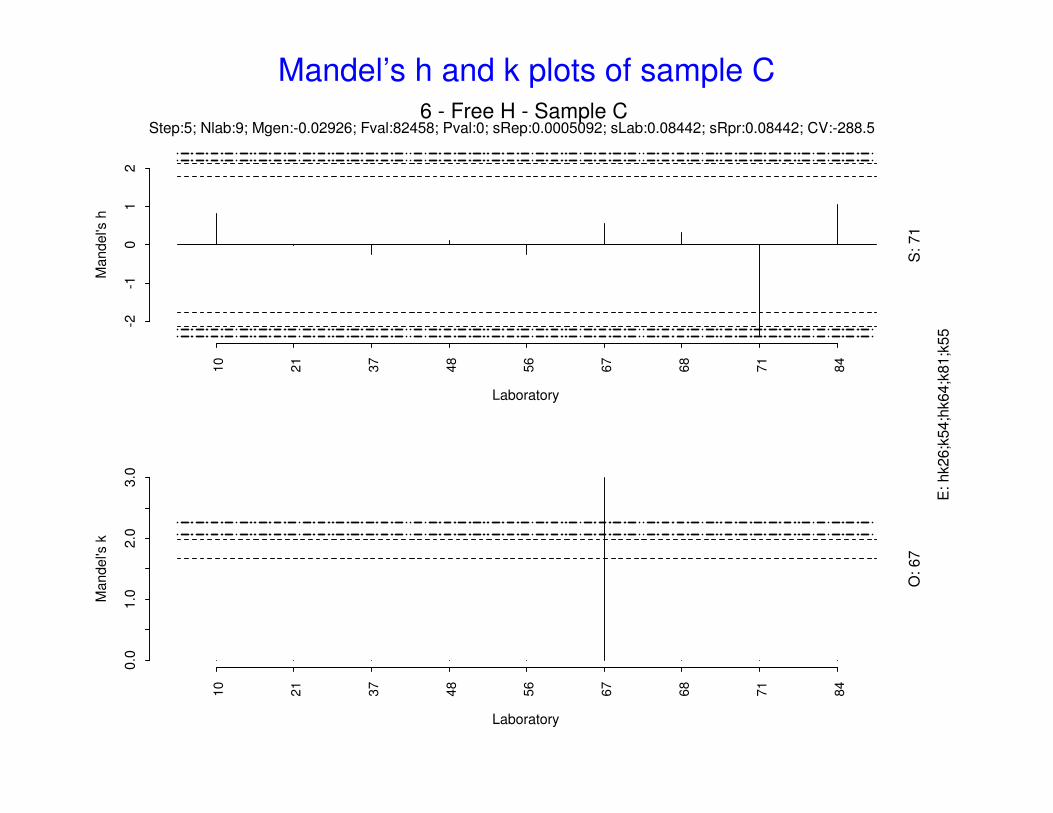
84
6 - Free H - Sample CStep:5; Nlab:9; Mgen:-0.02926; Fval:82458; Pval:0; sRep:0.0005092; sLab:0.08442; sRpr:0.08442; CV:-288.5
S: 71
Laboratory
Mandel's
k
0.0
1.0
2.0
3.0
10
21
37
48
56
67
68
71
84
O: 67
E: hk26;k
54;h
k64;k
81;k
55
Mandel’s h and k plots of sample C
Laboratory
Mandel's
h
-3-2
-10
12
3
10
13
14
21
26 3
31
32
34
37
48
56
64
67
68 8
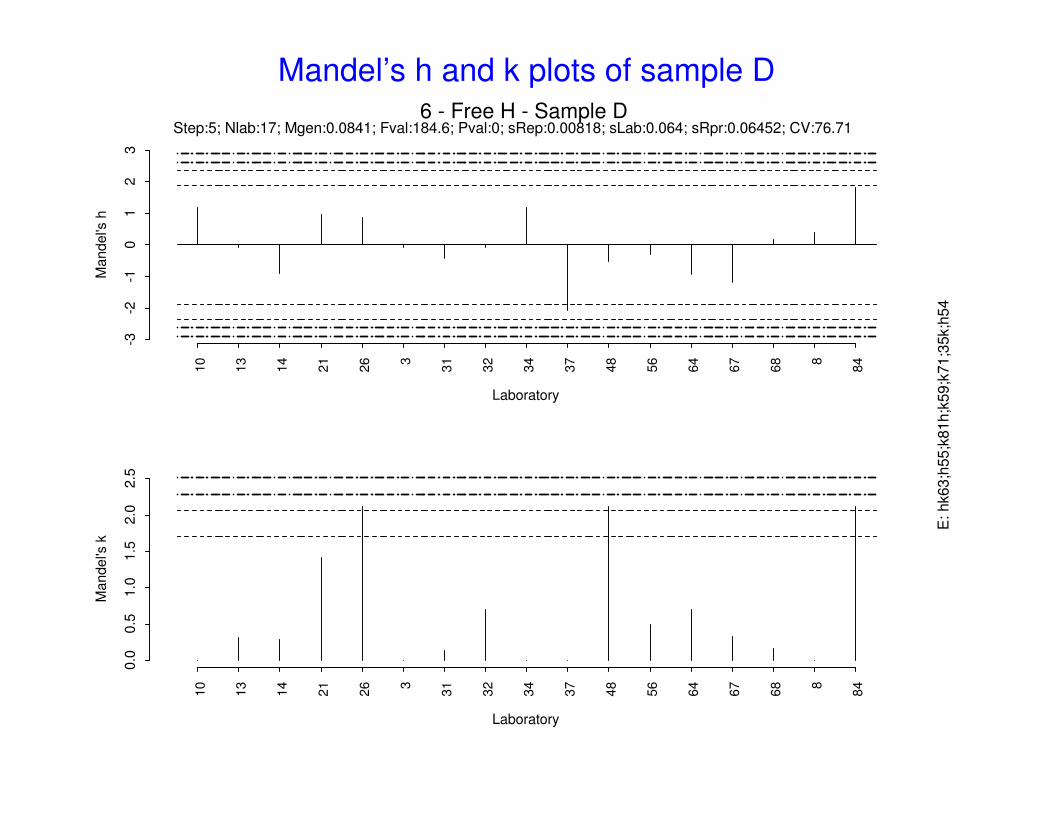
84
6 - Free H - Sample DStep:5; Nlab:17; Mgen:0.0841; Fval:184.6; Pval:0; sRep:0.00818; sLab:0.064; sRpr:0.06452; CV:76.71
Laboratory
Mandel's
k
0.0
0.5
1.0
1.5
2.0
2.5
10
13
14
21
26 3
31
32
34
37
48
56
64
67
68 8
84
E: hk63;h
55;k
81h;k
59;k
71;3
5k;h
54
Mandel’s h and k plots of sample D
Laboratory
Mandel's
h
-3-2
-10
12
3
10
13
14
21
26 3
30
31
32
34
35
36
37
38
40
42
54
55
59
64
67
68
71 8
84
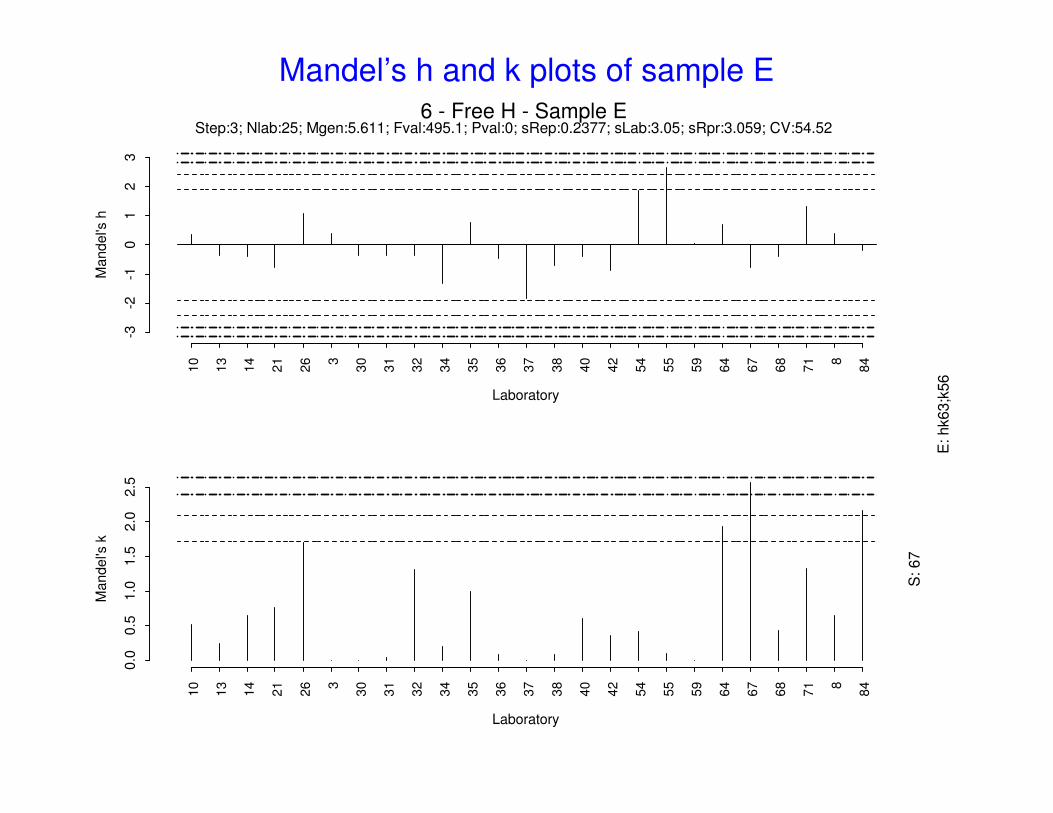
6 - Free H - Sample EStep:3; Nlab:25; Mgen:5.611; Fval:495.1; Pval:0; sRep:0.2377; sLab:3.05; sRpr:3.059; CV:54.52
Laboratory
Mandel's
k
0.0
0.5
1.0
1.5
2.0
2.5
10
13
14
21
26 3
30
31
32
34
35
36
37
38
40
42
54
55
59
64
67
68
71 8
84
S: 67
E: hk63;k
56
Mandel’s h and k plots of sample E
Recommended