www.mitchellservices.com.au1
ANNUAL GENERAL MEETING 26 OCTOBER 2016Chief Executive Officer Presentation
For
per
sona
l use
onl
y

www.mitchellservices.com.au2
DISCLAIMER
This investor presentation has been prepared by Mitchell Services Limited (“the Company”). Information in this presentation is of a general nature only and should be read in conjunction with the
Company’s other periodic and continuous disclosure announcements to the ASX, which are available at: www.asx.com.au.
This presentation contains statements, opinions, projections, forecasts and other material (“forward-looking statements”) with respect to the financial condition, business operations and competitive
landscape of the Company and certain plans for its future management. The words anticipate, believe, expect, project, forecast, estimate, likely, intend, should, could, may, target, plan and other similar
expressions are intended to identify forward-looking statements. Such forward-looking statements are not guarantees of future performance and include known and unknown risks, uncertainties,
assumptions and other important factors which are beyond the Company’s control and may cause actual results to differ from those expressed or implied in such statements. There can be no assurance
that actual outcomes will not differ materially from these statements. Any forward-looking statements contained in this document are qualified by this cautionary statement. The past performance of the
Company is not a guarantee of future performance. None of the Company, or its officers, employees, agents or any other person named in this presentation makes any representation, assurance or
guarantee as to the accuracy or likelihood of fulfilment of any forward-looking statements or any of the outcomes upon which they are based.
The information contained in this presentation does not take into account the investment objectives, financial situation or particular needs of any recipient and is not financial product advice. Before
making an investment decision, investors should consider their own needs and situation and, if necessary, seek independent professional advice.
To the maximum extent permitted by law, the Company and its directors and advisers of both give no warranty, representation or guarantee as to the accuracy, completeness or reliability of the
information contained in this presentation. Further, none of the Company, it officers, agents or employees of accepts, to the extent permitted by law, any liability for any loss, claim, damages, costs or
expenses arising from the use of this presentation or its contents or otherwise arising out of, or in connection with it. Any recipient of this presentation should independently satisfy themselves as to the
accuracy of all information contained herein.
For
per
sona
l use
onl
y
www.mitchellservices.com.au3
MITCHELL SERVICES VISION
Find a better way
To be Australia’s leading provider of drilling services to the global exploration, mining and energy industries
Management
Team
Safety Leading
Technology
Systems Operational
Capability
Value
Proposition
Our people are
your success
Be Sure. Be Safe
For
per
sona
l use
onl
y

www.mitchellservices.com.au4
SAFETY UPDATE
• Even though rig utilisation has increased the
frequency and severity of safety incidents has
continued to decrease
• Numerous initiatives implemented to further
strengthen safety culture and performance
• Mitchell Services has had no lost time
injuries since November 2014
For
per
sona
l use
onl
y

www.mitchellservices.com.au5
2016 BUSINESS OVERVIEW
600+ dayslost time injury free
POSITIVE EBITDAon less than 30% utilisation
Total revenue of $32.97m
31%from FY2015
Nitro acquisition and
integration completed
on time and on budget
↑
0
100
200
300
400
500
600
700
800
Jul Aug Sep Oct Nov Dec Jan Feb Mar Apr May Jun
OPERATING SHIFTSFY15 SHIFTS FY16 SHIFTS
For
per
sona
l use
onl
y

www.mitchellservices.com.au6
BUSINESS OPTIMISATION STRATEGY
Phase 1: Business ReadyCOMPLETE
• Implement initiatives to improve
safety culture and performance
• Reached goal of $24m operating
revenue in FY 2015
• $20.2m capital raise for the
acquisition of Tom Browne Drilling
Services assets from receivers
• Integration of Tom Browne Drilling
Services including auction of
surplus equipment
• Increase Tier 1 client base and
increase rig utilisation
• Take advantage of strong position
in key markets
• Capitalise on long term revenue
streams from high quality Tier 1
clients
• Focus on reducing costs in the
business
• Deliver efficient, safe and quality
services to our clients
• Acquisition and integration of Nitro
assets
• Upgrade asset fleet and sell non-
core assets to reduce commercial
debt levels and optimise asset mix
• ISO certification and
implementation of electronic
safety, training and human
resources management system
• Review and implementation of
Industrial Relations strategy to
increase flexibility across the
business
• Moved operational base,
corporate office and rented
Townsville premises to major
global defence contractor
• Auction of surplus equipment
• Increased rig utilisation from 3 to
12 rigs
Phase 3: RefinementCOMPLETE & ONGOING
Phase 2: Ramp UpCOMPLETE
For
per
sona
l use
onl
y

www.mitchellservices.com.au7
RESULTS OVERVIEW
FY16 FY15 Change
$000's $000's %
Revenue 32,970 25,233 31%
EBITDA 522 (4,322) 112%
EBIT (4,795) (12,648) 62%
NPBT (6,049) (16,999) 64%
Statutory Profit & Loss
FY16 FY15 Change
$000's $000's %
Revenue 32,970 25,233 31%
EBITDA 2,535 (219) 1259%
EBIT (2,782) (8,544) 67%
NPBT (4,036) (12,896) 69%
Adjusted Profit & Loss
Please note “Adjusted” figures represent non-IFRS information that has not been subject
to an audit or review at 30 June 2016
1H1H
1H2H
2H
2H
-
10,000
20,000
30,000
40,000
FY14 FY15 FY16
Revenue ($000's)
1H1H
1H
2H
2H
2H
(5,000)
(4,000)
(3,000)
(2,000)
(1,000)
-
1,000
FY14 FY15 FY16
Statutory EBITDA ($000's)
1H1H
1H
2H2H
2H
(3,000)
(2,000)
(1,000)
-
1,000
2,000
3,000
FY14 FY15 FY16
Adjusted EBITDA ($000's)
For
per
sona
l use
onl
y

www.mitchellservices.com.au8
OPERATING REVENUE BY CLIENT TYPE
VALUE OF TIER 1
• Large / multinational mining and
energy companies
• Very high safety and business
system requirements
• Generally brownfield work for
existing mining operators
• Longer term contracts
• Annual revenue from existing
Tier 1 clients (based on current
workloads) circa $30million
*large / multinational mining & energy companies
$8.55m $8.43m
$3.78m
$5.52m
$16.26m $28.85m
FY14 FY15 FY16
Tier 1 operating income*
Other operating income
$14.07m
$24.69m
$32.63m
For
per
sona
l use
onl
y
www.mitchellservices.com.au9
44.4%18.5%21.2%2.6%
13.2%
Gold Copper Coal Lead/Zinc/Silver Other
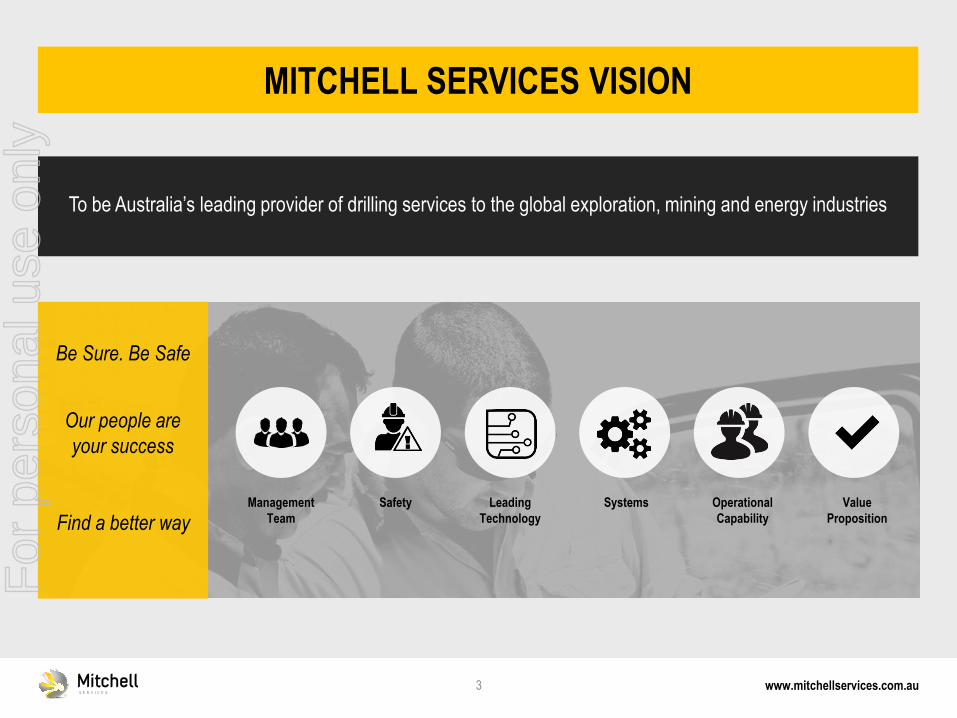
OPERATING REVENUE BY COMMODITY
Management remains mindful of the importance of diversification in revenue streams including diversity in commodity mix. Our
commodity mix remains well balanced with revenue from coal and revenue from minerals accounting for 46% and 51% of total
operating revenue respectively.
21.0%
15.8%
48.8%
2.1%12.3%
FY2014 $14.07m
6.9%
20.8%
49.7%
19.1%
3.5%
FY2015 $24.69m
33.2%
5.5%46.4%
12.7%2.2%
FY2016 $32.63m
For
per
sona
l use
onl
y

www.mitchellservices.com.au10
Surface Underground Non-Drilling
OPERATING REVENUE BY DRILLING TYPE
Management remains mindful of the importance of diversification in revenue streams including diversity in the mix between
underground and surface drilling. Underground drilling is generally performed on a double shift basis and is generally not
subjected to seasonal fluctuations. Revenue from underground drilling has grown by 681% compared to 2015 and now
accounts for 23% of our total operating revenue.
92.2%
6.6%
1.2%
FY2014 $14.07m
93.4%
3.9%2.7%
FY2015 $24.69m
76.2%
22.8%
1.0%
FY2016 $32.63m
For
per
sona
l use
onl
y
www.mitchellservices.com.au11
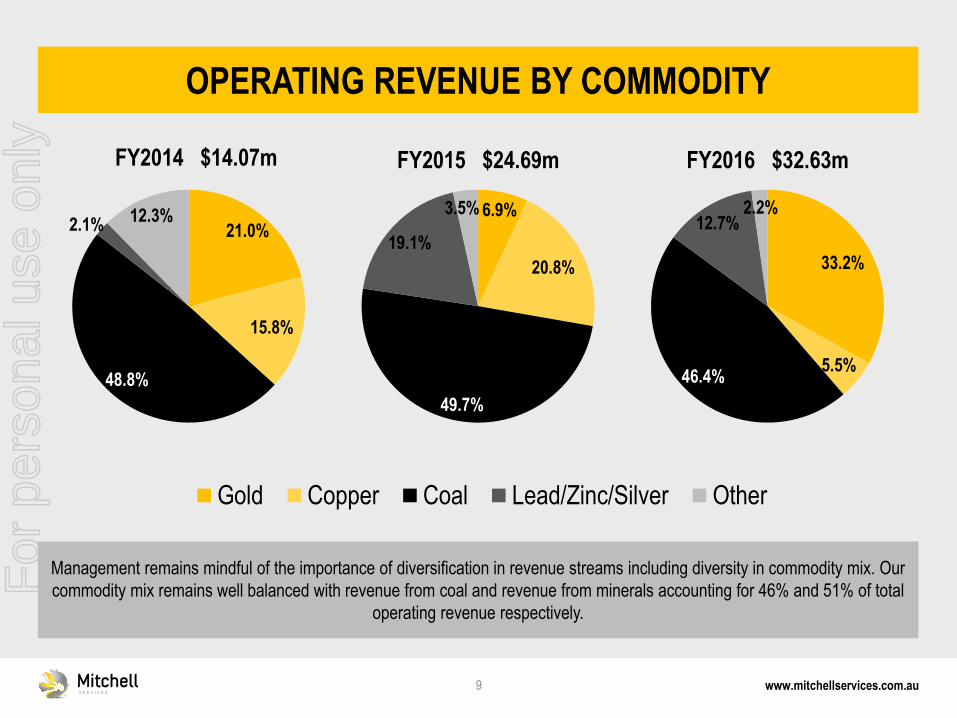
522
2,535
ADJUSTED EBITDA
Please note ADJUSTED EBITDA represents non-IFRS information that has not been subject to an audit or review at 30 June 2016 and is used internally by management to assess the underlying
performance of the business.
REPORTED
EBITDA ($000’s)
RESTRUCTURE
COSTS
NITRO ACQUISITION
& INTEGRATION
COSTS
UP FRONT
RAMP UP
COSTS FOR
2 YEAR
EVOLUTION
CONTRACT
ADJUSTED
EBITDA ($000’s)
For
per
sona
l use
onl
y

www.mitchellservices.com.au12
2005 2006 2007 2008 2009 2010 2011 2012 2013 2014 2015 2016
IS THE BOTTOM BEHIND US?
* Indexed to 24/7/2008
Indexed Average Listed Drilling Company –Share Price Movements* (Average is a non weighted average of daily close prices)
FY
97
FY
98
FY
99
FY
00
FY
01
FY
02
FY
03
FY
04
FY
05
FY
06
FY
07
FY
08
FY
09
FY
10
FY
11
FY
12
FY
13
FY
14
FY
15
FY
16
Mineral Exploration Meters Drilled (000’s)1
60
70
80
90
100
2013 2014 2015 2016
AUS Steam Coal Avg FOB Nwcstle (AU$/tonne)2
15
20
25
30
2013 2014 2015 2016
LBMA-Silver Price (AU$/oz)2
20
70
120
170
2013 2014 2015 2016
Iron Ore 62% China Imp CFR (AU$/tonne)2
1. Source: Australian Bureau of Statistics 2 Source: SNL Financial LC
For
per
sona
l use
onl
y

www.mitchellservices.com.au13
BUSINESS DEVELOPMENT
• Highly focused on lead generation
• Strong tender pipeline across Tier 1 and other clients requires equipment that
MSV already owns
• Increase in revenue growth demonstrates Mitchell Services ability to win
material size contracts with Tier 1 clients
• Conversion rate Tier 1 clients circa 50%
– Clients focused on safety and efficiency
– Majority of work is brownfield at mine or near mine
– Higher barriers to entry for competitors
• Conversion rate Tier 2 clients <50%
– Highly competitive
– Majority of work is greenfield exploration
– Competing against smaller drilling companies
• Increased focus on geographical diversification
Annual revenue from existing Tier one contracts Circa $30million based on current workloads
For
per
sona
l use
onl
y
www.mitchellservices.com.au14
MARKET OUTLOOK
• Competitive Profile of the market has continued to
improve
• New entrants are faced with barriers to entry such
as high capital cost and inability to secure financing
• Pipeline of identified opportunities continues to
grow
• Greenfield exploration sector showing some “green
shoots”
• Interest in gold has increased
• Ability to leverage to the upside as general market
conditions improve
For
per
sona
l use
onl
y
www.mitchellservices.com.au15
SUMMARY
• Mitchell Services’ vision is to be Australia’s leading provider of
drilling services to the global exploration, mining and energy
industries
• Tender pipeline provides opportunity for further revenue growth
• Mitchell Services can utilise acquired assets and generate a
superior return versus buying new equipment
• EBITDA positive at less than 30% annual rig utilisation in current
pricing environment
• Ability to leverage increased returns in an improving market
• Mitchell Services has an experienced board and
management team who have proven success
in business development and growthFor
per
sona
l use
onl
y
www.mitchellservices.com.au16
CONCLUSION
Questions?
For
per
sona
l use
onl
y
Recommended