18Annual Report
2018
A better experience

Content
Year in brief 2
Statement by the Managing Director 4
Internal strategy 6
Business model and growth strategy 8
Vision and values 10
The value creation model 12
Directors' Report 14
Service Business 18
Car Business 20
Fuel Business 22
Risks 24
Sustainability Report 28
Corporate Governance Statement 34
Board of Directors 38
Group Management 40
The Bilia share 41
Financial information 44
Consolidated Statement of Income
and Other Comprehensive Income 45
Consolidated Statement of Financial Position 47
Consolidated Statement of Changes in Equity 49
Consolidated Statement of Cash Flows 50
Notes to the Consolidated Financial Statements 52
Income Statement for Parent Company 89
Balance Sheet for Parent Company 90
Statement of Changes in Equity for Parent Company 92
Cash Flow Statement for Parent Company 93
Notes to the Parent Company Financial Statements 94
Signatures 104
Auditor’s report 105
Five-year Review 108
Definitions and Performance Measures 110
Information on Annual General Meeting 111
Articles of Association 112
This information has been made public in accordance
with the Securities Market Act on 18 March 2019.
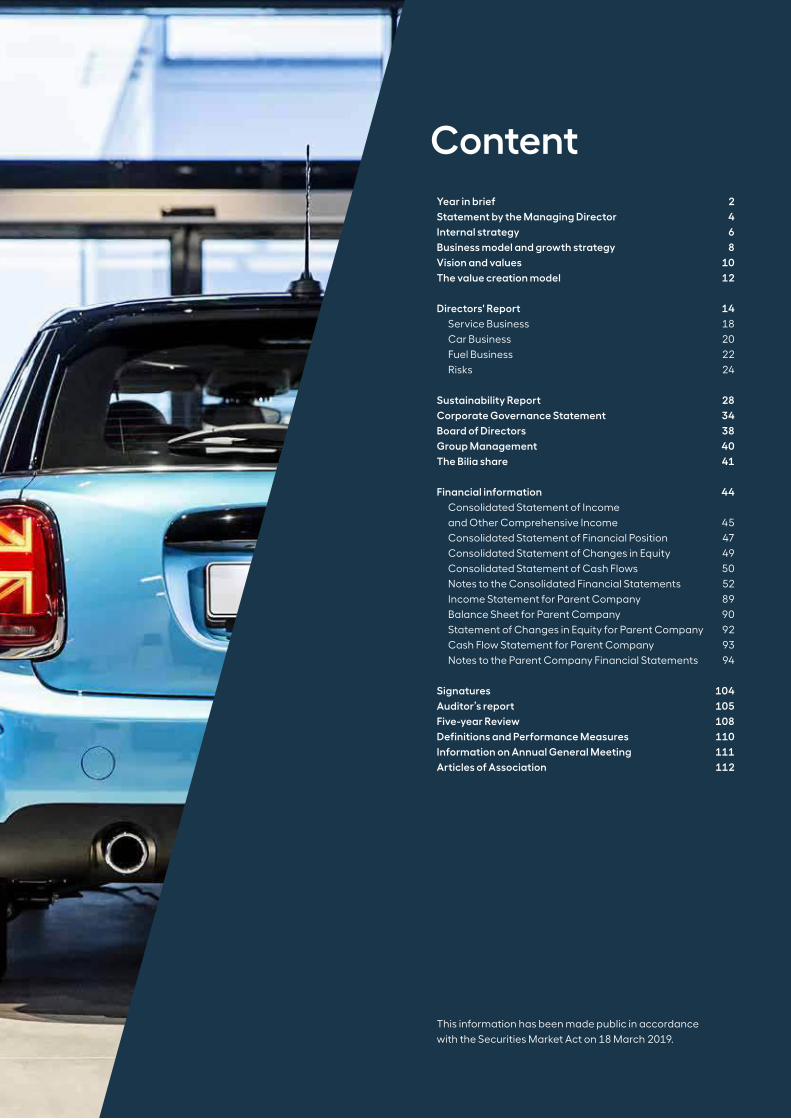
Year in brief2018 was a year of continued expansion and
growth despite fewer delivered new cars.
In Stockholm,
Bilia opened
Renault’s first
European
showroom for
electric cars.
Bilia’s strategic used
car initiative, Netbil
Begagnat, began in
Stockholm and Oslo.
Norwegian BMW
and MINI dealer
Bilsalongen AS
was acquired at
the beginning of
the year.
Sweden’s first
flagship store for
sales of Renault cars
opened in Gothenburg.
During Q4, Belgian
BMW and MINI dealer
Verstraeten NV
and Gent Store by
Verstraeten BVBA
was acquired.
Growth in turnover
3%
Number of facilities
134
FIND BILIA HERE
Sweden
Norway
Germany
Luxembourg
Belgium
Total turnover, SEK M
28,382
2 BILIA ANNUAL REPORT 2018
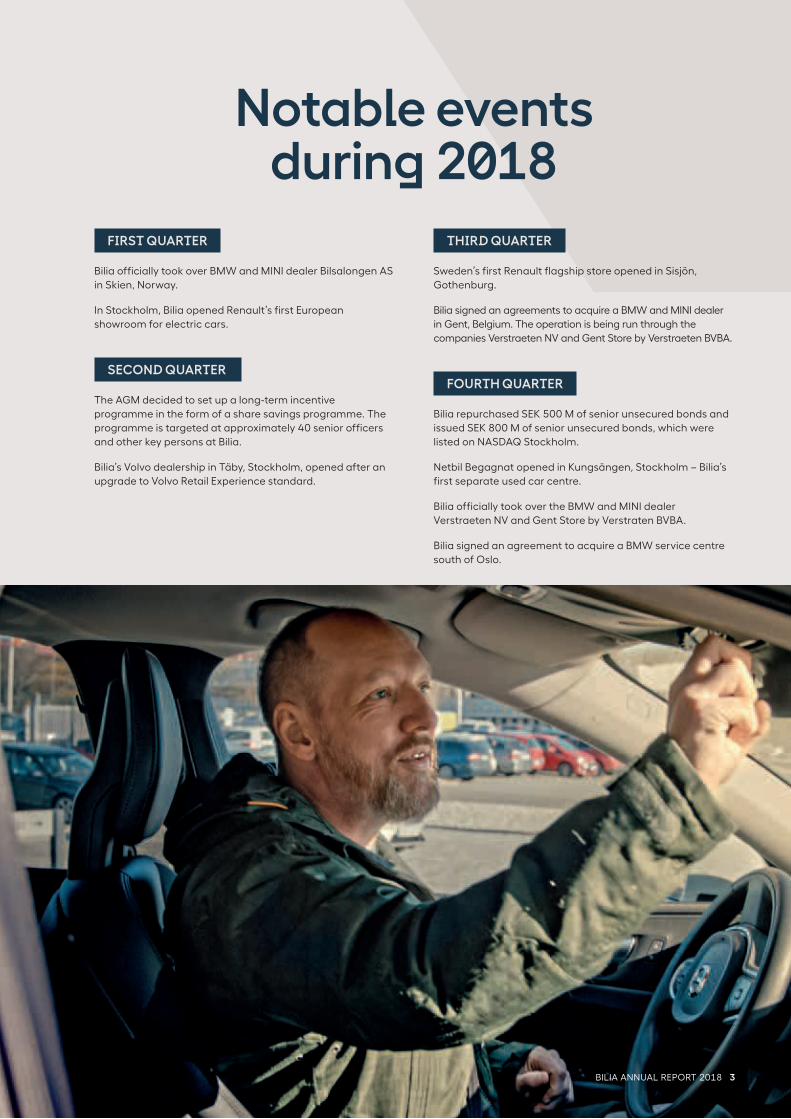
Notable events during 2018
FIRST QUARTER
Bilia officially took over BMW and MINI dealer Bilsalongen AS
in Skien, Norway.
In Stockholm, Bilia opened Renault’s first European
showroom for electric cars.
SECOND QUARTER
The AGM decided to set up a long-term incentive
programme in the form of a share savings programme. The
programme is targeted at approximately 40 senior officers
and other key persons at Bilia.
Bilia’s Volvo dealership in Täby, Stockholm, opened after an
upgrade to Volvo Retail Experience standard.
THIRD QUARTER
Sweden’s first Renault flagship store opened in Sisjön,
Gothenburg.
Bilia signed an agreements to acquire a BMW and MINI dealer
in Gent, Belgium. The operation is being run through the
companies Verstraeten NV and Gent Store by Verstraeten BVBA.
FOURTH QUARTER
Bilia repurchased SEK 500 M of senior unsecured bonds and
issued SEK 800 M of senior unsecured bonds, which were
listed on NASDAQ Stockholm.
Netbil Begagnat opened in Kungsängen, Stockholm – Bilia’s
first separate used car centre.
Bilia officially took over the BMW and MINI dealer
Verstraeten NV and Gent Store by Verstraten BVBA.
Bilia signed an agreement to acquire a BMW service centre
south of Oslo.
BILIA ANNUAL REPORT 2018 3
4 BILIA ANNUAL REPORT 2018
During the year we have continued to focus on our three
strategies: our business strategy, our growth strategy and our
internal strategy.
Our business strategy is to be a full-service supplier, a One
Stop Shop that provides everything a car owner needs. Our
service subscriptions offer customers simplicity in their car
ownership, while also enabling Bilia to meet our customers
regularly. We now have more than 105,000 active service
subscriptions, and we are aiming to have 130,000 within three
years. It is pleasing to see that we have increased the number
of service subscriptions for used cars during the year.
Our growth strategy is to grow by 5 to 10 per cent annually,
both organically and through acquisitions. Organic growth in
2018 came primarily from our Service Business, an increase
in turnover of around 8 per cent and adjusted for acquired
operations around 5 per cent. Recruiting more service
technicians is important to us, and in 2018 we employed
further some 30 people. During the year we continued to
increase our sales of glass and tyre services. Our newly opened
tyre centre in south Stockholm, with space for 50,000 wheels, is
now full, and we are planning a new tyre centre in the north of
the city. We currently store around 311,000 wheels within the
Group. The growth of our Car Business for 2018 was below our
financial goal, attributable to sales of new cars.
In January we acquired a BMW dealer in Skien, Norway,
and in November we signed an agreement to acquire a BMW
operation south of Oslo. In December we acquired a BMW and
MINI dealer in the Gent area of Belgium.
We launched our strategic used car initiative during the
year – Netbil Begagnat. In the years to come we are planning
to expand to a total of seven stand-alone centres, and we aim
to sell 25,000 cars in this sales channel within five years.
Our internal strategy focuses on a strong corporate culture
with driven and proud managers and employees. Together we
want to offer our customers a better experience by being the
best service company in the business. Having employees who
are proud and considerate is vital if we are to have satisfied
customers, and in the long run satisfied shareholders as well.
The results of the year’s employee survey were once again
very positive. The results put us among the top ten employers
in 2018 in the “Best Service Company” category.
2018 was a year marked by changes in the car market. The
tax system, above all, in Norway but also in Sweden steered
customers towards electric and hybrid cars. Several countries
in Europe took legal measures to place restrictions on vehicles
powered by fossil fuels in the future.
Intensive discussions are under way on fuel types, self-
driving vehicles, digitalisation, and the ability to sell directly
online. Alongside the manufacturers, with whom we enjoy
a good collaboration, we are a natural part of the ongoing
debate. The car brands we have chosen to work with are
strong and attractive, and at the forefront of development. We
divide these brands into three clusters:
• Volvo, Renault and Dacia, with whom we have long-standing
relations.
• BMW and MINI, where we are seeking to increase our repre-
sentation.
• Toyota and Lexus, where we are now a significant player on
the Swedish and Norwegian markets.
I am very proud of what Bilia's all employees have
performed during the year and together we have made
possible for Bilia to be a strong company that is ready and
well-equipped to continue performing well in a changing car
market.
Gothenburg, March 2019
Per Avander
Managing Director and CEO
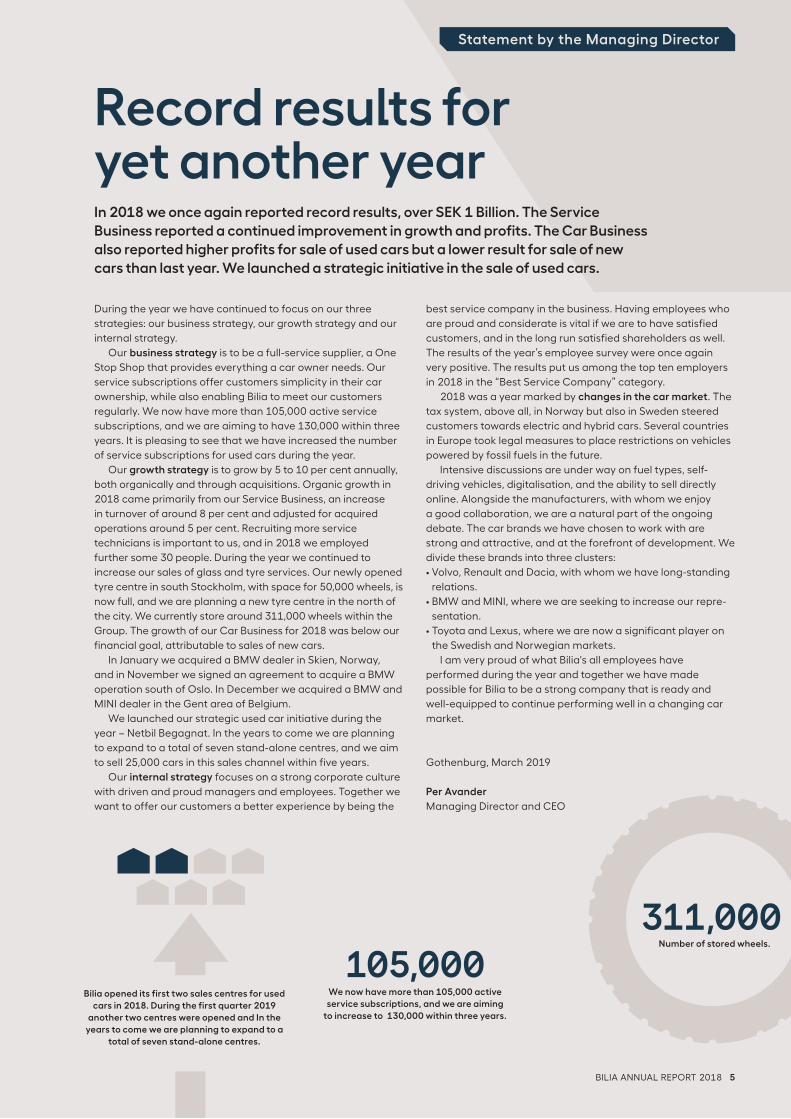
Record results for yet another yearIn 2018 we once again reported record results, over SEK 1 Billion. The Service
Business reported a continued improvement in growth and profits. The Car Business
also reported higher profits for sale of used cars but a lower result for sale of new
cars than last year. We launched a strategic initiative in the sale of used cars.
105,000We now have more than 105,000 active
service subscriptions, and we are aiming
to increase to 130,000 within three years.
Statement by the Managing Director
311,000Number of stored wheels.
Bilia opened its first two sales centres for used
cars in 2018. During the first quarter 2019
another two centres were opened and In the
years to come we are planning to expand to a
total of seven stand-alone centres.
BILIA ANNUAL REPORT 2018 5

Dedicated, competent employees are vital to Bilia’s continued success. At Bilia all
employees should have the ability to develop, and the working climate should cre-
ate dedication to achieve set goals. All of this requires good leadership, and Bilia's
priority is to identify and develop leaders within the Group. The internal strategy base
is a good leadership that creates proud and considerate employees. Bilia applies
situational leadership, whereby employees are supported in developing and achiev-
ing their optimum level of performance in every fase of their development. Being a
good manager requires being open to personal development, and all managers are
responsible for supporting and promoting the well-being of employees and teams.
The foundation of professional development within the company is the annual perfor-
mance appraisal which all employees have with their immediate manager.
To ensure that the internal strategy is working, annual employee surveys are carried
out using an independent research company. These surveys reveal strong results, as
well as a positive trend over time. All the indexes, such as leadership, commitment,
team efficiency and psychosocial work environment, are above average both in
general and in comparison with the industry. As to whether employees would recom-
mend Bilia as a workplace to someone they know, Bilia’s result is almost three times
the average. Follow-up of the employee survey with regard to improvement measures
is a priority. All of the company’s departments draw up action plans. The aim is to
identify areas of improvement, and to strive always to be even better.
The strong results qualified Bilia for the research company´s, Brilliant’s, Powered by
People Employee Experience Award Top 10 awards, in the category of best employee
experience for service and service companies.
Proud and considerate employees assure successStrong leadership is a success factor for Bilia. A leadership with
focus on dedication and competence make proud and considerate
employees which leads to satisfied customers. Satisfied customers
are fundamental to sustainable profit development, which keeps
shareholders satisfied.
Internal strategy
“The employee survey qualified Bilia in top 10
for the award ‘Powered by the People’”
Strong leadership
Satisfiedshareholders
Satisfiedcustomers
Proud employees
6 BILIA ANNUAL REPORT 2018
BILIA ANNUAL REPORT 2018 7
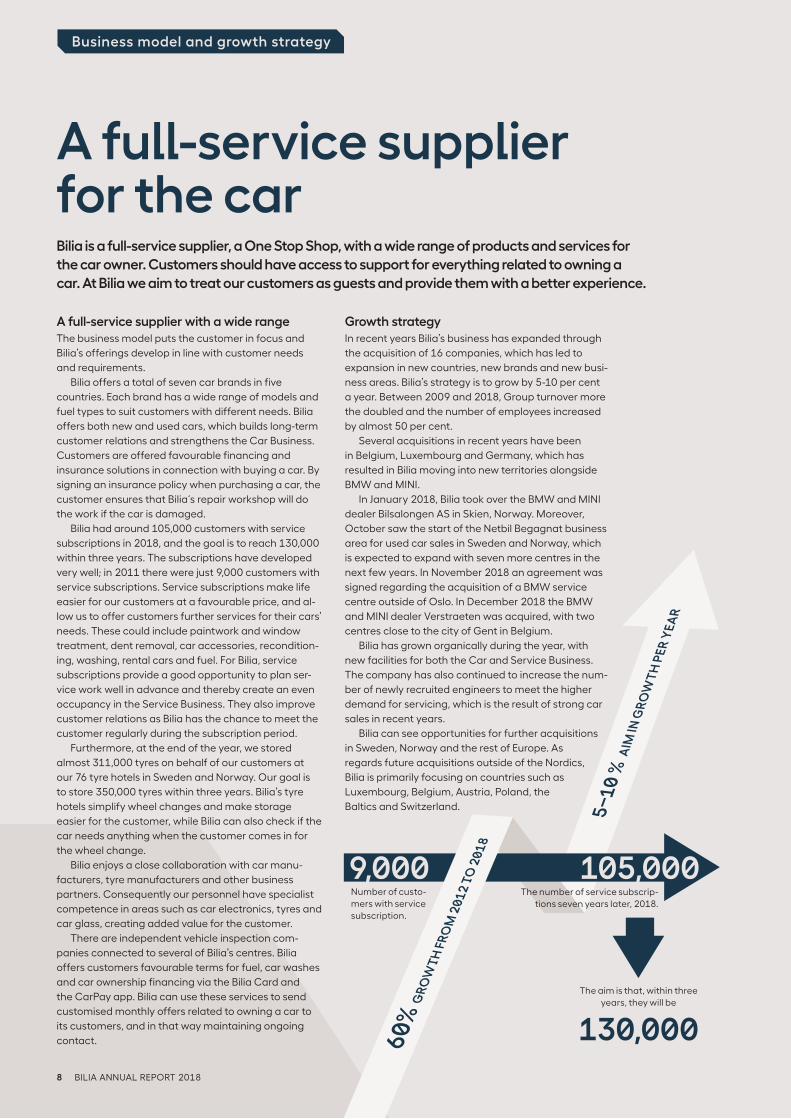
A full-service supplier for the car Bilia is a full-service supplier, a One Stop Shop, with a wide range of products and services for
the car owner. Customers should have access to support for everything related to owning a
car. At Bilia we aim to treat our customers as guests and provide them with a better experience.
Business model and growth strategy
A full-service supplier with a wide rangeThe business model puts the customer in focus and
Bilia’s offerings develop in line with customer needs
and requirements.
Bilia offers a total of seven car brands in five
countries. Each brand has a wide range of models and
fuel types to suit customers with different needs. Bilia
offers both new and used cars, which builds long-term
customer relations and strengthens the Car Business.
Customers are offered favourable financing and
insurance solutions in connection with buying a car. By
signing an insurance policy when purchasing a car, the
customer ensures that Bilia´s repair workshop will do
the work if the car is damaged.
Bilia had around 105,000 customers with service
subscriptions in 2018, and the goal is to reach 130,000
within three years. The subscriptions have developed
very well; in 2011 there were just 9,000 customers with
service subscriptions. Service subscriptions make life
easier for our customers at a favourable price, and al-
low us to offer customers further services for their cars’
needs. These could include paintwork and window
treatment, dent removal, car accessories, recondition-
ing, washing, rental cars and fuel. For Bilia, service
subscriptions provide a good opportunity to plan ser-
vice work well in advance and thereby create an even
occupancy in the Service Business. They also improve
customer relations as Bilia has the chance to meet the
customer regularly during the subscription period.
Furthermore, at the end of the year, we stored
almost 311,000 tyres on behalf of our customers at
our 76 tyre hotels in Sweden and Norway. Our goal is
to store 350,000 tyres within three years. Bilia’s tyre
hotels simplify wheel changes and make storage
easier for the customer, while Bilia can also check if the
car needs anything when the customer comes in for
the wheel change.
Bilia enjoys a close collaboration with car manu-
facturers, tyre manufacturers and other business
partners. Consequently our personnel have specialist
competence in areas such as car electronics, tyres and
car glass, creating added value for the customer.
There are independent vehicle inspection com-
panies connected to several of Bilia’s centres. Bilia
offers customers favourable terms for fuel, car washes
and car ownership financing via the Bilia Card and
the CarPay app. Bilia can use these services to send
customised monthly offers related to owning a car to
its customers, and in that way maintaining ongoing
contact.
Growth strategyIn recent years Bilia’s business has expanded through
the acquisition of 16 companies, which has led to
expansion in new countries, new brands and new busi-
ness areas. Bilia’s strategy is to grow by 5-10 per cent
a year. Between 2009 and 2018, Group turnover more
the doubled and the number of employees increased
by almost 50 per cent.
Several acquisitions in recent years have been
in Belgium, Luxembourg and Germany, which has
resulted in Bilia moving into new territories alongside
BMW and MINI.
In January 2018, Bilia took over the BMW and MINI
dealer Bilsalongen AS in Skien, Norway. Moreover,
October saw the start of the Netbil Begagnat business
area for used car sales in Sweden and Norway, which
is expected to expand with seven more centres in the
next few years. In November 2018 an agreement was
signed regarding the acquisition of a BMW service
centre outside of Oslo. In December 2018 the BMW
and MINI dealer Verstraeten was acquired, with two
centres close to the city of Gent in Belgium.
Bilia has grown organically during the year, with
new facilities for both the Car and Service Business.
The company has also continued to increase the num-
ber of newly recruited engineers to meet the higher
demand for servicing, which is the result of strong car
sales in recent years.
Bilia can see opportunities for further acquisitions
in Sweden, Norway and the rest of Europe. As
regards future acquisitions outside of the Nordics,
Bilia is primarily focusing on countries such as
Luxembourg, Belgium, Austria, Poland, the
Baltics and Switzerland.
The aim is that, within threeyears, they will be
130,000
5–
10
% A
IM IN
GR
OW
TH
PE
R Y
EA
R
60
% G
RO
WT
H F
RO
M 2
01
2 T
O 2
01
8
9,000 105,000Number of custo-mers with service subscription.
The number of service subscrip-tions seven years later, 2018.
8 BILIA ANNUAL REPORT 2018
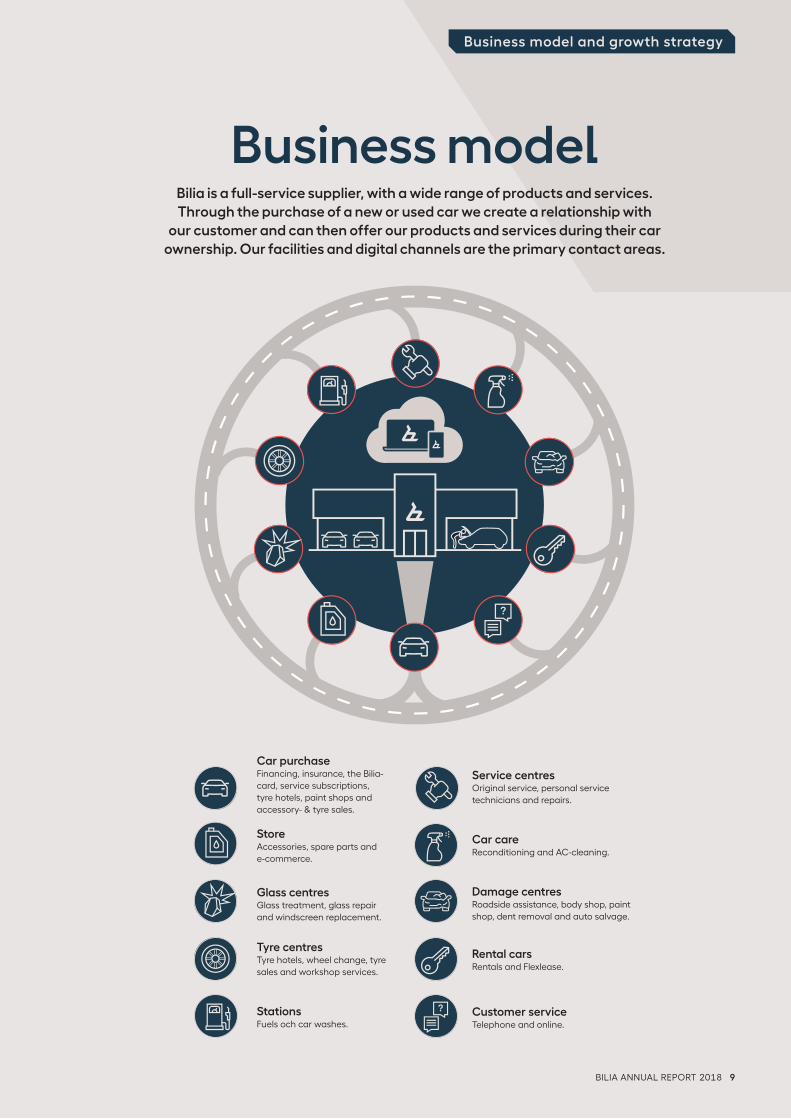
Business model and growth strategy
Bilia is a full-service supplier, with a wide range of products and services.
Through the purchase of a new or used car we create a relationship with
our customer and can then offer our products and services during their car
ownership. Our facilities and digital channels are the primary contact areas.
Business model
Car purchase Financing, insurance, the Bilia-card, service subscriptions, tyre hotels, paint shops and accessory- & tyre sales.
Store Accessories, spare parts and e-commerce.
Glass centresGlass treatment, glass repair and windscreen replacement.
Tyre centresTyre hotels, wheel change, tyre sales and workshop services.
StationsFuels och car washes.
Service centresOriginal service, personal service technicians and repairs.
Car careReconditioning and AC-cleaning.
Damage centresRoadside assistance, body shop, paint shop, dent removal and auto salvage.
Rental carsRentals and Flexlease.
Customer serviceTelephone and online.
BILIA ANNUAL REPORT 2018 9
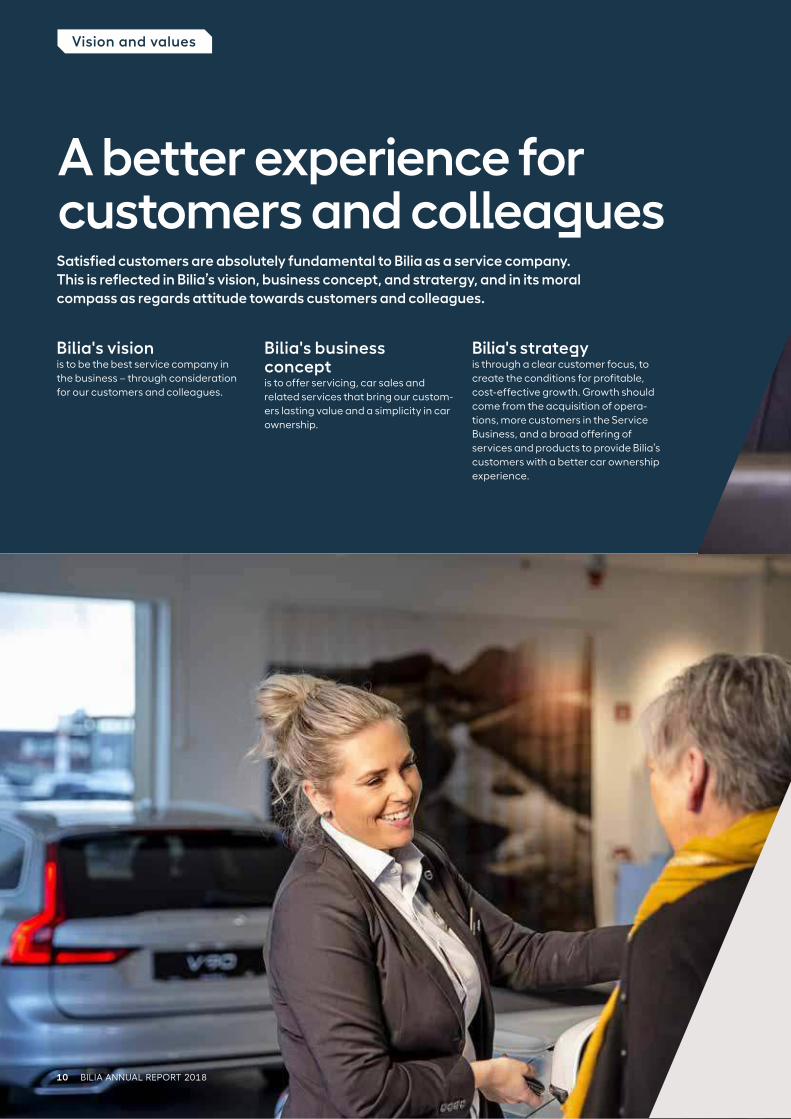
A better experience for customers and colleaguesSatisfied customers are absolutely fundamental to Bilia as a service company.
This is reflected in Bilia’s vision, business concept, and stratergy, and in its moral
compass as regards attitude towards customers and colleagues.
Bilia's visionis to be the best service company in
the business – through consideration
for our customers and colleagues.
Bilia's business concept is to offer servicing, car sales and
related services that bring our custom-
ers lasting value and a simplicity in car
ownership.
Bilia's strategyis through a clear customer focus, to
create the conditions for profitable,
cost-effective growth. Growth should
come from the acquisition of opera-
tions, more customers in the Service
Business, and a broad offering of
services and products to provide Bilia’s
customers with a better car ownership
experience.
Vision and values
10 BILIA ANNUAL REPORT 2018
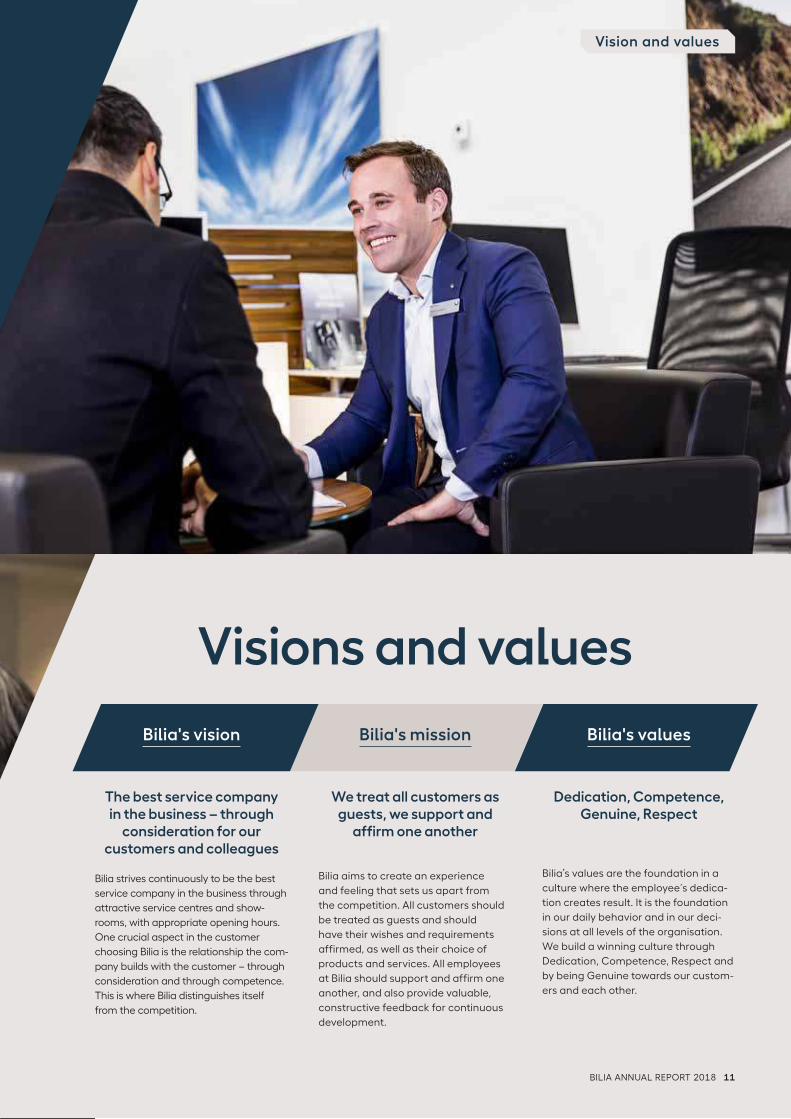
Bilia's vision Bilia's mission Bilia's values
We treat all customers as guests, we support and
affirm one another
Bilia aims to create an experience
and feeling that sets us apart from
the competition. All customers should
be treated as guests and should
have their wishes and requirements
affirmed, as well as their choice of
products and services. All employees
at Bilia should support and affirm one
another, and also provide valuable,
constructive feedback for continuous
development.
Dedication, Competence, Genuine, Respect
Bilia’s values are the foundation in a
culture where the employee´s dedica-
tion creates result. It is the foundation
in our daily behavior and in our deci-
sions at all levels of the organisation.
We build a winning culture through
Dedication, Competence, Respect and
by being Genuine towards our custom-
ers and each other.
Visions and values
The best service company in the business – through
consideration for our customers and colleagues
Bilia strives continuously to be the best
service company in the business through
attractive service centres and show-
rooms, with appropriate opening hours.
One crucial aspect in the customer
choosing Bilia is the relationship the com-
pany builds with the customer – through
consideration and through competence.
This is where Bilia distinguishes itself
from the competition.
Vision and values
BILIA ANNUAL REPORT 2018 11
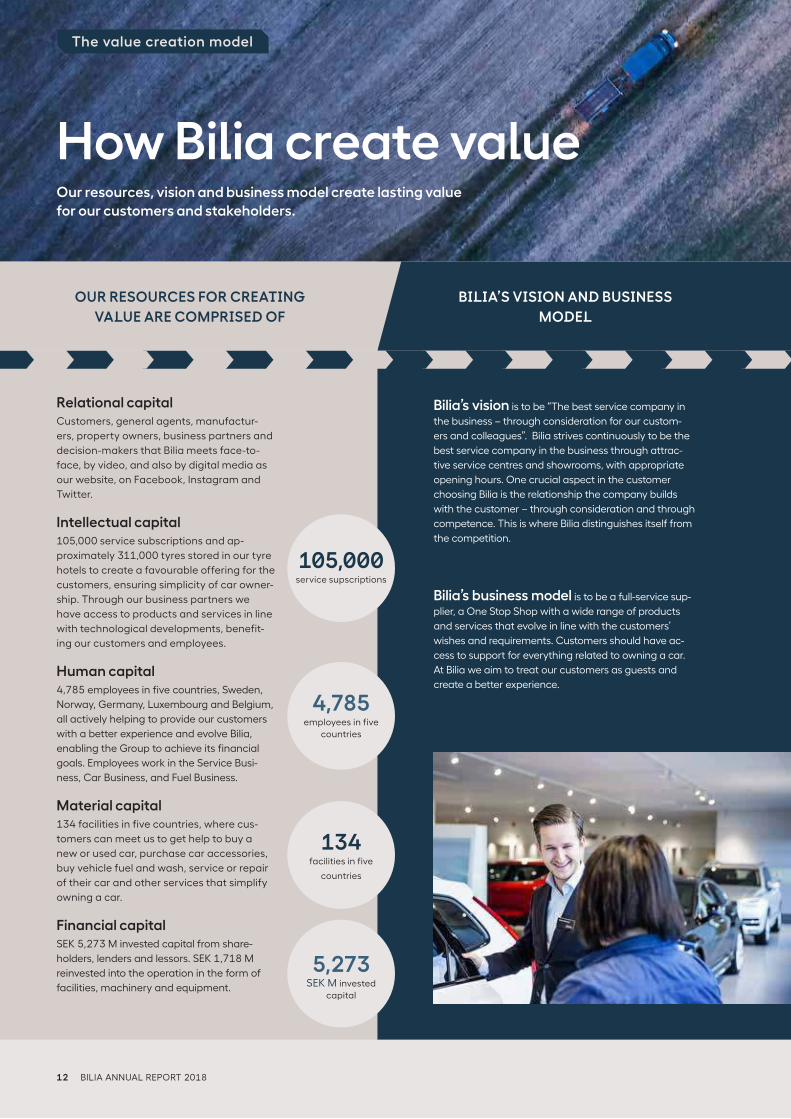
The value creation model
How Bilia create valueOur resources, vision and business model create lasting value
for our customers and stakeholders.
BILIA’S VISION AND BUSINESS
MODEL
OUR RESOURCES FOR CREATING
VALUE ARE COMPRISED OF
Bilia’s vision is to be “The best service company in
the business – through consideration for our custom-
ers and colleagues”. Bilia strives continuously to be the
best service company in the business through attrac-
tive service centres and showrooms, with appropriate
opening hours. One crucial aspect in the customer
choosing Bilia is the relationship the company builds
with the customer – through consideration and through
competence. This is where Bilia distinguishes itself from
the competition.
Bilia’s business model is to be a full-service sup-
plier, a One Stop Shop with a wide range of products
and services that evolve in line with the customers’
wishes and requirements. Customers should have ac-
cess to support for everything related to owning a car.
At Bilia we aim to treat our customers as guests and
create a better experience.
Relational capitalCustomers, general agents, manufactur-
ers, property owners, business partners and
decision-makers that Bilia meets face-to-
face, by video, and also by digital media as
our website, on Facebook, Instagram and
Twitter.
Intellectual capital105,000 service subscriptions and ap-
proximately 311,000 tyres stored in our tyre
hotels to create a favourable offering for the
customers, ensuring simplicity of car owner-
ship. Through our business partners we
have access to products and services in line
with technological developments, benefit-
ing our customers and employees.
Human capital4,785 employees in five countries, Sweden,
Norway, Germany, Luxembourg and Belgium,
all actively helping to provide our customers
with a better experience and evolve Bilia,
enabling the Group to achieve its financial
goals. Employees work in the Service Busi-
ness, Car Business, and Fuel Business.
Material capital134 facilities in five countries, where cus-
tomers can meet us to get help to buy a
new or used car, purchase car accessories,
buy vehicle fuel and wash, service or repair
of their car and other services that simplify
owning a car.
Financial capitalSEK 5,273 M invested capital from share-
holders, lenders and lessors. SEK 1,718 M
reinvested into the operation in the form of
facilities, machinery and equipment.
105,000service supscriptions
134facilities in five
countries
4,785employees in five
countries
5,273SEK M invested
capital
12 BILIA ANNUAL REPORT 2018
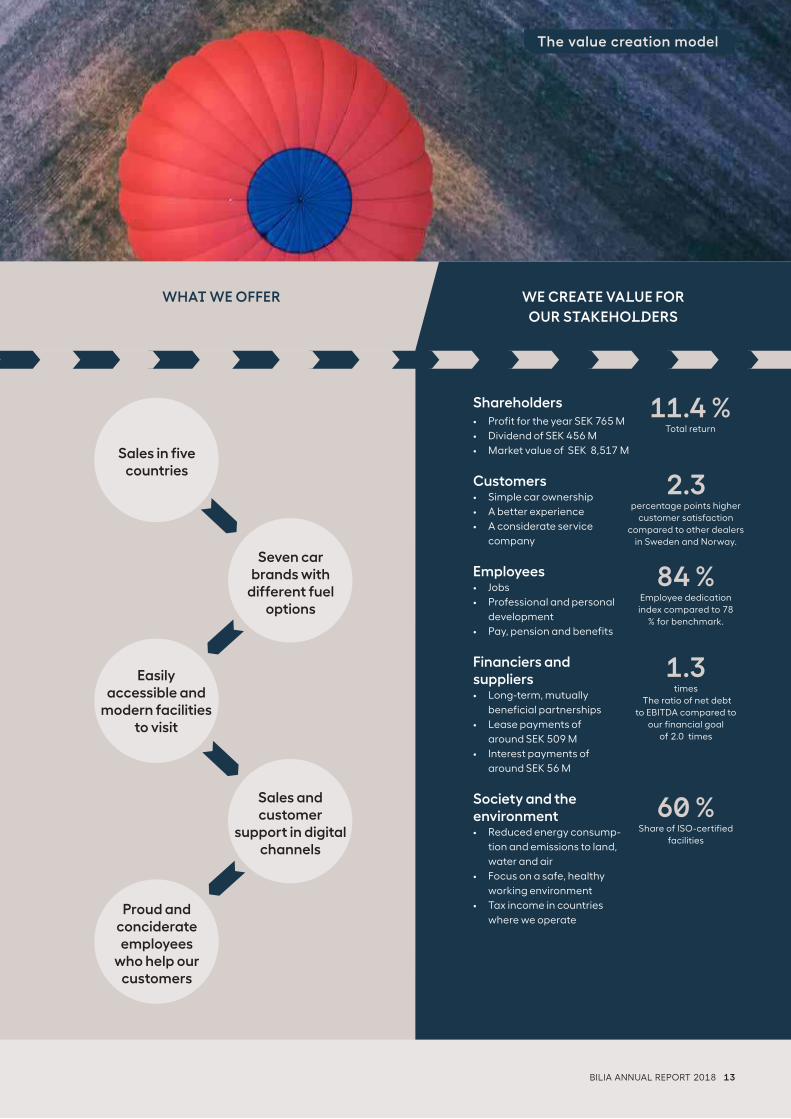
The value creation model
WHAT WE OFFER WE CREATE VALUE FOR
OUR STAKEHOLDERS
11.4 %Total return
Shareholders• Profit for the year SEK 765 M
• Dividend of SEK 456 M
• Market value of SEK 8,517 M
Customers• Simple car ownership
• A better experience
• A considerate service
company
Employees • Jobs
• Professional and personal
development
• Pay, pension and benefits
Financiers and suppliers• Long-term, mutually
beneficial partnerships
• Lease payments of
around SEK 509 M
• Interest payments of
around SEK 56 M
Society and the environment• Reduced energy consump-
tion and emissions to land,
water and air
• Focus on a safe, healthy
working environment
• Tax income in countries
where we operate
2.3percentage points higher
customer satisfaction compared to other dealers
in Sweden and Norway.
84 %Employee dedication index compared to 78
% for benchmark.
1.3times
The ratio of net debt to EBITDA compared to
our financial goal of 2.0 times
60 %Share of ISO-certified
facilities
Proud and conciderate employees
who help our customers
Sales and customer
support in digital channels
Easily accessible and
modern facilities to visit
Seven car brands with
different fuel options
Sales in five countries
BILIA ANNUAL REPORT 2018 13
Directors’ ReportGroup and Parent Company
The Board of Directors and Managing Director of Bilia AB (publ), Corp. ID no. 556112-5690, hereby submit their annual accounts and consolidated accounts for financial year 2018. The Bilia Group is referred to as Bilia. When only the Parent Company is being referred to, it is called Bilia AB.
Directors’ Report
Operations – generalBilia is one of Europe’s largest car dealership chains, with a
leading position in servicing and sales of new and used cars
and transport vehicles plus supplementary services such
as financing and insurance. Bilia has 134 facilities Sweden,
Norway, Germany, Luxembourg and Belgium plus two online
auction sites, one in Sweden and one in Norway.
Bilia’s vision is to be the best service company in the busi-
ness – through consideration for our cutomers and colleagues.
Bilia strives continuosly to be the best service company in the
business through attractive service centers and showrooms,
with appropriate opening hours.
Bilia’s Service Business includes a well-developed range of
services and service concepts that are continuously devel-
oped to simplify car ownership for the customers. The Service
Business includes workshop services, spare parts, store sales
and e-commerce.
Bilia's Car Business includes sales of both new and used
cars and transport vehicles, plus supplementary services such
as financing and insurance. Bilia sells cars from Volvo, BMW,
Toyota, Renault, Lexus, MINI and Dacia and transport vehicles
from Renault, Toyota and Dacia.
Bilia's Fuel Business comprises the sale of fuels and car
washes.
The Bilia shareThe total number of shares in the company at 31 December
2018 was 102,799,952, including holdings of own shares of
1,849,000. All issued shares are of Series A. It is also possible to
issue B shares according to the Articles of Association, but this
has not been done. All issued shares have equal rights in the
company and are entitled to one vote at the Annual General
Meeting (AGM). Bilia’s shares are listed on NASDAQ Stockholm
and can be transferred freely there, subject to the rules of the
exchange.
Bilia has no knowledge of any shareholders’ agreements
between Bilia’s shareholders.
The 2018 AGM authorised the Board of Directors to buy
back Bilia shares equivalent to no more than 10 per cent of
the total number of shares. At the same time, the Board was
Key figuresIn addition to financial definitions according to IFRS standards, key ratios are used as performance indicators to enable investors
and Bilia's management to gauge Bilia's performance. For definitions, see page 110.
2016 2017 2018
Bilia Group
Net turnover, SEK M 23,906 27,492 28,382
Operational earnings, SEK M 887 1,006 1,034
Operational margin, % 3.7 3.7 3.6
Operating profit, SEK M 841 923 943
Profit before tax, SEK M 833 896 922
Profit for the year from continuing operations, SEK M 657 691 734
Loss from discontinued operation, net after tax, SEK M –21 — —
Net profit for the year, SEK M 636 691 734
Earnings per share from continuing operations, SEK 6.40 6.75 7.25
Earnings per share, SEK 6.20 6.75 7.25
Ratio of net debt to EBITDA, times 0.7 1.0 1.3
Return on capital employed, % 26.4 23.4 20.5
Return on equity, % 27.9 27.0 26.5
Operating cash flow, SEK M 464 355 542
Equity/assets ratio, % 25 24 24
Equity per share, SEK 24 26 29
Number of employees, 31 December 4,327 4,708 4,785
14 BILIA ANNUAL REPORT 2018
also authorised to dispose of Bilia shares. Bilia did not exercise
the authorisation during 2018 to buy back or dispose of Bilia
shares and held 1,849,000 of its own shares at the end of the
year, which is 1.8 per cent of the total number of shares. These
shares were repurchased in 2017.
Notable events during the year• At the end of February 2018, Bilia opened a showroom for
Renault electric cars in Stockholm. It was Renault’s first show-
room for electric cars in Europe.• The AGM decided in April 2018 to set up a long-term incen-
tive programme in the form of a share savings programme.
The programme is targeted at approximately 40 senior offic-
ers and other key persons at Bilia.• In September 2018, Bilia entered into an agreement to
acquire a BMW and MINI dealer, Verstraeten NV and Gent
Store by Verstraeten BVBA, in Flanders, Belgium. For the past
three years, the companies have had an annual turnover of
approximately SEK 750 M and an average operating profit of
around SEK 40 M.• In October 2018, Bilia repurchased SEK 500 M of the
outstanding unsecured bond loans with ordinary maturity in
March 2021 at a price of 104 per cent. At the same time, a
new senior unsecured bond loan was issued to a value of SEK
800 M. The new bond loan has a variable interest rate on STI-
BOR 3-months plus 140 basis points and has a final maturity in
October 2023. The loan prospectus was published in Novem-
ber and was listed on NASDAQ Stockholm.• In October 2018, Bilia announced an investment in seven
new used car sales centres in Sweden and Norway. The range
of used cars is being extended to include more models of car,
both older vehicles and brands which Bilia does not represent
in its sales of new cars. Bilia expects to sell 25,000 cars via this
channel within a five-year period. • In November 2018, Bilia agreed to acquire an authorised BMW
service operation, Furubakken Bilverksted AS, south of Oslo,
Norway. The operation had a turnover of NOK 35 M in 2017,
with an average operating margin of 12.9 per cent over the past
three years. Bilia took over the centre on 1 January 2019.• In December 2018, Bilia took over operations at Verstraeten
NV and Gent Store by Verstraeten BVBA, following approval of
the acquisition by the Belgian competition authority.
Sales and earningsNet turnover amounted to SEK 28,382 M (27,492). For compa-
rable operations and adjusted for exchange rate fluctuations,
net turnover increased by approximately 1 per cent.
Operating profit amounted to SEK 943 M (923). Adjusted for
revenues and costs affecting comparability, operational earn-
ings amounted to SEK 1,034 M (1,006) with an operating mar-
gin of 3.6 per cent (3.7). The Service Business reported a profit
that was higher than last year, mainly attributable to higher
turnover. The Car Business reported a profit that was lower
than last year, and this is attributable to sales of new cars.
The Group’s underlying overheads increased by approxi-
mately 4 per cent compared with last year.
Overheads totalled 12.8 per cent in relation to net turnover,
which was 0.4 percentage points higher than last year. As a
“Bilia's vision is to be the best service
company in the business – through consideration for
our customers and colleagues”
Directors’ Report
BILIA ANNUAL REPORT 2018 15
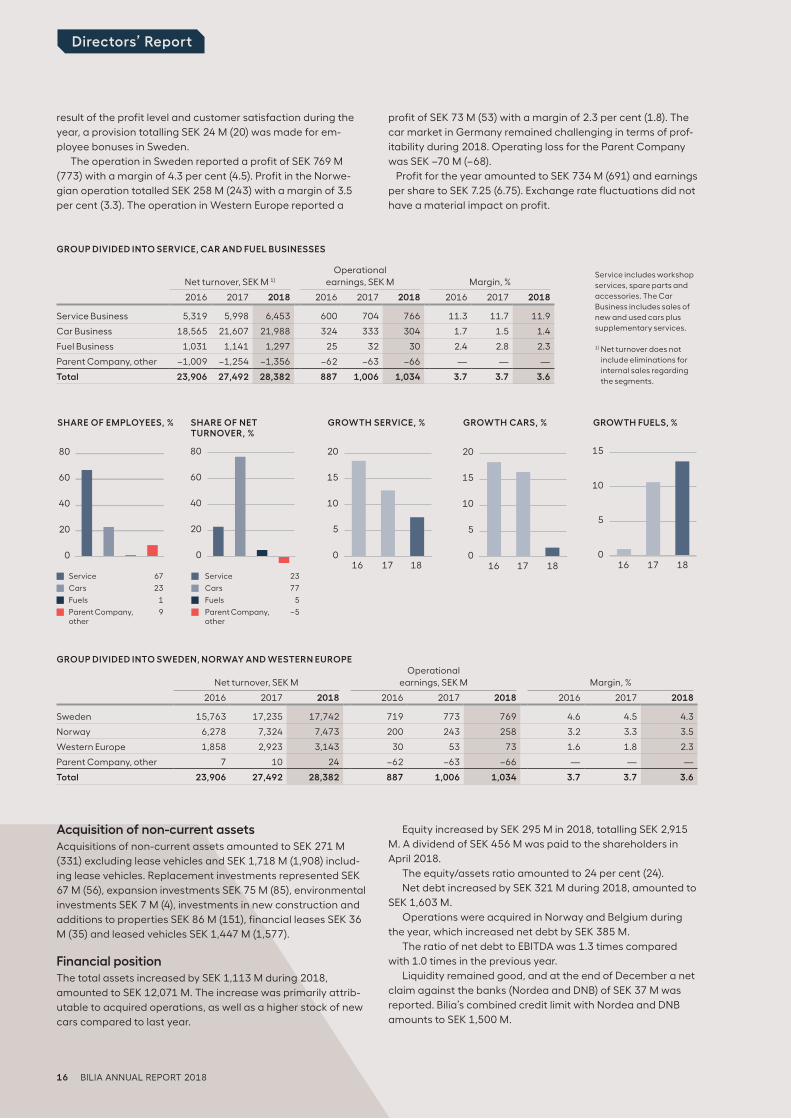
GROUP DIVIDED INTO SWEDEN, NORWAY AND WESTERN EUROPE
Net turnover, SEK M Operational
earnings, SEK M
Margin, %
2016 2017 2018 2016 2017 2018 2016 2017 2018
Sweden 15,763 17,235 17,742 719 773 769 4.6 4.5 4.3
Norway 6,278 7,324 7,473 200 243 258 3.2 3.3 3.5
Western Europe 1,858 2,923 3,143 30 53 73 1.6 1.8 2.3
Parent Company, other 7 10 24 –62 –63 –66 — — —
Total 23,906 27,492 28,382 887 1,006 1,034 3.7 3.7 3.6
Service 23
Cars 77
Fuels 5
Parent Company, –5 other
Service 67
Cars 23
Fuels 1
Parent Company, 9 other
SHARE OF EMPLOYEES, %
0
20
40
60
80
SHARE OF NET TURNOVER, %
0
20
40
60
80
GROWTH SERVICE, %
16 17 180
5
10
15
20
GROWTH CARS, %
0
5
10
15
20
16 17 18
GROWTH FUELS, %
0
5
10
15
16 17 18
result of the profit level and customer satisfaction during the
year, a provision totalling SEK 24 M (20) was made for em-
ployee bonuses in Sweden.
The operation in Sweden reported a profit of SEK 769 M
(773) with a margin of 4.3 per cent (4.5). Profit in the Norwe-
gian operation totalled SEK 258 M (243) with a margin of 3.5
per cent (3.3). The operation in Western Europe reported a
profit of SEK 73 M (53) with a margin of 2.3 per cent (1.8). The
car market in Germany remained challenging in terms of prof-
itability during 2018. Operating loss for the Parent Company
was SEK –70 M (–68).
Profit for the year amounted to SEK 734 M (691) and earnings
per share to SEK 7.25 (6.75). Exchange rate fluctuations did not
have a material impact on profit.
GROUP DIVIDED INTO SERVICE, CAR AND FUEL BUSINESSES
Net turnover, SEK M 1)
Operational earnings, SEK M
Margin, %
2016 2017 2018 2016 2017 2018 2016 2017 2018
Service Business 5,319 5,998 6,453 600 704 766 11.3 11.7 11.9
Car Business 18,565 21,607 21,988 324 333 304 1.7 1.5 1.4
Fuel Business 1,031 1,141 1,297 25 32 30 2.4 2.8 2.3
Parent Company, other –1,009 –1,254 –1,356 –62 –63 –66 — — —
Total 23,906 27,492 28,382 887 1,006 1,034 3.7 3.7 3.6
Service includes workshop
services, spare parts and
accessories. The Car
Business includes sales of
new and used cars plus
supplementary services.
1) Net turnover does not
include eliminations for
internal sales regarding
the segments.
Directors’ Report
Acquisition of non-current assets Acquisitions of non-current assets amounted to SEK 271 M
(331) excluding lease vehicles and SEK 1,718 M (1,908) includ-
ing lease vehicles. Replacement investments represented SEK
67 M (56), expansion investments SEK 75 M (85), environmental
investments SEK 7 M (4), investments in new construction and
additions to properties SEK 86 M (151), financial leases SEK 36
M (35) and leased vehicles SEK 1,447 M (1,577).
Financial positionThe total assets increased by SEK 1,113 M during 2018,
amounted to SEK 12,071 M. The increase was primarily attrib-
utable to acquired operations, as well as a higher stock of new
cars compared to last year.
Equity increased by SEK 295 M in 2018, totalling SEK 2,915
M. A dividend of SEK 456 M was paid to the shareholders in
April 2018.
The equity/assets ratio amounted to 24 per cent (24).
Net debt increased by SEK 321 M during 2018, amounted to
SEK 1,603 M.
Operations were acquired in Norway and Belgium during
the year, which increased net debt by SEK 385 M.
The ratio of net debt to EBITDA was 1.3 times compared
with 1.0 times in the previous year.
Liquidity remained good, and at the end of December a net
claim against the banks (Nordea and DNB) of SEK 37 M was
reported. Bilia’s combined credit limit with Nordea and DNB
amounts to SEK 1,500 M.
16 BILIA ANNUAL REPORT 2018
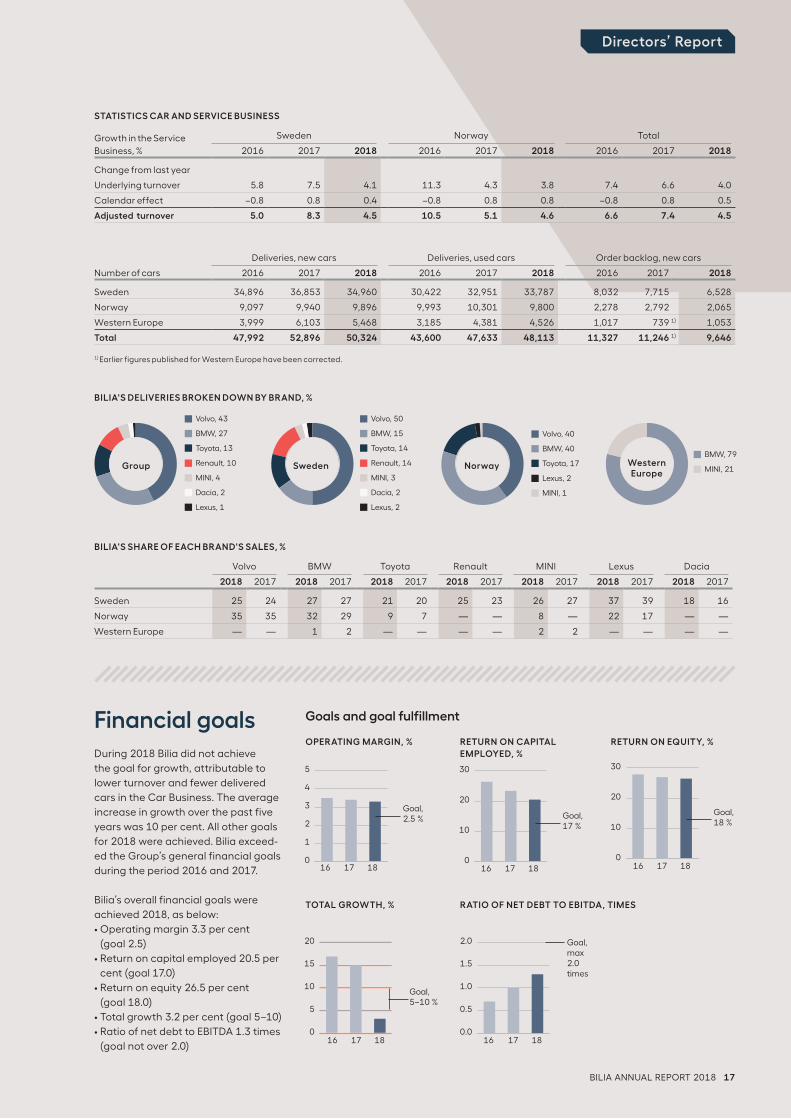
Goals and goal fulfillment
RETURN ON CAPITAL
E MPLOYED, %
TOTAL GROWTH, % RATIO OF NET DEBT TO EBITDA, TIMES
OPERATING MARGIN, %
0
1
2
3
4
5
16 17 18
Goal,2.5 %
RETURN ON EQUITY, %
0
10
20
30
16 17 18
Goal,18 %
0
10
20
30
16 17 18
Goal,17 %
16 17 180
5
10
15
20
Goal,5–10 %
16 17 180.0
0.5
1.0
1.5
2.0 Goal,max2.0times
Directors’ Report
Growth in the Service
Sweden
Norway
Total
Business, % 2016 2017 2018 2016 2017 2018 2016 2017 2018
Change from last year
Underlying turnover 5.8 7.5 4.1 11.3 4.3 3.8 7.4 6.6 4.0
Calendar effect –0.8 0.8 0.4 –0.8 0.8 0.8 –0.8 0.8 0.5
Adjusted turnover 5.0 8.3 4.5 10.5 5.1 4.6 6.6 7.4 4.5
BILIA'S SHARE OF EACH BRAND'S SALES, %
Deliveries, new cars Deliveries, used cars Order backlog, new cars
Number of cars 2016 2017 2018 2016 2017 2018 2016 2017 2018
Sweden 34,896 36,853 34,960 30,422 32,951 33,787 8,032 7,715 6,528
Norway 9,097 9,940 9,896 9,993 10,301 9,800 2,278 2,792 2,065
Western Europe 3,999 6,103 5,468 3,185 4,381 4,526 1,017 739 1) 1,053
Total 47,992 52,896 50,324 43,600 47,633 48,113 11,327 11,246 1) 9,646
1) Earlier figures published for Western Europe have been corrected.
Volvo
BMW
Toyota
Renault
MINI
Lexus
Dacia
2018 2017 2018 2017 2018 2017 2018 2017 2018 2017 2018 2017 2018 2017
Sweden 25 24 27 27 21 20 25 23 26 27 37 39 18 16
Norway 35 35 32 29 9 7 — — 8 — 22 17 — —
Western Europe — — 1 2 — — — — 2 2 — — — —
BILIA'S DELIVERIES BROKEN DOWN BY BRAND, %
Group Sweden Norway Western Europe
Volvo, 43
BMW, 27
Toyota, 13
Renault, 10
MINI, 4
Dacia, 2
Lexus, 1
Volvo, 50
BMW, 15
Toyota, 14
Renault, 14
MINI, 3
Dacia, 2
Lexus, 2
BMW, 79
MINI, 21
Volvo, 40
BMW, 40
Toyota, 17
Lexus, 2
MINI, 1
Financial goalsDuring 2018 Bilia did not achieve
the goal for growth, attributable to
lower turnover and fewer delivered
cars in the Car Business. The average
increase in growth over the past five
years was 10 per cent. All other goals
for 2018 were achieved. Bilia exceed-
ed the Group’s general financial goals
during the period 2016 and 2017.
Bilia’s overall financial goals were
achieved 2018, as below:
• Operating margin 3.3 per cent
(goal 2.5)
• Return on capital employed 20.5 per
cent (goal 17.0)
• Return on equity 26.5 per cent
(goal 18.0)
• Total growth 3.2 per cent (goal 5–10)
• Ratio of net debt to EBITDA 1.3 times
(goal not over 2.0)
STATISTICS CAR AND SERVICE BUSINESS
BILIA ANNUAL REPORT 2018 17
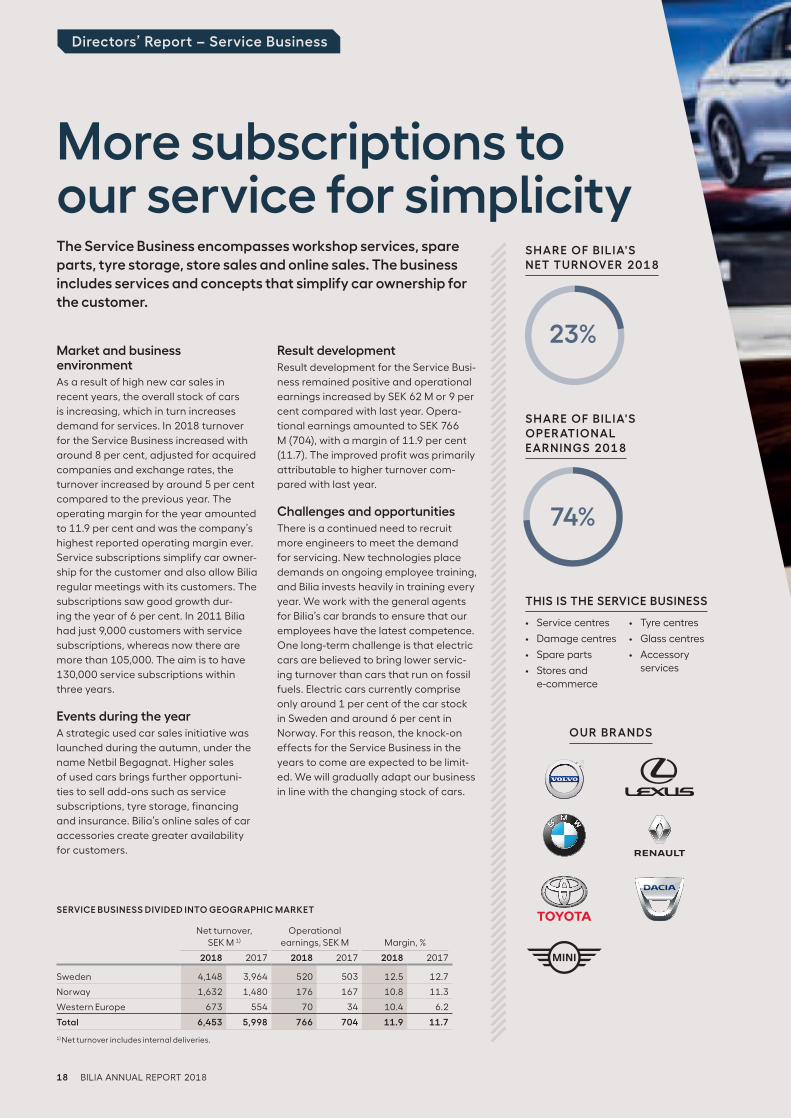
Market and business environmentAs a result of high new car sales in
recent years, the overall stock of cars
is increasing, which in turn increases
demand for services. In 2018 turnover
for the Service Business increased with
around 8 per cent, adjusted for acquired
companies and exchange rates, the
turnover increased by around 5 per cent
compared to the previous year. The
operating margin for the year amounted
to 11.9 per cent and was the company’s
highest reported operating margin ever.
Service subscriptions simplify car owner-
ship for the customer and also allow Bilia
regular meetings with its customers. The
subscriptions saw good growth dur-
ing the year of 6 per cent. In 2011 Bilia
had just 9,000 customers with service
subscriptions, whereas now there are
more than 105,000. The aim is to have
130,000 service subscriptions within
three years.
Events during the yearA strategic used car sales initiative was
launched during the autumn, under the
name Netbil Begagnat. Higher sales
of used cars brings further opportuni-
ties to sell add-ons such as service
subscriptions, tyre storage, financing
and insurance. Bilia’s online sales of car
accessories create greater availability
for customers.
Result developmentResult development for the Service Busi-
ness remained positive and operational
earnings increased by SEK 62 M or 9 per
cent compared with last year. Opera-
tional earnings amounted to SEK 766
M (704), with a margin of 11.9 per cent
(11.7). The improved profit was primarily
attributable to higher turnover com-
pared with last year.
Challenges and opportunitiesThere is a continued need to recruit
more engineers to meet the demand
for servicing. New technologies place
demands on ongoing employee training,
and Bilia invests heavily in training every
year. We work with the general agents
for Bilia’s car brands to ensure that our
employees have the latest competence.
One long-term challenge is that electric
cars are believed to bring lower servic-
ing turnover than cars that run on fossil
fuels. Electric cars currently comprise
only around 1 per cent of the car stock
in Sweden and around 6 per cent in
Norway. For this reason, the knock-on
effects for the Service Business in the
years to come are expected to be limit-
ed. We will gradually adapt our business
in line with the changing stock of cars.
More subscriptions to our service for simplicityThe Service Business encompasses workshop services, spare parts, tyre storage, store sales and online sales. The business includes services and concepts that simplify car ownership for the customer.
THIS IS THE SERVICE BUSINESS
SHARE OF BILIA'S NET TURNOVER 2018
SHARE OF BILIA'S OPERATIONAL EARNINGS 2018
OUR BRANDS
Directors’ Report – Service Business
• Service centres
• Damage centres
• Spare parts
• Stores and e-commerce
• Tyre centres
• Glass centres
• Accessory services
SERVICE BUSINESS DIVIDED INTO GEOGRAPHIC MARKET
Net turnover, SEK M 1)
Operational earnings, SEK M
Margin, %
2018 2017 2018 2017 2018 2017
Sweden 4,148 3,964 520 503 12.5 12.7
Norway 1,632 1,480 176 167 10.8 11.3
Western Europe 673 554 70 34 10.4 6.2
Total 6,453 5,998 766 704 11.9 11.7
1) Net turnover includes internal deliveries.
23%
74%
18 BILIA ANNUAL REPORT 2018
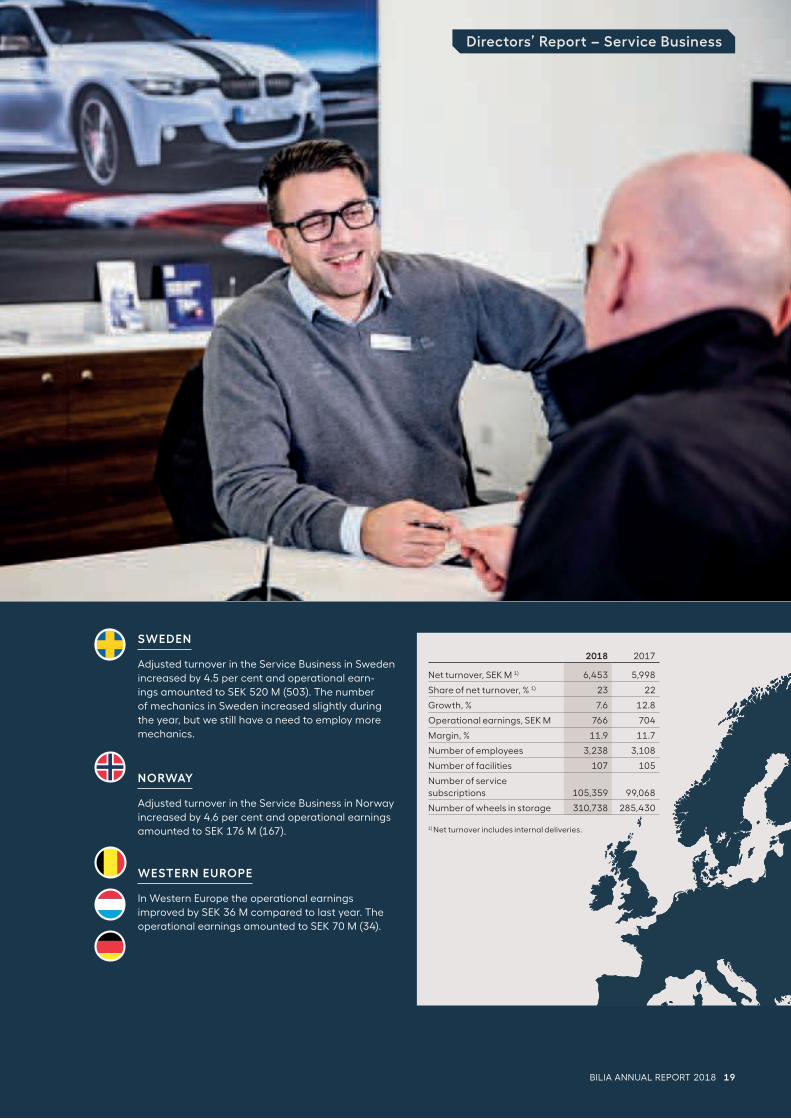
SWEDEN
Adjusted turnover in the Service Business in Sweden
increased by 4.5 per cent and operational earn-
ings amounted to SEK 520 M (503). The number
of mechanics in Sweden increased slightly during
the year, but we still have a need to employ more
mechanics.
NORWAY
Adjusted turnover in the Service Business in Norway
increased by 4.6 per cent and operational earnings
amounted to SEK 176 M (167).
WESTERN EUROPE
In Western Europe the operational earnings
improved by SEK 36 M compared to last year. The
operational earnings amounted to SEK 70 M (34).
Directors’ Report – Service Business
2018 2017
Net turnover, SEK M 1) 6,453 5,998
Share of net turnover, % 1) 23 22
Growth, % 7.6 12.8
Operational earnings, SEK M 766 704
Margin, % 11.9 11.7
Number of employees 3,238 3,108
Number of facilities 107 105
Number of service subscriptions 105,359 99,068
Number of wheels in storage 310,738 285,430 1) Net turnover includes internal deliveries.
BILIA ANNUAL REPORT 2018 19
Market and business environmentThe market for new cars remained at
a historically high level during 2018,
although slightly below the record year
of 2017. Increased demand of used
cars during the second half of the year
had a positive effect on the figures for
the Car Business. New tax rules for new
cars were introduced in Sweden, this
leading to higher new car demand dur-
ing the first half of the year, and lower
demand in the second half. Tax rules
also changed in Norway during the year,
promoting the sale of electric cars which
now represent as much as 6 per cent of
the car stock. In Germany, there contin-
ues to be stiff competition among the
German brands for new cars. In Belgium
and Luxembourg the market remains
strong overall, but the premium segment
that includes BMW has seen somewhat
weaker development.
Events during the yearBilia opened a showroom for Renault
electric cars in Täby centre, Stockholm.
New facilities for used cars were opened
in Stockholm and Oslo under the name
Netbil Begagnat. These are the first two
facilities in a strategic focus by Bilia on
sales of used cars.
At the beginning of 2018, Bilia acquired
a BMW and MINI dealership in Norway.
In cooperation with Bilia in Segeltorp, the
Alpine Cars brand opened its first centre
in the Nordic region. Bilia also acquired a
BMW and MINI dealer in Gent, Belgium
towards the end of the year.
Result developmentThe Car Business’s deliveries of new cars
and transport vehicles for comparable
operations decreased by 5 and in-
creased by 5 per cent respectively. Deliv-
eries of used cars were on a par with last
year. The turnover for the Car Business
increased by 2 per cent compared with
last year.
Operational earnings for the Car
Business were SEK 29 M lower than last
year. Profit from sales of used cars was
SEK 27 M higher than last year mainly
attributable to higher turnover and gross
profit margin. Profit from sales of new
cars was SEK 56 M lower than last year,
mainly attributable to fewer delivered
cars and to lower gross profit margin.
Challenges and opportunitiesSales of new cars are expected to re-
main at historically high levels in 2019, if
slightly lower than in 2018. If the current
economic boom starts to slow, this could
have an adverse effect on sales of new
cars. Sales of used cars do however tend
to increase in a market with lower sales
of new cars.
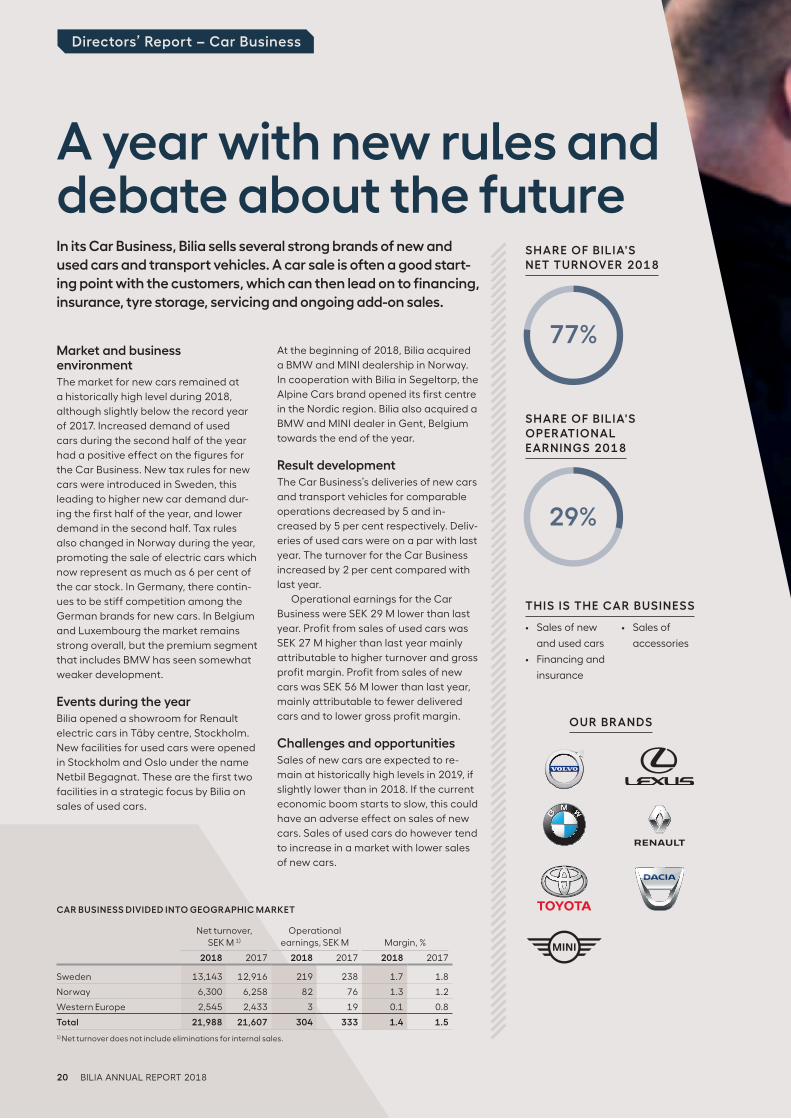
A year with new rules and debate about the futureIn its Car Business, Bilia sells several strong brands of new and used cars and transport vehicles. A car sale is often a good start-ing point with the customers, which can then lead on to financing, insurance, tyre storage, servicing and ongoing add-on sales.
Directors’ Report – Car Business
THIS IS THE CAR BUSINESS
OUR BRANDS
• Sales of new
and used cars
• Financing and
insurance
• Sales of
accessories
SHARE OF BILIA'S NET TURNOVER 2018
SHARE OF BILIA'S OPERATIONAL EARNINGS 2018
CAR BUSINESS DIVIDED INTO GEOGRAPHIC MARKET
Net turnover, SEK M 1)
Operational earnings, SEK M
Margin, %
2018 2017 2018 2017 2018 2017
Sweden 13,143 12,916 219 238 1.7 1.8
Norway 6,300 6,258 82 76 1.3 1.2
Western Europe 2,545 2,433 3 19 0.1 0.8
Total 21,988 21,607 304 333 1.4 1.5 1) Net turnover does not include eliminations for internal sales.
77%
29%
20 BILIA ANNUAL REPORT 2018
Directors’ Report – Car Business
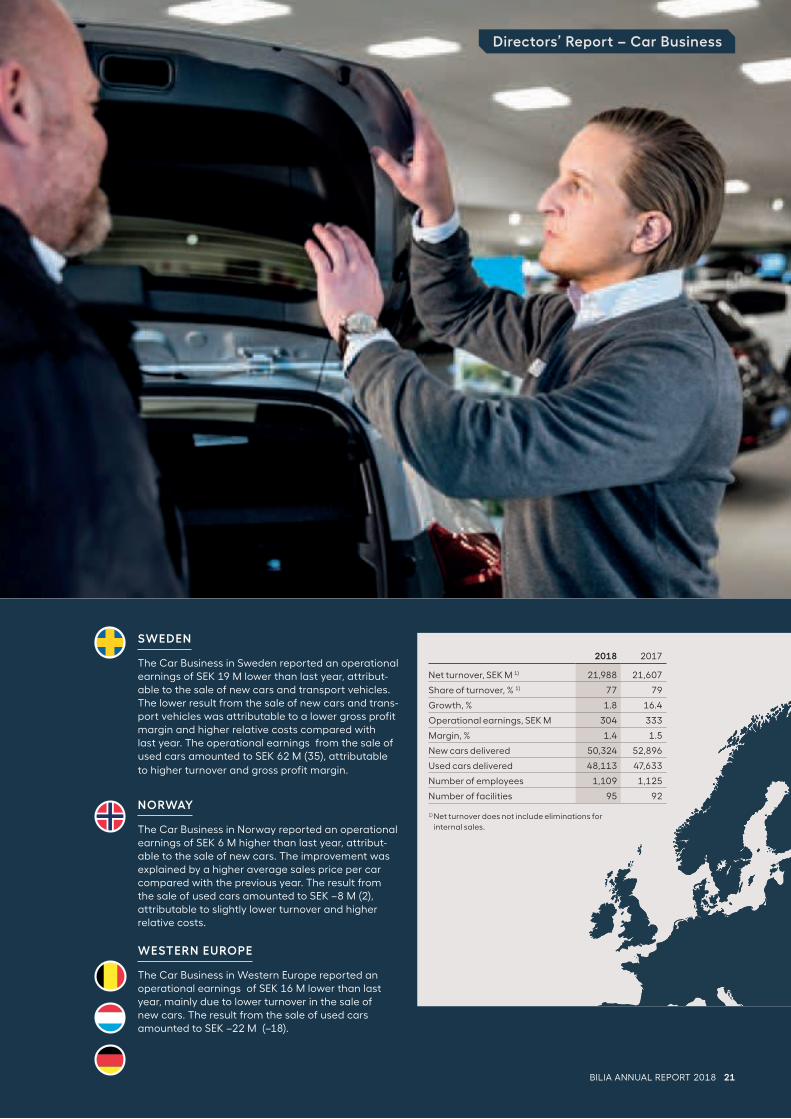
SWEDEN
The Car Business in Sweden reported an operational earnings of SEK 19 M lower than last year, attribut-able to the sale of new cars and transport vehicles. The lower result from the sale of new cars and trans-port vehicles was attributable to a lower gross profit margin and higher relative costs compared with last year. The operational earnings from the sale of used cars amounted to SEK 62 M (35), attributable
to higher turnover and gross profit margin.
NORWAY
The Car Business in Norway reported an operational earnings of SEK 6 M higher than last year, attribut-able to the sale of new cars. The improvement was explained by a higher average sales price per car compared with the previous year. The result from the sale of used cars amounted to SEK –8 M (2), attributable to slightly lower turnover and higher relative costs.
WESTERN EUROPE
The Car Business in Western Europe reported an operational earnings of SEK 16 M lower than last year, mainly due to lower turnover in the sale of new cars. The result from the sale of used cars amounted to SEK –22 M (–18).
2018 2017
Net turnover, SEK M 1) 21,988 21,607
Share of turnover, % 1) 77 79
Growth, % 1.8 16.4
Operational earnings, SEK M 304 333
Margin, % 1.4 1.5
New cars delivered 50,324 52,896
Used cars delivered 48,113 47,633
Number of employees 1,109 1,125
Number of facilities 95 92
1) Net turnover does not include eliminations for
internal sales.
BILIA ANNUAL REPORT 2018 21
Market and business environmentSales of fuel increased during the year,
despite dramatic rises in fuel prices. The
Swedish government introduced new
rules during the year, whereby fuel retail-
ers are obliged to help reduce climate
impact. This should be achieved by add-
ing biofuel to the petrol and diesel they
sell. Bilia uses suppliers that comply with
the necessary regulations.
Events during the yearBilia has continued to renew the Tanka
concept to make the service stations
more attractive and accessible to cus-
tomers, and this will continue in 2019.
The Tanka station in Sisjön, Gothen-
burg, is part of a pilot project whereby
customers can pay using the CarPay
smartphone app. In Strängnäs, central
Sweden, a new station has been estab-
lished in an attractive location close to
the E20 European Highway.
Result developmentThe Fuel Business is concentrated to
Sweden and profit for 2018 amounted
to SEK 30 M (32). Sales of fuels increased
by 14 per cent. Bilia’s customers did
166,966 car washes during the year, an
increase of 53 per cent. The upturn is
primarily due to updating and remodel-
ling at several car washes.
Challenges and opportunitiesThe market for automated service sta-
tions is growing, both as regards fuel and
car washes, particularly in southern Swe-
den. One challenge is getting approval
for new locations so as to enhance
service and replace facilities that have
had to close for environmental reasons.
The increasing number of electric and
hybrid cars could affect fuel sales in the
longer term, but also entail an opportu-
nity in potentially opening Bilia charging
stations in the future.
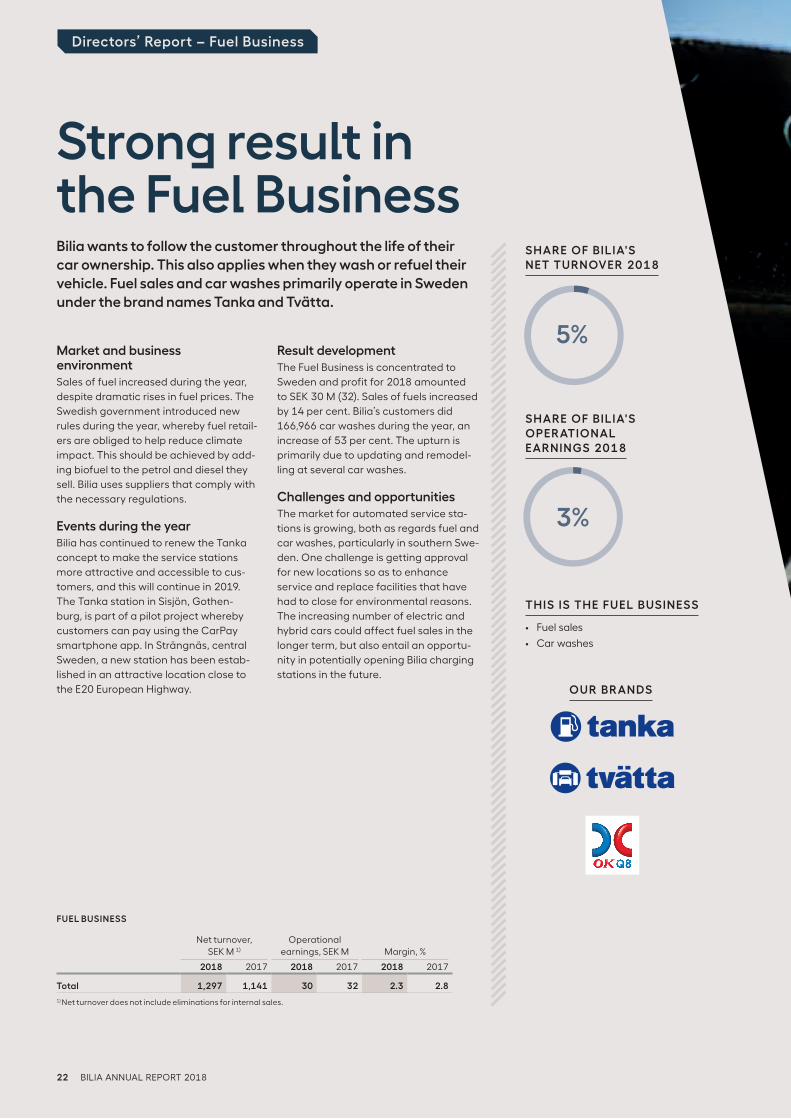
Strong result in the Fuel BusinessBilia wants to follow the customer throughout the life of their car ownership. This also applies when they wash or refuel their vehicle. Fuel sales and car washes primarily operate in Sweden under the brand names Tanka and Tvätta.
Directors’ Report – Fuel Business
THIS IS THE FUEL BUSINESS
OUR BRANDS
• Fuel sales
• Car washes
SHARE OF BILIA'S NET TURNOVER 2018
SHARE OF BILIA'S OPERATIONAL EARNINGS 2018
FUEL BUSINESS
Net turnover, SEK M 1)
Operational earnings, SEK M
Margin, %
2018 2017 2018 2017 2018 2017
Total 1,297 1,141 30 32 2.3 2.8 1) Net turnover does not include eliminations for internal sales.
5%
3%
22 BILIA ANNUAL REPORT 2018
Directors’ Report – Fuel Business
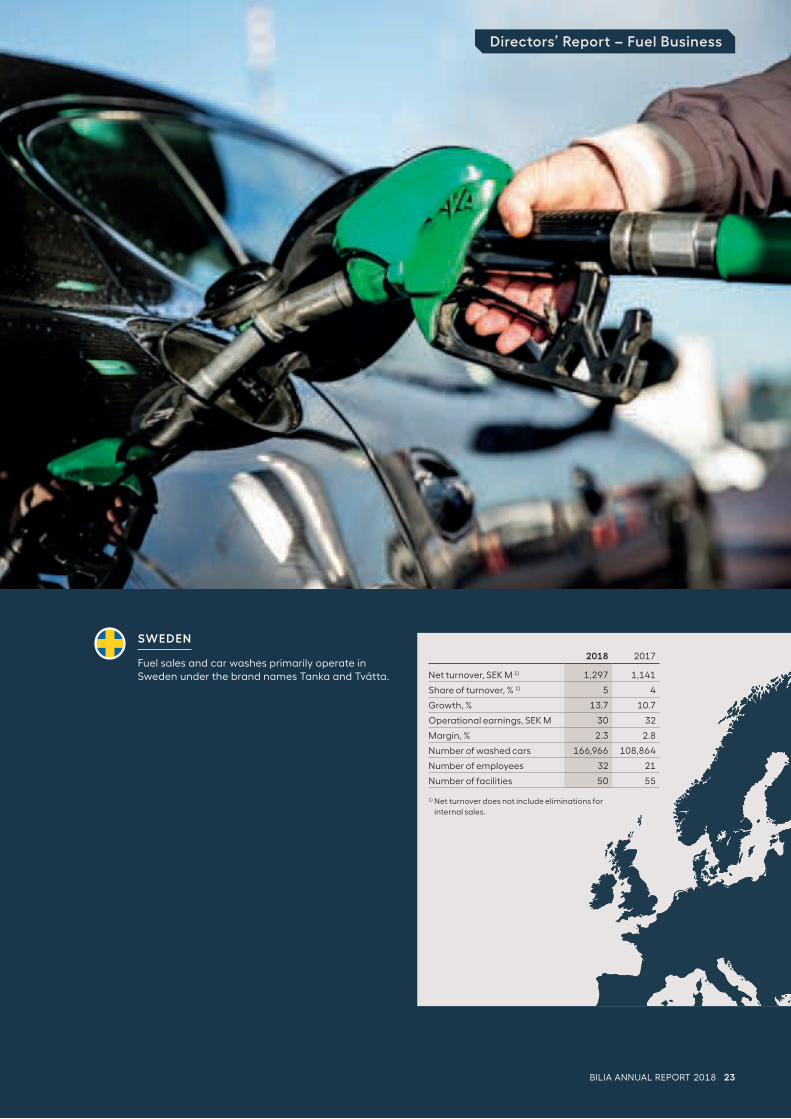
SWEDEN
Fuel sales and car washes primarily operate in Sweden under the brand names Tanka and Tvätta.
2018 2017
Net turnover, SEK M 1) 1,297 1,141
Share of turnover, % 1) 5 4
Growth, % 13.7 10.7
Operational earnings, SEK M 30 32
Margin, % 2.3 2.8
Number of washed cars 166,966 108,864
Number of employees 32 21
Number of facilities 50 55
1) Net turnover does not include eliminations for
internal sales.
BILIA ANNUAL REPORT 2018 23
Risk Risk description Opportunities and management
Market risks Demand for Bilia’s products and services are influenced by fluctuations in the business cycle. The Car Business is the part of the operations that are influenced most by changes in the business cycle. In a recession, some customers choose to post-pone or cancel their car purchase. Factors that influence the business cycle and the market trend include the labor market situation, stock market performance, opportunities for custo-mers to obtain financing, interest rate levels and fuel prices. Reduced demand for cars may also affect the value of cars in stock and cars sold with guaranteed residual values.
The Service and Fuel Businesses are less impacted by changes in the business cycle since cars require service, repairs and fuel regardless of the state of the economy. However, a deep recession could also affects the Service Business. Bilia conti-nuously work close to the general agents to understand the effects from the market development and to identify activities to secure a satisfying sales and financial development for the operations.
Risks related to
authorisation
agreements
Bilia’s core business consists of distribution and servicing of cars and transport vehicles in five countries. For expansion of car sales through new facilities in these countries, Bilia needs the approval from the respective general agent, as there is no special rules governing competition for new car sales in the EU. A car manufacture and/or general agent can unilaterally recall a sales authorisation and terminate the sales agre-ements with Bilia. Further, a car manufacture and/or general agent can become insolvent with disturbance in deliveries and uncertainties in the market as a result. Volvo, BMW and Toyota are the largest car manufacture/general agents for Bilia why changes in the collaboration can have significant impact on Bilias operations.
Good relations with car manufacture/general agents gives opportunities for continued expansion and reduce the risk for recall of sales authorisation for new car sales. Bilia is not dependent on one single manufacture/general agent but instead has several collaboration partners, which reduce the risk compared to being dependent on one single manufacture/general agent. Sales of used cars and the Service Business are not subject to the approval from the general agent for establishment and expansion of business.
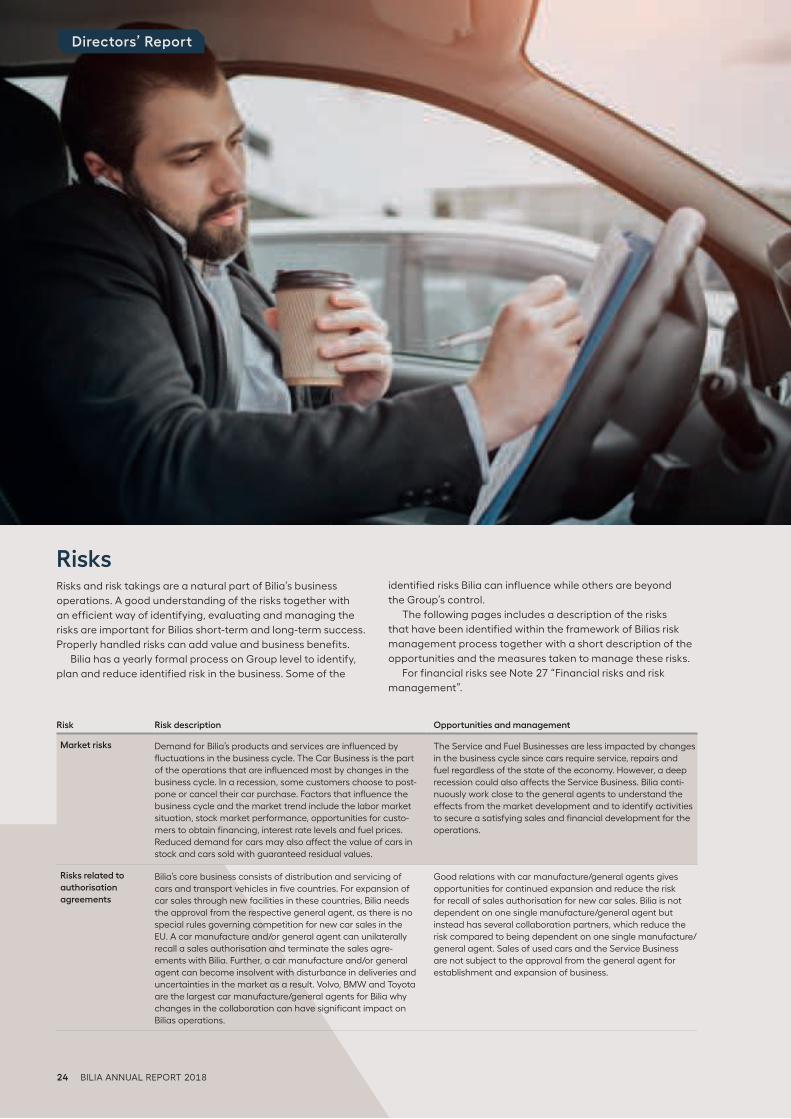
RisksRisks and risk takings are a natural part of Bilia’s business
operations. A good understanding of the risks together with
an efficient way of identifying, evaluating and managing the
risks are important for Bilias short-term and long-term success.
Properly handled risks can add value and business benefits.
Bilia has a yearly formal process on Group level to identify,
plan and reduce identified risk in the business. Some of the
Directors’ Report
identified risks Bilia can influence while others are beyond
the Group’s control.
The following pages includes a description of the risks
that have been identified within the framework of Bilias risk
management process together with a short description of the
opportunities and the measures taken to manage these risks.
For financial risks see Note 27 “Financial risks and risk
management”.
24 BILIA ANNUAL REPORT 2018
Risk Risk description Opportunities and management
Risks related to
authority decisions
and opinion
position
Regulatory decisions that lead to changes in taxes, charges, subsidies and restrictions on the products Bilia sells can influ-ence both demand for and the valuation of cars in stock and cars sold with guaranteed residual values. In the same way as authority decisions can effect Bilia's operations, the general opinion position can influence the future behavior of the custo-mers and hence Bilia's future sales.
New regulatory decisions can result in an improved or lower demand for Bilia's products and services. Adapting the opera-tions to changes in laws and regulations is an ongoing process and are achieved by monitoring relevant regulatory changes.
Risks for alternative
sales channels Bilia mainly operates through its own facilities, which is visited by the customer in connection with sale of cars and services. Bilia also has digital sales channels for used cars and accessories. These digital sales channels does not comprise a significant part of Bilia's net sales. During the year a car ma-nufacture/general agent has established an own digital sales channel and announced a future target for direct sales of cars to customers through this channel. If the car manufacture/general agents, which Bilia is collaborating with, should move, fully or partly, into own sales channels then Bilia's operations could be impacted negatively.
Bilia follows the development of alternative sales channels closely and will in the future make whatever adjustments as-sessed required. Bilia works close to the general agent in these matters and believes a future business model will be developed in consultation with the general agent to create loyal and satis-fied customers.
Risks related to
competitiveness
and technological
development
of the products
Bilia is dependent on the ability of the Group’s business partners to develop competitive products that incorporate the technological advances. One example is development of car models in line with the ongoing discussion about future fuel alternatives. The current subsidies on environmental friendly cars, especially in Sweden and Norway, increase the demand on car models that fulfills these requirements. Future technological development of the products can influence Bilia’s Service Business for example in relation to the complexity of the products and/or motor technique.
Bilias business partners currently offer several alternative fuel options and assesses to be well equipped to follow the technological development in long-term. Our business partners currently offer environmental friendly cars, which match the current subsidies from the governments. Bilia's business part-ners are financially well established business with resources to long-term assure the competitiveness and technological development of the products.
Risks related to
development of
own concepts and
services
To maintain and strengthen its competitiveness, Bilia must develop concepts and services that appeal to the customers. Bilia’s ability to develop new concepts and services also helps strengthen the suppliers’ brands and create customer loyalty.
Bilia continuously develops products and services based on the customers need and requests. One example of concepts and services is tyre hotels. This development work requires resources. Bilia is confident that the Group has the resources required to remain in the forefront of service development.
Risks related to
key persons and
coworkers
There is a future risk that Bilia will not be successful in recrui-ting or keeping the competent people to the extent that is requested. Both management and coworkers contribute with knowledge about the business and the operation and actively participate in developing new concepts and services. People with a vehicle technical competence is a scarce resource, which may influence future growth within the Service Business negatively.
Bilia has very good results in the working climate analysis com-pared to other companies. Bilia focus on keeping and further improve the environment for our key person and coworkers to be an attractive employer. Bilia works actively together with the schools to contribute to make the vehicle technician profession more attractive and to contribute to a good quality on the education that is offered.
Risks related to
facilities and
environment
Bilia leases most of the facilities for the operations. As a tenant, Bilia may become dismissed from the leased at the end of the rental period, which would mean that Bilia would lose strategic business locations.
If contamination should be confirmed at any of Bilia’s facilities, there is a risk that Bilia may be held responsible for decontamination of the facility. Such decontamination may be associated with considerable costs.
To lease facilities give Bilia a long-term flexibility to adjust the location of the facilities to be favorable for the operations. Bilia works, as an integrated part of its operations, to minimise the negative effect on the environment. 60 per cent of the facili-ties are certifies according to ISO 14001. These certifications means clear processes to discover and act on any deviations.
Risks related to
acquisitionsAs part of realising BIlia's strategic growth target, businesses are acquired. If the status of the acquired operations were to differ significantly from what was known before the acquisi-tion, or if the integration of the operations would fail, this could influence Bilia negatively.
Through acquisitions, Bilia improves its operations from a stra-tegic and financial perspective. New operations are continu-ously integrated and follow-up versus expected performance is made during the integration period to early identify and act on any deviations.
IT related risks Bilia's operations are dependent on a well working IT-environ-ment. A centralized and coordinated IT-environment gives the Group advantages but at the same time mean higher sensitiv-ity for disturbances such as for example downtime of significa-tions operational systems. Further, there is a risk for external attacks on the IT-environment through viruses or hacking, alternatively trespassing and information theft.
A centralised and coordinated IT-environment gives the Group advantages such as lower costs and centralised competence, which favors the development work within the IT-area. Actions have been taken to minimise effects of downtime and external attacks on the IT-environment. Bilia works continuously to update the processes to manage external attacks on the IT-environment and analyses existing and new risks and threats.
Risks related to
non-compliance of
laws and rules
A number of laws and rules regulates Bilia's operation. Bilia's ability to comply with laws and rules and deliver high quality in all customer relations is crucial for the customer confidence. An inability to comply with laws and rules and deliver high quality to customers may result in legal or regulatory penalties, financial losses and a negative impact on the customer confi-dence in the Bilia brand.
To comply with laws and rules and to minimise the risk expo-sure Bilia has developed a framework, which includes the Bilia Code of Conduct, competition, group policies and steering documents. For certain areas such as competition and integra-tion there are special compliance programs with training for the Group's coworkers.
Directors’ Report
BILIA ANNUAL REPORT 2018 25
tive in a subsidiary are entitled to terminate their own employ-
ment and receive 24 months’ salary, less any salary received
from other service during the last 12 months. Bilia’s bank,
service and distribution agreements all contain clauses to the
effect that the agreement may be terminated if the company
is transferred to a new owner.
Share issuesDuring 2016, Bilia sold 94,000 warrants to senior officers,
which corresponded to a new issue of SEK 1 M. This did not
lead to any dilution effect at year-end. During 2016, a private
placement of 1,398,484 shares was carried out, corresponding
to SEK 115 M, as partial payment of the purchase considera-
tion for an acquisition.
For further information see Note 13 “Earnings per share”.
Stock splitDuring 2017, in accordance with a resolution by the AGM, the
number of shares was increased by dividing each share into
two shares (a 2-for-1 stock split) for the purpose of increasing
trade in the share. The record date for the stock split was 7
June 2017.
Holding of own sharesThe 2018 AGM gave the Board of Directors a new authorisa-
tion to buy back the company’s own shares. No shares were
repurchased during 2018. A total of 1,849,000 shares were
repurchased during 2017 for a total price of SEK 147 M, which
amounts to an average price per share of SEK 79.50. Bilia’s
shares have a quotient value of SEK 2.50.
Guidelines for remuneration to senior officersA fee decided by the Annual General Meeting (AGM) is paid to
the Chairman and members of the Board.
The AGM for 2018 has decided on the following guidelines
for compensation to the management. For detailed information,
see the minutes of the AGM at the company’s website, bilia.com.
Remuneration to the Managing Director and other mem-
bers of the Group Management consists of basic salary,
variable remuneration, other benefits and pension. By “other
members of the Group Management” is meant the Deputy
Managing Director, the CFO of Bilia AB, and the Managing Di-
rector of Bilia Personbil as, Norway. For the composition of the
Group Management and remuneration, see Note 8, “Employ-
ees, personnel costs and remunerations for senior officers”.
The distribution between basic salary and variable salary
should be commensurate with the Group Management’s pow-
ers and responsibilities. The variable remuneration paid to the
Managing Director and other members of the Group Manage-
ment may not exceed 50 per cent of the individual’s basic sal-
ary. The variable remuneration is based on performance goals
and individual goals.
Premium-based pension benefits and other benefits for the
Managing Director and other senior officers are payable as a
part of the total remuneration.
The Board of Directors will propose to the 2019 AGM that
the above compensation principles should continue to apply
up to the 2020 AGM.
In the event of significant changes in the company’s owner-
ship structure that affect the conditions or content of their
jobs, the MD and the Deputy MD of Bilia AB and one top execu-
Directors’ Report
26 BILIA ANNUAL REPORT 2018
Parent CompanyBilia AB is responsible for the Group’s management, strategic
planning, purchasing, public relations, business development,
marketing, HR, real estate activities, accounting and financ-
ing. The Parent Company’s operating loss amounted to SEK 70
M (loss: 68).
Future outlookIndustry analysts predict that the car markets where Bilia
is represented will be at a slightly lower level in 2019 than in
2018, but still at a high level from a historical perspective. The
service markets, where Bilia is represented, are expected to
remain at the same level in 2019 as they were in 2018. Owing
to the fact that Bilia’s earnings are affected by various factors
beyond the company’s control, no earnings forecast is made.
A review of the most important earnings- impacting factors is
provided in the sensitivity analysis in Note 27, “Financial risks
and risk management”.
Proposed treatment of unappropriated earningsThe Board of Directors proposes that the earnings available
for distribution, SEK 976 M, be disposed of as follows:
SEK M
Cash dividend, SEK 4.75 per share 1) 480
To be carried forward 496
Total 976
1) Based on the number of shares outstanding at 31 December 2018, 100,950,952 (excluding holdings of own shares, 1,849,000).
Directors’ Report
Statement of Board of Directors regarding proposed distribution of profitsThe Group’s equity has been calculated according to the ac-
counting rules set forth in the International Financial Report-
ing Standards (IFRS). The Parent Company’s equity has been
calculated in accordance with the Swedish Financial Reporting
Board’s recommendation RFR 2, “Accounting for Legal Entities”.
The proposed dividend consists of a cash dividend of SEK
4.75 per share, totalling SEK 480 M. The Group’s equity/assets
ratio will thereafter amount to about 20 per cent.
The proposed cash dividend is consistent with Bilia’s dividend
policy, which states that at least 50 per cent of the net profit for
the year should be distributed to the shareholders, and that Bilia
should have an optimal capital structure at any given time.
It is the judgment of the Board of Directors that the com-
pany’s and the Group’s equity after the proposed dividend will
be sufficiently large in relation to the nature, scope and risks of
the business and the terms of the lenders. The Board has also
taken into account the Group’s history, liquidity and invest-
ment plans, as well as the general economic situation.
Approval of the financial statementsThe financial statements were approved for publication by the
Parent Company’s Board of Directors on 8 March 2019.
For further details concerning the company’s results and
financial position, please refer to the following Consolidated
Statement of Income and Other Comprehensive Income and
the Consolidated Statement of Financial Position with accom-
panying comments.
BILIA ANNUAL REPORT 2018 27
covered by the Group-wide certificate. Bilia plans to gradually
extend its certification by adding the subsidiaries in Sweden
and Norway.
During 2018 around 50 per cent of Bilia’s sites in Sweden and Norway were certified to these two ISO standards.
Around 60 per cent of them were certified to ISO 14001:2015.
Code of Conduct and whistleblower systemBilia’s sustainability work is based on the Group’s Code of Conduct, which applies to all employees and Board members of the Bilia Group. The Code of Conduct covers areas such as human rights, social conditions and employees, the environ-ment and anti-corruption.
Bilia has a number of policies, rules and guidelines in place which comply with the Code of Conduct and reflect the values established in it. These include an work environment policy, a policy on bullying and harassment in the workplace and an equal treatment policy, which covers issues such as non-dis-crimination, gender equality and diversity.
Since 2017, the Swedish companies have been able to anonymously report violations of the Code of Conduct or any other irregularities in a digital whistleblower system, which is managed externally. Incidents were reported to the system
Sustainability reportThis Sustainability Report is prepared in accordance with the Swedish Annual
Accounts Act and has been examined by Bilia’s auditors. For Bilia, sustainability work
is an integral part of responsible business and of creating long-term solutions. Bilia
works on various levels to do its part for a better, more sustainable society.
Organisation, responsibility and monitoringThe Bilia Group CEO is ultimately responsible for the Group’s sustainability work and makes decisions on goals, action plans and performance measures for this work. In connection with the business planning process, responsibility for goal achieve-ment and action plans is delegated to the Managing Director of each company. Group-wide goals are broken down into goals at company and department level.
The MD:s in turn delegate to their companies’ managers and employees to implement and monitor the goals and action plans, according to their levels of responsibility and authorisa-tion. Each company’s management tracks goal achievement and performance measures on a monthly basis. The results are then reported to the Group Management. Once a year an in-depth analysis is conducted at company and Group level.
Bilia’s sustainability work is monitored by internal auditors, supplier assessments, health and safety inspections and a health and safety committees, annual performance appraisals and internal deviation management. A digital employee survey is conducted annually through an external party, this enables the results to be benchmarked within and outside different sectors.
During 2018, the Parent Company Bilia AB and its subsidi-ary Bilia Group AB were certified to ISO 14001:2015 and ISO 9001:2015. At the end of the year, Bilia Personbilar AB was also
Sustainability report
28 BILIA ANNUAL REPORT 2018
Drug use is increasing in society, which can
risk affecting Bilia and its employees nega-
tively if this trend were to reach Bilia’s opera-
tions. If this occurs, the risk of accidents
during working hours would increase. In
association with the occupational health service, preven-
tive training has taken place with the aim of highlighting
the problems associated with abuse and dependency.
Identified misuse and dependency among employees is
dealt with according to a drug and misuse policy, the focus
being to help the individual in question.
Bilia faces a challenge in recruiting em-
ployees, primarily in the Service Business.
Projects are under way to motivate and
prepare young people for technical careers
by offering work experience placements, and
by maintaining a close dialogue regarding competence
requirements. To make technical recruitment easier, Bilia
takes part in collaborative projects to help groups that find
it hard to enter the job market.
“The best student programme in the business” is Bilia’s
quality initiative to offer work experience placements to
high school students, the aim being to enhance the quality
of their education.
Bilia sells and provides services for products
which, during their life cycle, have a negative
impact on the environment by using finite
resources and emitting substances into the
air that adversely affect the climate, environ-
ment and health. Bilia chooses business partners that can
meet prevailing requirements on sustainable production
and consumption. Bilia considers the customer’s needs,
and puts together a product recommendation which
includes the sustainability aspect.
Focus on three of the UN's global goals
during 2018, and these were dealt with accordingly in line with the system’s purpose. The whistleblower system was also im-plemented in Norway during the year, and the process of intro-ducing it in our operations in Europe is under way. Employees who do not yet have access to the digital system can report violations and irregularities by phone, e-mail or regular mail to Bilia’s internal auditors, HR or their immediate managers.
Stakeholder analysisOne prerequisite for long-term value creation is that Bilia under-stands the demands and expectations of its stakeholder groups. In 2017 an analysis was conducted to determine which stake-holder groups have the greatest influence on and/or are most influenced by Bilia’s business activities and sustainability work. The four most important stakeholder groups were identified as employees, customers, general agents and suppliers.
Bilia places high demands on its business partners. All of them are expected to meet the quality requirements of ISO 9001:2015 and the environmental requirements of ISO 14001:2015. When Bilia enters into agreements with suppliers, they must comply with requirements based on the ten prin-ciples of the UN Global Compact, which cover human rights, labour, the environment and anti-corruption.
In 2015, the UN adopted 17 global Sustainable Develop-ment Goals (SDGs). The goals aim to achieve an economically, socially and environmentally sustainable world for everybody in it. Bilia contributes to these goals in several ways, and now focuses on three which are currently deemed to be of the greatest relevance and importance to its operations. These are Good Health and Well-Being (Goal 3), Quality Education (Goal 4) and Responsible Consumption and Production (Goal 12).
Hållbarhetsrapport
TH REE QUESTIONS
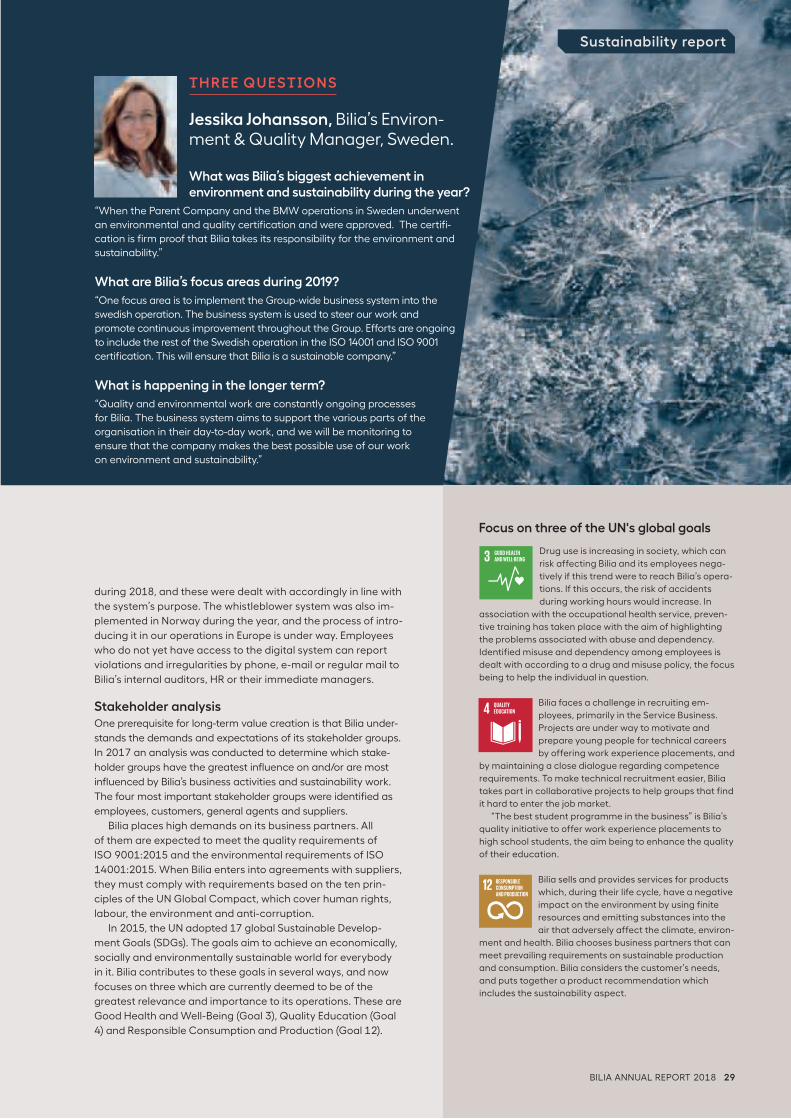
Jessika Johansson, Bilia’s Environ -ment & Quality Manager, Sweden.
What was Bilia’s biggest achievement in environ ment and sustainability during the year?
“When the Parent Company and the BMW operations in Sweden underwent an environmental and quality certification and were approved. The certifi-cation is firm proof that Bilia takes its responsibility for the environment and sustainability.”
What are Bilia’s focus areas during 2019?
“One focus area is to implement the Group-wide business system into the swedish operation. The business system is used to steer our work and promote continuous improvement throughout the Group. Efforts are ongoing to include the rest of the Swedish operation in the ISO 14001 and ISO 9001 certification. This will ensure that Bilia is a sustainable company.”
What is happening in the longer term?
“Quality and environmental work are constantly ongoing processes for Bilia. The business system aims to support the various parts of the organisation in their day-to-day work, and we will be monitoring to ensure that the company makes the best possible use of our work on environment and sustainability.”
Sustainability report
BILIA ANNUAL REPORT 2018 29
Hållbarhetsrapport
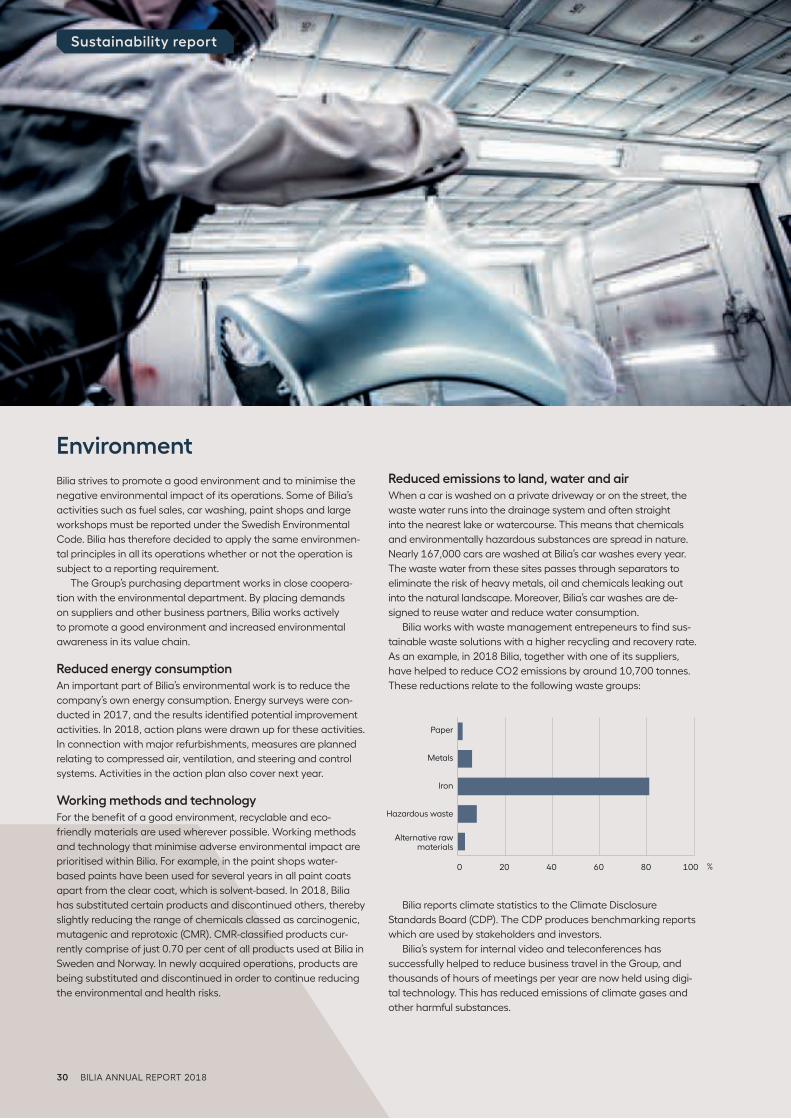
EnvironmentBilia strives to promote a good environment and to minimise the
negative environmental impact of its operations. Some of Bilia’s
activities such as fuel sales, car washing, paint shops and large
workshops must be reported under the Swedish Environmental
Code. Bilia has therefore decided to apply the same environmen-
tal principles in all its operations whether or not the operation is
subject to a reporting requirement.
The Group’s purchasing department works in close coopera-
tion with the environmental department. By placing demands
on suppliers and other business partners, Bilia works actively
to promote a good environment and increased environmental
awareness in its value chain.
Reduced energy consumption An important part of Bilia’s environmental work is to reduce the
company’s own energy consumption. Energy surveys were con-
ducted in 2017, and the results identified potential improvement activities. In 2018, action plans were drawn up for these activities. In connection with major refurbishments, measures are planned relating to compressed air, ventilation, and steering and control systems. Activities in the action plan also cover next year.
Working methods and technologyFor the benefit of a good environment, recyclable and eco-friendly materials are used wherever possible. Working methods and technology that minimise adverse environmental impact are prioritised within Bilia. For example, in the paint shops water-based paints have been used for several years in all paint coats apart from the clear coat, which is solvent-based. In 2018, Bilia has substituted certain products and discontinued others, thereby slightly reducing the range of chemicals classed as carcinogenic, mutagenic and reprotoxic (CMR). CMR-classified products cur-rently comprise of just 0.70 per cent of all products used at Bilia in Sweden and Norway. In newly acquired operations, products are being substituted and discontinued in order to continue reducing the environmental and health risks.
Reduced emissions to land, water and airWhen a car is washed on a private driveway or on the street, the waste water runs into the drainage system and often straight into the nearest lake or watercourse. This means that chemicals and environmentally hazardous substances are spread in nature. Nearly 167,000 cars are washed at Bilia’s car washes every year. The waste water from these sites passes through separators to eliminate the risk of heavy metals, oil and chemicals leaking out into the natural landscape. Moreover, Bilia’s car washes are de-signed to reuse water and reduce water consumption.
Bilia works with waste management entrepeneurs to find sus-tainable waste solutions with a higher recycling and recovery rate. As an example, in 2018 Bilia, together with one of its suppliers, have helped to reduce CO2 emissions by around 10,700 tonnes. These reductions relate to the following waste groups:
Bilia reports climate statistics to the Climate Disclosure Standards Board (CDP). The CDP produces benchmarking reports which are used by stakeholders and investors.
Bilia’s system for internal video and teleconferences has successfully helped to reduce business travel in the Group, and thousands of hours of meetings per year are now held using digi-tal technology. This has reduced emissions of climate gases and other harmful substances.
Sustainability report
%0 20 40 60 80 100
Paper
Metals
Iron
Hazardous waste
Alternative rawmaterials
30 BILIA ANNUAL REPORT 2018
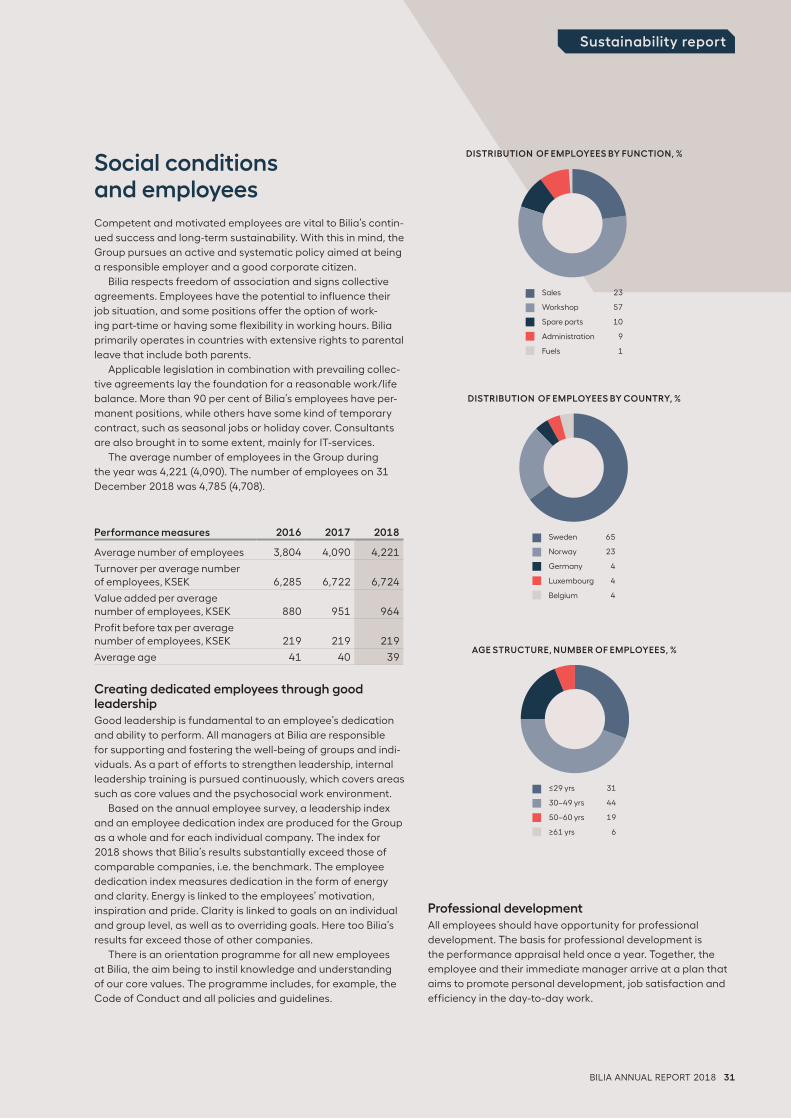
Social conditions and employeesCompetent and motivated employees are vital to Bilia’s contin-
ued success and long-term sustainability. With this in mind, the
Group pursues an active and systematic policy aimed at being
a responsible employer and a good corporate citizen.
Bilia respects freedom of association and signs collective
agreements. Employees have the potential to influence their
job situation, and some positions offer the option of work-
ing part-time or having some flexibility in working hours. Bilia
primarily operates in countries with extensive rights to parental
leave that include both parents.
Applicable legislation in combination with prevailing collec-
tive agreements lay the foundation for a reasonable work/life
balance. More than 90 per cent of Bilia’s employees have per-manent positions, while others have some kind of temporary contract, such as seasonal jobs or holiday cover. Consultants are also brought in to some extent, mainly for IT-services.
The average number of employees in the Group during the year was 4,221 (4,090). The number of employees on 31 December 2018 was 4,785 (4,708).
Creating dedicated employees through good leadershipGood leadership is fundamental to an employee’s dedication and ability to perform. All managers at Bilia are responsible for supporting and fostering the well-being of groups and indi-viduals. As a part of efforts to strengthen leadership, internal leadership training is pursued continuously, which covers areas such as core values and the psychosocial work environment.
Based on the annual employee survey, a leadership index and an employee dedication index are produced for the Group as a whole and for each individual company. The index for 2018 shows that Bilia’s results substantially exceed those of comparable companies, i.e. the benchmark. The employee dedication index measures dedication in the form of energy and clarity. Energy is linked to the employees’ motivation, inspiration and pride. Clarity is linked to goals on an individual and group level, as well as to overriding goals. Here too Bilia’s results far exceed those of other companies.
There is an orientation programme for all new employees at Bilia, the aim being to instil knowledge and understanding of our core values. The programme includes, for example, the Code of Conduct and all policies and guidelines.
Sales 23
Workshop 57
Spare parts 10
Administration 9
Fuels 1
DISTRIBUTION OF EMPLOYEES BY FUNCTION, %
Sweden 65
Norway 23
Germany 4
Luxembourg 4
Belgium 4
DISTRIBUTION OF EMPLOYEES BY COUNTRY, %
≤29 yrs 31
30–49 yrs 44
50–60 yrs 19
≥61 yrs 6
AGE STRUCTURE, NUMBER OF EMPLOYEES, %
Professional development All employees should have opportunity for professional development. The basis for professional development is the performance appraisal held once a year. Together, the employee and their immediate manager arrive at a plan that aims to promote personal development, job satisfaction and efficiency in the day-to-day work.
Sustainability report
Performance measures 2016 2017 2018
Average number of employees 3,804 4,090 4,221
Turnover per average number of employees, KSEK 6,285 6,722 6,724
Value added per average number of employees, KSEK 880 951 964
Profit before tax per average number of employees, KSEK 219 219 219
Average age 41 40 39
BILIA ANNUAL REPORT 2018 31
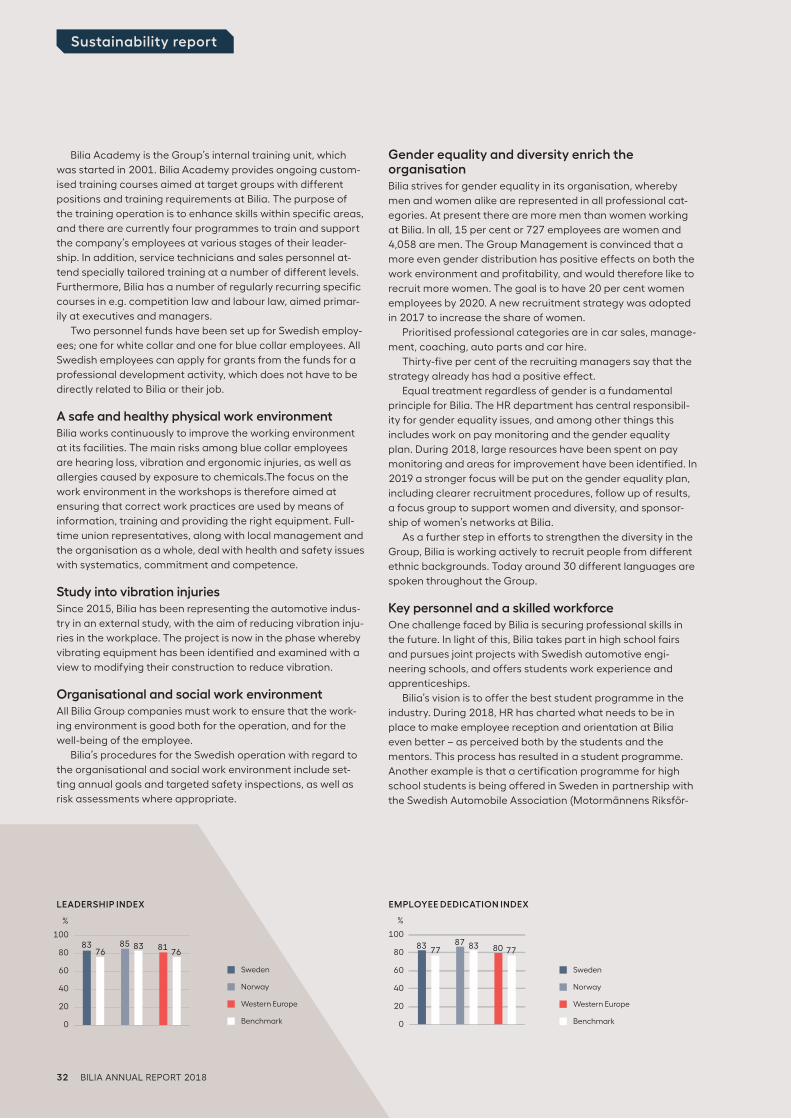
Bilia Academy is the Group’s internal training unit, which
was started in 2001. Bilia Academy provides ongoing custom-ised training courses aimed at target groups with different positions and training requirements at Bilia. The purpose of the training operation is to enhance skills within specific areas, and there are currently four programmes to train and support the company’s employees at various stages of their leader-ship. In addition, service technicians and sales personnel at-tend specially tailored training at a number of different levels. Furthermore, Bilia has a number of regularly recurring specific courses in e.g. competition law and labour law, aimed primar-ily at executives and managers.
Two personnel funds have been set up for Swedish employ-ees; one for white collar and one for blue collar employees. All Swedish employees can apply for grants from the funds for a professional development activity, which does not have to be directly related to Bilia or their job.
A safe and healthy physical work environment Bilia works continuously to improve the working environment at its facilities. The main risks among blue collar employees are hearing loss, vibration and ergonomic injuries, as well as allergies caused by exposure to chemicals.The focus on the work environment in the workshops is therefore aimed at ensuring that correct work practices are used by means of information, training and providing the right equipment. Full-time union representatives, along with local management and the organisation as a whole, deal with health and safety issues with systematics, commitment and competence.
Study into vibration injuriesSince 2015, Bilia has been representing the automotive indus-try in an external study, with the aim of reducing vibration inju-ries in the workplace. The project is now in the phase whereby vibrating equipment has been identified and examined with a view to modifying their construction to reduce vibration.
Organisational and social work environmentAll Bilia Group companies must work to ensure that the work-ing environment is good both for the operation, and for the well-being of the employee.
Bilia’s procedures for the Swedish operation with regard to the organisational and social work environment include set-ting annual goals and targeted safety inspections, as well as risk assessments where appropriate.
Gender equality and diversity enrich the organisationBilia strives for gender equality in its organisation, whereby men and women alike are represented in all professional cat-egories. At present there are more men than women working at Bilia. In all, 15 per cent or 727 employees are women and 4,058 are men. The Group Management is convinced that a more even gender distribution has positive effects on both the work environment and profitability, and would therefore like to recruit more women. The goal is to have 20 per cent women employees by 2020. A new recruitment strategy was adopted in 2017 to increase the share of women.
Prioritised professional categories are in car sales, manage-ment, coaching, auto parts and car hire.
Thirty-five per cent of the recruiting managers say that the strategy already has had a positive effect.
Equal treatment regardless of gender is a fundamental principle for Bilia. The HR department has central responsibil-ity for gender equality issues, and among other things this includes work on pay monitoring and the gender equality plan. During 2018, large resources have been spent on pay monitoring and areas for improvement have been identified. In 2019 a stronger focus will be put on the gender equality plan, including clearer recruitment procedures, follow up of results, a focus group to support women and diversity, and sponsor-ship of women’s networks at Bilia.
As a further step in efforts to strengthen the diversity in the Group, Bilia is working actively to recruit people from different ethnic backgrounds. Today around 30 different languages are spoken throughout the Group.
Key personnel and a skilled workforceOne challenge faced by Bilia is securing professional skills in the future. In light of this, Bilia takes part in high school fairs and pursues joint projects with Swedish automotive engi-neering schools, and offers students work experience and apprenticeships.
Bilia’s vision is to offer the best student programme in the industry. During 2018, HR has charted what needs to be in place to make employee reception and orientation at Bilia even better – as perceived both by the students and the mentors. This process has resulted in a student programme. Another example is that a certification programme for high school students is being offered in Sweden in partnership with the Swedish Automobile Association (Motormännens Riksför-
Western Europe
Benchmark
Sweden
Norway
%
0
20
40
60
80
100
76 7685 83 8183
LEADERSHIP INDEX
Western Europe
Benchmark
Sweden
Norway
%
0
20
40
60
80
100
77 7787 8383 80
EMPLOYEE DEDICATION INDEX
Sustainability report
32 BILIA ANNUAL REPORT 2018
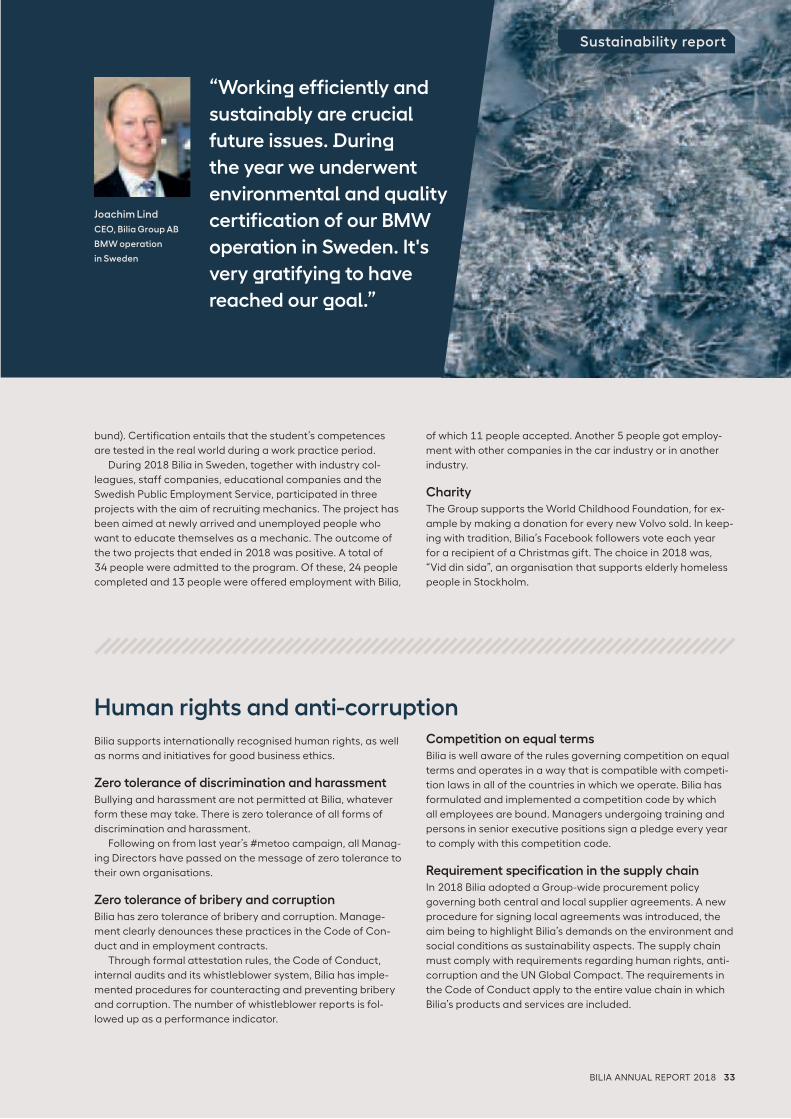
“Working efficiently and
sustainably are crucial
future issues. During
the year we underwent
environmental and quality
certification of our BMW
operation in Sweden. It's
very gratifying to have
reached our goal.”
Joachim Lind
CEO, Bilia Group AB
BMW operation
in Sweden
bund). Certification entails that the student’s competences
are tested in the real world during a work practice period.
During 2018 Bilia in Sweden, together with industry col-leagues, staff companies, educational companies and the Swedish Public Employment Service, participated in three projects with the aim of recruiting mechanics. The project has been aimed at newly arrived and unemployed people who want to educate themselves as a mechanic. The outcome of the two projects that ended in 2018 was positive. A total of 34 people were admitted to the program. Of these, 24 people completed and 13 people were offered employment with Bilia,
of which 11 people accepted. Another 5 people got employ-ment with other companies in the car industry or in another industry.
Charity The Group supports the World Childhood Foundation, for ex-ample by making a donation for every new Volvo sold. In keep-ing with tradition, Bilia’s Facebook followers vote each year for a recipient of a Christmas gift. The choice in 2018 was, “Vid din sida”, an organisation that supports elderly homeless people in Stockholm.
Sustainability report
Human rights and anti-corruptionBilia supports internationally recognised human rights, as well as norms and initiatives for good business ethics.
Zero tolerance of discrimination and harassmentBullying and harassment are not permitted at Bilia, whatever form these may take. There is zero tolerance of all forms of discrimination and harassment.
Following on from last year’s #metoo campaign, all Manag-ing Directors have passed on the message of zero tolerance to their own organisations.
Zero tolerance of bribery and corruptionBilia has zero tolerance of bribery and corruption. Manage-ment clearly denounces these practices in the Code of Con-duct and in employment contracts.
Through formal attestation rules, the Code of Conduct, internal audits and its whistleblower system, Bilia has imple-mented procedures for counteracting and preventing bribery and corruption. The number of whistleblower reports is fol-lowed up as a performance indicator.
Competition on equal termsBilia is well aware of the rules governing competition on equal terms and operates in a way that is compatible with competi-tion laws in all of the countries in which we operate. Bilia has formulated and implemented a competition code by which all employees are bound. Managers undergoing training and persons in senior executive positions sign a pledge every year to comply with this competition code.
Requirement specification in the supply chainIn 2018 Bilia adopted a Group-wide procurement policy governing both central and local supplier agreements. A new procedure for signing local agreements was introduced, the aim being to highlight Bilia’s demands on the environment and social conditions as sustainability aspects. The supply chain must comply with requirements regarding human rights, anti-corruption and the UN Global Compact. The requirements in the Code of Conduct apply to the entire value chain in which Bilia’s products and services are included.
BILIA ANNUAL REPORT 2018 33
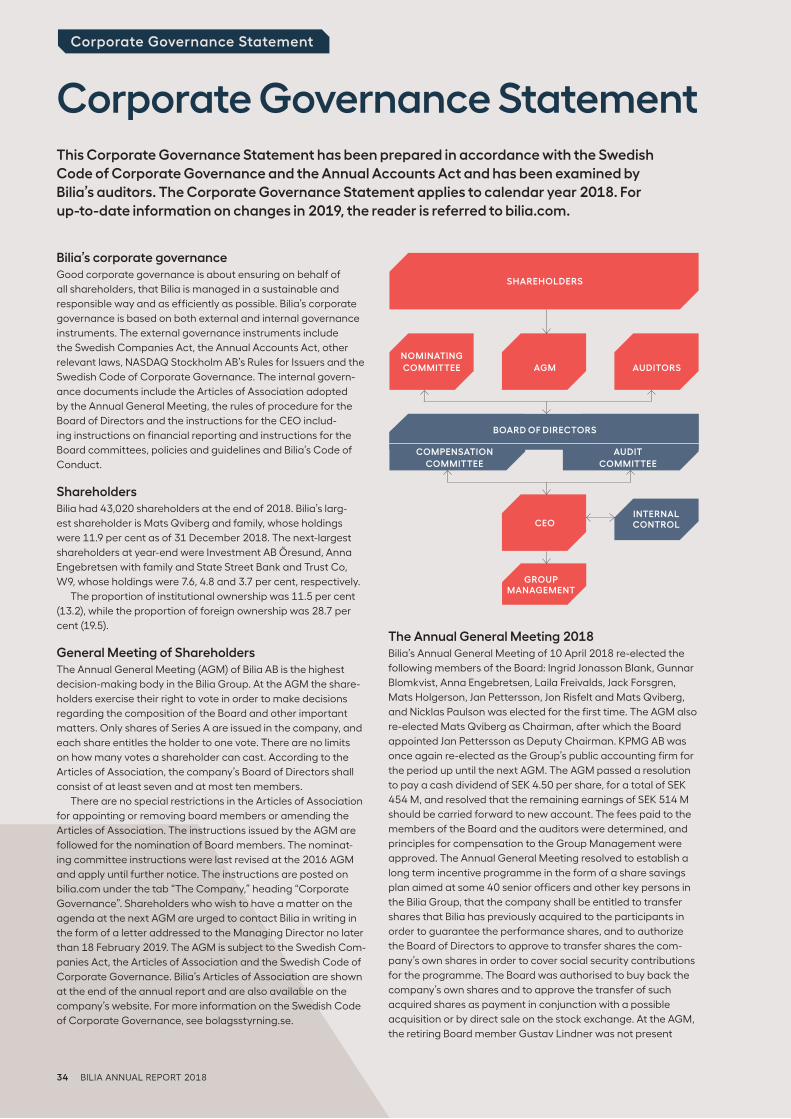
Corporate Governance Statement
Bilia’s corporate governanceGood corporate governance is about ensuring on behalf of
all shareholders, that Bilia is managed in a sustainable and
responsible way and as efficiently as possible. Bilia’s corporate
governance is based on both external and internal governance
instruments. The external governance instruments include
the Swedish Companies Act, the Annual Accounts Act, other
relevant laws, NASDAQ Stockholm AB’s Rules for Issuers and the
Swedish Code of Corporate Governance. The internal govern-
ance documents include the Articles of Association adopted
by the Annual General Meeting, the rules of procedure for the
Board of Directors and the instructions for the CEO includ-
ing instructions on financial reporting and instructions for the
Board committees, policies and guidelines and Bilia’s Code of
Conduct.
ShareholdersBilia had 43,020 shareholders at the end of 2018. Bilia’s larg-est shareholder is Mats Qviberg and family, whose holdings were 11.9 per cent as of 31 December 2018. The next-largest shareholders at year-end were Investment AB Öresund, Anna Engebretsen with family and State Street Bank and Trust Co, W9, whose holdings were 7.6, 4.8 and 3.7 per cent, respectively.
The proportion of institutional ownership was 11.5 per cent (13.2), while the proportion of foreign ownership was 28.7 per cent (19.5).
General Meeting of ShareholdersThe Annual General Meeting (AGM) of Bilia AB is the highest decision-making body in the Bilia Group. At the AGM the share-holders exercise their right to vote in order to make decisions regarding the composition of the Board and other important matters. Only shares of Series A are issued in the company, and each share entitles the holder to one vote. There are no limits on how many votes a shareholder can cast. According to the Articles of Association, the company’s Board of Directors shall consist of at least seven and at most ten members.
There are no special restrictions in the Articles of Association for appointing or removing board members or amending the Articles of Association. The instructions issued by the AGM are followed for the nomination of Board members. The nominat-ing committee instructions were last revised at the 2016 AGM and apply until further notice. The instructions are posted on bilia.com under the tab “The Company,” heading “Corporate Governance”. Shareholders who wish to have a matter on the agenda at the next AGM are urged to contact Bilia in writing in the form of a letter addressed to the Managing Director no later than 18 February 2019. The AGM is subject to the Swedish Com-panies Act, the Articles of Association and the Swedish Code of Corporate Governance. Bilia’s Articles of Association are shown at the end of the annual report and are also available on the company’s website. For more information on the Swedish Code of Corporate Governance, see bolagsstyrning.se.
The Annual General Meeting 2018Bilia’s Annual General Meeting of 10 April 2018 re-elected the following members of the Board: Ingrid Jonasson Blank, Gunnar Blomkvist, Anna Engebretsen, Laila Freivalds, Jack Forsgren, Mats Holgerson, Jan Pettersson, Jon Risfelt and Mats Qviberg, and Nicklas Paulson was elected for the first time. The AGM also re-elected Mats Qviberg as Chairman, after which the Board appointed Jan Pettersson as Deputy Chairman. KPMG AB was once again re-elected as the Group’s public accounting firm for the period up until the next AGM. The AGM passed a resolution to pay a cash dividend of SEK 4.50 per share, for a total of SEK 454 M, and resolved that the remaining earnings of SEK 514 M should be carried forward to new account. The fees paid to the members of the Board and the auditors were determined, and principles for compensation to the Group Management were approved. The Annual General Meeting resolved to establish a long term incentive programme in the form of a share savings plan aimed at some 40 senior officers and other key persons in the Bilia Group, that the company shall be entitled to transfer shares that Bilia has previously acquired to the participants in order to guarantee the performance shares, and to authorize the Board of Directors to approve to transfer shares the com-pany’s own shares in order to cover social security contributions for the programme. The Board was authorised to buy back the company’s own shares and to approve the transfer of such acquired shares as payment in conjunction with a possible acquisition or by direct sale on the stock exchange. At the AGM, the retiring Board member Gustav Lindner was not present
Corporate Governance StatementThis Corporate Governance Statement has been prepared in accordance with the Swedish Code of Corporate Governance and the Annual Accounts Act and has been examined by Bilia’s auditors. The Corporate Governance Statement applies to calendar year 2018. For up-to-date information on changes in 2019, the reader is referred to bilia.com.
SHAREHOLDERS
AGM
BOARD OF DIRECTORS
CEOINTERNAL CONTROL
AUDIT COMMITTEE
NOMINATING COMMITTEE AUDITORS
COMPENSATION COMMITTEE
GROUP MANAGEMENT
34 BILIA ANNUAL REPORT 2018
has been judged to influence the impartiality and independ-
ence of the auditors.
Board of DirectorsBilia’s Board of Directors consists of ten members elected
by the AGM and two additional members who represent the
employees, plus two deputy employee representatives. The
AGM-elected members are elected for one year. There is no
limit to how long a member can sit on the Board. The employee
representatives are appointed by their respective trade-union
organisations. Information about the members of the Board can
be found under the heading “Board of Directors” in the annual
report and at bilia.com. This information includes other posts
and possible dependency.
The duties of the Board are regulated by the Companies Act,
the Articles of Association and the Swedish Code of Corporate
Governance. The Swedish Code of Corporate Governance has
been applied during 2018, with exception for the Board mem-bers presence at the AGM as described above and the following Gunnar Blomkvist was appointed a member of the Board of Director’s Compensation Committee 2017, as a result of which the committee is not in compliance with the Swedish Code of Corporate Governance, whose rule 9.2 states that the mem-bers of the committee must be independent of the company, whereas Mr. Blomkvist is a former employee and therefore not independent of the company. However, the Board of Directors has judged that Mr. Blomkvist’s qualifications make him a valu-able asset to the committee.
The work of the Board of Directors conforms to annually adopted rules of procedure governing the items of business to be dealt with at each ordinary meeting and the division of labour within the Board, with special duties for the Chair-man and the committees appointed within the Board. Based on the rules of procedure, the Board of Directors prepares a detailed annual plan each year for the Board meetings so that all important items are dealt with during the year. The rules of procedure also include rules for financial reporting to the Board and more detailed rules regarding the Managing Director’s pow-ers and responsibilities. The ultimate aim of the deliberations and decisions of the Board is to promote the interests of the shareholders in terms of value growth and return on investment. Measures to progressively strengthen the Bilia brand are also considered by the Board.
The work of the BoardFourteen Board meetings were held during 2018; one statutory meeting, five ordinary meetings, four extra meetings plus four meetings by correspondence. The number of Board meetings have increased due to new routines for Board meetings related to the publication of quarterly reports. During the year the following AGM-elected members and the members appointed by the trade union organisations were unable to attend the following Board meetings; Isak Ekblom the Board meetings on 10 April, Mats Qviberg, Ingrid Jonasson Blank and Isak Ekblom the Board meeting on 27 April (meeting prior to the publication of the Q1-report), Nicklas Paulson and Anna Engebretsen the Board meeting on 12 June, Dragan Mitrasinovic and Anders Bej-mar the Board meeting 26 July (meeting prior to the publication of the Q2-report), Isak Ekblom the Board meeting 20 August (extra Board meeting), and Mats Qviberg, Laila Freivalds, Anna Engebretsen, Patrik Nordvall and Isak Ekblom the Board meeting 26 October (meeting prior to the publication of the Q3-report). Otherwise all members have attended all Board meetings.
An agenda, along with in-depth information on important matters, is sent to each Board member in good time before
Corporate Governance Statement
due to a longer stay abroad, which entailed a digression from point 1.2 of the Swedish Code of Corporate Governance, which states that as far as possible all Board members shall be present at the annual general meeting.
Nominating CommitteeThe Nominating Committee submits proposals to the AGM for Board members and auditors and for fees to be paid to the Board members and the auditors. The committee also proposes fees for the work of Board members in special subcommittees. The Nominating Committee has four members, including the Chairman of the Board. Not later than six months before the AGM, the three to four largest shareholders who wish to take an active part in the nominating work each appoint one person to the Nominating Committee. Bilia AB’s chairman also has a per-manent seat on the Nominating Committee. The members of the Nominating Committee appoint a chairman. The Nominat-ing Committee works in accordance with the instructions issued by the AGM in 2016, which apply until further notice.
Bilia’s diversity policy complies with rule 4.1 of the Swedish Code of Corporate Governance, which states that the Board of Directors should have a composition appropriate to the com-pany’s operations, phase of development and other relevant cir-cumstances, characterised by diversity and breadth with regard to qualifications, experience and background, in addition to which an even gender distribution should be striven for. The election of Nicklas Paulson did not affect the gender distribution on the Board since the number of men and women is unchanged. Bilia strives for an even gender distribution over time.
Prior to the AGM 2018, the Nominating Committee consisted of the following persons, who were appointed in September 2017: Tim Floderus (Chairman in the Nominating Committee), representing Investment AB Öresund, Mats Qviberg, represent-ing the Qviberg family and in his capacity as Chairman of the Board of Bilia AB, Eva Cederbalk, representing Anna Engebrets-en with family, and Helen Fasth Gillstedt, representing Handels-banken Funds.
In the course of its work, the Nominating Committee had recieved information regarding the experience of Bilia’s Board members and their possible dependency relationship with Bilia and had also reviewed the evaluation of the Board’s work that is compiled every year. When the Nominating Committee pre-sents its proposals, it also submits an account of its work and a written explanation of the reasons for its proposals. Informa-tion from the Nominating Committee can be read at bilia.com. Each year the Nominating Committee welcomes proposals and viewpoints from shareholders and can most easily be contacted via e-mail at [email protected].
A new Nominating Committee was appointed in September 2018 consisting of Tim Floderus (Chairman in the Nominat-ing Committee), representing Investment AB Öresund, Mats Qviberg, representing the Qviberg family and in his capacity as Chairman of the Board of Bilia AB, Lisen Oliw, representing Anna Engebretsen with family, and Åsa Nisell, representing Swedbank Robur Funds.
AuditorsThe auditors of Bilia AB are elected by the AGM, and in 2018 KPMG AB was re-elected as the public accounting firm for the period up to the 2019 AGM. Johan Kratz was appointed as audi-tor in charge. Audit mainly involves continuous auditing and examination of the annual report.
KPMG AB also assists Bilia with advice on accounting mat-ters. During the past three years this has mainly involved ques-tions pertaining to accounting practices in accordance with IFRS standards. No circumstance relating to this advisory role
BILIA ANNUAL REPORT 2018 35
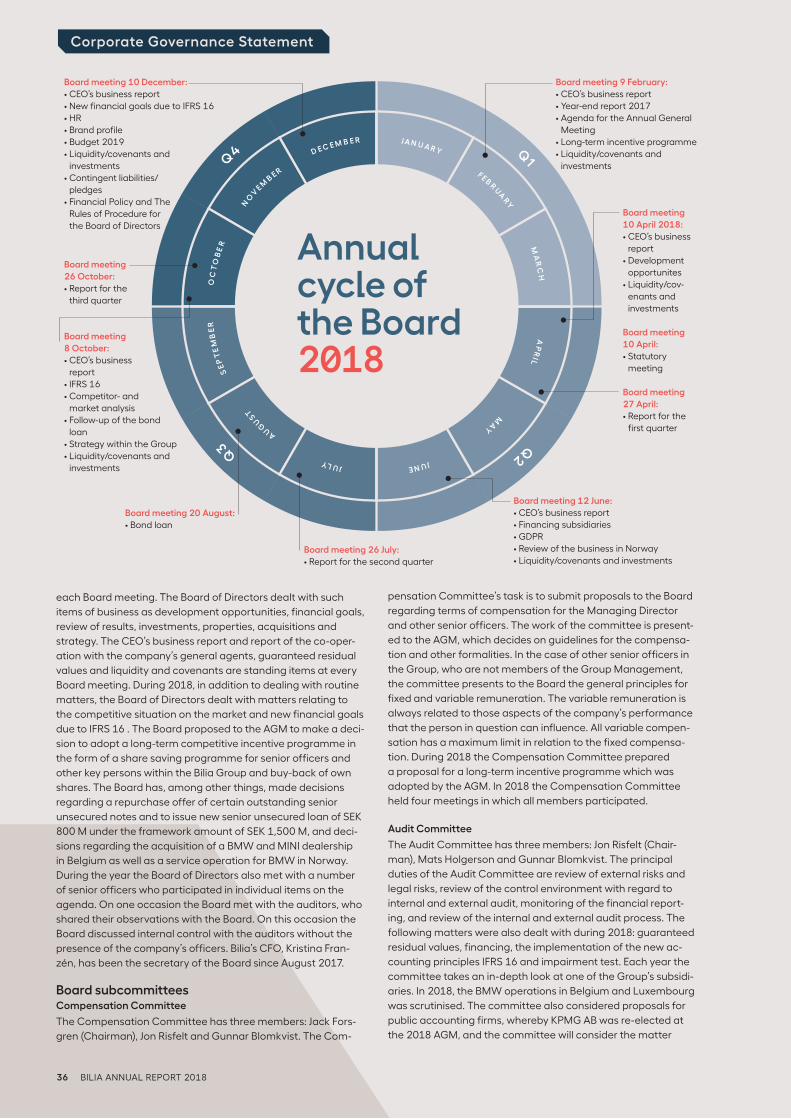
each Board meeting. The Board of Directors dealt with such
items of business as development opportunities, financial goals,
review of results, investments, properties, acquisitions and
strategy. The CEO’s business report and report of the co-oper-
ation with the company’s general agents, guaranteed residual
values and liquidity and covenants are standing items at every
Board meeting. During 2018, in addition to dealing with routine matters, the Board of Directors dealt with matters relating to the competitive situation on the market and new financial goals due to IFRS 16 . The Board proposed to the AGM to make a deci-sion to adopt a long-term competitive incentive programme in the form of a share saving programme for senior officers and other key persons within the Bilia Group and buy-back of own shares. The Board has, among other things, made decisions regarding a repurchase offer of certain outstanding senior unsecured notes and to issue new senior unsecured loan of SEK 800 M under the framework amount of SEK 1,500 M, and deci-sions regarding the acquisition of a BMW and MINI dealership in Belgium as well as a service operation for BMW in Norway. During the year the Board of Directors also met with a number of senior officers who participated in individual items on the agenda. On one occasion the Board met with the auditors, who shared their observations with the Board. On this occasion the Board discussed internal control with the auditors without the presence of the company’s officers. Bilia’s CFO, Kristina Fran-zén, has been the secretary of the Board since August 2017.
Board subcommitteesCompensation Committee
The Compensation Committee has three members: Jack Fors-gren (Chairman), Jon Risfelt and Gunnar Blomkvist. The Com-
pensation Committee’s task is to submit proposals to the Board regarding terms of compensation for the Managing Director and other senior officers. The work of the committee is present-ed to the AGM, which decides on guidelines for the compensa-tion and other formalities. In the case of other senior officers in the Group, who are not members of the Group Management, the committee presents to the Board the general principles for fixed and variable remuneration. The variable remuneration is always related to those aspects of the company’s performance that the person in question can influence. All variable compen-sation has a maximum limit in relation to the fixed compensa-tion. During 2018 the Compensation Committee prepared a proposal for a long-term incentive programme which was adopted by the AGM. In 2018 the Compensation Committee held four meetings in which all members participated.
Audit Committee
The Audit Committee has three members: Jon Risfelt (Chair-man), Mats Holgerson and Gunnar Blomkvist. The principal duties of the Audit Committee are review of external risks and legal risks, review of the control environment with regard to internal and external audit, monitoring of the financial report-ing, and review of the internal and external audit process. The following matters were also dealt with during 2018: guaranteed residual values, financing, the implementation of the new ac-counting principles IFRS 16 and impairment test. Each year the committee takes an in-depth look at one of the Group’s subsidi-aries. In 2018, the BMW operations in Belgium and Luxembourg was scrutinised. The committee also considered proposals for public accounting firms, whereby KPMG AB was re-elected at the 2018 AGM, and the committee will consider the matter
Q
1 Q
2
Q
3
Q
4
Board meeting 9 February: • CEO’s business report• Year-end report 2017• Agenda for the Annual General
Meeting• Long-term incentive programme• Liquidity/covenants and
investments
Board meeting 10 December: • CEO’s business report• New financial goals due to IFRS 16• HR• Brand profile• Budget 2019• Liquidity/covenants and
investments • Contingent liabilities/
pledges• Financial Policy and The
Rules of Procedure for the Board of Directors
Board meeting 10 April 2018: • CEO’s business
report• Development
opportunites • Liquidity/cov-
enants and investments
Board meeting 10 April:• Statutory
meeting
Board meeting 27 April:• Report for the
first quarter
Board meeting 12 June:• CEO’s business report• Financing subsidiaries • GDPR• Review of the business in Norway• Liquidity/covenants and investments
Board meeting 26 July: • Report for the second quarter
Board meeting 20 August:• Bond loan
Board meeting 26 October:• Report for the
third quarter
Board meeting 8 October:• CEO’s business
report• IFRS 16• Competitor- and
market analysis • Follow-up of the bond
loan• Strategy within the Group• Liquidity/covenants and
investments
Corporate Governance Statement
J A N U A R Y FEBR
UA
RY
MA
RC
H A
PR
IL M
AY JUNE J
ULY
A
UG
UST
SE
PT
EM
BE
R
OC
TO
BE
R
NO
V
EMB ER
DE C E M B E R
Annual cycle of the Board2018
36 BILIA ANNUAL REPORT 2018
once again prior to the next election of auditors. The work of
the committee has been based on material and information
from the Group Management and the auditors. Bilia’s internal
auditors give an annual account of their work to the Audit
Committee and Bilia’s auditors. The Audit Committee held four
meetings during the year. In addition to all members, the meet-
ings were also attended by Bilia’s auditors, the MD, the CFO and
additional co-opted persons. The Audit Committee also allots
time for a private session with the company’s CFO. In addition
to the aforementioned meetings, the chairman of the Audit
Committee has contact with the company’s auditor separately.
A record is kept of the committee’s meeting and submitted to
the Board of Directors.
Evaluation of the work of the BoardThe work of the Board is evaluated annually according to a
model that includes the following main areas:
• Board of Directors (roles, planning, functions)
• Board meetings
• Board material, information and reports
• Members of the Board
• Chairman of the Board
• Managing Director
The evaluation is performed by having the members them-
selves make an anonymous assessment of the work of the
Board by rating a number of areas/aspects, after which the
results are compiled. This year’s evaluation painted a posi-
tive overall picture of the work of the Board. The Board also
performs an annual evaluation of the work of the committees,
and other members remain satisfied with how the committees
handle their respective areas of responsibility.
Group ManagementAt the end of 2018, the Group Management consisted of Per Avander, Managing Director and CEO, Stefan Nordström, Deputy Managing Director, Kristina Franzén, CFO, and Frode Hebnes, Managing Director of Bilia Personbil as, Norway. The Group Management is responsible for formulating the Group’s overall strategy, business management and allocation of financial resources, as well as for the Group’s financing, capital structure and risk management. Its duties also include execut-ing major acquisitions and other major projects. Furthermore, the Group Management is responsible for the Group’s financial reporting, communication with the stock market and a variety of other matters concerning the Group as a whole. The Group
Management holds regular meetings under the leadership of Bilia’s Managing Director and CEO.
Group operations are largely decentralised, and the different companies enjoy a large measure of autonomy. The relation-ship between the companies and the Group Management is mainly concerned with Group-wide policies, principales and projects and work on the boards of the various companies.
The Board’s report regarding internal controlThis report is prepared in accordance with the Annual Accounts Act. The report is limited to internal control and risk management regarding the financial reporting and includes the entire Group. The Board of Directors bears ultimate responsibility for ensuring that Bilia’s internal control works satisfactorily and that adequate financial reports are presented. Under the Companies Act, the Board is responsible for Bilia’s organisation and management. It is the responsibility of the Board that Bilia’s accounting, manage-ment of funds and financial situation in general includes satisfac-tory controls. This responsibility cannot be delegated but always rests ultimately with the Board of Directors.
Bilia’s control environment is based on the communication of clear guidelines to all subsidiaries to ensure that the same rules and principles are applied in the Group’s different companies and within each business area and that the necessary tools are in place out in the subsidiaries to enable them to report back to Bilia AB in a correct and uniform manner. The management conducts a risk analysis which, following discussion by the Audit Committee and the Board of Directors, serves as a basis, along with other considerations, for focusing the internal control.
Internal control work
As a complement to manager responsibility and other control procedures, Bilia has a function for internal audit that reports to the company’s CFO. Bilia’s CFO has approved the audit plan presented and the result of the audit is reported directly to Bilia’s CFO. Bilia’s internal auditors annually inform the Audit Commit-tee concerning the audit plan and submit reports regarding the audit work. The audit plan is evaluated regularly and was last updated in September 2018.
The work of assuring internal control is a continuous process that should be subject to constant review, follow-up and im-provement.
Bilia’s Code of Conduct applies to all employees in the Group and Board members. The Code of Conduct, which is posted on bilia.com, was issued in 2006 and has been revised after the end of 2018.
Corporate Governance Statement
BILIA ÅRSREDOVISNING 2018 37
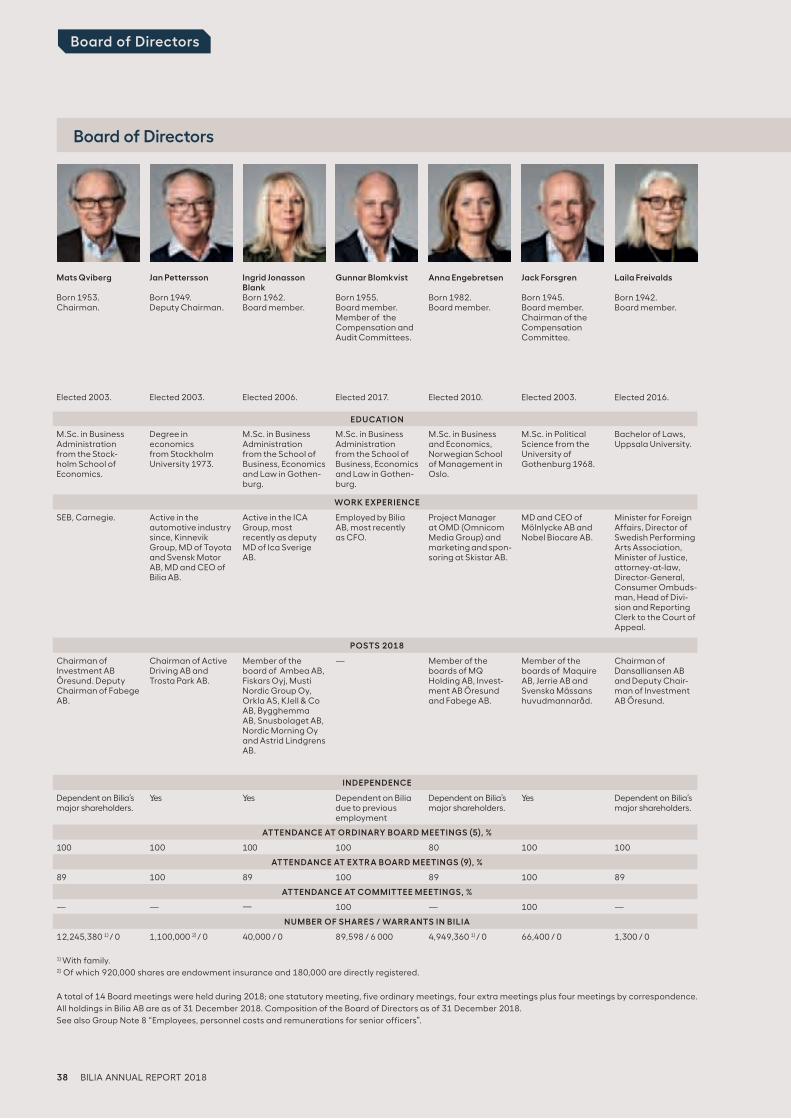
Mats Qviberg
Born 1953.Chairman.
Elected 2003.
Jan Pettersson
Born 1949.Deputy Chairman.
Elected 2003.
Ingrid Jonasson BlankBorn 1962.Board member.
Elected 2006.
Gunnar Blomkvist
Born 1955.Board member.Member of the Compensation and Audit Committees.
Elected 2017.
Anna Engebretsen
Born 1982.Board member.
Elected 2010.
Jack Forsgren
Born 1945.Board member. Chairman of the Compensation Committee.
Elected 2003.
Laila Freivalds
Born 1942.Board member.
Elected 2016.
EDUCATION
M.Sc. in Business Administration from the Stock-holm School of Economics.
Degree in economics from Stockholm University 1973.
M.Sc. in Business Administration from the School of Business, Economics and Law in Gothen-burg.
M.Sc. in Business Administration from the School of Business, Economics and Law in Gothen-burg.
M.Sc. in Business and Economics, Norwegian School of Management in Oslo.
M.Sc. in Political Science from the University of Gothenburg 1968.
Bachelor of Laws, Uppsala University.
WORK EXPERIENCE
SEB, Carnegie. Active in the automotive industry since, Kinnevik Group, MD of Toyota and Svensk Motor AB, MD and CEO of Bilia AB.
Active in the ICA Group, most recently as deputy MD of Ica Sverige AB.
Employed by Bilia AB, most recently as CFO.
Project Manager at OMD (Omnicom Media Group) and marketing and spon-soring at Skistar AB.
MD and CEO of Mölnlycke AB and Nobel Biocare AB.
Minister for Foreign Affairs, Director of Swedish Performing Arts Association, Minister of Justice, attorney-at-law, Director-General, Consumer Ombuds-man, Head of Divi-sion and Reporting Clerk to the Court of Appeal.
POSTS 2018
Chairman of Investment AB Öresund. Deputy Chairman of Fabege AB.
Chairman of Active Driving AB and Trosta Park AB.
Member of the board of Ambea AB, Fiskars Oyj, Musti Nordic Group Oy, Orkla AS, KJell & Co AB, Bygghemma AB, Snusbolaget AB, Nordic Morning Oy and Astrid Lindgrens AB.
— Member of the boards of MQ Holding AB, Invest-ment AB Öresund and Fabege AB.
Member of the boards of Maquire AB, Jerrie AB and Svenska Mässans huvudmannaråd.
Chairman of Dansalliansen AB and Deputy Chair-man of Investment AB Öresund.
INDEPENDENCE
Dependent on Bilia’s major shareholders.
Yes Yes Dependent on Bilia due to previous employment
Dependent on Bilia’s major shareholders.
Yes Dependent on Bilia’s major shareholders.
ATTENDANCE AT ORDINARY BOARD MEETINGS (5), %
100 100 100 100 80 100 100
ATTENDANCE AT EXTRA BOARD MEETINGS (9), %
89 100 89 100 89 100 89
ATTENDANCE AT COMMITTEE MEETINGS, %
— — — 100 — 100 —
NUMBER OF SHARES / WARRANTS IN BILIA
12,245,380 1) / 0 1,100,000 2) / 0 40,000 / 0 89,598 / 6 000 4,949,360 1) / 0 66,400 / 0 1,300 / 0
1) With family.2) Of which 920,000 shares are endowment insurance and 180,000 are directly registered.
A total of 14 Board meetings were held during 2018; one statutory meeting, five ordinary meetings, four extra meetings plus four meetings by correspondence.All holdings in Bilia AB are as of 31 December 2018. Composition of the Board of Directors as of 31 December 2018.See also Group Note 8 “Employees, personnel costs and remunerations for senior officers”.
Board of Directors
Board of Directors
38 BILIA ANNUAL REPORT 2018
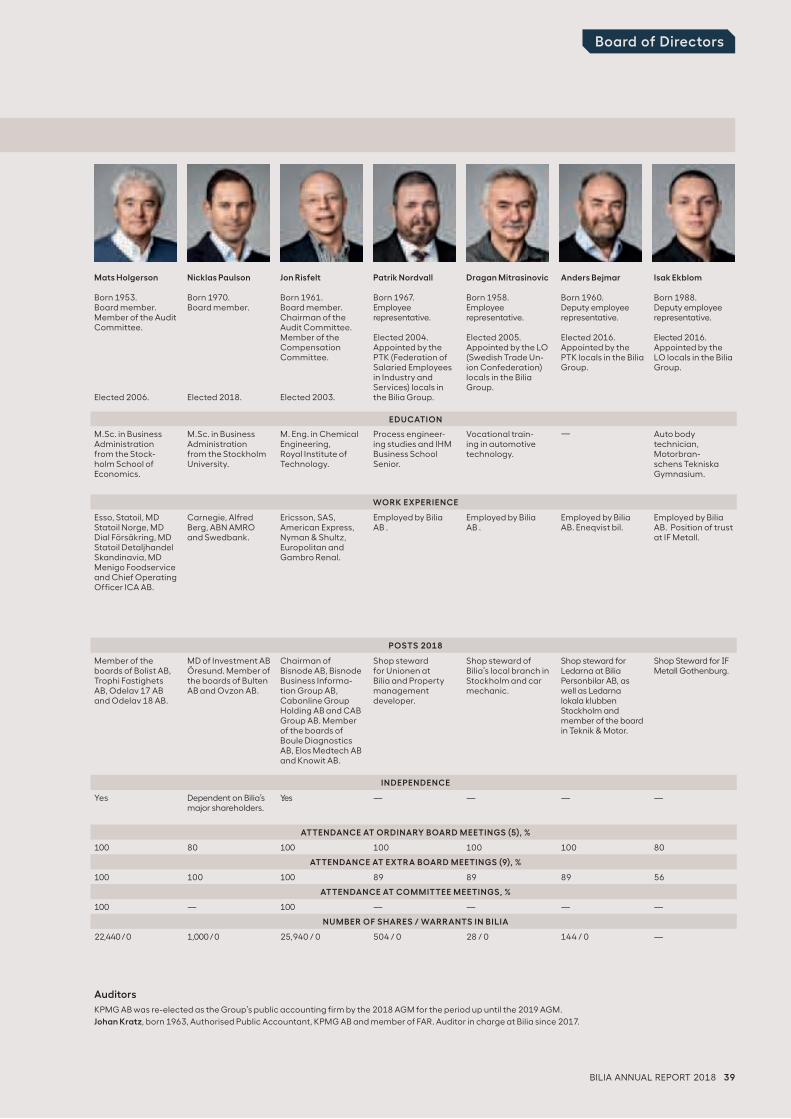
Mats Holgerson
Born 1953.Board member.Member of the Audit Committee.
Elected 2006.
Nicklas Paulson
Born 1970.Board member.
Elected 2018.
Jon Risfelt
Born 1961.Board member.Chairman of the Audit Committee. Member of the Compensation Committee.
Elected 2003.
Patrik Nordvall
Born 1967.Employee representative.
Elected 2004. Appointed by the PTK (Federation of Salaried Employees in Industry and Services) locals in the Bilia Group.
Dragan Mitrasinovic
Born 1958.Employee representative.
Elected 2005. Appointed by the LO (Swedish Trade Un-ion Confederation) locals in the Bilia Group.
Anders Bejmar
Born 1960.Deputy employee representative.
Elected 2016. Appointed by the PTK locals in the Bilia Group.
Isak Ekblom
Born 1988.Deputy employee representative.
Elected 2016. Appointed by the LO locals in the Bilia Group.
EDUCATION
M.Sc. in Business Administration from the Stock-holm School of Economics.
M.Sc. in Business Administration from the Stockholm University.
M. Eng. in Chemical Engineering, Royal Institute of Technology.
Process engineer-ing studies and IHM Business School Senior.
Vocational train-ing in automotive technology.
— Auto body technician, Motorbran-schens Tekniska Gymnasium.
WORK EXPERIENCE
Esso, Statoil, MD Statoil Norge, MD Dial Försäkring, MD Statoil Detaljhandel Skandinavia, MD Menigo Food service and Chief Operating Officer ICA AB.
Carnegie, Alfred Berg, ABN AMRO and Swedbank.
Ericsson, SAS, American Express, Nyman & Shultz, Europolitan and Gambro Renal.
Employed by Bilia AB .
Employed by Bilia AB .
Employed by Bilia AB. Eneqvist bil.
Employed by Bilia AB. Position of trust at IF Metall.
POSTS 2018
Member of the boards of Bolist AB, Trophi Fastighets AB, Odelav 17 AB and Odelav 18 AB.
MD of Investment AB Öresund. Member of the boards of Bulten AB and Ovzon AB.
Chairman of Bisnode AB, Bisnode Business Informa-tion Group AB, Cabonline Group Holding AB and CAB Group AB. Member of the boards of Boule Diagnostics AB, Elos Medtech AB and Knowit AB.
Shop steward for Unionen at Bilia and Property management developer.
Shop steward of Bilia’s local branch in Stockholm and car mechanic.
Shop steward for Ledarna at Bilia Personbilar AB, as well as Ledarna lokala klubben Stockholm and member of the board in Teknik & Motor.
Shop Steward for IF Metall Gothenburg.
INDEPENDENCE
Yes Dependent on Bilia’s major shareholders.
Yes — — — —
ATTENDANCE AT ORDINARY BOARD MEETINGS (5), %
100 80 100 100 100 100 80
ATTENDANCE AT EXTRA BOARD MEETINGS (9), %
100 100 100 89 89 89 56
ATTENDANCE AT COMMITTEE MEETINGS, %
100 — 100 — — — —
NUMBER OF SHARES / WARRANTS IN BILIA
22,440 / 0 1,000 / 0 25,940 / 0 504 / 0 28 / 0 144 / 0 —
Auditors
KPMG AB was re-elected as the Group’s public accounting firm by the 2018 AGM for the period up until the 2019 AGM. Johan Kratz, born 1963, Authorised Public Accountant, KPMG AB and member of FAR. Auditor in charge at Bilia since 2017.
Board of Directors
BILIA ANNUAL REPORT 2018 39
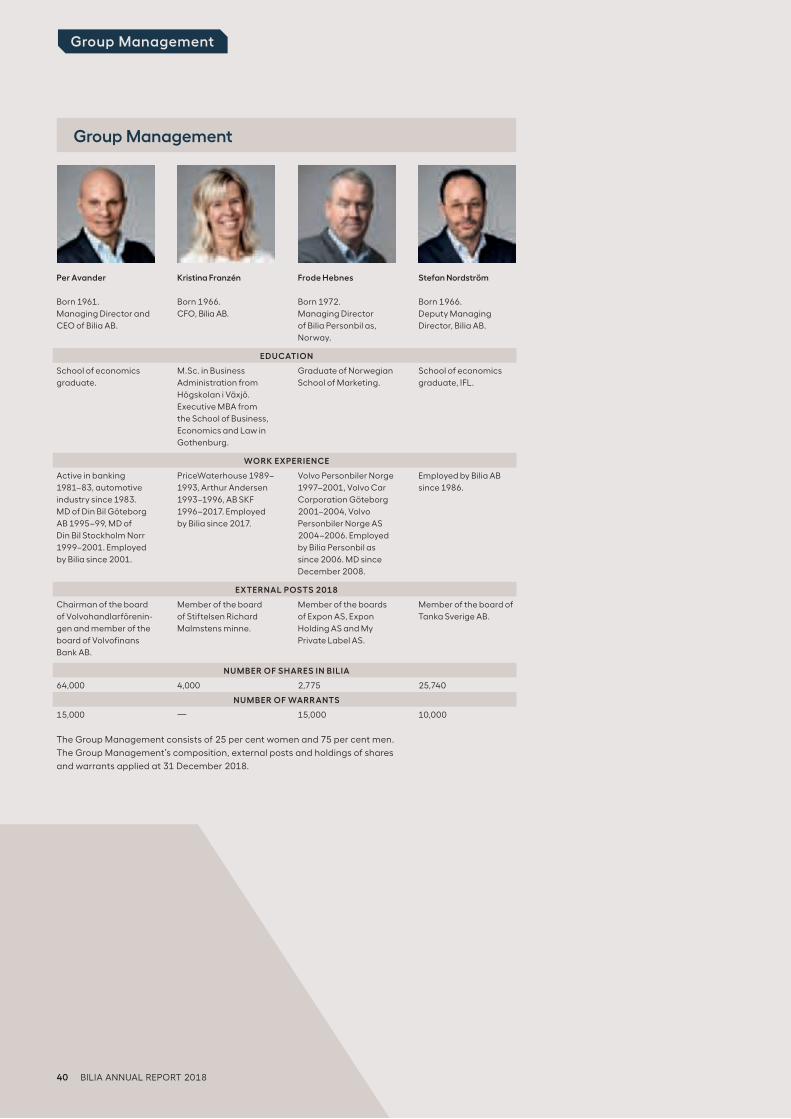
Per Avander
Born 1961.Managing Director and CEO of Bilia AB.
Kristina Franzén
Born 1966.CFO, Bilia AB.
Frode Hebnes
Born 1972.Managing Director of Bilia Personbil as, Norway.
Stefan Nordström
Born 1966.Deputy Managing Director, Bilia AB.
EDUCATION
School of economics graduate.
M.Sc. in Business Administration from Högskolan i Växjö. Executive MBA from the School of Business, Economics and Law in Gothenburg.
Graduate of Norwegian School of Marketing.
School of economics graduate, IFL.
WORK EXPERIENCE
Active in banking 1981–83, automotive industry since 1983. MD of Din Bil Göteborg AB 1995–99, MD of Din Bil Stockholm Norr 1999–2001. Employed by Bilia since 2001.
PriceWaterhouse 1989–1993, Arthur Andersen 1993–1996, AB SKF 1996–2017. Employed by Bilia since 2017.
Volvo Personbiler Norge 1997–2001, Volvo Car Corporation Göteborg 2001–2004, Volvo Personbiler Norge AS 2004–2006. Employed by Bilia Personbil as since 2006. MD since December 2008.
Employed by Bilia AB since 1986.
EXTERNAL POSTS 2018
Chairman of the board of Volvohandlarförenin-gen and member of the board of Volvofinans Bank AB.
Member of the board of Stiftelsen Richard Malmstens minne.
Member of the boards of Expon AS, Expon Holding AS and My Private Label AS.
Member of the board of Tanka Sverige AB.
NUMBER OF SHARES IN BILIA
64,000 4,000 2,775 25,740
NUMBER OF WARRANTS
15,000 — 15,000 10,000
The Group Management consists of 25 per cent women and 75 per cent men.The Group Management’s composition, external posts and holdings of shares and warrants applied at 31 December 2018.
Group Management
Group Management
40 BILIA ANNUAL REPORT 2018
BILIA ANNUAL REPORT 2018 41
The Bilia share
The Bilia share has been listed on the NASDAQ Stockholm
exchange since 1984. The share is traded under the ticker
code BILI A.
At 31 December 2018, the share capital amounted to
SEK 257 M (257), divided among 102,799,952 Series A shares,
including repurchased own shares of 1,849,000. The quotient
value is SEK 2.50 per share. Each share represents one vote. All
Series A shares are entitled to an equal share in Bilia’s assets
and profits.
Total returnThe OMX Stockholm Consumer Services PI fell by 17.8 per cent
in 2018. The Bilia share increased from SEK 80.00 to SEK 82.85
during the year. The highest price paid, SEK 89.30, was quoted
on 14 December 2018. The lowest price paid, SEK 64.40, was
quoted on 27 April 2018.
Bilia’s shareholders received a total return of 11 per cent
(–20) in 2018. The calculation is based on share price perfor-
mance.
Bilia’s market capitalisation at year-end was SEK 8,517 M
(8,224), based on the total number of shares outstanding.
A total of 86.9 million Bilia shares (72.0) were traded in 2018 at
a value of SEK 6,676 M (6,109). This turnover represented 86
per cent (70) of the weighted average number of shares.
The P/E ratio based on earnings in 2018 was 11 (12).
Beta coefficientThe volatility of the price of a single share compared with the
volatility of the stock market as a whole is known as the beta
coefficient, or beta. If the beta is greater than 1, this means
that the share price fluctuates more than the average for the
exchange. A value lower than 1 indicates that the share is less
sensitive than the exchange as a whole.
The Bilia share’s beta for the past five years is 0.74. This
means that the price fluctuations for the Bilia share have been
less than the average price fluctuations on NASDAQ Stock-
holm.
Number of shareholders decreasedBilia had 43,020 shareholders at the end of 2018, compared
with 43,259 a year earlier. Most shareholders own relatively
small lots. Of the shareholders, 86.1 per cent (84.5) owned
fewer than 1,000 shares. The proportion of institutional owner-
ship was 11.5 per cent (13.2), while the proportion of foreign
ownership was 28.8 per cent (19.5). Bilia's holding of repur-
chased shares amounted to 1.8 per cent.
Dividend policyOver a business cycle, Bilia’s dividend should provide the
shareholders with a competitive dividend yield in comparison
with similar listed companies. Good dividend growth is also
striven for, and the dividend should amount to at least 50 per
cent of the net profit for the year.
Bilia’s earning capacity, cash flow, investment needs and
overall financial position are also taken into account when
determining the size of the dividend. An effort is also made to
ensure that Bilia has an optimal capital structure at any given
time.
Proposed dividend SEK 4.75Bilia’s Board of Directors proposes to the Annual General Meet-
ing of 8 April 2019 that an ordinary dividend be paid in the
amount of SEK 4.75 per share (4.50). The proposed dividend
corresponds to 65 per cent (66) of the net profit for the year. If
the AGM approves this proposal, the dividend is expected to
be paid by Euroclear Sweden AB on 15 April 2019.
Stock splitDuring 2017, in accordance with a resolution by the AGM, the
number of shares was increased by dividing each share into
two shares (a 2-for-1 stock split) for the purpose of increasing
trade in the share. The record date for the stock split was 7
June 2017.
Analyses of BiliaThe Bilia share is analysed above all by Swedish brokerage
houses and banks. The following analysts cover Bilia regularly:
• Mats Liss, Kepler Cheuvreux, +46 8 723 51 18
• Stellan Hellström, Nordea Markets, +46 10 156 59 72
• Andreas Lundberg, ABG Sundal Collier, +46 8 566 286 00
• Nicklas Fhärm, SEB, +46 8 522 295 00
• Mika Karppinen, Handelsbanken Capital Markets,
+358 10 444 27 52
Shareholder informationBilia’s information to the stock market and its shareholders
should be characterised by correctness, relevance, openness
and speed. Shareholders wishing to receive the annual report
and half-year reports directly through the mail should notify
Euroclear Sweden AB.
Bilia’s press releases, quarterly reports and annual reports
are available at www.bilia.com. Additional information on the
company, its financial performance and the Bilia share can
also be found there. It is also possible to subscribe to press
releases and send queries to Bilia on Bilia’s website.
The Bilia share
Data per Share 2014 2015 2016 2017 2018
Earnings, SEK 3.85 2) 6.45 3) 6.20 4) 6.75 5) 7.25 6)
Equity, SEK 1) 18.35 20.40 24.40 25.95 28.85
Operating cash flow, SEK 7.45 2) 2.10 3) 4.55 4) 3.45 5) 5.35 6)
Share price at year-end, SEK 59.40 96.00 104.75 80.00 82.85
P/E ratio, times 15 15 17 12 11
Price/equity ratio, % 324 471 429 308 287
Dividend yield, % 6.1 4.8 4.3 5.3 6.2
Dividend, SEK 3.00 3.75 4.00 4.50 4.75 7)
Payout ratio, % 8) 79 59 65 66 65
1) Calculated based on the number of shares outstanding at the end of each year. For 2018 and 2017, the number of shares outstanding was 100,950,952 for 2016 it was 102,799,952, for 2015 it was 100,872,104, and for 2014 it was 100,696,132.
2) Calculated after exercised warrants corresponding to 137,764 shares during 2014, resulting in a weighted average number of shares of 100,619,052.3) Calculated after exercised warrants corresponding to 175,972 shares during 2015, resulting in a weighted average number of shares of 100,811,973.4) Calculated after exercised warrants corresponding to 529,364 shares during 2016 and 1,398,484 new issue of shares, for a weighted average number
of shares of 102,261,494.5) Calculated after buy-back of 1,849,000 shares during August–November 2017, resulting in a weighted average number of shares of 102,282,796.6) Calculated on a weighted average number of shares 2018, 100,950,9527) Proposed dividend.8) Calculated after assigned performance shares within the frame of incentive programs, which gives 101,054,370 number of outstanding shares
for 2018. Calculated after full exercise of the warrants, which gives 100,950,952 number of outstanding shares for 2017, 102,799,952 for 2016, 101,837,020 for 2015 and 2014.
All years have been recalculated after the 2:1 stock split in 2015 and 2017.
Change in share capital
The Bilia share
Distribution of shares, 31 December 2018
ShareholdingTotal number
of shareholdersPercentage of totalno. of shareholders
Combined numberof shares owned
Percentage ofshare capital
1–1,000 37,024 86.1 7,449,481 7.2
1,001–10,000 5,530 12.8 14,348,625 14.0
10,001–100,000 373 0.9 10,287,794 10.0
100,001– 92 0.2 68,865,052 67.0
Total 43,019 100.0 100,950,952 98.2
Repurchased own shares 1 0.0 1,849,000 1.8
Total 43,020 100.0 102,799,952 100.0
Year Number of shares Change Share capital, SEK M Change, SEK M Reason
1985 15,000,000 300
1987 21,000,000 6,000,000 420 120 Bonus issue
1988 21,032,486 32,486 421 1 New issue at conversion
1989 21,046,667 14,181 421 0 New issue at conversion
1990 21,076,925 30,258 422 1 New issue at conversion
1991 31,674,669 10,597,744 634 212 New issue at conversion
2001 28,554,512 –3,120,157 571 –63 Reduction
2002 25,699,061 –2,855,451 514 –57 Reduction
2004 1) 60,845,603 35,146,542 608 94 Share buy-back/reduction/lowering of par value of share/subordinated shares, Series C
2005 23,129,155 –37,716,448 231 –377 Redemption subordinated shares, Series C
2007 21,459,255 –1,669,900 215 –16 Reduction
2009 25,293,574 3,834,319 253 38 Exercised warrants
2010 24,883,946 –409,628 249 –4 Exercised warrants/reduction
2011 25,080,028 196,082 251 2 Exercised warrants
2012 25,114,099 34,071 251 0 Exercised warrants
2013 25,139,592 25,493 251 0 Exercised warrants
2014 25,174,033 34,441 252 1 Exercised warrants
2015 50,436,052 25,262,019 252 0 Exercised warrants/stock split
2016 51,399,976 963,924 257 5 Exercised warrants/new share issue
2017 102,799,952 51,399,976 257 0 Stock split/share buy-back
1) Of which subordinated shares, Series C, 37,716,448 shares, SEK 377 M.
42 BILIA ANNUAL REPORT 2018
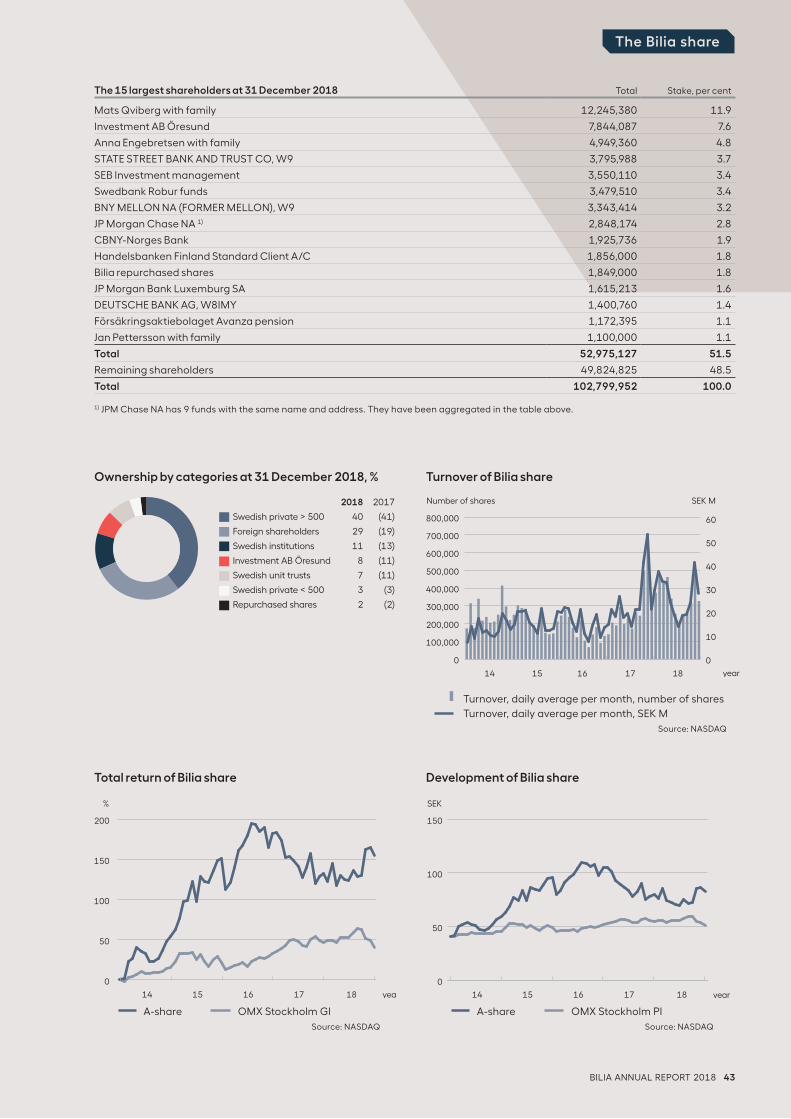
Turnover of Bilia share
Total return of Bilia share Development of Bilia share
0
100,000
200,000
300,000
400,000
500,000
600,000
700,000
800,000
0
10
20
30
40
50
60
14 15 16 17 18
Number of shares SEK M
year
A-share OMX Stockholm PI
Source: NASDAQ
A-share OMX Stockholm GI
Source: NASDAQ
Turnover, daily average per month, number of shares
Turnover, daily average per month, SEK M
Source: NASDAQ
0
50
100
150
14 15 16 17 18
SEK
year
0
50
100
150
200
14 15 16 17 18
%
yea
Ownership by categories at 31 December 2018, %
2018 2017
Swedish private > 500 40 (41)
Foreign shareholders 29 (19)
Swedish institutions 11 (13)
Investment AB Öresund 8 (11)
Swedish unit trusts 7 (11)
Swedish private < 500 3 (3)
Repurchased shares 2 (2)
The 15 largest shareholders at 31 December 2018 Total Stake, per cent
Mats Qviberg with family 12,245,380 11.9
Investment AB Öresund 7,844,087 7.6
Anna Engebretsen with family 4,949,360 4.8
STATE STREET BANK AND TRUST CO, W9 3,795,988 3.7
SEB Investment management 3,550,110 3.4
Swedbank Robur funds 3,479,510 3.4
BNY MELLON NA (FORMER MELLON), W9 3,343,414 3.2
JP Morgan Chase NA 1) 2,848,174 2.8
CBNY-Norges Bank 1,925,736 1.9
Handelsbanken Finland Standard Client A/C 1,856,000 1.8
Bilia repurchased shares 1,849,000 1.8
JP Morgan Bank Luxemburg SA 1,615,213 1.6
DEUTSCHE BANK AG, W8IMY 1,400,760 1.4
Försäkringsaktiebolaget Avanza pension 1,172,395 1.1
Jan Pettersson with family 1,100,000 1.1
Total 52,975,127 51.5
Remaining shareholders 49,824,825 48.5
Total 102,799,952 100.0
1) JPM Chase NA has 9 funds with the same name and address. They have been aggregated in the table above.
BILIA ANNUAL REPORT 2018 43
The Bilia share
44 BILIA ANNUAL REPORT 2018
Financial information Group
Financial information PageConsolidated Statement of Income and Other Comprehensive Income 45Consolidated Statement of Financial Position 47Consolidated Statement of Changes in Equity 49Consolidated Statement of Cash Flows 50
Note Bilia Group IFRS standard Page 1 Key accounting principles 52 2 Revenue IFRS 15 Revenue from Contracts with Customers 54 3 Income from supplementary services 55
in the Car Business 4 Operating segments IFRS 8 Operating Segments 55 5 Business combinations IFRS 3 Business Combinations 58 6 Other operating income 60 7 Other operating expenses 60 8 Employees, personnel costs and IAS 19 Employee Benefits 61 remunerations for senior officers 9 Fees and cost reimbursement to auditors 64 10 Operating expenses classified by nature of expense 64 11 Net financial items IAS 21 The Effects of Changes in Foreign Exchange Rates 64 IAS 23 Borrowing Costs IAS 28 Investments in Associates and Joint Ventures IAS 37 Provisions, Contingent Liabilities and Contingent Assets IFRS 9 Financial Instruments 12 Taxes IAS 12 Income Taxes 65 13 Earnings per share IAS 33 Earnings Per Share 67 14 Intangible assets IAS 38 Intangible Assets 68 15 Property, plant and equipment IAS 16 Property, Plant and Equipment 71 IAS 17 Leases 16 Interests in associated companies IAS 28 Investments in Associates and Joint Ventures 74 17 Financial investments IFRS 9 Financial Instruments 75 18 Long-term receivables and other receivables 75 19 Inventories IAS 2 Inventories 75 20 Prepaid expenses and accrued income 75 21 Interest-bearing liabilities IAS 17 Leases 76 IFRS 9 Financial Instruments 22 Pensions IAS 19 Employee Benefits 77 23 Provisions IAS 37 Provisions, Contingent Liabilities 78 and Contingent Assets 24 Other liabilities 79 25 Accrued expenses and deferred income 79 26 Financial instruments IAS 32 Financial Instruments: Presentation 79 IFRS 9 Financial Instruments IFRS 7 Financial Instruments: Disclosures IFRS 13 Fair Value Measurement 27 Financial risks and risk management IFRS 7 Financial Instruments: Disclosures 81 IFRS 13 Fair Value Measurement 28 Operating leases IAS 17 Leases 85 29 Capital commitments IAS 16 Property, Plant and Equipment 86 IAS 38 Intangible Assets 30 Pledged assets and contingent liabilities IAS 37 Provisions, Contingent Liabilities 86 and Contingent Assets 31 Related parties IAS 24 Related Party Disclosures 87 32 Cash and cash equivalents and IAS 7 Statement of Cash Flows 87 specifications for cash flows 33 Events after the balance sheet date IAS 10 Events After the Reporting Period 88 34 Information about the Parent Company 88
Income Statement for Parent Company 89Balance Sheet for Parent Company 90Statement of Changes in Equity for Parent Company 92Cash Flow Statement for Parent Company 93Notes to the Parent Company Financial Statements 94
Contents
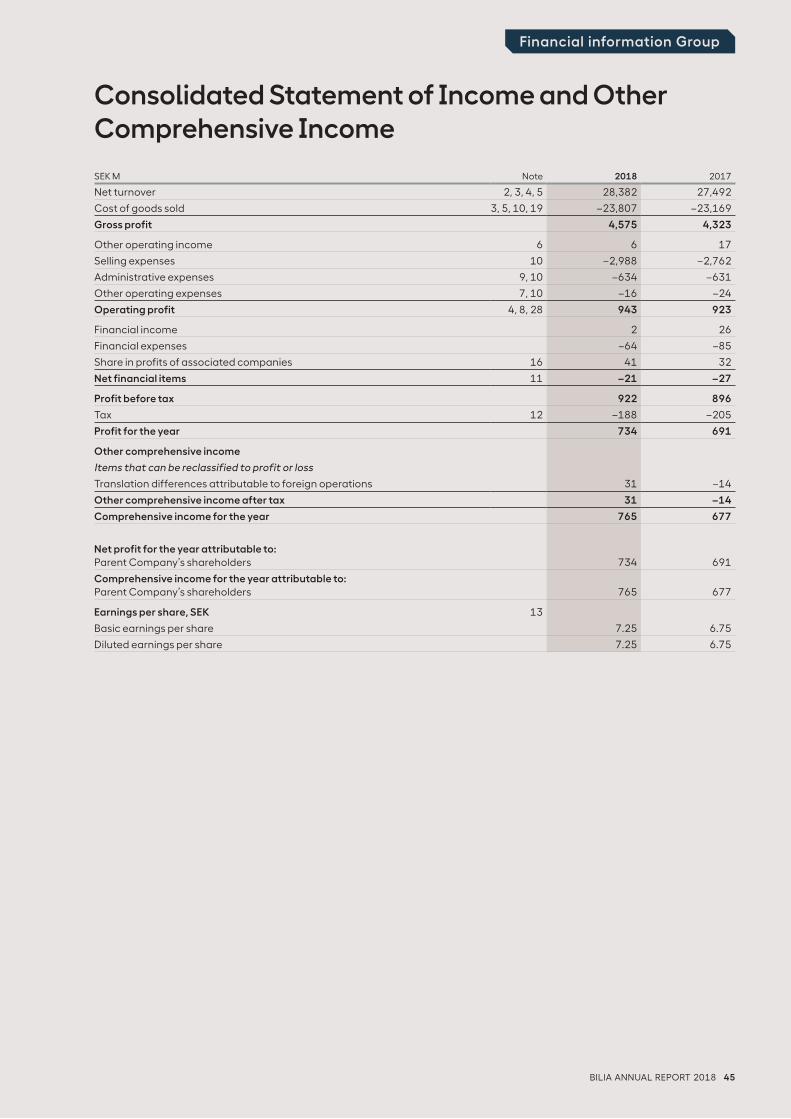
BILIA ANNUAL REPORT 2018 45
Financial information Group
Consolidated Statement of Income and Other C omprehensive Income
SEK M Note 2018 2017
Net turnover 2, 3, 4, 5 28,382 27,492
Cost of goods sold 3, 5, 10, 19 –23,807 –23,169
Gross profit 4,575 4,323
Other operating income 6 6 17
Selling expenses 10 –2,988 –2,762
Administrative expenses 9, 10 –634 –631
Other operating expenses 7, 10 –16 –24
Operating profit 4, 8, 28 943 923
Financial income 2 26
Financial expenses –64 –85
Share in profits of associated companies 16 41 32
Net financial items 11 –21 –27
Profit before tax 922 896
Tax 12 –188 –205
Profit for the year 734 691
Other comprehensive income
Items that can be reclassified to profit or loss
Translation differences attributable to foreign operations 31 –14
Other comprehensive income after tax 31 –14
Comprehensive income for the year 765 677
Net profit for the year attributable to:Parent Company’s shareholders 734 691
Comprehensive income for the year attributable to:Parent Company’s shareholders 765 677
Earnings per share, SEK 13
Basic earnings per share 7.25 6.75
Diluted earnings per share 7.25 6.75
46 BILIA ANNUAL REPORT 2018
Financial information Group
Net turnoverNet turnover amounted to SEK 28,382 M (27,492), an increase
of 3 per cent during the year. Adjusted for comparable opera-
tions and exchange rate movements, net turnover increased
by 1 per cent. The increase was primarily attributable to the
Service Business.
Net turnover in the Service Business increased by 8 per
cent to total SEK 6,453 M (5,998). Adjusted net turnover (see
definition on page 110) increased by 5 per cent (5). In Sweden,
underlying turnover increased by 5 per cent (7), in Norway by
5 per cent (4).
Net turnover in the Car Business increased by 2 per cent to
total SEK 21,988 M (21,607). Adjusted for comparable opera-
tions and exchange rate movements, net turnover decreased
by 1 per cent (9). In Sweden underlying turnover increased by
1 per cent (5), while underlying turnover in Norway fell by 6 per
cent (18).
Income from related services in the form of financing
increased by 2 per cent (23) to SEK 696 M (680). Income from
long-term leases increased by SEK 10 M (89) and commission
from finance companies increased by SEK 6 M (36).
Net turnover in the Fuel Business increased by 14 per cent
(11) to total SEK 1,297 M (1,141). The entire increase is attribut-
able to Sweden.
Operating profit Operating profit for the Group totalled SEK 943 M (923).
Operational earnings increased by 3 per cent to total SEK
1,034 M (1,006), the margin amounting to 3.6 per cent (3.7).
Performance analysis, SEK M 2018 2017
Operational earnings 1,034 1,006
Gain from sale of operation, other — 8
Structural costs etc. –8 –17
Acquisition-related costs and value adjustments –6 –3
Amortisation of surplus values –77 –71
Operating profit 943 923
Profit from sale of operations during 2017 relates to the sale
of the Ford operation in Stockholm. Structural costs during
2018 primarily relate to downsizing costs. Structural costs dur-
ing 2017 primarily relate to the estimated cost of discontinuing
remaining Ford operations in Sweden and Norway.
Acquisition-related expenses and value adjustments relate
to costs for acquiring operations. Amortisation of surplus
values pertains amortisation according to plan of aquired
intangible assets.
Operational earnings in the Swedish operation totalled SEK
769 M (773) with a margin of 4.3 per cent (4.5). In Norway
earnings increased to SEK 258 M (243) with a margin of 3.5 per
cent (3.3). In Western Europe earnings increased to SEK 73 M
(53) with a margin of 2.3 per cent (1.8).
Operational earnings for the Parent Company totalled SEK
–70 M (–68).
Operational earnings for the Service Business increased by
9 per cent to SEK 766 M (704). The higher turnover was the
main factor behind the increase. The Service Business margin
increased to 11.9 per cent (11.7).
Operational earnings for the Car Business totalled SEK 304
M (333). The decrease was mainly due to sales and the gross
profit margin of new cars in Sweden. The profit from sales of
used cars increased by SEK 27 M to SEK 62 M (35). The Car
Business margin fell to 1.4 per cent (1.5). Deliveries of new cars
for comparable units fell by 5 per cent (4) and the order intake
decreased by 9 per cent (decrease: 1). The order backlog for
new cars declined by 14 per cent, totalling 9,646 cars (11,246)
at year-end.
Operational earnings for the Fuel Business totalled SEK 30 M
(32). The decline was due to a lower gross profit margin.
Net financial itemsNet financial items amounted to SEK –21 M (–27). The im-
provement on last year was mainly due to higher profits from
shares in associated companies.
Profit before taxProfit before tax increased by SEK 26 M and totalled SEK 922
M (896).
Tax for the yearTax for the year fell by SEK 17 M to total SEK –188 M (–205),
and the effective tax rate was 20 per cent (23).
Profit for the yearProfit for the year totalled SEK 734 M (691). This equates to
earnings per share of SEK 7.25 (6.75) based on the average
number of outstanding shares. The profit margin was 2.6 per
cent (2.6).
Comments on Consolidated Statement of Income and Other Comprehensive Income
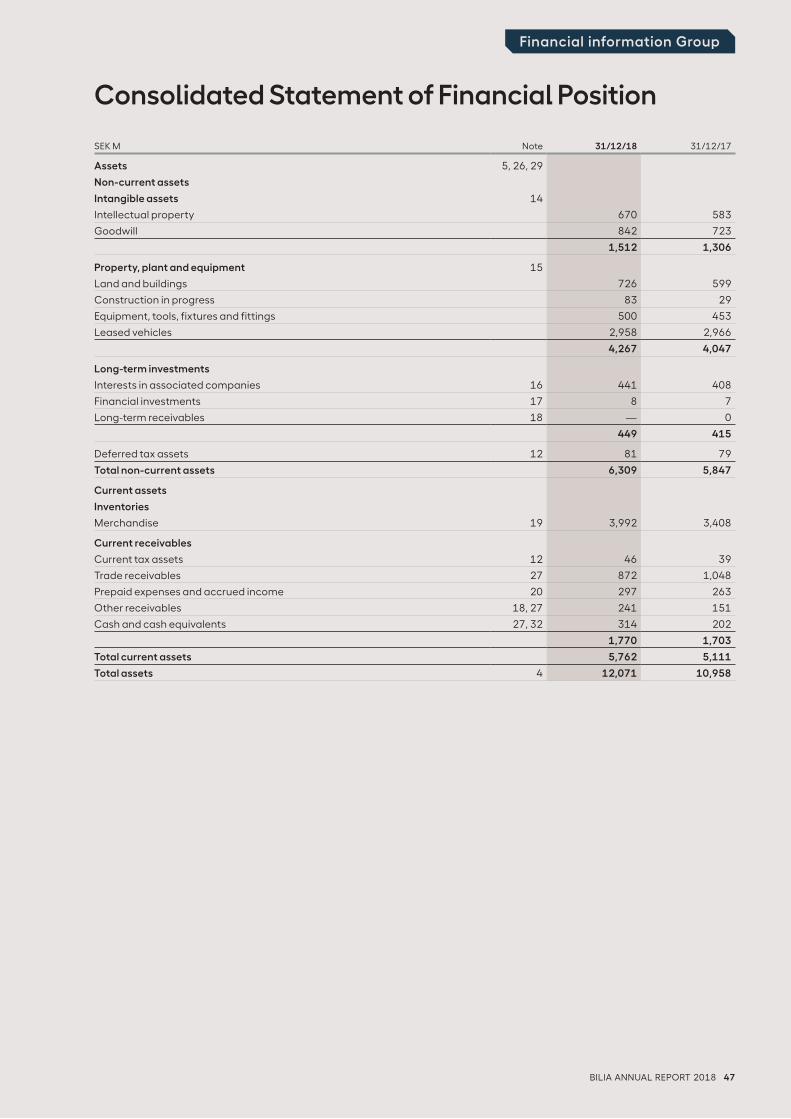
BILIA ANNUAL REPORT 2018 47
Financial information Group
SEK M Note 31/12/18 31/12/17
Assets 5, 26, 29
Non-current assets
Intangible assets 14
Intellectual property 670 583
Goodwill 842 723
1,512 1,306
Property, plant and equipment 15
Land and buildings 726 599
Construction in progress 83 29
Equipment, tools, fixtures and fittings 500 453
Leased vehicles 2,958 2,966
4,267 4,047
Long-term investments
Interests in associated companies 16 441 408
Financial investments 17 8 7
Long-term receivables 18 — 0
449 415
Deferred tax assets 12 81 79
Total non-current assets 6,309 5,847
Current assets
Inventories
Merchandise 19 3,992 3,408
Current receivables
Current tax assets 12 46 39
Trade receivables 27 872 1,048
Prepaid expenses and accrued income 20 297 263
Other receivables 18, 27 241 151
Cash and cash equivalents 27, 32 314 202
1,770 1,703
Total current assets 5,762 5,111
Total assets 4 12,071 10,958
Consolidated Statement of Financial Position
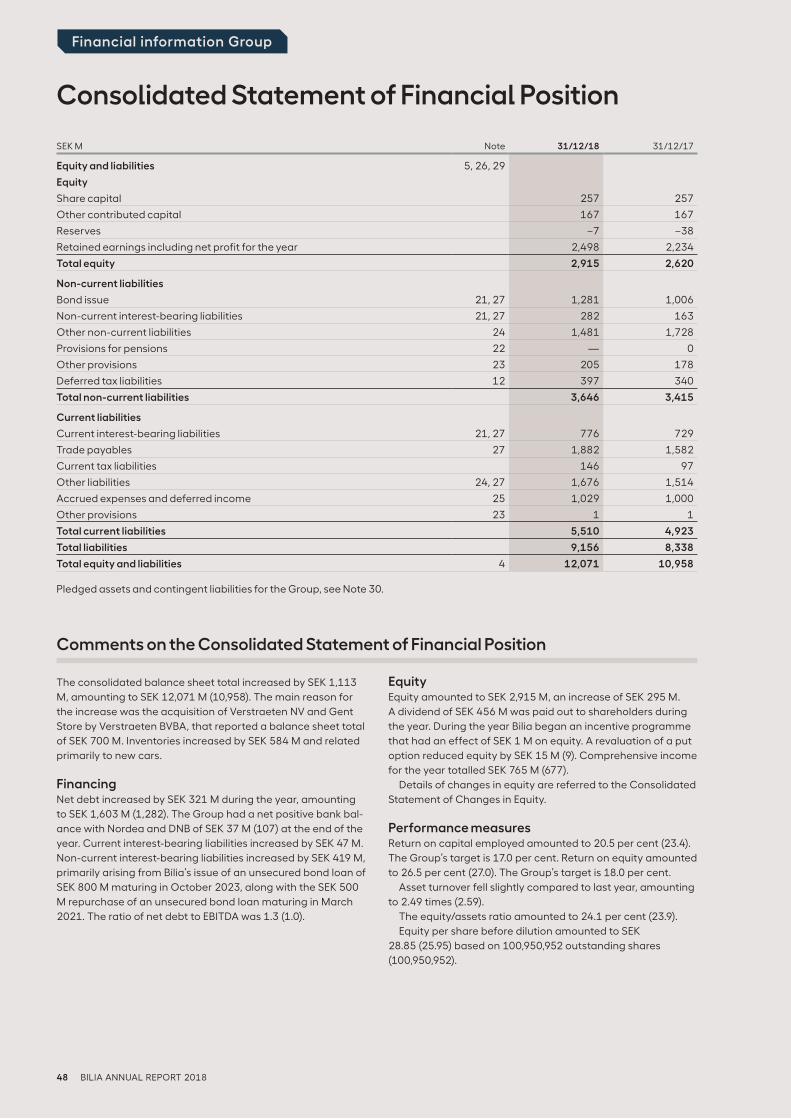
48 BILIA ANNUAL REPORT 2018
Financial information Group
Consolidated Statement of Financial Position
SEK M Note 31/12/18 31/12/17
Equity and liabilities 5, 26, 29
Equity
Share capital 257 257
Other contributed capital 167 167
Reserves –7 –38
Retained earnings including net profit for the year 2,498 2,234
Total equity 2,915 2,620
Non-current liabilities
Bond issue 21, 27 1,281 1,006
Non-current interest-bearing liabilities 21, 27 282 163
Other non-current liabilities 24 1,481 1,728
Provisions for pensions 22 — 0
Other provisions 23 205 178
Deferred tax liabilities 12 397 340
Total non-current liabilities 3,646 3,415
Current liabilities
Current interest-bearing liabilities 21, 27 776 729
Trade payables 27 1,882 1,582
Current tax liabilities 146 97
Other liabilities 24, 27 1,676 1,514
Accrued expenses and deferred income 25 1,029 1,000
Other provisions 23 1 1
Total current liabilities 5,510 4,923
Total liabilities 9,156 8,338
Total equity and liabilities 4 12,071 10,958
Pledged assets and contingent liabilities for the Group, see Note 30.
Comments on the Consolidated Statement of Financial Position
The consolidated balance sheet total increased by SEK 1,113
M, amounting to SEK 12,071 M (10,958). The main reason for
the increase was the acquisition of Verstraeten NV and Gent
Store by Verstraeten BVBA, that reported a balance sheet total
of SEK 700 M. Inventories increased by SEK 584 M and related
primarily to new cars.
FinancingNet debt increased by SEK 321 M during the year, amounting
to SEK 1,603 M (1,282). The Group had a net positive bank bal-
ance with Nordea and DNB of SEK 37 M (107) at the end of the
year. Current interest-bearing liabilities increased by SEK 47 M.
Non-current interest-bearing liabilities increased by SEK 419 M,
primarily arising from Bilia’s issue of an unsecured bond loan of
SEK 800 M maturing in October 2023, along with the SEK 500
M repurchase of an unsecured bond loan maturing in March
2021. The ratio of net debt to EBITDA was 1.3 (1.0).
EquityEquity amounted to SEK 2,915 M, an increase of SEK 295 M.
A dividend of SEK 456 M was paid out to shareholders during
the year. During the year Bilia began an incentive programme
that had an effect of SEK 1 M on equity. A revaluation of a put
option reduced equity by SEK 15 M (9). Comprehensive income
for the year totalled SEK 765 M (677).
Details of changes in equity are referred to the Consolidated
Statement of Changes in Equity.
Performance measuresReturn on capital employed amounted to 20.5 per cent (23.4).
The Group’s target is 17.0 per cent. Return on equity amounted
to 26.5 per cent (27.0). The Group’s target is 18.0 per cent.
Asset turnover fell slightly compared to last year, amounting
to 2.49 times (2.59).
The equity/assets ratio amounted to 24.1 per cent (23.9).
Equity per share before dilution amounted to SEK
28.85 (25.95) based on 100,950,952 outstanding shares
(100,950,952).
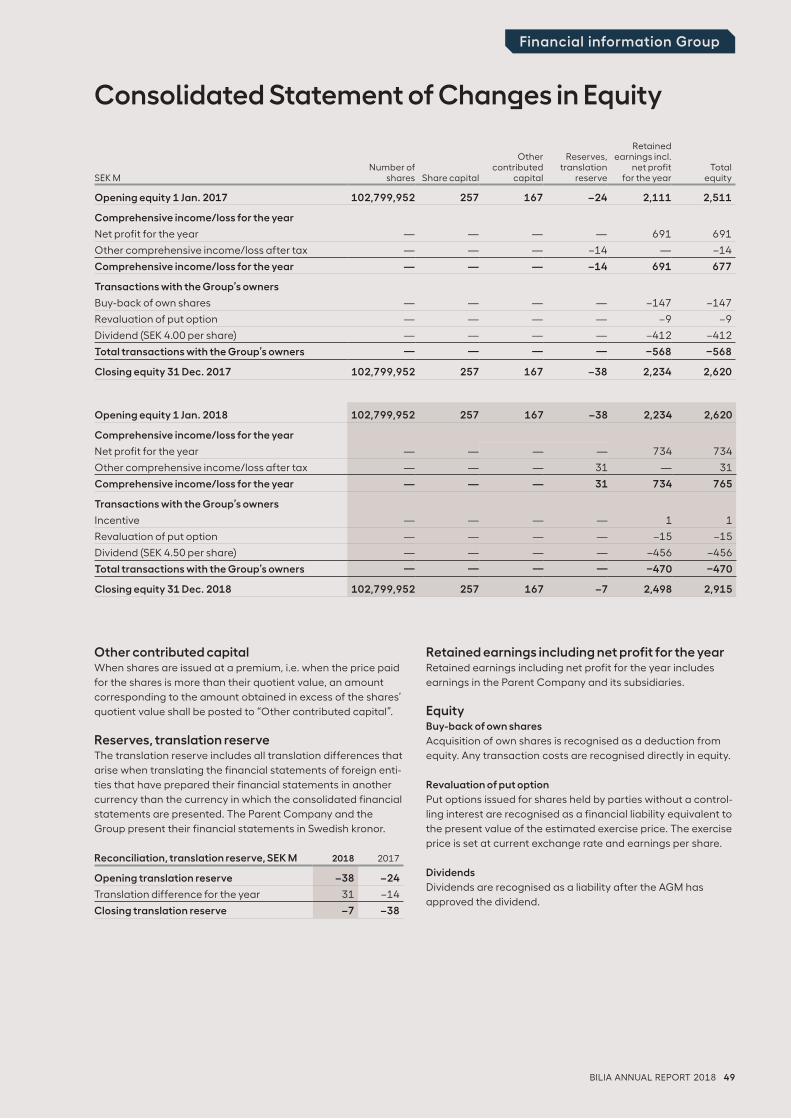
BILIA ANNUAL REPORT 2018 49
Financial information Group
Other contributed capitalWhen shares are issued at a premium, i.e. when the price paid
for the shares is more than their quotient value, an amount
corresponding to the amount obtained in excess of the shares’
quotient value shall be posted to “Other contributed capital”.
Reserves, translation reserveThe translation reserve includes all translation differences that
arise when translating the financial statements of foreign enti-
ties that have prepared their financial statements in another
currency than the currency in which the consolidated financial
statements are presented. The Parent Company and the
Group present their financial statements in Swedish kronor.
Retained earnings including net profit for the yearRetained earnings including net profit for the year includes
earnings in the Parent Company and its subsidiaries.
EquityBuy-back of own shares
Acquisition of own shares is recognised as a deduction from
equity. Any transaction costs are recognised directly in equity.
Revaluation of put option
Put options issued for shares held by parties without a control-
ling interest are recognised as a financial liability equivalent to
the present value of the estimated exercise price. The exercise
price is set at current exchange rate and earnings per share.
Dividends
Dividends are recognised as a liability after the AGM has
approved the dividend.
Consolidated Statement of Changes in Equity
Reconciliation, translation reserve, SEK M 2018 2017
Opening translation reserve –38 –24
Translation difference for the year 31 –14
Closing translation reserve –7 –38
SEK MNumber of
shares Share capital
Othercontributed
capital
Reserves,translation
reserve
Retainedearnings incl.
net profitfor the year
Totalequity
Opening equity 1 Jan. 2017 102,799,952 257 167 –24 2,111 2,511
Comprehensive income/loss for the year
Net profit for the year — — — — 691 691
Other comprehensive income/loss after tax — — — –14 — –14
Comprehensive income/loss for the year — — — –14 691 677
Transactions with the Group’s owners
Buy-back of own shares — — — — –147 –147
Revaluation of put option — — — — –9 –9
Dividend (SEK 4.00 per share) — — — — –412 –412
Total transactions with the Group’s owners — — — — –568 –568
Closing equity 31 Dec. 2017 102,799,952 257 167 –38 2,234 2,620
Opening equity 1 Jan. 2018 102,799,952 257 167 –38 2,234 2,620
Comprehensive income/loss for the year
Net profit for the year — — — —— 734 734
Other comprehensive income/loss after tax — — — 31 — 31
Comprehensive income/loss for the year — — — 31 734 765
Transactions with the Group’s owners
Incentive — — — — 1 1
Revaluation of put option — — — — –15 –15
Dividend (SEK 4.50 per share) — — — — –456 –456
Total transactions with the Group’s owners — — — — –470 –470
Closing equity 31 Dec. 2018 102,799,952 257 167 –7 2,498 2,915
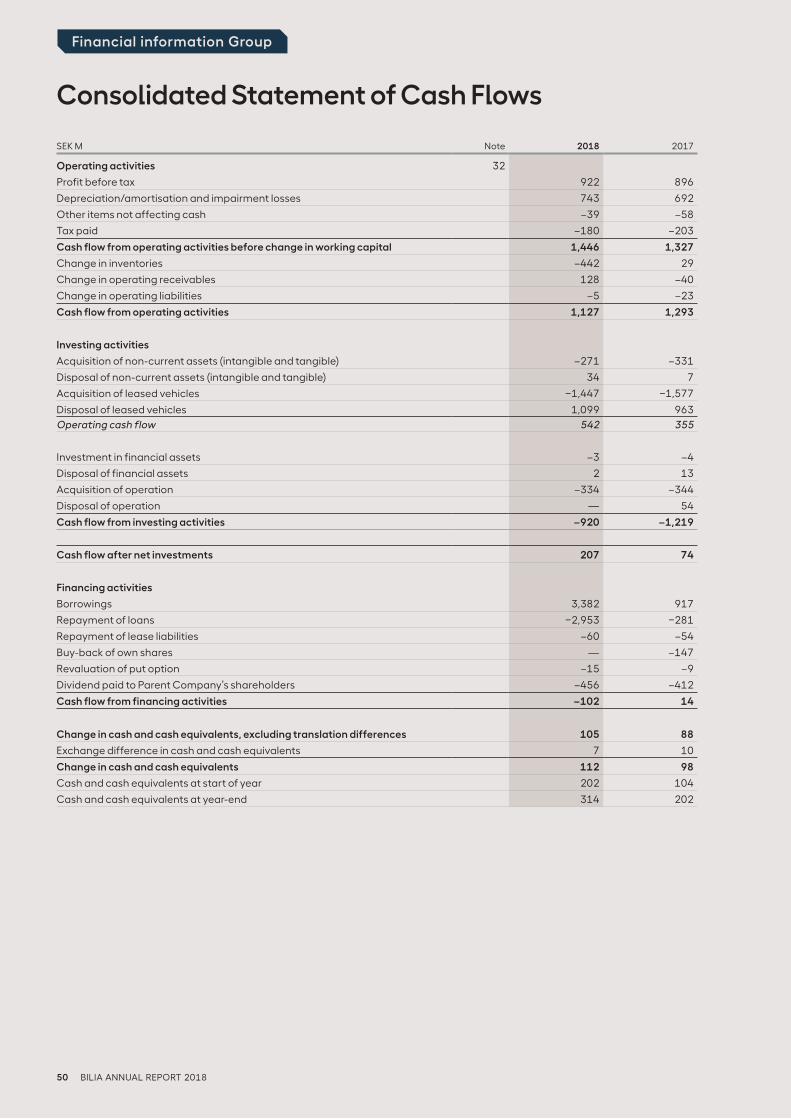
50 BILIA ANNUAL REPORT 2018
Financial information Group
SEK M Note 2018 2017
Operating activities 32
Profit before tax 922 896
Depreciation/amortisation and impairment losses 743 692
Other items not affecting cash –39 –58
Tax paid –180 –203
Cash flow from operating activities before change in working capital 1,446 1,327
Change in inventories –442 29
Change in operating receivables 128 –40
Change in operating liabilities –5 –23
Cash flow from operating activities 1,127 1,293
Investing activities
Acquisition of non-current assets (intangible and tangible) –271 –331
Disposal of non-current assets (intangible and tangible) 34 7
Acquisition of leased vehicles –1,447 –1,577
Disposal of leased vehicles 1,099 963
Operating cash flow 542 355
Investment in financial assets –3 –4
Disposal of financial assets 2 13
Acquisition of operation –334 –344
Disposal of operation — 54
Cash flow from investing activities –920 –1,219
Cash flow after net investments 207 74
Financing activities
Borrowings 3,382 917
Repayment of loans –2,953 –281
Repayment of lease liabilities –60 –54
Buy-back of own shares — –147
Revaluation of put option –15 –9
Dividend paid to Parent Company’s shareholders –456 –412
Cash flow from financing activities –102 14
Change in cash and cash equivalents, excluding translation differences 105 88
Exchange difference in cash and cash equivalents 7 10
Change in cash and cash equivalents 112 98
Cash and cash equivalents at start of year 202 104
Cash and cash equivalents at year-end 314 202
Consolidated Statement of Cash Flows
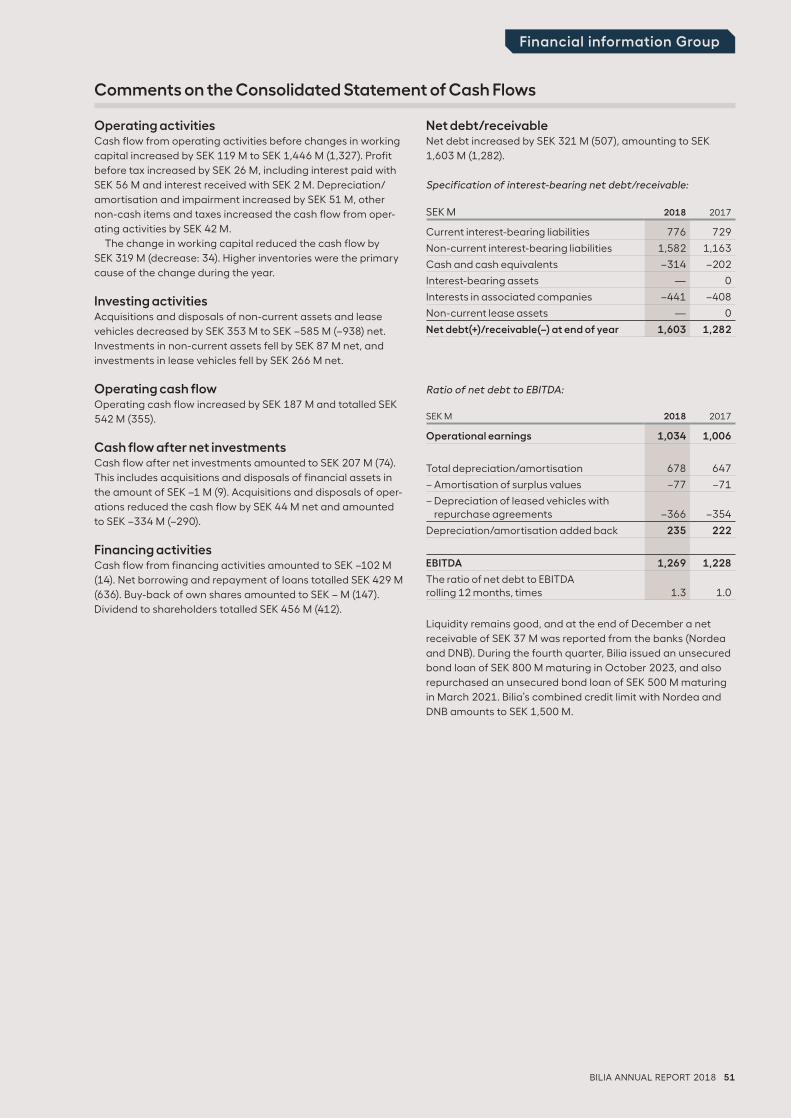
BILIA ANNUAL REPORT 2018 51
Financial information Group
Operating activities Cash flow from operating activities before changes in working
capital increased by SEK 119 M to SEK 1,446 M (1,327). Profit
before tax increased by SEK 26 M, including interest paid with
SEK 56 M and interest received with SEK 2 M. Depreciation/
amortisation and impairment increased by SEK 51 M, other
non-cash items and taxes increased the cash flow from oper-
ating activities by SEK 42 M.
The change in working capital reduced the cash flow by
SEK 319 M (decrease: 34). Higher inventories were the primary
cause of the change during the year.
Investing activitiesAcquisitions and disposals of non-current assets and lease
vehicles decreased by SEK 353 M to SEK –585 M (–938) net.
Investments in non-current assets fell by SEK 87 M net, and
investments in lease vehicles fell by SEK 266 M net.
Operating cash flowOperating cash flow increased by SEK 187 M and totalled SEK
542 M (355).
Cash flow after net investmentsCash flow after net investments amounted to SEK 207 M (74).
This includes acquisitions and disposals of financial assets in
the amount of SEK –1 M (9). Acquisitions and disposals of oper-
ations reduced the cash flow by SEK 44 M net and amounted
to SEK –334 M (–290).
Financing activitiesCash flow from financing activities amounted to SEK –102 M
(14). Net borrowing and repayment of loans totalled SEK 429 M
(636). Buy-back of own shares amounted to SEK – M (147).
Dividend to shareholders totalled SEK 456 M (412).
Net debt/receivableNet debt increased by SEK 321 M (507), amounting to SEK
1,603 M (1,282).
Specification of interest-bearing net debt/receivable:
SEK M 2018 2017
Current interest-bearing liabilities 776 729
Non-current interest-bearing liabilities 1,582 1,163
Cash and cash equivalents –314 –202
Interest-bearing assets — 0
Interests in associated companies –441 –408
Non-current lease assets — 0
Net debt(+)/receivable(–) at end of year 1,603 1,282
Ratio of net debt to EBITDA:
SEK M 2018 2017
Operational earnings 1,034 1,006
Total depreciation/amortisation 678 647
– Amortisation of surplus values –77 –71
– Depreciation of leased vehicles with repurchase agreements –366 –354
Depreciation/amortisation added back 235 222
EBITDA 1,269 1,228
The ratio of net debt to EBITDA rolling 12 months, times 1.3 1.0
Liquidity remains good, and at the end of December a net
receivable of SEK 37 M was reported from the banks (Nordea
and DNB). During the fourth quarter, Bilia issued an unsecured
bond loan of SEK 800 M maturing in October 2023, and also
repurchased an unsecured bond loan of SEK 500 M maturing
in March 2021. Bilia’s combined credit limit with Nordea and
DNB amounts to SEK 1,500 M.
Comments on the Consolidated Statement of Cash Flows
52 BILIA ANNUAL REPORT 2018
Financial information Group
Amounts in SEK M unless otherwise stated.
The consolidated accounts have been prepared in accord-ance with International Financial Reporting Standards (IFRS) issued by the International Accounting Standards Board (IASB) as adopted by the EU. Furthermore, the Swedish Financial Reporting Board’s recommendation RFR 1 Supplementary Ac-counting Rules for Groups has been applied.
The Group accounting policies have been consistently applied to all periods presented in the consolidated financial statements, unless otherwise stated below.
The annual accounts and consolidated accounts were ap-proved for publication by the Board of Directors and Manag-ing Director on 8 March 2019. The Consolidated Statement
of Income and Other Comprehensive Income and the Parent
Company’s Income Statement and Balance Sheet will be sub-
ject to adoption at the AGM on 8 April 2019.
Bilia describes the accounting policies in connection with
each note for the purpose of providing a better understanding
of the accounting area in question. Bilia focuses on describ-
ing the accounting choices that have been made within the
framework of the applicable IFRS policy and avoids repeating
the text of the standard unless it is considered particularly
important for an understanding of the content of the note.
Valuation criteria applied in the preparation of Parent Company and consolidated financial statementsAssets and liabilities are recognised at cost, except for certain
financial assets and liabilities, which are measured at fair
value. Financial assets and liabilities that are measured at fair
value consist of derivative instruments measured at fair value
through profit or loss and financial assets.
Functional currency and presentation currencyThe Parent Company’s functional currency is the Swedish
krona (SEK), which is also the presentation currency for the
Parent Company and the Group. This means that the financial
statements are presented in Swedish kronor.
Revised accounting policiesNew IFRSs have not had any significant effect on the Group’s
or the Parent Company’s financial reports during the year.
Starting on 1 January 2018, IFRS 9 Financial Instruments came
into force and replaced the previous standard IAS 39 Financial
Instruments: Recognition and Measurement. IFRS 9 includes
a model for classification and measurement, a forward-
looking “expected loss” impairment model and a substantially
reformed approach to hedge accounting.
Starting on 1 January 2018, IFRS 15 Revenue from Contracts
with Customers came into force and replaced previous IFRS
standards dealing with Revenue Recognition. IFRS 15 is based
on recognising revenue when control of goods or services is
transferred to the customer, which differs from the transfer of
risks and benefits.
Alternative performance measuresBilia applies the new guidelines from the European Securities
and Markets Authority (ESMA) concerning alternative perfor-
mance measures (APMs). Even though these performance
measures are not defined or specified by IFRS, Bilia believes
that they provide valuable information to investors but also
for Bilia’s management as a complement to IFRS for better
assessing Bilia’s performance. Definitions and performance
measures in this report are shown on page 110. Reconciliation
of performance measures can be found at bilia.com/finances/
finances/performance-measures/.
New IFRS that have not yet been appliedA number of new or revised IFRS will come into effect in the
coming financial year and have not been applied in the prepa-
ration of these financial statements.
As of 2019, IFRS 16 Leases replaces existing IFRS relating
to accounting of leases, such as IAS 17 Leases and IFRIC 4
Determining Whether an Arrangement Contains a Lease. Bilia
will apply IFRS 16 as of 1 January 2019.
IFRS 16 mainly affects leases where Bilia is the lessee. Bilia
will recognise new assets and liabilities for operating leases
regarding the operation’s facilities. The cost of these leases
will be changed, because Bilia will recognise depreciation for
right-of-use assets and interest expenses for lease liabilities.
Bilia previously recognised costs for operating leases on a
straight-line basis over the term of the lease and prepaid leas-
ing payments only to the extent that there was a difference
between actual lease payments and the recognised cost.
No material difference will be recognised for Bilia’s finance
leases.
Based on the information available, Bilia will recognise
further lease liabilities of around SEK 2,600–2,700 M after
adjustments for pre-paid lease payments recognised and
right-of-use assets of around SEK 2,600–2,700 M.
Bilia expects operating profit for 2019 to be higher, provided
the group structure and exchange rates for 2018, than if the pre-
vious accounting policies had been applied because some of the
lease costs will be recognised as an interest expense. Profit be-
fore tax is expected to decrease. EBITDA is expected to increase
because the lease costs will partly be recognised as depreciation.
Cash flow is expected to increase from operating activities and
decrease from financing activities, because the repayment part
of the lease payments will be recognised as an outward payment
in financing activities.
Bilia does not expect the introduction of IFRS 16 to affect
its ability to abide by the maximum debt/equity ratio in the
Group’s loan terms.
No material effect will be recognised for leases in which Bilia
is the lessor.
Bilia will apply the modified retrospective approach. This
means that the financial year of 2018 will not be re-calculated.
Bilia will apply the relaxation rule of “inheriting” the former
Notes to the Consolidated Financial Statements
Note 1 Key accounting principles
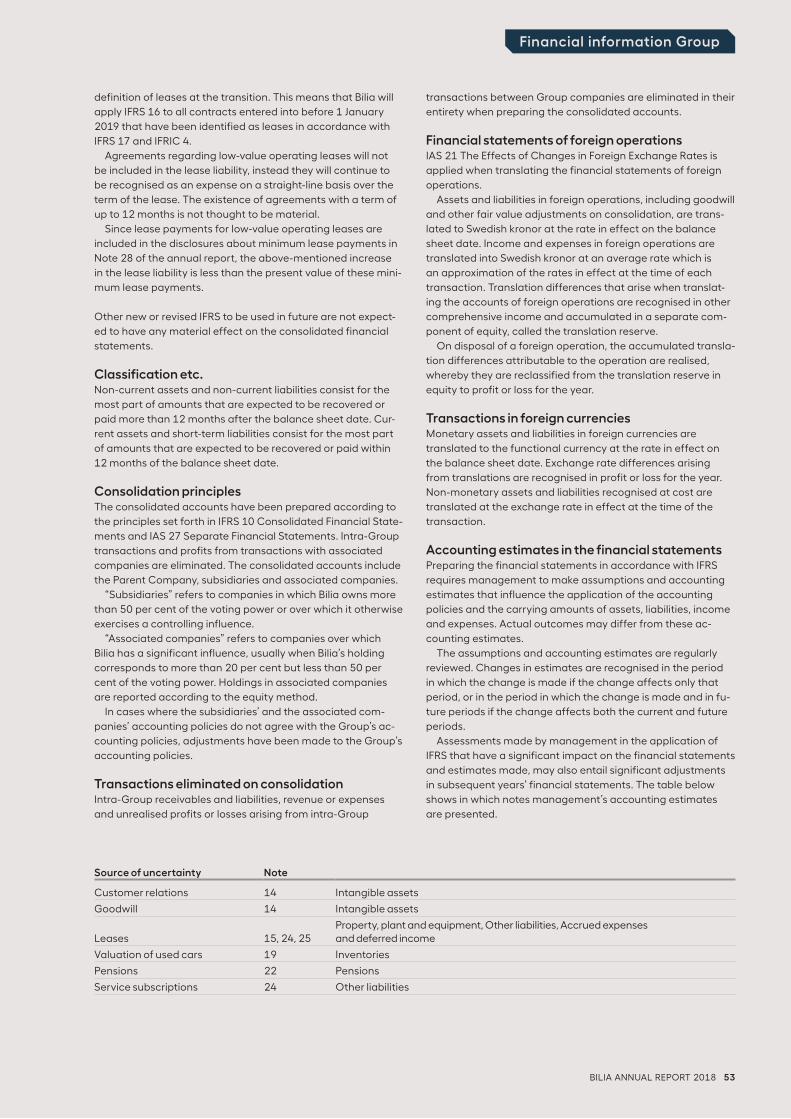
BILIA ANNUAL REPORT 2018 53
Financial information Group
definition of leases at the transition. This means that Bilia will
apply IFRS 16 to all contracts entered into before 1 January
2019 that have been identified as leases in accordance with
IFRS 17 and IFRIC 4.
Agreements regarding low-value operating leases will not
be included in the lease liability, instead they will continue to
be recognised as an expense on a straight-line basis over the
term of the lease. The existence of agreements with a term of
up to 12 months is not thought to be material.
Since lease payments for low-value operating leases are
included in the disclosures about minimum lease payments in
Note 28 of the annual report, the above-mentioned increase
in the lease liability is less than the present value of these mini-
mum lease payments.
Other new or revised IFRS to be used in future are not expect-
ed to have any material effect on the consolidated financial
statements.
Classification etc.Non-current assets and non-current liabilities consist for the
most part of amounts that are expected to be recovered or
paid more than 12 months after the balance sheet date. Cur-
rent assets and short-term liabilities consist for the most part
of amounts that are expected to be recovered or paid within
12 months of the balance sheet date.
Consolidation principlesThe consolidated accounts have been prepared according to
the principles set forth in IFRS 10 Consolidated Financial State-
ments and IAS 27 Separate Financial Statements. Intra-Group
transactions and profits from transactions with associated
companies are eliminated. The consolidated accounts include
the Parent Company, subsidiaries and associated companies.
“Subsidiaries” refers to companies in which Bilia owns more
than 50 per cent of the voting power or over which it otherwise
exercises a controlling influence.
“Associated companies” refers to companies over which
Bilia has a significant influence, usually when Bilia’s holding
corresponds to more than 20 per cent but less than 50 per
cent of the voting power. Holdings in associated companies
are reported according to the equity method.
In cases where the subsidiaries’ and the associated com-
panies’ accounting policies do not agree with the Group’s ac-
counting policies, adjustments have been made to the Group’s
accounting policies.
Transactions eliminated on consolidationIntra-Group receivables and liabilities, revenue or expenses
and unrealised profits or losses arising from intra-Group
transactions between Group companies are eliminated in their
entirety when preparing the consolidated accounts.
Financial statements of foreign operationsIAS 21 The Effects of Changes in Foreign Exchange Rates is
applied when translating the financial statements of foreign
operations.
Assets and liabilities in foreign operations, including goodwill
and other fair value adjustments on consolidation, are trans-
lated to Swedish kronor at the rate in effect on the balance
sheet date. Income and expenses in foreign operations are
translated into Swedish kronor at an average rate which is
an approximation of the rates in effect at the time of each
transaction. Translation differences that arise when translat-
ing the accounts of foreign operations are recognised in other
comprehensive income and accumulated in a separate com-
ponent of equity, called the translation reserve.
On disposal of a foreign operation, the accumulated transla-
tion differences attributable to the operation are realised,
whereby they are reclassified from the translation reserve in
equity to profit or loss for the year.
Transactions in foreign currenciesMonetary assets and liabilities in foreign currencies are
translated to the functional currency at the rate in effect on
the balance sheet date. Exchange rate differences arising
from translations are recognised in profit or loss for the year.
Non-monetary assets and liabilities recognised at cost are
translated at the exchange rate in effect at the time of the
transaction.
Accounting estimates in the financial statementsPreparing the financial statements in accordance with IFRS
requires management to make assumptions and accounting
estimates that influence the application of the accounting
policies and the carrying amounts of assets, liabilities, income
and expenses. Actual outcomes may differ from these ac-
counting estimates.
The assumptions and accounting estimates are regularly
reviewed. Changes in estimates are recognised in the period
in which the change is made if the change affects only that
period, or in the period in which the change is made and in fu-
ture periods if the change affects both the current and future
periods.
Assessments made by management in the application of
IFRS that have a significant impact on the financial statements
and estimates made, may also entail significant adjustments
in subsequent years’ financial statements. The table below
shows in which notes management’s accounting estimates
are presented.
Source of uncertainty Note
Customer relations 14 Intangible assets
Goodwill 14 Intangible assets
Leases 15, 24, 25Property, plant and equipment, Other liabilities, Accrued expenses and deferred income
Valuation of used cars 19 Inventories
Pensions 22 Pensions
Service subscriptions 24 Other liabilities
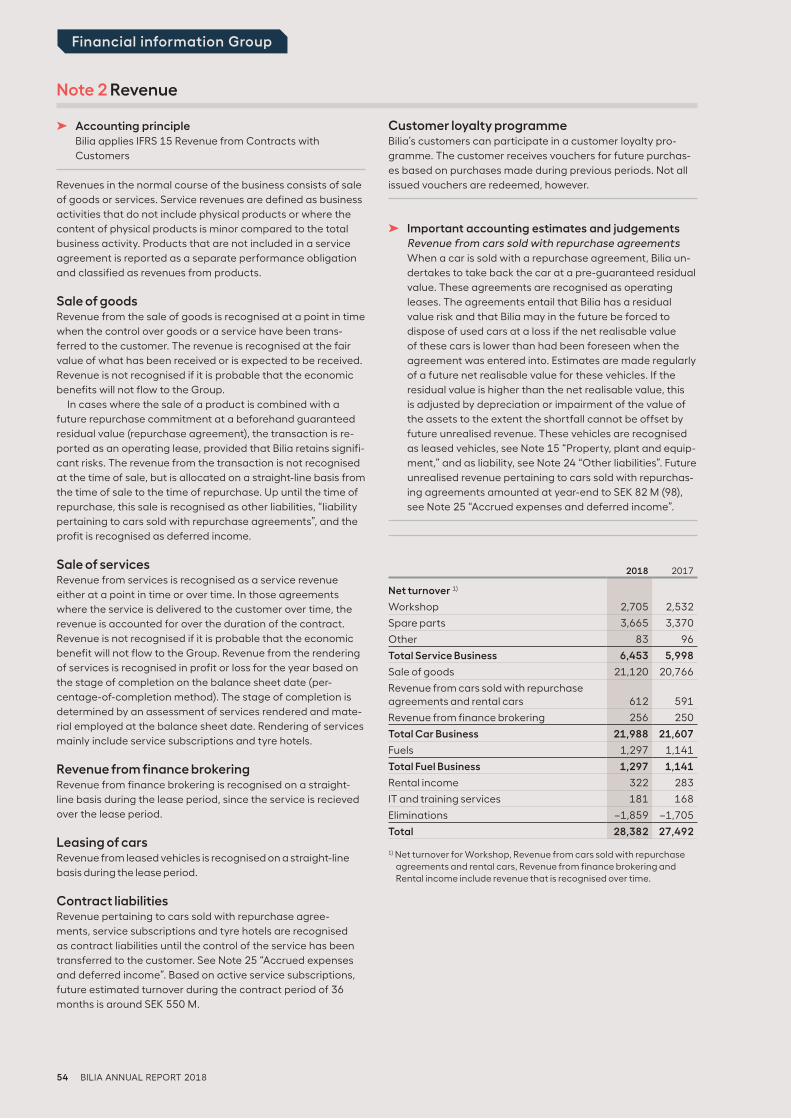
54 BILIA ANNUAL REPORT 2018
Financial information Group
➤ Accounting principleBilia applies IFRS 15 Revenue from Contracts with
Customers
Revenues in the normal course of the business consists of sale
of goods or services. Service revenues are defined as business
activities that do not include physical products or where the
content of physical products is minor compared to the total
business activity. Products that are not included in a service
agreement is reported as a separate performance obligation
and classified as revenues from products.
Sale of goodsRevenue from the sale of goods is recognised at a point in time
when the control over goods or a service have been trans-
ferred to the customer. The revenue is recognised at the fair
value of what has been received or is expected to be received.
Revenue is not recognised if it is probable that the economic
benefits will not flow to the Group.
In cases where the sale of a product is combined with a
future repurchase commitment at a beforehand guaranteed
residual value (repurchase agreement), the transaction is re-
ported as an operating lease, provided that Bilia retains signifi-
cant risks. The revenue from the transaction is not recognised
at the time of sale, but is allocated on a straight-line basis from
the time of sale to the time of repurchase. Up until the time of
repurchase, this sale is recognised as other liabilities, “liability
pertaining to cars sold with repurchase agreements”, and the
profit is recognised as deferred income.
Sale of servicesRevenue from services is recognised as a service revenue
either at a point in time or over time. In those agreements
where the service is delivered to the customer over time, the
revenue is accounted for over the duration of the contract.
Revenue is not recognised if it is probable that the economic
benefit will not flow to the Group. Revenue from the rendering
of services is recognised in profit or loss for the year based on
the stage of completion on the balance sheet date (per-
centage-of-completion method). The stage of completion is
determined by an assessment of services rendered and mate-
rial employed at the balance sheet date. Rendering of services
mainly include service subscriptions and tyre hotels.
Revenue from finance brokeringRevenue from finance brokering is recognised on a straight-
line basis during the lease period, since the service is recieved
over the lease period.
Leasing of carsRevenue from leased vehicles is recognised on a straight-line
basis during the lease period.
Contract liabilitiesRevenue pertaining to cars sold with repurchase agree-
ments, service subscriptions and tyre hotels are recognised
as contract liabilities until the control of the service has been
transferred to the customer. See Note 25 “Accrued expenses
and deferred income”. Based on active service subscriptions,
future estimated turnover during the contract period of 36
months is around SEK 550 M.
Customer loyalty programmeBilia’s customers can participate in a customer loyalty pro-
gramme. The customer receives vouchers for future purchas-
es based on purchases made during previous periods. Not all
issued vouchers are redeemed, however.
➤ Important accounting estimates and judgementsRevenue from cars sold with repurchase agreements
When a car is sold with a repurchase agreement, Bilia un-
dertakes to take back the car at a pre-guaranteed residual
value. These agreements are recognised as operating
leases. The agreements entail that Bilia has a residual
value risk and that Bilia may in the future be forced to
dispose of used cars at a loss if the net realisable value
of these cars is lower than had been foreseen when the
agreement was entered into. Estimates are made regularly
of a future net realisable value for these vehicles. If the
residual value is higher than the net realisable value, this
is adjusted by depreciation or impairment of the value of
the assets to the extent the shortfall cannot be offset by
future unrealised revenue. These vehicles are recognised
as leased vehicles, see Note 15 “Property, plant and equip-
ment,” and as liability, see Note 24 “Other liabilities”. Future
unrealised revenue pertaining to cars sold with repurchas-
ing agreements amounted at year-end to SEK 82 M (98),
see Note 25 “Accrued expenses and deferred income”.
Note 2 Revenue
2018 2017
Net turnover 1)
Workshop 2,705 2,532
Spare parts 3,665 3,370
Other 83 96
Total Service Business 6,453 5,998
Sale of goods 21,120 20,766
Revenue from cars sold with repurchase agreements and rental cars 612 591
Revenue from finance brokering 256 250
Total Car Business 21,988 21,607
Fuels 1,297 1,141
Total Fuel Business 1,297 1,141
Rental income 322 283
IT and training services 181 168
Eliminations –1,859 –1,705
Total 28,382 27,492
1) Net turnover for Workshop, Revenue from cars sold with repurchase agreements and rental cars, Revenue from finance brokering and Rental income include revenue that is recognised over time.
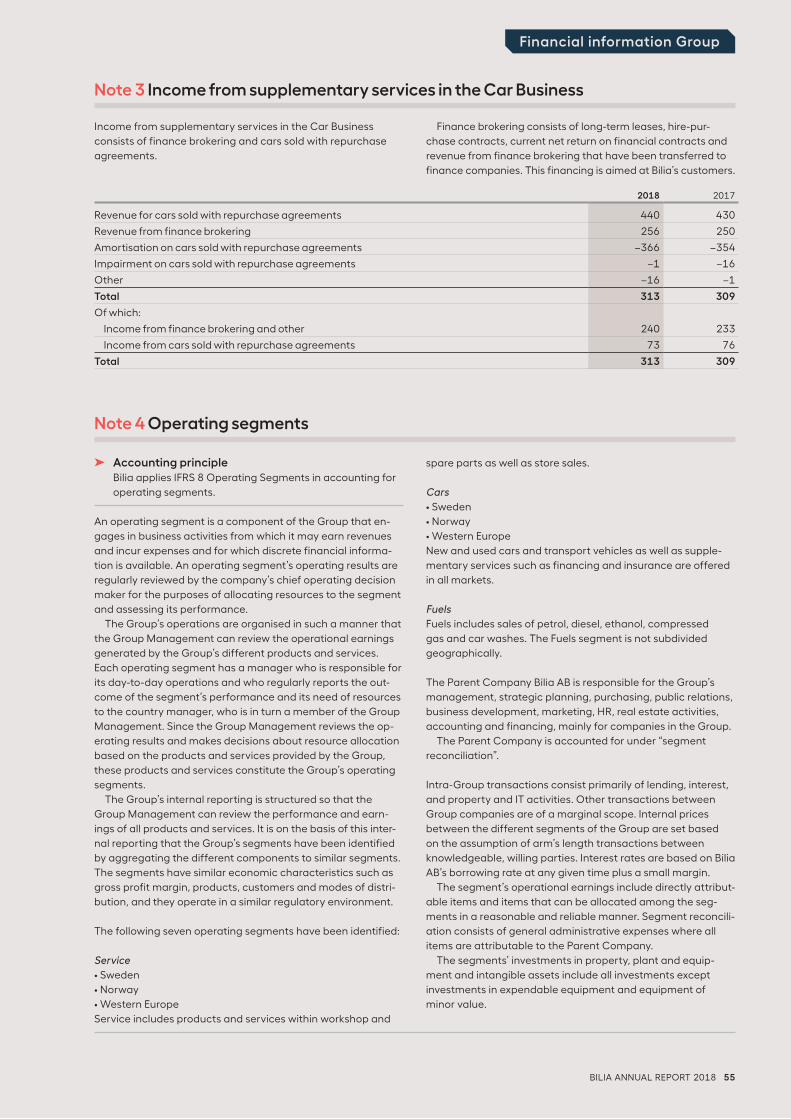
BILIA ANNUAL REPORT 2018 55
Financial information Group
Note 3 Income from supplementary services in the Car Business
2018 2017
Revenue for cars sold with repurchase agreements 440 430
Revenue from finance brokering 256 250
Amortisation on cars sold with repurchase agreements –366 –354
Impairment on cars sold with repurchase agreements –1 –16
Other –16 –1
Total 313 309
Of which:
Income from finance brokering and other 240 233
Income from cars sold with repurchase agreements 73 76
Total 313 309
Income from supplementary services in the Car Business
consists of finance brokering and cars sold with repurchase
agreements.
Finance brokering consists of long-term leases, hire-pur-
chase contracts, current net return on financial contracts and
revenue from finance brokering that have been transferred to
finance companies. This financing is aimed at Bilia’s customers.
➤ Accounting principleBilia applies IFRS 8 Operating Segments in accounting for
operating segments.
An operating segment is a component of the Group that en-
gages in business activities from which it may earn revenues
and incur expenses and for which discrete financial informa-
tion is available. An operating segment’s operating results are
regularly reviewed by the company’s chief operating decision
maker for the purposes of allocating resources to the segment
and assessing its performance.
The Group’s operations are organised in such a manner that
the Group Management can review the operational earnings
generated by the Group’s different products and services.
Each operating segment has a manager who is responsible for
its day-to-day operations and who regularly reports the out-
come of the segment’s performance and its need of resources
to the country manager, who is in turn a member of the Group
Management. Since the Group Management reviews the op-
erating results and makes decisions about resource allocation
based on the products and services provided by the Group,
these products and services constitute the Group’s operating
segments.
The Group’s internal reporting is structured so that the
Group Management can review the performance and earn-
ings of all products and services. It is on the basis of this inter-
nal reporting that the Group’s segments have been identified
by aggregating the different components to similar segments.
The segments have similar economic characteristics such as
gross profit margin, products, customers and modes of distri-
bution, and they operate in a similar regulatory environment.
The following seven operating segments have been identified:
Service
• Sweden
• Norway
• Western Europe
Service includes products and services within workshop and
spare parts as well as store sales.
Cars
• Sweden
• Norway
• Western Europe
New and used cars and transport vehicles as well as supple-
mentary services such as financing and insurance are offered
in all markets.
Fuels
Fuels includes sales of petrol, diesel, ethanol, compressed
gas and car washes. The Fuels segment is not subdivided
geographically.
The Parent Company Bilia AB is responsible for the Group’s
management, strategic planning, purchasing, public relations,
business development, marketing, HR, real estate activities,
accounting and financing, mainly for companies in the Group.
The Parent Company is accounted for under “segment
reconciliation”.
Intra-Group transactions consist primarily of lending, interest,
and property and IT activities. Other transactions between
Group companies are of a marginal scope. Internal prices
between the different segments of the Group are set based
on the assumption of arm’s length transactions between
knowledgeable, willing parties. Interest rates are based on Bilia
AB’s borrowing rate at any given time plus a small margin.
The segment’s operational earnings include directly attribut-
able items and items that can be allocated among the seg-
ments in a reasonable and reliable manner. Segment reconcili-
ation consists of general administrative expenses where all
items are attributable to the Parent Company.
The segments’ investments in property, plant and equip-
ment and intangible assets include all investments except
investments in expendable equipment and equipment of
minor value.
Note 4 Operating segments
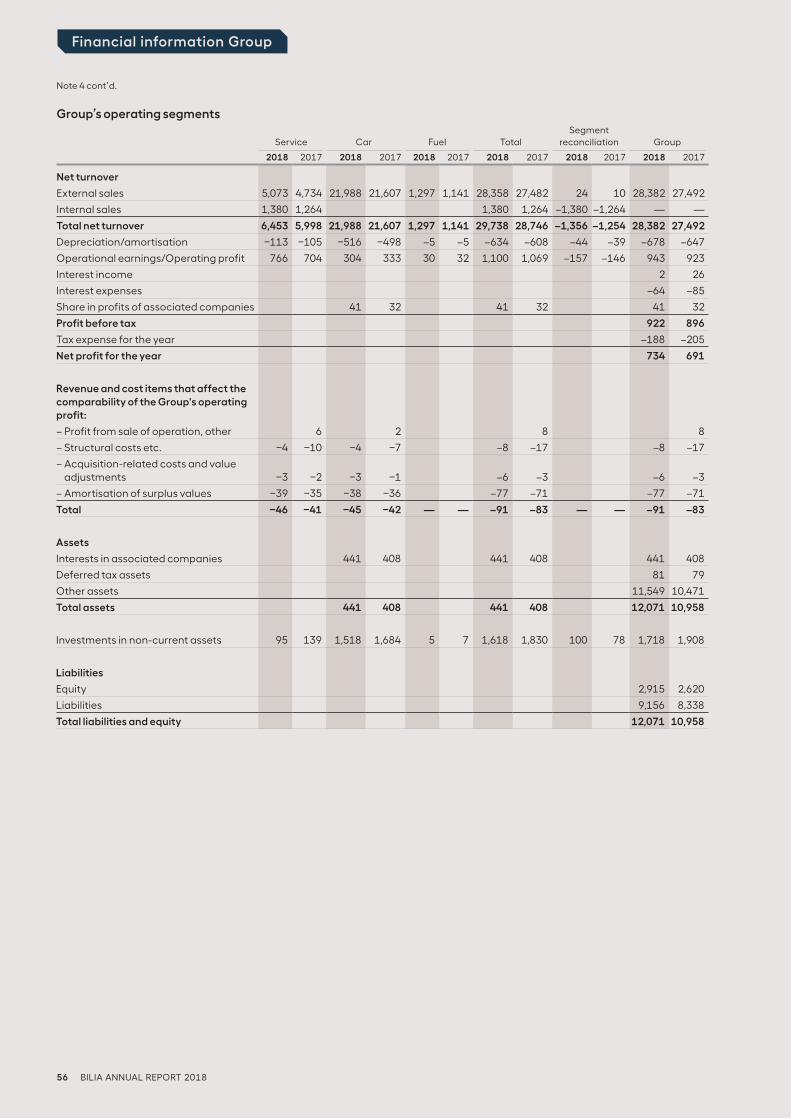
56 BILIA ANNUAL REPORT 2018
Financial information Group
Group’s operating segments
Service Car Fuel TotalSegment
reconciliation Group
2018 2017 2018 2017 2018 2017 2018 2017 2018 2017 2018 2017
Net turnover
External sales 5,073 4,734 21,988 21,607 1,297 1,141 28,358 27,482 24 10 28,382 27,492
Internal sales 1,380 1,264 1,380 1,264 –1,380 –1,264 — —
Total net turnover 6,453 5,998 21,988 21,607 1,297 1,141 29,738 28,746 –1,356 –1,254 28,382 27,492
Depreciation/amortisation –113 –105 –516 –498 –5 –5 –634 –608 –44 –39 –678 –647
Operational earnings/Operating profit 766 704 304 333 30 32 1,100 1,069 –157 –146 943 923
Interest income 2 26
Interest expenses –64 –85
Share in profits of associated companies 41 32 41 32 41 32
Profit before tax 922 896
Tax expense for the year –188 –205
Net profit for the year 734 691
Revenue and cost items that affect the comparability of the Group's operating profit:
– Profit from sale of operation, other 6 2 8 8
– Structural costs etc. –4 –10 –4 –7 –8 –17 –8 –17
– Acquisition-related costs and value adjustments –3 –2 –3 –1 –6 –3 –6 –3
– Amortisation of surplus values –39 –35 –38 –36 –77 –71 –77 –71
Total –46 –41 –45 –42 — — –91 –83 — — –91 –83
Assets
Interests in associated companies 441 408 441 408 441 408
Deferred tax assets 81 79
Other assets 11,549 10,471
Total assets 441 408 441 408 12,071 10,958
Investments in non-current assets 95 139 1,518 1,684 5 7 1,618 1,830 100 78 1,718 1,908
Liabilities
Equity 2,915 2,620
Liabilities 9,156 8,338
Total liabilities and equity 12,071 10,958
Note 4 cont’d.
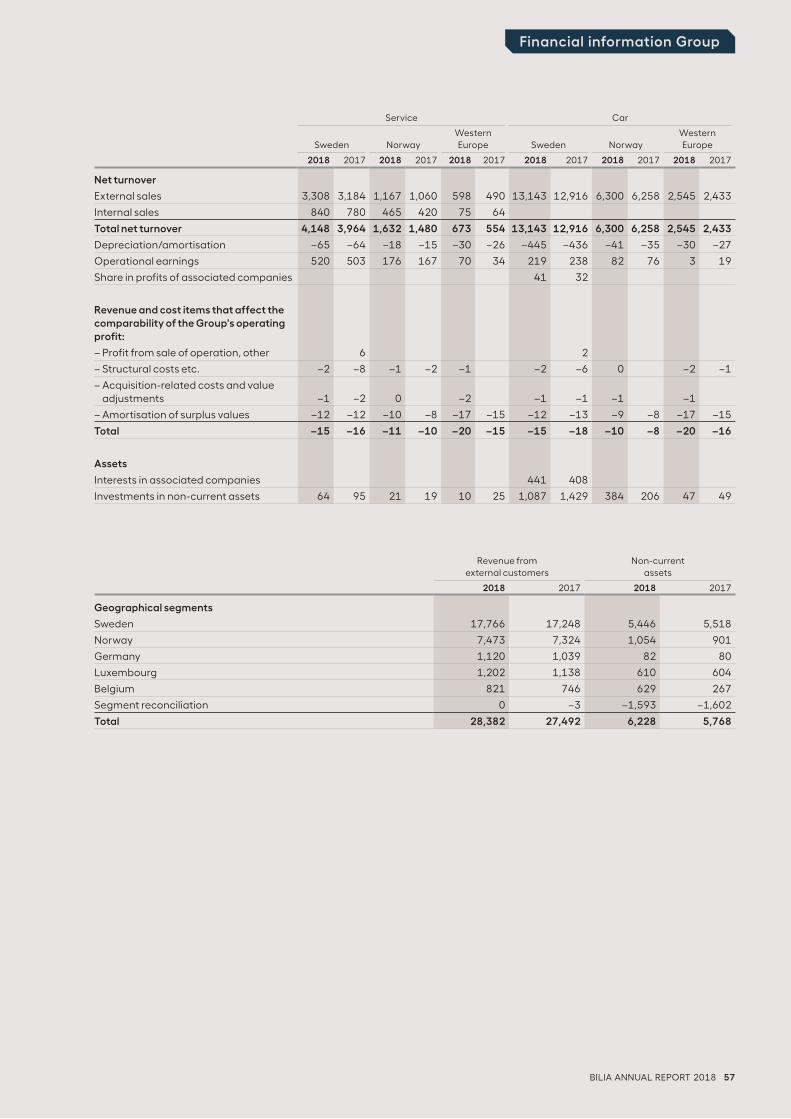
BILIA ANNUAL REPORT 2018 57
Financial information Group
Revenue from external customers
Non-current assets
2018 2017 2018 2017
Geographical segments
Sweden 17,766 17,248 5,446 5,518
Norway 7,473 7,324 1,054 901
Germany 1,120 1,039 82 80
Luxembourg 1,202 1,138 610 604
Belgium 821 746 629 267
Segment reconciliation 0 –3 –1,593 –1,602
Total 28,382 27,492 6,228 5,768
Service Car
Sweden
NorwayWestern Europe
Sweden
Norway
Western Europe
2018 2017 2018 2017 2018 2017 2018 2017 2018 2017 2018 2017
Net turnover
External sales 3,308 3,184 1,167 1,060 598 490 13,143 12,916 6,300 6,258 2,545 2,433
Internal sales 840 780 465 420 75 64
Total net turnover 4,148 3,964 1,632 1,480 673 554 13,143 12,916 6,300 6,258 2,545 2,433
Depreciation/amortisation –65 –64 –18 –15 –30 –26 –445 –436 –41 –35 –30 –27
Operational earnings 520 503 176 167 70 34 219 238 82 76 3 19
Share in profits of associated companies 41 32
Revenue and cost items that affect the comparability of the Group's operating profit:
– Profit from sale of operation, other 6 2
– Structural costs etc. –2 –8 –1 –2 –1 –2 –6 0 –2 –1
– Acquisition-related costs and value adjustments –1 –2 0 –2 –1 –1 –1 –1
– Amortisation of surplus values –12 –12 –10 –8 –17 –15 –12 –13 –9 –8 –17 –15
Total –15 –16 –11 –10 –20 –15 –15 –18 –10 –8 –20 –16
Assets
Interests in associated companies 441 408
Investments in non-current assets 64 95 21 19 10 25 1,087 1,429 384 206 47 49
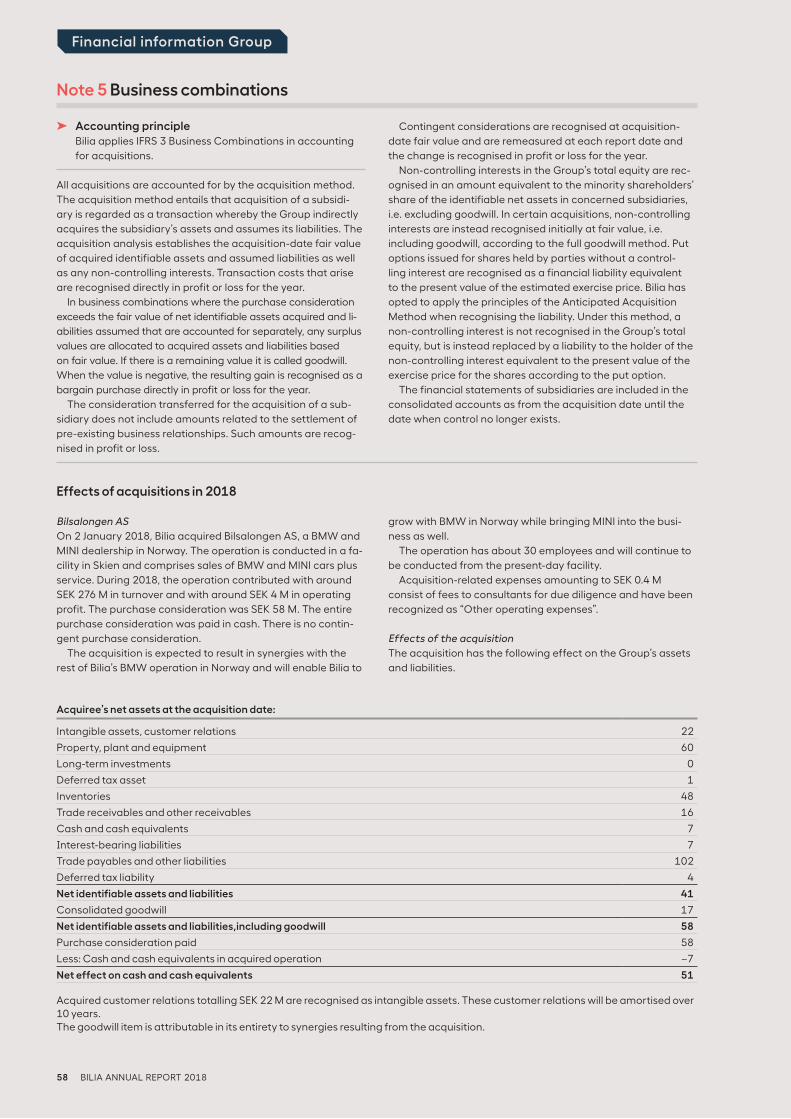
58 BILIA ANNUAL REPORT 2018
Financial information Group
➤ Accounting principleBilia applies IFRS 3 Business Combinations in accounting
for acquisitions.
All acquisitions are accounted for by the acquisition method.
The acquisition method entails that acquisition of a subsidi-
ary is regarded as a transaction whereby the Group indirectly
acquires the subsidiary’s assets and assumes its liabilities. The
acquisition analysis establishes the acquisition-date fair value
of acquired identifiable assets and assumed liabilities as well
as any non-controlling interests. Transaction costs that arise
are recognised directly in profit or loss for the year.
In business combinations where the purchase consideration
exceeds the fair value of net identifiable assets acquired and li-
abilities assumed that are accounted for separately, any surplus
values are allocated to acquired assets and liabilities based
on fair value. If there is a remaining value it is called goodwill.
When the value is negative, the resulting gain is recognised as a
bargain purchase directly in profit or loss for the year.
The consideration transferred for the acquisition of a sub-
sidiary does not include amounts related to the settlement of
pre-existing business relationships. Such amounts are recog-
nised in profit or loss.
Contingent considerations are recognised at acquisition-
date fair value and are remeasured at each report date and
the change is recognised in profit or loss for the year.
Non-controlling interests in the Group’s total equity are rec-
ognised in an amount equivalent to the minority shareholders’
share of the identifiable net assets in concerned subsidiaries,
i.e. excluding goodwill. In certain acquisitions, non-controlling
interests are instead recognised initially at fair value, i.e.
including goodwill, according to the full goodwill method. Put
options issued for shares held by parties without a control-
ling interest are recognised as a financial liability equivalent
to the present value of the estimated exercise price. Bilia has
opted to apply the principles of the Anticipated Acquisition
Method when recognising the liability. Under this method, a
non-controlling interest is not recognised in the Group’s total
equity, but is instead replaced by a liability to the holder of the
non-controlling interest equivalent to the present value of the
exercise price for the shares according to the put option.
The financial statements of subsidiaries are included in the
consolidated accounts as from the acquisition date until the
date when control no longer exists.
Note 5 Business combinations
Effects of acquisitions in 2018
Bilsalongen AS
On 2 January 2018, Bilia acquired Bilsalongen AS, a BMW and
MINI dealership in Norway. The operation is conducted in a fa-
cility in Skien and comprises sales of BMW and MINI cars plus
service. During 2018, the operation contributed with around
SEK 276 M in turnover and with around SEK 4 M in operating
profit. The purchase consideration was SEK 58 M. The entire
purchase consideration was paid in cash. There is no contin-
gent purchase consideration.
The acquisition is expected to result in synergies with the
rest of Bilia’s BMW operation in Norway and will enable Bilia to
grow with BMW in Norway while bringing MINI into the busi-
ness as well.
The operation has about 30 employees and will continue to
be conducted from the present-day facility.
Acquisition-related expenses amounting to SEK 0.4 M
consist of fees to consultants for due diligence and have been
recognized as “Other operating expenses”.
Effects of the acquisition
The acquisition has the following effect on the Group’s assets
and liabilities.
Acquiree’s net assets at the acquisition date:
Intangible assets, customer relations 22
Property, plant and equipment 60
Long-term investments 0
Deferred tax asset 1
Inventories 48
Trade receivables and other receivables 16
Cash and cash equivalents 7
Interest-bearing liabilities 7
Trade payables and other liabilities 102
Deferred tax liability 4
Net identifiable assets and liabilities 41
Consolidated goodwill 17
Net identifiable assets and liabilities,including goodwill 58
Purchase consideration paid 58
Less: Cash and cash equivalents in acquired operation –7
Net effect on cash and cash equivalents 51
Acquired customer relations totalling SEK 22 M are recognised as intangible assets. These customer relations will be amortised over 10 years. The goodwill item is attributable in its entirety to synergies resulting from the acquisition.
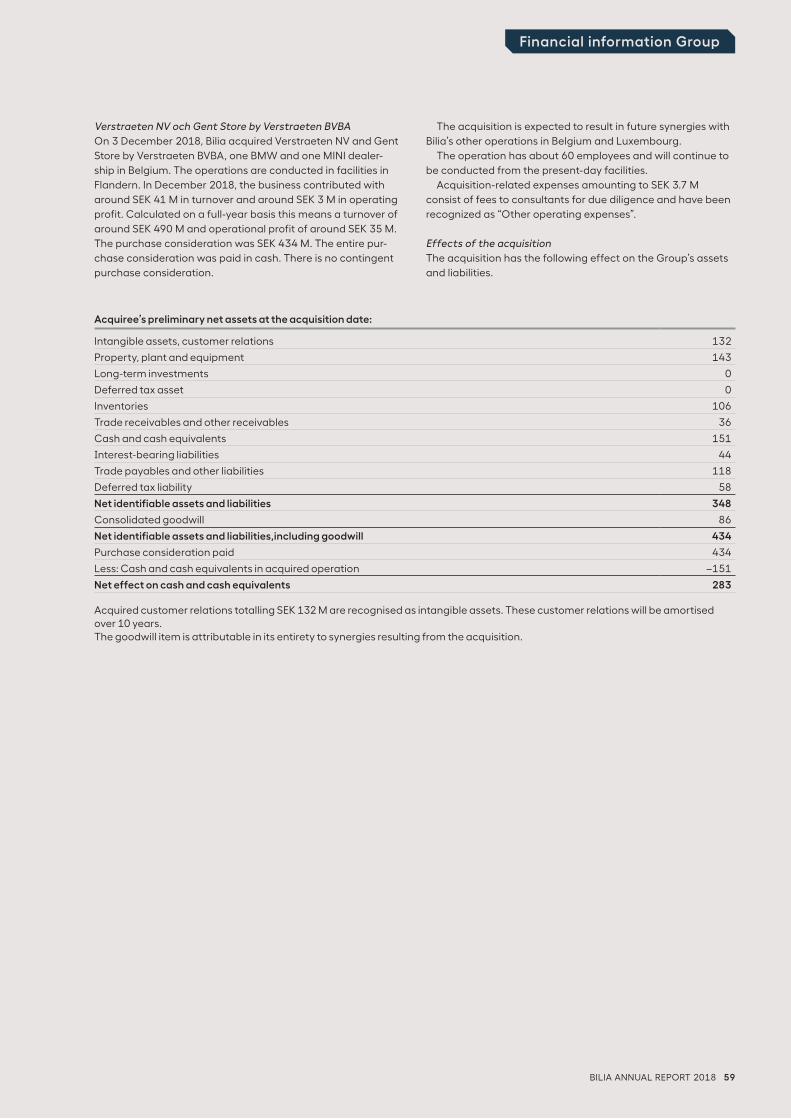
BILIA ANNUAL REPORT 2018 59
Financial information Group
Verstraeten NV och Gent Store by Verstraeten BVBA
On 3 December 2018, Bilia acquired Verstraeten NV and Gent
Store by Verstraeten BVBA, one BMW and one MINI dealer-
ship in Belgium. The operations are conducted in facilities in
Flandern. In December 2018, the business contributed with
around SEK 41 M in turnover and around SEK 3 M in operating
profit. Calculated on a full-year basis this means a turnover of
around SEK 490 M and operational profit of around SEK 35 M.
The purchase consideration was SEK 434 M. The entire pur-
chase consideration was paid in cash. There is no contingent
purchase consideration.
The acquisition is expected to result in future synergies with
Bilia’s other operations in Belgium and Luxembourg.
The operation has about 60 employees and will continue to
be conducted from the present-day facilities.
Acquisition-related expenses amounting to SEK 3.7 M
consist of fees to consultants for due diligence and have been
recognized as “Other operating expenses”.
Effects of the acquisition
The acquisition has the following effect on the Group’s assets
and liabilities.
Acquiree’s preliminary net assets at the acquisition date:
Intangible assets, customer relations 132
Property, plant and equipment 143
Long-term investments 0
Deferred tax asset 0
Inventories 106
Trade receivables and other receivables 36
Cash and cash equivalents 151
Interest-bearing liabilities 44
Trade payables and other liabilities 118
Deferred tax liability 58
Net identifiable assets and liabilities 348
Consolidated goodwill 86
Net identifiable assets and liabilities,including goodwill 434
Purchase consideration paid 434
Less: Cash and cash equivalents in acquired operation –151
Net effect on cash and cash equivalents 283
Acquired customer relations totalling SEK 132 M are recognised as intangible assets. These customer relations will be amortised over 10 years. The goodwill item is attributable in its entirety to synergies resulting from the acquisition.
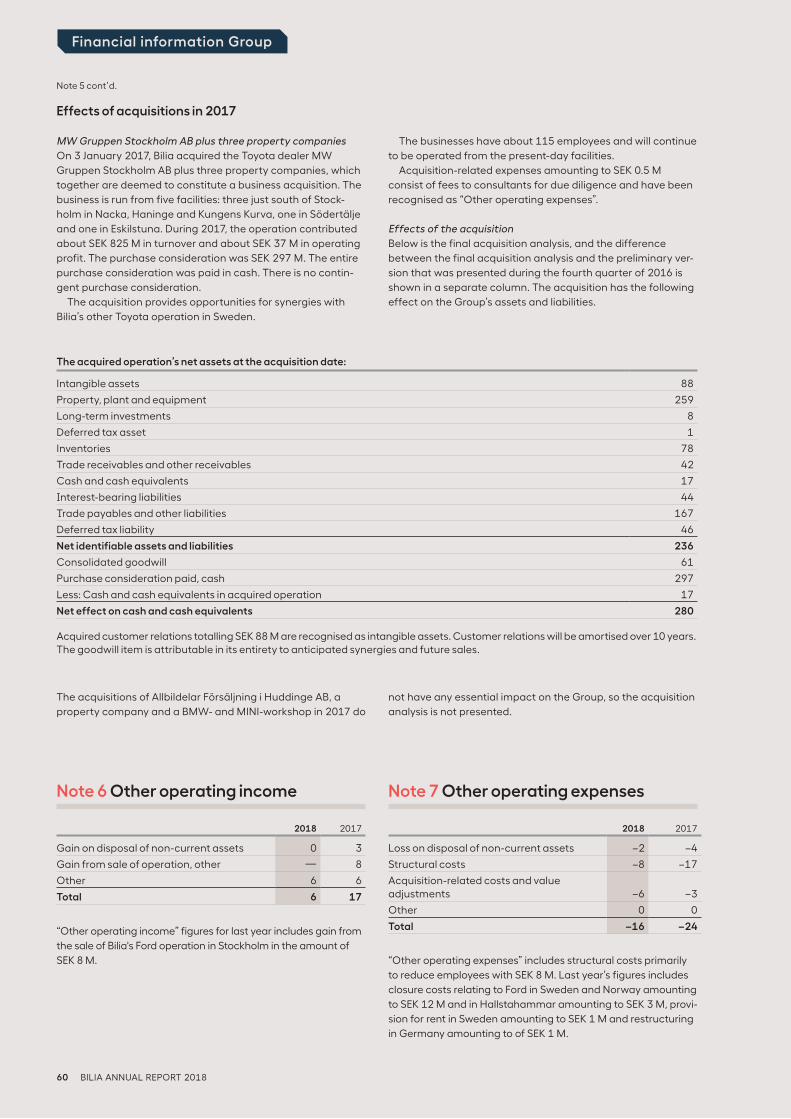
60 BILIA ANNUAL REPORT 2018
Financial information Group
Note 5 cont’d.
The acquisitions of Allbildelar Försäljning i Huddinge AB, a
property company and a BMW- and MINI-workshop in 2017 do
not have any essential impact on the Group, so the acquisition
analysis is not presented.
Effects of acquisitions in 2017
MW Gruppen Stockholm AB plus three property companies
On 3 January 2017, Bilia acquired the Toyota dealer MW
Gruppen Stockholm AB plus three property companies, which
together are deemed to constitute a business acquisition. The
business is run from five facilities: three just south of Stock-
holm in Nacka, Haninge and Kungens Kurva, one in Södertälje
and one in Eskilstuna. During 2017, the operation contributed
about SEK 825 M in turnover and about SEK 37 M in operating
profit. The purchase consideration was SEK 297 M. The entire
purchase consideration was paid in cash. There is no contin-
gent purchase consideration.
The acquisition provides opportunities for synergies with
Bilia’s other Toyota operation in Sweden.
The businesses have about 115 employees and will continue
to be operated from the present-day facilities.
Acquisition-related expenses amounting to SEK 0.5 M
consist of fees to consultants for due diligence and have been
recognised as “Other operating expenses”.
Effects of the acquisition
Below is the final acquisition analysis, and the difference
between the final acquisition analysis and the preliminary ver-
sion that was presented during the fourth quarter of 2016 is
shown in a separate column. The acquisition has the following
effect on the Group’s assets and liabilities.
The acquired operation’s net assets at the acquisition date:
Intangible assets 88
Property, plant and equipment 259
Long-term investments 8
Deferred tax asset 1
Inventories 78
Trade receivables and other receivables 42
Cash and cash equivalents 17
Interest-bearing liabilities 44
Trade payables and other liabilities 167
Deferred tax liability 46
Net identifiable assets and liabilities 236
Consolidated goodwill 61
Purchase consideration paid, cash 297
Less: Cash and cash equivalents in acquired operation 17
Net effect on cash and cash equivalents 280
Acquired customer relations totalling SEK 88 M are recognised as intangible assets. Customer relations will be amortised over 10 years. The goodwill item is attributable in its entirety to anticipated synergies and future sales.
Note 6 Other operating income
2018 2017
Gain on disposal of non-current assets 0 3
Gain from sale of operation, other — 8
Other 6 6
Total 6 17
“Other operating income” figures for last year includes gain from
the sale of Bilia's Ford operation in Stockholm in the amount of
SEK 8 M.
Note 7 Other operating expenses
2018 2017
Loss on disposal of non-current assets –2 –4
Structural costs –8 –17
Acquisition-related costs and value adjustments –6 –3
Other 0 0
Total –16 –24
“Other operating expenses” includes structural costs primarily
to reduce employees with SEK 8 M. Last year’s figures includes
closure costs relating to Ford in Sweden and Norway amounting
to SEK 12 M and in Hallstahammar amounting to SEK 3 M, provi-
sion for rent in Sweden amounting to SEK 1 M and restructuring
in Germany amounting to of SEK 1 M.
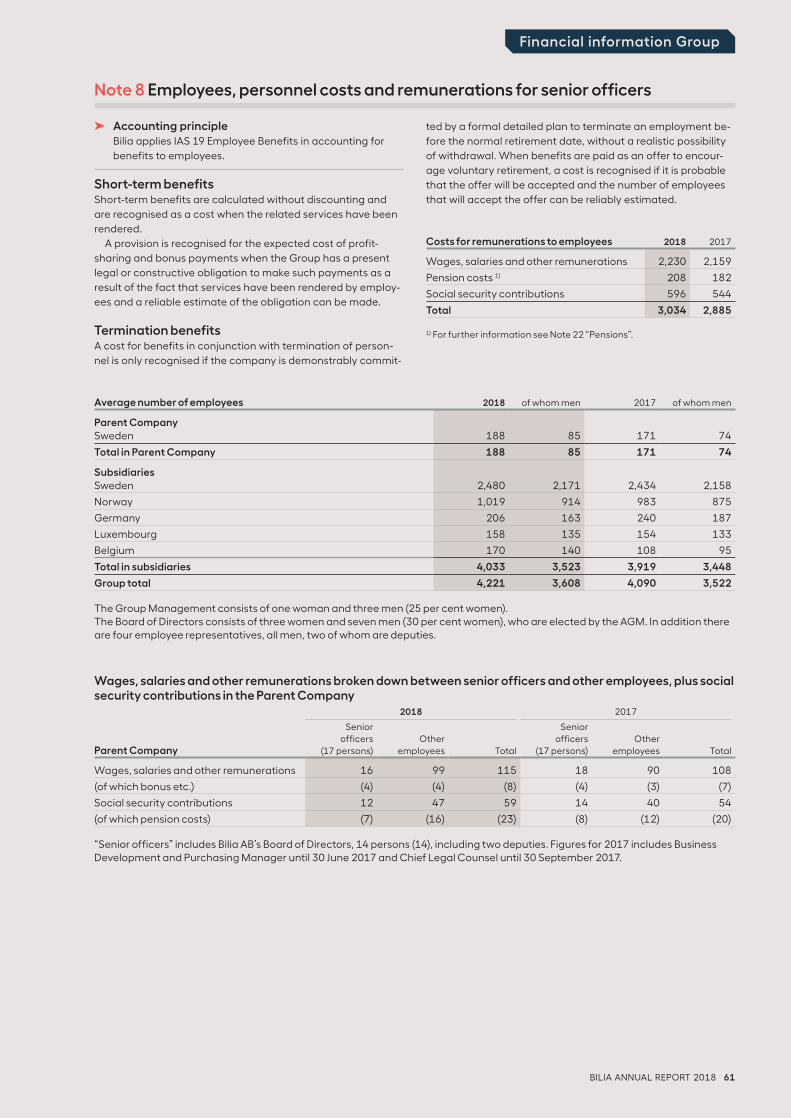
BILIA ANNUAL REPORT 2018 61
Financial information Group
➤ Accounting principleBilia applies IAS 19 Employee Benefits in accounting for
benefits to employees.
Short-term benefitsShort-term benefits are calculated without discounting and
are recognised as a cost when the related services have been
rendered.
A provision is recognised for the expected cost of profit-
sharing and bonus payments when the Group has a present
legal or constructive obligation to make such payments as a
result of the fact that services have been rendered by employ-
ees and a reliable estimate of the obligation can be made.
Termination benefitsA cost for benefits in conjunction with termination of person-
nel is only recognised if the company is demonstrably commit-
ted by a formal detailed plan to terminate an employment be-
fore the normal retirement date, without a realistic possibility
of withdrawal. When benefits are paid as an offer to encour-
age voluntary retirement, a cost is recognised if it is probable
that the offer will be accepted and the number of employees
that will accept the offer can be reliably estimated.
Note 8 Employees, personnel costs and remunerations for senior officers
Costs for remunerations to employees 2018 2017
Wages, salaries and other remunerations 2,230 2,159
Pension costs 1) 208 182
Social security contributions 596 544
Total 3,034 2,885
1) For further information see Note 22 “Pensions”.
Average number of employees 2018 of whom men 2017 of whom men
Parent CompanySweden 188 85 171 74
Total in Parent Company 188 85 171 74
SubsidiariesSweden 2,480 2,171 2,434 2,158
Norway 1,019 914 983 875
Germany 206 163 240 187
Luxembourg 158 135 154 133
Belgium 170 140 108 95
Total in subsidiaries 4,033 3,523 3,919 3,448
Group total 4,221 3,608 4,090 3,522
The Group Management consists of one woman and three men (25 per cent women).The Board of Directors consists of three women and seven men (30 per cent women), who are elected by the AGM. In addition there are four employee representatives, all men, two of whom are deputies.
Wages, salaries and other remunerations broken down between senior officers and other employees, plus social security contributions in the Parent Company
2018 2017
Parent Company
Senior officers
(17 persons)Other
employees Total
Senior officers
(17 persons)Other
employees Total
Wages, salaries and other remunerations 16 99 115 18 90 108
(of which bonus etc.) (4) (4) (8) (4) (3) (7)
Social security contributions 12 47 59 14 40 54
(of which pension costs) (7) (16) (23) (8) (12) (20)
“Senior officers” includes Bilia AB’s Board of Directors, 14 persons (14), including two deputies. Figures for 2017 includes Business Development and Purchasing Manager until 30 June 2017 and Chief Legal Counsel until 30 September 2017.
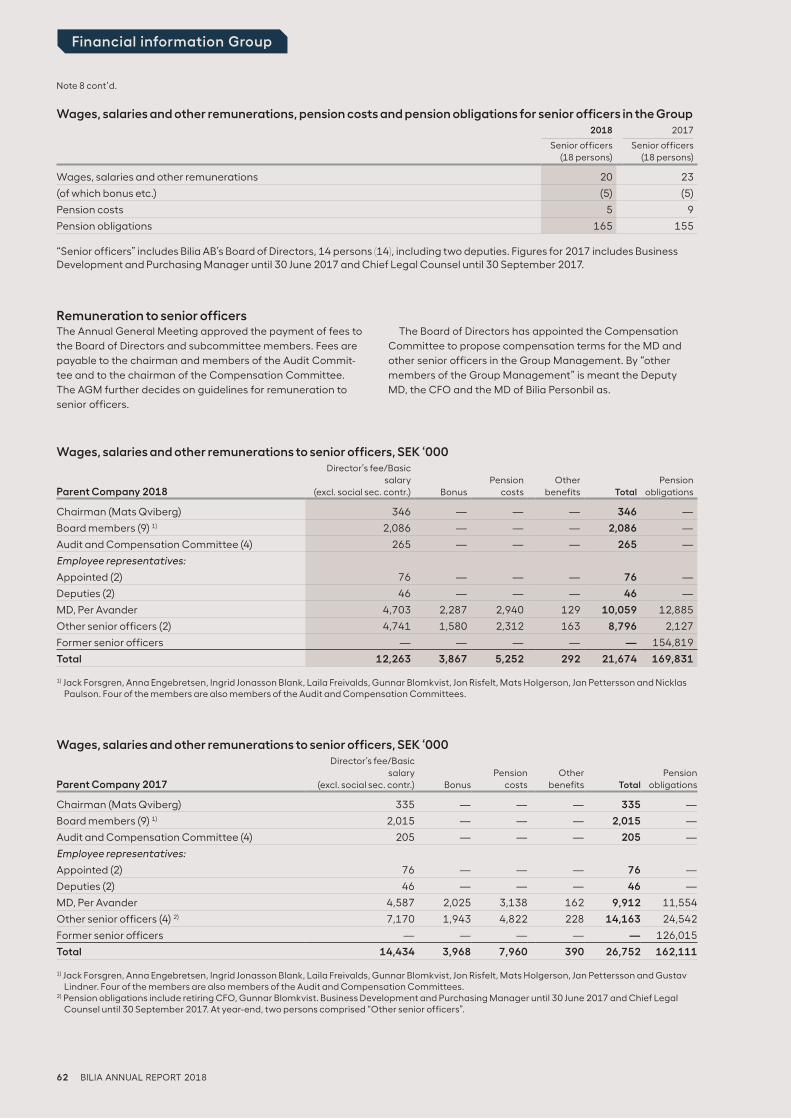
62 BILIA ANNUAL REPORT 2018
Financial information Group
Remuneration to senior officersThe Annual General Meeting approved the payment of fees to
the Board of Directors and subcommittee members. Fees are
payable to the chairman and members of the Audit Commit-
tee and to the chairman of the Compensation Committee.
The AGM further decides on guidelines for remuneration to
senior officers.
The Board of Directors has appointed the Compensation
Committee to propose compensation terms for the MD and
other senior officers in the Group Management. By “other
members of the Group Management” is meant the Deputy
MD, the CFO and the MD of Bilia Personbil as.
Wages, salaries and other remunerations, pension costs and pension obligations for senior officers in the Group2018 2017
Senior officers
(18 persons)Senior officers
(18 persons)
Wages, salaries and other remunerations 20 23
(of which bonus etc.) (5) (5)
Pension costs 5 9
Pension obligations 165 155
“Senior officers” includes Bilia AB’s Board of Directors, 14 persons (14), including two deputies. Figures for 2017 includes Business Development and Purchasing Manager until 30 June 2017 and Chief Legal Counsel until 30 September 2017.
Wages, salaries and other remunerations to senior officers, SEK ‘000
Parent Company 2018
Director’s fee/Basic salary
(excl. social sec. contr.) BonusPension
costs
Otherbenefits Total
Pension obligations
Chairman (Mats Qviberg) 346 — — — 346 —
Board members (9) 1) 2,086 — — — 2,086 —
Audit and Compensation Committee (4) 265 — — — 265 —
Employee representatives:
Appointed (2) 76 — — — 76 —
Deputies (2) 46 — — — 46 —
MD, Per Avander 4,703 2,287 2,940 129 10,059 12,885
Other senior officers (2) 4,741 1,580 2,312 163 8,796 2,127
Former senior officers — — — — — 154,819
Total 12,263 3,867 5,252 292 21,674 169,831
1) Jack Forsgren, Anna Engebretsen, Ingrid Jonasson Blank, Laila Freivalds, Gunnar Blomkvist, Jon Risfelt, Mats Holgerson, Jan Pettersson and Nicklas Paulson. Four of the members are also members of the Audit and Compensation Committees.
Note 8 cont’d.
Wages, salaries and other remunerations to senior officers, SEK ‘000
Parent Company 2017
Director’s fee/Basic salary
(excl. social sec. contr.) BonusPension
costs
Otherbenefits Total
Pension obligations
Chairman (Mats Qviberg) 335 — — — 335 —
Board members (9) 1) 2,015 — — — 2,015 —
Audit and Compensation Committee (4) 205 — — — 205 —
Employee representatives:
Appointed (2) 76 — — — 76 —
Deputies (2) 46 — — — 46 —
MD, Per Avander 4,587 2,025 3,138 162 9,912 11,554
Other senior officers (4) 2) 7,170 1,943 4,822 228 14,163 24,542
Former senior officers — — — — — 126,015
Total 14,434 3,968 7,960 390 26,752 162,111
1) Jack Forsgren, Anna Engebretsen, Ingrid Jonasson Blank, Laila Freivalds, Gunnar Blomkvist, Jon Risfelt, Mats Holgerson, Jan Pettersson and Gustav Lindner. Four of the members are also members of the Audit and Compensation Committees.
2) Pension obligations include retiring CFO, Gunnar Blomkvist. Business Development and Purchasing Manager until 30 June 2017 and Chief Legal Counsel until 30 September 2017. At year-end, two persons comprised “Other senior officers”.
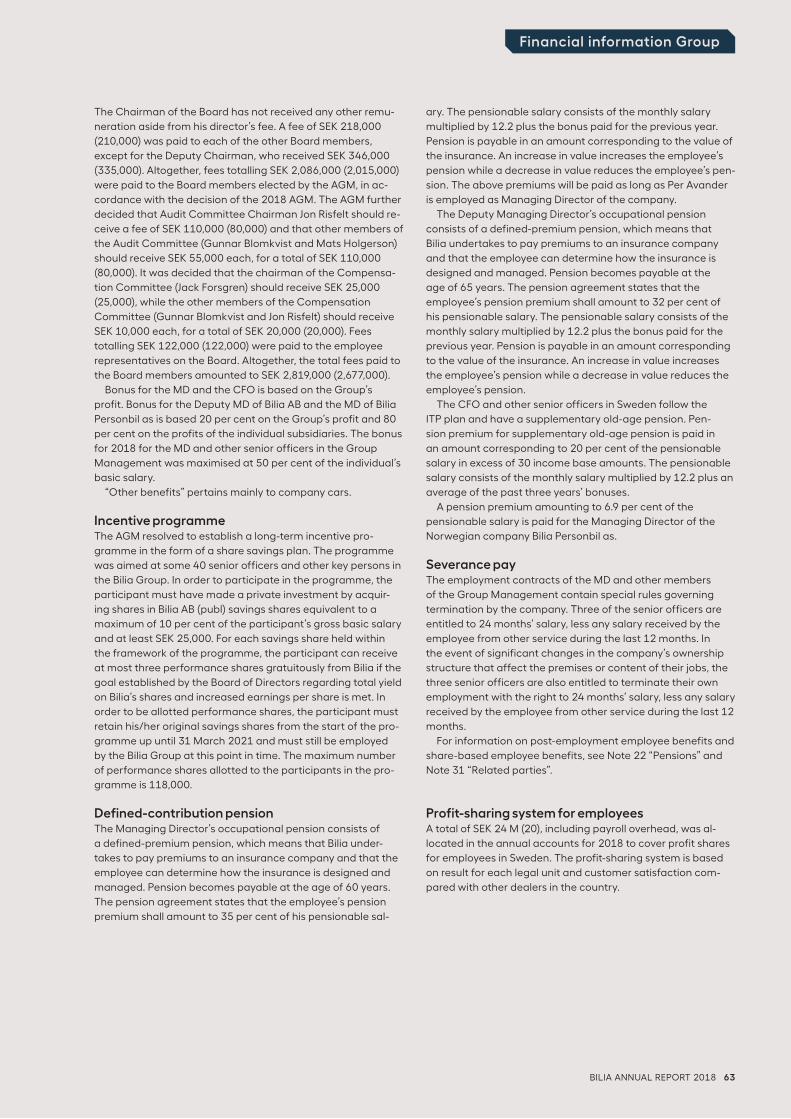
BILIA ANNUAL REPORT 2018 63
Financial information Group
The Chairman of the Board has not received any other remu-
neration aside from his director’s fee. A fee of SEK 218,000
(210,000) was paid to each of the other Board members,
except for the Deputy Chairman, who received SEK 346,000
(335,000). Altogether, fees totalling SEK 2,086,000 (2,015,000)
were paid to the Board members elected by the AGM, in ac-
cordance with the decision of the 2018 AGM. The AGM further
decided that Audit Committee Chairman Jon Risfelt should re-
ceive a fee of SEK 110,000 (80,000) and that other members of
the Audit Committee (Gunnar Blomkvist and Mats Holgerson)
should receive SEK 55,000 each, for a total of SEK 110,000
(80,000). It was decided that the chairman of the Compensa-
tion Committee (Jack Forsgren) should receive SEK 25,000
(25,000), while the other members of the Compensation
Committee ( Gunnar Blomkvist and Jon Risfelt) should receive
SEK 10,000 each, for a total of SEK 20,000 (20,000). Fees
totalling SEK 122,000 (122,000) were paid to the employee
representatives on the Board. Altogether, the total fees paid to
the Board members amounted to SEK 2,819,000 (2,677,000).
Bonus for the MD and the CFO is based on the Group’s
profit. Bonus for the Deputy MD of Bilia AB and the MD of Bilia
Personbil as is based 20 per cent on the Group’s profit and 80
per cent on the profits of the individual subsidiaries. The bonus
for 2018 for the MD and other senior officers in the Group
Management was maximised at 50 per cent of the individual’s
basic salary.
“Other benefits” pertains mainly to company cars.
Incentive programmeThe AGM resolved to establish a long-term incentive pro-
gramme in the form of a share savings plan. The programme
was aimed at some 40 senior officers and other key persons in
the Bilia Group. In order to participate in the programme, the
participant must have made a private investment by acquir-
ing shares in Bilia AB (publ) savings shares equivalent to a
maximum of 10 per cent of the participant’s gross basic salary
and at least SEK 25,000. For each savings share held within
the framework of the programme, the participant can receive
at most three performance shares gratuitously from Bilia if the
goal established by the Board of Directors regarding total yield
on Bilia’s shares and increased earnings per share is met. In
order to be allotted performance shares, the participant must
retain his/her original savings shares from the start of the pro-
gramme up until 31 March 2021 and must still be employed
by the Bilia Group at this point in time. The maximum number
of performance shares allotted to the participants in the pro-
gramme is 118,000.
Defined-contribution pensionThe Managing Director’s occupational pension consists of
a defined-premium pension, which means that Bilia under-
takes to pay premiums to an insurance company and that the
employee can determine how the insurance is designed and
managed. Pension becomes payable at the age of 60 years.
The pension agreement states that the employee’s pension
premium shall amount to 35 per cent of his pensionable sal-
ary. The pensionable salary consists of the monthly salary
multiplied by 12.2 plus the bonus paid for the previous year.
Pension is payable in an amount corresponding to the value of
the insurance. An increase in value increases the employee’s
pension while a decrease in value reduces the employee’s pen-
sion. The above premiums will be paid as long as Per Avander
is employed as Managing Director of the company.
The Deputy Managing Director’s occupational pension
consists of a defined-premium pension, which means that
Bilia undertakes to pay premiums to an insurance company
and that the employee can determine how the insurance is
designed and managed. Pension becomes payable at the
age of 65 years. The pension agreement states that the
employee’s pension premium shall amount to 32 per cent of
his pensionable salary. The pensionable salary consists of the
monthly salary multiplied by 12.2 plus the bonus paid for the
previous year. Pension is payable in an amount corresponding
to the value of the insurance. An increase in value increases
the employee’s pension while a decrease in value reduces the
employee’s pension.
The CFO and other senior officers in Sweden follow the
ITP plan and have a supplementary old-age pension. Pen-
sion premium for supplementary old-age pension is paid in
an amount corresponding to 20 per cent of the pensionable
salary in excess of 30 income base amounts. The pensionable
salary consists of the monthly salary multiplied by 12.2 plus an
average of the past three years’ bonuses.
A pension premium amounting to 6.9 per cent of the
pensionable salary is paid for the Managing Director of the
Norwegian company Bilia Personbil as.
Severance payThe employment contracts of the MD and other members
of the Group Management contain special rules governing
termination by the company. Three of the senior officers are
entitled to 24 months’ salary, less any salary received by the
employee from other service during the last 12 months. In
the event of significant changes in the company’s ownership
structure that affect the premises or content of their jobs, the
three senior officers are also entitled to terminate their own
employment with the right to 24 months’ salary, less any salary
received by the employee from other service during the last 12
months.
For information on post-employment employee benefits and
share-based employee benefits, see Note 22 “Pensions” and
Note 31 “Related parties”.
Profit-sharing system for employees A total of SEK 24 M (20), including payroll overhead, was al-
located in the annual accounts for 2018 to cover profit shares
for employees in Sweden. The profit-sharing system is based
on result for each legal unit and customer satisfaction com-
pared with other dealers in the country.
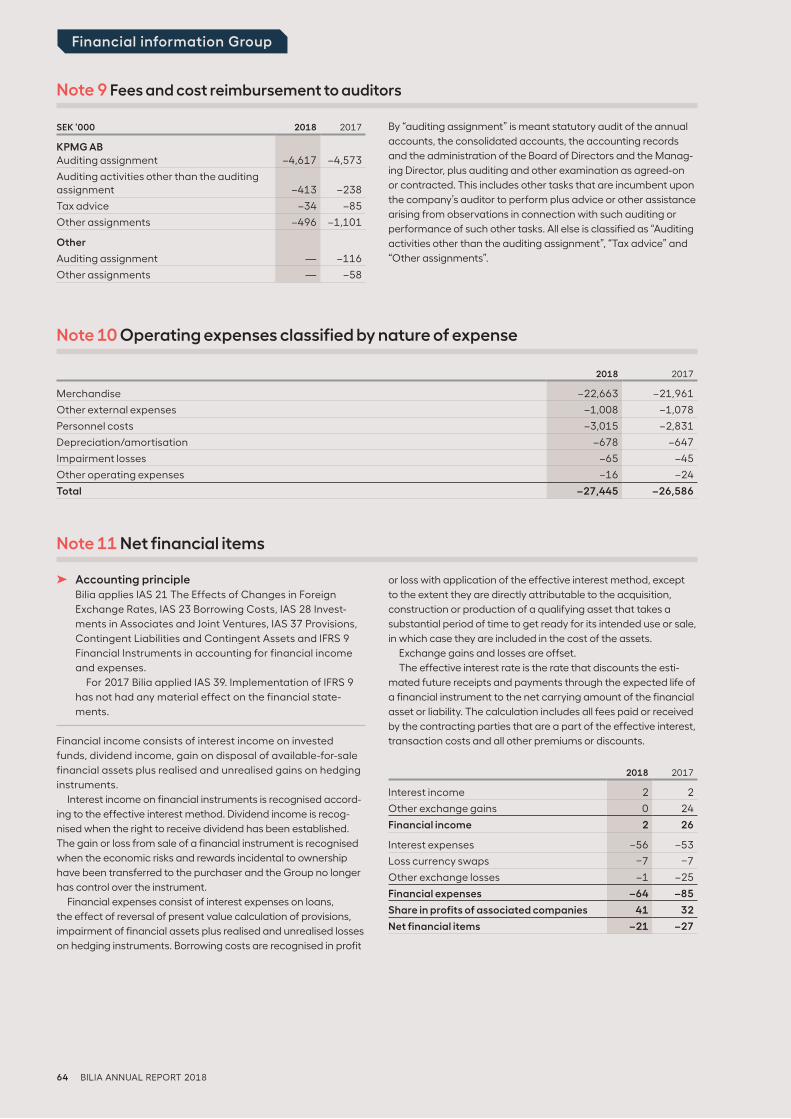
64 BILIA ANNUAL REPORT 2018
Financial information Group
Note 9 Fees and cost reimbursement to auditors
SEK ‘000 2018 2017
KPMG ABAuditing assignment –4,617 –4,573
Auditing activities other than the auditing assignment –413 –238
Tax advice –34 –85
Other assignments –496 –1,101
Other
Auditing assignment — –116
Other assignments — –58
By “auditing assignment” is meant statutory audit of the annual
accounts, the consolidated accounts, the accounting records
and the administration of the Board of Directors and the Manag-
ing Director, plus auditing and other examination as agreed-on
or contracted. This includes other tasks that are incumbent upon
the company’s auditor to perform plus advice or other assistance
arising from observations in connection with such auditing or
performance of such other tasks. All else is classified as “Auditing
activities other than the auditing assignment”, “Tax advice” and
“Other assignments”.
Note 10 Operating expenses classified by nature of expense
2018 2017
Merchandise –22,663 –21,961
Other external expenses –1,008 –1,078
Personnel costs –3,015 –2,831
Depreciation/amortisation –678 –647
Impairment losses –65 –45
Other operating expenses –16 –24
Total –27,445 –26,586
Note 11 Net financial items
➤ Accounting principleBilia applies IAS 21 The Effects of Changes in Foreign
Exchange Rates, IAS 23 Borrowing Costs, IAS 28 Invest-
ments in Associates and Joint Ventures, IAS 37 Provisions,
Contingent Liabilities and Contingent Assets and IFRS 9
Financial Instruments in accounting for financial income
and expenses.
For 2017 Bilia applied IAS 39. Implementation of IFRS 9
has not had any material effect on the financial state-
ments.
Financial income consists of interest income on invested
funds, dividend income, gain on disposal of available-for-sale
financial assets plus realised and unrealised gains on hedging
instruments.
Interest income on financial instruments is recognised accord-
ing to the effective interest method. Dividend income is recog-
nised when the right to receive dividend has been established.
The gain or loss from sale of a financial instrument is recognised
when the economic risks and rewards incidental to ownership
have been transferred to the purchaser and the Group no longer
has control over the instrument.
Financial expenses consist of interest expenses on loans,
the effect of reversal of present value calculation of provisions,
impairment of financial assets plus realised and unrealised losses
on hedging instruments. Borrowing costs are recognised in profit
or loss with application of the effective interest method, except
to the extent they are directly attributable to the acquisition,
construction or production of a qualifying asset that takes a
substantial period of time to get ready for its intended use or sale,
in which case they are included in the cost of the assets.
Exchange gains and losses are offset.
The effective interest rate is the rate that discounts the esti-
mated future receipts and payments through the expected life of
a financial instrument to the net carrying amount of the financial
asset or liability. The calculation includes all fees paid or received
by the contracting parties that are a part of the effective interest,
transaction costs and all other premiums or discounts.
2018 2017
Interest income 2 2
Other exchange gains 0 24
Financial income 2 26
Interest expenses –56 –53
Loss currency swaps –7 –7
Other exchange losses –1 –25
Financial expenses –64 –85
Share in profits of associated companies 41 32
Net financial items –21 –27
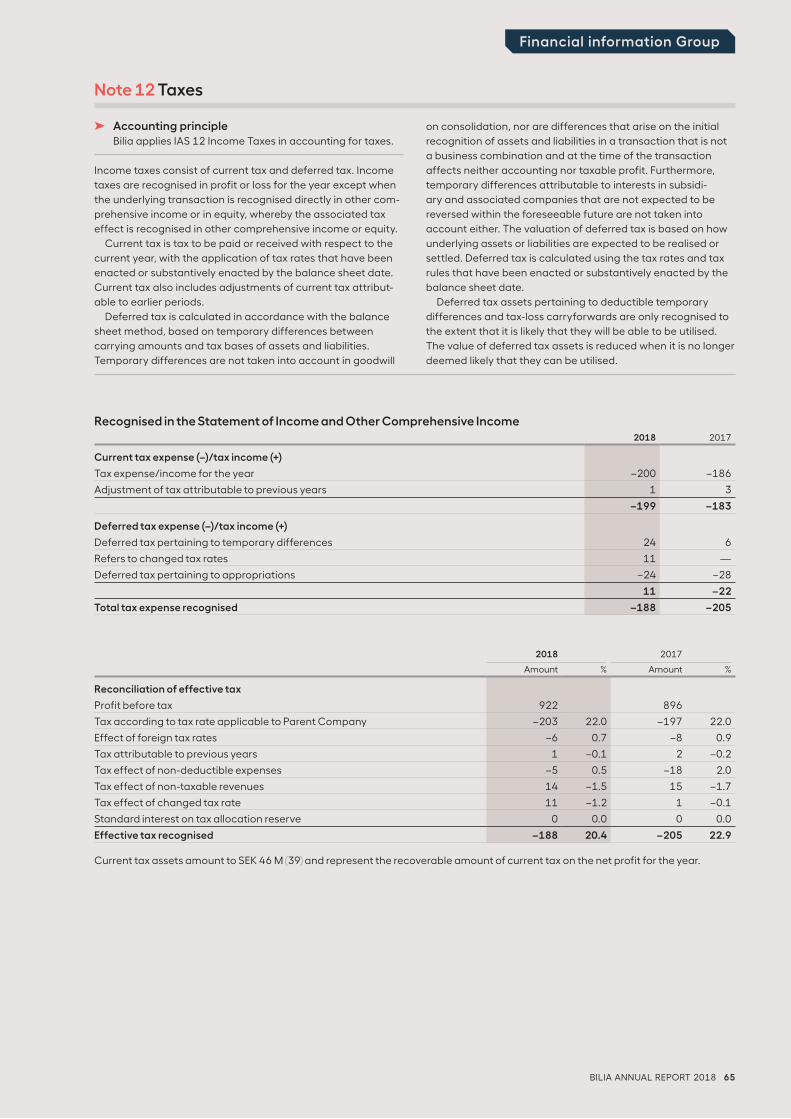
BILIA ANNUAL REPORT 2018 65
Financial information Group
➤ Accounting principleBilia applies IAS 12 Income Taxes in accounting for taxes.
Income taxes consist of current tax and deferred tax. Income
taxes are recognised in profit or loss for the year except when
the underlying transaction is recognised directly in other com-
prehensive income or in equity, whereby the associated tax
effect is recognised in other comprehensive income or equity.
Current tax is tax to be paid or received with respect to the
current year, with the application of tax rates that have been
enacted or substantively enacted by the balance sheet date.
Current tax also includes adjustments of current tax attribut-
able to earlier periods.
Deferred tax is calculated in accordance with the balance
sheet method, based on temporary differences between
carrying amounts and tax bases of assets and liabilities.
Temporary differences are not taken into account in goodwill
on consolidation, nor are differences that arise on the initial
recognition of assets and liabilities in a transaction that is not
a business combination and at the time of the transaction
affects neither accounting nor taxable profit. Furthermore,
temporary differences attributable to interests in subsidi-
ary and associated companies that are not expected to be
reversed within the foreseeable future are not taken into
account either. The valuation of deferred tax is based on how
underlying assets or liabilities are expected to be realised or
settled. Deferred tax is calculated using the tax rates and tax
rules that have been enacted or substantively enacted by the
balance sheet date.
Deferred tax assets pertaining to deductible temporary
differences and tax-loss carryforwards are only recognised to
the extent that it is likely that they will be able to be utilised.
The value of deferred tax assets is reduced when it is no longer
deemed likely that they can be utilised.
Note 12 Taxes
Recognised in the Statement of Income and Other Comprehensive Income
2018 2017
Current tax expense (–)/tax income (+)
Tax expense/income for the year –200 –186
Adjustment of tax attributable to previous years 1 3
–199 –183
Deferred tax expense (–)/tax income (+)
Deferred tax pertaining to temporary differences 24 6
Refers to changed tax rates 11 —
Deferred tax pertaining to appropriations –24 –28
11 –22
Total tax expense recognised –188 –205
2018 2017
Amount % Amount %
Reconciliation of effective tax
Profit before tax 922 896
Tax according to tax rate applicable to Parent Company –203 22.0 –197 22.0
Effect of foreign tax rates –6 0.7 –8 0.9
Tax attributable to previous years 1 –0.1 2 –0.2
Tax effect of non-deductible expenses –5 0.5 –18 2.0
Tax effect of non-taxable revenues 14 –1.5 15 –1.7
Tax effect of changed tax rate 11 –1.2 1 –0.1
Standard interest on tax allocation reserve 0 0.0 0 0.0
Effective tax recognised –188 20.4 –205 22.9
Current tax assets amount to SEK 46 M (39) and represent the recoverable amount of current tax on the net profit for the year.
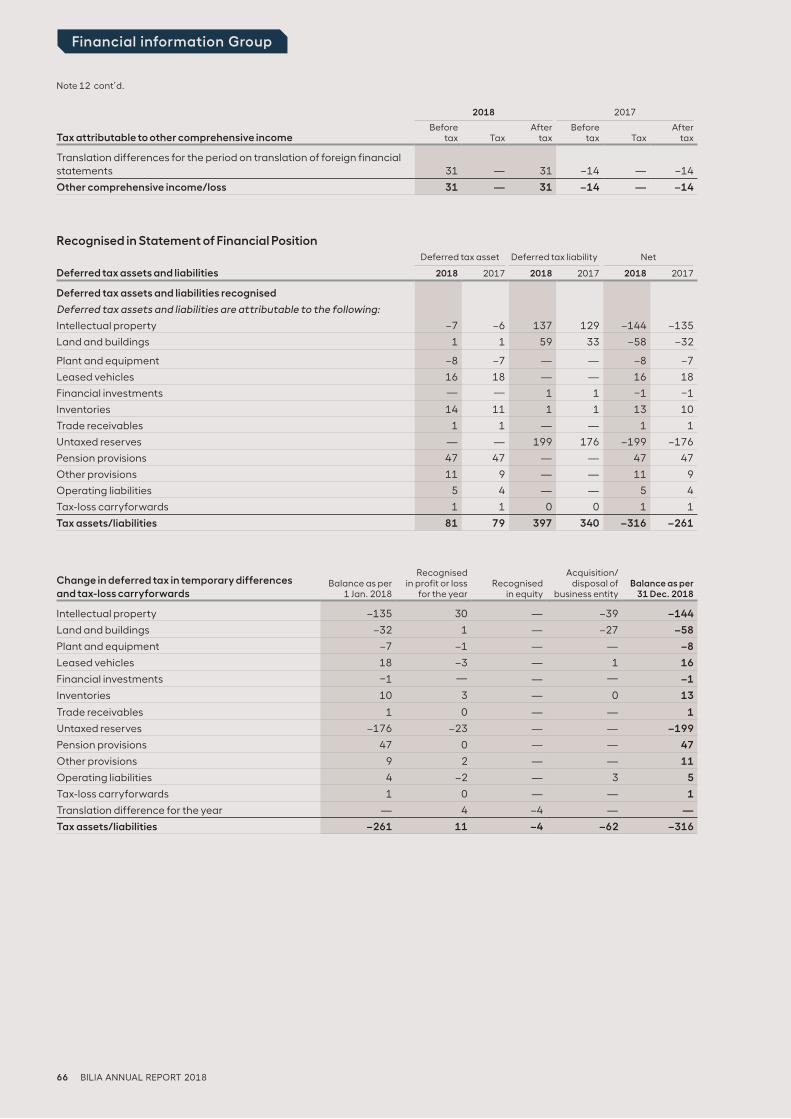
66 BILIA ANNUAL REPORT 2018
Financial information Group
2018 2017
Tax attributable to other comprehensive incomeBefore
tax TaxAfter
taxBefore
tax TaxAfter
tax
Translation differences for the period on translation of foreign financial statements 31 — 31 –14 — –14
Other comprehensive income/loss 31 — 31 –14 — –14
Recognised in Statement of Financial Position Deferred tax asset Deferred tax liability Net
Deferred tax assets and liabilities 2018 2017 2018 2017 2018 2017
Deferred tax assets and liabilities recognised
Deferred tax assets and liabilities are attributable to the following:
Intellectual property –7 –6 137 129 –144 –135
Land and buildings 1 1 59 33 –58 –32
Plant and equipment –8 –7 — — –8 –7
Leased vehicles 16 18 — — 16 18
Financial investments — — 1 1 –1 –1
Inventories 14 11 1 1 13 10
Trade receivables 1 1 — — 1 1
Untaxed reserves — — 199 176 –199 –176
Pension provisions 47 47 — — 47 47
Other provisions 11 9 — — 11 9
Operating liabilities 5 4 — — 5 4
Tax-loss carryforwards 1 1 0 0 1 1
Tax assets/liabilities 81 79 397 340 –316 –261
Note 12 cont’d.
Change in deferred tax in temporary differences and tax-loss carryforwards
Balance as per1 Jan. 2018
Recognisedin profit or loss
for the yearRecognised
in equity
Acquisition/disposal of
business entityBalance as per
31 Dec. 2018
Intellectual property –135 30 — –39 –144
Land and buildings –32 1 — –27 –58
Plant and equipment –7 –1 — — –8
Leased vehicles 18 –3 — 1 16
Financial investments –1 — — — –1
Inventories 10 3 — 0 13
Trade receivables 1 0 — — 1
Untaxed reserves –176 –23 — — –199
Pension provisions 47 0 — — 47
Other provisions 9 2 — — 11
Operating liabilities 4 –2 — 3 5
Tax-loss carryforwards 1 0 — — 1
Translation difference for the year — 4 –4 — —
Tax assets/liabilities –261 11 –4 –62 –316
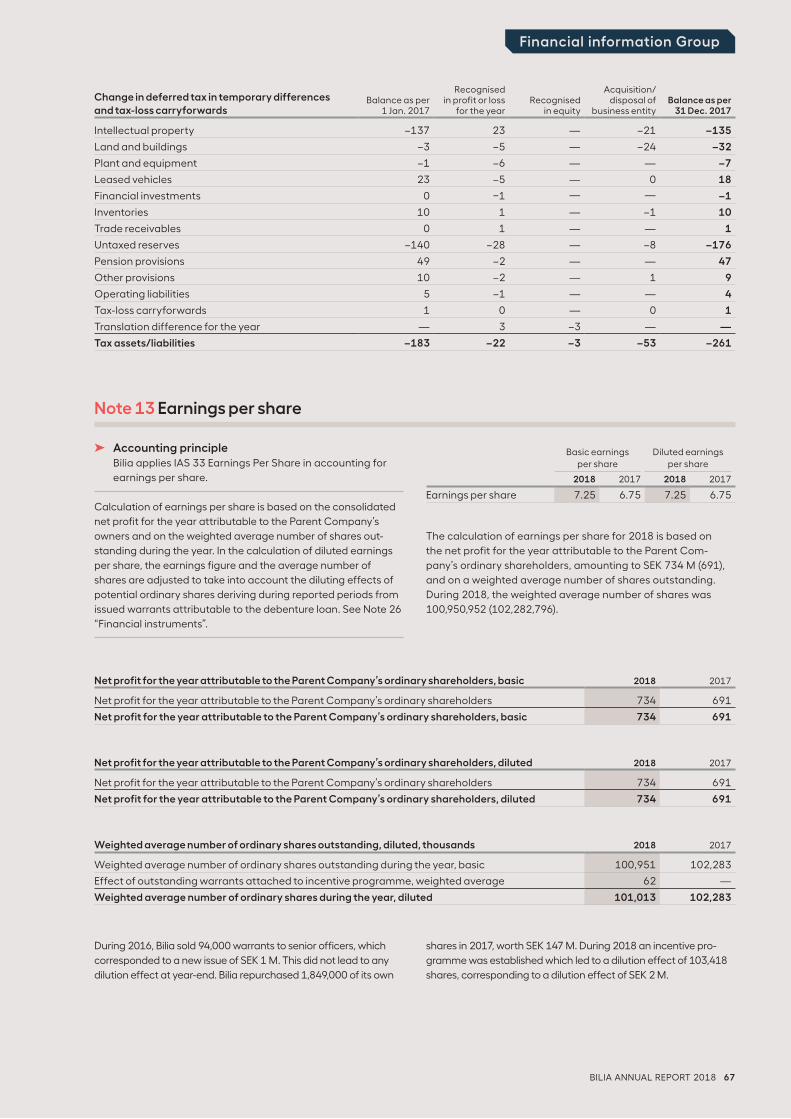
BILIA ANNUAL REPORT 2018 67
Financial information Group
Note 13 Earnings per share
➤ Accounting principleBilia applies IAS 33 Earnings Per Share in accounting for
earnings per share.
Calculation of earnings per share is based on the consolidated
net profit for the year attributable to the Parent Company’s
owners and on the weighted average number of shares out-
standing during the year. In the calculation of diluted earnings
per share, the earnings figure and the average number of
shares are adjusted to take into account the diluting effects of
potential ordinary shares deriving during reported periods from
issued warrants attributable to the debenture loan. See Note 26
“Financial instruments”.
Basic earnings per share
Diluted earnings per share
2018 2017 2018 2017
Earnings per share 7.25 6.75 7.25 6.75
The calculation of earnings per share for 2018 is based on
the net profit for the year attributable to the Parent Com-
pany’s ordinary shareholders, amounting to SEK 734 M (691),
and on a weighted average number of shares outstanding.
During 2018, the weighted average number of shares was
100,950,952 (102,282,796).
Net profit for the year attributable to the Parent Company’s ordinary shareholders, basic 2018 2017
Net profit for the year attributable to the Parent Company’s ordinary shareholders 734 691
Net profit for the year attributable to the Parent Company’s ordinary shareholders, basic 734 691
Net profit for the year attributable to the Parent Company’s ordinary shareholders, diluted 2018 2017
Net profit for the year attributable to the Parent Company’s ordinary shareholders 734 691
Net profit for the year attributable to the Parent Company’s ordinary shareholders, diluted 734 691
Weighted average number of ordinary shares outstanding, diluted, thousands 2018 2017
Weighted average number of ordinary shares outstanding during the year, basic 100,951 102,283
Effect of outstanding warrants attached to incentive programme, weighted average 62 —
Weighted average number of ordinary shares during the year, diluted 101,013 102,283
During 2016, Bilia sold 94,000 warrants to senior officers, which
corresponded to a new issue of SEK 1 M. This did not lead to any
dilution effect at year-end. Bilia repurchased 1,849,000 of its own
shares in 2017, worth SEK 147 M. During 2018 an incentive pro-
gramme was established which led to a dilution effect of 103,418
shares, corresponding to a dilution effect of SEK 2 M.
Change in deferred tax in temporary differences and tax-loss carryforwards
Balance as per1 Jan. 2017
Recognisedin profit or loss
for the yearRecognised
in equity
Acquisition/disposal of
business entityBalance as per
31 Dec. 2017
Intellectual property –137 23 — –21 –135
Land and buildings –3 –5 — –24 –32
Plant and equipment –1 –6 — — –7
Leased vehicles 23 –5 — 0 18
Financial investments 0 –1 — — –1
Inventories 10 1 — –1 10
Trade receivables 0 1 — — 1
Untaxed reserves –140 –28 — –8 –176
Pension provisions 49 –2 — — 47
Other provisions 10 –2 — 1 9
Operating liabilities 5 –1 — — 4
Tax-loss carryforwards 1 0 — 0 1
Translation difference for the year — 3 –3 — —
Tax assets/liabilities –183 –22 –3 –53 –261
68 BILIA ANNUAL REPORT 2018
Financial information Group
➤ Accounting principleBilia applies IAS 38 Intangible Assets in accounting for
intangible assets.
SoftwareInternally developed
Expenditures for development of software and improved busi-
ness management systems are recognised as an asset in the
Statement of Financial Position if the software is technically
useful, and if Bilia has sufficient resources to complete devel-
opment and thereafter intends to use the intangible asset. The
carrying amount includes costs for materials, direct costs for
salaries, and overheads that can be attributed to the asset
on a reasonable and consistent basis. Other expenditures for
development are recognised in profit or loss as expense when
they are incurred. Expenditures for development of software
recognised in the Statement of Financial Position are stated
at cost less accumulated depreciation and any impairment
losses.
Business Combinations
Software acquired via business combinations is recognised at
fair value, which is equivalent to estimated replacement cost
at the acquisition date less accumulated depreciation and any
impairment losses.
Other acquisitions
Other investments in software are recognised at cost less
accumulated amortisation and any impairment losses. The
cost includes the purchase price plus costs directly attribut-
able to the asset for bringing the asset to its location and to
working condition for its intended use.
Customer relationsCustomer relations that have been acquired via business
combinations are recognised at fair value, which is equivalent
to the cost calculated by cash flow valuation at the acquisi-
tion date less accumulated amortisation and any impairment
losses.
Distribution rightsDistribution rights that have been acquired through business
combinations are recognised at fair value, which is equivalent
to the cost calculated by cash flow valuation at the acquisi-
tion date less accumulated amortisation and any impairment
losses.
GoodwillGoodwill represents the difference between the cost of the
business combination and the fair value of identifiable assets,
assumed liabilities and contingent liabilities. Goodwill includes
expected future profits from existing operations and expected
synergies resulting from the acquisition.
Goodwill is measured at cost less accumulated impairment
losses. Goodwill is allocated to cash-generating units and is
subjected annually to impairment testing.
In the case of business combinations where the cost is less
than the net value of identifiable assets, assumed liabilities
and contingent liabilities, the difference is recognised directly
in profit or loss.
Subsequent expendituresSubsequent expenditures for capitalised intangible assets
are only recognised as an asset in the Statement of Financial
Position when they increase the future economic benefits
for the specific asset to which they are attributable. All other
expenditures are recognised as expenses when they are
incurred.
AmortisationAmortisation is recognised in profit or loss for the year on a
straight-line basis over the calculated useful lives of intangible
assets, unless these useful lives are indefinite. Goodwill with an
indefinite useful life is impairment tested annually or as soon
as there are indications that the asset in question has declined
in value. Amortisable intangible assets are amortised from the
date they are available for use. Amortisation period is based
on expected useful life considering historic experience and
valid agreement.
Estimated useful lives:
• Software 3–10 years
• Customer relations 10 years
• Distribution rights 10 years
Impairment testing of intangible assetsBilia applies IAS 36 Impairment of Assets in accounting for impairment.
The carrying amounts are tested at every balance sheet date for any indication of impairment. If such an indication ex-ists, the asset’s recoverable amount is calculated.
In the case of goodwill and other intangible assets that are not yet ready for use, the recoverable amount is calculated at least annually. An impairment loss is recognised when the car-rying amount of an asset or a cash-generating unit exceeds the recoverable amount. An impairment loss is recognised in profit or loss for the year.
Impairment of assets attributable to a cash-generating unit is first allocated to goodwill. Then a pro rata impairment loss is recognised for the other assets included in the unit.
The recoverable amount is the higher of an asset’s fair value less selling costs and its value in use. When calculating the value in use, future cash flows are discounted by a discount rate that takes into account the risk-free interest rate and the risk associated with the specific asset.
An impairment loss is reversed if there is an indication that the impairment no longer exists and there has been a change in the estimates used to determine the recoverable amount. Impairment losses relating to goodwill are never reversed, however. An impairment loss is only reversed to the extent the carrying amount of the asset after reversal does not exceed the carrying amount that would have been recognised, less amortisation where applicable, if no impairment loss had been recognised.
➤ Important accounting estimates and judgementsImpairment testing of goodwill
Goodwill is impairment tested at least annually. Impair-ment testing is based on 5-year forecasts for the cash-
generating units in question. For important assumptions
per cash- generating unit, see the following pages.
Note 14 Intangible assets
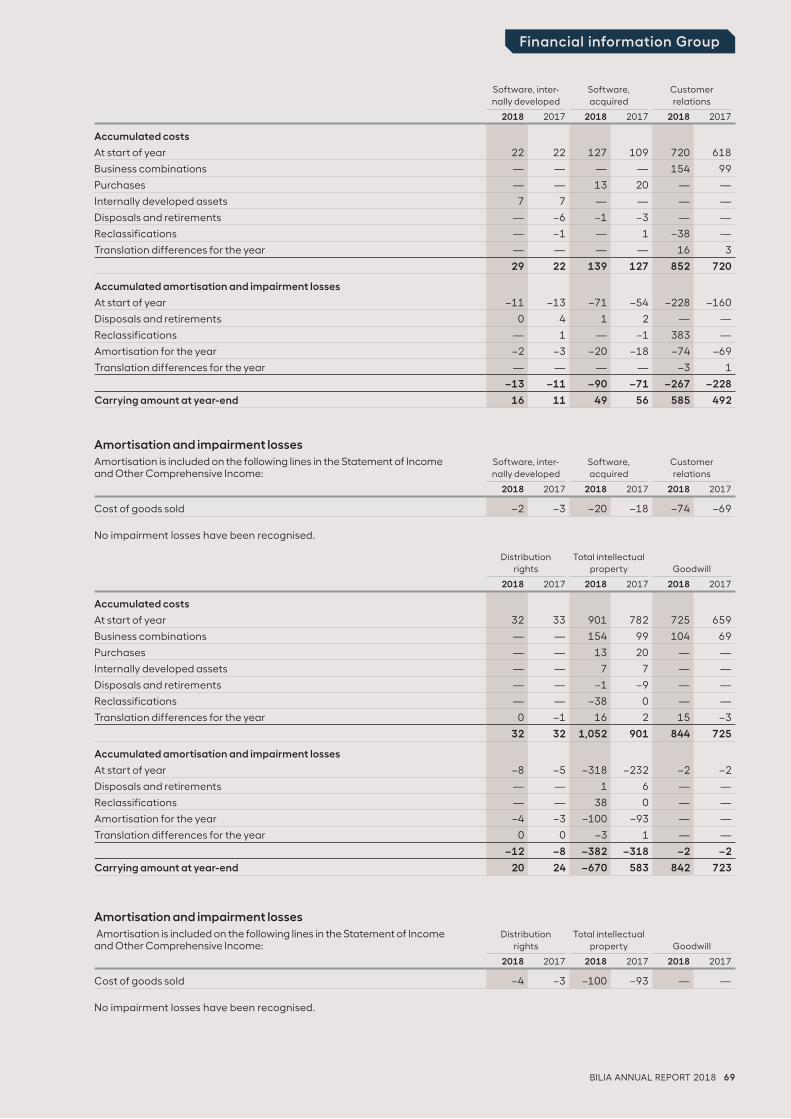
BILIA ANNUAL REPORT 2018 69
Financial information Group
Software, inter-nally developed
Software, acquired
Customer relations
2018 2017 2018 2017 2018 2017
Accumulated costs
At start of year 22 22 127 109 720 618
Business combinations — — — — 154 99
Purchases — — 13 20 — —
Internally developed assets 7 7 — — — —
Disposals and retirements — –6 –1 –3 — —
Reclassifications — –1 — 1 –38 —
Translation differences for the year — — — — 16 3
29 22 139 127 852 720
Accumulated amortisation and impairment losses
At start of year –11 –13 –71 –54 –228 –160
Disposals and retirements 0 4 1 2 — —
Reclassifications — 1 — –1 383 —
Amortisation for the year –2 –3 –20 –18 –74 –69
Translation differences for the year — — — — –3 1
–13 –11 –90 –71 –267 –228
Carrying amount at year-end 16 11 49 56 585 492
Amortisation and impairment losses
Amortisation is included on the following lines in the Statement of Income and Other Comprehensive Income:
Software, inter-
nally developed
Software,
acquired
Customer
relations
2018 2017 2018 2017 2018 2017
Cost of goods sold –2 –3 –20 –18 –74 –69
No impairment losses have been recognised.
Distribution
rights
Total intellectual
property
Goodwill
2018 2017 2018 2017 2018 2017
Accumulated costs
At start of year 32 33 901 782 725 659
Business combinations — — 154 99 104 69
Purchases — — 13 20 — —
Internally developed assets — — 7 7 — —
Disposals and retirements — — –1 –9 — —
Reclassifications — — –38 0 — —
Translation differences for the year 0 –1 16 2 15 –3
32 32 1,052 901 844 725
Accumulated amortisation and impairment losses
At start of year –8 –5 –318 –232 –2 –2
Disposals and retirements — — 1 6 — —
Reclassifications — — 38 0 — —
Amortisation for the year –4 –3 –100 –93 — —
Translation differences for the year 0 0 –3 1 — —
–12 –8 –382 –318 –2 –2
Carrying amount at year-end 20 24 –670 583 842 723
Amortisation and impairment losses
Amortisation is included on the following lines in the Statement of Income and Other Comprehensive Income:
Distribution
rights
Total intellectual
property
Goodwill
2018 2017 2018 2017 2018 2017
Cost of goods sold –4 –3 –100 –93 — —
No impairment losses have been recognised.
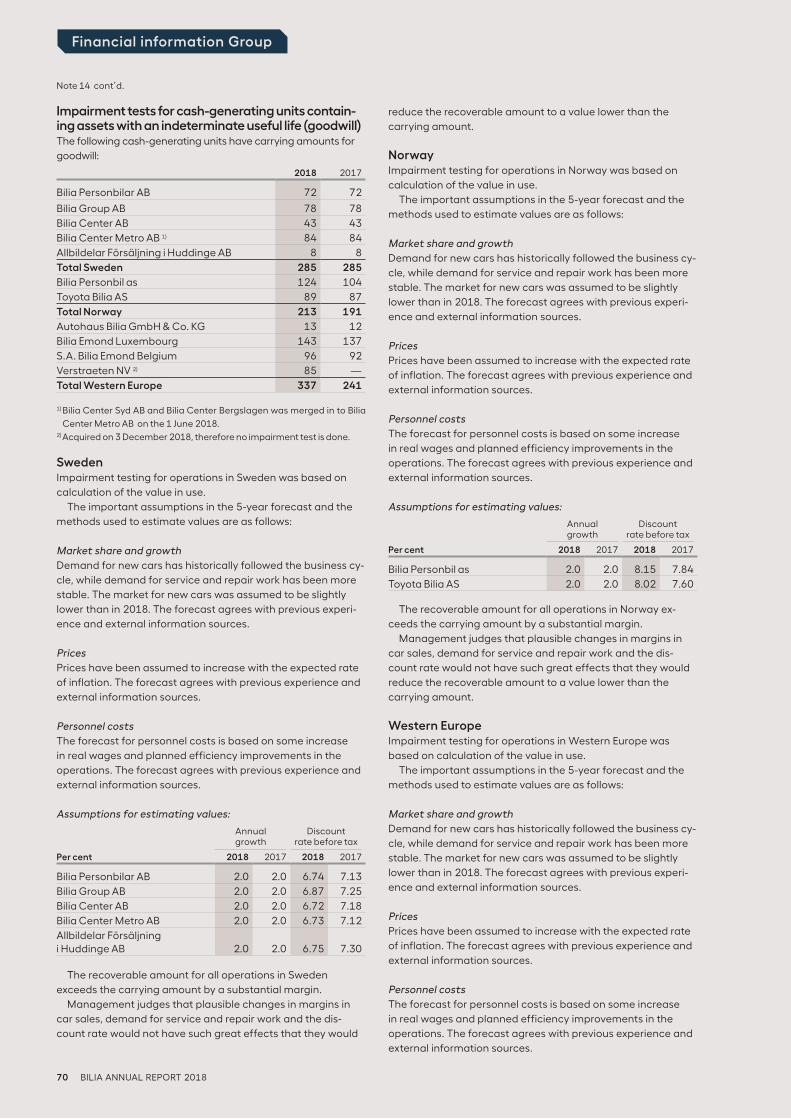
70 BILIA ANNUAL REPORT 2018
Financial information Group
Impairment tests for cash-generating units contain-ing assets with an indeterminate useful life (goodwill)The following cash-generating units have carrying amounts for
goodwill:
2018 2017
Bilia Personbilar AB 72 72
Bilia Group AB 78 78Bilia Center AB 43 43
Bilia Center Metro AB 1) 84 84
Allbildelar Försäljning i Huddinge AB 8 8
Total Sweden 285 285
Bilia Personbil as 124 104
Toyota Bilia AS 89 87
Total Norway 213 191
Autohaus Bilia GmbH & Co. KG 13 12
Bilia Emond Luxembourg 143 137
S.A. Bilia Emond Belgium 96 92
Verstraeten NV 2) 85 —
Total Western Europe 337 241
1) Bilia Center Syd AB and Bilia Center Bergslagen was merged in to Bilia
Center Metro AB on the 1 June 2018.2) Acquired on 3 December 2018, therefore no impairment test is done.
Sweden Impairment testing for operations in Sweden was based on
calculation of the value in use.
The important assumptions in the 5-year forecast and the
methods used to estimate values are as follows:
Market share and growth
Demand for new cars has historically followed the business cy-
cle, while demand for service and repair work has been more
stable. The market for new cars was assumed to be slightly
lower than in 2018. The forecast agrees with previous experi-
ence and external information sources.
Prices
Prices have been assumed to increase with the expected rate
of inflation. The forecast agrees with previous experience and
external information sources.
Personnel costs
The forecast for personnel costs is based on some increase
in real wages and planned efficiency improvements in the
operations. The forecast agrees with previous experience and
external information sources.
Assumptions for estimating values:
Annual growth
Discount rate before tax
Per cent 2018 2017 2018 2017
Bilia Personbilar AB 2.0 2.0 6.74 7.13
Bilia Group AB 2.0 2.0 6.87 7.25
Bilia Center AB 2.0 2.0 6.72 7.18
Bilia Center Metro AB 2.0 2.0 6.73 7.12
Allbildelar Försäljning i Huddinge AB 2.0 2.0 6.75 7.30
The recoverable amount for all operations in Sweden
exceeds the carrying amount by a substantial margin.
Management judges that plausible changes in margins in
car sales, demand for service and repair work and the dis-
count rate would not have such great effects that they would
reduce the recoverable amount to a value lower than the
carrying amount.
Norway Impairment testing for operations in Norway was based on
calculation of the value in use.
The important assumptions in the 5-year forecast and the
methods used to estimate values are as follows:
Market share and growth
Demand for new cars has historically followed the business cy-
cle, while demand for service and repair work has been more
stable. The market for new cars was assumed to be slightly
lower than in 2018. The forecast agrees with previous experi-
ence and external information sources.
Prices
Prices have been assumed to increase with the expected rate
of inflation. The forecast agrees with previous experience and
external information sources.
Personnel costs
The forecast for personnel costs is based on some increase
in real wages and planned efficiency improvements in the
operations. The forecast agrees with previous experience and
external information sources.
Assumptions for estimating values:
Annual growth
Discount rate before tax
Per cent 2018 2017 2018 2017
Bilia Personbil as 2.0 2.0 8.15 7.84
Toyota Bilia AS 2.0 2.0 8.02 7.60
The recoverable amount for all operations in Norway ex-
ceeds the carrying amount by a substantial margin.
Management judges that plausible changes in margins in
car sales, demand for service and repair work and the dis-
count rate would not have such great effects that they would
reduce the recoverable amount to a value lower than the
carrying amount.
Western Europe Impairment testing for operations in Western Europe was
based on calculation of the value in use.
The important assumptions in the 5-year forecast and the
methods used to estimate values are as follows:
Market share and growth
Demand for new cars has historically followed the business cy-
cle, while demand for service and repair work has been more
stable. The market for new cars was assumed to be slightly
lower than in 2018. The forecast agrees with previous experi-
ence and external information sources.
Prices
Prices have been assumed to increase with the expected rate
of inflation. The forecast agrees with previous experience and
external information sources.
Personnel costs
The forecast for personnel costs is based on some increase
in real wages and planned efficiency improvements in the
operations. The forecast agrees with previous experience and
external information sources.
Note 14 cont’d.
BILIA ANNUAL REPORT 2018 71
Financial information Group
Assumptions for estimating values:
Annual growth
Discount rate before tax
Per cent 2018 2017 2018 2017
Autohaus Bilia GmbH & Co. KG 2.0 2.0 6.39 7.68
Bilia Emond Luxembourg 2.0 2.0 6.92 6.99
S.A. Bilia Emond Belgium 2.0 2.0 7.59 7.37
The recoverable amount for operations in Luxembourg and
Belgium exceeds the carrying amount by a substantial margin.
Management judges that plausible changes in margins in
car sales, demand for service and repair work and the dis-
count rate would not have such great effects that they would
reduce the recoverable amount for operations in Luxembourg
and Belgium to a value lower than the carrying amount.
The recoverable amount for the operation in Germany is indi-
cating a need for impairment. A number of sensitivity analyses
have been done and show that a reasonable change in the
different assumptions together with an assessment of a possible
net sales price, defends the present carrying amount. The good-
will value for Autohaus Bilia GmbH & Co. KG is SEK 13 M.
Note 15 Property, plant and equipment
➤ Accounting principleBilia applies IAS 16 Property, Plant and Equipment in
accounting for property, plant and equipment and IAS 17
Leases in accounting for leases.
Owned assetsProperty, plant and equipment are recognised at cost less ac-
cumulated depreciation and any impairment losses. The cost
includes the purchase price plus expenses directly attributable
to the asset for bringing the asset to its location and to work-
ing condition for its intended use.
Borrowing costsBorrowing costs that are directly attributable to the acquisi-
tion, construction or production of a qualifying asset are
capitalised as a part of the cost of the qualifying asset. A
qualifying asset is an asset that necessarily takes a substantial
period of time to get ready for its intended use or sale. Primar-
ily, borrowing costs that have arisen on loans that are specific
to the qualifying asset are capitalised. Secondarily, borrowing
costs that have arisen on general loans that are not specific to
any qualifying asset are capitalised.
Construction in progressConstruction in progress consists primarily of conversion
projects in Täby, Västerås, Segeltorp and Skövde in Sweden.
Leased assetsLessee
Leases are classified as either finance or operating leases. In
the case of finance leases, the economic risks and rewards
incidental to ownership are transferred substantially to the les-
see. Otherwise the lease is classified as an operating lease.
Assets that are leased under finance leases are recog-
nised as assets in the Statement of Financial Position and are
initially measured at the lower of the fair value of the asset
and the present value of the minimum lease payments at the
commencement of the lease. Commitments to pay future
lease payments are recognised as non-current and current
liabilities. The leased assets are depreciated according to plan,
while the minimum lease payments are recognised as interest
and repayment of the liabilities. The interest expense is al-
located over the lease period so that each accounting period
is charged with an amount corresponding to a fixed rate of
interest for the liability recognised during that period. Variable
payments are recognised as expenses in the periods they are
incurred.
Lessor
Assets that are leased out under operating leases are recog-
nised as property, plant and equipment. These assets consist
of owned and rented cars that are leased out under operating
leases, as well as sold cars combined with a future repurchase
commitment at a guaranteed residual value.
Subsequent expendituresSubsequent expenditures are added to the cost only if it is
probable that the future economic benefits associated with
the asset will flow to the company and the cost of the asset
can be measured reliably. All other subsequent expenditures
are recognised as expense in the period they are incurred.
A subsequent expenditure is added to the cost if the ex-
penditure relates to replacements of identified components
or parts thereof. The expenditure is also added to the cost in
cases when a new component has been created. Any unde-
preciated carrying amounts on replaced components, or parts
of components, are retired and recognised as expenses in
conjunction with their replacement. Repairs are recognised as
expenses when they occur.
Principles of depreciationDepreciation is straight-line over the estimated useful life of
the asset. Land is not depreciated.
Estimated useful lives:
• Computer equipment 3 years
• Land and buildings 5–50 years
• Equipment, tools, fixtures and fittings 3–10 years
• Leased vehicles 1–4 years 1)
An annual assessment is made of an asset’s residual value and
useful life.
1) Leased vehicles are written down to an expected residual value at
the end of the lease period.
Impairment lossesFor an explanation of the accounting principle for impairment
losses, see Note 14 “Intangible assets”.
➤ Important accounting estimates and judgementsSee Note 2 “Revenue” from cars sold with repurchase
agreements.
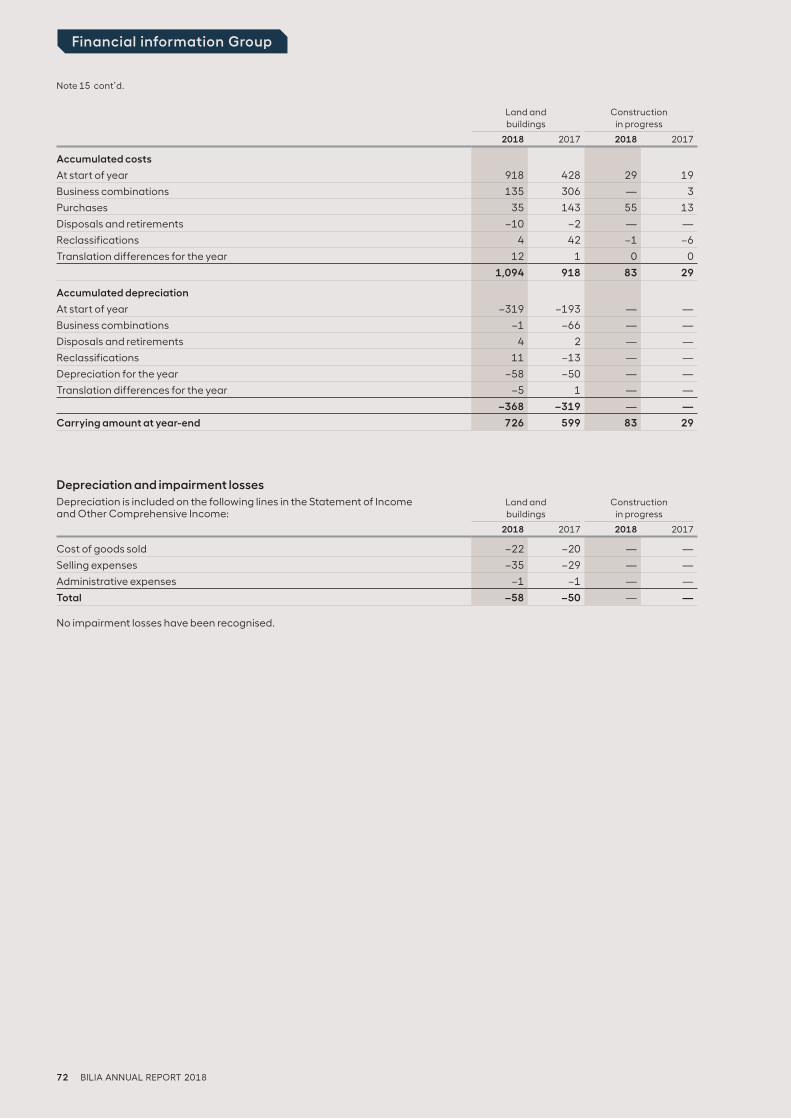
72 BILIA ANNUAL REPORT 2018
Financial information Group
Note 15 cont’d.
Land and buildings
Construction in progress
2018 2017 2018 2017
Accumulated costs
At start of year 918 428 29 19
Business combinations 135 306 — 3
Purchases 35 143 55 13
Disposals and retirements –10 –2 — —
Reclassifications 4 42 –1 –6
Translation differences for the year 12 1 0 0
1,094 918 83 29
Accumulated depreciation
At start of year –319 –193 — —
Business combinations –1 –66 — —
Disposals and retirements 4 2 — —
Reclassifications 11 –13 — —
Depreciation for the year –58 –50 — —
Translation differences for the year –5 1 — —
–368 –319 — —
Carrying amount at year-end 726 599 83 29
Depreciation and impairment losses
Depreciation is included on the following lines in the Statement of Income and Other Comprehensive Income:
Land and
buildings
Construction
in progress
2018 2017 2018 2017
Cost of goods sold –22 –20 — —
Selling expenses –35 –29 — —
Administrative expenses –1 –1 — —
Total –58 –50 — —
No impairment losses have been recognised.
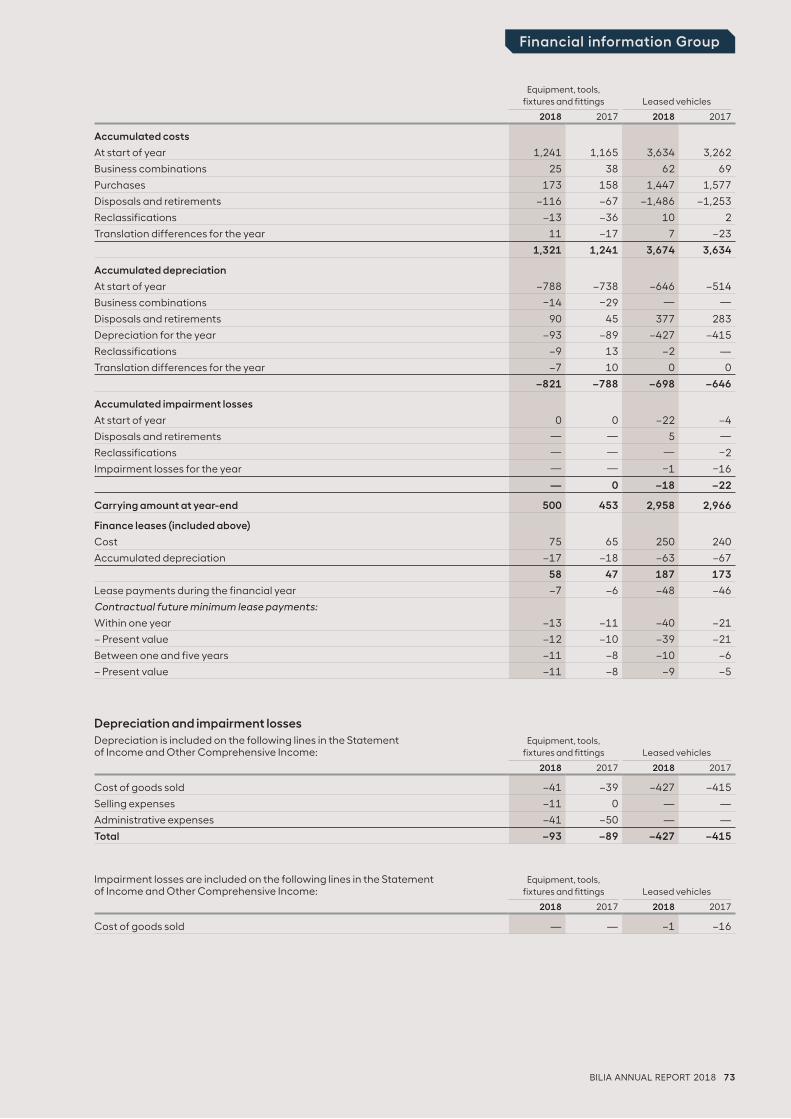
BILIA ANNUAL REPORT 2018 73
Financial information Group
Equipment, tools,
fixtures and fittings
Leased vehicles
2018 2017 2018 2017
Accumulated costs
At start of year 1,241 1,165 3,634 3,262
Business combinations 25 38 62 69
Purchases 173 158 1,447 1,577
Disposals and retirements –116 –67 –1,486 –1,253
Reclassifications –13 –36 10 2
Translation differences for the year 11 –17 7 –23
1,321 1,241 3,674 3,634
Accumulated depreciation
At start of year –788 –738 –646 –514
Business combinations –14 –29 — —
Disposals and retirements 90 45 377 283
Depreciation for the year –93 –89 –427 –415
Reclassifications –9 13 –2 —
Translation differences for the year –7 10 0 0
–821 –788 –698 –646
Accumulated impairment losses
At start of year 0 0 –22 –4
Disposals and retirements — — 5 —
Reclassifications — — — –2
Impairment losses for the year — — –1 –16
— 0 –18 –22
Carrying amount at year-end 500 453 2,958 2,966
Finance leases (included above)
Cost 75 65 250 240
Accumulated depreciation –17 –18 –63 –67
58 47 187 173
Lease payments during the financial year –7 –6 –48 –46
Contractual future minimum lease payments:
Within one year –13 –11 –40 –21
– Present value –12 –10 –39 –21
Between one and five years –11 –8 –10 –6
– Present value –11 –8 –9 –5
Depreciation and impairment losses
Depreciation is included on the following lines in the Statement of Income and Other Comprehensive Income:
Equipment, tools,
fixtures and fittings
Leased vehicles
2018 2017 2018 2017
Cost of goods sold –41 –39 –427 –415
Selling expenses –11 0 — —
Administrative expenses –41 –50 — —
Total –93 –89 –427 –415
Impairment losses are included on the following lines in the Statement of Income and Other Comprehensive Income:
Equipment, tools,
fixtures and fittings
Leased vehicles
2018 2017 2018 2017
Cost of goods sold — — –1 –16
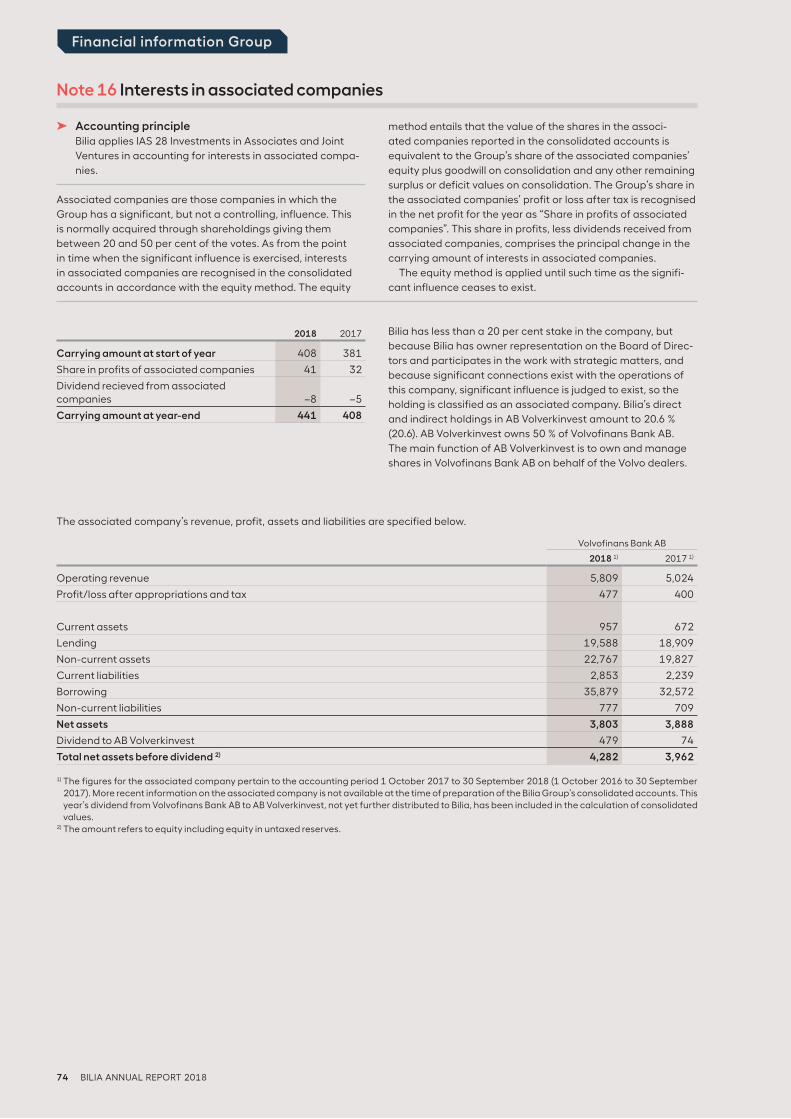
74 BILIA ANNUAL REPORT 2018
Financial information Group
Bilia has less than a 20 per cent stake in the company, but
because Bilia has owner representation on the Board of Direc-
tors and participates in the work with strategic matters, and
because significant connections exist with the operations of
this company, significant influence is judged to exist, so the
holding is classified as an associated company. Bilia’s direct
and indirect holdings in AB Volverkinvest amount to 20.6 % (20.6). AB Volverkinvest owns 50 % of Volvofinans Bank AB.
The main function of AB Volverkinvest is to own and manage
shares in Volvofinans Bank AB on behalf of the Volvo dealers.
Note 16 Interests in associated companies
2018 2017
Carrying amount at start of year 408 381
Share in profits of associated companies 41 32
Dividend recieved from associated companies –8 –5
Carrying amount at year-end 441 408
The associated company’s revenue, profit, assets and liabilities are specified below.
➤ Accounting principleBilia applies IAS 28 Investments in Associates and Joint
Ventures in accounting for interests in associated compa-
nies.
Associated companies are those companies in which the
Group has a significant, but not a controlling, influence. This
is normally acquired through shareholdings giving them
between 20 and 50 per cent of the votes. As from the point
in time when the significant influence is exercised, interests
in associated companies are recognised in the consolidated
accounts in accordance with the equity method. The equity
method entails that the value of the shares in the associ-
ated companies reported in the consolidated accounts is
equivalent to the Group’s share of the associated companies’
equity plus goodwill on consolidation and any other remaining
surplus or deficit values on consolidation. The Group’s share in
the associated companies’ profit or loss after tax is recognised
in the net profit for the year as “Share in profits of associated
companies”. This share in profits, less dividends received from
associated companies, comprises the principal change in the
carrying amount of interests in associated companies.
The equity method is applied until such time as the signifi-
cant influence ceases to exist.
Volvofinans Bank AB
2018 1) 2017 1)
Operating revenue 5,809 5,024
Profit/loss after appropriations and tax 477 400
Current assets 957 672
Lending 19,588 18,909
Non-current assets 22,767 19,827
Current liabilities 2,853 2,239
Borrowing 35,879 32,572
Non-current liabilities 777 709
Net assets 3,803 3,888
Dividend to AB Volverkinvest 479 74
Total net assets before dividend 2) 4,282 3,962
1) The figures for the associated company pertain to the accounting period 1 October 2017 to 30 September 2018 (1 October 2016 to 30 September
2017). More recent information on the associated company is not available at the time of preparation of the Bilia Group’s consolidated accounts. This
year’s dividend from Volvofinans Bank AB to AB Volverkinvest, not yet further distributed to Bilia, has been included in the calculation of consolidated
values.2) The amount refers to equity including equity in untaxed reserves.
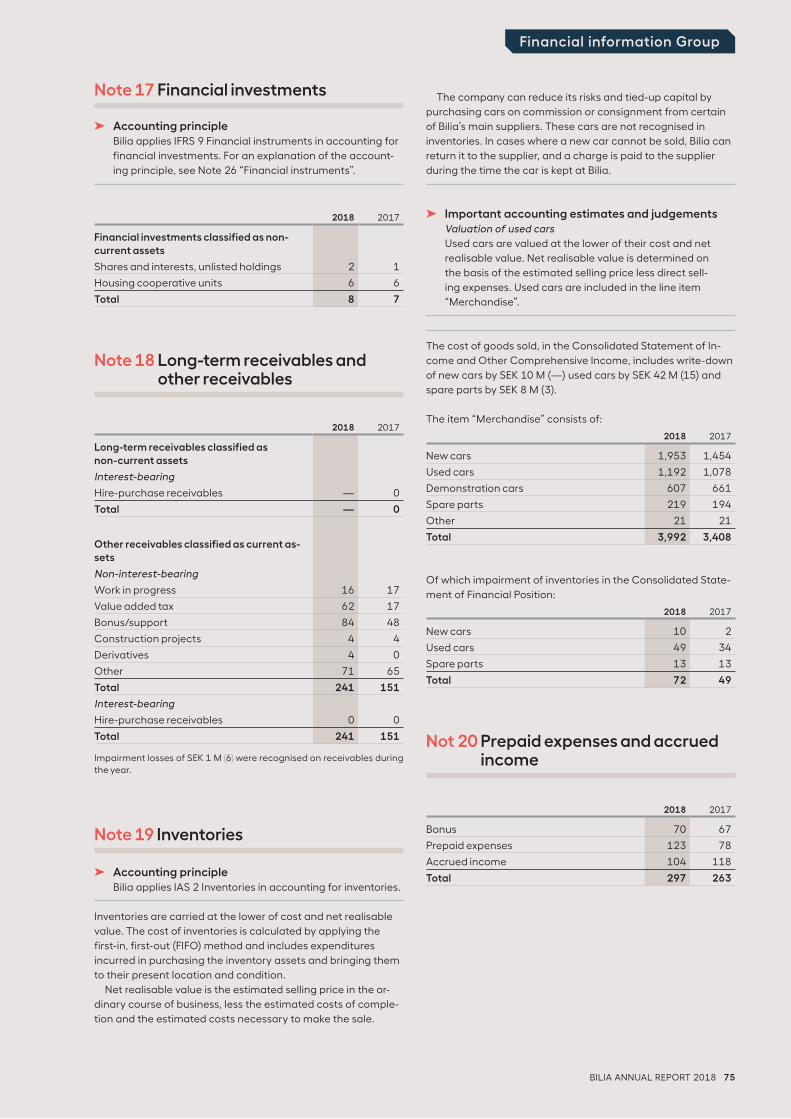
BILIA ANNUAL REPORT 2018 75
Financial information Group
Note 17 Financial investments The company can reduce its risks and tied-up capital by
purchasing cars on commission or consignment from certain
of Bilia’s main suppliers. These cars are not recognised in
inventories. In cases where a new car cannot be sold, Bilia can
return it to the supplier, and a charge is paid to the supplier
during the time the car is kept at Bilia.
➤ Important accounting estimates and judgementsValuation of used cars
Used cars are valued at the lower of their cost and net
realisable value. Net realisable value is determined on
the basis of the estimated selling price less direct sell-
ing expenses. Used cars are included in the line item
“ Merchandise”.
The cost of goods sold, in the Consolidated Statement of In-
come and Other Comprehensive Income, includes write-down
of new cars by SEK 10 M (—) used cars by SEK 42 M (15) and
spare parts by SEK 8 M (3).
The item “Merchandise” consists of:
2018 2017
New cars 1,953 1,454
Used cars 1,192 1,078
Demonstration cars 607 661
Spare parts 219 194
Other 21 21
Total 3,992 3,408
Of which impairment of inventories in the Consolidated State-
ment of Financial Position:
2018 2017
New cars 10 2
Used cars 49 34
Spare parts 13 13
Total 72 49
Not 20 Prepaid expenses and accrued income
2018 2017
Bonus 70 67
Prepaid expenses 123 78
Accrued income 104 118
Total 297 263
➤ Accounting principleBilia applies IFRS 9 Financial instruments in accounting for
financial investments. For an explanation of the account-
ing principle, see Note 26 “ Financial instruments”.
2018 2017
Financial investments classified as non-current assets
Shares and interests, unlisted holdings 2 1
Housing cooperative units 6 6
Total 8 7
Note 18 Long-term receivables and other receivables
2018 2017
Long-term receivables classified as non-current assets
Interest-bearing
Hire-purchase receivables — 0
Total — 0
Other receivables classified as current as-sets
Non-interest-bearing
Work in progress 16 17
Value added tax 62 17
Bonus/support 84 48
Construction projects 4 4
Derivatives 4 0
Other 71 65
Total 241 151
Interest-bearing
Hire-purchase receivables 0 0
Total 241 151
Impairment losses of SEK 1 M (6) were recognised on receivables during
the year.
Note 19 Inventories
➤ Accounting principleBilia applies IAS 2 Inventories in accounting for inventories.
Inventories are carried at the lower of cost and net realisable
value. The cost of inventories is calculated by applying the
first-in, first-out (FIFO) method and includes expenditures
incurred in purchasing the inventory assets and bringing them
to their present location and condition.
Net realisable value is the estimated selling price in the or-
dinary course of business, less the estimated costs of comple-
tion and the estimated costs necessary to make the sale.
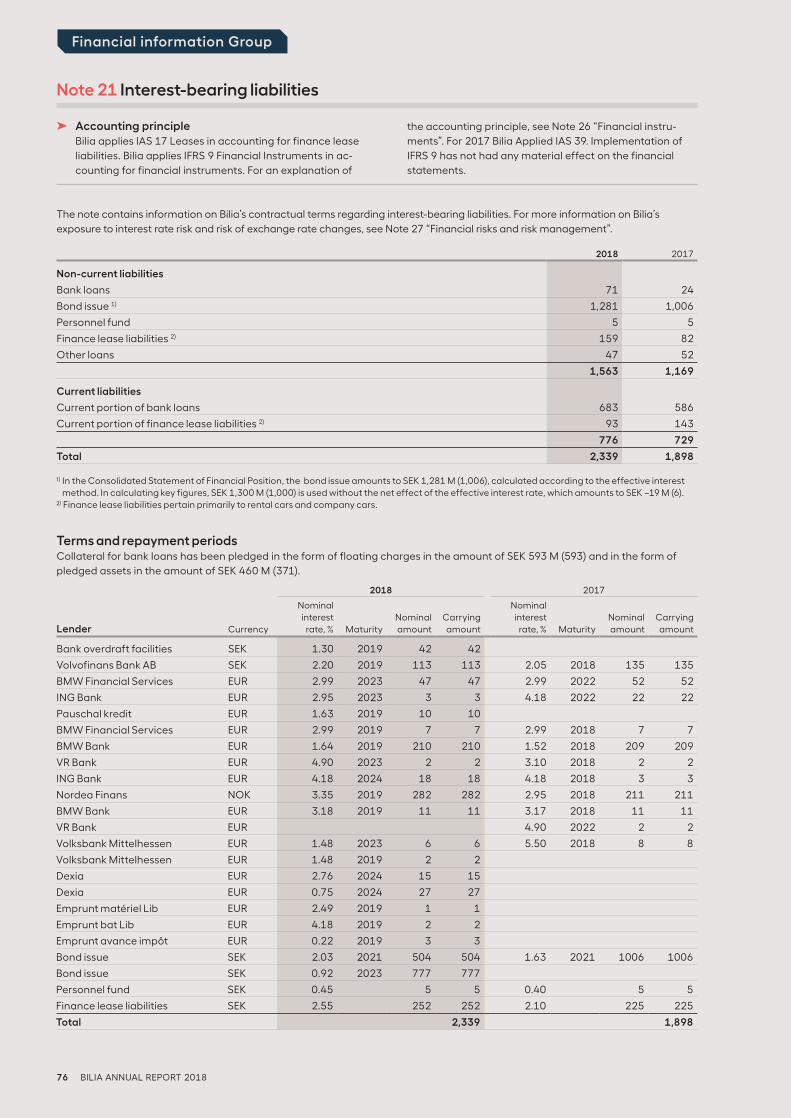
76 BILIA ANNUAL REPORT 2018
Financial information Group
Note 21 Interest-bearing liabilities
The note contains information on Bilia’s contractual terms regarding interest-bearing liabilities. For more information on Bilia’s
exposure to interest rate risk and risk of exchange rate changes, see Note 27 “Financial risks and risk management”.
2018 2017
Non-current liabilities
Bank loans 71 24
Bond issue 1) 1,281 1,006
Personnel fund 5 5
Finance lease liabilities 2) 159 82
Other loans 47 52
1,563 1,169
Current liabilities
Current portion of bank loans 683 586
Current portion of finance lease liabilities 2) 93 143
776 729
Total 2,339 1,898
1) In the Consolidated Statement of Financial Position, the bond issue amounts to SEK 1,281 M (1,006), calculated according to the effective interest
method. In calculating key figures, SEK 1,300 M (1,000) is used without the net effect of the effective interest rate, which amounts to SEK –19 M (6).
2) Finance lease liabilities pertain primarily to rental cars and company cars.
Terms and repayment periodsCollateral for bank loans has been pledged in the form of floating charges in the amount of SEK 593 M (593) and in the form of
pledged assets in the amount of SEK 460 M (371).
2018 2017
Lender Currency
Nominal
interest
rate, % Maturity
Nominal
amount
Carrying
amount
Nominal
interest
rate, % Maturity
Nominal
amount
Carrying
amount
Bank overdraft facilities SEK 1.30 2019 42 42
Volvofinans Bank AB SEK 2.20 2019 113 113 2.05 2018 135 135
BMW Financial Services EUR 2.99 2023 47 47 2.99 2022 52 52
ING Bank EUR 2.95 2023 3 3 4.18 2022 22 22
Pauschal kredit EUR 1.63 2019 10 10
BMW Financial Services EUR 2.99 2019 7 7 2.99 2018 7 7
BMW Bank EUR 1.64 2019 210 210 1.52 2018 209 209
VR Bank EUR 4.90 2023 2 2 3.10 2018 2 2
ING Bank EUR 4.18 2024 18 18 4.18 2018 3 3
Nordea Finans NOK 3.35 2019 282 282 2.95 2018 211 211
BMW Bank EUR 3.18 2019 11 11 3.17 2018 11 11
VR Bank EUR 4.90 2022 2 2
Volksbank Mittelhessen EUR 1.48 2023 6 6 5.50 2018 8 8
Volksbank Mittelhessen EUR 1.48 2019 2 2
Dexia EUR 2.76 2024 15 15
Dexia EUR 0.75 2024 27 27
Emprunt matériel Lib EUR 2.49 2019 1 1
Emprunt bat Lib EUR 4.18 2019 2 2
Emprunt avance impôt EUR 0.22 2019 3 3
Bond issue SEK 2.03 2021 504 504 1.63 2021 1006 1006
Bond issue SEK 0.92 2023 777 777
Personnel fund SEK 0.45 5 5 0.40 5 5
Finance lease liabilities SEK 2.55 252 252 2.10 225 225
Total 2,339 1,898
➤ Accounting principleBilia applies IAS 17 Leases in accounting for finance lease
liabilities. Bilia applies IFRS 9 Financial Instruments in ac-
counting for financial instruments. For an explanation of
the accounting principle, see Note 26 “Financial instru-
ments”. For 2017 Bilia Applied IAS 39. Implementation of
IFRS 9 has not had any material effect on the financial
statements.
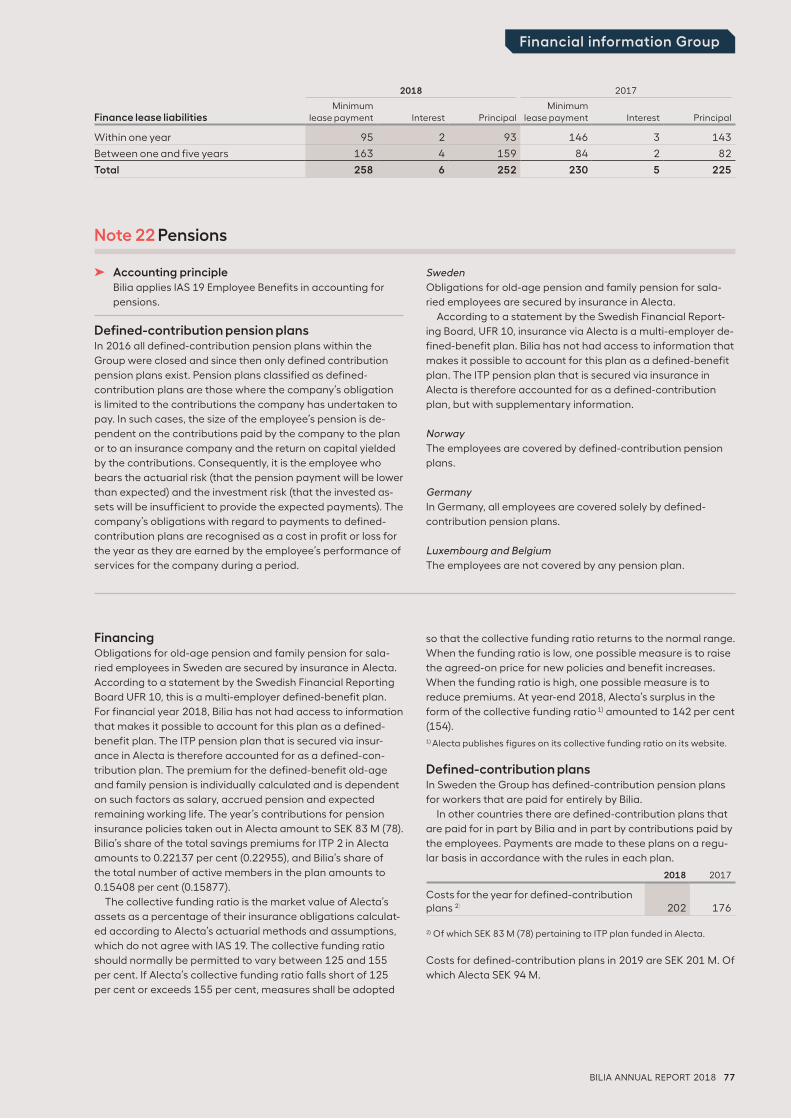
BILIA ANNUAL REPORT 2018 77
Financial information Group
2018 2017
Finance lease liabilitiesMinimum
lease payment Interest PrincipalMinimum
lease payment Interest Principal
Within one year 95 2 93 146 3 143
Between one and five years 163 4 159 84 2 82
Total 258 6 252 230 5 225
Note 22 Pensions
➤ Accounting principleBilia applies IAS 19 Employee Benefits in accounting for
pensions.
Defined-contribution pension plansIn 2016 all defined-contribution pension plans within the
Group were closed and since then only defined contribution
pension plans exist. Pension plans classified as defined-
contribution plans are those where the company’s obligation
is limited to the contributions the company has undertaken to
pay. In such cases, the size of the employee’s pension is de-
pendent on the contributions paid by the company to the plan
or to an insurance company and the return on capital yielded
by the contributions. Consequently, it is the employee who
bears the actuarial risk (that the pension payment will be lower
than expected) and the investment risk (that the invested as-
sets will be insufficient to provide the expected payments). The
company’s obligations with regard to payments to defined-
contribution plans are recognised as a cost in profit or loss for
the year as they are earned by the employee’s performance of
services for the company during a period.
Sweden
Obligations for old-age pension and family pension for sala-
ried employees are secured by insurance in Alecta.
According to a statement by the Swedish Financial Report-
ing Board, UFR 10, insurance via Alecta is a multi-employer de-
fined-benefit plan. Bilia has not had access to information that
makes it possible to account for this plan as a defined-benefit
plan. The ITP pension plan that is secured via insurance in
Alecta is therefore accounted for as a defined-contribution
plan, but with supplementary information.
Norway
The employees are covered by defined-contribution pension
plans.
Germany
In Germany, all employees are covered solely by defined-
contribution pension plans.
Luxembourg and Belgium
The employees are not covered by any pension plan.
FinancingObligations for old-age pension and family pension for sala-
ried employees in Sweden are secured by insurance in Alecta.
According to a statement by the Swedish Financial Reporting
Board UFR 10, this is a multi-employer defined-benefit plan.
For financial year 2018, Bilia has not had access to information
that makes it possible to account for this plan as a defined-
benefit plan. The ITP pension plan that is secured via insur-
ance in Alecta is therefore accounted for as a defined-con-
tribution plan. The premium for the defined-benefit old-age
and family pension is individually calculated and is dependent
on such factors as salary, accrued pension and expected
remaining working life. The year’s contributions for pension
insurance policies taken out in Alecta amount to SEK 83 M (78).
Bilia’s share of the total savings premiums for ITP 2 in Alecta
amounts to 0.22137 per cent (0.22955), and Bilia’s share of
the total number of active members in the plan amounts to
0.15408 per cent (0.15877).
The collective funding ratio is the market value of Alecta’s
assets as a percentage of their insurance obligations calculat-
ed according to Alecta’s actuarial methods and assumptions,
which do not agree with IAS 19. The collective funding ratio
should normally be permitted to vary between 125 and 155
per cent. If Alecta’s collective funding ratio falls short of 125
per cent or exceeds 155 per cent, measures shall be adopted
so that the collective funding ratio returns to the normal range.
When the funding ratio is low, one possible measure is to raise
the agreed-on price for new policies and benefit increases.
When the funding ratio is high, one possible measure is to
reduce premiums. At year-end 2018, Alecta’s surplus in the
form of the collective funding ratio 1) amounted to 142 per cent
(154).
1) Alecta publishes figures on its collective funding ratio on its website.
Defined-contribution plansIn Sweden the Group has defined-contribution pension plans
for workers that are paid for entirely by Bilia.
In other countries there are defined-contribution plans that
are paid for in part by Bilia and in part by contributions paid by
the employees. Payments are made to these plans on a regu-
lar basis in accordance with the rules in each plan.
2018 2017
Costs for the year for defined-contribution plans 2) 202 176
2) Of which SEK 83 M (78) pertaining to ITP plan funded in Alecta.
Costs for defined-contribution plans in 2019 are SEK 201 M. Of
which Alecta SEK 94 M.
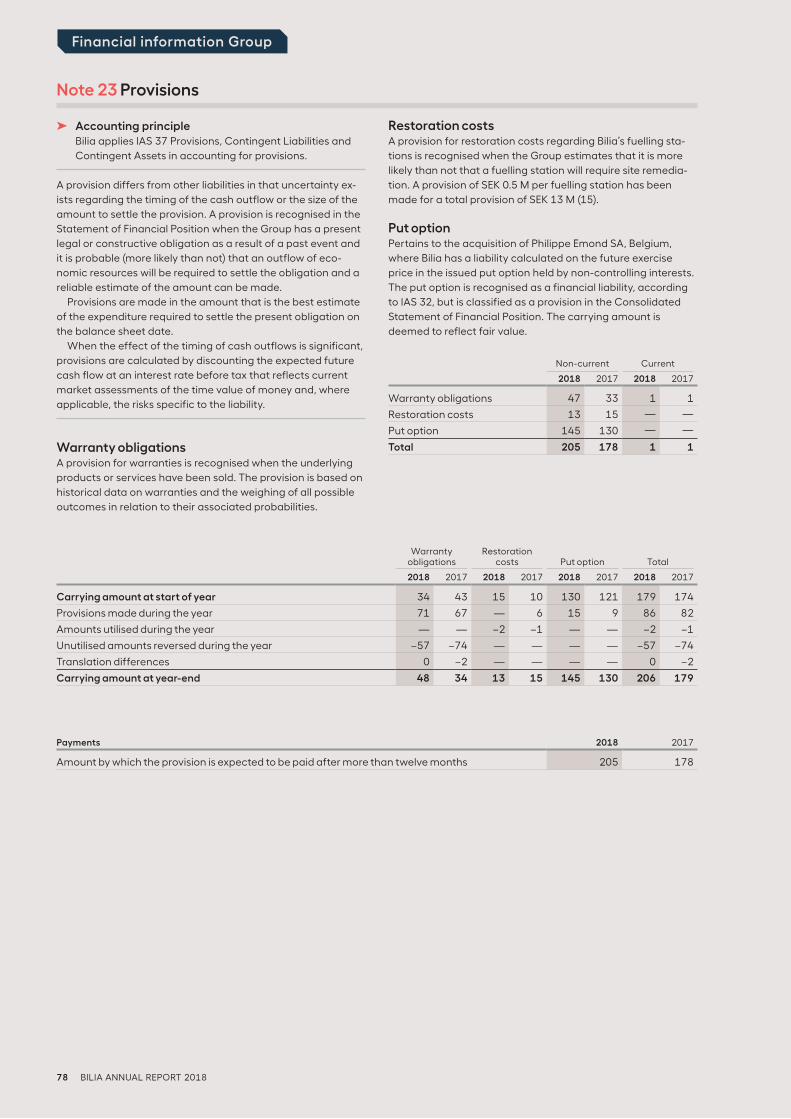
78 BILIA ANNUAL REPORT 2018
Financial information Group
Note 23 Provisions
➤ Accounting principleBilia applies IAS 37 Provisions, Contingent Liabilities and Contingent Assets in accounting for provisions.
A provision differs from other liabilities in that uncertainty ex-ists regarding the timing of the cash outflow or the size of the amount to settle the provision. A provision is recognised in the Statement of Financial Position when the Group has a present legal or constructive obligation as a result of a past event and it is probable (more likely than not) that an outflow of eco-nomic resources will be required to settle the obligation and a reliable estimate of the amount can be made.
Provisions are made in the amount that is the best estimate of the expenditure required to settle the present obligation on the balance sheet date.
When the effect of the timing of cash outflows is significant, provisions are calculated by discounting the expected future cash flow at an interest rate before tax that reflects current market assessments of the time value of money and, where applicable, the risks specific to the liability.
Warranty obligationsA provision for warranties is recognised when the underlying products or services have been sold. The provision is based on historical data on warranties and the weighing of all possible outcomes in relation to their associated probabilities.
Restoration costsA provision for restoration costs regarding Bilia’s fuelling sta-tions is recognised when the Group estimates that it is more likely than not that a fuelling station will require site remedia-tion. A provision of SEK 0.5 M per fuelling station has been
made for a total provision of SEK 13 M (15).
Put optionPertains to the acquisition of Philippe Emond SA, Belgium,
where Bilia has a liability calculated on the future exercise
price in the issued put option held by non-controlling interests.
The put option is recognised as a financial liability, according
to IAS 32, but is classified as a provision in the Consolidated
Statement of Financial Position. The carrying amount is
deemed to reflect fair value.
Warranty obligations
Restoration costs
Put option
Total
2018 2017 2018 2017 2018 2017 2018 2017
Carrying amount at start of year 34 43 15 10 130 121 179 174
Provisions made during the year 71 67 — 6 15 9 86 82
Amounts utilised during the year — — –2 –1 — — –2 –1
Unutilised amounts reversed during the year –57 –74 — — — — –57 –74
Translation differences 0 –2 — — — — 0 –2
Carrying amount at year-end 48 34 13 15 145 130 206 179
Payments 2018 2017
Amount by which the provision is expected to be paid after more than twelve months 205 178
Non-current
Current
2018 2017 2018 2017
Warranty obligations 47 33 1 1
Restoration costs 13 15 — —
Put option 145 130 — —
Total 205 178 1 1
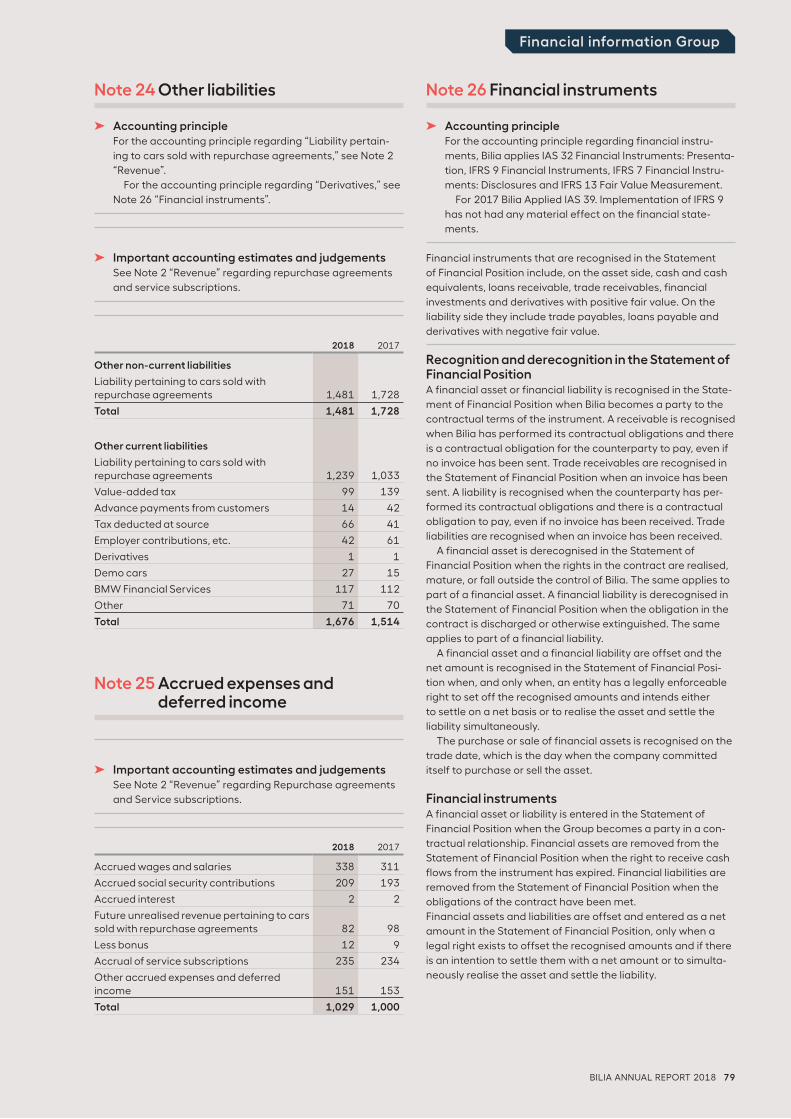
BILIA ANNUAL REPORT 2018 79
Financial information Group
2018 2017
Other non-current liabilities
Liability pertaining to cars sold with repurchase agreements 1,481 1,728
Total 1,481 1,728
Other current liabilities
Liability pertaining to cars sold with repurchase agreements 1,239 1,033
Value-added tax 99 139
Advance payments from customers 14 42
Tax deducted at source 66 41
Employer contributions, etc. 42 61
Derivatives 1 1
Demo cars 27 15
BMW Financial Services 117 112
Other 71 70
Total 1,676 1,514
Note 24 Other liabilities
➤ Accounting principleFor the accounting principle regarding “Liability pertain-
ing to cars sold with repurchase agreements,” see Note 2
“Revenue”.
For the accounting principle regarding “Derivatives,” see
Note 26 “Financial instruments”.
➤ Important accounting estimates and judgementsSee Note 2 “Revenue” regarding repurchase agreements
and service subscriptions.
2018 2017
Accrued wages and salaries 338 311
Accrued social security contributions 209 193
Accrued interest 2 2
Future unrealised revenue pertaining to cars sold with repurchase agreements 82 98
Less bonus 12 9
Accrual of service subscriptions 235 234
Other accrued expenses and deferred income 151 153
Total 1,029 1,000
Note 25 Accrued expenses and deferred income
➤ Important accounting estimates and judgementsSee Note 2 “Revenue” regarding Repurchase agreements
and Service subscriptions.
Note 26 Financial instruments
➤ Accounting principleFor the accounting principle regarding financial instru-
ments, Bilia applies IAS 32 Financial Instruments: Presenta-
tion, IFRS 9 Financial Instruments, IFRS 7 Financial Instru-
ments: Disclosures and IFRS 13 Fair Value Measurement.
For 2017 Bilia Applied IAS 39. Implementation of IFRS 9
has not had any material effect on the financial state-
ments.
Financial instruments that are recognised in the Statement
of Financial Position include, on the asset side, cash and cash
equivalents, loans receivable, trade receivables, financial
investments and derivatives with positive fair value. On the
liability side they include trade payables, loans payable and
derivatives with negative fair value.
Recognition and derecognition in the Statement of Financial PositionA financial asset or financial liability is recognised in the State-
ment of Financial Position when Bilia becomes a party to the
contractual terms of the instrument. A receivable is recognised
when Bilia has performed its contractual obligations and there
is a contractual obligation for the counterparty to pay, even if
no invoice has been sent. Trade receivables are recognised in
the Statement of Financial Position when an invoice has been
sent. A liability is recognised when the counterparty has per-
formed its contractual obligations and there is a contractual
obligation to pay, even if no invoice has been received. Trade
liabilities are recognised when an invoice has been received.
A financial asset is derecognised in the Statement of
Financial Position when the rights in the contract are realised,
mature, or fall outside the control of Bilia. The same applies to
part of a financial asset. A financial liability is derecognised in
the Statement of Financial Position when the obligation in the
contract is discharged or otherwise extinguished. The same
applies to part of a financial liability.
A financial asset and a financial liability are offset and the
net amount is recognised in the Statement of Financial Posi-
tion when, and only when, an entity has a legally enforceable
right to set off the recognised amounts and intends either
to settle on a net basis or to realise the asset and settle the
liability simultaneously.
The purchase or sale of financial assets is recognised on the
trade date, which is the day when the company committed
itself to purchase or sell the asset.
Financial instrumentsA financial asset or liability is entered in the Statement of
Financial Position when the Group becomes a party in a con-
tractual relationship. Financial assets are removed from the
Statement of Financial Position when the right to receive cash
flows from the instrument has expired. Financial liabilities are
removed from the Statement of Financial Position when the
obligations of the contract have been met.
Financial assets and liabilities are offset and entered as a net
amount in the Statement of Financial Position, only when a
legal right exists to offset the recognised amounts and if there
is an intention to settle them with a net amount or to simulta-
neously realise the asset and settle the liability.
80 BILIA ANNUAL REPORT 2018
Financial information Group
Classification of financial instrumentsAll financial instruments are initially measured at their respec-
tive fair values plus transaction costs, apart from financial
instruments that are measured at fair value through the
Statement of Income and Other Comprehensive Income on
an ongoing basis. With these assets, transaction costs are
recognised as expenses on an ongoing basis.
Interest-bearing financial instruments
The classification and measurement of interest-bearing
financial assets depends on the purpose of the financial asset.
Interest-bearing financial assets are measured at either:
• Amortised cost
• Fair value in other comprehensive income
• Fair value through profit or loss
This category is comprised of hire-purchase receivables, ac-
counts receivable and other receivables. Assets in this catego-
ry are measured at amortised cost. All interest-bearing assets
are held to obtain ongoing payments in the form of repay-
ments and interest. For this reason, all interest-bearing assets
are recognised and measured at their respective amortised
cost in accordance with the effective interest rate method.
Amortised cost is determined based on the effective interest
rate calculated at the time of acquisition. Interest income is
recognised in net financial items in the Statement of Income
and Other Comprehensive Income. Any capital gains or losses
arising when these assets are derecognised are recognised
as other income and expenses. Bilia recognises the following
interest-bearing assets in its Statement of Financial Position:
• Cash and cash equivalents consist of cash on hand and
demand deposits at banks and similar institutions, as well as
short-term, highly liquid investments.
• Short-term investments have been classified as cash and
cash equivalents based on the fact that they carry a negli-
gible risk of value fluctuations, they can easily be converted
to cash and they have a maturity of not more than three
months from their date of acquisition.
• Trade receivables.
• Lease recievables, short- and long-term.
• Other long-term receivables.
Assets with a short duration are not discounted. Impairment
losses are reversed if the previous reasons for write-down no
longer apply and full payment is expected to be received from
the customer.
Equity instruments
All equity instruments are entered at their respective fair val-
ues in the Statement of Income and Other Comprehensive In-
come as other income and expenses. Bilia has unlisted shares
and tenant-owner agreements that belong to this category of
financial assets.
Derivative instruments
Financial derivatives are held only to manage the financial
risks to which Bilia is exposed, see Note 27 Financial risks and risk management. Bilia has financial derivative instruments in the form of currency hedging instruments (currency swaps) which are used to secure future currency flows. All the deriva-tives are measured at their respective fair value through the Statement of Income and Other Comprehensive Income. The derivatives that have positive values are recognised as assets in the Statement of Financial Position. Changes in the value of currency swaps are recognised in financial income or financial expenses. Hedge accounting is not applied.
Impairment of financial assetsFor all interest-bearing financial instruments, including ac-counts receivable and lease receivables, a credit risk reserve is booked, and this is based on the future expected losses applicable to the individual assets. For accounts receivable, the credit risk reserve is calculated based on the asset’s antici-pated loss over the total life of the asset.
Other financial liabilitiesLoans, including debenture loans, and other financial liabili-ties, for example trade payables, belong to this category. The liabilities are measured at amortised cost.
In March and December 2016 and January 2017 Bilia issued unsecured bonds worth SEK 500 M, repectively SEK 250 M and
SEK 250 M within a total framework of SEK 1,000 M. The bond
issue matures in five years (March 2021) and carries a vari-
able interest rate of STIBOR (3 months) plus 220 basis points
respectively 150 basis points and 140 basis points.
In Octobre 2018 Bilia repurchased SEK 500 M of the out-
standing unsecured bonds due in March 2021 to a price of
104 per cent. At the same time Bilia issued a new unsecured
bond worth SEK 800 M. The new bond issue carries a variable
interest rate of STIBOR (3 months) plus 140 basis points and
matures in Octobre 2023.
The total new outstanding amount after the bond issue is
SEK 1,300 M.
Information on how fair value has been determined for the
financial instruments that are measured at fair value in the
Statement of Financial Position is furnished below. Fair value is
determined on the basis of the following three levels:
Level 1: according to prices quoted on an active market for the
same instrument.
Level 2: based on directly or indirectly observable market
inputs other than those included in level 1.
Level 3: based on inputs that are not observable on the market.
Level 2 2018 2017
Financial assets measured at fair value through profit or loss/Currency swaps 4 0
Financial liabilities measured at fair value through profit or loss/Currency swaps 1 1
Note 26 cont’d.
BILIA ANNUAL REPORT 2018 81
Financial information Group
2018
2017
Note Carrying amount Fair value
Carrying amount Fair value
Assets measured at fair value through profit and loss
Currency swaps 18 4 4 0 0
Interest-bearing assets measured at amortised cost
Long-term receivables, interest-bearing 18 — — 0 0
Trade receivables 27 872 872 1,048 1,048
Other receivables 18 175 175 134 134
Cash and cash equivalents 32 314 314 202 202
Financial investments
Shares and interests 17 2 — 1 —
Housing cooperative units 17 6 6 6 6
Debts measured at fair value through profit and loss
Currency swaps 24 1 1 1 1
Debts measured at amortised lost
Bond issue 21 1,281 1,281 1,006 1,006
Non-current interest-bearing liabilities 21 123 123 81 81
Current interest-bearing liabilities 21 683 683 586 586
Finance lease liabilities 21 252 252 225 225
Provision/put option 23 145 145 130 130
Trade payables 1,882 1,882 1,582 1,582
Accrued interest 25 2 2 2 2
Fair value and carrying amount for financial instruments and categorisation are presented below:
Fair Value MeasurementThe following summarises the most important methods and
a ssumptions that have been used to establish the fair value of
the financial instruments in the above table.
Financial instruments measured at fair value
Currency swaps
For currency swaps, the fair value is determined on the basis of
market rates. If such rates are not available, the fair value is cal-
culated by discounting the difference between the contracted
forward rate and the forward rate that can be obtained on the
balance sheet date for the remaining contract period.
Financial investments
Bilia’s holdings in this category consist of unlisted shareholdings,
housing cooperative units and deposits. Since fair value cannot be
calculated with sufficient reliability for unlisted shareholdings and
housing cooperative units, these assets are measured at cost.
Financial instruments that are not measured at fair value
Interest-bearing liabilities and finance lease liabilities
Fair value is largely equivalent to carrying amount, since the
interest rate on outstanding liabilities is variable.
Hire-purchase receivables
Fair value essentially corresponds to carrying amount, since
the interest rate on outstanding receivables is variable.
Trade receivables and trade payables
In the case of trade receivables and trade payables with a
remaining life of less than one year, the carrying amount is
deemed to reflect fair value. The carrying amount is deemed
to reflect fair value in the case of trade receivables and trade
payables with a life of more than one year as well, since vari-
able interest is charged on the outstanding receivable/liability.
➤ Accounting principleBilia applies IFRS 7 Financial Instruments: Disclosures and
IFRS 13 Fair Value Measurement in accounting for financial
risks and risk management.
GeneralThe main purpose of Bilia AB with subsidiaries is to sell new
and used cars, and in conjunction with this also supply work-
shop services, spare parts, accessories and fuel.
The financing operation in Bilia encompasses the following:
• financing of the Group with loans and other operating liabilities
• analysis, measurement and management of currency risks, in-
terest rate risks and operating risks in order to reduce these risks
• administration of Group accounts and internal bank function
in Bilia
• oversight of credit granting by the subsidiaries to ensure
compliance with an appropriate credit policy
• Bilia’s payment procedures and everything included in the
concept of cash management
• control, monitoring and reporting of the outcome of Bilia’s
financing operation based on guidelines issued by the Board
of Directors.
Goals of the financing operationThe goals of Bilia’s financing operation are to:
• ensure that the Group has access to the requisite loan
financing
Note 27 Financial risks and risk management
82 BILIA ANNUAL REPORT 2018
Financial information Group
Note 27 cont’d.
• secure the best possible terms for lending and investing• ensure that credit risks, interest rate risks, liquidity risks,
currency risks and operating risks are always kept within the limits stipulated in Bilia’s financing policy.
Organisation and division of responsibilitiesThe Parent Company Bilia AB
The Managing Director of Bilia AB is responsible for all fi-nancial activities in the Group and shall ensure that they are conducted in accordance with the finance policy adopted by the Board of Directors. The CFO is the head of the Finance Department and is responsible for ensuring that financing activities throughout Bilia are conducted in accordance with Bilia’s policies, rules and instructions.
The Treasurer is in charge of the day-to-day activities of the Parent Company’s Finance Department, which also has an internal bank function that is intended to serve all Group companies.
The overall objective of the finance function is to provide cost-effective financing and to minimise the negative effects of currency fluctuations on the Group’s earnings.
All investments of temporary excess liquidity must have high liquidity and low credit risk. Short-term investments may be made in instruments and with counterparties included in a list issued by the Managing Director of Bilia AB. The list is prepared to meet the following requirements:• Short-term investments may be made in Swedish govern-
ment securities with high liquidity with no limit on amounts.• Short-term investments may be made in Swedish banks, no
more than SEK 300 M per bank, with a commitment period
of no more than 90 days. The bank must have a rating of at
least A2 according to Moody’s rating model or Standard &
Poor’s equivalent rating of A.
• Short-term investments, in commercial paper or deposits
in accounts, of no more than SEK 200 M and with a com-
mitment period of no more than 30 days may be made in
Volvofinans Bank AB.
• Short-term investments may be made in securities assigned a
rating of K1 by Nordisk Rating and with a remaining maturity
of no more than 90 days, to an amount of no more than SEK
50 M per issuer.
Subsidiaries
The managing director of each subsidiary is responsible for
ensuring that the granting of credit by the company takes
place in accordance with a credit policy adopted by the
company’s board of directors and that financing activities are
otherwise conducted in accordance with the guidelines set
forth in special instructions from Bilia AB.
Financial receivablesThe Group’s do not have any non-current financial assets.
The Group’s current financial assets consist for the most
part of SEK 872 M (1048) in trade receivables and SEK 42 M
(27) in short-term investments. The average credit period for trade receivables is 22 days (21).
Capital managementThe Group’s equity, which is defined as total reported equity, amounted at year-end to SEK 2,915 M (2,620). Return on equity
amounted to 26.5 per cent (27.0).
The 2018 Annual General Meeting gave the Board of Directors
a mandate to resolve to acquire Bilia shares equivalent to no
more than 10 per cent of the total number of shares.
According to Bilia’s finance policy, one of the most important
goals is to ensure that the Group has access to the requisite
loan financing.
Bilia’s dividend policy prescribes that at least 50 per cent of the
net profit for the year be distributed to the shareholders. In addi-
tion to cash dividends, Bilia has made extra distributions in kind
on two occasions: the spin-offs of Kommersiella Fordon (KFAB) in
2003 and Catena (property portfolio) in 2006.
There has been no change in the Group’s principles for capital
management during the year.
Financing agreementsFor 2018, Bilia’s lenders require that the ratio of EBITDAJ to net
interest should be at least 3.5 times, the ratio of net debt to
EBITDAJ should not exceed 3.5 times, and bank loans in rela-
tion to the sum of fixtures and fittings, interests in associated
companies, inventories and net trade receivables should not
exceed 50 per cent. In 2018 the ratio of EBITDAJ to net interest
was 23.39 times, the ratio of interest-bearing net debt to EBITDAJ
was 1.27 times, and the ratio of bank loans to the sum of fixtures
and fittings, interests in associated companies, inventories and
net trade receivables was –1 per cent. The lender is contractually
entitled to cancel the lease for renegotiation or termination if the
above requirements are not met.
Financial risks and risk limitation
Bilia is exposed through its business operations to various kinds
of financial risks.
By “financial risks” is meant fluctuations in Bilia’s earnings and
cash flow as a result of changes in exchange rates, interest rates,
refinancing risks and credit risks. Bilia’s finance policy for manag-
ing financial risks has been formulated by the Board of Directors
and comprises a framework of guidelines and rules in the form of
risk mandates and limits for the financing activities.
The various financial risks to which Bilia is exposed are
described below. These risks are managed by Bilia AB’s internal
bank at the head office in Gothenburg.
Liquidity riskBy liquidity risk (also called financing risk) is meant the risk that
financing cannot be obtained at all, or only at excessively in-
flated costs, due to disruptions in the financial system. At least
50 per cent of the lines of credit shall have a remaining matu-
rity of at least one year. Contracts have been signed for lines
of credit totalling SEK 1,500 M (1,500). The lines of credit were
extended in August 2015 up until July 2020, and SEK 1,500
M (1,500) , net, was unutilised at year-end. Bilia’s financial li-
abilities amounted to SEK 4,241 M (3,475) at year-end, and the
maturity structure of the debt is shown in the table “Maturity
structure– Financial liabilities”.
Credit facilities and loans CurrencyNominalamount Total amount
Utilised/credited (—) Available
Maturity SEK 1,500 1,500 –37 1,537
Total 1,500 –37 1,537
Available cash and cash equivalents 314
Liquidity reserve 1,851
BILIA ANNUAL REPORT 2018 83
Financial information Group
Market riskMarket risk is the risk that the fair value of, or future cash flows
from, a financial instrument will fluctuate due to changes in
market prices. Market risks are divided by IFRS into three types:
interest rate risk, currency risk and other price risks. The mar-
ket risks that affect the Group the most are interest rate risks
and currency risks.
Bilia’s goal is to manage and control market risks within
established parameters while simultaneously optimising the
result of the risk-taking within given limits. The parameters are
set for the purpose of ensuring that the market risks will, in
the short term (6–12 months), have only a marginal effect on Bilia’s earnings and position. In the longer term, however, last-ing changes in exchange rates and interest rates will have an impact on the consolidated profit.
Interest rate risk
Interest rate risk is the risk that the value of a financial instru-ment will vary due to changes in market rates. Interest rate risk can consist of change in fair value, known as price risk, and changes in cash flow, known as cash flow risk. A significant fac-tor influencing interest rate risk is the fixed interest rate period.
A short average fixed interest rate period in Bilia’s loan port-folio means that large interest rate changes affect earnings almost immediately.
A long fixed interest rate period, on the other hand, means that the financing cost may fall out of step with the general price and inflation trend and therefore deviate significantly
from the current cost of financing generally applicable in the sector. Bilia’s assets are primarily of a current nature. The goal of the finance policy is to minimise the effects of an interest rate change.
According to the finance policy, the goal is that at a net debt of less than SEK 500 M, the fixed interest rate period should be
0–6 months. If net debt exceeds SEK 500 M, the average fixed
interest rate period should be no more than 9 months.
At the balance sheet date, the Bilia had the following inter-
est rate profile on its financial instruments:
Carrying amounts 2018 2017
Variable interest rate
Financial assets 314 202
Financial liabilities 2,358 1,892
Sensitivity analysis
As of 31 December 2018, a general increase in the interest
rate by 1 percentage point is expected to reduce the Group’s
profit before tax by about SEK 16 M (reduction: 13).
Currency risk
Bilia is exposed to different types of currency risks. The
foremost exposure comes from currency risk fluctuations on
translation of the assets and liabilities of foreign subsidiaries to
the Parent Company’s functional currency, called translation
exposure.
Maturity structure – Financial liabilitiesThe following table shows the maturity structure of the financial liabilities on the balance sheet date, undiscounted cash flows.
2018 2017
LenderCur-rency
Totalamount
Within1 mth
1–3mths
3 mths–1 yr 1–5 yrs >5 yrs
Totalamount
Within1 mth
1–3mths
3 mths–1 yr 1–5 yrs >5 yrs
Bank overdraft facilities SEK 42 42 — — — — — — — — — —
Volvofinans Bank AB SEK 115 1 1 113 — — 138 1 1 136 — —
BMW Financial Services EUR 49 0 0 0 49 — 53 0 0 0 23 30
ING Bank EUR 3 0 0 0 1 2 23 0 0 0 11 12
Pauschal kredit EUR 10 10 — — — — — — — — — —
BMW Financial Services EUR 7 0 0 7 — — 7 0 0 7 — —
BMW Bank EUR 211 1 210 — — — 210 30 180 — — —
VR Bank EUR 2 0 0 0 2 — 2 2 — — — —
ING Bank EUR 21 0 0 0 10 11 3 0 1 2 — —
Nordea Finans NOK 283 283 — — — — 212 212 — — — —
BMW Bank EUR 11 11 — — — — 11 11 — — — —
VR Bank EUR — — — — — — 2 0 0 0 1 1
Volksbank Mittelhessen EUR 6 0 0 0 5 1 8 0 8 — — —
Volksbank Mittelhessen EUR 2 0 0 2 — — — — — — — —
Dexia EUR 17 0 0 0 2 15 — — — — — —
Dexia EUR 28 0 0 0 1 27 — — — — — —
Emprunt matériel Lib EUR 1 0 0 1 — — — — — — — —
Emprunt bat Lib EUR 2 0 1 1 — — — — — — — —
Emprunt avance impôt EUR 3 0 1 2 — — — — — — — —
Personnel fund SEK 5 — — 0 0 5 5 — — 0 0 5
Bond issue SEK 1,377 2 5 16 1,354 — 1,048 — 4 8 1,036 —
Derivatives 1 1 — — — — 1 1 — — — —
Trade payables 1,882 1,882 — — — — 1,582 1,582 — — — —
Finance lease liabilities SEK 258 25 3 67 163 — 230 79 15 52 84 —
Total 4,336 2,258 221 209 1,587 61 3,535 1,918 209 205 1,155 48
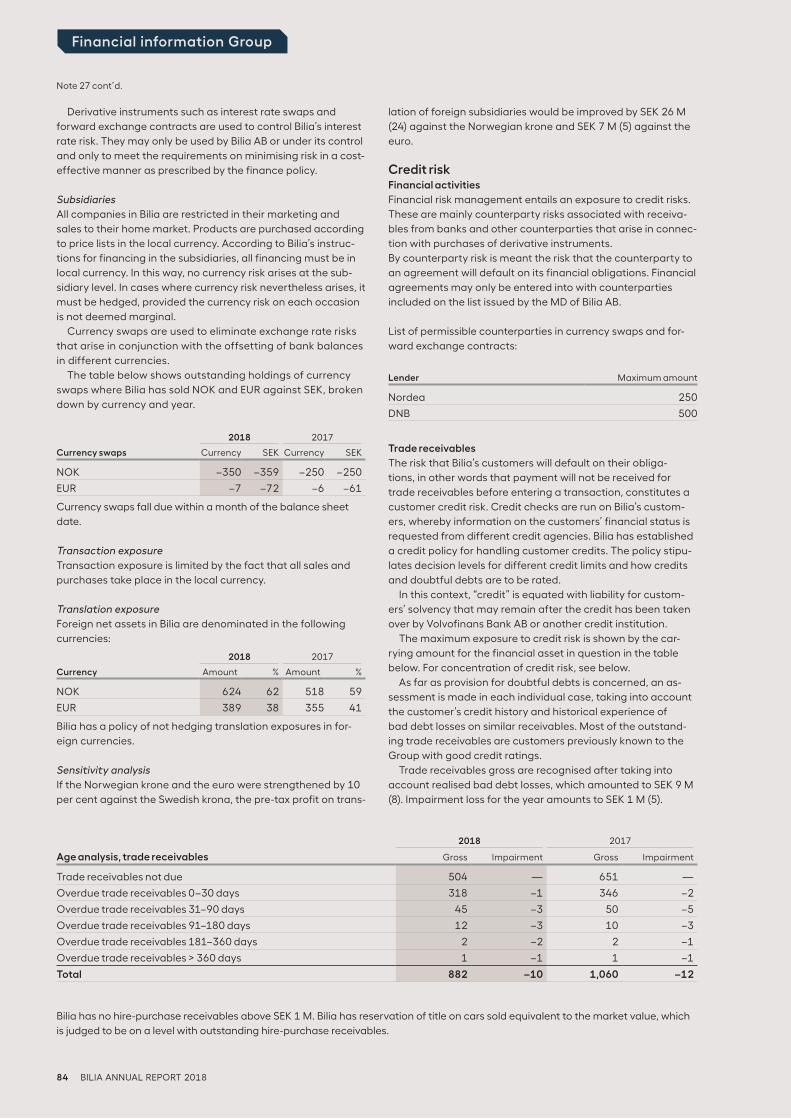
84 BILIA ANNUAL REPORT 2018
Financial information Group
Note 27 cont’d.
Derivative instruments such as interest rate swaps and forward exchange contracts are used to control Bilia’s interest rate risk. They may only be used by Bilia AB or under its control and only to meet the requirements on minimising risk in a cost-effective manner as prescribed by the finance policy.
Subsidiaries
All companies in Bilia are restricted in their marketing and sales to their home market. Products are purchased according to price lists in the local currency. According to Bilia’s instruc-tions for financing in the subsidiaries, all financing must be in local currency. In this way, no currency risk arises at the sub-sidiary level. In cases where currency risk nevertheless arises, it must be hedged, provided the currency risk on each occasion is not deemed marginal.
Currency swaps are used to eliminate exchange rate risks that arise in conjunction with the offsetting of bank balances in different currencies.
The table below shows outstanding holdings of currency swaps where Bilia has sold NOK and EUR against SEK, broken down by currency and year.
2018 2017
Currency swaps Currency SEK Currency SEK
NOK –350 –359 –250 –250
EUR –7 –72 –6 –61
Currency swaps fall due within a month of the balance sheet
date.
Transaction exposure
Transaction exposure is limited by the fact that all sales and
purchases take place in the local currency.
Translation exposure
Foreign net assets in Bilia are denominated in the following
currencies:
2018 2017
Currency Amount % Amount %
NOK 624 62 518 59
EUR 389 38 355 41
Bilia has a policy of not hedging translation exposures in for-
eign currencies.
Sensitivity analysis
If the Norwegian krone and the euro were strengthened by 10
per cent against the Swedish krona, the pre-tax profit on trans-
lation of foreign subsidiaries would be improved by SEK 26 M
(24) against the Norwegian krone and SEK 7 M (5) against the
euro.
Credit riskFinancial activities
Financial risk management entails an exposure to credit risks.
These are mainly counterparty risks associated with receiva-
bles from banks and other counterparties that arise in connec-
tion with purchases of derivative instruments.
By counterparty risk is meant the risk that the counterparty to
an agreement will default on its financial obligations. Financial
agreements may only be entered into with counterparties
included on the list issued by the MD of Bilia AB.
List of permissible counterparties in currency swaps and for-
ward exchange contracts:
Lender Maximum amount
Nordea 250
DNB 500
Trade receivables
The risk that Bilia’s customers will default on their obliga-
tions, in other words that payment will not be received for
trade receivables before entering a transaction, constitutes a
customer credit risk. Credit checks are run on Bilia’s custom-
ers, whereby information on the customers’ financial status is
requested from different credit agencies. Bilia has established
a credit policy for handling customer credits. The policy stipu-
lates decision levels for different credit limits and how credits
and doubtful debts are to be rated.
In this context, “credit” is equated with liability for custom-
ers’ solvency that may remain after the credit has been taken
over by Volvofinans Bank AB or another credit institution.
The maximum exposure to credit risk is shown by the car-
rying amount for the financial asset in question in the table
below. For concentration of credit risk, see below.
As far as provision for doubtful debts is concerned, an as-
sessment is made in each individual case, taking into account
the customer’s credit history and historical experience of
bad debt losses on similar receivables. Most of the outstand-
ing trade receivables are customers previously known to the
Group with good credit ratings.
Trade receivables gross are recognised after taking into
account realised bad debt losses, which amounted to SEK 9 M
(8). Impairment loss for the year amounts to SEK 1 M (5).
Bilia has no hire-purchase receivables above SEK 1 M. Bilia has reservation of title on cars sold equivalent to the market value, which
is judged to be on a level with outstanding hire- purchase receivables.
2018 2017
Age analysis, trade receivables Gross Impairment Gross Impairment
Trade receivables not due 504 — 651 —
Overdue trade receivables 0–30 days 318 –1 346 –2
Overdue trade receivables 31–90 days 45 –3 50 –5
Overdue trade receivables 91–180 days 12 –3 10 –3
Overdue trade receivables 181–360 days 2 –2 2 –1
Overdue trade receivables > 360 days 1 –1 1 –1
Total 882 –10 1,060 –12
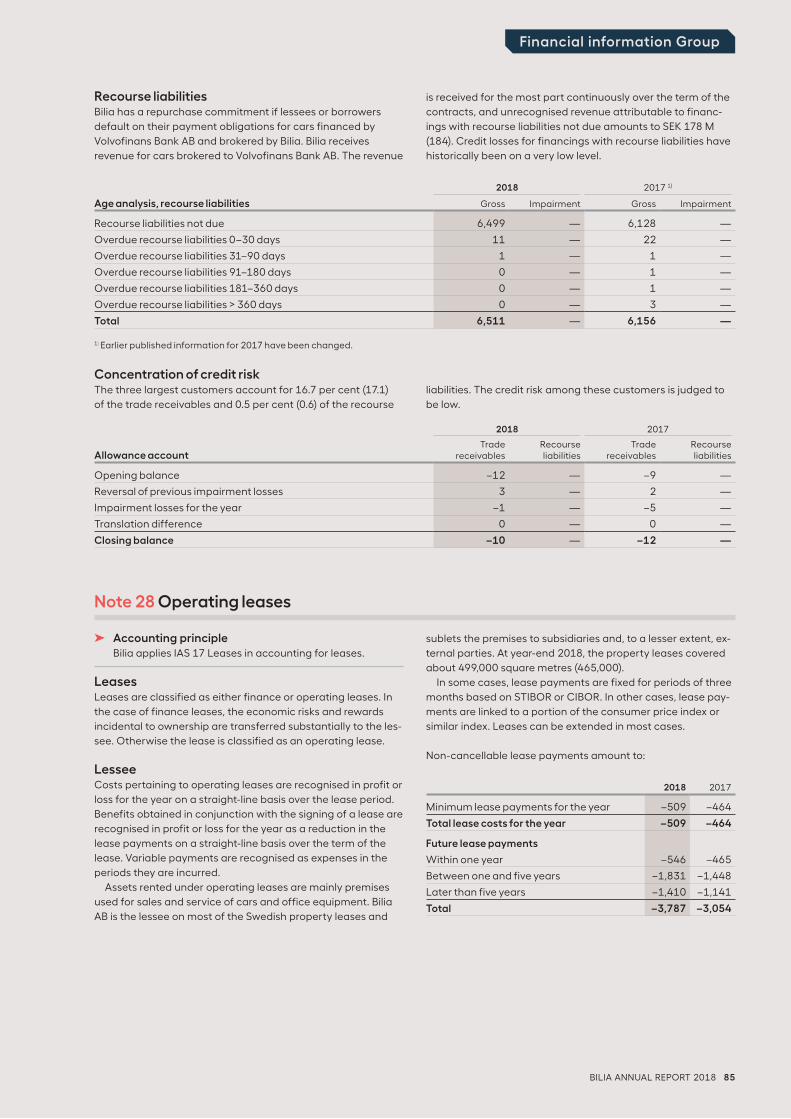
BILIA ANNUAL REPORT 2018 85
Financial information Group
Concentration of credit riskThe three largest customers account for 16.7 per cent (17.1) of the trade receivables and 0.5 per cent (0.6) of the recourse
liabilities. The credit risk among these customers is judged to be low.
Recourse liabilitiesBilia has a repurchase commitment if lessees or borrowers default on their payment obligations for cars financed by Volvo finans Bank AB and brokered by Bilia. Bilia receives revenue for cars brokered to Volvofinans Bank AB. The revenue
is received for the most part continuously over the term of the contracts, and unrecognised revenue attributable to financ-ings with recourse liabilities not due amounts to SEK 178 M (184). Credit losses for financings with recourse liabilities have
historically been on a very low level.
2018 2017 1)
Age analysis, recourse liabilities Gross Impairment Gross Impairment
Recourse liabilities not due 6,499 — 6,128 —
Overdue recourse liabilities 0–30 days 11 — 22 —
Overdue recourse liabilities 31–90 days 1 — 1 —
Overdue recourse liabilities 91–180 days 0 — 1 —
Overdue recourse liabilities 181–360 days 0 — 1 —
Overdue recourse liabilities > 360 days 0 — 3 —
Total 6,511 — 6,156 —
1) Earlier published information for 2017 have been changed.
2018 2017
Allowance accountTrade
receivablesRecourseliabilities
Tradereceivables
Recourseliabilities
Opening balance –12 — –9 —
Reversal of previous impairment losses 3 — 2 —
Impairment losses for the year –1 — –5 —
Translation difference 0 — 0 —
Closing balance –10 — –12 —
Note 28 Operating leases
➤ Accounting principleBilia applies IAS 17 Leases in accounting for leases.
LeasesLeases are classified as either finance or operating leases. In
the case of finance leases, the economic risks and rewards
incidental to ownership are transferred substantially to the les-
see. Otherwise the lease is classified as an operating lease.
LesseeCosts pertaining to operating leases are recognised in profit or
loss for the year on a straight-line basis over the lease period.
Benefits obtained in conjunction with the signing of a lease are
recognised in profit or loss for the year as a reduction in the
lease payments on a straight-line basis over the term of the
lease. Variable payments are recognised as expenses in the
periods they are incurred.
Assets rented under operating leases are mainly premises
used for sales and service of cars and office equipment. Bilia
AB is the lessee on most of the Swedish property leases and
sublets the premises to subsidiaries and, to a lesser extent, ex-
ternal parties. At year-end 2018, the property leases covered
about 499,000 square metres (465,000).
In some cases, lease payments are fixed for periods of three
months based on STIBOR or CIBOR. In other cases, lease pay-
ments are linked to a portion of the consumer price index or
similar index. Leases can be extended in most cases.
Non-cancellable lease payments amount to:
2018 2017
Minimum lease payments for the year –509 –464
Total lease costs for the year –509 –464
Future lease payments
Within one year –546 –465
Between one and five years –1,831 –1,448
Later than five years –1,410 –1,141
Total –3,787 –3,054
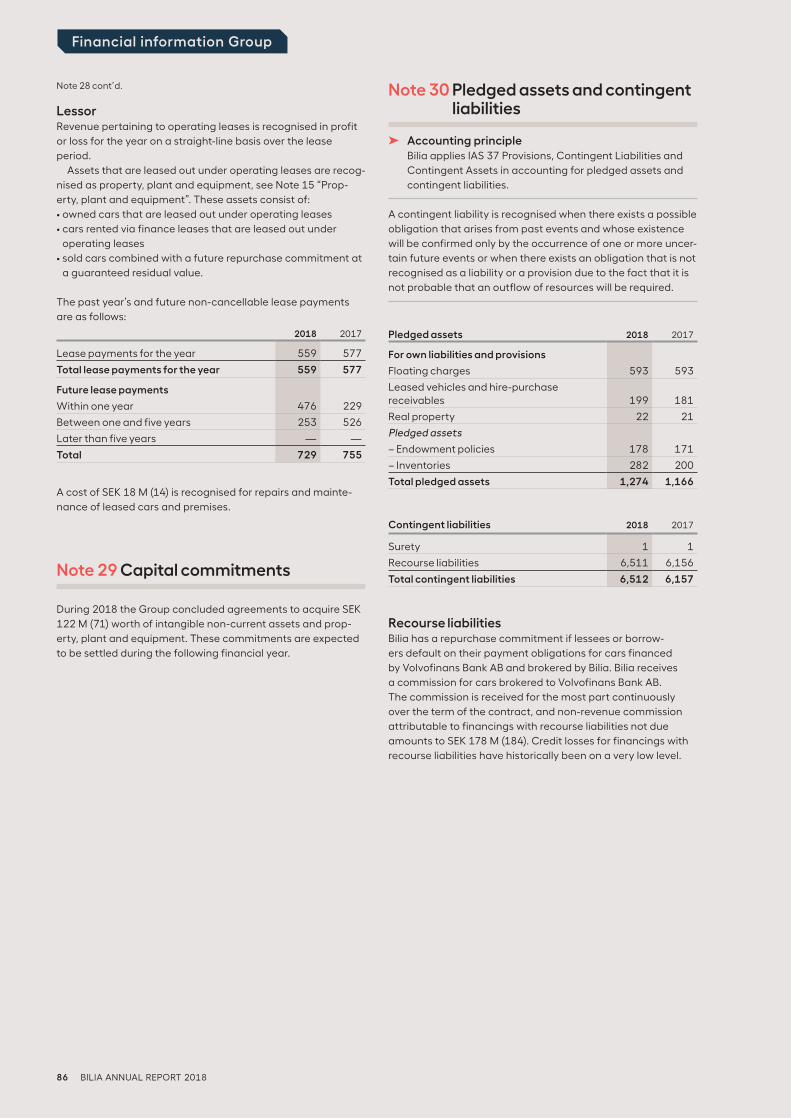
86 BILIA ANNUAL REPORT 2018
Financial information Group
Note 28 cont’d.
During 2018 the Group concluded agreements to acquire SEK
122 M (71) worth of intangible non-current assets and prop-
erty, plant and equipment. These commitments are expected
to be settled during the following financial year.
Note 29 Capital commitments
Note 30 Pledged assets and contingent liabilities
➤ Accounting principleBilia applies IAS 37 Provisions, Contingent Liabilities and
Contingent Assets in accounting for pledged assets and
contingent liabilities.
A contingent liability is recognised when there exists a possible
obligation that arises from past events and whose existence
will be confirmed only by the occurrence of one or more uncer-
tain future events or when there exists an obligation that is not
recognised as a liability or a provision due to the fact that it is
not probable that an outflow of resources will be required.
Pledged assets 2018 2017
For own liabilities and provisions
Floating charges 593 593
Leased vehicles and hire-purchase receivables 199 181
Real property 22 21
Pledged assets
– Endowment policies 178 171
– Inventories 282 200
Total pledged assets 1,274 1,166
Contingent liabilities 2018 2017
Surety 1 1
Recourse liabilities 6,511 6,156
Total contingent liabilities 6,512 6,157
Recourse liabilitiesBilia has a repurchase commitment if lessees or borrow-
ers default on their payment obligations for cars financed
by Volvofinans Bank AB and brokered by Bilia. Bilia receives
a commission for cars brokered to Volvofinans Bank AB.
The commission is received for the most part continuously
over the term of the contract, and non-revenue commission
attributable to financings with recourse liabilities not due
amounts to SEK 178 M (184). Credit losses for financings with
recourse liabilities have historically been on a very low level.
LessorRevenue pertaining to operating leases is recognised in profit
or loss for the year on a straight-line basis over the lease
period.
Assets that are leased out under operating leases are recog-
nised as property, plant and equipment, see Note 15 “Prop-
erty, plant and equipment”. These assets consist of:
• owned cars that are leased out under operating leases
• cars rented via finance leases that are leased out under
operating leases
• sold cars combined with a future repurchase commitment at
a guaranteed residual value.
The past year’s and future non-cancellable lease payments
are as follows:
2018 2017
Lease payments for the year 559 577
Total lease payments for the year 559 577
Future lease payments
Within one year 476 229
Between one and five years 253 526
Later than five years — —
Total 729 755
A cost of SEK 18 M (14) is recognised for repairs and mainte-
nance of leased cars and premises.
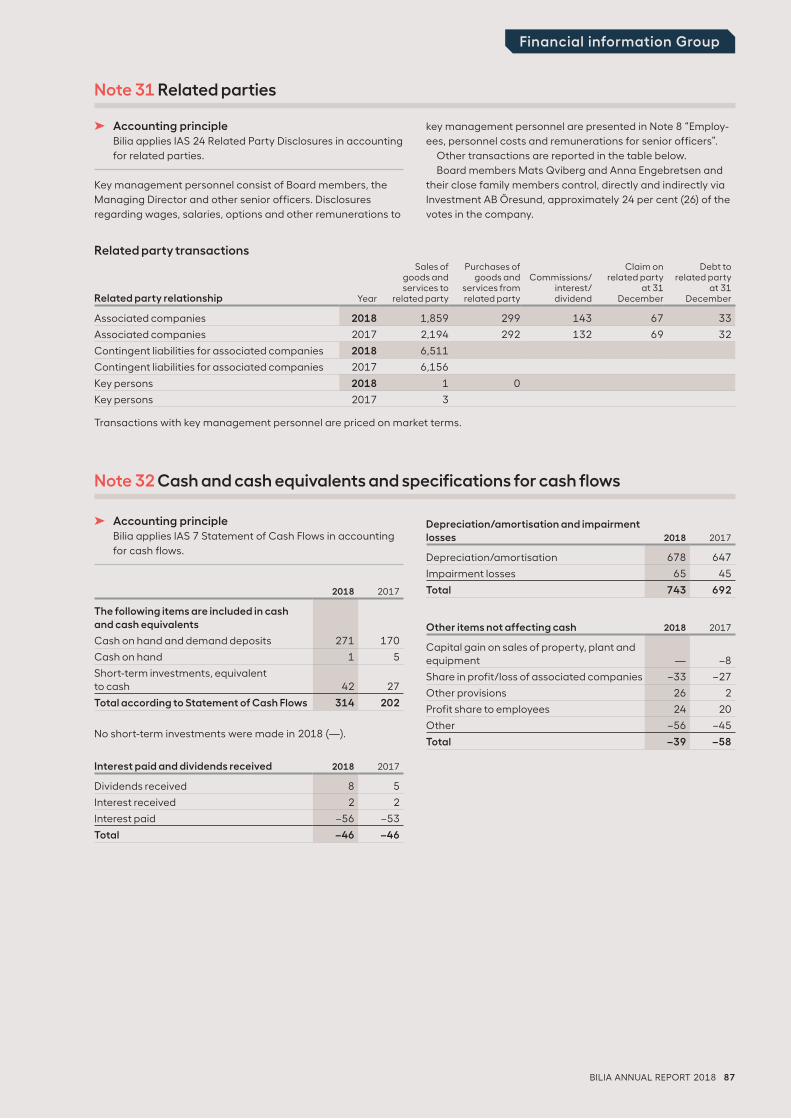
BILIA ANNUAL REPORT 2018 87
Financial information Group
Note 32 Cash and cash equivalents and specifications for cash flows
2018 2017
The following items are included in cash and cash equivalents
Cash on hand and demand deposits 271 170
Cash on hand 1 5
Short-term investments, equivalent to cash 42 27
Total according to Statement of Cash Flows 314 202
No short-term investments were made in 2018 (—).
➤ Accounting principleBilia applies IAS 7 Statement of Cash Flows in accounting for cash flows.
Key management personnel consist of Board members, the Managing Director and other senior officers. Disclosures regarding wages, salaries, options and other remunerations to
key management personnel are presented in Note 8 “Employ-ees, personnel costs and remunerations for senior officers”.
Other transactions are reported in the table below.Board members Mats Qviberg and Anna Engebretsen and
their close family members control, directly and indirectly via Investment AB Öresund, approximately 24 per cent (26) of the votes in the company.
Transactions with key management personnel are priced on market terms.
Note 31 Related parties
Related party transactions
Related party relationship Year
Sales ofgoods andservices to
related party
Purchases ofgoods and
services from related party
Commissions/interest/dividend
Claim onrelated party
at 31December
Debt torelated party
at 31December
Associated companies 2018 1,859 299 143 67 33
Associated companies 2017 2,194 292 132 69 32
Contingent liabilities for associated companies 2018 6,511
Contingent liabilities for associated companies 2017 6,156
Key persons 2018 1 0
Key persons 2017 3
➤ Accounting principleBilia applies IAS 24 Related Party Disclosures in accounting
for related parties.
Interest paid and dividends received 2018 2017
Dividends received 8 5
Interest received 2 2
Interest paid –56 –53
Total –46 –46
Depreciation/amortisation and impairment losses 2018 2017
Depreciation/amortisation 678 647
Impairment losses 65 45
Total 743 692
Other items not affecting cash 2018 2017
Capital gain on sales of property, plant and equipment — –8
Share in profit/loss of associated companies –33 –27
Other provisions 26 2
Profit share to employees 24 20
Other –56 –45
Total –39 –58
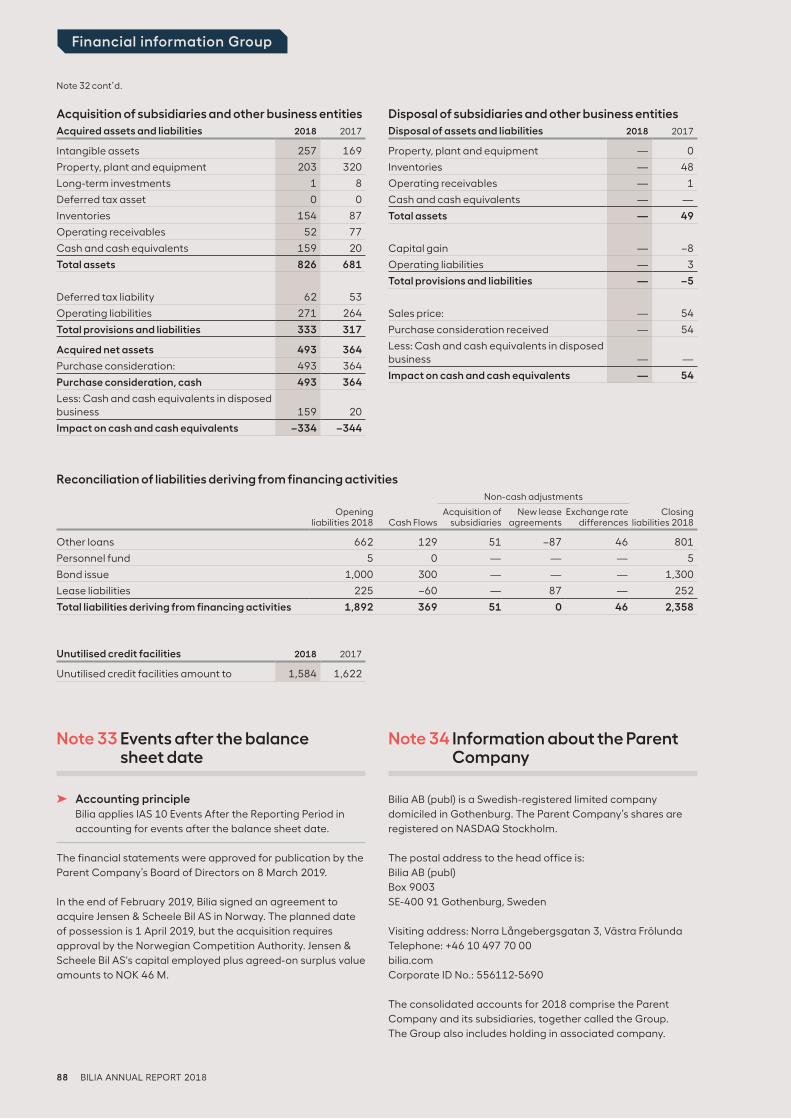
88 BILIA ANNUAL REPORT 2018
Financial information Group
Note 32 cont’d.
Acquisition of subsidiaries and other business entities
Acquired assets and liabilities 2018 2017
Intangible assets 257 169
Property, plant and equipment 203 320
Long-term investments 1 8
Deferred tax asset 0 0
Inventories 154 87
Operating receivables 52 77
Cash and cash equivalents 159 20
Total assets 826 681
Deferred tax liability 62 53
Operating liabilities 271 264
Total provisions and liabilities 333 317
Acquired net assets 493 364
Purchase consideration: 493 364
Purchase consideration, cash 493 364
Less: Cash and cash equivalents in disposed business 159 20
Impact on cash and cash equivalents –334 –344
Disposal of subsidiaries and other business entities
Disposal of assets and liabilities 2018 2017
Property, plant and equipment — 0
Inventories — 48
Operating receivables — 1
Cash and cash equivalents — —
Total assets — 49
Capital gain — –8
Operating liabilities — 3
Total provisions and liabilities — –5
Sales price: — 54
Purchase consideration received — 54
Less: Cash and cash equivalents in disposed business — —
Impact on cash and cash equivalents — 54
Unutilised credit facilities 2018 2017
Unutilised credit facilities amount to 1,584 1,622
Reconciliation of liabilities deriving from financing activities
Non-cash adjustments
Opening liabilities 2018 Cash Flows
Acquisition of subsidiaries
New lease agreements
Exchange rate differences
Closing liabilities 2018
Other loans 662 129 51 –87 46 801
Personnel fund 5 0 — — — 5
Bond issue 1,000 300 — — — 1,300
Lease liabilities 225 –60 — 87 — 252
Total liabilities deriving from financing activities 1,892 369 51 0 46 2,358
Note 34 Information about the Parent Company
Bilia AB (publ) is a Swedish-registered limited company
domiciled in Gothenburg. The Parent Company’s shares are
registered on NASDAQ Stockholm.
The postal address to the head office is:
Bilia AB (publ)
Box 9003
SE-400 91 Gothenburg, Sweden
Visiting address: Norra Långebergsgatan 3, Västra Frölunda
Telephone: +46 10 497 70 00
bilia.com
Corporate ID No.: 556112-5690
The consolidated accounts for 2018 comprise the Parent
Company and its subsidiaries, together called the Group.
The Group also includes holding in associated company.
Note 33 Events after the balance sheet date
➤ Accounting principleBilia applies IAS 10 Events After the Reporting Period in
accounting for events after the balance sheet date.
The financial statements were approved for publication by the
Parent Company’s Board of Directors on 8 March 2019.
In the end of February 2019, Bilia signed an agreement to
acquire Jensen & Scheele Bil AS in Norway. The planned date
of possession is 1 April 2019, but the acquisition requires
approval by the Norwegian Competition Authority. Jensen &
Scheele Bil AS's capital employed plus agreed-on surplus value
amounts to NOK 46 M.
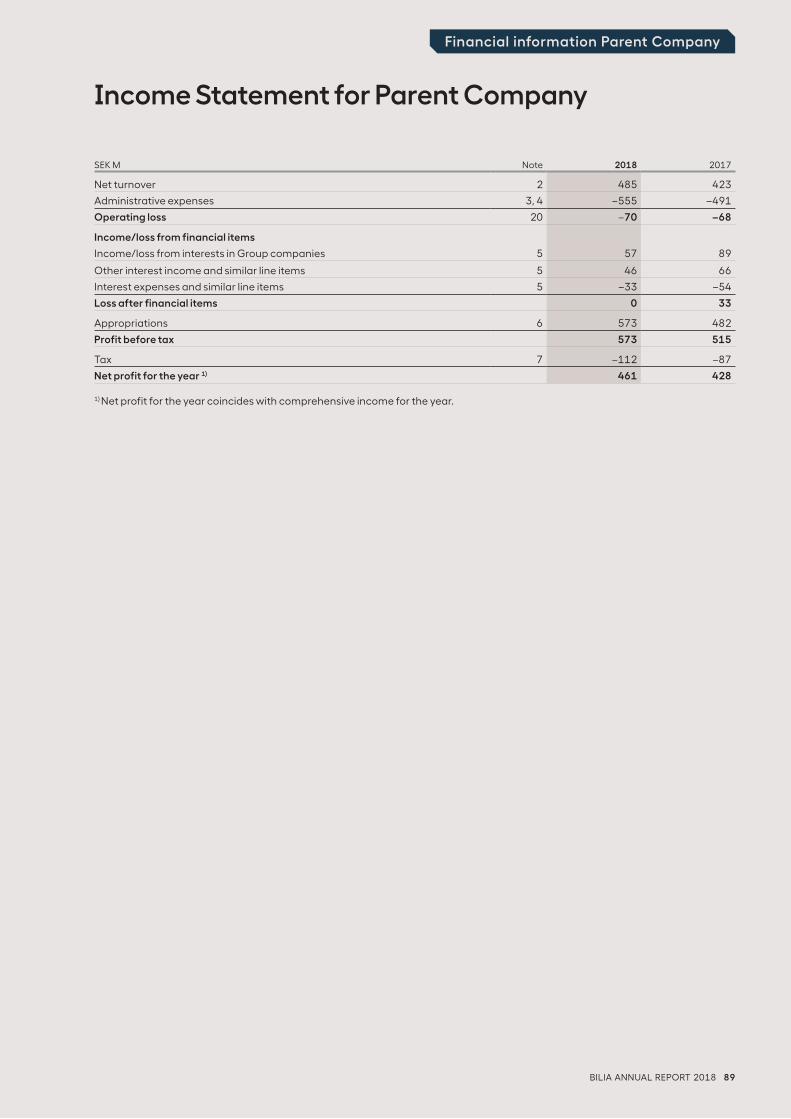
BILIA ANNUAL REPORT 2018 89
Financial information Parent Company
Income Statement for Parent Company
SEK M Note 2018 2017
Net turnover 2 485 423
Administrative expenses 3, 4 –555 –491
Operating loss 20 –70 –68
Income/loss from financial items
Income/loss from interests in Group companies 5 57 89
Other interest income and similar line items 5 46 66
Interest expenses and similar line items 5 –33 –54
Loss after financial items 0 33
Appropriations 6 573 482
Profit before tax 573 515
Tax 7 –112 –87
Net profit for the year 1) 461 428
1) Net profit for the year coincides with comprehensive income for the year.
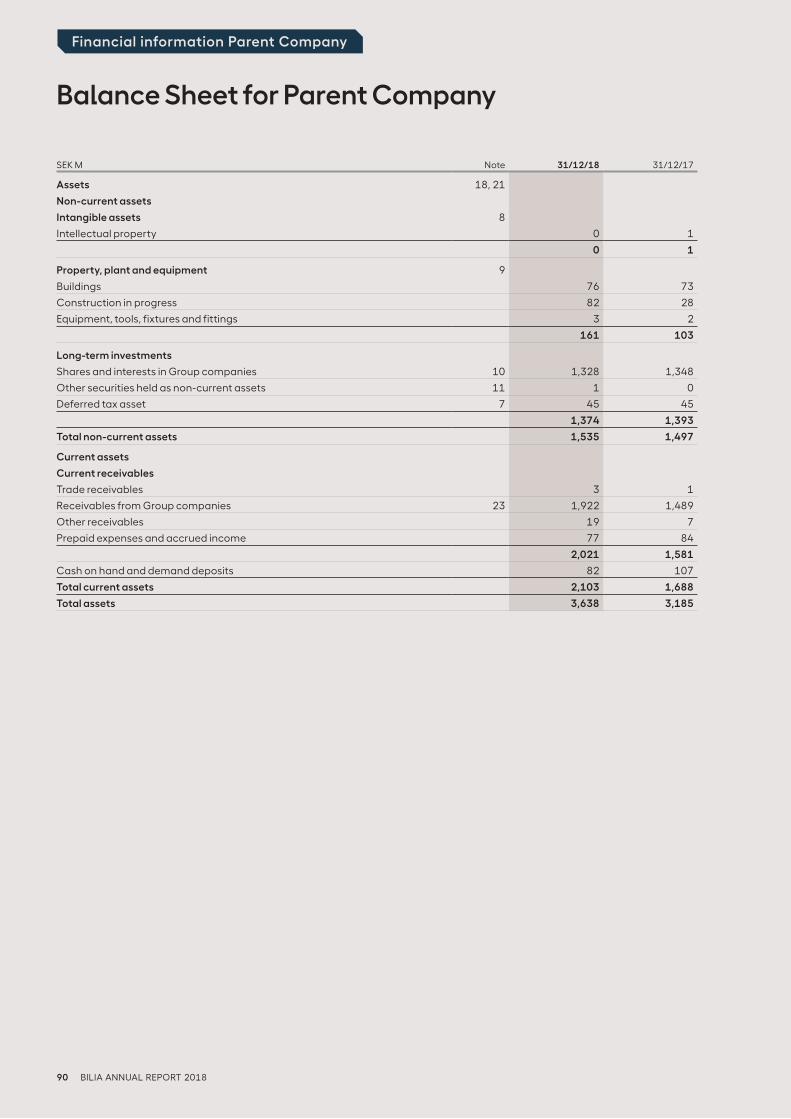
90 BILIA ANNUAL REPORT 2018
Financial information Parent Company
Balance Sheet for Parent Company
SEK M Note 31/12/18 31/12/17
Assets 18, 21
Non-current assets
Intangible assets 8
Intellectual property 0 1
0 1
Property, plant and equipment 9
Buildings 76 73
Construction in progress 82 28
Equipment, tools, fixtures and fittings 3 2
161 103
Long-term investments
Shares and interests in Group companies 10 1,328 1,348
Other securities held as non-current assets 11 1 0
Deferred tax asset 7 45 45
1,374 1,393
Total non-current assets 1,535 1,497
Current assets
Current receivables
Trade receivables 3 1
Receivables from Group companies 23 1,922 1,489
Other receivables 19 7
Prepaid expenses and accrued income 77 84
2,021 1,581
Cash on hand and demand deposits 82 107
Total current assets 2,103 1,688
Total assets 3,638 3,185
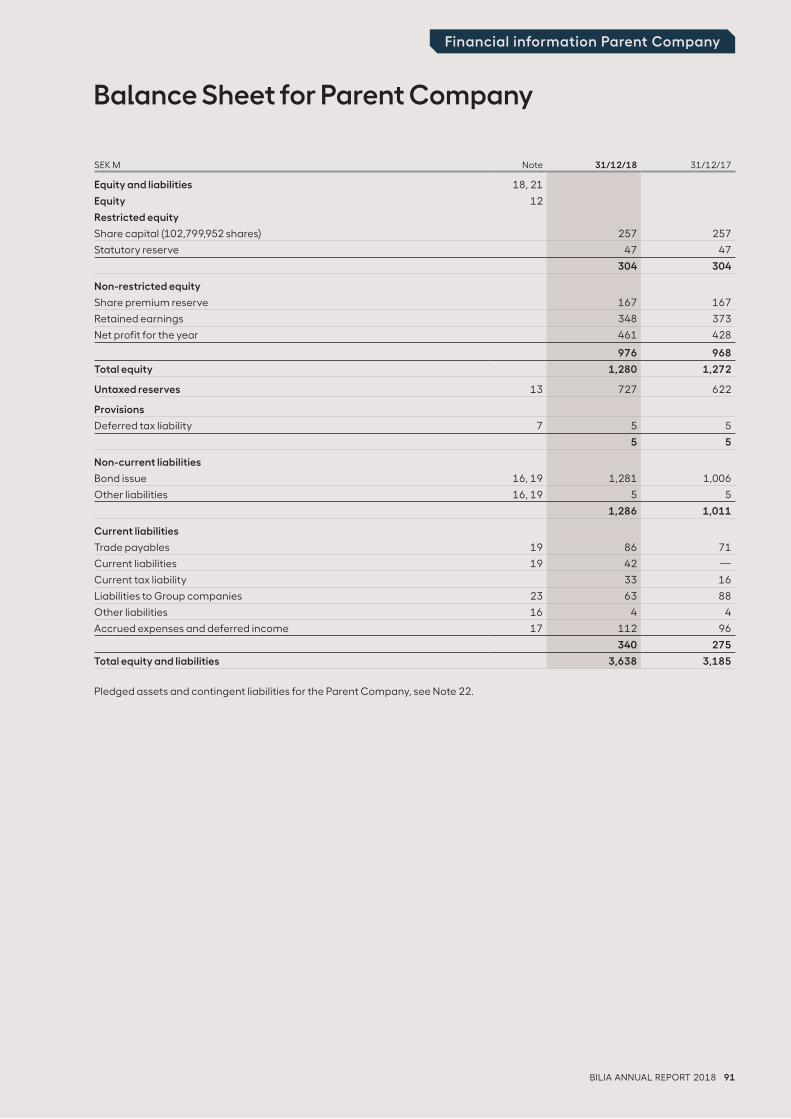
BILIA ANNUAL REPORT 2018 91
Financial information Parent Company
Balance Sheet for Parent Company
SEK M Note 31/12/18 31/12/17
Equity and liabilities 18, 21
Equity 12
Restricted equity
Share capital (102,799,952 shares) 257 257
Statutory reserve 47 47
304 304
Non-restricted equity
Share premium reserve 167 167
Retained earnings 348 373
Net profit for the year 461 428
976 968
Total equity 1,280 1,272
Untaxed reserves 13 727 622
Provisions
Deferred tax liability 7 5 5
5 5
Non-current liabilities
Bond issue 16, 19 1,281 1,006
Other liabilities 16, 19 5 5
1,286 1,011
Current liabilities
Trade payables 19 86 71
Current liabilities 19 42 —
Current tax liability 33 16
Liabilities to Group companies 23 63 88
Other liabilities 16 4 4
Accrued expenses and deferred income 17 112 96
340 275
Total equity and liabilities 3,638 3,185
Pledged assets and contingent liabilities for the Parent Company, see Note 22.
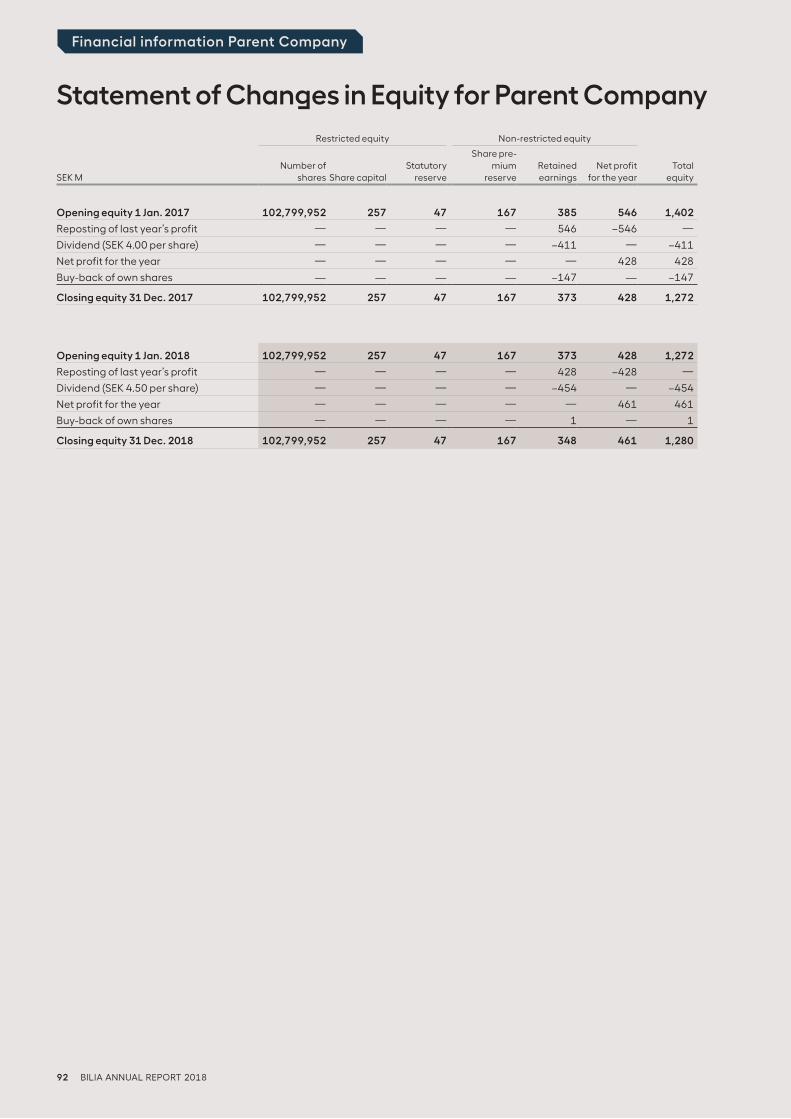
92 BILIA ANNUAL REPORT 2018
Financial information Parent Company
Statement of Changes in Equity for Parent Company
Restricted equity Non-restricted equity
SEK MNumber of
shares Share capitalStatutory
reserve
Share pre-mium
reserveRetainedearnings
Net profitfor the year
Totalequity
Opening equity 1 Jan. 2018 102,799,952 257 47 167 373 428 1,272
Reposting of last year’s profit — — — — 428 –428 —
Dividend (SEK 4.50 per share) — — — — –454 — –454
Net profit for the year — — — — — 461 461
Buy-back of own shares — — — — 1 — 1
Closing equity 31 Dec. 2018 102,799,952 257 47 167 348 461 1,280
Opening equity 1 Jan. 2017 102,799,952 257 47 167 385 546 1,402
Reposting of last year’s profit — — — — 546 –546 —
Dividend (SEK 4.00 per share) — — — — –411 — –411
Net profit for the year — — — — — 428 428
Buy-back of own shares — — — — –147 — –147
Closing equity 31 Dec. 2017 102,799,952 257 47 167 373 428 1,272
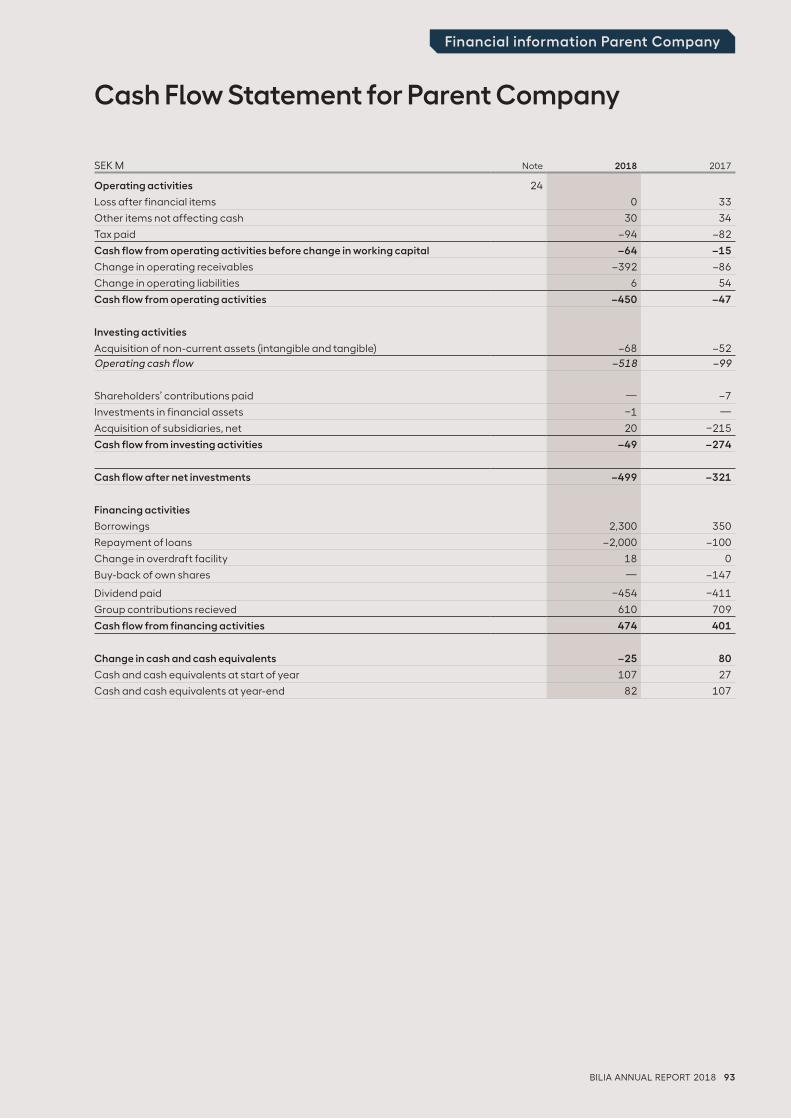
BILIA ANNUAL REPORT 2018 93
Financial information Parent Company
Cash Flow Statement for Parent Company
SEK M Note 2018 2017
Operating activities 24
Loss after financial items 0 33
Other items not affecting cash 30 34
Tax paid –94 –82
Cash flow from operating activities before change in working capital –64 –15
Change in operating receivables –392 –86
Change in operating liabilities 6 54
Cash flow from operating activities –450 –47
Investing activities
Acquisition of non-current assets (intangible and tangible) –68 –52
Operating cash flow –518 –99
Shareholders’ contributions paid — –7
Investments in financial assets –1 —
Acquisition of subsidiaries, net 20 –215
Cash flow from investing activities –49 –274
Cash flow after net investments –499 –321
Financing activities
Borrowings 2,300 350
Repayment of loans –2,000 –100
Change in overdraft facility 18 0
Buy-back of own shares — –147
Dividend paid –454 –411
Group contributions recieved 610 709
Cash flow from financing activities 474 401
Change in cash and cash equivalents –25 80
Cash and cash equivalents at start of year 107 27
Cash and cash equivalents at year-end 82 107
94 BILIA ANNUAL REPORT 2018
Financial information Parent Company
Notes to the Parent Company Financial Statements
Amounts in SEK M unless otherwise stated.
The Parent Company has prepared its annual accounts in ac-
cordance with the Swedish Annual Accounts Act (1995:1554)
and the Swedish Financial Reporting Board’s recommendation
RFR 2 Accounting for Legal Entities. The statements regarding
listed companies issued by the Swedish Financial Reporting
Board are also applied. Under RFR 2, the Parent Company
shall, in preparing the annual accounts for the legal entity,
apply all IFRS's and statements adopted by the EU whenever
this is possible within the framework of the Annual Accounts
Act and the Act on Safeguarding of Pension Obligations, while
taking account of the relationship between accounting and
taxation. The recommendation stipulates which exceptions
and additions shall be made to the IFRSs.
The Parent Company applies the same accounting principles
as the Group, except in the cases described below.
The Parent Company’s accounting principles have been
applied consistently to all periods presented in the Parent Com-
pany’s financial statements.
Presentation and formatsAn Income Statement is presented for the Parent Company
where a Consolidated Statement of Income and Other Com-
prehensive Income is presented for the Group. Furthermore,
the designations Balance Sheet and Cash Flow Statement are
used for the Parent Company for those statements which in
the Group are entitled Consolidated Statement of Financial
Position and Consolidated Statement of Cash Flows, respec-
tively. The Income Statement and the Balance Sheet for the
Parent Company follow the formats stipulated in the Annual
Accounts Act, while the Consolidated Statement of Income
and Other Comprehensive Income, the Consolidated State-
ment of Changes in Equity and the Consolidated Statement of
Cash Flows are based on IAS 1 Presentation of Financial State-
ments and IAS 7 Statement of Cash Flows. The differences in
the Parent Company’s Income Statement and Balance Sheet,
compared with the consolidated statements, consist mainly
of reporting of equity and the occurrence of provisions as a
separate heading in the Balance Sheet.
SubsidiariesInterests in subsidiaries are accounted for in the Parent Com-
pany according to the cost method. This means that transac-
tion costs are included in the carrying amount of holdings in
subsidiaries.
Contingent considerations are measured based on the
probability that the purchase consideration will be paid. Any
changes in the provision are added to the cost.
RevenueRental income
The Parent Company rents most of the properties in the Swed-
ish part of the Group. The rents are further invoiced to the sub-
sidiaries. Rental income and costs are recognised gross in the
Parent Company in the period to which they are attributable.
Anticipated dividends
Anticipated dividend from a subsidiary is recognised in cases
where the Parent Company alone is entitled to determine the
size of the dividend and the Parent Company has made a de-
cision on the size of the dividend before the Parent Company
has published its financial statements.
Financial guaranteesThe Parent Company’s financial guarantee contracts consist
in the main of guarantees for the benefit of Group companies.
Financial guarantees require the company to reimburse the
holder of a debt instrument for losses the latter incurs due
to the fact that a stipulated debtor fails to make payment
when due under the terms of the contract. In accounting for
financial guarantee contracts, the Parent Company applies
an exemption rule allowed by the Swedish Financial Reporting
Board, compared with the rules in IAS 39. The exemption rule
pertains to financial guarantee contracts issued for the benefit
of subsidiaries. The Parent Company recognises financial
guarantee contracts as provision in the Balance Sheet when
the company has an obligation and an outflow of resources
will probably be required to settle the obligation.
Leased assetsIn the Parent Company, all leases are accounted for in
accordance with the rules for operating leases.
TaxesIn the Parent Company, in contrast to the Group, untaxed
reserves are recognised without being divided into equity and
deferred tax liability. In a similar manner, in the Parent Com-
pany Income Statement, no reallocation of appropriations is
made to deferred tax expense.
Group contributions and shareholders’ contributionsShareholders’ contributions paid are capitalised in shares and
interests, to the extent impairment loss is not recognised.
Group contributions paid and received are recognised
as appropriations.
Note 1 Key accounting principles
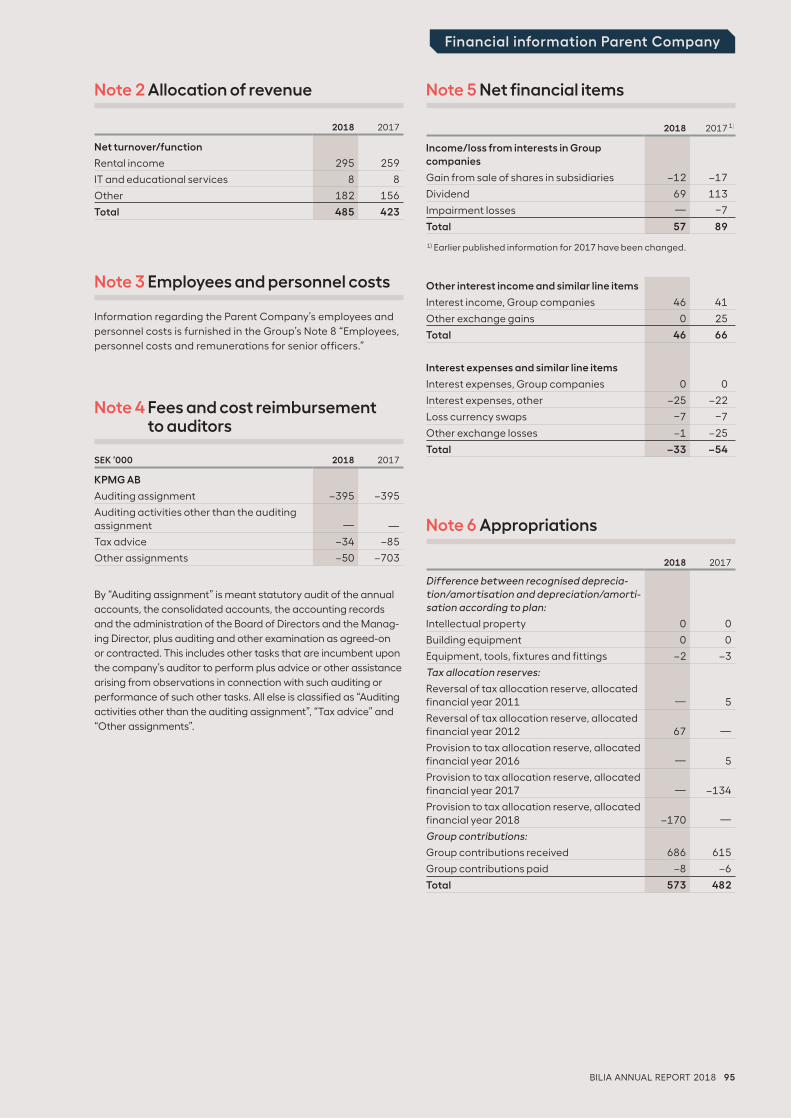
BILIA ANNUAL REPORT 2018 95
Financial information Parent Company
2018 2017
Net turnover/function
Rental income 295 259
IT and educational services 8 8
Other 182 156
Total 485 423
Note 2 Allocation of revenue
Information regarding the Parent Company’s employees and
personnel costs is furnished in the Group’s Note 8 “Employees,
personnel costs and remunerations for senior officers.”
Note 3 Employees and personnel costs
By “Auditing assignment” is meant statutory audit of the annual
accounts, the consolidated accounts, the accounting records
and the administration of the Board of Directors and the Manag-
ing Director, plus auditing and other examination as agreed-on
or contracted. This includes other tasks that are incumbent upon
the company’s auditor to perform plus advice or other assistance
arising from observations in connection with such auditing or
performance of such other tasks. All else is classified as “Auditing
activities other than the auditing assignment”, “Tax advice” and
“Other assignments”.
SEK ‘000 2018 2017
KPMG AB
Auditing assignment –395 –395
Auditing activities other than the auditing assignment — —
Tax advice –34 –85
Other assignments –50 –703
Note 4 Fees and cost reimbursement to auditors
2018 2017 1)
Income/loss from interests in Group companies
Gain from sale of shares in subsidiaries –12 –17
Dividend 69 113
Impairment losses — –7
Total 57 89
1) Earlier published information for 2017 have been changed.
Other interest income and similar line items
Interest income, Group companies 46 41
Other exchange gains 0 25
Total 46 66
Interest expenses and similar line items
Interest expenses, Group companies 0 0
Interest expenses, other –25 –22
Loss currency swaps –7 –7
Other exchange losses –1 –25
Total –33 –54
Note 5 Net financial items
2018 2017
Difference between recognised deprecia-
tion/amortisation and depreciation/amorti-
sation according to plan:
Intellectual property 0 0
Building equipment 0 0
Equipment, tools, fixtures and fittings –2 –3
Tax allocation reserves:
Reversal of tax allocation reserve, allocated financial year 2011 — 5
Reversal of tax allocation reserve, allocated financial year 2012 67 —
Provision to tax allocation reserve, allocated financial year 2016 — 5
Provision to tax allocation reserve, allocated financial year 2017 — –134
Provision to tax allocation reserve, allocated financial year 2018 –170 —
Group contributions:
Group contributions received 686 615
Group contributions paid –8 –6
Total 573 482
Note 6 Appropriations
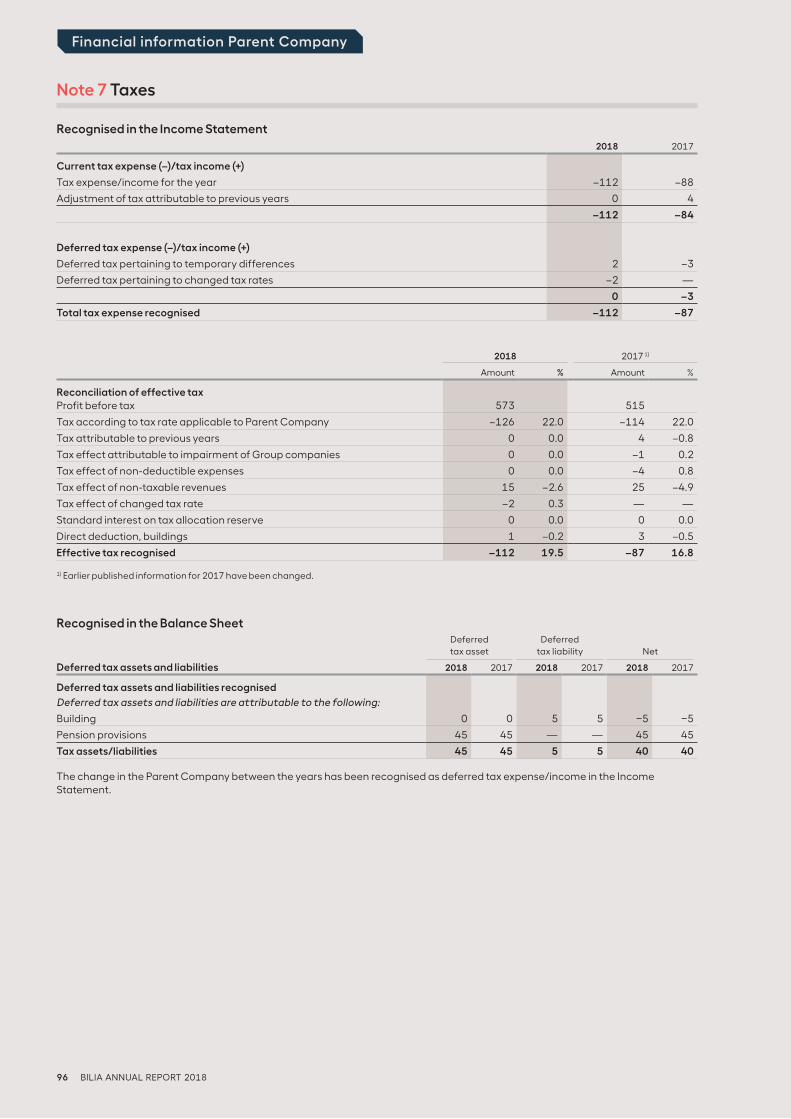
96 BILIA ANNUAL REPORT 2018
Financial information Parent Company
Recognised in the Balance Sheet
Deferred tax asset
Deferred tax liability
Net
Deferred tax assets and liabilities 2018 2017 2018 2017 2018 2017
Deferred tax assets and liabilities recognised
Deferred tax assets and liabilities are attributable to the following:
Building 0 0 5 5 –5 –5
Pension provisions 45 45 — — 45 45
Tax assets/liabilities 45 45 5 5 40 40
The change in the Parent Company between the years has been recognised as deferred tax expense/income in the Income Statement.
2018 2017 1)
Amount % Amount %
Reconciliation of effective taxProfit before tax 573 515
Tax according to tax rate applicable to Parent Company –126 22.0 –114 22.0
Tax attributable to previous years 0 0.0 4 –0.8
Tax effect attributable to impairment of Group companies 0 0.0 –1 0.2
Tax effect of non-deductible expenses 0 0.0 –4 0.8
Tax effect of non-taxable revenues 15 –2.6 25 –4.9
Tax effect of changed tax rate –2 0.3 — —
Standard interest on tax allocation reserve 0 0.0 0 0.0
Direct deduction, buildings 1 –0.2 3 –0.5
Effective tax recognised –112 19.5 –87 16.8
1) Earlier published information for 2017 have been changed.
Recognised in the Income Statement
2018 2017
Current tax expense (–)/tax income (+)
Tax expense/income for the year –112 –88
Adjustment of tax attributable to previous years 0 4
–112 –84
Deferred tax expense (–)/tax income (+)
Deferred tax pertaining to temporary differences 2 –3
Deferred tax pertaining to changed tax rates –2 —
0 –3
Total tax expense recognised –112 –87
Note 7 Taxes
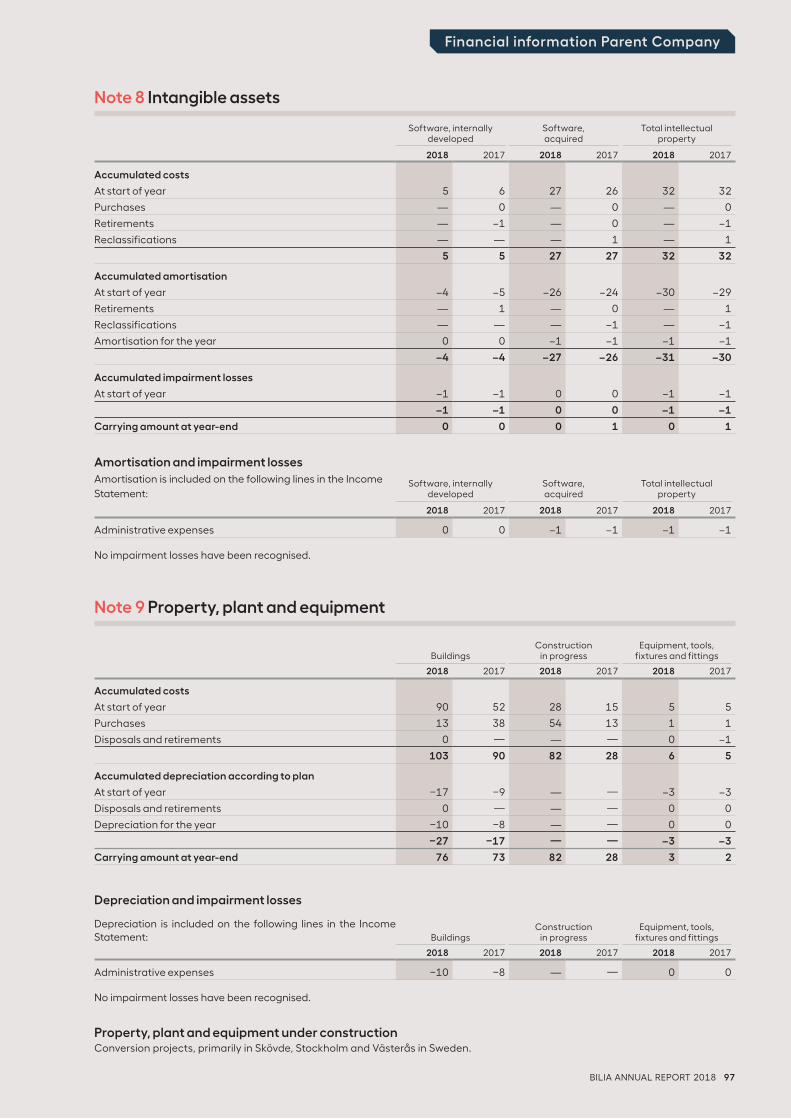
BILIA ANNUAL REPORT 2018 97
Financial information Parent Company
Software, internally
developedSoftware, acquired
Total intellectual property
2018 2017 2018 2017 2018 2017
Accumulated costs
At start of year 5 6 27 26 32 32
Purchases — 0 — 0 — 0
Retirements — –1 — 0 — –1
Reclassifications — — — 1 — 1
5 5 27 27 32 32
Accumulated amortisation
At start of year –4 –5 –26 –24 –30 –29
Retirements — 1 — 0 — 1
Reclassifications — — — –1 — –1
Amortisation for the year 0 0 –1 –1 –1 –1
–4 –4 –27 –26 –31 –30
Accumulated impairment losses
At start of year –1 –1 0 0 –1 –1
–1 –1 0 0 –1 –1
Carrying amount at year-end 0 0 0 1 0 1
Note 8 Intangible assets
Amortisation and impairment losses
Amortisation is included on the following lines in the Income
Statement:Software, internally
developedSoftware, acquired
Total intellectual property
2018 2017 2018 2017 2018 2017
Administrative expenses 0 0 –1 –1 –1 –1
No impairment losses have been recognised.
Note 9 Property, plant and equipment
Buildings
Construction
in progress
Equipment, tools,
fixtures and fittings
2018 2017 2018 2017 2018 2017
Accumulated costs
At start of year 90 52 28 15 5 5
Purchases 13 38 54 13 1 1
Disposals and retirements 0 — — — 0 –1
103 90 82 28 6 5
Accumulated depreciation according to plan
At start of year –17 –9 — — –3 –3
Disposals and retirements 0 — — — 0 0
Depreciation for the year –10 –8 — — 0 0
–27 –17 — — –3 –3
Carrying amount at year-end 76 73 82 28 3 2
Depreciation and impairment losses
Depreciation is included on the following lines in the Income Statement:
Buildings
Construction
in progress
Equipment, tools,
fixtures and fittings
2018 2017 2018 2017 2018 2017
Administrative expenses –10 –8 — — 0 0
No impairment losses have been recognised.
Property, plant and equipment under constructionConversion projects, primarily in Skövde, Stockholm and Västerås in Sweden.
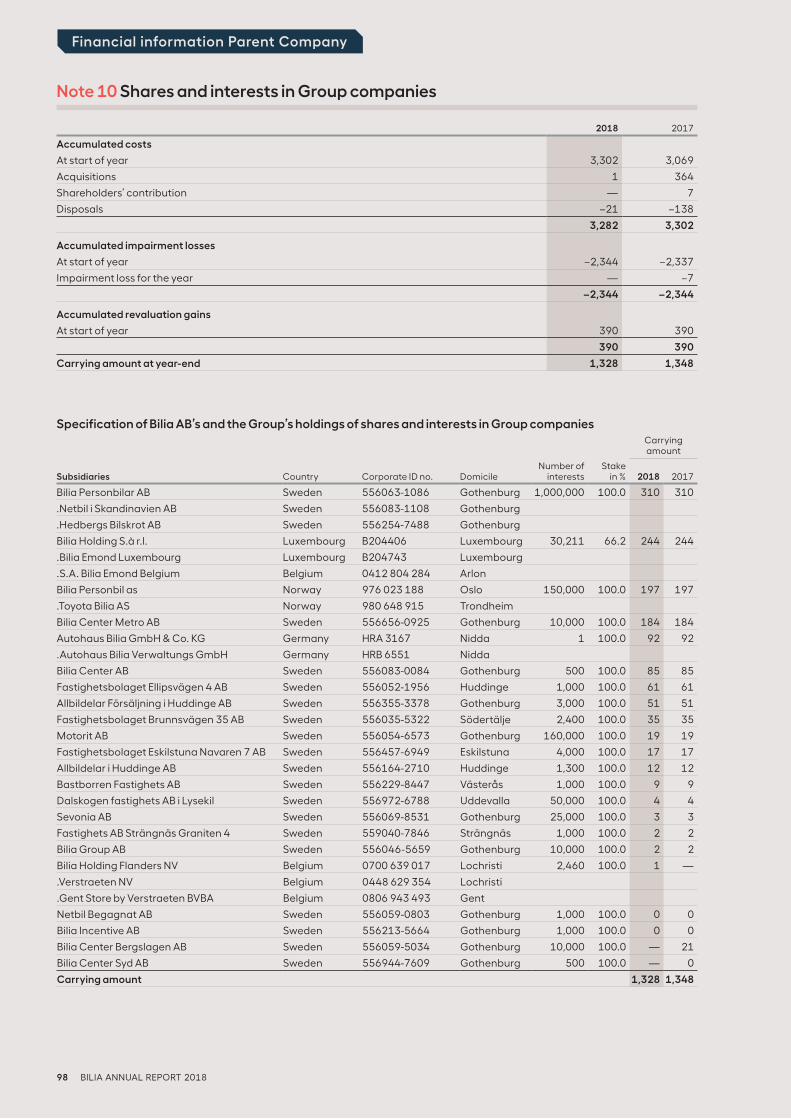
98 BILIA ANNUAL REPORT 2018
Financial information Parent Company
Specification of Bilia AB’s and the Group’s holdings of shares and interests in Group companies
Carrying amount
Subsidiaries Country Corporate ID no. DomicileNumber of
interestsStake
in % 2018 2017
Bilia Personbilar AB Sweden 556063-1086 Gothenburg 1,000,000 100.0 310 310
.Netbil i Skandinavien AB Sweden 556083-1108 Gothenburg
.Hedbergs Bilskrot AB Sweden 556254-7488 Gothenburg
Bilia Holding S.à r.l. Luxembourg B204406 Luxembourg 30,211 66.2 244 244
.Bilia Emond Luxembourg Luxembourg B204743 Luxembourg
.S.A. Bilia Emond Belgium Belgium 0412 804 284 Arlon
Bilia Personbil as Norway 976 023 188 Oslo 150,000 100.0 197 197
.Toyota Bilia AS Norway 980 648 915 Trondheim
Bilia Center Metro AB Sweden 556656-0925 Gothenburg 10,000 100.0 184 184
Autohaus Bilia GmbH & Co. KG Germany HRA 3167 Nidda 1 100.0 92 92
.Autohaus Bilia Verwaltungs GmbH Germany HRB 6551 Nidda
Bilia Center AB Sweden 556083-0084 Gothenburg 500 100.0 85 85
Fastighetsbolaget Ellipsvägen 4 AB Sweden 556052-1956 Huddinge 1,000 100.0 61 61
Allbildelar Försäljning i Huddinge AB Sweden 556355-3378 Gothenburg 3,000 100.0 51 51
Fastighetsbolaget Brunnsvägen 35 AB Sweden 556035-5322 Södertälje 2,400 100.0 35 35
Motorit AB Sweden 556054-6573 Gothenburg 160,000 100.0 19 19
Fastighetsbolaget Eskilstuna Navaren 7 AB Sweden 556457-6949 Eskilstuna 4,000 100.0 17 17
Allbildelar i Huddinge AB Sweden 556164-2710 Huddinge 1,300 100.0 12 12
Bastborren Fastighets AB Sweden 556229-8447 Västerås 1,000 100.0 9 9
Dalskogen fastighets AB i Lysekil Sweden 556972-6788 Uddevalla 50,000 100.0 4 4
Sevonia AB Sweden 556069-8531 Gothenburg 25,000 100.0 3 3
Fastighets AB Strängnäs Graniten 4 Sweden 559040-7846 Strängnäs 1,000 100.0 2 2
Bilia Group AB Sweden 556046-5659 Gothenburg 10,000 100.0 2 2
Bilia Holding Flanders NV Belgium 0700 639 017 Lochristi 2,460 100.0 1 —
.Verstraeten NV Belgium 0448 629 354 Lochristi
.Gent Store by Verstraeten BVBA Belgium 0806 943 493 Gent
Netbil Begagnat AB Sweden 556059-0803 Gothenburg 1,000 100.0 0 0
Bilia Incentive AB Sweden 556213-5664 Gothenburg 1,000 100.0 0 0
Bilia Center Bergslagen AB Sweden 556059-5034 Gothenburg 10,000 100.0 — 21
Bilia Center Syd AB Sweden 556944-7609 Gothenburg 500 100.0 — 0
Carrying amount 1,328 1,348
2018 2017
Accumulated costs
At start of year 3,302 3,069
Acquisitions 1 364
Shareholders’ contribution — 7
Disposals –21 –138
3,282 3,302
Accumulated impairment losses
At start of year –2,344 –2,337
Impairment loss for the year — –7
–2,344 –2,344
Accumulated revaluation gains
At start of year 390 390
390 390
Carrying amount at year-end 1,328 1,348
Note 10 Shares and interests in Group companies
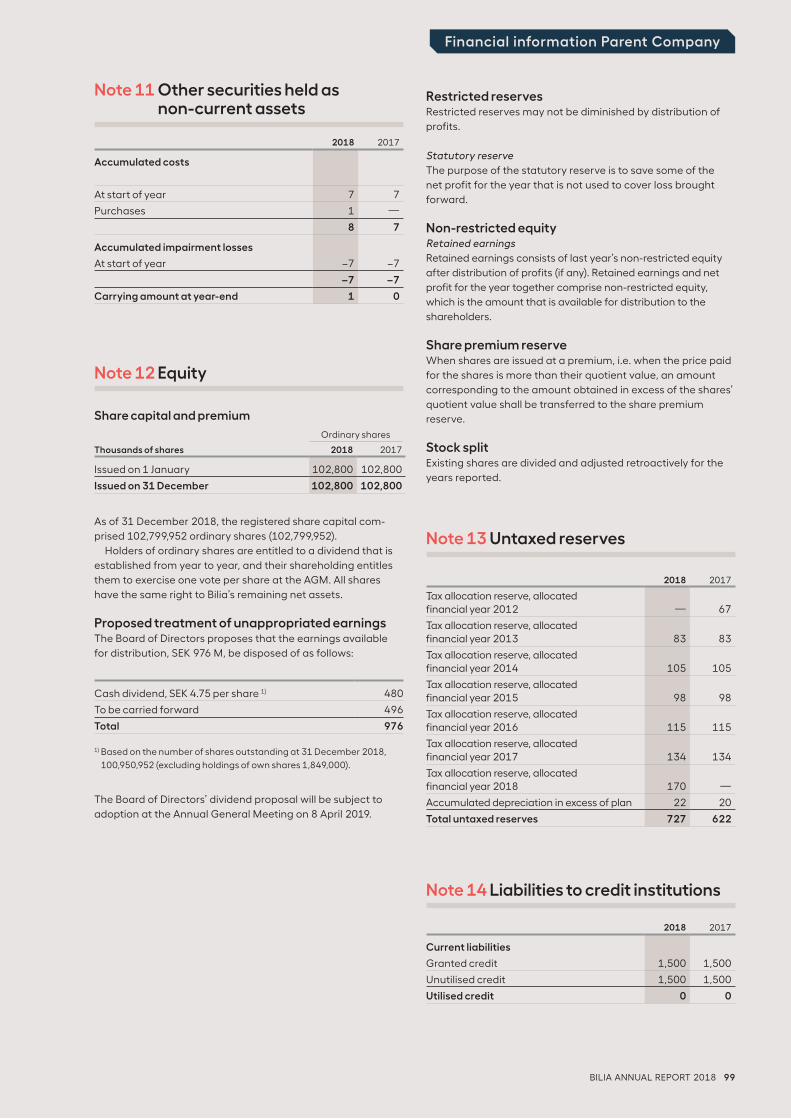
BILIA ANNUAL REPORT 2018 99
Financial information Parent Company
Note 11 Other securities held as non- current assets
2018 2017
Accumulated costs
At start of year 7 7
Purchases 1 —
8 7
Accumulated impairment losses
At start of year –7 –7
–7 –7
Carrying amount at year-end 1 0
Note 12 Equity
Share capital and premium
Ordinary shares
Thousands of shares 2018 2017
Issued on 1 January 102,800 102,800
Issued on 31 December 102,800 102,800
As of 31 December 2018, the registered share capital com-
prised 102,799,952 ordinary shares (102,799,952).
Holders of ordinary shares are entitled to a dividend that is
established from year to year, and their shareholding entitles
them to exercise one vote per share at the AGM. All shares
have the same right to Bilia’s remaining net assets.
Proposed treatment of unappropriated earningsThe Board of Directors proposes that the earnings available
for distribution, SEK 976 M, be disposed of as follows:
Note 13 Untaxed reserves
2018 2017
Tax allocation reserve, allocated financial year 2012 — 67
Tax allocation reserve, allocated financial year 2013 83 83
Tax allocation reserve, allocated financial year 2014 105 105
Tax allocation reserve, allocated financial year 2015 98 98
Tax allocation reserve, allocated financial year 2016 115 115
Tax allocation reserve, allocated financial year 2017 134 134
Tax allocation reserve, allocated financial year 2018 170 —
Accumulated depreciation in excess of plan 22 20
Total untaxed reserves 727 622
2018 2017
Current liabilities
Granted credit 1,500 1,500
Unutilised credit 1,500 1,500
Utilised credit 0 0
Note 14 Liabilities to credit institutions
Restricted reservesRestricted reserves may not be diminished by distribution of
profits.
Statutory reserve
The purpose of the statutory reserve is to save some of the
net profit for the year that is not used to cover loss brought
forward.
Non-restricted equityRetained earnings
Retained earnings consists of last year’s non-restricted equity
after distribution of profits (if any). Retained earnings and net
profit for the year together comprise non-restricted equity,
which is the amount that is available for distribution to the
shareholders.
Share premium reserveWhen shares are issued at a premium, i.e. when the price paid
for the shares is more than their quotient value, an amount
corresponding to the amount obtained in excess of the shares’
quotient value shall be transferred to the share premium
reserve.
Stock splitExisting shares are divided and adjusted retroactively for the
years reported.
Cash dividend, SEK 4.75 per share 1) 480
To be carried forward 496
Total 976
1) Based on the number of shares outstanding at 31 December 2018,
100,950,952 (excluding holdings of own shares 1,849,000).
The Board of Directors’ dividend proposal will be subject to
adoption at the Annual General Meeting on 8 April 2019.
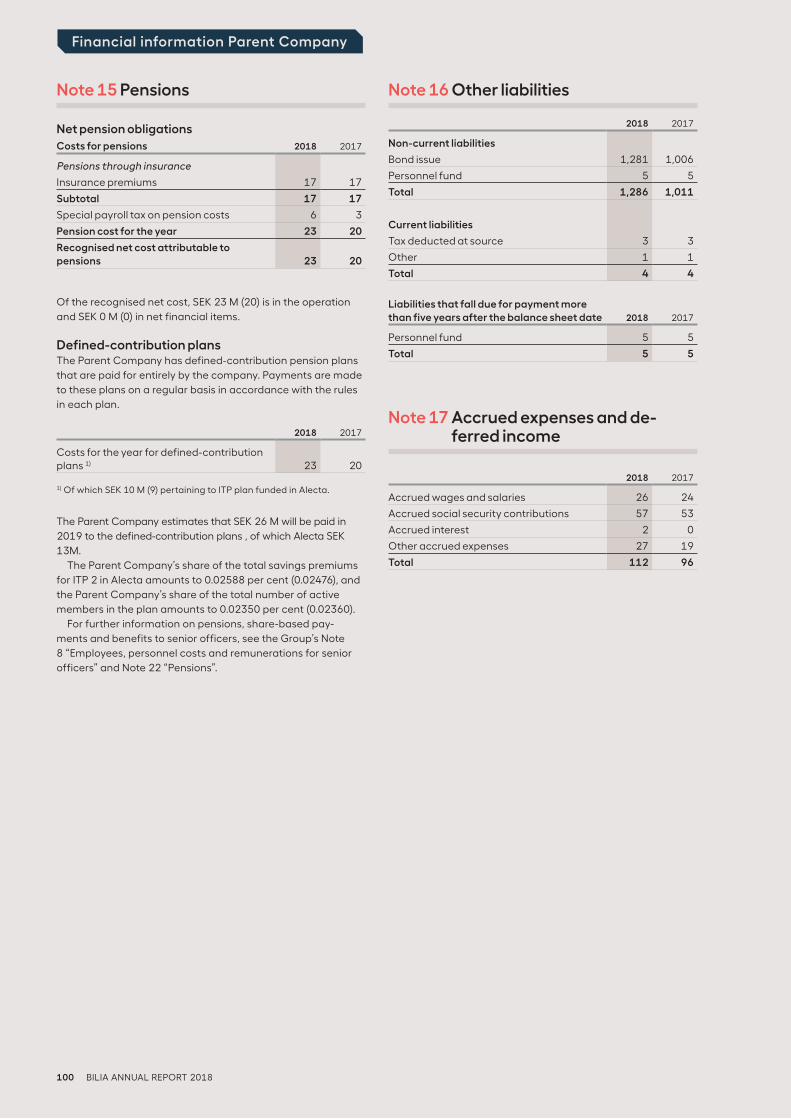
100 BILIA ANNUAL REPORT 2018
Financial information Parent Company
Note 16 Other liabilities
2018 2017
Non-current liabilities
Bond issue 1,281 1,006
Personnel fund 5 5
Total 1,286 1,011
Current liabilities
Tax deducted at source 3 3
Other 1 1
Total 4 4
Liabilities that fall due for payment more than five years after the balance sheet date 2018 2017
Personnel fund 5 5
Total 5 5
2018 2017
Accrued wages and salaries 26 24
Accrued social security contributions 57 53
Accrued interest 2 0
Other accrued expenses 27 19
Total 112 96
Note 17 Accrued expenses and de-ferred income
Note 15 Pensions
Net pension obligations
Costs for pensions 2018 2017
Pensions through insurance
Insurance premiums 17 17
Subtotal 17 17
Special payroll tax on pension costs 6 3
Pension cost for the year 23 20
Recognised net cost attributable to pensions 23 20
Of the recognised net cost, SEK 23 M (20) is in the operation
and SEK 0 M (0) in net financial items.
Defined-contribution plansThe Parent Company has defined-contribution pension plans
that are paid for entirely by the company. Payments are made
to these plans on a regular basis in accordance with the rules
in each plan.
2018 2017
Costs for the year for defined-contribution plans 1) 23 20
1) Of which SEK 10 M (9) pertaining to ITP plan funded in Alecta.
The Parent Company estimates that SEK 26 M will be paid in
2019 to the defined-contribution plans , of which Alecta SEK
13M.
The Parent Company’s share of the total savings premiums
for ITP 2 in Alecta amounts to 0.02588 per cent (0.02476), and
the Parent Company’s share of the total number of active
members in the plan amounts to 0.02350 per cent (0.02360).
For further information on pensions, share-based pay-
ments and benefits to senior officers, see the Group’s Note
8 “Employees, personnel costs and remunerations for senior
officers” and Note 22 “Pensions”.
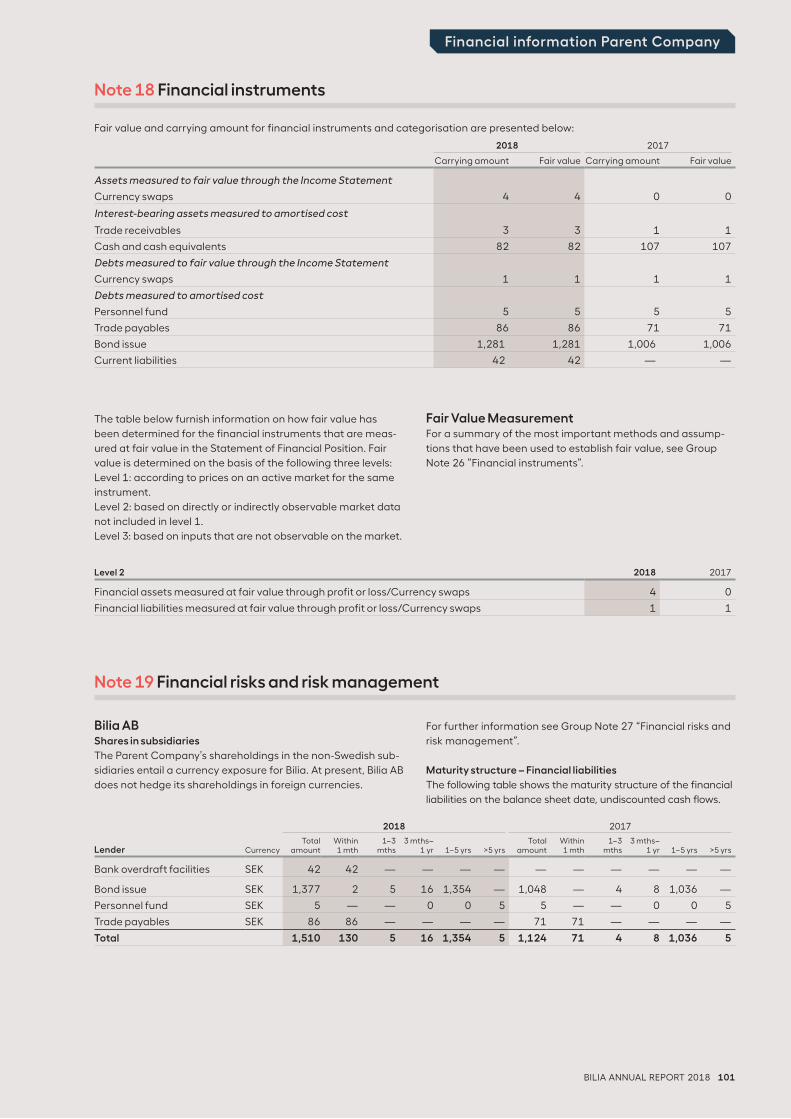
BILIA ANNUAL REPORT 2018 101
Financial information Parent Company
The table below furnish information on how fair value has
been determined for the financial instruments that are meas-
ured at fair value in the Statement of Financial Position. Fair
value is determined on the basis of the following three levels:
Level 1: according to prices on an active market for the same
instrument.
Level 2: based on directly or indirectly observable market data
not included in level 1.
Level 3: based on inputs that are not observable on the market.
Fair Value MeasurementFor a summary of the most important methods and assump-
tions that have been used to establish fair value, see Group
Note 26 ”Financial instruments”.
Level 2 2018 2017
Financial assets measured at fair value through profit or loss/Currency swaps 4 0
Financial liabilities measured at fair value through profit or loss/Currency swaps 1 1
Note 18 Financial instruments
2018 2017
Carrying amount Fair value Carrying amount Fair value
Assets measured to fair value through the Income Statement
Currency swaps 4 4 0 0
Interest-bearing assets measured to amortised cost
Trade receivables 3 3 1 1
Cash and cash equivalents 82 82 107 107
Debts measured to fair value through the Income Statement
Currency swaps 1 1 1 1
Debts measured to amortised cost
Personnel fund 5 5 5 5
Trade payables 86 86 71 71
Bond issue 1,281 1,281 1,006 1,006
Current liabilities 42 42 — —
Fair value and carrying amount for financial instruments and categorisation are presented below:
Bilia ABShares in subsidiaries
The Parent Company’s shareholdings in the non-Swedish sub-
sidiaries entail a currency exposure for Bilia. At present, Bilia AB
does not hedge its shareholdings in foreign currencies.
For further information see Group Note 27 “Financial risks and
risk management”.
Maturity structure – Financial liabilities
The following table shows the maturity structure of the financial
liabilities on the balance sheet date, undiscounted cash flows.
Note 19 Financial risks and risk management
2018 2017
Lender CurrencyTotal
amountWithin1 mth
1–3mths
3 mths–1 yr 1–5 yrs >5 yrs
Totalamount
Within1 mth
1–3mths
3 mths–1 yr 1–5 yrs >5 yrs
Bank overdraft facilities SEK 42 42 — — — — — — — — — —
Bond issue SEK 1,377 2 5 16 1,354 — 1,048 — 4 8 1,036 —
Personnel fund SEK 5 — — 0 0 5 5 — — 0 0 5
Trade payables SEK 86 86 — — — — 71 71 — — — —
Total 1,510 130 5 16 1,354 5 1,124 71 4 8 1,036 5
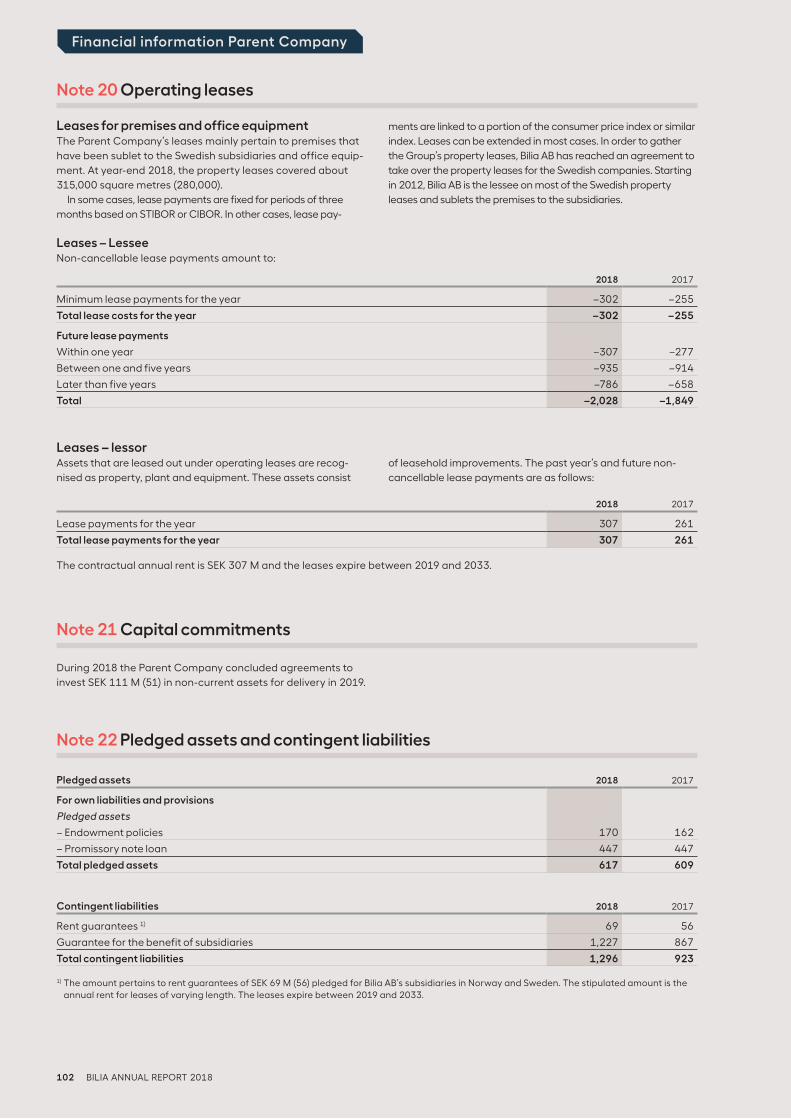
102 BILIA ANNUAL REPORT 2018
Financial information Parent Company
Note 20 Operating leases
Leases for premises and office equipmentThe Parent Company’s leases mainly pertain to premises that
have been sublet to the Swedish subsidiaries and office equip-
ment. At year-end 2018, the property leases covered about
315,000 square metres (280,000).
In some cases, lease payments are fixed for periods of three
months based on STIBOR or CIBOR. In other cases, lease pay-
ments are linked to a portion of the consumer price index or similar
index. Leases can be extended in most cases. In order to gather
the Group’s property leases, Bilia AB has reached an agreement to
take over the property leases for the Swedish companies. Starting
in 2012, Bilia AB is the lessee on most of the Swedish property
leases and sublets the premises to the subsidiaries.
Leases – lessorAssets that are leased out under operating leases are recog-
nised as property, plant and equipment. These assets consist
of leasehold improvements. The past year’s and future non-
cancellable lease payments are as follows:
Note 21 Capital commitments
During 2018 the Parent Company concluded agreements to
invest SEK 111 M (51) in non-current assets for delivery in 2019.
Note 22 Pledged assets and contingent liabilities
Pledged assets 2018 2017
For own liabilities and provisions
Pledged assets
– Endowment policies 170 162
– Promissory note loan 447 447
Total pledged assets 617 609
Contingent liabilities 2018 2017
Rent guarantees 1) 69 56
Guarantee for the benefit of subsidiaries 1,227 867
Total contingent liabilities 1,296 923
1) The amount pertains to rent guarantees of SEK 69 M (56) pledged for Bilia AB’s subsidiaries in Norway and Sweden. The stipulated amount is the
annual rent for leases of varying length. The leases expire between 2019 and 2033.
2018 2017
Minimum lease payments for the year –302 –255
Total lease costs for the year –302 –255
Future lease payments
Within one year –307 –277
Between one and five years –935 –914
Later than five years –786 –658
Total –2,028 –1,849
2018 2017
Lease payments for the year 307 261
Total lease payments for the year 307 261
The contractual annual rent is SEK 307 M and the leases expire between 2019 and 2033.
Leases – LesseeNon-cancellable lease payments amount to:
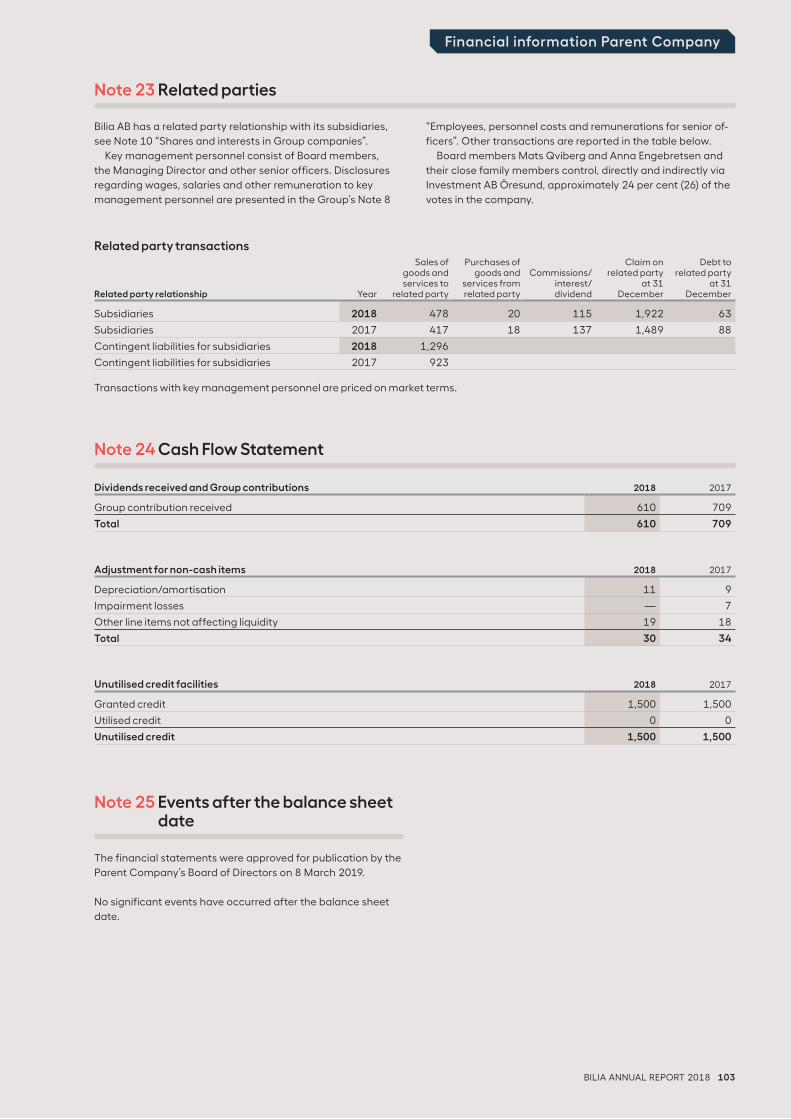
BILIA ANNUAL REPORT 2018 103
Financial information Parent Company
Bilia AB has a related party relationship with its subsidiaries,
see Note 10 “Shares and interests in Group companies”.
Key management personnel consist of Board members,
the Managing Director and other senior officers. Disclosures
regarding wages, salaries and other remuneration to key
management personnel are presented in the Group’s Note 8
“Employees, personnel costs and remunerations for senior of-
ficers”. Other transactions are reported in the table below.
Board members Mats Qviberg and Anna Engebretsen and
their close family members control, directly and indirectly via
Investment AB Öresund, approximately 24 per cent (26) of the
votes in the company.
Note 23 Related parties
Related party transactions
Related party relationship Year
Sales ofgoods andservices to
related party
Purchases ofgoods and
services from related party
Commissions/interest/dividend
Claim onrelated party
at 31December
Debt torelated party
at 31December
Subsidiaries 2018 478 20 115 1,922 63
Subsidiaries 2017 417 18 137 1,489 88
Contingent liabilities for subsidiaries 2018 1,296
Contingent liabilities for subsidiaries 2017 923
Transactions with key management personnel are priced on market terms.
Dividends received and Group contributions 2018 2017
Group contribution received 610 709
Total 610 709
Adjustment for non-cash items 2018 2017
Depreciation/amortisation 11 9
Impairment losses — 7
Other line items not affecting liquidity 19 18
Total 30 34
Unutilised credit facilities 2018 2017
Granted credit 1,500 1,500
Utilised credit 0 0
Unutilised credit 1,500 1,500
Note 24 Cash Flow Statement
Note 25 Events after the balance sheet date
The financial statements were approved for publication by the
Parent Company’s Board of Directors on 8 March 2019.
No significant events have occurred after the balance sheet
date.
Signatures
Signatures
104 BILIA ANNUAL REPORT 2018
The Board of Directors and the Managing Director ensure that the annual accounts have been prepared in accordance with
generally accepted accounting principles in Sweden and that the consolidated accounts have been prepared in accordance
with the international accounting standards referred to in Regulation (EC) No 1606/2002 of the European Parliament and of
the Council of 19 July 2002 on the application of international accounting standards. The annual accounts and consolidated
accounts give a true and fair view of the Parent Company’s and the Group’s financial position and results of operations.
The Directors’ Report for the Parent Company and the Group provides a true and fair summary of the development of the
Parent Company’s and the Group’s activities, financial position and results of operations while describing significant risks and
uncertainties faced by the Parent Company and the companies included in the Group.
Gothenburg, 8 March 2019
Mats Qviberg
Chairman
Jan Pettersson Ingrid Jonasson Blank Gunnar Blomkvist
Deputy Chairman Board member Board member
Anna Engebretsen Jack Forsgren Laila Freivalds
Board member Board member Board member
Mats Holgerson Nicklas Paulson Jon Risfelt
Board member Board member Board member
Dragan Mitrasinovic Patrik Nordvall Per Avander
Board member appointed Board member appointed Managing Director
by employee organisation by employee organisation
Our Audit Report was submitted on 11 March 2019
KPMG AB
Johan Kratz
Authorised Public Accountant
As is evident above, the annual accounts and consolidated accounts were approved for publication by the Board of Directors and
the Managing Director on 8 March 2019. The Consolidated Statement of Income and Other Comprehensive Income, the Consoli-
dated Statement of Financial Position, the Parent Company Income Statement and the Parent Company Balance Sheet will be
subject to adoption at the Annual General Meeting on 8 April 2019.
Auditor's report
To the annual meeting of the shareholders of Bilia AB (publ), Corp. ID no. 556112-5690
Report on the annual accounts and consolidated accountsOpinions
We have audited the annual accounts and consolidated
accounts of Bilia AB (publ) for the year 2018, except for the
corporate governance statement on pages 34–37 and the
sustainability report on pages 28–33. The annual accounts
and consolidated accounts of the company are included on
pages 44–103 in this document.
In our opinion, the annual accounts have been prepared in ac-
cordance with the Annual Accounts Act, and present fairly, in all
material respects, the financial position of the parent company
as of 31 December 2018 and its financial performance and cash
flow for the year then ended in accordance with the Annual
Accounts Act. The consolidated accounts have been prepared
in accordance with the Annual Accounts Act and present fairly,
in all material respects, the financial position of the group as of
31 December 2018 and their financial performance and cash
flow for the year then ended in accordance with International
Financial Reporting Standards (IFRS), as adopted by the EU, and
the Annual Accounts Act. Our opinions do not cover the corpo-
rate governance statement on pages 34–37 and sustainability
report on pages 28–33. The statutory administration report
is consistent with the other parts of the annual accounts and
consolidated accounts.
We therefore recommend that the general meeting of share-
holders adopts the Income Statement and Balance Sheet for the
parent company and the Statement of Comprehensive Income
and Statement of Financial Position for the group.
Our opinions in this report on the the annual accounts and
consolidated accounts are consistent with the content of the
additional report that has been submitted to the parent com-
pany's audit committee in accordance with the Audit Regulation
(537/2014) Article 11.
Basis for Opinions
We conducted our audit in accordance with International
Standards on Auditing (ISA) and generally accepted auditing
standards in Sweden. Our responsibilities under those stand-
ards are further described in the Auditor’s Responsibilities
section. We are independent of the parent company and the
group in accordance with professional ethics for accountants
in Sweden and have otherwise fulfilled our ethical responsibili-
ties in accordance with these requirements.This includes that,
based on the best of our knowledge and belief, no prohibited
services referred to in the Audit Regulation (537/2014) Article
5.1 have been provided to the audited company or, where ap-
plicable, its parent company or its controlled companies within
the EU.
We believe that the audit evidence we have obtained is suf-
ficient and appropriate to provide a basis for our opinions.
Key Audit Matters
Key audit matters of the audit are those matters that, in our
professional judgment, were of most significance in our audit
of the annual accounts and consolidated accounts of the
current period. These matters were addressed in the context
of our audit of, and in forming our opinion thereon, the annual
accounts and consolidated accounts as a whole, but we do
not provide a separate opinion on these matters.
Revenues from goods and services.
See Note 2 in the consolidated accounts for detailed informa-
tion and description of the matter.
Description of key audit matter
The group revenues for 2018 amounts to SEK 28,382 M.
Total revenue from cutomers consist of delivering goods and
services. In both cases revenue is recognised when control is
tranfered to the costumer.
Lease income is recognised in accordance with contract terms.
Revenue recognitions include a substantial amount of assump-
tions and professinal judgments perfomed by management.
Response in the audit
We have examined pertinent contract terms in order to as-
sess the Group’s identification of goods and services and the
methodology for allocation of revenue to different goods and
services based on their relative fair values. We have tested
controls regarding allocation and accrual of revenues.
We have also assedded the timing of recognition of revenues
from goods and services by considering when they have been
delivered or are expected to be delivered as well as contractual
conditions for the transaction, both by testing samples and the
precision of thos methodology based on historic outcome.
Valuation of inventory
See Note 19 in the consolidated accounts for detailed informa-
tion and description of the matter.
Description of key audit matter
The value of Group’s inventory amounts to SEK 3,992 M and
33 per cent of the Group’s total assets, whereby we consider
it a significant balance sheet item. The net fair value of
the vehicle stock depends on numerous variables such as
econimic cycle, interest rate levels, current and upcoming
model programs, regulatory requirements and time in stock.
The difference between the purchase price and the net fair
value can affect the Groups’s earnings.
Response in the audit
We have assesed and tested the Group’s controls and proce-
dures for valuation of inventory. We have conducted our own
analyses of the vehicles’ time in stock and when necessary
evaluated this against external transations and prevailing mar-
ket conditions.
Other Information than the annual accounts and consolidated
accounts
This document also contains other information than the annual
accounts and consolidated accounts and is found on pages
2–13, 38–43 and 108–112. The Board of Directors and the
Managing Director are responsible for this other information.
Our opinion on the annual accounts and consolidated ac-
counts does not cover this other information and we do not
express any form of assurance conclusion regarding this other
information.
In connection with our audit of the annual accounts and
consolidated accounts, our responsibility is to read the informa-
Auditor’s report
BILIA ANNUAL REPORT 2018 105
Auditor’s report cont’d.
Auditor's report
106 BILIA ANNUAL REPORT 2018
tion identified above and consider whether the information is
materially inconsistent with the annual accounts and consoli-
dated accounts. In this procedure we also take into account our
knowledge otherwise obtained in the audit and assess whether
the information otherwise appears to be materially misstated.
If we, based on the work performed concerning this informa-
tion, conclude that there is a material misstatement of this other
information, we are required to report that fact. We have noth-
ing to report in this regard.
Responsibilities of the Board of Directors and the Managing
Director
The Board of Directors and the Managing Director are respon-
sible for the preparation of the annual accounts and consoli-
dated accounts and that they give a fair presentation in ac-
cordance with the Annual Accounts Act and, concerning the
consolidated accounts, in accordance with IFRS as adopted by
the EU. The Board of Directors and the Managing Director are
also responsible for such internal control as they determine is
necessary to enable the preparation of annual accounts and
consolidated accounts that are free from material misstate-
ment, whether due to fraud or error.
In preparing the annual accounts and consolidated accounts
The Board of Directors and the Managing Director are responsi-
ble for the assessment of the company’s and the group's ability
to continue as a going concern. They disclose, as applicable,
matters related to going concern and using the going concern
basis of accounting. The going concern basis of accounting is
however not applied if the Board of Directors and the Managing
Director intend to liquidate the company, to cease operations, or
has no realistic alternative but to do so.
The Audit Committee shall, without prejudice to the Board
of Director’s responsibilities and tasks in general, among other
things oversee the company’s financial reporting process.
Auditor’s responsibility
Our objectives are to obtain reasonable assurance about
whether the annual accounts and consolidated accounts as
a whole are free from material misstatement, whether due to
fraud or error, and to issue an auditor’s report that includes our
opinions. Reasonable assurance is a high level of assurance,
but is not a guarantee that an audit conducted in accord-
ance with ISAs and generally accepted auditing standards
in Sweden will always detect a material misstatement when
it exists. Misstatements can arise from fraud or error and are
considered material if, individually or in the aggregate, they
could reasonably be expected to influence the economic deci-
sions of users taken on the basis of these annual accounts and
consolidated accounts.
As part of an audit in accordance with ISAs, we exercise
professional judgment and maintain professional scepticism
throughout the audit. We also:
• identify and assess the risks of material misstatement of the
annual accounts and consolidated accounts, whether due to
fraud or error, design and perform audit procedures respon-
sive to those risks, and obtain audit evidence that is sufficient
and appropriate to provide a basis for our opinions. The risk
of not detecting a material misstatement resulting from
fraud is higher than for one resulting from error, as fraud may
involve collusion, forgery, intentional omissions, misrepresen-
tations, or the override of internal control.
• obtain an understanding of the company’s internal control
relevant to our audit in order to design audit procedures that
are appropriate in the circumstances, but not for the purpose
of expressing an opinion on the effectiveness of the com-
pany’s internal control.
• evaluate the appropriateness of accounting policies used
and the reasonableness of accounting estimates and related
disclosures made by the Board of Directors and the Manag-
ing Director.
• conclude on the appropriateness of the Board of Direc-
tors’ and the Managing Director's, use of the going concern
basis of accounting in preparing the annual accounts and
consolidated accounts. We also draw a conclusion, based
on the audit evidence obtained, as to whether any material
uncertainty exists related to events or conditions that may
cast significant doubt on the company’s and the group's
ability to continue as a going concern. If we conclude that a
material uncertainty exists, we are required to draw attention
in our auditor’s report to the related disclosures in the annual
accounts and consolidated accounts or, if such disclosures
are inadequate, to modify our opinion about the annual
accounts and consolidated accounts. Our conclusions are
based on the audit evidence obtained up to the date of our
auditor’s report. However, future events or conditions may
cause a company and a group to cease to continue as a go-
ing concern.
• evaluate the overall presentation, structure and content of
the annual accounts and consolidated accounts, includ-
ing the disclosures, and whether the annual accounts and
consolidated accounts represent the underlying transactions
and events in a manner that achieves fair presentation.
• obtain sufficient and appropriate audit evidence regarding
the financial information of the entities or business activities
within the group to express an opinion on the consolidated
accounts. We are responsible for the direction, supervi-
sion and performance of the group audit. We remain solely
responsible for our opinions.
We must inform the Board of Directors of, among other mat-
ters, the planned scope and timing of the audit. We must also
inform of significant audit findings during our audit, including
any significant deficiencies in internal control that we identified.
We must also provide the Board of Directors with a state-
ment that we have complied with relevant ethical requirements
regarding independence, and to communicate with them all
relationships and other matters that may reasonably be thought
to bear on our independence, and where applicable, related
safeguards.
From the matters communicated with the Board of Directors,
we determine those matters that were of most significance in
the audit of the annual accounts and consolidated accounts,
including the most important assessed risks for material mis-
statement, and are therefore the key audit matters. We describe
these matters in the auditor’s report unless law or regulation
precludes disclosure about the matter.
Report on other legal and regulatory requirementsOpinions
In addition to our audit of the annual accounts and consoli-
dated accounts, we have also audited the administration of
the Board of Directors and the Managing Director of Bilia AB
(publ) for the year 2018 and the proposed appropriations of
the company's profit or loss.
We recommend to the general meeting of shareholders that
the profit be appropriated in accordance with the proposal in
the statutory administration report and that the members of the
Board of Directors and the Managing Director be discharged
from liability for the financial year.
Basis for Opinions
We conducted the audit in accordance with generally ac-
cepted auditing standards in Sweden. Our responsibilities
under those standards are further described in the Auditor’s
Responsibilities section. We are independent of the parent
company and the group in accordance with professional eth-
ics for accountants in Sweden and have otherwise fulfilled our
ethical responsibilities in accordance with these requirements.
We believe that the audit evidence we have obtained is suf-
ficient and appropriate to provide a basis for our opinions.
Responsibilities of the Board of Directors and the Managing
Director
The Board of Directors is responsible for the proposal for ap-
propriations of the company’s profit or loss. At the proposal
of a dividend, this includes an assessment of whether the
dividend is justifiable considering the requirements which the
company's and the group's type of operations, size and risks
place on the size of the parent company's and the group’s
equity, consolidation requirements, liquidity and position in
general.
The Board of Directors is responsible for the company’s
organisation and the administration of the company’s affairs.
This includes among other things continuous assessment of the
company’s and the group's financial situation and ensuring that
the company's organisation is designed so that the account-
ing, management of assets and the company’s financial affairs
otherwise are controlled in a reassuring manner.
The Managing Director shall manage the ongoing administra-
tion according to the Board of Directors' guidelines and instruc-
tions and among other matters take measures that are neces-
sary to fulfill the company's accounting in accordance with law
and handle the management of assets in a reassuring manner.
Auditor’s responsibility
Our objective concerning the audit of the administration, and
thereby our opinion about discharge from liability, is to obtain
audit evidence to assess with a reasonable degree of assur-
ance whether any member of the Board of Directors or the
Managing Director in any material respect:
• has undertaken any action or been guilty of any omission
which can give rise to liability to the company, or
• in any other way has acted in contravention of the Compa-
nies Act, the Annual Accounts Act or the Articles of Associa-
tion.
Our objective concerning the audit of the proposed appropria-
tions of the company’s profit or loss, and thereby our opinion
about this, is to assess with reasonable degree of assurance
whether the proposal is in accordance with the Companies Act.
Reasonable assurance is a high level of assurance, but is not
a guarantee that an audit conducted in accordance with gener-
ally accepted auditing standards in Sweden will always detect
actions or omissions that can give rise to liability to the company,
or that the proposed appropriations of the company’s profit or
loss are not in accordance with the Companies Act.
As part of an audit in accordance with generally accepted au-
diting standards in Sweden, we exercise professional judgment
and maintain professional scepticism throughout the audit. The
examination of the administration and the proposed appropria-
tions of the company’s profit or loss is based primarily on the
audit of the accounts. Additional audit procedures performed
are based on our professional judgment with starting point in
risk and materiality. This means that we focus the examination
on such actions, areas and relationships that are material for
the operations and where deviations and violations would have
particular importance for the company’s situation. We examine
and test decisions undertaken, support for decisions, actions
taken and other circumstances that are relevant to our opinion
concerning discharge from liability. As a basis for our opinion on
the Board of Directors’ proposed appropriations of the compa-
ny’s profit or loss we examined the Board of Directors' reasoned
statement and a selection of supporting evidence in order to be
able to assess whether the proposal is in accordance with the
Companies Act.
The auditor's examination of the corporate governance
statement
The Board of Directors is responsible for that the corporate
governance statement on pages 34–37 has been prepared in
accordance with the Annual Accounts Act.
Our examination of the corporate governance statement is
conducted in accordance with FAR´s auditing standard RevU 16
The auditor´s examination of the corporate governance state-
ment. This means that our examination of the corporate govern-
ance statement is different and substantially less in scope than
an audit conducted in accordance with International Standards
on Auditing and generally accepted auditing standards in
Sweden. We believe that the examination has provided us with
sufficient basis for our opinions.
A corporate governance statement has been prepared.
Disclosures in accordance with chapter 6 section 6 the second
paragraph points 2–6 of the Annual Accounts Act and chapter
7 section 31 the second paragraph the same law are consistent
with the other parts of the annual accounts and consolidated
accounts and are in accordance with the Annual Accounts Act.
The auditor's opinion regarding the statutory sustainability
report
The Board of Directors is responsible for the sustainability re-
port on pages 28–33, and that it is prepared in accordance with
the Annual Accounts Act.
Our examination has been conducted in accordance with
FAR:s auditing standard RevR 12 The auditor's opinion regarding
the statutory sustainability report. This means that our examina-
tion of the statutory sustainability report is different and sub-
stantially less in scope than an audit conducted in accordance
with International Standards on Auditing and generally accepted
auditing standards in Sweden. We believe that the examination
has provided us with sufficient basis for our opinion.
A statutory sustainability report has been prepared.
KPMG AB, Box 11908, 404 39 , Göteborg, was appointed
auditor of Bilia AB (publ) by the annual general meeting of
the shareholders on the 10th of April 2018. KPMG AB or
auditors operating at KPMG AB have been the company's
auditor since 2000.
Gothenburg, 11 March 2019
KPMG AB
Johan Kratz
Authorised Public Accountant
Auditor's report
BILIA ANNUAL REPORT 2018 107
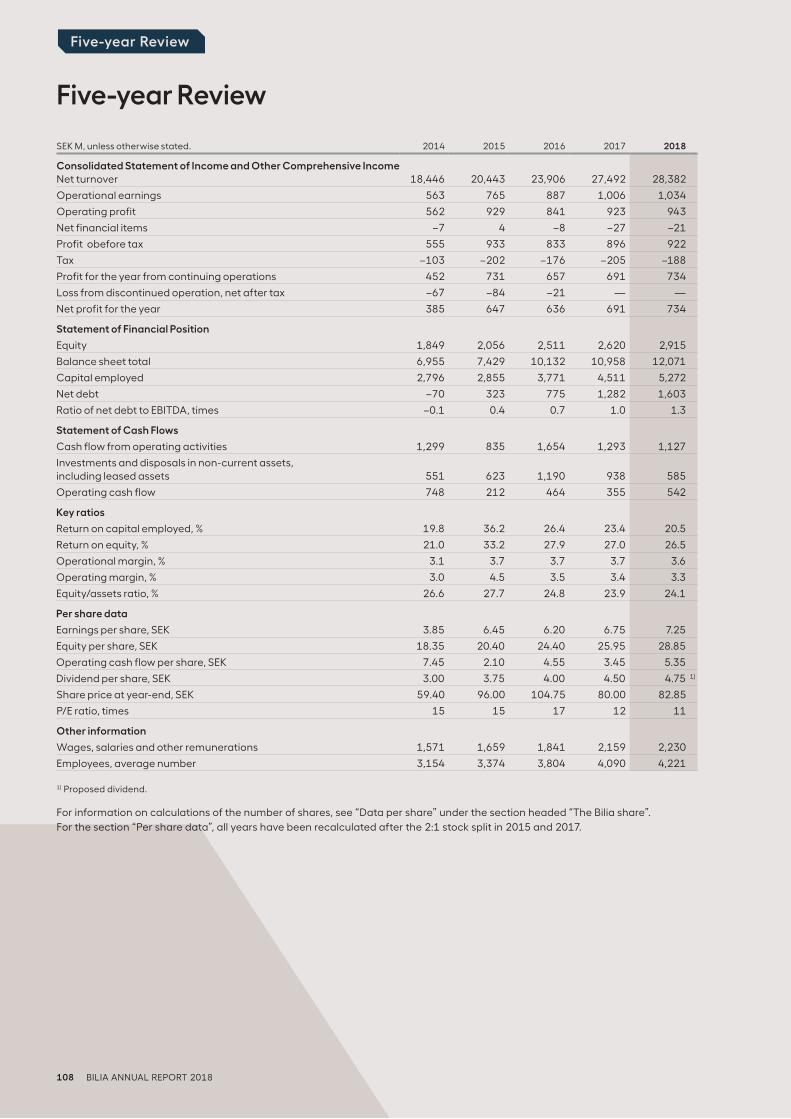
Five-year Review
Five-year Review
SEK M, unless otherwise stated. 2014 2015 2016 2017 2018
Consolidated Statement of Income and Other Comprehensive IncomeNet turnover 18,446 20,443 23,906 27,492 28,382
Operational earnings 563 765 887 1,006 1,034
Operating profit 562 929 841 923 943
Net financial items –7 4 –8 –27 –21
Profit obefore tax 555 933 833 896 922
Tax –103 –202 –176 –205 –188
Profit for the year from continuing operations 452 731 657 691 734
Loss from discontinued operation, net after tax –67 –84 –21 — —
Net profit for the year 385 647 636 691 734
Statement of Financial Position
Equity 1,849 2,056 2,511 2,620 2,915
Balance sheet total 6,955 7,429 10,132 10,958 12,071
Capital employed 2,796 2,855 3,771 4,511 5,272
Net debt –70 323 775 1,282 1,603
Ratio of net debt to EBITDA, times –0.1 0.4 0.7 1.0 1.3
Statement of Cash Flows
Cash flow from operating activities 1,299 835 1,654 1,293 1,127
Investments and disposals in non-current assets, including leased assets 551 623 1,190 938 585
Operating cash flow 748 212 464 355 542
Key ratios
Return on capital employed, % 19.8 36.2 26.4 23.4 20.5
Return on equity, % 21.0 33.2 27.9 27.0 26.5
Operational margin, % 3.1 3.7 3.7 3.7 3.6
Operating margin, % 3.0 4.5 3.5 3.4 3.3
Equity/assets ratio, % 26.6 27.7 24.8 23.9 24.1
Per share data
Earnings per share, SEK 3.85 6.45 6.20 6.75 7.25
Equity per share, SEK 18.35 20.40 24.40 25.95 28.85
Operating cash flow per share, SEK 7.45 2.10 4.55 3.45 5.35
Dividend per share, SEK 3.00 3.75 4.00 4.50 4.75 1)
Share price at year-end, SEK 59.40 96.00 104.75 80.00 82.85
P/E ratio, times 15 15 17 12 11
Other information
Wages, salaries and other remunerations 1,571 1,659 1,841 2,159 2,230
Employees, average number 3,154 3,374 3,804 4,090 4,221
1) Proposed dividend.
For information on calculations of the number of shares, see “Data per share” under the section headed “The Bilia share”.
For the section “Per share data”, all years have been recalculated after the 2:1 stock split in 2015 and 2017.
108 BILIA ANNUAL REPORT 2018
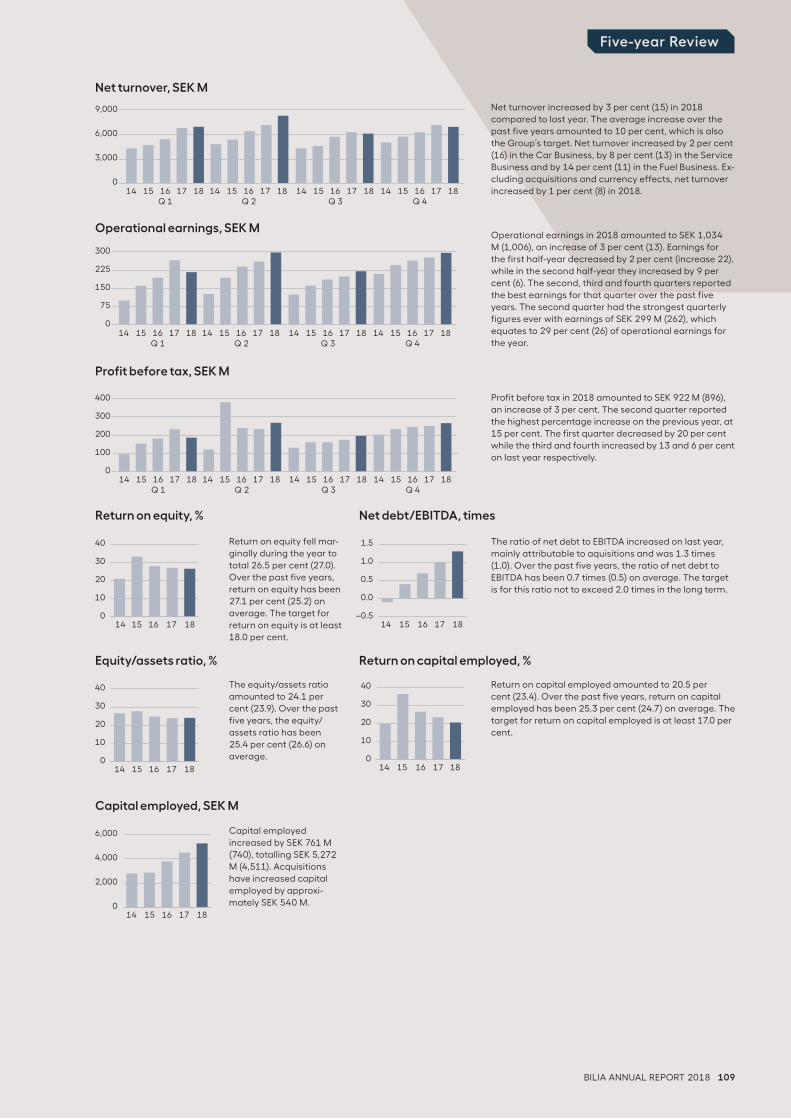
Five-year Review
Net turnover increased by 3 per cent (15) in 2018
compared to last year. The average increase over the
past five years amounted to 10 per cent, which is also
the Group’s target. Net turnover increased by 2 per cent
(16) in the Car Business, by 8 per cent (13) in the Service
Business and by 14 per cent (11) in the Fuel Business. Ex-
cluding acquisitions and currency effects, net turnover
increased by 1 per cent (8) in 2018.
Operational earnings in 2018 amounted to SEK 1,034
M (1,006), an increase of 3 per cent (13). Earnings for
the first half-year decreased by 2 per cent (increase 22),
while in the second half-year they increased by 9 per
cent (6). The second, third and fourth quarters reported
the best earnings for that quarter over the past five
years. The second quarter had the strongest quarterly
figures ever with earnings of SEK 299 M (262), which
equates to 29 per cent (26) of operational earnings for
the year.
Profit before tax in 2018 amounted to SEK 922 M (896),
an increase of 3 per cent. The second quarter reported
the highest percentage increase on the previous year, at
15 per cent. The first quarter decreased by 20 per cent
while the third and fourth increased by 13 and 6 per cent
on last year respectively.
Capital employed
increased by SEK 761 M
(740), totalling SEK 5,272
M (4,511). Acquisitions
have increased capital
employed by approxi-
mately SEK 540 M.
The equity/assets ratio
amounted to 24.1 per
cent (23.9). Over the past
five years, the equity/
assets ratio has been
25.4 per cent (26.6) on
average.
Return on capital employed amounted to 20.5 per
cent (23.4). Over the past five years, return on capital
employed has been 25.3 per cent (24.7) on average. The
target for return on capital employed is at least 17.0 per
cent.
Return on equity fell mar-
ginally during the year to
total 26.5 per cent (27.0).
Over the past five years,
return on equity has been
27.1 per cent (25.2) on
average. The target for
return on equity is at least
18.0 per cent.
The ratio of net debt to EBITDA increased on last year,
mainly attributable to aquisitions and was 1.3 times
(1.0). Over the past five years, the ratio of net debt to
EBITDA has been 0.7 times (0.5) on average. The target
is for this ratio not to exceed 2.0 times in the long term.
Net turnover, SEK M
Operational earnings, SEK M
Profit before tax, SEK M
Capital employed, SEK M
Equity/assets ratio, %
Return on equity, % Net debt/EBITDA, times
Return on capital employed, %
0
3,000
6,000
9,000
14 15 16 17 18Q 1
14 15 16 17 18Q 2
14 15 16 17 18Q 3
14 15 16 17 18Q 4
0
75
150
225
300
14 15 16 17 18Q 1
14 15 16 17 18Q 2
14 15 16 17 18Q 3
14 15 16 17 18Q 4
0
100
200
300
400
14 15 16 17 18Q 1
14 15 16 17 18Q 2
14 15 16 17 18Q 3
14 15 16 17 18Q 4
14 15 16 17 18–0.5
0.0
0.5
1.0
1.5
14 15 16 17 180
2,000
4,000
6,000
14 15 16 17 18 0
10
20
30
40
14 15 16 17 180
10
20
30
40
14 15 16 17 180
10
20
30
40
BILIA ANNUAL REPORT 2018 109
Definitions and Performance Measures
Definitions and Performance Measures
110 BILIA ANNUAL REPORT 2018
Acquisition-related costs and value adjustments Pertains to
costs for legal consultants and other external costs associ-
ated directly with an acquisition, as well as value adjustments
regarding acquired inventory assets, which are depreciated
during the asset’s turnover time.
Adjusted turnover Net turnover is adjusted for operations that
have been acquired or disposed of during the year. Adjustment
is also made for exchange rate differences and for calendar
effect.
Amortisation of surplus values Occurs in connection with acqui-
sitions of operations and is recognised under intangible assets.
Normally these surplus values are amortised over a 10-year
period.
Average number of employees Paid hours worked in relation to
normal annual working hours worked in each country.
Capital employed Balance sheet total less non-interest-bearing
current liabilities and provisions as well as deferred tax liability.
Comparable operations Financial information and quantities
that are adjusted for operations that have been acquired or
disposed of during the year.
Deliveries Cars that have been physically turned over to the cus-
tomer and invoiced and are included in reported net turnover.
Dividend yield Dividend in relation to the average share price
during the year.
EBITDA Operational earnings plus total depreciation/amortisa-
tion less amortisation of surplus values and depreciation of
leased vehicles with repurchase agreements.
EBITDAJ EBITDA reduced by acquisition-related costs and value
adjustments.
EBITDAJ/net interest income/expense EBITDAJ in relation to the
net of financial income plus dividends received from associated
companies and financial expenses.
Equity/assets ratio Equity in relation to balance sheet total.
Gain from sale of operation Difference between purchase
consideration and the operation’s consolidated carrying
amount, less selling costs.
Growth Increase or decrease of net turnover in relation to the
preceding year.
Liquidity Unutilised credit with the banks, Nordea and DNB, plus
cash and cash equivalents.
Net debt Net debt consists of interest-bearing liabilities less
cash and cash equivalents, interest-bearing current and long-
term receivables, interests in associated companies and leased
vehicles, long-term.
Performance measures that include interest-bearing liabilities
are calculated excluding the effect of transaction costs and
premium calculated according to the effective interest method.
Operating cash flow Cash flow from operating activities plus
investments in and disposals of intangible assets and property,
plant and equipment.
Operating margin Operating profit in relation to net turnover.
Operational earnings Operating profit, excluding revenues and
costs that affect comparability between accounting periods
and/or operating segments. They include, but are not limited to,
acquisition-related expenses, value adjustments, restructurings
and amortisation of surplus values.
Operational margin Operational earnings in relation to net
turnover.
Order backlog New cars ordered by the customer but not yet
delivered.
Payout ratio Dividend in relation to profit for the year.
Price/Earnings ratio Share price at year-end in relation to
earnings per share.
Price/equity ratio Share price at year-end in relation to equity
per share.
Return on capital employed Operating profit plus interest
expense included in the business and financial income in rela-
tion to average capital employed (see definition above).
Return on equity Net profit for the year in relation to avarage
equity.
Structural costs Costs that significantly alter the thrust and/
or scope of the operation. Examples of structural costs may
be costs for reducing the number of employees and costs for
vacating a leased facility before expiration of the lease.
Tax The division of untaxed reserves into deferred tax liability
and retained earnings has been done on the basis of a tax rate
of 21.4 per cent.
The ratio of net debt to EBITDA Net debt in relation to EBITDA.
Underlying values Values that are adjusted for operations that
have been acquired or disposed of during the year. Adjustment
is made for exchange rate differences, where applicable.
Value added Operational earnings plus payroll expenses,
including payroll overheads.
Information on AGM
Annual General Meeting, 8 April 2019The AGM of Bilia AB will be held on Tuesday 8 April 2019,
at 2 p.m. at the IVA Konferenscenter, Grev Ture gatan 16,
Stockholm. To be entitled to participate in the Annual General
Meeting, shareholders must:
• be registered in the share register on Tuesday 2 April 2019
• have notified Bilia of their intention to participate, not later
than Tuesday 2 April 2019.
NotificationShareholders wishing to participate in the AGM can notify Bilia:
• by telephone at +46 10 497 73 04 (or +46 10 497 70 00)
weekdays between the hours of 10 a.m. and 4 p.m.
• by mail to Bilia AB, Box 9003, SE-400 91 Gothenburg, Sweden
• at Bilia’s website www.bilia.com. NOTE! only individuals.
The following particulars must be stated:
• name
• personal or corporate identity number
• address and telephone number
Nominee-registered sharesBilia’s share register is kept by Euroclear Sweden AB. Only
holdings registered in their owners’ names are entered in this
register.
Shareholders whose shares have been registered to a nomi-
nee must arrange for their shares to be temporarily re-regis-
tered in their own name in order to be able to participate in the
AGM. These shareholders should ask the bank or stockbroker
that holds their shares in trust (the nominee) to temporarily
re- register them (voting right registration) in good time prior to
2 April 2019. Nominees usually charge a fee for this service.
Proxies and assistantsA shareholder who is not personally present at the AGM may
exercise his or her right through a proxy, who must have a writ-
ten power of attorney signed by the shareholder. The power
of attorney may not have a period of validity of more than five
years. A shareholder or a proxy may not bring more than two
assistants to the AGM. If the shareholder wishes to bring an
assistant, the company must be notified of this by the date
indicated above under the heading “Notification”.
DividendThe Board of Directors proposes to the AGM that of the earn-
ings available for distribution, SEK 4.75 per share (4.50) be paid
in dividend to the shareholders, for a total of SEK 480 M (454).
Board of DirectorsThe Nominating Committee has announced that they intend
to propose re-election of the following members: Ingrid Jonas-
son Blank, Gunnar Blomkvist, Anna Engebretsen, Jack Fors-
gren, Mats Holgerson, Nicklas Paulson, Jan Pettersson, Mats
Qviberg and Jon Risfeldt. The Nominating Committee propose
new election of Eva Eriksson as a member of the board. Laila
Freivalds has declined re-election. The Nominating Commit-
tee’s proposal is available at bilia.com.
Buy-back of shares in BiliaThe Board of Directors proposes that the AGM authorise the
Board of Bilia to buy back its own shares and to resolve that
such acquired own shares may be transferred. The purpose
of the authorisation, which will be valid until the AGM in 2020,
is to give the Board greater freedom in its work with the com-
pany’s capital structure and to make it possible, if deemed ap-
propriate, to acquire enterprises using the company’s shares
as payment. Acquisition of own shares may not exceed 1/10th
of the number of issued shares in the company. Transfer of
own shares shall not exceed the number acquired at the time
of the transfer and shall be made possible by departure from
the shareholders’ pre-emption rights by sale via the stock ex-
change or in conjunction with the acquisition of an enterprise,
whereby non-cash payment shall be possible.
For complete information on the AGM, see the convening
notice, which was issued at the end of February 2019.
Information on Annual General Meeting
BILIA ANNUAL REPORT 2018 111
Articles of Association
Articles of Association
112 BILIA ANNUAL REPORT 2018
Article 1 Name of the company The name of the company is Bilia AB. The company is a public company (publ).
Article 2 Registered officeThe company’s Board of Directors has its registered office in Gothenburg, Västra Götaland County.
Article 3 Object of the companyThe object of the company is – directly or via subsidiaries – to• carry on trade and distribution activities with regard to means of
transport• carry on manufacture, trade and distribution in other product
areas as well• carry on sales of service and spare parts associated with the
products• manage real and movable estate, including shares• carry on financing activities (except that the company shall not
carry on such activities as are referred to in Banking Business Act, and that activities subject to the provisions of the Act on Credit Market Companies may only be carried on in subsidiaries), and
• carry on other activities consistent with the above types of business.
Article 4 Share capitalThe company’s share capital shall be no less than two hundred million kronor (SEK 200,000,000) and no more than eight hundred million kronor (SEK 800,000,000).
Shares may be issued in two series: series A and series B. If shares of more than one series are issued, each of the series may be issued to an amount equivalent to no more than ninety-nine hundredths of the total share capital. In voting at a General Meet-ing of Shareholders, series A shares confer one vote and series B shares one-tenth of a vote. Otherwise the shares are equal to each other.
In conjunction with a new issue of shares or an issue of warrants or convertibles for cash payment, the shareholders have a prefer-ential right to subscribe for new shares in proportion to their stake in the company’s share capital.
Article 5 Number of sharesThe number of shares shall be no less than ninety million (90,000,000) and no more than three hundred sixty million
(360,000,000).
Article 6 Board membersThe Board of Directors shall consist of at least seven and at most
ten members.
Article 7 AuditorsThe company shall have one or two auditors and at most an equal
number of deputy auditors or one or two registered public account-
ing firms.
Article 8 Location for General Meeting of ShareholdersThe General Meeting of Shareholders shall be held at one of
the following locations as determined by the Board of Directors:
Stockholm, Solna, Gothenburg or Malmö.
Article 9 Notice convening a General Meeting of ShareholdersNotice to attend a General Meeting shall be given by advertise-
ment in Post- och Inrikes Tidningar (the official Swedish gazette)
and on the company’s website. At the same time as notice conven-
ing the meeting is given, the company shall advertise in Dagens
Industri that such notice has been given.
Article 10 Shareholders’ right to attend a General Meeting of ShareholdersShareholders wishing to participate in the proceedings at a General
Meeting of Shareholders shall a) be listed in a printout or other
presentation of the whole share register referred to in Chapter 7,
Section 28, paragraph 3 of the Swedish Companies Act (2005:551)
representing the situation five weekdays prior to the General
Meeting, and b) notify the company by not later the date stipulated
in the notice convening the meeting. The latter date may not be
a Sunday or other public holiday, a Saturday, Midsummer’s Eve,
Christmas Eve or New Year’s Eve and may not fall earlier than the
fifth weekday prior to the meeting.
Article 11 Shareholder’s assistantAn assistant may accompany the shareholder at the General Meet-
ing if the shareholder has given notice to this effect in the manner
stipulated in the preceding paragraph.
Article 12 Presence of outsider at General Meeting of ShareholdersSomeone who is not a shareholder in the company may be entitled,
under terms determined by the Board of Directors, to attend or other-
wise follow the proceedings at the General Meeting of Shareholders.
Article 13 Annual General MeetingThe following matters shall be dealt with at the Annual General
Meeting:
1. Election of Chairman of the meeting;
2. Preparation and approval of the voting list;
3. Approval of the agenda;
4. Election of one or two persons to verify the minutes;
5. Determination of whether the meeting has been duly con-
vened;
6. Presentation of the annual report and the audit report as well
as the consolidated accounts and the audit report on the
consolidated accounts;
7. Resolutions concerning
a) adoption of the Income Statement and the Balance Sheet
as well as the Consolidated Statement of Comprehensive In-
come and the Consolidated Statement of Financial Position,
b) appropriations of the company’s profit or loss according to
the adopted Balance Sheet,
c) discharge of the members of the Board of Directors and the
Managing Director from liability;
8. Determination of the number of members of the Board of
Directors as well as auditor and deputy auditor or public
accounting firm (at meeting when auditor is elected);
9. Determination of fees to be paid to the Board of Directors and,
where applicable, auditors;
10. Election of Board of Directors as well as auditor and deputy
auditor or registered public accounting firm (at meeting when
auditor is elected).
Other matters incumbent upon the General Meeting under the
Companies Act or the Articles of Association.
Article 14 Financial yearThe company’s financial year shall be the calendar year.
Article 15 CSD clauseThe company’s shares shall be registered in a Central Securities
Depository (CSD) register pursuant to the Financial Instruments Ac-
counts Act (1998:1479).
Adopted at Annual General Meeting, 19 April 2017.

BILIA ANNUAL REPORT 2018 113
PRODUCTION: NEWSROOM
Bilia is one of Europe’s largest car chains with a leading position within service and sales of cars, transport vehicles and supplementary services as financing and insurance. Bilia has 134 facilities in Sweden,
Norway, Germany, Luxembourg and Belgium and two internet based
auction sites, one in Sweden and one in Norway.
Bilia’s business concept is to offer servicing, car sales and related
services that bring our customers lasting value and simplicity in
car ownership – in short, a better experience for our customers.
Available around the clock: Bilia Nu +46771-400 000
bilia.com
Recommended