Introduction Data Mining Methods Density-based anomaly Commute Time Approach Addressing Scalability Anomalies in Complex Data Evaluating Anomaly Detection Methods Applications Problem solutions
Anomaly Detection A TutorialTheory and Applications
Sanjay Chawla1 Varun Chandola2
1School of Information TechnologiesUniversity of Sydney
NSW Australiachawlaitusydeduau
2Computational Sciences and Engineering DivisionOak Ridge National Laboratory
Oak Ridge TN USAchandolavornlgov
December 14 2011
Chawla and Chandola Anomaly Detection
Introduction Data Mining Methods Density-based anomaly Commute Time Approach Addressing Scalability Anomalies in Complex Data Evaluating Anomaly Detection Methods Applications Problem solutionsOutline Anomaly Detection - Overview Definition Statistical Methods Anomaly Detection with Mahalanobis Distance Mahalanobis vs Euclidean Distance
Tutorial Outline
Introduction and Overview
Theory Statistical Methods Distance and Density Based Methods Addressing Scalability Anomalies in Complex Data Evaluation Methods
Applications Network Intrusion Detection Fraud Detection Epidemiological Studies Climate and Weather Data Analysis
Chawla and Chandola Anomaly Detection
Introduction Data Mining Methods Density-based anomaly Commute Time Approach Addressing Scalability Anomalies in Complex Data Evaluating Anomaly Detection Methods Applications Problem solutionsOutline Anomaly Detection - Overview Definition Statistical Methods Anomaly Detection with Mahalanobis Distance Mahalanobis vs Euclidean Distance
Anomaly Detection - Overview
In Data Mining anomaly or outlier detection is one of thefour tasks
Classification Clustering Pattern Mining Anomaly Detection
Historically detection of anomalies has led to the discovery ofnew theories Famous examples include
El Nino and Southern Oscillation Index (SOI) The discovery of the planet Neptune The use of fluoride in toothpaste
Anomalies often lead to ldquosurpriserdquo - a form of inferenceknown as abduction (different from induction and deduction)
Chawla and Chandola Anomaly Detection
Introduction Data Mining Methods Density-based anomaly Commute Time Approach Addressing Scalability Anomalies in Complex Data Evaluating Anomaly Detection Methods Applications Problem solutionsOutline Anomaly Detection - Overview Definition Statistical Methods Anomaly Detection with Mahalanobis Distance Mahalanobis vs Euclidean Distance
Definition
Hawkins ldquoan outlier is an observation which deviates somuch from other observations as to arouse suspicions that itwas generated by a different mechanismrdquo [15]
0 10 20 30 40 50 60 700
10
20
30
40
50
60
70
dimension 1
dim
en
sio
n 2
p1
p2
p3
p4
Chawla and Chandola Anomaly Detection
Introduction Data Mining Methods Density-based anomaly Commute Time Approach Addressing Scalability Anomalies in Complex Data Evaluating Anomaly Detection Methods Applications Problem solutionsOutline Anomaly Detection - Overview Definition Statistical Methods Anomaly Detection with Mahalanobis Distance Mahalanobis vs Euclidean Distance
Statistical Methods
Lets begin with the univariate Normal distribution
f(x) =1
(2πσ2)12
eminus[(xminusmicro)σ]22
Notice exponent measures square of deviation from mean andnormalized by standard deviation(
xminus microσ
)2
= (xminus micro)(σ2)minus1(xminus micro)
For d dimension the exponent is called (square of)Mahalanobis distance
(xminus micro)primeΣminus1(xminus micro)
where Σ is the dtimes d variance-covariance matrix
Chawla and Chandola Anomaly Detection
Introduction Data Mining Methods Density-based anomaly Commute Time Approach Addressing Scalability Anomalies in Complex Data Evaluating Anomaly Detection Methods Applications Problem solutionsOutline Anomaly Detection - Overview Definition Statistical Methods Anomaly Detection with Mahalanobis Distance Mahalanobis vs Euclidean Distance
Anomaly Detection with Mahalanobis Distance
The key observation is that if data x follows a d dimensionalGaussian distribution then
(xminus micro)primeΣminus1(xminus micro) asymp χ2d
Anomalies can be found in the tail of the distribution
There are three major weaknesses of the above approach Data may not follow a Normal distribution or be a mixture of
distributions Both mean and variance of χ2 is d For high-dimensional data
this is a problem Mean and thus variance are extremely sensitive to outliers -and
we are using them to find anomalies - often leads to falsenegatives
Chawla and Chandola Anomaly Detection
Introduction Data Mining Methods Density-based anomaly Commute Time Approach Addressing Scalability Anomalies in Complex Data Evaluating Anomaly Detection Methods Applications Problem solutionsOutline Anomaly Detection - Overview Definition Statistical Methods Anomaly Detection with Mahalanobis Distance Mahalanobis vs Euclidean Distance
Mahalanobis vs Euclidean Distance
Mahalanobis normalizes for variance
minus10 minus5 0 5 10minus10
minus8
minus6
minus4
minus2
0
2
4
6
8
10
14
61
16
29
Point Pairs Mahalanobis Euclidean
(1429) 507 1178
(1661) 483 684
Chawla and Chandola Anomaly Detection
Introduction Data Mining Methods Density-based anomaly Commute Time Approach Addressing Scalability Anomalies in Complex Data Evaluating Anomaly Detection Methods Applications Problem solutionsDistance-based anomalies DB(pD) outlier Distance-based methods (DB(kN) Pruning rule Examples of pruning technique Strengths and weaknesses - Distance-based techniques
Distance-based anomalies
Intuition A data point which is far away from its nearestneighbors is a candidate anomaly
Several definitions which capture the above intuition
DB(pD) anomaly [20] an object o in a data set T is aDB(pD) anomaly if at least a fraction p of objects in T havedistances greater than D from o
Generalizes the notion of ldquothree standard deviation from themeanrdquo
This definition had a huge influence on subsequentdevelopment in outlier detection
Chawla and Chandola Anomaly Detection
Introduction Data Mining Methods Density-based anomaly Commute Time Approach Addressing Scalability Anomalies in Complex Data Evaluating Anomaly Detection Methods Applications Problem solutionsDistance-based anomalies DB(pD) outlier Distance-based methods (DB(kN) Pruning rule Examples of pruning technique Strengths and weaknesses - Distance-based techniques
DB(pD) outlier
To build some intuition consider data generated from theNormal distribution N(0 1) Then if O is a DB(pD) outlier
1
(2π)12
int O+D
OminusDeminus
x2
2 dx le 1minus p
Example If O is 3 (3 standard deviations away from themean) then it is a DB(01 0999) outlier
Thus for particular settings of D and p DB(pD) capturesstandard outliers
But much more general (eg any distance metric)
Chawla and Chandola Anomaly Detection
Introduction Data Mining Methods Density-based anomaly Commute Time Approach Addressing Scalability Anomalies in Complex Data Evaluating Anomaly Detection Methods Applications Problem solutionsDistance-based anomalies DB(pD) outlier Distance-based methods (DB(kN) Pruning rule Examples of pruning technique Strengths and weaknesses - Distance-based techniques
Distance-based methods (DB(kN)
DB(kN) anomaly [28] top N data instances whosedistances to its k-th nearest neighbor are largest
Several advantages Ranking for anomalies is more intuitiveSetting of parameters generally easier
A Simple Nested Loop (SNL) algorithm can be used to selectthe top N DB(kN) outliers Time complexity is O(n2d)where n is the database size and d is the dimensionality
Chawla and Chandola Anomaly Detection
Introduction Data Mining Methods Density-based anomaly Commute Time Approach Addressing Scalability Anomalies in Complex Data Evaluating Anomaly Detection Methods Applications Problem solutionsDistance-based anomalies DB(pD) outlier Distance-based methods (DB(kN) Pruning rule Examples of pruning technique Strengths and weaknesses - Distance-based techniques
Pruning rule
DB(kN) anomaly [3] a data instance is not an anomaly ifits distance to its k-th current nearest neighbor is less thanthe score of the weakest anomaly among top N anomaliesfound so far
A large number of non-anomalies can be pruned withoutcarrying out a full data search
Complexity nearly O(n)
Chawla and Chandola Anomaly Detection
Introduction Data Mining Methods Density-based anomaly Commute Time Approach Addressing Scalability Anomalies in Complex Data Evaluating Anomaly Detection Methods Applications Problem solutionsDistance-based anomalies DB(pD) outlier Distance-based methods (DB(kN) Pruning rule Examples of pruning technique Strengths and weaknesses - Distance-based techniques
Examples of pruning technique
Non-anomalies are pruned earlier
Chawla and Chandola Anomaly Detection
Introduction Data Mining Methods Density-based anomaly Commute Time Approach Addressing Scalability Anomalies in Complex Data Evaluating Anomaly Detection Methods Applications Problem solutionsDistance-based anomalies DB(pD) outlier Distance-based methods (DB(kN) Pruning rule Examples of pruning technique Strengths and weaknesses - Distance-based techniques
Strengths and weaknesses - Distance-based techniques
Do not make any assumption about the distribution of thedata
Scalable for large dataset (O(n))
Capable of finding only global anomalies
Can lead to non-intuitive results in Top-k situations
0 10 20 30 40 50 60 700
10
20
30
40
50
60
70
dimension 1
dim
en
sio
n 2
p1
p2
p3
p4
Chawla and Chandola Anomaly Detection
Introduction Data Mining Methods Density-based anomaly Commute Time Approach Addressing Scalability Anomalies in Complex Data Evaluating Anomaly Detection Methods Applications Problem solutionsDensity-based anomaly Strengths and Weaknesses
Density-based anomaly
Calculate the density of an object based on the density of itsk nearest neighbours
density(p) = 1
sum
qisinNk(p)distk(p q)
|Nk(p)|
relative-density(p) =
density(p)1
|Nk(p)|sum
qisinNk(p)density(q)
anomaly-score(p) =1
relative-density(p)
LOF indicates a degree of local outlier-ness [6]
Chawla and Chandola Anomaly Detection
Introduction Data Mining Methods Density-based anomaly Commute Time Approach Addressing Scalability Anomalies in Complex Data Evaluating Anomaly Detection Methods Applications Problem solutionsDensity-based anomaly Strengths and Weaknesses
Strengths and Weaknesses
Can detect global and local anomalies
Cannot use pruning technique and has a complexity of O(n2)
Require a method combining the strengths of distance anddensity based approaches A distance based approach whichcan capture density
C
C
O
O1
1
2
2
Chawla and Chandola Anomaly Detection
Introduction Data Mining Methods Density-based anomaly Commute Time Approach Addressing Scalability Anomalies in Complex Data Evaluating Anomaly Detection Methods Applications Problem solutionsCommute time Computation of commute time Anomaly detection using commute time (CDOF) Fast estimation of commute time Scalability for Density-based method PINN Algorithm (ICDM 2010) PINN Guarantee Examples high-dim distance-based outliers Examples high-dim density-based outliers Examples local density-based outliers
Commute time
Commute time between i and j is the expected number ofsteps that a random walk starting at i will take to reach jonce and go back to i for the first time
Commute time can capture both the distance between pointsand the data densities
Chawla and Chandola Anomaly Detection
Introduction Data Mining Methods Density-based anomaly Commute Time Approach Addressing Scalability Anomalies in Complex Data Evaluating Anomaly Detection Methods Applications Problem solutionsCommute time Computation of commute time Anomaly detection using commute time (CDOF) Fast estimation of commute time Scalability for Density-based method PINN Algorithm (ICDM 2010) PINN Guarantee Examples high-dim distance-based outliers Examples high-dim density-based outliers Examples local density-based outliers
Computation of commute time
Commute time can be computed using graph Laplacian matrixL
cij = VG(ei minus ej)TL+(ei minus ej)L+ pseudo-inverse of LVG graph volumeei i-th column of the identity matrix
Commute time is Euclidean distance in the space spanned byeigenvectors of L
cij = VG[(Sminus12V T )(ei minus ej)]T [(Sminus12V T )(ei minus ej)]
V S eigenvectors and eigenvalues of L
Chawla and Chandola Anomaly Detection
Introduction Data Mining Methods Density-based anomaly Commute Time Approach Addressing Scalability Anomalies in Complex Data Evaluating Anomaly Detection Methods Applications Problem solutionsCommute time Computation of commute time Anomaly detection using commute time (CDOF) Fast estimation of commute time Scalability for Density-based method PINN Algorithm (ICDM 2010) PINN Guarantee Examples high-dim distance-based outliers Examples high-dim density-based outliers Examples local density-based outliers
Anomaly detection using commute time (CDOF)
Construct the mutual k nearest neighbor graph G from thedataset
Compute the Laplacian matrix L of G and its eigensystems
Find top N anomalies using the distance-based technique incommute time with pruning rule
Complexity O(n3)
Commute time method can detect global local and groupanomalies
Chawla and Chandola Anomaly Detection
Introduction Data Mining Methods Density-based anomaly Commute Time Approach Addressing Scalability Anomalies in Complex Data Evaluating Anomaly Detection Methods Applications Problem solutionsCommute time Computation of commute time Anomaly detection using commute time (CDOF) Fast estimation of commute time Scalability for Density-based method PINN Algorithm (ICDM 2010) PINN Guarantee Examples high-dim distance-based outliers Examples high-dim density-based outliers Examples local density-based outliers
Fast estimation of commute time
Speilman and Srivastava [31] combined random projection anda linear time solver to build a structure where we can computethe compute time between two nodes in O(log n) time
Complexity of CDOF O(n3)rarr O(n log n)
Uses a near linear time solver for a linear system of equationAx = b
Spielman and Teng solvers Also see work by Iannis Koutisfrom CMU
Chawla and Chandola Anomaly Detection
Introduction Data Mining Methods Density-based anomaly Commute Time Approach Addressing Scalability Anomalies in Complex Data Evaluating Anomaly Detection Methods Applications Problem solutionsCommute time Computation of commute time Anomaly detection using commute time (CDOF) Fast estimation of commute time Scalability for Density-based method PINN Algorithm (ICDM 2010) PINN Guarantee Examples high-dim distance-based outliers Examples high-dim density-based outliers Examples local density-based outliers
Scalability for Density-based method
The pruning rule for Distance-based methods does not applyto Density-based approaches
We can go from O(n2) to nearly O(n log n) by using an index
One solution for the curse of high dimensionality is to use ofrandom projections
Chawla and Chandola Anomaly Detection
Introduction Data Mining Methods Density-based anomaly Commute Time Approach Addressing Scalability Anomalies in Complex Data Evaluating Anomaly Detection Methods Applications Problem solutionsCommute time Computation of commute time Anomaly detection using commute time (CDOF) Fast estimation of commute time Scalability for Density-based method PINN Algorithm (ICDM 2010) PINN Guarantee Examples high-dim distance-based outliers Examples high-dim density-based outliers Examples local density-based outliers
PINN Algorithm (ICDM 2010)
Chawla and Chandola Anomaly Detection
Introduction Data Mining Methods Density-based anomaly Commute Time Approach Addressing Scalability Anomalies in Complex Data Evaluating Anomaly Detection Methods Applications Problem solutionsCommute time Computation of commute time Anomaly detection using commute time (CDOF) Fast estimation of commute time Scalability for Density-based method PINN Algorithm (ICDM 2010) PINN Guarantee Examples high-dim distance-based outliers Examples high-dim density-based outliers Examples local density-based outliers
PINN Guarantee
The PINN Algorithm provides probabilistic guarantees
Under certain assumptions about intrinsic dimensionality (c)with high probability
1minus ε1 + ε
middot LOF (p) le LOF (p) le 1 + ε
1minus ε middot LOF (p)
In practice we do not know the intrinsic dimensionality ofdata However random projections are quite robust
Chawla and Chandola Anomaly Detection
Introduction Data Mining Methods Density-based anomaly Commute Time Approach Addressing Scalability Anomalies in Complex Data Evaluating Anomaly Detection Methods Applications Problem solutionsCommute time Computation of commute time Anomaly detection using commute time (CDOF) Fast estimation of commute time Scalability for Density-based method PINN Algorithm (ICDM 2010) PINN Guarantee Examples high-dim distance-based outliers Examples high-dim density-based outliers Examples local density-based outliers
Examples high-dim distance-based outliers
On a large database of images the bright images show up asdistance based outliers
Chawla and Chandola Anomaly Detection
Introduction Data Mining Methods Density-based anomaly Commute Time Approach Addressing Scalability Anomalies in Complex Data Evaluating Anomaly Detection Methods Applications Problem solutionsCommute time Computation of commute time Anomaly detection using commute time (CDOF) Fast estimation of commute time Scalability for Density-based method PINN Algorithm (ICDM 2010) PINN Guarantee Examples high-dim distance-based outliers Examples high-dim density-based outliers Examples local density-based outliers
Examples high-dim density-based outliers
On a large database of images occluded images show up asdensity based outliers
Chawla and Chandola Anomaly Detection
Introduction Data Mining Methods Density-based anomaly Commute Time Approach Addressing Scalability Anomalies in Complex Data Evaluating Anomaly Detection Methods Applications Problem solutionsCommute time Computation of commute time Anomaly detection using commute time (CDOF) Fast estimation of commute time Scalability for Density-based method PINN Algorithm (ICDM 2010) PINN Guarantee Examples high-dim distance-based outliers Examples high-dim density-based outliers Examples local density-based outliers
Examples local density-based outliers
Examples of images ranked by LOF
Chawla and Chandola Anomaly Detection
Introduction Data Mining Methods Density-based anomaly Commute Time Approach Addressing Scalability Anomalies in Complex Data Evaluating Anomaly Detection Methods Applications Problem solutions
Addressing Scalability
Chawla and Chandola Anomaly Detection
Introduction Data Mining Methods Density-based anomaly Commute Time Approach Addressing Scalability Anomalies in Complex Data Evaluating Anomaly Detection Methods Applications Problem solutions
Using GPUs for Anomaly Detection
Well suited for data parallel algorithms Using CUDA - Compute Unified Device
Architecture (Nvidia)
Need to re-engineer existing algorithms Utilization of device memory Minimize CPUhArrGPU transfer of data Keep threads homogeneous
Most model based algorithms arenaturally setup for the testing phase
Model building needs careful redesign
What about unsupervised algorithms
Kernel
Host
Grid
Device
Block(00)
Block(01)
Block(02)
Block(10)
Block(11)
Block(12)
Thread Block
Thread(00)
Thread(01)
Thread(02)
Thread(03)
Thread(10)
Thread(11)
Thread(12)
Thread(13)
Thread(20)
Thread(21)
Thread(22)
Thread(23)
Host Host Memory
SM 2
SM 1
SM 0
Registers Registers Registers
SP 0 SP 1 SP 7
Shared Memory
Global Memory
Texture Memory
Constant Memory
Device
Chawla and Chandola Anomaly Detection
Introduction Data Mining Methods Density-based anomaly Commute Time Approach Addressing Scalability Anomalies in Complex Data Evaluating Anomaly Detection Methods Applications Problem solutions
Implementing DB(kN) on GPUs
Return top N data instances whose distances tok-th nearest neighbor are largest (SerialDB(kN) is O(n2))
Involves computing pairwise distances
Load block i and block j to shared memory Data layout in memory should be optimized
Each thread computes distance between a pairof instances
Can utilize this time to load next chunk of datafrom host to device memory
Writes results to corresponding output block
Sorting can be done efficiently in CUDA [29]
d
n
T
n
n
Chawla and Chandola Anomaly Detection
Introduction Data Mining Methods Density-based anomaly Commute Time Approach Addressing Scalability Anomalies in Complex Data Evaluating Anomaly Detection Methods Applications Problem solutionsCategorical Data Discrete Sequences and Time Series Contextual Anomalies Collective Anomalies
Moving Beyond Multi-dimensional Record Data
Categorical (Mixed)
Fraud Detection
Cyber Networks
Time Series
Sensor Networks
Healthcare
Discrete Sequences
Genomic
System Calls
Spatial
GIS
Image analysis
Spatio-temporal
Remote sensing
Climate
Graphs
Social networks
Epidemiology
Chawla and Chandola Anomaly Detection
Introduction Data Mining Methods Density-based anomaly Commute Time Approach Addressing Scalability Anomalies in Complex Data Evaluating Anomaly Detection Methods Applications Problem solutionsCategorical Data Discrete Sequences and Time Series Contextual Anomalies Collective Anomalies
Handling Categorical Data
Each attribute can belong to one of many categories
No ordering between categories
Mixed data (categorical and continuous attributes)
cap-shape cap-surface middot middot middot habitat type
convex smooth urban poisonousconvex smooth grasses ediblebell smooth meadows edibleconvex scaly urban poisonousconvex smooth grasses ediblemiddot middot middot
Table Mushroom Data Set [2]
Chawla and Chandola Anomaly Detection
Introduction Data Mining Methods Density-based anomaly Commute Time Approach Addressing Scalability Anomalies in Complex Data Evaluating Anomaly Detection Methods Applications Problem solutionsCategorical Data Discrete Sequences and Time Series Contextual Anomalies Collective Anomalies
Approaches to Identify Categorical Anomalies
Using Association Analysis [24]
Binarize data
Learn rules (X rArr Y ) Choose high confidence
rules (P (Y |X))
For test record Z = 〈XY 〉find rules of the formP (Y |X)
Y is not observed whenX is observed
Using Bayesian Networks [33]
Learn Bayesian networkstructure and parameters
Compute P (Z) for test datarecord Z
Flag anomaly if P (Z) lt δ
Using Similarity Metrics [10]
Use a similarity measure (S(X1 X2))
Apply distancedensityclustering based method (eg lof)
Chawla and Chandola Anomaly Detection
Introduction Data Mining Methods Density-based anomaly Commute Time Approach Addressing Scalability Anomalies in Complex Data Evaluating Anomaly Detection Methods Applications Problem solutionsCategorical Data Discrete Sequences and Time Series Contextual Anomalies Collective Anomalies
Conditional Probability Test [18]
Identify unusual combinations of attribute values
r(at bt) =P (at bt)
P (at)P (bt)
A capB = φ Assumption If r(at bt) is low and is observed in test record t
then t is anomalous For a test record t
For each mutually exclusive pair of attribute sets ABcompute r(at bt)
Score t based on all r-values Assign minimum r-value as score Take product of all r-values
Need to compare exponential pairs of subsets Only consider subsets upto size k Ignore subsets with frequency less than a threshold α Avoid comparing independent subsets of attributes
micro(AB) ge βmicroChawla and Chandola Anomaly Detection
Introduction Data Mining Methods Density-based anomaly Commute Time Approach Addressing Scalability Anomalies in Complex Data Evaluating Anomaly Detection Methods Applications Problem solutionsCategorical Data Discrete Sequences and Time Series Contextual Anomalies Collective Anomalies
Estimating Probabilities for CPT [18]
Maximum LikelihoodEstimation
P (at bt)
P (at)P (bt)=C(at bt)
Ntimes N
C(at)times N
C(bt)
C(at) Number of traininginstances with A = at
N Total number of traininginstances
Laplace Smoothing
E(p) =C(p) + 1
N + 2
r(at bt) =E(at bt)
E(at)times E(bt)
Speedup Tricks
Replace rare attributevalues with genericattribute (reduce arity)
Use efficient datastructure to querying forcounts(AD Trees [26])
ADTrees work fasterfor low arity attributes
Chawla and Chandola Anomaly Detection
Introduction Data Mining Methods Density-based anomaly Commute Time Approach Addressing Scalability Anomalies in Complex Data Evaluating Anomaly Detection Methods Applications Problem solutionsCategorical Data Discrete Sequences and Time Series Contextual Anomalies Collective Anomalies
Finding Anomalies in Discrete Sequences
Many problem formulations
1 Anomalous symbols in asequence
2 Anomalous subsequence in asequence
3 Anomalous sequence in adatabase of sequences
See [11] for a comparativeevaluation [9] for a survey
login pwdmail ssh mail web logoutlogin pwdmail web web web web logoutlogin pwdmail ssh mail web web logoutlogin pwdwebmail ssh webmail logoutloginpwd loginpwd loginpwd logout
Chawla and Chandola Anomaly Detection
Introduction Data Mining Methods Density-based anomaly Commute Time Approach Addressing Scalability Anomalies in Complex Data Evaluating Anomaly Detection Methods Applications Problem solutionsCategorical Data Discrete Sequences and Time Series Contextual Anomalies Collective Anomalies
Treating Sequences as Points
Utilize a distancesimilarity measure Plug into a distancedensityclustering based method
Simplest Hamming Distance
h(Ai Bi) = 1 Ai 6= Bi= 0 Ai = Bi
H(AB) =nsumi=1
h(Ai Bi)
Issues Unequal lengths misalignment Normalized Length of Longest Common Subsequence
D(AB) = 1minus |LCS(AB)|radic|A||B|
Standard Dynamic Programming method is slow Faster versions available (Hunt Szymnaski method [7])
Weaknesses Cannot localize anomalies within a sequence Weak anomaly signals might get lost
Chawla and Chandola Anomaly Detection
Introduction Data Mining Methods Density-based anomaly Commute Time Approach Addressing Scalability Anomalies in Complex Data Evaluating Anomaly Detection Methods Applications Problem solutionsCategorical Data Discrete Sequences and Time Series Contextual Anomalies Collective Anomalies
Using Sliding Windows
Slide a window of size k
Extract all windows from a sequence (nminus k + 1)
Training (Creating a normal dictionary) Store all uniquewindows in all normal sequences and their counts
Testing For each window find the frequency in normal dictionary Anomaly score is inverse of the aggregate frequencies for all
windows (normalized by length)
Many variants exist For each window find the hamming distance to the closest
window in the normal dictionary [16]
Issues Penalizes low frequency windows in the normal dictionary Rewards high frequency windows that might not be relevant Can construct anomalous sequences that will escape detection
Chawla and Chandola Anomaly Detection
Introduction Data Mining Methods Density-based anomaly Commute Time Approach Addressing Scalability Anomalies in Complex Data Evaluating Anomaly Detection Methods Applications Problem solutionsCategorical Data Discrete Sequences and Time Series Contextual Anomalies Collective Anomalies
Using Probabilistic Models
Probability of occurrence of sequence S
P (S) =nprodi=1
P (Si|S1 Siminus1)
Short memory property of sequences
P (Si|S1 Siminus1) = P (Si|Siminusk Siminus1)
Conditional probability estimates for a symbol Si
P (Si|Siminusk Siminus1) =f(Si|Siminusk Si)f(Si|Siminusk Siminus1)
f is estimated from the normal dictionary
Anomaly score for a test sequence is inverse of the normalizedprobability of occurrence
Issues What if the suffix occurs very infrequently in thenormal data (or not at all)
Replace with the longest suffix that occurs sufficient number oftimes [32] - Probabilistic Suffix Trees
Significantly reduces the size of the modelChawla and Chandola Anomaly Detection
Introduction Data Mining Methods Density-based anomaly Commute Time Approach Addressing Scalability Anomalies in Complex Data Evaluating Anomaly Detection Methods Applications Problem solutionsCategorical Data Discrete Sequences and Time Series Contextual Anomalies Collective Anomalies
Finding Contextual Anomalies
Sometimes contextual information isavailable about data
Not used directly as a feature Are well understood no anomalies in
the context Can reduce false positives and yield
interesting anomalies
Example adapted from [30]
Clearest Outlier
Conditional Anomaly
Maximum Daily Temperature
Number
ofFever
Cases
Contextual anomalies - Anomalous with respect to a context Context is defined using environmental variables
Spatial (Latitude Longitude) Graph context (Edges Weights) Temporal location Domain specific (Demographic other)
How to incorporate context Reduce to traditional anomaly detection (subset on context) Explicitly model contextual information (time series spatial)
Chawla and Chandola Anomaly Detection
Introduction Data Mining Methods Density-based anomaly Commute Time Approach Addressing Scalability Anomalies in Complex Data Evaluating Anomaly Detection Methods Applications Problem solutionsCategorical Data Discrete Sequences and Time Series Contextual Anomalies Collective Anomalies
Conditional Anomaly Detection
Data instance d rArru1 u2 udU v1 v2 vdV
dU environmentalattributes
dV indicator attributes u1
u2
U1
U2
U3
v1
v2
V1V2
V3
p(V1|U3) = 02
p(V2|U3) = 02
p(V3|U3) = 06
Algorithm [30]
1 Learn a Gaussian Mixture Model (GMM)U = U1 U2 UnU
each with dimensionality dU2 Learn a set of Gaussians U = V1 V2 VnV
each withdimensionality dV
3 Learn a probabilistic mapping function p(Vj |Ui)4 Score a test instance d = [uv]
S =
nUsumi=1
p(u|Ui)nVsumj=1
p(v|Vj)p(Vj |Ui)
Chawla and Chandola Anomaly Detection
Introduction Data Mining Methods Density-based anomaly Commute Time Approach Addressing Scalability Anomalies in Complex Data Evaluating Anomaly Detection Methods Applications Problem solutionsCategorical Data Discrete Sequences and Time Series Contextual Anomalies Collective Anomalies
Finding Collective Anomalies
Find a collection of data points
Each point by itself is normal
The collection as a whole isanomalous
Relevant when data has inherentstructure and
When domain definition ofanomalies cannot be described aspoint anomalies
A Simple Solution
1 Break data intogroups
2 Compute features foreach group
3 Apply traditionalanomaly detection
Examples
1 Time series
2 Image
3 Spatial clusters ofgalaxies
Chawla and Chandola Anomaly Detection
Introduction Data Mining Methods Density-based anomaly Commute Time Approach Addressing Scalability Anomalies in Complex Data Evaluating Anomaly Detection Methods Applications Problem solutionsCategorical Data Discrete Sequences and Time Series Contextual Anomalies Collective Anomalies
Using Latent Dirichlet Allocation for Group Anomalies
Find anomalous groups in data [34]
Example Spatial clusters of galaxies topics red green emissive words continuous features
Flexible Genre Model (FGM)
For each group
1 Draw a genre 1 2 T 3 ym simM(π)2 Draw topic distribution forym SK 3 θm sim Dir(αym)
3 Draw K topicsβmk sim P (βmk|ηk)k=12K
4 For each point in group
1 Draw topic membershipzmn simM(θn)
2 Generate pointxmn isin P (xmn|βmzmn)
α
zmn
xmn
N
θm
T
π
ηK
ym
β
MK
Model Parameters
M(π) -Multinomial
Genre - Dir(αt)
Topic generatorsP (|ηk)- GIW
Point generatorsP (xmn|βnk) -MultivariateGaussian
Chawla and Chandola Anomaly Detection
Introduction Data Mining Methods Density-based anomaly Commute Time Approach Addressing Scalability Anomalies in Complex Data Evaluating Anomaly Detection Methods Applications Problem solutionsCategorical Data Discrete Sequences and Time Series Contextual Anomalies Collective Anomalies
Inference and Testing for FGM
Inference and Learning Parameters
Approximate inference of latentvariables (Gibbs Sampling)
Use samples to learn parameters(Single step Monte Carlo EM)
Topic 1
Topic 2
Topic 3
Anomaly Detection
Infer the topic distribution θm
Compute negative log likelihood wrt αt
Rationale An anomalous group will be unlikely to begenerated from any genre
Geometric interpretation Mapping each group into a Tdimensional space and finding anomalies
Chawla and Chandola Anomaly Detection
Introduction Data Mining Methods Density-based anomaly Commute Time Approach Addressing Scalability Anomalies in Complex Data Evaluating Anomaly Detection Methods Applications Problem solutions
Evaluating Anomaly Detection Methods - Labels
Labeled validation data set exists Confusion matrix Traditional evaluation metrics
Class imbalance
ROC Curve
Validation set does not exist Use domain expertise to find TP
and FP FN is harder to estimate
Pseudo false negativeestimation techniques [25]
Predicteda n
Actuala TP FNn FP TN
Acc =TP + TNsum
Rec (R) =TP
TP + FN
Prec (P ) =TP
TP + FP
F =2 lowastR lowast PR+ P
Chawla and Chandola Anomaly Detection
Introduction Data Mining Methods Density-based anomaly Commute Time Approach Addressing Scalability Anomalies in Complex Data Evaluating Anomaly Detection Methods Applications Problem solutions
Evaluating Anomaly Detection Methods - Scores
Convert to binary output Use threshold δ on score (Scale
issues [21]) Take top x as anomalies
ROC curve by varying x or δ
Quality of output Does the output ldquosuggestrdquo x or δ Which output is better
Chawla and Chandola Anomaly Detection
Introduction Data Mining Methods Density-based anomaly Commute Time Approach Addressing Scalability Anomalies in Complex Data Evaluating Anomaly Detection Methods Applications Problem solutions
Unifying Scores
Different methods assign scores in differentranges
kNN-based scores [0 1] Lof scores [1 6] ABOD scores [0 80000]
Anomalies have lower scores
Direct scaling to [0 1] might lose distinctionbetween normal and anomalies
Desired scaling Stretch interesting rangesand shrink irrelevant ones
Generalized Procedure for Normalizing Outlier Scores [21] Regularity rArr S(o) ge 0forallo S(o) asymp 0 if o is normal andS(o) 0 if o is anomalous
Normality S is regular and S(o) isin [0 1]forallo
Chawla and Chandola Anomaly Detection
Introduction Data Mining Methods Density-based anomaly Commute Time Approach Addressing Scalability Anomalies in Complex Data Evaluating Anomaly Detection Methods Applications Problem solutions
Regularization and Normalization of Scores
Regularization
1 R(o) = max0 S(o)minus baseS2 R(o) = Smax minus S(o)
3 R(o) = minus log SmaxS(o)
Normalization
1 N(o) = S(o)Smax
2 N(o) = max(
0 erf(S(o)minusmicroSσS radic2
))(Gaussian Scaling)
Suited for high dimensional data
3 N(o) = max(
0cdfγS (o)minusmicroγ
1minusmicroγ
)(Gamma Scaling)
Where cdfγS (o) = P (k S(o) θ) P is the regularized Gamma function Suited for low dimensional data
Chawla and Chandola Anomaly Detection
Introduction Data Mining Methods Density-based anomaly Commute Time Approach Addressing Scalability Anomalies in Complex Data Evaluating Anomaly Detection Methods Applications Problem solutions
Generating Labeled Data for Validation
Generating Both Normal and Anomalous Data
Use generative models for normal and anomalous behavior
Several generators available Multivariate continuous data [27] Multivariate categorical data [5] Discrete sequences using HMM [12]
Drawbacks Might not capture the domain characteristics
Injecting Anomalies - Random Perturbation[30]
Given data point z = xy x and y arepartitions of feature space
Take a random sample D of the entire data set
Let zprime = xprimeyprime isin D such that distancebetween y and yprime is maximum
Replace x with xprime and add z back to data setx
yz
zprime
Injected anomaly
Chawla and Chandola Anomaly Detection
Introduction Data Mining Methods Density-based anomaly Commute Time Approach Addressing Scalability Anomalies in Complex Data Evaluating Anomaly Detection Methods Applications Problem solutionsWhat is Network Anomaly Detection Motivation How Much Serious
Applications Overview
How to set up an anomaly detection solution for agiven application domain
Available data Define anomalies define normal behavior Identify requirements and constraints (online
real-time limited resources) What domain knowledge available
Feature identification Defining normal and anomalous behavior Tuning parameters
Available ground truth (training validation)
Chawla and Chandola Anomaly Detection
Introduction Data Mining Methods Density-based anomaly Commute Time Approach Addressing Scalability Anomalies in Complex Data Evaluating Anomaly Detection Methods Applications Problem solutionsWhat is Network Anomaly Detection Motivation How Much Serious
What is Network Anomaly Detection
Anomaly Detection or Intrusion Detection
Traditional Intrusion Detection Systems (IDS) finding attackscorresponding to predefined pattern data set known as signaturestherefore system is absolutely vulnerable against zero-day attacks
Network Anomaly Detection Systems (NADS) to detectzero-day attacks without any pre-identified signature besides profilenormal behavior of the network and address suspected incidents
Network Anomaly Detection finding unusual and largechanges in the network traffic
Examples intentional attacks (eg Distributed Denial ofService - DDoS) or unusual network traffic (eg flash crowds)
Chawla and Chandola Anomaly Detection
Introduction Data Mining Methods Density-based anomaly Commute Time Approach Addressing Scalability Anomalies in Complex Data Evaluating Anomaly Detection Methods Applications Problem solutionsWhat is Network Anomaly Detection Motivation How Much Serious
Motivation How Much Serious
According to Symantec report released in early 2011 morethan 286 million new threats have been detected in 2010which is a huge number
1656227
2704836
1000000
1500000
2000000
2500000
3000000
20547 18827 69107 113025 140690
624267
1656227
2704836
0
500000
1000000
1500000
2000000
2500000
3000000
2002 2003 2004 2005 2006 2007 2008 July2009-June2010
Chawla and Chandola Anomaly Detection
Introduction Data Mining Methods Density-based anomaly Commute Time Approach Addressing Scalability Anomalies in Complex Data Evaluating Anomaly Detection Methods Applications Problem solutionsNetwork Topology Network Anomalies Detection Problem Network Anomalies Detection Problem Why care about OD Flows
Network Topology
A Typical network
1 y
Router
2
3
41t
x2t
x1t
x3t
x4t
Origin-Destination (OD) flow is the traffic that enters at anorigin node and exits at a destination node of a backbonenetwork x1t x1t
Link measurement is the traffic enters at an node during aninterval y1t
Relationship between link traffic and OD flow traffic iscaptured by the routing matrix A
Chawla and Chandola Anomaly Detection
Introduction Data Mining Methods Density-based anomaly Commute Time Approach Addressing Scalability Anomalies in Complex Data Evaluating Anomaly Detection Methods Applications Problem solutionsNetwork Topology Network Anomalies Detection Problem Network Anomalies Detection Problem Why care about OD Flows
Network Anomalies Detection Problem
Chawla and Chandola Anomaly Detection
Introduction Data Mining Methods Density-based anomaly Commute Time Approach Addressing Scalability Anomalies in Complex Data Evaluating Anomaly Detection Methods Applications Problem solutionsNetwork Topology Network Anomalies Detection Problem Network Anomalies Detection Problem Why care about OD Flows
Why care about OD Flows
Volume anomaly typically arises on an OD flow (trafficarriving at one node and destined for another node)
If we only monitor traffic on network links volume arisingfrom an OD flow may not be noticeable Thus naiveapproach wont work if OD flow info is not available
Figure source [22]
Chawla and Chandola Anomaly Detection
Introduction Data Mining Methods Density-based anomaly Commute Time Approach Addressing Scalability Anomalies in Complex Data Evaluating Anomaly Detection Methods Applications Problem solutionsPCA and Subspace Method Subspace Method Algorithm Subspace Analysis Results Discussion Typical Characteristics of Anomaly Limitation of Volume Entropy Based versus Volume Based Fraud Detection Epidemeology Anomaly Detection in Climate and Weather Anomalies in Climate Validation of Anomalies
PCA and Subspace Method
Chawla and Chandola Anomaly Detection
Introduction Data Mining Methods Density-based anomaly Commute Time Approach Addressing Scalability Anomalies in Complex Data Evaluating Anomaly Detection Methods Applications Problem solutionsPCA and Subspace Method Subspace Method Algorithm Subspace Analysis Results Discussion Typical Characteristics of Anomaly Limitation of Volume Entropy Based versus Volume Based Fraud Detection Epidemeology Anomaly Detection in Climate and Weather Anomalies in Climate Validation of Anomalies
Subspace Method Algorithm
Step1- Determine the PCs based on eigenvaluedecomposition of the covariance matrix of the dataset
Step2- Choose first top k principle components with thehighest eigenvalues as matrix P
Step3-normal traffic subspace called Z
Z = PP TZ = CZ
Step4-abnormal traffic subspace called Z
Z = (I minus PP T )Z = CZ
Step5-If the norm of a vector is large then it is an rdquoanomalyrdquo
Chawla and Chandola Anomaly Detection
Introduction Data Mining Methods Density-based anomaly Commute Time Approach Addressing Scalability Anomalies in Complex Data Evaluating Anomaly Detection Methods Applications Problem solutionsPCA and Subspace Method Subspace Method Algorithm Subspace Analysis Results Discussion Typical Characteristics of Anomaly Limitation of Volume Entropy Based versus Volume Based Fraud Detection Epidemeology Anomaly Detection in Climate and Weather Anomalies in Climate Validation of Anomalies
Subspace Analysis Results
Note that during anomaly normal component does not changethat much while residual component changes quite a lot
Thus anomalies can be detected by setting some threshold
Figure source [22]
Chawla and Chandola Anomaly Detection
Introduction Data Mining Methods Density-based anomaly Commute Time Approach Addressing Scalability Anomalies in Complex Data Evaluating Anomaly Detection Methods Applications Problem solutionsPCA and Subspace Method Subspace Method Algorithm Subspace Analysis Results Discussion Typical Characteristics of Anomaly Limitation of Volume Entropy Based versus Volume Based Fraud Detection Epidemeology Anomaly Detection in Climate and Weather Anomalies in Climate Validation of Anomalies
Discussion Typical Characteristics of Anomaly
Most Anomalies induce a change in distributionalaspects of packet header fields (called features)
Most important features include 5-tuple Source ampdestination IP addresses Source and destination portnumbers and IP protocol
raquo DOS attack ndash multiple source IP address concentrated on asingle destination IP address
raquo Network scan ndash dispersed distribution of destination addresses
raquo Most wormsviruses also induce some change in distribution ofcertain features
raquo However these changes can be very subtle and mining them islike searching for needles in a haystack
Unlike many previous approach this paper aims todetect events which disturb the distribution of trafficfeatures rather than traffic volume
Chawla and Chandola Anomaly Detection
Introduction Data Mining Methods Density-based anomaly Commute Time Approach Addressing Scalability Anomalies in Complex Data Evaluating Anomaly Detection Methods Applications Problem solutionsPCA and Subspace Method Subspace Method Algorithm Subspace Analysis Results Discussion Typical Characteristics of Anomaly Limitation of Volume Entropy Based versus Volume Based Fraud Detection Epidemeology Anomaly Detection in Climate and Weather Anomalies in Climate Validation of Anomalies
Limitation of Volume
Figure source [22]
Port scan anomaly (traffic feature changes however traffic volume
remains more or less the same)
We can use entropy tocapture the variationsin the traffic feature
bullTakes value 0 when distribution is maximally concentratedbullTakes value log2N when distribution is maximally dispersed
But stands out in
feature entropy
which also reveals
its structure
Port scan
dwarfed
in volume
metricshellip
Chawla and Chandola Anomaly Detection
Introduction Data Mining Methods Density-based anomaly Commute Time Approach Addressing Scalability Anomalies in Complex Data Evaluating Anomaly Detection Methods Applications Problem solutionsPCA and Subspace Method Subspace Method Algorithm Subspace Analysis Results Discussion Typical Characteristics of Anomaly Limitation of Volume Entropy Based versus Volume Based Fraud Detection Epidemeology Anomaly Detection in Climate and Weather Anomalies in Climate Validation of Anomalies
Entropy Based versus Volume Based
DoSDDoS Attacks- a spike in traffic data toward adominant destination IP
Scan anomaly-a spike in traffic data from a dominant sourceIP
Flash Crowd anomaly- again a spike in traffic data to adominant destination IP
Worm anomaly-a Spike in traffic with a dominant port
Chawla and Chandola Anomaly Detection
Introduction Data Mining Methods Density-based anomaly Commute Time Approach Addressing Scalability Anomalies in Complex Data Evaluating Anomaly Detection Methods Applications Problem solutionsPCA and Subspace Method Subspace Method Algorithm Subspace Analysis Results Discussion Typical Characteristics of Anomaly Limitation of Volume Entropy Based versus Volume Based Fraud Detection Epidemeology Anomaly Detection in Climate and Weather Anomalies in Climate Validation of Anomalies
Fraud Detection
Domain Question Identifyfraudulent activities or players fromobserved transaction data
Data Transactions between different
players in the system Meta information about the
individuals An underlying graph structure
Challenges Track and model human behavior Anomalies caused by adaptive
human adversaries Massive data sizes
Insurance (autohealtha)
ClaimantProvider Payer
Telecommunications Customer
Provider
Credit Cards Customer
Supplier Bank
Web Advertising User Advertiser
Publisher
ahttpwwwcheatingculturecompast-cases-of-medicare-fraud
Chawla and Chandola Anomaly Detection
Introduction Data Mining Methods Density-based anomaly Commute Time Approach Addressing Scalability Anomalies in Complex Data Evaluating Anomaly Detection Methods Applications Problem solutionsPCA and Subspace Method Subspace Method Algorithm Subspace Analysis Results Discussion Typical Characteristics of Anomaly Limitation of Volume Entropy Based versus Volume Based Fraud Detection Epidemeology Anomaly Detection in Climate and Weather Anomalies in Climate Validation of Anomalies
A Generic Fraud Detection Method
Activity Monitoring [13]1 Build profiles for individuals (customers users etc) based on
historic data User X makes n calls on an average in January
2 Compare current behavior with historical profile for significantdeviations
Clustering based [4]1 Cluster historical profiles of customers2 Identify small clusters or outlying profiles as anomalies
Strengths Anomaly detection is fast (good for real time) Results are easy to explain
Weaknesses Need to create and maintain a large number of profiles Not dynamic Adequate historical data might not be available Too many false positives
Chawla and Chandola Anomaly Detection
Introduction Data Mining Methods Density-based anomaly Commute Time Approach Addressing Scalability Anomalies in Complex Data Evaluating Anomaly Detection Methods Applications Problem solutionsPCA and Subspace Method Subspace Method Algorithm Subspace Analysis Results Discussion Typical Characteristics of Anomaly Limitation of Volume Entropy Based versus Volume Based Fraud Detection Epidemeology Anomaly Detection in Climate and Weather Anomalies in Climate Validation of Anomalies
Exploiting Graph Structure - Weighted Graphs
Represent data as a weighted graph Communication networks (phone email SMS) Provider referral networks
Objective Identify anomalous nodes
For each node extract several features based on the propertiesof the induced sub-graph (egonet) of neighboring nodes [1]
Choose features that can highlight anomalous nodes
1 Ni degree of node2 Ei number of edges in egonet3 Wi total weight of egonet4 λi principal eigen vector of weighted adjacency matrix of
egonet
Data is transformed into a point in a multi-dimensional space
Chawla and Chandola Anomaly Detection
Introduction Data Mining Methods Density-based anomaly Commute Time Approach Addressing Scalability Anomalies in Complex Data Evaluating Anomaly Detection Methods Applications Problem solutionsPCA and Subspace Method Subspace Method Algorithm Subspace Analysis Results Discussion Typical Characteristics of Anomaly Limitation of Volume Entropy Based versus Volume Based Fraud Detection Epidemeology Anomaly Detection in Climate and Weather Anomalies in Climate Validation of Anomalies
Identifying Anomalies
Traditional anomaly detection (lof) Can be slow but can identify any type of anomalous structure
Faster method to identify specific types of anomalousstructures
Identify relevant feature pairs and power law relationship
Eg Egonet Density Power Law Ni vs Ei - detect nearcliques and stars
Ei prop Nαi 1 le α le 2
Anomaly score for node i wrt a pair of features (y = Cxθ)
Si =max(yi Cx
θi )
min(yi Cxθi )lowast log (|yi minus Cxθi |+ 1)
Chawla and Chandola Anomaly Detection
Introduction Data Mining Methods Density-based anomaly Commute Time Approach Addressing Scalability Anomalies in Complex Data Evaluating Anomaly Detection Methods Applications Problem solutionsPCA and Subspace Method Subspace Method Algorithm Subspace Analysis Results Discussion Typical Characteristics of Anomaly Limitation of Volume Entropy Based versus Volume Based Fraud Detection Epidemeology Anomaly Detection in Climate and Weather Anomalies in Climate Validation of Anomalies
Exploiting Graph Structure - Bipartite Graphs
Represent data as a bipartite graph Healthcare Data (Beneficiaries vs Providers) Insider trading (Traders vs Stocks)
Objective Identify anomalous links
Given a query node a isin V1 find the ldquorelevancerdquoof all other nodes in V1 to a
RelevanceScore(a b) prop Number of times aldquorandom walkrdquo from a reaches b
Use the relevance scores to compute thenormality scores for a node t isin V2
Find set St = a|〈a t〉 isin E Compute |St| times |St| similarity matrix using
relevance vectors for a isin St Normality Score = mean of non-diagonal entries
of similarity matrix
V1 E V2a1
a2
a3
an
t1
t2
t3
tn
Chawla and Chandola Anomaly Detection
Introduction Data Mining Methods Density-based anomaly Commute Time Approach Addressing Scalability Anomalies in Complex Data Evaluating Anomaly Detection Methods Applications Problem solutionsPCA and Subspace Method Subspace Method Algorithm Subspace Analysis Results Discussion Typical Characteristics of Anomaly Limitation of Volume Entropy Based versus Volume Based Fraud Detection Epidemeology Anomaly Detection in Climate and Weather Anomalies in Climate Validation of Anomalies
Detecting Disease Outbreaks
Domain Question Early detection of disease
outbreaks Anthrax attack
Data Emergency department visits Grocery data (Example [14]) Clinical visits Weatherclimate data
Challenges Weak signals in the data
ED cases involving cough rArrFlu or SARS
Integration of multiple signals(lag analysis)
Account for spatial and temporalcorrelations
Chawla and Chandola Anomaly Detection
Introduction Data Mining Methods Density-based anomaly Commute Time Approach Addressing Scalability Anomalies in Complex Data Evaluating Anomaly Detection Methods Applications Problem solutionsPCA and Subspace Method Subspace Method Algorithm Subspace Analysis Results Discussion Typical Characteristics of Anomaly Limitation of Volume Entropy Based versus Volume Based Fraud Detection Epidemeology Anomaly Detection in Climate and Weather Anomalies in Climate Validation of Anomalies
Whatrsquos Significant About Recent Events (WSARE) [33]
1 Learn Bayesian network from historical data Environmental and response variables
2 Sample from the BN (DBbaseline|Current Environment)3 Compute contingency table for rules for DBbaseline andDBcurrent
Rules are single assignment rules (Xi = Y ji ) or conjunctions4 Find p-value for rules using χ2-test
Null Hypothesis Rows and columns of tables for DBbaselineand DBcurrent are independent
5 Find rule with largest p-value Repeat Step 2
Chawla and Chandola Anomaly Detection
Introduction Data Mining Methods Density-based anomaly Commute Time Approach Addressing Scalability Anomalies in Complex Data Evaluating Anomaly Detection Methods Applications Problem solutionsPCA and Subspace Method Subspace Method Algorithm Subspace Analysis Results Discussion Typical Characteristics of Anomaly Limitation of Volume Entropy Based versus Volume Based Fraud Detection Epidemeology Anomaly Detection in Climate and Weather Anomalies in Climate Validation of Anomalies
Incorporating Spatial and Temporal Relationships
WSARE does not explicitly model the spatial and temporalrelationships
What happened yesterday What happened in the adjoining neighborhood (yesterday)
Bayesian Network Spatio-Temporal (BNST) modelingframework [17]
Add nodes for temporal and spatial dependencies Need more data to train
Chawla and Chandola Anomaly Detection
Introduction Data Mining Methods Density-based anomaly Commute Time Approach Addressing Scalability Anomalies in Complex Data Evaluating Anomaly Detection Methods Applications Problem solutionsPCA and Subspace Method Subspace Method Algorithm Subspace Analysis Results Discussion Typical Characteristics of Anomaly Limitation of Volume Entropy Based versus Volume Based Fraud Detection Epidemeology Anomaly Detection in Climate and Weather Anomalies in Climate Validation of Anomalies
Anomaly Detection in Climate and Weather
Science Questions Identify natural and anthropogenic disasters Identify long time scale events - droughts atmospheric rivers
cold fronts etc
Data Ground observations Remote sensing data (satellites
air-borne) Climate model simulation outputs Multiple variables spatio-temporal (often has height dimension
as well)
Challenges Model spatio-temporal relationships across multiple variables Explain the cause of anomalies Massive data sizes
Climate and weather extreme events are well defined
Key challenge is to find significant events and explain the cause
Chawla and Chandola Anomaly Detection
Introduction Data Mining Methods Density-based anomaly Commute Time Approach Addressing Scalability Anomalies in Complex Data Evaluating Anomaly Detection Methods Applications Problem solutionsPCA and Subspace Method Subspace Method Algorithm Subspace Analysis Results Discussion Typical Characteristics of Anomaly Limitation of Volume Entropy Based versus Volume Based Fraud Detection Epidemeology Anomaly Detection in Climate and Weather Anomalies in Climate Validation of Anomalies
Anomalies are Widely Used in Climate
Most analysis done on ldquoanomalyrdquo time series
Difference from a ldquobase periodrdquo (Toosimplistic)
Brings spatial smoothness (eg a mountaintop and nearby valley can have very differenttemperatures) Removes seasonality
Understand climate and weatherphenomenon
Southern Oscillation Index (SOI) Difference between Sea Level Pressure
(SLP) anomalies for Tahiti and DarwinAustralia
Figure Global AverageTemperature Anomaly(1975 - 2007) Srcwwwmetofficegovuk
Chawla and Chandola Anomaly Detection
Introduction Data Mining Methods Density-based anomaly Commute Time Approach Addressing Scalability Anomalies in Complex Data Evaluating Anomaly Detection Methods Applications Problem solutionsPCA and Subspace Method Subspace Method Algorithm Subspace Analysis Results Discussion Typical Characteristics of Anomaly Limitation of Volume Entropy Based versus Volume Based Fraud Detection Epidemeology Anomaly Detection in Climate and Weather Anomalies in Climate Validation of Anomalies
Constructing Anomalies from Raw Data
Anomaly time series for a given location i
vprimei = vi minus bi
where bi is the base (reference)
How to choose bi Mean of all data for location i Monthly mean values (account for seasonality) Monthly z-score values Median (more robust) Using a shorter ldquoreference periodrdquo
30 year moving window
Different methods show statistically significant differences[19] What is the right strategy Weighted mean of different strategies (Pick weights using
Monte Carlo sampling)
Chawla and Chandola Anomaly Detection
Introduction Data Mining Methods Density-based anomaly Commute Time Approach Addressing Scalability Anomalies in Complex Data Evaluating Anomaly Detection Methods Applications Problem solutionsPCA and Subspace Method Subspace Method Algorithm Subspace Analysis Results Discussion Typical Characteristics of Anomaly Limitation of Volume Entropy Based versus Volume Based Fraud Detection Epidemeology Anomaly Detection in Climate and Weather Anomalies in Climate Validation of Anomalies
Anomaly Detection for Identifying Droughts
Science question Identify significant drought patterns usinghistorical observation data or future simulation data or both
Find persistent spatiotemporal anomalies in precipitation data
A two step approach
1 Find precipitationanomalies usingthresholds
2 Find large connectedcomponents across spaceand time
Matlab - bwlabelbwlabeln
Followup Science questionExplain cause
(drought190120061avi)
Figure Video courtsey Dr ArindamBanerjee
Chawla and Chandola Anomaly Detection
Introduction Data Mining Methods Density-based anomaly Commute Time Approach Addressing Scalability Anomalies in Complex Data Evaluating Anomaly Detection Methods Applications Problem solutionsOutline Anomaly Detection - Overview Definition Statistical Methods Anomaly Detection with Mahalanobis Distance Mahalanobis vs Euclidean Distance
Anomaly Detection - Overview
In Data Mining anomaly or outlier detection is one of thefour tasks
Classification Clustering Pattern Mining Anomaly Detection
Historically detection of anomalies has led to the discovery ofnew theories Famous examples include
El Nino and Southern Oscillation Index (SOI) The discovery of the planet Neptune The use of fluoride in toothpaste
Anomalies often lead to ldquosurpriserdquo - a form of inferenceknown as abduction (different from induction and deduction)
Chawla and Chandola Anomaly Detection
Introduction Data Mining Methods Density-based anomaly Commute Time Approach Addressing Scalability Anomalies in Complex Data Evaluating Anomaly Detection Methods Applications Problem solutionsOutline Anomaly Detection - Overview Definition Statistical Methods Anomaly Detection with Mahalanobis Distance Mahalanobis vs Euclidean Distance
Definition
Hawkins ldquoan outlier is an observation which deviates somuch from other observations as to arouse suspicions that itwas generated by a different mechanismrdquo [15]
0 10 20 30 40 50 60 700
10
20
30
40
50
60
70
dimension 1
dim
en
sio
n 2
p1
p2
p3
p4
Chawla and Chandola Anomaly Detection
Introduction Data Mining Methods Density-based anomaly Commute Time Approach Addressing Scalability Anomalies in Complex Data Evaluating Anomaly Detection Methods Applications Problem solutionsOutline Anomaly Detection - Overview Definition Statistical Methods Anomaly Detection with Mahalanobis Distance Mahalanobis vs Euclidean Distance
Statistical Methods
Lets begin with the univariate Normal distribution
f(x) =1
(2πσ2)12
eminus[(xminusmicro)σ]22
Notice exponent measures square of deviation from mean andnormalized by standard deviation(
xminus microσ
)2
= (xminus micro)(σ2)minus1(xminus micro)
For d dimension the exponent is called (square of)Mahalanobis distance
(xminus micro)primeΣminus1(xminus micro)
where Σ is the dtimes d variance-covariance matrix
Chawla and Chandola Anomaly Detection
Introduction Data Mining Methods Density-based anomaly Commute Time Approach Addressing Scalability Anomalies in Complex Data Evaluating Anomaly Detection Methods Applications Problem solutionsOutline Anomaly Detection - Overview Definition Statistical Methods Anomaly Detection with Mahalanobis Distance Mahalanobis vs Euclidean Distance
Anomaly Detection with Mahalanobis Distance
The key observation is that if data x follows a d dimensionalGaussian distribution then
(xminus micro)primeΣminus1(xminus micro) asymp χ2d
Anomalies can be found in the tail of the distribution
There are three major weaknesses of the above approach Data may not follow a Normal distribution or be a mixture of
distributions Both mean and variance of χ2 is d For high-dimensional data
this is a problem Mean and thus variance are extremely sensitive to outliers -and
we are using them to find anomalies - often leads to falsenegatives
Chawla and Chandola Anomaly Detection
Introduction Data Mining Methods Density-based anomaly Commute Time Approach Addressing Scalability Anomalies in Complex Data Evaluating Anomaly Detection Methods Applications Problem solutionsOutline Anomaly Detection - Overview Definition Statistical Methods Anomaly Detection with Mahalanobis Distance Mahalanobis vs Euclidean Distance
Mahalanobis vs Euclidean Distance
Mahalanobis normalizes for variance
minus10 minus5 0 5 10minus10
minus8
minus6
minus4
minus2
0
2
4
6
8
10
14
61
16
29
Point Pairs Mahalanobis Euclidean
(1429) 507 1178
(1661) 483 684
Chawla and Chandola Anomaly Detection
Introduction Data Mining Methods Density-based anomaly Commute Time Approach Addressing Scalability Anomalies in Complex Data Evaluating Anomaly Detection Methods Applications Problem solutionsDistance-based anomalies DB(pD) outlier Distance-based methods (DB(kN) Pruning rule Examples of pruning technique Strengths and weaknesses - Distance-based techniques
Distance-based anomalies
Intuition A data point which is far away from its nearestneighbors is a candidate anomaly
Several definitions which capture the above intuition
DB(pD) anomaly [20] an object o in a data set T is aDB(pD) anomaly if at least a fraction p of objects in T havedistances greater than D from o
Generalizes the notion of ldquothree standard deviation from themeanrdquo
This definition had a huge influence on subsequentdevelopment in outlier detection
Chawla and Chandola Anomaly Detection
Introduction Data Mining Methods Density-based anomaly Commute Time Approach Addressing Scalability Anomalies in Complex Data Evaluating Anomaly Detection Methods Applications Problem solutionsDistance-based anomalies DB(pD) outlier Distance-based methods (DB(kN) Pruning rule Examples of pruning technique Strengths and weaknesses - Distance-based techniques
DB(pD) outlier
To build some intuition consider data generated from theNormal distribution N(0 1) Then if O is a DB(pD) outlier
1
(2π)12
int O+D
OminusDeminus
x2
2 dx le 1minus p
Example If O is 3 (3 standard deviations away from themean) then it is a DB(01 0999) outlier
Thus for particular settings of D and p DB(pD) capturesstandard outliers
But much more general (eg any distance metric)
Chawla and Chandola Anomaly Detection
Introduction Data Mining Methods Density-based anomaly Commute Time Approach Addressing Scalability Anomalies in Complex Data Evaluating Anomaly Detection Methods Applications Problem solutionsDistance-based anomalies DB(pD) outlier Distance-based methods (DB(kN) Pruning rule Examples of pruning technique Strengths and weaknesses - Distance-based techniques
Distance-based methods (DB(kN)
DB(kN) anomaly [28] top N data instances whosedistances to its k-th nearest neighbor are largest
Several advantages Ranking for anomalies is more intuitiveSetting of parameters generally easier
A Simple Nested Loop (SNL) algorithm can be used to selectthe top N DB(kN) outliers Time complexity is O(n2d)where n is the database size and d is the dimensionality
Chawla and Chandola Anomaly Detection
Introduction Data Mining Methods Density-based anomaly Commute Time Approach Addressing Scalability Anomalies in Complex Data Evaluating Anomaly Detection Methods Applications Problem solutionsDistance-based anomalies DB(pD) outlier Distance-based methods (DB(kN) Pruning rule Examples of pruning technique Strengths and weaknesses - Distance-based techniques
Pruning rule
DB(kN) anomaly [3] a data instance is not an anomaly ifits distance to its k-th current nearest neighbor is less thanthe score of the weakest anomaly among top N anomaliesfound so far
A large number of non-anomalies can be pruned withoutcarrying out a full data search
Complexity nearly O(n)
Chawla and Chandola Anomaly Detection
Introduction Data Mining Methods Density-based anomaly Commute Time Approach Addressing Scalability Anomalies in Complex Data Evaluating Anomaly Detection Methods Applications Problem solutionsDistance-based anomalies DB(pD) outlier Distance-based methods (DB(kN) Pruning rule Examples of pruning technique Strengths and weaknesses - Distance-based techniques
Examples of pruning technique
Non-anomalies are pruned earlier
Chawla and Chandola Anomaly Detection
Introduction Data Mining Methods Density-based anomaly Commute Time Approach Addressing Scalability Anomalies in Complex Data Evaluating Anomaly Detection Methods Applications Problem solutionsDistance-based anomalies DB(pD) outlier Distance-based methods (DB(kN) Pruning rule Examples of pruning technique Strengths and weaknesses - Distance-based techniques
Strengths and weaknesses - Distance-based techniques
Do not make any assumption about the distribution of thedata
Scalable for large dataset (O(n))
Capable of finding only global anomalies
Can lead to non-intuitive results in Top-k situations
0 10 20 30 40 50 60 700
10
20
30
40
50
60
70
dimension 1
dim
en
sio
n 2
p1
p2
p3
p4
Chawla and Chandola Anomaly Detection
Introduction Data Mining Methods Density-based anomaly Commute Time Approach Addressing Scalability Anomalies in Complex Data Evaluating Anomaly Detection Methods Applications Problem solutionsDensity-based anomaly Strengths and Weaknesses
Density-based anomaly
Calculate the density of an object based on the density of itsk nearest neighbours
density(p) = 1
sum
qisinNk(p)distk(p q)
|Nk(p)|
relative-density(p) =
density(p)1
|Nk(p)|sum
qisinNk(p)density(q)
anomaly-score(p) =1
relative-density(p)
LOF indicates a degree of local outlier-ness [6]
Chawla and Chandola Anomaly Detection
Introduction Data Mining Methods Density-based anomaly Commute Time Approach Addressing Scalability Anomalies in Complex Data Evaluating Anomaly Detection Methods Applications Problem solutionsDensity-based anomaly Strengths and Weaknesses
Strengths and Weaknesses
Can detect global and local anomalies
Cannot use pruning technique and has a complexity of O(n2)
Require a method combining the strengths of distance anddensity based approaches A distance based approach whichcan capture density
C
C
O
O1
1
2
2
Chawla and Chandola Anomaly Detection
Introduction Data Mining Methods Density-based anomaly Commute Time Approach Addressing Scalability Anomalies in Complex Data Evaluating Anomaly Detection Methods Applications Problem solutionsCommute time Computation of commute time Anomaly detection using commute time (CDOF) Fast estimation of commute time Scalability for Density-based method PINN Algorithm (ICDM 2010) PINN Guarantee Examples high-dim distance-based outliers Examples high-dim density-based outliers Examples local density-based outliers
Commute time
Commute time between i and j is the expected number ofsteps that a random walk starting at i will take to reach jonce and go back to i for the first time
Commute time can capture both the distance between pointsand the data densities
Chawla and Chandola Anomaly Detection
Introduction Data Mining Methods Density-based anomaly Commute Time Approach Addressing Scalability Anomalies in Complex Data Evaluating Anomaly Detection Methods Applications Problem solutionsCommute time Computation of commute time Anomaly detection using commute time (CDOF) Fast estimation of commute time Scalability for Density-based method PINN Algorithm (ICDM 2010) PINN Guarantee Examples high-dim distance-based outliers Examples high-dim density-based outliers Examples local density-based outliers
Computation of commute time
Commute time can be computed using graph Laplacian matrixL
cij = VG(ei minus ej)TL+(ei minus ej)L+ pseudo-inverse of LVG graph volumeei i-th column of the identity matrix
Commute time is Euclidean distance in the space spanned byeigenvectors of L
cij = VG[(Sminus12V T )(ei minus ej)]T [(Sminus12V T )(ei minus ej)]
V S eigenvectors and eigenvalues of L
Chawla and Chandola Anomaly Detection
Introduction Data Mining Methods Density-based anomaly Commute Time Approach Addressing Scalability Anomalies in Complex Data Evaluating Anomaly Detection Methods Applications Problem solutionsCommute time Computation of commute time Anomaly detection using commute time (CDOF) Fast estimation of commute time Scalability for Density-based method PINN Algorithm (ICDM 2010) PINN Guarantee Examples high-dim distance-based outliers Examples high-dim density-based outliers Examples local density-based outliers
Anomaly detection using commute time (CDOF)
Construct the mutual k nearest neighbor graph G from thedataset
Compute the Laplacian matrix L of G and its eigensystems
Find top N anomalies using the distance-based technique incommute time with pruning rule
Complexity O(n3)
Commute time method can detect global local and groupanomalies
Chawla and Chandola Anomaly Detection
Introduction Data Mining Methods Density-based anomaly Commute Time Approach Addressing Scalability Anomalies in Complex Data Evaluating Anomaly Detection Methods Applications Problem solutionsCommute time Computation of commute time Anomaly detection using commute time (CDOF) Fast estimation of commute time Scalability for Density-based method PINN Algorithm (ICDM 2010) PINN Guarantee Examples high-dim distance-based outliers Examples high-dim density-based outliers Examples local density-based outliers
Fast estimation of commute time
Speilman and Srivastava [31] combined random projection anda linear time solver to build a structure where we can computethe compute time between two nodes in O(log n) time
Complexity of CDOF O(n3)rarr O(n log n)
Uses a near linear time solver for a linear system of equationAx = b
Spielman and Teng solvers Also see work by Iannis Koutisfrom CMU
Chawla and Chandola Anomaly Detection
Introduction Data Mining Methods Density-based anomaly Commute Time Approach Addressing Scalability Anomalies in Complex Data Evaluating Anomaly Detection Methods Applications Problem solutionsCommute time Computation of commute time Anomaly detection using commute time (CDOF) Fast estimation of commute time Scalability for Density-based method PINN Algorithm (ICDM 2010) PINN Guarantee Examples high-dim distance-based outliers Examples high-dim density-based outliers Examples local density-based outliers
Scalability for Density-based method
The pruning rule for Distance-based methods does not applyto Density-based approaches
We can go from O(n2) to nearly O(n log n) by using an index
One solution for the curse of high dimensionality is to use ofrandom projections
Chawla and Chandola Anomaly Detection
Introduction Data Mining Methods Density-based anomaly Commute Time Approach Addressing Scalability Anomalies in Complex Data Evaluating Anomaly Detection Methods Applications Problem solutionsCommute time Computation of commute time Anomaly detection using commute time (CDOF) Fast estimation of commute time Scalability for Density-based method PINN Algorithm (ICDM 2010) PINN Guarantee Examples high-dim distance-based outliers Examples high-dim density-based outliers Examples local density-based outliers
PINN Algorithm (ICDM 2010)
Chawla and Chandola Anomaly Detection
Introduction Data Mining Methods Density-based anomaly Commute Time Approach Addressing Scalability Anomalies in Complex Data Evaluating Anomaly Detection Methods Applications Problem solutionsCommute time Computation of commute time Anomaly detection using commute time (CDOF) Fast estimation of commute time Scalability for Density-based method PINN Algorithm (ICDM 2010) PINN Guarantee Examples high-dim distance-based outliers Examples high-dim density-based outliers Examples local density-based outliers
PINN Guarantee
The PINN Algorithm provides probabilistic guarantees
Under certain assumptions about intrinsic dimensionality (c)with high probability
1minus ε1 + ε
middot LOF (p) le LOF (p) le 1 + ε
1minus ε middot LOF (p)
In practice we do not know the intrinsic dimensionality ofdata However random projections are quite robust
Chawla and Chandola Anomaly Detection
Introduction Data Mining Methods Density-based anomaly Commute Time Approach Addressing Scalability Anomalies in Complex Data Evaluating Anomaly Detection Methods Applications Problem solutionsCommute time Computation of commute time Anomaly detection using commute time (CDOF) Fast estimation of commute time Scalability for Density-based method PINN Algorithm (ICDM 2010) PINN Guarantee Examples high-dim distance-based outliers Examples high-dim density-based outliers Examples local density-based outliers
Examples high-dim distance-based outliers
On a large database of images the bright images show up asdistance based outliers
Chawla and Chandola Anomaly Detection
Introduction Data Mining Methods Density-based anomaly Commute Time Approach Addressing Scalability Anomalies in Complex Data Evaluating Anomaly Detection Methods Applications Problem solutionsCommute time Computation of commute time Anomaly detection using commute time (CDOF) Fast estimation of commute time Scalability for Density-based method PINN Algorithm (ICDM 2010) PINN Guarantee Examples high-dim distance-based outliers Examples high-dim density-based outliers Examples local density-based outliers
Examples high-dim density-based outliers
On a large database of images occluded images show up asdensity based outliers
Chawla and Chandola Anomaly Detection
Introduction Data Mining Methods Density-based anomaly Commute Time Approach Addressing Scalability Anomalies in Complex Data Evaluating Anomaly Detection Methods Applications Problem solutionsCommute time Computation of commute time Anomaly detection using commute time (CDOF) Fast estimation of commute time Scalability for Density-based method PINN Algorithm (ICDM 2010) PINN Guarantee Examples high-dim distance-based outliers Examples high-dim density-based outliers Examples local density-based outliers
Examples local density-based outliers
Examples of images ranked by LOF
Chawla and Chandola Anomaly Detection
Introduction Data Mining Methods Density-based anomaly Commute Time Approach Addressing Scalability Anomalies in Complex Data Evaluating Anomaly Detection Methods Applications Problem solutions
Addressing Scalability
Chawla and Chandola Anomaly Detection
Introduction Data Mining Methods Density-based anomaly Commute Time Approach Addressing Scalability Anomalies in Complex Data Evaluating Anomaly Detection Methods Applications Problem solutions
Using GPUs for Anomaly Detection
Well suited for data parallel algorithms Using CUDA - Compute Unified Device
Architecture (Nvidia)
Need to re-engineer existing algorithms Utilization of device memory Minimize CPUhArrGPU transfer of data Keep threads homogeneous
Most model based algorithms arenaturally setup for the testing phase
Model building needs careful redesign
What about unsupervised algorithms
Kernel
Host
Grid
Device
Block(00)
Block(01)
Block(02)
Block(10)
Block(11)
Block(12)
Thread Block
Thread(00)
Thread(01)
Thread(02)
Thread(03)
Thread(10)
Thread(11)
Thread(12)
Thread(13)
Thread(20)
Thread(21)
Thread(22)
Thread(23)
Host Host Memory
SM 2
SM 1
SM 0
Registers Registers Registers
SP 0 SP 1 SP 7
Shared Memory
Global Memory
Texture Memory
Constant Memory
Device
Chawla and Chandola Anomaly Detection
Introduction Data Mining Methods Density-based anomaly Commute Time Approach Addressing Scalability Anomalies in Complex Data Evaluating Anomaly Detection Methods Applications Problem solutions
Implementing DB(kN) on GPUs
Return top N data instances whose distances tok-th nearest neighbor are largest (SerialDB(kN) is O(n2))
Involves computing pairwise distances
Load block i and block j to shared memory Data layout in memory should be optimized
Each thread computes distance between a pairof instances
Can utilize this time to load next chunk of datafrom host to device memory
Writes results to corresponding output block
Sorting can be done efficiently in CUDA [29]
d
n
T
n
n
Chawla and Chandola Anomaly Detection
Introduction Data Mining Methods Density-based anomaly Commute Time Approach Addressing Scalability Anomalies in Complex Data Evaluating Anomaly Detection Methods Applications Problem solutionsCategorical Data Discrete Sequences and Time Series Contextual Anomalies Collective Anomalies
Moving Beyond Multi-dimensional Record Data
Categorical (Mixed)
Fraud Detection
Cyber Networks
Time Series
Sensor Networks
Healthcare
Discrete Sequences
Genomic
System Calls
Spatial
GIS
Image analysis
Spatio-temporal
Remote sensing
Climate
Graphs
Social networks
Epidemiology
Chawla and Chandola Anomaly Detection
Introduction Data Mining Methods Density-based anomaly Commute Time Approach Addressing Scalability Anomalies in Complex Data Evaluating Anomaly Detection Methods Applications Problem solutionsCategorical Data Discrete Sequences and Time Series Contextual Anomalies Collective Anomalies
Handling Categorical Data
Each attribute can belong to one of many categories
No ordering between categories
Mixed data (categorical and continuous attributes)
cap-shape cap-surface middot middot middot habitat type
convex smooth urban poisonousconvex smooth grasses ediblebell smooth meadows edibleconvex scaly urban poisonousconvex smooth grasses ediblemiddot middot middot
Table Mushroom Data Set [2]
Chawla and Chandola Anomaly Detection
Introduction Data Mining Methods Density-based anomaly Commute Time Approach Addressing Scalability Anomalies in Complex Data Evaluating Anomaly Detection Methods Applications Problem solutionsCategorical Data Discrete Sequences and Time Series Contextual Anomalies Collective Anomalies
Approaches to Identify Categorical Anomalies
Using Association Analysis [24]
Binarize data
Learn rules (X rArr Y ) Choose high confidence
rules (P (Y |X))
For test record Z = 〈XY 〉find rules of the formP (Y |X)
Y is not observed whenX is observed
Using Bayesian Networks [33]
Learn Bayesian networkstructure and parameters
Compute P (Z) for test datarecord Z
Flag anomaly if P (Z) lt δ
Using Similarity Metrics [10]
Use a similarity measure (S(X1 X2))
Apply distancedensityclustering based method (eg lof)
Chawla and Chandola Anomaly Detection
Introduction Data Mining Methods Density-based anomaly Commute Time Approach Addressing Scalability Anomalies in Complex Data Evaluating Anomaly Detection Methods Applications Problem solutionsCategorical Data Discrete Sequences and Time Series Contextual Anomalies Collective Anomalies
Conditional Probability Test [18]
Identify unusual combinations of attribute values
r(at bt) =P (at bt)
P (at)P (bt)
A capB = φ Assumption If r(at bt) is low and is observed in test record t
then t is anomalous For a test record t
For each mutually exclusive pair of attribute sets ABcompute r(at bt)
Score t based on all r-values Assign minimum r-value as score Take product of all r-values
Need to compare exponential pairs of subsets Only consider subsets upto size k Ignore subsets with frequency less than a threshold α Avoid comparing independent subsets of attributes
micro(AB) ge βmicroChawla and Chandola Anomaly Detection
Introduction Data Mining Methods Density-based anomaly Commute Time Approach Addressing Scalability Anomalies in Complex Data Evaluating Anomaly Detection Methods Applications Problem solutionsCategorical Data Discrete Sequences and Time Series Contextual Anomalies Collective Anomalies
Estimating Probabilities for CPT [18]
Maximum LikelihoodEstimation
P (at bt)
P (at)P (bt)=C(at bt)
Ntimes N
C(at)times N
C(bt)
C(at) Number of traininginstances with A = at
N Total number of traininginstances
Laplace Smoothing
E(p) =C(p) + 1
N + 2
r(at bt) =E(at bt)
E(at)times E(bt)
Speedup Tricks
Replace rare attributevalues with genericattribute (reduce arity)
Use efficient datastructure to querying forcounts(AD Trees [26])
ADTrees work fasterfor low arity attributes
Chawla and Chandola Anomaly Detection
Introduction Data Mining Methods Density-based anomaly Commute Time Approach Addressing Scalability Anomalies in Complex Data Evaluating Anomaly Detection Methods Applications Problem solutionsCategorical Data Discrete Sequences and Time Series Contextual Anomalies Collective Anomalies
Finding Anomalies in Discrete Sequences
Many problem formulations
1 Anomalous symbols in asequence
2 Anomalous subsequence in asequence
3 Anomalous sequence in adatabase of sequences
See [11] for a comparativeevaluation [9] for a survey
login pwdmail ssh mail web logoutlogin pwdmail web web web web logoutlogin pwdmail ssh mail web web logoutlogin pwdwebmail ssh webmail logoutloginpwd loginpwd loginpwd logout
Chawla and Chandola Anomaly Detection
Introduction Data Mining Methods Density-based anomaly Commute Time Approach Addressing Scalability Anomalies in Complex Data Evaluating Anomaly Detection Methods Applications Problem solutionsCategorical Data Discrete Sequences and Time Series Contextual Anomalies Collective Anomalies
Treating Sequences as Points
Utilize a distancesimilarity measure Plug into a distancedensityclustering based method
Simplest Hamming Distance
h(Ai Bi) = 1 Ai 6= Bi= 0 Ai = Bi
H(AB) =nsumi=1
h(Ai Bi)
Issues Unequal lengths misalignment Normalized Length of Longest Common Subsequence
D(AB) = 1minus |LCS(AB)|radic|A||B|
Standard Dynamic Programming method is slow Faster versions available (Hunt Szymnaski method [7])
Weaknesses Cannot localize anomalies within a sequence Weak anomaly signals might get lost
Chawla and Chandola Anomaly Detection
Introduction Data Mining Methods Density-based anomaly Commute Time Approach Addressing Scalability Anomalies in Complex Data Evaluating Anomaly Detection Methods Applications Problem solutionsCategorical Data Discrete Sequences and Time Series Contextual Anomalies Collective Anomalies
Using Sliding Windows
Slide a window of size k
Extract all windows from a sequence (nminus k + 1)
Training (Creating a normal dictionary) Store all uniquewindows in all normal sequences and their counts
Testing For each window find the frequency in normal dictionary Anomaly score is inverse of the aggregate frequencies for all
windows (normalized by length)
Many variants exist For each window find the hamming distance to the closest
window in the normal dictionary [16]
Issues Penalizes low frequency windows in the normal dictionary Rewards high frequency windows that might not be relevant Can construct anomalous sequences that will escape detection
Chawla and Chandola Anomaly Detection
Introduction Data Mining Methods Density-based anomaly Commute Time Approach Addressing Scalability Anomalies in Complex Data Evaluating Anomaly Detection Methods Applications Problem solutionsCategorical Data Discrete Sequences and Time Series Contextual Anomalies Collective Anomalies
Using Probabilistic Models
Probability of occurrence of sequence S
P (S) =nprodi=1
P (Si|S1 Siminus1)
Short memory property of sequences
P (Si|S1 Siminus1) = P (Si|Siminusk Siminus1)
Conditional probability estimates for a symbol Si
P (Si|Siminusk Siminus1) =f(Si|Siminusk Si)f(Si|Siminusk Siminus1)
f is estimated from the normal dictionary
Anomaly score for a test sequence is inverse of the normalizedprobability of occurrence
Issues What if the suffix occurs very infrequently in thenormal data (or not at all)
Replace with the longest suffix that occurs sufficient number oftimes [32] - Probabilistic Suffix Trees
Significantly reduces the size of the modelChawla and Chandola Anomaly Detection
Introduction Data Mining Methods Density-based anomaly Commute Time Approach Addressing Scalability Anomalies in Complex Data Evaluating Anomaly Detection Methods Applications Problem solutionsCategorical Data Discrete Sequences and Time Series Contextual Anomalies Collective Anomalies
Finding Contextual Anomalies
Sometimes contextual information isavailable about data
Not used directly as a feature Are well understood no anomalies in
the context Can reduce false positives and yield
interesting anomalies
Example adapted from [30]
Clearest Outlier
Conditional Anomaly
Maximum Daily Temperature
Number
ofFever
Cases
Contextual anomalies - Anomalous with respect to a context Context is defined using environmental variables
Spatial (Latitude Longitude) Graph context (Edges Weights) Temporal location Domain specific (Demographic other)
How to incorporate context Reduce to traditional anomaly detection (subset on context) Explicitly model contextual information (time series spatial)
Chawla and Chandola Anomaly Detection
Introduction Data Mining Methods Density-based anomaly Commute Time Approach Addressing Scalability Anomalies in Complex Data Evaluating Anomaly Detection Methods Applications Problem solutionsCategorical Data Discrete Sequences and Time Series Contextual Anomalies Collective Anomalies
Conditional Anomaly Detection
Data instance d rArru1 u2 udU v1 v2 vdV
dU environmentalattributes
dV indicator attributes u1
u2
U1
U2
U3
v1
v2
V1V2
V3
p(V1|U3) = 02
p(V2|U3) = 02
p(V3|U3) = 06
Algorithm [30]
1 Learn a Gaussian Mixture Model (GMM)U = U1 U2 UnU
each with dimensionality dU2 Learn a set of Gaussians U = V1 V2 VnV
each withdimensionality dV
3 Learn a probabilistic mapping function p(Vj |Ui)4 Score a test instance d = [uv]
S =
nUsumi=1
p(u|Ui)nVsumj=1
p(v|Vj)p(Vj |Ui)
Chawla and Chandola Anomaly Detection
Introduction Data Mining Methods Density-based anomaly Commute Time Approach Addressing Scalability Anomalies in Complex Data Evaluating Anomaly Detection Methods Applications Problem solutionsCategorical Data Discrete Sequences and Time Series Contextual Anomalies Collective Anomalies
Finding Collective Anomalies
Find a collection of data points
Each point by itself is normal
The collection as a whole isanomalous
Relevant when data has inherentstructure and
When domain definition ofanomalies cannot be described aspoint anomalies
A Simple Solution
1 Break data intogroups
2 Compute features foreach group
3 Apply traditionalanomaly detection
Examples
1 Time series
2 Image
3 Spatial clusters ofgalaxies
Chawla and Chandola Anomaly Detection
Introduction Data Mining Methods Density-based anomaly Commute Time Approach Addressing Scalability Anomalies in Complex Data Evaluating Anomaly Detection Methods Applications Problem solutionsCategorical Data Discrete Sequences and Time Series Contextual Anomalies Collective Anomalies
Using Latent Dirichlet Allocation for Group Anomalies
Find anomalous groups in data [34]
Example Spatial clusters of galaxies topics red green emissive words continuous features
Flexible Genre Model (FGM)
For each group
1 Draw a genre 1 2 T 3 ym simM(π)2 Draw topic distribution forym SK 3 θm sim Dir(αym)
3 Draw K topicsβmk sim P (βmk|ηk)k=12K
4 For each point in group
1 Draw topic membershipzmn simM(θn)
2 Generate pointxmn isin P (xmn|βmzmn)
α
zmn
xmn
N
θm
T
π
ηK
ym
β
MK
Model Parameters
M(π) -Multinomial
Genre - Dir(αt)
Topic generatorsP (|ηk)- GIW
Point generatorsP (xmn|βnk) -MultivariateGaussian
Chawla and Chandola Anomaly Detection
Introduction Data Mining Methods Density-based anomaly Commute Time Approach Addressing Scalability Anomalies in Complex Data Evaluating Anomaly Detection Methods Applications Problem solutionsCategorical Data Discrete Sequences and Time Series Contextual Anomalies Collective Anomalies
Inference and Testing for FGM
Inference and Learning Parameters
Approximate inference of latentvariables (Gibbs Sampling)
Use samples to learn parameters(Single step Monte Carlo EM)
Topic 1
Topic 2
Topic 3
Anomaly Detection
Infer the topic distribution θm
Compute negative log likelihood wrt αt
Rationale An anomalous group will be unlikely to begenerated from any genre
Geometric interpretation Mapping each group into a Tdimensional space and finding anomalies
Chawla and Chandola Anomaly Detection
Introduction Data Mining Methods Density-based anomaly Commute Time Approach Addressing Scalability Anomalies in Complex Data Evaluating Anomaly Detection Methods Applications Problem solutions
Evaluating Anomaly Detection Methods - Labels
Labeled validation data set exists Confusion matrix Traditional evaluation metrics
Class imbalance
ROC Curve
Validation set does not exist Use domain expertise to find TP
and FP FN is harder to estimate
Pseudo false negativeestimation techniques [25]
Predicteda n
Actuala TP FNn FP TN
Acc =TP + TNsum
Rec (R) =TP
TP + FN
Prec (P ) =TP
TP + FP
F =2 lowastR lowast PR+ P
Chawla and Chandola Anomaly Detection
Introduction Data Mining Methods Density-based anomaly Commute Time Approach Addressing Scalability Anomalies in Complex Data Evaluating Anomaly Detection Methods Applications Problem solutions
Evaluating Anomaly Detection Methods - Scores
Convert to binary output Use threshold δ on score (Scale
issues [21]) Take top x as anomalies
ROC curve by varying x or δ
Quality of output Does the output ldquosuggestrdquo x or δ Which output is better
Chawla and Chandola Anomaly Detection
Introduction Data Mining Methods Density-based anomaly Commute Time Approach Addressing Scalability Anomalies in Complex Data Evaluating Anomaly Detection Methods Applications Problem solutions
Unifying Scores
Different methods assign scores in differentranges
kNN-based scores [0 1] Lof scores [1 6] ABOD scores [0 80000]
Anomalies have lower scores
Direct scaling to [0 1] might lose distinctionbetween normal and anomalies
Desired scaling Stretch interesting rangesand shrink irrelevant ones
Generalized Procedure for Normalizing Outlier Scores [21] Regularity rArr S(o) ge 0forallo S(o) asymp 0 if o is normal andS(o) 0 if o is anomalous
Normality S is regular and S(o) isin [0 1]forallo
Chawla and Chandola Anomaly Detection
Introduction Data Mining Methods Density-based anomaly Commute Time Approach Addressing Scalability Anomalies in Complex Data Evaluating Anomaly Detection Methods Applications Problem solutions
Regularization and Normalization of Scores
Regularization
1 R(o) = max0 S(o)minus baseS2 R(o) = Smax minus S(o)
3 R(o) = minus log SmaxS(o)
Normalization
1 N(o) = S(o)Smax
2 N(o) = max(
0 erf(S(o)minusmicroSσS radic2
))(Gaussian Scaling)
Suited for high dimensional data
3 N(o) = max(
0cdfγS (o)minusmicroγ
1minusmicroγ
)(Gamma Scaling)
Where cdfγS (o) = P (k S(o) θ) P is the regularized Gamma function Suited for low dimensional data
Chawla and Chandola Anomaly Detection
Introduction Data Mining Methods Density-based anomaly Commute Time Approach Addressing Scalability Anomalies in Complex Data Evaluating Anomaly Detection Methods Applications Problem solutions
Generating Labeled Data for Validation
Generating Both Normal and Anomalous Data
Use generative models for normal and anomalous behavior
Several generators available Multivariate continuous data [27] Multivariate categorical data [5] Discrete sequences using HMM [12]
Drawbacks Might not capture the domain characteristics
Injecting Anomalies - Random Perturbation[30]
Given data point z = xy x and y arepartitions of feature space
Take a random sample D of the entire data set
Let zprime = xprimeyprime isin D such that distancebetween y and yprime is maximum
Replace x with xprime and add z back to data setx
yz
zprime
Injected anomaly
Chawla and Chandola Anomaly Detection
Introduction Data Mining Methods Density-based anomaly Commute Time Approach Addressing Scalability Anomalies in Complex Data Evaluating Anomaly Detection Methods Applications Problem solutionsWhat is Network Anomaly Detection Motivation How Much Serious
Applications Overview
How to set up an anomaly detection solution for agiven application domain
Available data Define anomalies define normal behavior Identify requirements and constraints (online
real-time limited resources) What domain knowledge available
Feature identification Defining normal and anomalous behavior Tuning parameters
Available ground truth (training validation)
Chawla and Chandola Anomaly Detection
Introduction Data Mining Methods Density-based anomaly Commute Time Approach Addressing Scalability Anomalies in Complex Data Evaluating Anomaly Detection Methods Applications Problem solutionsWhat is Network Anomaly Detection Motivation How Much Serious
What is Network Anomaly Detection
Anomaly Detection or Intrusion Detection
Traditional Intrusion Detection Systems (IDS) finding attackscorresponding to predefined pattern data set known as signaturestherefore system is absolutely vulnerable against zero-day attacks
Network Anomaly Detection Systems (NADS) to detectzero-day attacks without any pre-identified signature besides profilenormal behavior of the network and address suspected incidents
Network Anomaly Detection finding unusual and largechanges in the network traffic
Examples intentional attacks (eg Distributed Denial ofService - DDoS) or unusual network traffic (eg flash crowds)
Chawla and Chandola Anomaly Detection
Introduction Data Mining Methods Density-based anomaly Commute Time Approach Addressing Scalability Anomalies in Complex Data Evaluating Anomaly Detection Methods Applications Problem solutionsWhat is Network Anomaly Detection Motivation How Much Serious
Motivation How Much Serious
According to Symantec report released in early 2011 morethan 286 million new threats have been detected in 2010which is a huge number
1656227
2704836
1000000
1500000
2000000
2500000
3000000
20547 18827 69107 113025 140690
624267
1656227
2704836
0
500000
1000000
1500000
2000000
2500000
3000000
2002 2003 2004 2005 2006 2007 2008 July2009-June2010
Chawla and Chandola Anomaly Detection
Introduction Data Mining Methods Density-based anomaly Commute Time Approach Addressing Scalability Anomalies in Complex Data Evaluating Anomaly Detection Methods Applications Problem solutionsNetwork Topology Network Anomalies Detection Problem Network Anomalies Detection Problem Why care about OD Flows
Network Topology
A Typical network
1 y
Router
2
3
41t
x2t
x1t
x3t
x4t
Origin-Destination (OD) flow is the traffic that enters at anorigin node and exits at a destination node of a backbonenetwork x1t x1t
Link measurement is the traffic enters at an node during aninterval y1t
Relationship between link traffic and OD flow traffic iscaptured by the routing matrix A
Chawla and Chandola Anomaly Detection
Introduction Data Mining Methods Density-based anomaly Commute Time Approach Addressing Scalability Anomalies in Complex Data Evaluating Anomaly Detection Methods Applications Problem solutionsNetwork Topology Network Anomalies Detection Problem Network Anomalies Detection Problem Why care about OD Flows
Network Anomalies Detection Problem
Chawla and Chandola Anomaly Detection
Introduction Data Mining Methods Density-based anomaly Commute Time Approach Addressing Scalability Anomalies in Complex Data Evaluating Anomaly Detection Methods Applications Problem solutionsNetwork Topology Network Anomalies Detection Problem Network Anomalies Detection Problem Why care about OD Flows
Network Anomalies Detection Problem
Chawla and Chandola Anomaly Detection
Introduction Data Mining Methods Density-based anomaly Commute Time Approach Addressing Scalability Anomalies in Complex Data Evaluating Anomaly Detection Methods Applications Problem solutionsNetwork Topology Network Anomalies Detection Problem Network Anomalies Detection Problem Why care about OD Flows
Why care about OD Flows
Volume anomaly typically arises on an OD flow (trafficarriving at one node and destined for another node)
If we only monitor traffic on network links volume arisingfrom an OD flow may not be noticeable Thus naiveapproach wont work if OD flow info is not available
Figure source [22]
Chawla and Chandola Anomaly Detection
Introduction Data Mining Methods Density-based anomaly Commute Time Approach Addressing Scalability Anomalies in Complex Data Evaluating Anomaly Detection Methods Applications Problem solutionsPCA and Subspace Method Subspace Method Algorithm Subspace Analysis Results Discussion Typical Characteristics of Anomaly Limitation of Volume Entropy Based versus Volume Based Fraud Detection Epidemeology Anomaly Detection in Climate and Weather Anomalies in Climate Validation of Anomalies
PCA and Subspace Method
Chawla and Chandola Anomaly Detection
Introduction Data Mining Methods Density-based anomaly Commute Time Approach Addressing Scalability Anomalies in Complex Data Evaluating Anomaly Detection Methods Applications Problem solutionsPCA and Subspace Method Subspace Method Algorithm Subspace Analysis Results Discussion Typical Characteristics of Anomaly Limitation of Volume Entropy Based versus Volume Based Fraud Detection Epidemeology Anomaly Detection in Climate and Weather Anomalies in Climate Validation of Anomalies
Subspace Method Algorithm
Step1- Determine the PCs based on eigenvaluedecomposition of the covariance matrix of the dataset
Step2- Choose first top k principle components with thehighest eigenvalues as matrix P
Step3-normal traffic subspace called Z
Z = PP TZ = CZ
Step4-abnormal traffic subspace called Z
Z = (I minus PP T )Z = CZ
Step5-If the norm of a vector is large then it is an rdquoanomalyrdquo
Chawla and Chandola Anomaly Detection
Introduction Data Mining Methods Density-based anomaly Commute Time Approach Addressing Scalability Anomalies in Complex Data Evaluating Anomaly Detection Methods Applications Problem solutionsPCA and Subspace Method Subspace Method Algorithm Subspace Analysis Results Discussion Typical Characteristics of Anomaly Limitation of Volume Entropy Based versus Volume Based Fraud Detection Epidemeology Anomaly Detection in Climate and Weather Anomalies in Climate Validation of Anomalies
Subspace Analysis Results
Note that during anomaly normal component does not changethat much while residual component changes quite a lot
Thus anomalies can be detected by setting some threshold
Figure source [22]
Chawla and Chandola Anomaly Detection
Introduction Data Mining Methods Density-based anomaly Commute Time Approach Addressing Scalability Anomalies in Complex Data Evaluating Anomaly Detection Methods Applications Problem solutionsPCA and Subspace Method Subspace Method Algorithm Subspace Analysis Results Discussion Typical Characteristics of Anomaly Limitation of Volume Entropy Based versus Volume Based Fraud Detection Epidemeology Anomaly Detection in Climate and Weather Anomalies in Climate Validation of Anomalies
Discussion Typical Characteristics of Anomaly
Most Anomalies induce a change in distributionalaspects of packet header fields (called features)
Most important features include 5-tuple Source ampdestination IP addresses Source and destination portnumbers and IP protocol
raquo DOS attack ndash multiple source IP address concentrated on asingle destination IP address
raquo Network scan ndash dispersed distribution of destination addresses
raquo Most wormsviruses also induce some change in distribution ofcertain features
raquo However these changes can be very subtle and mining them islike searching for needles in a haystack
Unlike many previous approach this paper aims todetect events which disturb the distribution of trafficfeatures rather than traffic volume
Chawla and Chandola Anomaly Detection
Introduction Data Mining Methods Density-based anomaly Commute Time Approach Addressing Scalability Anomalies in Complex Data Evaluating Anomaly Detection Methods Applications Problem solutionsPCA and Subspace Method Subspace Method Algorithm Subspace Analysis Results Discussion Typical Characteristics of Anomaly Limitation of Volume Entropy Based versus Volume Based Fraud Detection Epidemeology Anomaly Detection in Climate and Weather Anomalies in Climate Validation of Anomalies
Limitation of Volume
Figure source [22]
Port scan anomaly (traffic feature changes however traffic volume
remains more or less the same)
We can use entropy tocapture the variationsin the traffic feature
bullTakes value 0 when distribution is maximally concentratedbullTakes value log2N when distribution is maximally dispersed
But stands out in
feature entropy
which also reveals
its structure
Port scan
dwarfed
in volume
metricshellip
Chawla and Chandola Anomaly Detection
Introduction Data Mining Methods Density-based anomaly Commute Time Approach Addressing Scalability Anomalies in Complex Data Evaluating Anomaly Detection Methods Applications Problem solutionsPCA and Subspace Method Subspace Method Algorithm Subspace Analysis Results Discussion Typical Characteristics of Anomaly Limitation of Volume Entropy Based versus Volume Based Fraud Detection Epidemeology Anomaly Detection in Climate and Weather Anomalies in Climate Validation of Anomalies
Entropy Based versus Volume Based
DoSDDoS Attacks- a spike in traffic data toward adominant destination IP
Scan anomaly-a spike in traffic data from a dominant sourceIP
Flash Crowd anomaly- again a spike in traffic data to adominant destination IP
Worm anomaly-a Spike in traffic with a dominant port
Chawla and Chandola Anomaly Detection
Introduction Data Mining Methods Density-based anomaly Commute Time Approach Addressing Scalability Anomalies in Complex Data Evaluating Anomaly Detection Methods Applications Problem solutionsPCA and Subspace Method Subspace Method Algorithm Subspace Analysis Results Discussion Typical Characteristics of Anomaly Limitation of Volume Entropy Based versus Volume Based Fraud Detection Epidemeology Anomaly Detection in Climate and Weather Anomalies in Climate Validation of Anomalies
Fraud Detection
Domain Question Identifyfraudulent activities or players fromobserved transaction data
Data Transactions between different
players in the system Meta information about the
individuals An underlying graph structure
Challenges Track and model human behavior Anomalies caused by adaptive
human adversaries Massive data sizes
Insurance (autohealtha)
ClaimantProvider Payer
Telecommunications Customer
Provider
Credit Cards Customer
Supplier Bank
Web Advertising User Advertiser
Publisher
ahttpwwwcheatingculturecompast-cases-of-medicare-fraud
Chawla and Chandola Anomaly Detection
Introduction Data Mining Methods Density-based anomaly Commute Time Approach Addressing Scalability Anomalies in Complex Data Evaluating Anomaly Detection Methods Applications Problem solutionsPCA and Subspace Method Subspace Method Algorithm Subspace Analysis Results Discussion Typical Characteristics of Anomaly Limitation of Volume Entropy Based versus Volume Based Fraud Detection Epidemeology Anomaly Detection in Climate and Weather Anomalies in Climate Validation of Anomalies
A Generic Fraud Detection Method
Activity Monitoring [13]1 Build profiles for individuals (customers users etc) based on
historic data User X makes n calls on an average in January
2 Compare current behavior with historical profile for significantdeviations
Clustering based [4]1 Cluster historical profiles of customers2 Identify small clusters or outlying profiles as anomalies
Strengths Anomaly detection is fast (good for real time) Results are easy to explain
Weaknesses Need to create and maintain a large number of profiles Not dynamic Adequate historical data might not be available Too many false positives
Chawla and Chandola Anomaly Detection
Introduction Data Mining Methods Density-based anomaly Commute Time Approach Addressing Scalability Anomalies in Complex Data Evaluating Anomaly Detection Methods Applications Problem solutionsPCA and Subspace Method Subspace Method Algorithm Subspace Analysis Results Discussion Typical Characteristics of Anomaly Limitation of Volume Entropy Based versus Volume Based Fraud Detection Epidemeology Anomaly Detection in Climate and Weather Anomalies in Climate Validation of Anomalies
Exploiting Graph Structure - Weighted Graphs
Represent data as a weighted graph Communication networks (phone email SMS) Provider referral networks
Objective Identify anomalous nodes
For each node extract several features based on the propertiesof the induced sub-graph (egonet) of neighboring nodes [1]
Choose features that can highlight anomalous nodes
1 Ni degree of node2 Ei number of edges in egonet3 Wi total weight of egonet4 λi principal eigen vector of weighted adjacency matrix of
egonet
Data is transformed into a point in a multi-dimensional space
Chawla and Chandola Anomaly Detection
Introduction Data Mining Methods Density-based anomaly Commute Time Approach Addressing Scalability Anomalies in Complex Data Evaluating Anomaly Detection Methods Applications Problem solutionsPCA and Subspace Method Subspace Method Algorithm Subspace Analysis Results Discussion Typical Characteristics of Anomaly Limitation of Volume Entropy Based versus Volume Based Fraud Detection Epidemeology Anomaly Detection in Climate and Weather Anomalies in Climate Validation of Anomalies
Identifying Anomalies
Traditional anomaly detection (lof) Can be slow but can identify any type of anomalous structure
Faster method to identify specific types of anomalousstructures
Identify relevant feature pairs and power law relationship
Eg Egonet Density Power Law Ni vs Ei - detect nearcliques and stars
Ei prop Nαi 1 le α le 2
Anomaly score for node i wrt a pair of features (y = Cxθ)
Si =max(yi Cx
θi )
min(yi Cxθi )lowast log (|yi minus Cxθi |+ 1)
Chawla and Chandola Anomaly Detection
Introduction Data Mining Methods Density-based anomaly Commute Time Approach Addressing Scalability Anomalies in Complex Data Evaluating Anomaly Detection Methods Applications Problem solutionsPCA and Subspace Method Subspace Method Algorithm Subspace Analysis Results Discussion Typical Characteristics of Anomaly Limitation of Volume Entropy Based versus Volume Based Fraud Detection Epidemeology Anomaly Detection in Climate and Weather Anomalies in Climate Validation of Anomalies
Exploiting Graph Structure - Bipartite Graphs
Represent data as a bipartite graph Healthcare Data (Beneficiaries vs Providers) Insider trading (Traders vs Stocks)
Objective Identify anomalous links
Given a query node a isin V1 find the ldquorelevancerdquoof all other nodes in V1 to a
RelevanceScore(a b) prop Number of times aldquorandom walkrdquo from a reaches b
Use the relevance scores to compute thenormality scores for a node t isin V2
Find set St = a|〈a t〉 isin E Compute |St| times |St| similarity matrix using
relevance vectors for a isin St Normality Score = mean of non-diagonal entries
of similarity matrix
V1 E V2a1
a2
a3
an
t1
t2
t3
tn
Chawla and Chandola Anomaly Detection
Introduction Data Mining Methods Density-based anomaly Commute Time Approach Addressing Scalability Anomalies in Complex Data Evaluating Anomaly Detection Methods Applications Problem solutionsPCA and Subspace Method Subspace Method Algorithm Subspace Analysis Results Discussion Typical Characteristics of Anomaly Limitation of Volume Entropy Based versus Volume Based Fraud Detection Epidemeology Anomaly Detection in Climate and Weather Anomalies in Climate Validation of Anomalies
Detecting Disease Outbreaks
Domain Question Early detection of disease
outbreaks Anthrax attack
Data Emergency department visits Grocery data (Example [14]) Clinical visits Weatherclimate data
Challenges Weak signals in the data
ED cases involving cough rArrFlu or SARS
Integration of multiple signals(lag analysis)
Account for spatial and temporalcorrelations
Chawla and Chandola Anomaly Detection
Introduction Data Mining Methods Density-based anomaly Commute Time Approach Addressing Scalability Anomalies in Complex Data Evaluating Anomaly Detection Methods Applications Problem solutionsPCA and Subspace Method Subspace Method Algorithm Subspace Analysis Results Discussion Typical Characteristics of Anomaly Limitation of Volume Entropy Based versus Volume Based Fraud Detection Epidemeology Anomaly Detection in Climate and Weather Anomalies in Climate Validation of Anomalies
Whatrsquos Significant About Recent Events (WSARE) [33]
1 Learn Bayesian network from historical data Environmental and response variables
2 Sample from the BN (DBbaseline|Current Environment)3 Compute contingency table for rules for DBbaseline andDBcurrent
Rules are single assignment rules (Xi = Y ji ) or conjunctions4 Find p-value for rules using χ2-test
Null Hypothesis Rows and columns of tables for DBbaselineand DBcurrent are independent
5 Find rule with largest p-value Repeat Step 2
Chawla and Chandola Anomaly Detection
Introduction Data Mining Methods Density-based anomaly Commute Time Approach Addressing Scalability Anomalies in Complex Data Evaluating Anomaly Detection Methods Applications Problem solutionsPCA and Subspace Method Subspace Method Algorithm Subspace Analysis Results Discussion Typical Characteristics of Anomaly Limitation of Volume Entropy Based versus Volume Based Fraud Detection Epidemeology Anomaly Detection in Climate and Weather Anomalies in Climate Validation of Anomalies
Incorporating Spatial and Temporal Relationships
WSARE does not explicitly model the spatial and temporalrelationships
What happened yesterday What happened in the adjoining neighborhood (yesterday)
Bayesian Network Spatio-Temporal (BNST) modelingframework [17]
Add nodes for temporal and spatial dependencies Need more data to train
Chawla and Chandola Anomaly Detection
Introduction Data Mining Methods Density-based anomaly Commute Time Approach Addressing Scalability Anomalies in Complex Data Evaluating Anomaly Detection Methods Applications Problem solutionsPCA and Subspace Method Subspace Method Algorithm Subspace Analysis Results Discussion Typical Characteristics of Anomaly Limitation of Volume Entropy Based versus Volume Based Fraud Detection Epidemeology Anomaly Detection in Climate and Weather Anomalies in Climate Validation of Anomalies
Anomaly Detection in Climate and Weather
Science Questions Identify natural and anthropogenic disasters Identify long time scale events - droughts atmospheric rivers
cold fronts etc
Data Ground observations Remote sensing data (satellites
air-borne) Climate model simulation outputs Multiple variables spatio-temporal (often has height dimension
as well)
Challenges Model spatio-temporal relationships across multiple variables Explain the cause of anomalies Massive data sizes
Climate and weather extreme events are well defined
Key challenge is to find significant events and explain the cause
Chawla and Chandola Anomaly Detection
Introduction Data Mining Methods Density-based anomaly Commute Time Approach Addressing Scalability Anomalies in Complex Data Evaluating Anomaly Detection Methods Applications Problem solutionsPCA and Subspace Method Subspace Method Algorithm Subspace Analysis Results Discussion Typical Characteristics of Anomaly Limitation of Volume Entropy Based versus Volume Based Fraud Detection Epidemeology Anomaly Detection in Climate and Weather Anomalies in Climate Validation of Anomalies
Anomalies are Widely Used in Climate
Most analysis done on ldquoanomalyrdquo time series
Difference from a ldquobase periodrdquo (Toosimplistic)
Brings spatial smoothness (eg a mountaintop and nearby valley can have very differenttemperatures) Removes seasonality
Understand climate and weatherphenomenon
Southern Oscillation Index (SOI) Difference between Sea Level Pressure
(SLP) anomalies for Tahiti and DarwinAustralia
Figure Global AverageTemperature Anomaly(1975 - 2007) Srcwwwmetofficegovuk
Chawla and Chandola Anomaly Detection
Introduction Data Mining Methods Density-based anomaly Commute Time Approach Addressing Scalability Anomalies in Complex Data Evaluating Anomaly Detection Methods Applications Problem solutionsPCA and Subspace Method Subspace Method Algorithm Subspace Analysis Results Discussion Typical Characteristics of Anomaly Limitation of Volume Entropy Based versus Volume Based Fraud Detection Epidemeology Anomaly Detection in Climate and Weather Anomalies in Climate Validation of Anomalies
Constructing Anomalies from Raw Data
Anomaly time series for a given location i
vprimei = vi minus bi
where bi is the base (reference)
How to choose bi Mean of all data for location i Monthly mean values (account for seasonality) Monthly z-score values Median (more robust) Using a shorter ldquoreference periodrdquo
30 year moving window
Different methods show statistically significant differences[19] What is the right strategy Weighted mean of different strategies (Pick weights using
Monte Carlo sampling)
Chawla and Chandola Anomaly Detection
Introduction Data Mining Methods Density-based anomaly Commute Time Approach Addressing Scalability Anomalies in Complex Data Evaluating Anomaly Detection Methods Applications Problem solutionsPCA and Subspace Method Subspace Method Algorithm Subspace Analysis Results Discussion Typical Characteristics of Anomaly Limitation of Volume Entropy Based versus Volume Based Fraud Detection Epidemeology Anomaly Detection in Climate and Weather Anomalies in Climate Validation of Anomalies
Anomaly Detection for Identifying Droughts
Science question Identify significant drought patterns usinghistorical observation data or future simulation data or both
Find persistent spatiotemporal anomalies in precipitation data
A two step approach
1 Find precipitationanomalies usingthresholds
2 Find large connectedcomponents across spaceand time
Matlab - bwlabelbwlabeln
Followup Science questionExplain cause
(drought190120061avi)
Figure Video courtsey Dr ArindamBanerjee
Chawla and Chandola Anomaly Detection
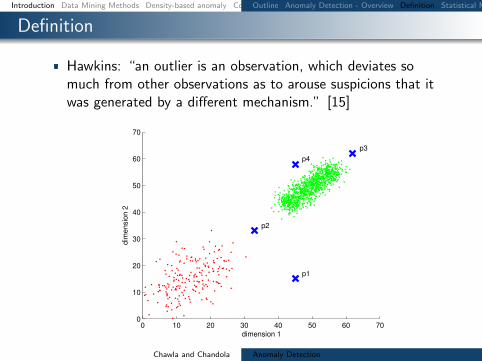
Introduction Data Mining Methods Density-based anomaly Commute Time Approach Addressing Scalability Anomalies in Complex Data Evaluating Anomaly Detection Methods Applications Problem solutionsOutline Anomaly Detection - Overview Definition Statistical Methods Anomaly Detection with Mahalanobis Distance Mahalanobis vs Euclidean Distance
Definition
Hawkins ldquoan outlier is an observation which deviates somuch from other observations as to arouse suspicions that itwas generated by a different mechanismrdquo [15]
0 10 20 30 40 50 60 700
10
20
30
40
50
60
70
dimension 1
dim
en
sio
n 2
p1
p2
p3
p4
Chawla and Chandola Anomaly Detection
Introduction Data Mining Methods Density-based anomaly Commute Time Approach Addressing Scalability Anomalies in Complex Data Evaluating Anomaly Detection Methods Applications Problem solutionsOutline Anomaly Detection - Overview Definition Statistical Methods Anomaly Detection with Mahalanobis Distance Mahalanobis vs Euclidean Distance
Statistical Methods
Lets begin with the univariate Normal distribution
f(x) =1
(2πσ2)12
eminus[(xminusmicro)σ]22
Notice exponent measures square of deviation from mean andnormalized by standard deviation(
xminus microσ
)2
= (xminus micro)(σ2)minus1(xminus micro)
For d dimension the exponent is called (square of)Mahalanobis distance
(xminus micro)primeΣminus1(xminus micro)
where Σ is the dtimes d variance-covariance matrix
Chawla and Chandola Anomaly Detection
Introduction Data Mining Methods Density-based anomaly Commute Time Approach Addressing Scalability Anomalies in Complex Data Evaluating Anomaly Detection Methods Applications Problem solutionsOutline Anomaly Detection - Overview Definition Statistical Methods Anomaly Detection with Mahalanobis Distance Mahalanobis vs Euclidean Distance
Anomaly Detection with Mahalanobis Distance
The key observation is that if data x follows a d dimensionalGaussian distribution then
(xminus micro)primeΣminus1(xminus micro) asymp χ2d
Anomalies can be found in the tail of the distribution
There are three major weaknesses of the above approach Data may not follow a Normal distribution or be a mixture of
distributions Both mean and variance of χ2 is d For high-dimensional data
this is a problem Mean and thus variance are extremely sensitive to outliers -and
we are using them to find anomalies - often leads to falsenegatives
Chawla and Chandola Anomaly Detection
Introduction Data Mining Methods Density-based anomaly Commute Time Approach Addressing Scalability Anomalies in Complex Data Evaluating Anomaly Detection Methods Applications Problem solutionsOutline Anomaly Detection - Overview Definition Statistical Methods Anomaly Detection with Mahalanobis Distance Mahalanobis vs Euclidean Distance
Mahalanobis vs Euclidean Distance
Mahalanobis normalizes for variance
minus10 minus5 0 5 10minus10
minus8
minus6
minus4
minus2
0
2
4
6
8
10
14
61
16
29
Point Pairs Mahalanobis Euclidean
(1429) 507 1178
(1661) 483 684
Chawla and Chandola Anomaly Detection
Introduction Data Mining Methods Density-based anomaly Commute Time Approach Addressing Scalability Anomalies in Complex Data Evaluating Anomaly Detection Methods Applications Problem solutionsDistance-based anomalies DB(pD) outlier Distance-based methods (DB(kN) Pruning rule Examples of pruning technique Strengths and weaknesses - Distance-based techniques
Distance-based anomalies
Intuition A data point which is far away from its nearestneighbors is a candidate anomaly
Several definitions which capture the above intuition
DB(pD) anomaly [20] an object o in a data set T is aDB(pD) anomaly if at least a fraction p of objects in T havedistances greater than D from o
Generalizes the notion of ldquothree standard deviation from themeanrdquo
This definition had a huge influence on subsequentdevelopment in outlier detection
Chawla and Chandola Anomaly Detection
Introduction Data Mining Methods Density-based anomaly Commute Time Approach Addressing Scalability Anomalies in Complex Data Evaluating Anomaly Detection Methods Applications Problem solutionsDistance-based anomalies DB(pD) outlier Distance-based methods (DB(kN) Pruning rule Examples of pruning technique Strengths and weaknesses - Distance-based techniques
DB(pD) outlier
To build some intuition consider data generated from theNormal distribution N(0 1) Then if O is a DB(pD) outlier
1
(2π)12
int O+D
OminusDeminus
x2
2 dx le 1minus p
Example If O is 3 (3 standard deviations away from themean) then it is a DB(01 0999) outlier
Thus for particular settings of D and p DB(pD) capturesstandard outliers
But much more general (eg any distance metric)
Chawla and Chandola Anomaly Detection
Introduction Data Mining Methods Density-based anomaly Commute Time Approach Addressing Scalability Anomalies in Complex Data Evaluating Anomaly Detection Methods Applications Problem solutionsDistance-based anomalies DB(pD) outlier Distance-based methods (DB(kN) Pruning rule Examples of pruning technique Strengths and weaknesses - Distance-based techniques
Distance-based methods (DB(kN)
DB(kN) anomaly [28] top N data instances whosedistances to its k-th nearest neighbor are largest
Several advantages Ranking for anomalies is more intuitiveSetting of parameters generally easier
A Simple Nested Loop (SNL) algorithm can be used to selectthe top N DB(kN) outliers Time complexity is O(n2d)where n is the database size and d is the dimensionality
Chawla and Chandola Anomaly Detection
Introduction Data Mining Methods Density-based anomaly Commute Time Approach Addressing Scalability Anomalies in Complex Data Evaluating Anomaly Detection Methods Applications Problem solutionsDistance-based anomalies DB(pD) outlier Distance-based methods (DB(kN) Pruning rule Examples of pruning technique Strengths and weaknesses - Distance-based techniques
Pruning rule
DB(kN) anomaly [3] a data instance is not an anomaly ifits distance to its k-th current nearest neighbor is less thanthe score of the weakest anomaly among top N anomaliesfound so far
A large number of non-anomalies can be pruned withoutcarrying out a full data search
Complexity nearly O(n)
Chawla and Chandola Anomaly Detection
Introduction Data Mining Methods Density-based anomaly Commute Time Approach Addressing Scalability Anomalies in Complex Data Evaluating Anomaly Detection Methods Applications Problem solutionsDistance-based anomalies DB(pD) outlier Distance-based methods (DB(kN) Pruning rule Examples of pruning technique Strengths and weaknesses - Distance-based techniques
Examples of pruning technique
Non-anomalies are pruned earlier
Chawla and Chandola Anomaly Detection
Introduction Data Mining Methods Density-based anomaly Commute Time Approach Addressing Scalability Anomalies in Complex Data Evaluating Anomaly Detection Methods Applications Problem solutionsDistance-based anomalies DB(pD) outlier Distance-based methods (DB(kN) Pruning rule Examples of pruning technique Strengths and weaknesses - Distance-based techniques
Strengths and weaknesses - Distance-based techniques
Do not make any assumption about the distribution of thedata
Scalable for large dataset (O(n))
Capable of finding only global anomalies
Can lead to non-intuitive results in Top-k situations
0 10 20 30 40 50 60 700
10
20
30
40
50
60
70
dimension 1
dim
en
sio
n 2
p1
p2
p3
p4
Chawla and Chandola Anomaly Detection
Introduction Data Mining Methods Density-based anomaly Commute Time Approach Addressing Scalability Anomalies in Complex Data Evaluating Anomaly Detection Methods Applications Problem solutionsDensity-based anomaly Strengths and Weaknesses
Density-based anomaly
Calculate the density of an object based on the density of itsk nearest neighbours
density(p) = 1
sum
qisinNk(p)distk(p q)
|Nk(p)|
relative-density(p) =
density(p)1
|Nk(p)|sum
qisinNk(p)density(q)
anomaly-score(p) =1
relative-density(p)
LOF indicates a degree of local outlier-ness [6]
Chawla and Chandola Anomaly Detection
Introduction Data Mining Methods Density-based anomaly Commute Time Approach Addressing Scalability Anomalies in Complex Data Evaluating Anomaly Detection Methods Applications Problem solutionsDensity-based anomaly Strengths and Weaknesses
Strengths and Weaknesses
Can detect global and local anomalies
Cannot use pruning technique and has a complexity of O(n2)
Require a method combining the strengths of distance anddensity based approaches A distance based approach whichcan capture density
C
C
O
O1
1
2
2
Chawla and Chandola Anomaly Detection
Introduction Data Mining Methods Density-based anomaly Commute Time Approach Addressing Scalability Anomalies in Complex Data Evaluating Anomaly Detection Methods Applications Problem solutionsCommute time Computation of commute time Anomaly detection using commute time (CDOF) Fast estimation of commute time Scalability for Density-based method PINN Algorithm (ICDM 2010) PINN Guarantee Examples high-dim distance-based outliers Examples high-dim density-based outliers Examples local density-based outliers
Commute time
Commute time between i and j is the expected number ofsteps that a random walk starting at i will take to reach jonce and go back to i for the first time
Commute time can capture both the distance between pointsand the data densities
Chawla and Chandola Anomaly Detection
Introduction Data Mining Methods Density-based anomaly Commute Time Approach Addressing Scalability Anomalies in Complex Data Evaluating Anomaly Detection Methods Applications Problem solutionsCommute time Computation of commute time Anomaly detection using commute time (CDOF) Fast estimation of commute time Scalability for Density-based method PINN Algorithm (ICDM 2010) PINN Guarantee Examples high-dim distance-based outliers Examples high-dim density-based outliers Examples local density-based outliers
Computation of commute time
Commute time can be computed using graph Laplacian matrixL
cij = VG(ei minus ej)TL+(ei minus ej)L+ pseudo-inverse of LVG graph volumeei i-th column of the identity matrix
Commute time is Euclidean distance in the space spanned byeigenvectors of L
cij = VG[(Sminus12V T )(ei minus ej)]T [(Sminus12V T )(ei minus ej)]
V S eigenvectors and eigenvalues of L
Chawla and Chandola Anomaly Detection
Introduction Data Mining Methods Density-based anomaly Commute Time Approach Addressing Scalability Anomalies in Complex Data Evaluating Anomaly Detection Methods Applications Problem solutionsCommute time Computation of commute time Anomaly detection using commute time (CDOF) Fast estimation of commute time Scalability for Density-based method PINN Algorithm (ICDM 2010) PINN Guarantee Examples high-dim distance-based outliers Examples high-dim density-based outliers Examples local density-based outliers
Anomaly detection using commute time (CDOF)
Construct the mutual k nearest neighbor graph G from thedataset
Compute the Laplacian matrix L of G and its eigensystems
Find top N anomalies using the distance-based technique incommute time with pruning rule
Complexity O(n3)
Commute time method can detect global local and groupanomalies
Chawla and Chandola Anomaly Detection
Introduction Data Mining Methods Density-based anomaly Commute Time Approach Addressing Scalability Anomalies in Complex Data Evaluating Anomaly Detection Methods Applications Problem solutionsCommute time Computation of commute time Anomaly detection using commute time (CDOF) Fast estimation of commute time Scalability for Density-based method PINN Algorithm (ICDM 2010) PINN Guarantee Examples high-dim distance-based outliers Examples high-dim density-based outliers Examples local density-based outliers
Fast estimation of commute time
Speilman and Srivastava [31] combined random projection anda linear time solver to build a structure where we can computethe compute time between two nodes in O(log n) time
Complexity of CDOF O(n3)rarr O(n log n)
Uses a near linear time solver for a linear system of equationAx = b
Spielman and Teng solvers Also see work by Iannis Koutisfrom CMU
Chawla and Chandola Anomaly Detection
Introduction Data Mining Methods Density-based anomaly Commute Time Approach Addressing Scalability Anomalies in Complex Data Evaluating Anomaly Detection Methods Applications Problem solutionsCommute time Computation of commute time Anomaly detection using commute time (CDOF) Fast estimation of commute time Scalability for Density-based method PINN Algorithm (ICDM 2010) PINN Guarantee Examples high-dim distance-based outliers Examples high-dim density-based outliers Examples local density-based outliers
Scalability for Density-based method
The pruning rule for Distance-based methods does not applyto Density-based approaches
We can go from O(n2) to nearly O(n log n) by using an index
One solution for the curse of high dimensionality is to use ofrandom projections
Chawla and Chandola Anomaly Detection
Introduction Data Mining Methods Density-based anomaly Commute Time Approach Addressing Scalability Anomalies in Complex Data Evaluating Anomaly Detection Methods Applications Problem solutionsCommute time Computation of commute time Anomaly detection using commute time (CDOF) Fast estimation of commute time Scalability for Density-based method PINN Algorithm (ICDM 2010) PINN Guarantee Examples high-dim distance-based outliers Examples high-dim density-based outliers Examples local density-based outliers
PINN Algorithm (ICDM 2010)
Chawla and Chandola Anomaly Detection
Introduction Data Mining Methods Density-based anomaly Commute Time Approach Addressing Scalability Anomalies in Complex Data Evaluating Anomaly Detection Methods Applications Problem solutionsCommute time Computation of commute time Anomaly detection using commute time (CDOF) Fast estimation of commute time Scalability for Density-based method PINN Algorithm (ICDM 2010) PINN Guarantee Examples high-dim distance-based outliers Examples high-dim density-based outliers Examples local density-based outliers
PINN Guarantee
The PINN Algorithm provides probabilistic guarantees
Under certain assumptions about intrinsic dimensionality (c)with high probability
1minus ε1 + ε
middot LOF (p) le LOF (p) le 1 + ε
1minus ε middot LOF (p)
In practice we do not know the intrinsic dimensionality ofdata However random projections are quite robust
Chawla and Chandola Anomaly Detection
Introduction Data Mining Methods Density-based anomaly Commute Time Approach Addressing Scalability Anomalies in Complex Data Evaluating Anomaly Detection Methods Applications Problem solutionsCommute time Computation of commute time Anomaly detection using commute time (CDOF) Fast estimation of commute time Scalability for Density-based method PINN Algorithm (ICDM 2010) PINN Guarantee Examples high-dim distance-based outliers Examples high-dim density-based outliers Examples local density-based outliers
Examples high-dim distance-based outliers
On a large database of images the bright images show up asdistance based outliers
Chawla and Chandola Anomaly Detection
Introduction Data Mining Methods Density-based anomaly Commute Time Approach Addressing Scalability Anomalies in Complex Data Evaluating Anomaly Detection Methods Applications Problem solutionsCommute time Computation of commute time Anomaly detection using commute time (CDOF) Fast estimation of commute time Scalability for Density-based method PINN Algorithm (ICDM 2010) PINN Guarantee Examples high-dim distance-based outliers Examples high-dim density-based outliers Examples local density-based outliers
Examples high-dim density-based outliers
On a large database of images occluded images show up asdensity based outliers
Chawla and Chandola Anomaly Detection
Introduction Data Mining Methods Density-based anomaly Commute Time Approach Addressing Scalability Anomalies in Complex Data Evaluating Anomaly Detection Methods Applications Problem solutionsCommute time Computation of commute time Anomaly detection using commute time (CDOF) Fast estimation of commute time Scalability for Density-based method PINN Algorithm (ICDM 2010) PINN Guarantee Examples high-dim distance-based outliers Examples high-dim density-based outliers Examples local density-based outliers
Examples local density-based outliers
Examples of images ranked by LOF
Chawla and Chandola Anomaly Detection
Introduction Data Mining Methods Density-based anomaly Commute Time Approach Addressing Scalability Anomalies in Complex Data Evaluating Anomaly Detection Methods Applications Problem solutions
Addressing Scalability
Chawla and Chandola Anomaly Detection
Introduction Data Mining Methods Density-based anomaly Commute Time Approach Addressing Scalability Anomalies in Complex Data Evaluating Anomaly Detection Methods Applications Problem solutions
Using GPUs for Anomaly Detection
Well suited for data parallel algorithms Using CUDA - Compute Unified Device
Architecture (Nvidia)
Need to re-engineer existing algorithms Utilization of device memory Minimize CPUhArrGPU transfer of data Keep threads homogeneous
Most model based algorithms arenaturally setup for the testing phase
Model building needs careful redesign
What about unsupervised algorithms
Kernel
Host
Grid
Device
Block(00)
Block(01)
Block(02)
Block(10)
Block(11)
Block(12)
Thread Block
Thread(00)
Thread(01)
Thread(02)
Thread(03)
Thread(10)
Thread(11)
Thread(12)
Thread(13)
Thread(20)
Thread(21)
Thread(22)
Thread(23)
Host Host Memory
SM 2
SM 1
SM 0
Registers Registers Registers
SP 0 SP 1 SP 7
Shared Memory
Global Memory
Texture Memory
Constant Memory
Device
Chawla and Chandola Anomaly Detection
Introduction Data Mining Methods Density-based anomaly Commute Time Approach Addressing Scalability Anomalies in Complex Data Evaluating Anomaly Detection Methods Applications Problem solutions
Implementing DB(kN) on GPUs
Return top N data instances whose distances tok-th nearest neighbor are largest (SerialDB(kN) is O(n2))
Involves computing pairwise distances
Load block i and block j to shared memory Data layout in memory should be optimized
Each thread computes distance between a pairof instances
Can utilize this time to load next chunk of datafrom host to device memory
Writes results to corresponding output block
Sorting can be done efficiently in CUDA [29]
d
n
T
n
n
Chawla and Chandola Anomaly Detection
Introduction Data Mining Methods Density-based anomaly Commute Time Approach Addressing Scalability Anomalies in Complex Data Evaluating Anomaly Detection Methods Applications Problem solutionsCategorical Data Discrete Sequences and Time Series Contextual Anomalies Collective Anomalies
Moving Beyond Multi-dimensional Record Data
Categorical (Mixed)
Fraud Detection
Cyber Networks
Time Series
Sensor Networks
Healthcare
Discrete Sequences
Genomic
System Calls
Spatial
GIS
Image analysis
Spatio-temporal
Remote sensing
Climate
Graphs
Social networks
Epidemiology
Chawla and Chandola Anomaly Detection
Introduction Data Mining Methods Density-based anomaly Commute Time Approach Addressing Scalability Anomalies in Complex Data Evaluating Anomaly Detection Methods Applications Problem solutionsCategorical Data Discrete Sequences and Time Series Contextual Anomalies Collective Anomalies
Handling Categorical Data
Each attribute can belong to one of many categories
No ordering between categories
Mixed data (categorical and continuous attributes)
cap-shape cap-surface middot middot middot habitat type
convex smooth urban poisonousconvex smooth grasses ediblebell smooth meadows edibleconvex scaly urban poisonousconvex smooth grasses ediblemiddot middot middot
Table Mushroom Data Set [2]
Chawla and Chandola Anomaly Detection
Introduction Data Mining Methods Density-based anomaly Commute Time Approach Addressing Scalability Anomalies in Complex Data Evaluating Anomaly Detection Methods Applications Problem solutionsCategorical Data Discrete Sequences and Time Series Contextual Anomalies Collective Anomalies
Approaches to Identify Categorical Anomalies
Using Association Analysis [24]
Binarize data
Learn rules (X rArr Y ) Choose high confidence
rules (P (Y |X))
For test record Z = 〈XY 〉find rules of the formP (Y |X)
Y is not observed whenX is observed
Using Bayesian Networks [33]
Learn Bayesian networkstructure and parameters
Compute P (Z) for test datarecord Z
Flag anomaly if P (Z) lt δ
Using Similarity Metrics [10]
Use a similarity measure (S(X1 X2))
Apply distancedensityclustering based method (eg lof)
Chawla and Chandola Anomaly Detection
Introduction Data Mining Methods Density-based anomaly Commute Time Approach Addressing Scalability Anomalies in Complex Data Evaluating Anomaly Detection Methods Applications Problem solutionsCategorical Data Discrete Sequences and Time Series Contextual Anomalies Collective Anomalies
Conditional Probability Test [18]
Identify unusual combinations of attribute values
r(at bt) =P (at bt)
P (at)P (bt)
A capB = φ Assumption If r(at bt) is low and is observed in test record t
then t is anomalous For a test record t
For each mutually exclusive pair of attribute sets ABcompute r(at bt)
Score t based on all r-values Assign minimum r-value as score Take product of all r-values
Need to compare exponential pairs of subsets Only consider subsets upto size k Ignore subsets with frequency less than a threshold α Avoid comparing independent subsets of attributes
micro(AB) ge βmicroChawla and Chandola Anomaly Detection
Introduction Data Mining Methods Density-based anomaly Commute Time Approach Addressing Scalability Anomalies in Complex Data Evaluating Anomaly Detection Methods Applications Problem solutionsCategorical Data Discrete Sequences and Time Series Contextual Anomalies Collective Anomalies
Estimating Probabilities for CPT [18]
Maximum LikelihoodEstimation
P (at bt)
P (at)P (bt)=C(at bt)
Ntimes N
C(at)times N
C(bt)
C(at) Number of traininginstances with A = at
N Total number of traininginstances
Laplace Smoothing
E(p) =C(p) + 1
N + 2
r(at bt) =E(at bt)
E(at)times E(bt)
Speedup Tricks
Replace rare attributevalues with genericattribute (reduce arity)
Use efficient datastructure to querying forcounts(AD Trees [26])
ADTrees work fasterfor low arity attributes
Chawla and Chandola Anomaly Detection
Introduction Data Mining Methods Density-based anomaly Commute Time Approach Addressing Scalability Anomalies in Complex Data Evaluating Anomaly Detection Methods Applications Problem solutionsCategorical Data Discrete Sequences and Time Series Contextual Anomalies Collective Anomalies
Finding Anomalies in Discrete Sequences
Many problem formulations
1 Anomalous symbols in asequence
2 Anomalous subsequence in asequence
3 Anomalous sequence in adatabase of sequences
See [11] for a comparativeevaluation [9] for a survey
login pwdmail ssh mail web logoutlogin pwdmail web web web web logoutlogin pwdmail ssh mail web web logoutlogin pwdwebmail ssh webmail logoutloginpwd loginpwd loginpwd logout
Chawla and Chandola Anomaly Detection
Introduction Data Mining Methods Density-based anomaly Commute Time Approach Addressing Scalability Anomalies in Complex Data Evaluating Anomaly Detection Methods Applications Problem solutionsCategorical Data Discrete Sequences and Time Series Contextual Anomalies Collective Anomalies
Treating Sequences as Points
Utilize a distancesimilarity measure Plug into a distancedensityclustering based method
Simplest Hamming Distance
h(Ai Bi) = 1 Ai 6= Bi= 0 Ai = Bi
H(AB) =nsumi=1
h(Ai Bi)
Issues Unequal lengths misalignment Normalized Length of Longest Common Subsequence
D(AB) = 1minus |LCS(AB)|radic|A||B|
Standard Dynamic Programming method is slow Faster versions available (Hunt Szymnaski method [7])
Weaknesses Cannot localize anomalies within a sequence Weak anomaly signals might get lost
Chawla and Chandola Anomaly Detection
Introduction Data Mining Methods Density-based anomaly Commute Time Approach Addressing Scalability Anomalies in Complex Data Evaluating Anomaly Detection Methods Applications Problem solutionsCategorical Data Discrete Sequences and Time Series Contextual Anomalies Collective Anomalies
Using Sliding Windows
Slide a window of size k
Extract all windows from a sequence (nminus k + 1)
Training (Creating a normal dictionary) Store all uniquewindows in all normal sequences and their counts
Testing For each window find the frequency in normal dictionary Anomaly score is inverse of the aggregate frequencies for all
windows (normalized by length)
Many variants exist For each window find the hamming distance to the closest
window in the normal dictionary [16]
Issues Penalizes low frequency windows in the normal dictionary Rewards high frequency windows that might not be relevant Can construct anomalous sequences that will escape detection
Chawla and Chandola Anomaly Detection
Introduction Data Mining Methods Density-based anomaly Commute Time Approach Addressing Scalability Anomalies in Complex Data Evaluating Anomaly Detection Methods Applications Problem solutionsCategorical Data Discrete Sequences and Time Series Contextual Anomalies Collective Anomalies
Using Probabilistic Models
Probability of occurrence of sequence S
P (S) =nprodi=1
P (Si|S1 Siminus1)
Short memory property of sequences
P (Si|S1 Siminus1) = P (Si|Siminusk Siminus1)
Conditional probability estimates for a symbol Si
P (Si|Siminusk Siminus1) =f(Si|Siminusk Si)f(Si|Siminusk Siminus1)
f is estimated from the normal dictionary
Anomaly score for a test sequence is inverse of the normalizedprobability of occurrence
Issues What if the suffix occurs very infrequently in thenormal data (or not at all)
Replace with the longest suffix that occurs sufficient number oftimes [32] - Probabilistic Suffix Trees
Significantly reduces the size of the modelChawla and Chandola Anomaly Detection
Introduction Data Mining Methods Density-based anomaly Commute Time Approach Addressing Scalability Anomalies in Complex Data Evaluating Anomaly Detection Methods Applications Problem solutionsCategorical Data Discrete Sequences and Time Series Contextual Anomalies Collective Anomalies
Finding Contextual Anomalies
Sometimes contextual information isavailable about data
Not used directly as a feature Are well understood no anomalies in
the context Can reduce false positives and yield
interesting anomalies
Example adapted from [30]
Clearest Outlier
Conditional Anomaly
Maximum Daily Temperature
Number
ofFever
Cases
Contextual anomalies - Anomalous with respect to a context Context is defined using environmental variables
Spatial (Latitude Longitude) Graph context (Edges Weights) Temporal location Domain specific (Demographic other)
How to incorporate context Reduce to traditional anomaly detection (subset on context) Explicitly model contextual information (time series spatial)
Chawla and Chandola Anomaly Detection
Introduction Data Mining Methods Density-based anomaly Commute Time Approach Addressing Scalability Anomalies in Complex Data Evaluating Anomaly Detection Methods Applications Problem solutionsCategorical Data Discrete Sequences and Time Series Contextual Anomalies Collective Anomalies
Conditional Anomaly Detection
Data instance d rArru1 u2 udU v1 v2 vdV
dU environmentalattributes
dV indicator attributes u1
u2
U1
U2
U3
v1
v2
V1V2
V3
p(V1|U3) = 02
p(V2|U3) = 02
p(V3|U3) = 06
Algorithm [30]
1 Learn a Gaussian Mixture Model (GMM)U = U1 U2 UnU
each with dimensionality dU2 Learn a set of Gaussians U = V1 V2 VnV
each withdimensionality dV
3 Learn a probabilistic mapping function p(Vj |Ui)4 Score a test instance d = [uv]
S =
nUsumi=1
p(u|Ui)nVsumj=1
p(v|Vj)p(Vj |Ui)
Chawla and Chandola Anomaly Detection
Introduction Data Mining Methods Density-based anomaly Commute Time Approach Addressing Scalability Anomalies in Complex Data Evaluating Anomaly Detection Methods Applications Problem solutionsCategorical Data Discrete Sequences and Time Series Contextual Anomalies Collective Anomalies
Finding Collective Anomalies
Find a collection of data points
Each point by itself is normal
The collection as a whole isanomalous
Relevant when data has inherentstructure and
When domain definition ofanomalies cannot be described aspoint anomalies
A Simple Solution
1 Break data intogroups
2 Compute features foreach group
3 Apply traditionalanomaly detection
Examples
1 Time series
2 Image
3 Spatial clusters ofgalaxies
Chawla and Chandola Anomaly Detection
Introduction Data Mining Methods Density-based anomaly Commute Time Approach Addressing Scalability Anomalies in Complex Data Evaluating Anomaly Detection Methods Applications Problem solutionsCategorical Data Discrete Sequences and Time Series Contextual Anomalies Collective Anomalies
Using Latent Dirichlet Allocation for Group Anomalies
Find anomalous groups in data [34]
Example Spatial clusters of galaxies topics red green emissive words continuous features
Flexible Genre Model (FGM)
For each group
1 Draw a genre 1 2 T 3 ym simM(π)2 Draw topic distribution forym SK 3 θm sim Dir(αym)
3 Draw K topicsβmk sim P (βmk|ηk)k=12K
4 For each point in group
1 Draw topic membershipzmn simM(θn)
2 Generate pointxmn isin P (xmn|βmzmn)
α
zmn
xmn
N
θm
T
π
ηK
ym
β
MK
Model Parameters
M(π) -Multinomial
Genre - Dir(αt)
Topic generatorsP (|ηk)- GIW
Point generatorsP (xmn|βnk) -MultivariateGaussian
Chawla and Chandola Anomaly Detection
Introduction Data Mining Methods Density-based anomaly Commute Time Approach Addressing Scalability Anomalies in Complex Data Evaluating Anomaly Detection Methods Applications Problem solutionsCategorical Data Discrete Sequences and Time Series Contextual Anomalies Collective Anomalies
Inference and Testing for FGM
Inference and Learning Parameters
Approximate inference of latentvariables (Gibbs Sampling)
Use samples to learn parameters(Single step Monte Carlo EM)
Topic 1
Topic 2
Topic 3
Anomaly Detection
Infer the topic distribution θm
Compute negative log likelihood wrt αt
Rationale An anomalous group will be unlikely to begenerated from any genre
Geometric interpretation Mapping each group into a Tdimensional space and finding anomalies
Chawla and Chandola Anomaly Detection
Introduction Data Mining Methods Density-based anomaly Commute Time Approach Addressing Scalability Anomalies in Complex Data Evaluating Anomaly Detection Methods Applications Problem solutions
Evaluating Anomaly Detection Methods - Labels
Labeled validation data set exists Confusion matrix Traditional evaluation metrics
Class imbalance
ROC Curve
Validation set does not exist Use domain expertise to find TP
and FP FN is harder to estimate
Pseudo false negativeestimation techniques [25]
Predicteda n
Actuala TP FNn FP TN
Acc =TP + TNsum
Rec (R) =TP
TP + FN
Prec (P ) =TP
TP + FP
F =2 lowastR lowast PR+ P
Chawla and Chandola Anomaly Detection
Introduction Data Mining Methods Density-based anomaly Commute Time Approach Addressing Scalability Anomalies in Complex Data Evaluating Anomaly Detection Methods Applications Problem solutions
Evaluating Anomaly Detection Methods - Scores
Convert to binary output Use threshold δ on score (Scale
issues [21]) Take top x as anomalies
ROC curve by varying x or δ
Quality of output Does the output ldquosuggestrdquo x or δ Which output is better
Chawla and Chandola Anomaly Detection
Introduction Data Mining Methods Density-based anomaly Commute Time Approach Addressing Scalability Anomalies in Complex Data Evaluating Anomaly Detection Methods Applications Problem solutions
Unifying Scores
Different methods assign scores in differentranges
kNN-based scores [0 1] Lof scores [1 6] ABOD scores [0 80000]
Anomalies have lower scores
Direct scaling to [0 1] might lose distinctionbetween normal and anomalies
Desired scaling Stretch interesting rangesand shrink irrelevant ones
Generalized Procedure for Normalizing Outlier Scores [21] Regularity rArr S(o) ge 0forallo S(o) asymp 0 if o is normal andS(o) 0 if o is anomalous
Normality S is regular and S(o) isin [0 1]forallo
Chawla and Chandola Anomaly Detection
Introduction Data Mining Methods Density-based anomaly Commute Time Approach Addressing Scalability Anomalies in Complex Data Evaluating Anomaly Detection Methods Applications Problem solutions
Regularization and Normalization of Scores
Regularization
1 R(o) = max0 S(o)minus baseS2 R(o) = Smax minus S(o)
3 R(o) = minus log SmaxS(o)
Normalization
1 N(o) = S(o)Smax
2 N(o) = max(
0 erf(S(o)minusmicroSσS radic2
))(Gaussian Scaling)
Suited for high dimensional data
3 N(o) = max(
0cdfγS (o)minusmicroγ
1minusmicroγ
)(Gamma Scaling)
Where cdfγS (o) = P (k S(o) θ) P is the regularized Gamma function Suited for low dimensional data
Chawla and Chandola Anomaly Detection
Introduction Data Mining Methods Density-based anomaly Commute Time Approach Addressing Scalability Anomalies in Complex Data Evaluating Anomaly Detection Methods Applications Problem solutions
Generating Labeled Data for Validation
Generating Both Normal and Anomalous Data
Use generative models for normal and anomalous behavior
Several generators available Multivariate continuous data [27] Multivariate categorical data [5] Discrete sequences using HMM [12]
Drawbacks Might not capture the domain characteristics
Injecting Anomalies - Random Perturbation[30]
Given data point z = xy x and y arepartitions of feature space
Take a random sample D of the entire data set
Let zprime = xprimeyprime isin D such that distancebetween y and yprime is maximum
Replace x with xprime and add z back to data setx
yz
zprime
Injected anomaly
Chawla and Chandola Anomaly Detection
Introduction Data Mining Methods Density-based anomaly Commute Time Approach Addressing Scalability Anomalies in Complex Data Evaluating Anomaly Detection Methods Applications Problem solutionsWhat is Network Anomaly Detection Motivation How Much Serious
Applications Overview
How to set up an anomaly detection solution for agiven application domain
Available data Define anomalies define normal behavior Identify requirements and constraints (online
real-time limited resources) What domain knowledge available
Feature identification Defining normal and anomalous behavior Tuning parameters
Available ground truth (training validation)
Chawla and Chandola Anomaly Detection
Introduction Data Mining Methods Density-based anomaly Commute Time Approach Addressing Scalability Anomalies in Complex Data Evaluating Anomaly Detection Methods Applications Problem solutionsWhat is Network Anomaly Detection Motivation How Much Serious
What is Network Anomaly Detection
Anomaly Detection or Intrusion Detection
Traditional Intrusion Detection Systems (IDS) finding attackscorresponding to predefined pattern data set known as signaturestherefore system is absolutely vulnerable against zero-day attacks
Network Anomaly Detection Systems (NADS) to detectzero-day attacks without any pre-identified signature besides profilenormal behavior of the network and address suspected incidents
Network Anomaly Detection finding unusual and largechanges in the network traffic
Examples intentional attacks (eg Distributed Denial ofService - DDoS) or unusual network traffic (eg flash crowds)
Chawla and Chandola Anomaly Detection
Introduction Data Mining Methods Density-based anomaly Commute Time Approach Addressing Scalability Anomalies in Complex Data Evaluating Anomaly Detection Methods Applications Problem solutionsWhat is Network Anomaly Detection Motivation How Much Serious
Motivation How Much Serious
According to Symantec report released in early 2011 morethan 286 million new threats have been detected in 2010which is a huge number
1656227
2704836
1000000
1500000
2000000
2500000
3000000
20547 18827 69107 113025 140690
624267
1656227
2704836
0
500000
1000000
1500000
2000000
2500000
3000000
2002 2003 2004 2005 2006 2007 2008 July2009-June2010
Chawla and Chandola Anomaly Detection
Introduction Data Mining Methods Density-based anomaly Commute Time Approach Addressing Scalability Anomalies in Complex Data Evaluating Anomaly Detection Methods Applications Problem solutionsNetwork Topology Network Anomalies Detection Problem Network Anomalies Detection Problem Why care about OD Flows
Network Topology
A Typical network
1 y
Router
2
3
41t
x2t
x1t
x3t
x4t
Origin-Destination (OD) flow is the traffic that enters at anorigin node and exits at a destination node of a backbonenetwork x1t x1t
Link measurement is the traffic enters at an node during aninterval y1t
Relationship between link traffic and OD flow traffic iscaptured by the routing matrix A
Chawla and Chandola Anomaly Detection
Introduction Data Mining Methods Density-based anomaly Commute Time Approach Addressing Scalability Anomalies in Complex Data Evaluating Anomaly Detection Methods Applications Problem solutionsNetwork Topology Network Anomalies Detection Problem Network Anomalies Detection Problem Why care about OD Flows
Network Anomalies Detection Problem
Chawla and Chandola Anomaly Detection
Introduction Data Mining Methods Density-based anomaly Commute Time Approach Addressing Scalability Anomalies in Complex Data Evaluating Anomaly Detection Methods Applications Problem solutionsNetwork Topology Network Anomalies Detection Problem Network Anomalies Detection Problem Why care about OD Flows
Network Anomalies Detection Problem
Chawla and Chandola Anomaly Detection
Introduction Data Mining Methods Density-based anomaly Commute Time Approach Addressing Scalability Anomalies in Complex Data Evaluating Anomaly Detection Methods Applications Problem solutionsNetwork Topology Network Anomalies Detection Problem Network Anomalies Detection Problem Why care about OD Flows
Why care about OD Flows
Volume anomaly typically arises on an OD flow (trafficarriving at one node and destined for another node)
If we only monitor traffic on network links volume arisingfrom an OD flow may not be noticeable Thus naiveapproach wont work if OD flow info is not available
Figure source [22]
Chawla and Chandola Anomaly Detection
Introduction Data Mining Methods Density-based anomaly Commute Time Approach Addressing Scalability Anomalies in Complex Data Evaluating Anomaly Detection Methods Applications Problem solutionsPCA and Subspace Method Subspace Method Algorithm Subspace Analysis Results Discussion Typical Characteristics of Anomaly Limitation of Volume Entropy Based versus Volume Based Fraud Detection Epidemeology Anomaly Detection in Climate and Weather Anomalies in Climate Validation of Anomalies
PCA and Subspace Method
Chawla and Chandola Anomaly Detection
Introduction Data Mining Methods Density-based anomaly Commute Time Approach Addressing Scalability Anomalies in Complex Data Evaluating Anomaly Detection Methods Applications Problem solutionsPCA and Subspace Method Subspace Method Algorithm Subspace Analysis Results Discussion Typical Characteristics of Anomaly Limitation of Volume Entropy Based versus Volume Based Fraud Detection Epidemeology Anomaly Detection in Climate and Weather Anomalies in Climate Validation of Anomalies
Subspace Method Algorithm
Step1- Determine the PCs based on eigenvaluedecomposition of the covariance matrix of the dataset
Step2- Choose first top k principle components with thehighest eigenvalues as matrix P
Step3-normal traffic subspace called Z
Z = PP TZ = CZ
Step4-abnormal traffic subspace called Z
Z = (I minus PP T )Z = CZ
Step5-If the norm of a vector is large then it is an rdquoanomalyrdquo
Chawla and Chandola Anomaly Detection
Introduction Data Mining Methods Density-based anomaly Commute Time Approach Addressing Scalability Anomalies in Complex Data Evaluating Anomaly Detection Methods Applications Problem solutionsPCA and Subspace Method Subspace Method Algorithm Subspace Analysis Results Discussion Typical Characteristics of Anomaly Limitation of Volume Entropy Based versus Volume Based Fraud Detection Epidemeology Anomaly Detection in Climate and Weather Anomalies in Climate Validation of Anomalies
Subspace Analysis Results
Note that during anomaly normal component does not changethat much while residual component changes quite a lot
Thus anomalies can be detected by setting some threshold
Figure source [22]
Chawla and Chandola Anomaly Detection
Introduction Data Mining Methods Density-based anomaly Commute Time Approach Addressing Scalability Anomalies in Complex Data Evaluating Anomaly Detection Methods Applications Problem solutionsPCA and Subspace Method Subspace Method Algorithm Subspace Analysis Results Discussion Typical Characteristics of Anomaly Limitation of Volume Entropy Based versus Volume Based Fraud Detection Epidemeology Anomaly Detection in Climate and Weather Anomalies in Climate Validation of Anomalies
Discussion Typical Characteristics of Anomaly
Most Anomalies induce a change in distributionalaspects of packet header fields (called features)
Most important features include 5-tuple Source ampdestination IP addresses Source and destination portnumbers and IP protocol
raquo DOS attack ndash multiple source IP address concentrated on asingle destination IP address
raquo Network scan ndash dispersed distribution of destination addresses
raquo Most wormsviruses also induce some change in distribution ofcertain features
raquo However these changes can be very subtle and mining them islike searching for needles in a haystack
Unlike many previous approach this paper aims todetect events which disturb the distribution of trafficfeatures rather than traffic volume
Chawla and Chandola Anomaly Detection
Introduction Data Mining Methods Density-based anomaly Commute Time Approach Addressing Scalability Anomalies in Complex Data Evaluating Anomaly Detection Methods Applications Problem solutionsPCA and Subspace Method Subspace Method Algorithm Subspace Analysis Results Discussion Typical Characteristics of Anomaly Limitation of Volume Entropy Based versus Volume Based Fraud Detection Epidemeology Anomaly Detection in Climate and Weather Anomalies in Climate Validation of Anomalies
Limitation of Volume
Figure source [22]
Port scan anomaly (traffic feature changes however traffic volume
remains more or less the same)
We can use entropy tocapture the variationsin the traffic feature
bullTakes value 0 when distribution is maximally concentratedbullTakes value log2N when distribution is maximally dispersed
But stands out in
feature entropy
which also reveals
its structure
Port scan
dwarfed
in volume
metricshellip
Chawla and Chandola Anomaly Detection
Introduction Data Mining Methods Density-based anomaly Commute Time Approach Addressing Scalability Anomalies in Complex Data Evaluating Anomaly Detection Methods Applications Problem solutionsPCA and Subspace Method Subspace Method Algorithm Subspace Analysis Results Discussion Typical Characteristics of Anomaly Limitation of Volume Entropy Based versus Volume Based Fraud Detection Epidemeology Anomaly Detection in Climate and Weather Anomalies in Climate Validation of Anomalies
Entropy Based versus Volume Based
DoSDDoS Attacks- a spike in traffic data toward adominant destination IP
Scan anomaly-a spike in traffic data from a dominant sourceIP
Flash Crowd anomaly- again a spike in traffic data to adominant destination IP
Worm anomaly-a Spike in traffic with a dominant port
Chawla and Chandola Anomaly Detection
Introduction Data Mining Methods Density-based anomaly Commute Time Approach Addressing Scalability Anomalies in Complex Data Evaluating Anomaly Detection Methods Applications Problem solutionsPCA and Subspace Method Subspace Method Algorithm Subspace Analysis Results Discussion Typical Characteristics of Anomaly Limitation of Volume Entropy Based versus Volume Based Fraud Detection Epidemeology Anomaly Detection in Climate and Weather Anomalies in Climate Validation of Anomalies
Fraud Detection
Domain Question Identifyfraudulent activities or players fromobserved transaction data
Data Transactions between different
players in the system Meta information about the
individuals An underlying graph structure
Challenges Track and model human behavior Anomalies caused by adaptive
human adversaries Massive data sizes
Insurance (autohealtha)
ClaimantProvider Payer
Telecommunications Customer
Provider
Credit Cards Customer
Supplier Bank
Web Advertising User Advertiser
Publisher
ahttpwwwcheatingculturecompast-cases-of-medicare-fraud
Chawla and Chandola Anomaly Detection
Introduction Data Mining Methods Density-based anomaly Commute Time Approach Addressing Scalability Anomalies in Complex Data Evaluating Anomaly Detection Methods Applications Problem solutionsPCA and Subspace Method Subspace Method Algorithm Subspace Analysis Results Discussion Typical Characteristics of Anomaly Limitation of Volume Entropy Based versus Volume Based Fraud Detection Epidemeology Anomaly Detection in Climate and Weather Anomalies in Climate Validation of Anomalies
A Generic Fraud Detection Method
Activity Monitoring [13]1 Build profiles for individuals (customers users etc) based on
historic data User X makes n calls on an average in January
2 Compare current behavior with historical profile for significantdeviations
Clustering based [4]1 Cluster historical profiles of customers2 Identify small clusters or outlying profiles as anomalies
Strengths Anomaly detection is fast (good for real time) Results are easy to explain
Weaknesses Need to create and maintain a large number of profiles Not dynamic Adequate historical data might not be available Too many false positives
Chawla and Chandola Anomaly Detection
Introduction Data Mining Methods Density-based anomaly Commute Time Approach Addressing Scalability Anomalies in Complex Data Evaluating Anomaly Detection Methods Applications Problem solutionsPCA and Subspace Method Subspace Method Algorithm Subspace Analysis Results Discussion Typical Characteristics of Anomaly Limitation of Volume Entropy Based versus Volume Based Fraud Detection Epidemeology Anomaly Detection in Climate and Weather Anomalies in Climate Validation of Anomalies
Exploiting Graph Structure - Weighted Graphs
Represent data as a weighted graph Communication networks (phone email SMS) Provider referral networks
Objective Identify anomalous nodes
For each node extract several features based on the propertiesof the induced sub-graph (egonet) of neighboring nodes [1]
Choose features that can highlight anomalous nodes
1 Ni degree of node2 Ei number of edges in egonet3 Wi total weight of egonet4 λi principal eigen vector of weighted adjacency matrix of
egonet
Data is transformed into a point in a multi-dimensional space
Chawla and Chandola Anomaly Detection
Introduction Data Mining Methods Density-based anomaly Commute Time Approach Addressing Scalability Anomalies in Complex Data Evaluating Anomaly Detection Methods Applications Problem solutionsPCA and Subspace Method Subspace Method Algorithm Subspace Analysis Results Discussion Typical Characteristics of Anomaly Limitation of Volume Entropy Based versus Volume Based Fraud Detection Epidemeology Anomaly Detection in Climate and Weather Anomalies in Climate Validation of Anomalies
Identifying Anomalies
Traditional anomaly detection (lof) Can be slow but can identify any type of anomalous structure
Faster method to identify specific types of anomalousstructures
Identify relevant feature pairs and power law relationship
Eg Egonet Density Power Law Ni vs Ei - detect nearcliques and stars
Ei prop Nαi 1 le α le 2
Anomaly score for node i wrt a pair of features (y = Cxθ)
Si =max(yi Cx
θi )
min(yi Cxθi )lowast log (|yi minus Cxθi |+ 1)
Chawla and Chandola Anomaly Detection
Introduction Data Mining Methods Density-based anomaly Commute Time Approach Addressing Scalability Anomalies in Complex Data Evaluating Anomaly Detection Methods Applications Problem solutionsPCA and Subspace Method Subspace Method Algorithm Subspace Analysis Results Discussion Typical Characteristics of Anomaly Limitation of Volume Entropy Based versus Volume Based Fraud Detection Epidemeology Anomaly Detection in Climate and Weather Anomalies in Climate Validation of Anomalies
Exploiting Graph Structure - Bipartite Graphs
Represent data as a bipartite graph Healthcare Data (Beneficiaries vs Providers) Insider trading (Traders vs Stocks)
Objective Identify anomalous links
Given a query node a isin V1 find the ldquorelevancerdquoof all other nodes in V1 to a
RelevanceScore(a b) prop Number of times aldquorandom walkrdquo from a reaches b
Use the relevance scores to compute thenormality scores for a node t isin V2
Find set St = a|〈a t〉 isin E Compute |St| times |St| similarity matrix using
relevance vectors for a isin St Normality Score = mean of non-diagonal entries
of similarity matrix
V1 E V2a1
a2
a3
an
t1
t2
t3
tn
Chawla and Chandola Anomaly Detection
Introduction Data Mining Methods Density-based anomaly Commute Time Approach Addressing Scalability Anomalies in Complex Data Evaluating Anomaly Detection Methods Applications Problem solutionsPCA and Subspace Method Subspace Method Algorithm Subspace Analysis Results Discussion Typical Characteristics of Anomaly Limitation of Volume Entropy Based versus Volume Based Fraud Detection Epidemeology Anomaly Detection in Climate and Weather Anomalies in Climate Validation of Anomalies
Detecting Disease Outbreaks
Domain Question Early detection of disease
outbreaks Anthrax attack
Data Emergency department visits Grocery data (Example [14]) Clinical visits Weatherclimate data
Challenges Weak signals in the data
ED cases involving cough rArrFlu or SARS
Integration of multiple signals(lag analysis)
Account for spatial and temporalcorrelations
Chawla and Chandola Anomaly Detection
Introduction Data Mining Methods Density-based anomaly Commute Time Approach Addressing Scalability Anomalies in Complex Data Evaluating Anomaly Detection Methods Applications Problem solutionsPCA and Subspace Method Subspace Method Algorithm Subspace Analysis Results Discussion Typical Characteristics of Anomaly Limitation of Volume Entropy Based versus Volume Based Fraud Detection Epidemeology Anomaly Detection in Climate and Weather Anomalies in Climate Validation of Anomalies
Whatrsquos Significant About Recent Events (WSARE) [33]
1 Learn Bayesian network from historical data Environmental and response variables
2 Sample from the BN (DBbaseline|Current Environment)3 Compute contingency table for rules for DBbaseline andDBcurrent
Rules are single assignment rules (Xi = Y ji ) or conjunctions4 Find p-value for rules using χ2-test
Null Hypothesis Rows and columns of tables for DBbaselineand DBcurrent are independent
5 Find rule with largest p-value Repeat Step 2
Chawla and Chandola Anomaly Detection
Introduction Data Mining Methods Density-based anomaly Commute Time Approach Addressing Scalability Anomalies in Complex Data Evaluating Anomaly Detection Methods Applications Problem solutionsPCA and Subspace Method Subspace Method Algorithm Subspace Analysis Results Discussion Typical Characteristics of Anomaly Limitation of Volume Entropy Based versus Volume Based Fraud Detection Epidemeology Anomaly Detection in Climate and Weather Anomalies in Climate Validation of Anomalies
Incorporating Spatial and Temporal Relationships
WSARE does not explicitly model the spatial and temporalrelationships
What happened yesterday What happened in the adjoining neighborhood (yesterday)
Bayesian Network Spatio-Temporal (BNST) modelingframework [17]
Add nodes for temporal and spatial dependencies Need more data to train
Chawla and Chandola Anomaly Detection
Introduction Data Mining Methods Density-based anomaly Commute Time Approach Addressing Scalability Anomalies in Complex Data Evaluating Anomaly Detection Methods Applications Problem solutionsPCA and Subspace Method Subspace Method Algorithm Subspace Analysis Results Discussion Typical Characteristics of Anomaly Limitation of Volume Entropy Based versus Volume Based Fraud Detection Epidemeology Anomaly Detection in Climate and Weather Anomalies in Climate Validation of Anomalies
Anomaly Detection in Climate and Weather
Science Questions Identify natural and anthropogenic disasters Identify long time scale events - droughts atmospheric rivers
cold fronts etc
Data Ground observations Remote sensing data (satellites
air-borne) Climate model simulation outputs Multiple variables spatio-temporal (often has height dimension
as well)
Challenges Model spatio-temporal relationships across multiple variables Explain the cause of anomalies Massive data sizes
Climate and weather extreme events are well defined
Key challenge is to find significant events and explain the cause
Chawla and Chandola Anomaly Detection
Introduction Data Mining Methods Density-based anomaly Commute Time Approach Addressing Scalability Anomalies in Complex Data Evaluating Anomaly Detection Methods Applications Problem solutionsPCA and Subspace Method Subspace Method Algorithm Subspace Analysis Results Discussion Typical Characteristics of Anomaly Limitation of Volume Entropy Based versus Volume Based Fraud Detection Epidemeology Anomaly Detection in Climate and Weather Anomalies in Climate Validation of Anomalies
Anomalies are Widely Used in Climate
Most analysis done on ldquoanomalyrdquo time series
Difference from a ldquobase periodrdquo (Toosimplistic)
Brings spatial smoothness (eg a mountaintop and nearby valley can have very differenttemperatures) Removes seasonality
Understand climate and weatherphenomenon
Southern Oscillation Index (SOI) Difference between Sea Level Pressure
(SLP) anomalies for Tahiti and DarwinAustralia
Figure Global AverageTemperature Anomaly(1975 - 2007) Srcwwwmetofficegovuk
Chawla and Chandola Anomaly Detection
Introduction Data Mining Methods Density-based anomaly Commute Time Approach Addressing Scalability Anomalies in Complex Data Evaluating Anomaly Detection Methods Applications Problem solutionsPCA and Subspace Method Subspace Method Algorithm Subspace Analysis Results Discussion Typical Characteristics of Anomaly Limitation of Volume Entropy Based versus Volume Based Fraud Detection Epidemeology Anomaly Detection in Climate and Weather Anomalies in Climate Validation of Anomalies
Constructing Anomalies from Raw Data
Anomaly time series for a given location i
vprimei = vi minus bi
where bi is the base (reference)
How to choose bi Mean of all data for location i Monthly mean values (account for seasonality) Monthly z-score values Median (more robust) Using a shorter ldquoreference periodrdquo
30 year moving window
Different methods show statistically significant differences[19] What is the right strategy Weighted mean of different strategies (Pick weights using
Monte Carlo sampling)
Chawla and Chandola Anomaly Detection
Introduction Data Mining Methods Density-based anomaly Commute Time Approach Addressing Scalability Anomalies in Complex Data Evaluating Anomaly Detection Methods Applications Problem solutionsPCA and Subspace Method Subspace Method Algorithm Subspace Analysis Results Discussion Typical Characteristics of Anomaly Limitation of Volume Entropy Based versus Volume Based Fraud Detection Epidemeology Anomaly Detection in Climate and Weather Anomalies in Climate Validation of Anomalies
Anomaly Detection for Identifying Droughts
Science question Identify significant drought patterns usinghistorical observation data or future simulation data or both
Find persistent spatiotemporal anomalies in precipitation data
A two step approach
1 Find precipitationanomalies usingthresholds
2 Find large connectedcomponents across spaceand time
Matlab - bwlabelbwlabeln
Followup Science questionExplain cause
(drought190120061avi)
Figure Video courtsey Dr ArindamBanerjee
Chawla and Chandola Anomaly Detection
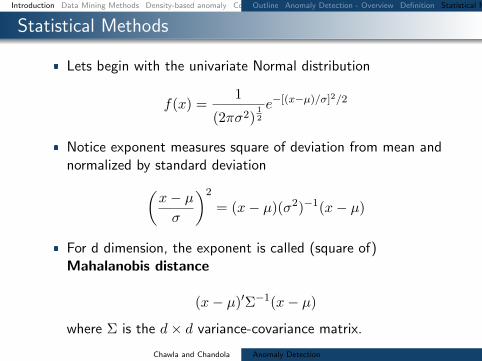
Introduction Data Mining Methods Density-based anomaly Commute Time Approach Addressing Scalability Anomalies in Complex Data Evaluating Anomaly Detection Methods Applications Problem solutionsOutline Anomaly Detection - Overview Definition Statistical Methods Anomaly Detection with Mahalanobis Distance Mahalanobis vs Euclidean Distance
Statistical Methods
Lets begin with the univariate Normal distribution
f(x) =1
(2πσ2)12
eminus[(xminusmicro)σ]22
Notice exponent measures square of deviation from mean andnormalized by standard deviation(
xminus microσ
)2
= (xminus micro)(σ2)minus1(xminus micro)
For d dimension the exponent is called (square of)Mahalanobis distance
(xminus micro)primeΣminus1(xminus micro)
where Σ is the dtimes d variance-covariance matrix
Chawla and Chandola Anomaly Detection
Introduction Data Mining Methods Density-based anomaly Commute Time Approach Addressing Scalability Anomalies in Complex Data Evaluating Anomaly Detection Methods Applications Problem solutionsOutline Anomaly Detection - Overview Definition Statistical Methods Anomaly Detection with Mahalanobis Distance Mahalanobis vs Euclidean Distance
Anomaly Detection with Mahalanobis Distance
The key observation is that if data x follows a d dimensionalGaussian distribution then
(xminus micro)primeΣminus1(xminus micro) asymp χ2d
Anomalies can be found in the tail of the distribution
There are three major weaknesses of the above approach Data may not follow a Normal distribution or be a mixture of
distributions Both mean and variance of χ2 is d For high-dimensional data
this is a problem Mean and thus variance are extremely sensitive to outliers -and
we are using them to find anomalies - often leads to falsenegatives
Chawla and Chandola Anomaly Detection
Introduction Data Mining Methods Density-based anomaly Commute Time Approach Addressing Scalability Anomalies in Complex Data Evaluating Anomaly Detection Methods Applications Problem solutionsOutline Anomaly Detection - Overview Definition Statistical Methods Anomaly Detection with Mahalanobis Distance Mahalanobis vs Euclidean Distance
Mahalanobis vs Euclidean Distance
Mahalanobis normalizes for variance
minus10 minus5 0 5 10minus10
minus8
minus6
minus4
minus2
0
2
4
6
8
10
14
61
16
29
Point Pairs Mahalanobis Euclidean
(1429) 507 1178
(1661) 483 684
Chawla and Chandola Anomaly Detection
Introduction Data Mining Methods Density-based anomaly Commute Time Approach Addressing Scalability Anomalies in Complex Data Evaluating Anomaly Detection Methods Applications Problem solutionsDistance-based anomalies DB(pD) outlier Distance-based methods (DB(kN) Pruning rule Examples of pruning technique Strengths and weaknesses - Distance-based techniques
Distance-based anomalies
Intuition A data point which is far away from its nearestneighbors is a candidate anomaly
Several definitions which capture the above intuition
DB(pD) anomaly [20] an object o in a data set T is aDB(pD) anomaly if at least a fraction p of objects in T havedistances greater than D from o
Generalizes the notion of ldquothree standard deviation from themeanrdquo
This definition had a huge influence on subsequentdevelopment in outlier detection
Chawla and Chandola Anomaly Detection
Introduction Data Mining Methods Density-based anomaly Commute Time Approach Addressing Scalability Anomalies in Complex Data Evaluating Anomaly Detection Methods Applications Problem solutionsDistance-based anomalies DB(pD) outlier Distance-based methods (DB(kN) Pruning rule Examples of pruning technique Strengths and weaknesses - Distance-based techniques
DB(pD) outlier
To build some intuition consider data generated from theNormal distribution N(0 1) Then if O is a DB(pD) outlier
1
(2π)12
int O+D
OminusDeminus
x2
2 dx le 1minus p
Example If O is 3 (3 standard deviations away from themean) then it is a DB(01 0999) outlier
Thus for particular settings of D and p DB(pD) capturesstandard outliers
But much more general (eg any distance metric)
Chawla and Chandola Anomaly Detection
Introduction Data Mining Methods Density-based anomaly Commute Time Approach Addressing Scalability Anomalies in Complex Data Evaluating Anomaly Detection Methods Applications Problem solutionsDistance-based anomalies DB(pD) outlier Distance-based methods (DB(kN) Pruning rule Examples of pruning technique Strengths and weaknesses - Distance-based techniques
Distance-based methods (DB(kN)
DB(kN) anomaly [28] top N data instances whosedistances to its k-th nearest neighbor are largest
Several advantages Ranking for anomalies is more intuitiveSetting of parameters generally easier
A Simple Nested Loop (SNL) algorithm can be used to selectthe top N DB(kN) outliers Time complexity is O(n2d)where n is the database size and d is the dimensionality
Chawla and Chandola Anomaly Detection
Introduction Data Mining Methods Density-based anomaly Commute Time Approach Addressing Scalability Anomalies in Complex Data Evaluating Anomaly Detection Methods Applications Problem solutionsDistance-based anomalies DB(pD) outlier Distance-based methods (DB(kN) Pruning rule Examples of pruning technique Strengths and weaknesses - Distance-based techniques
Pruning rule
DB(kN) anomaly [3] a data instance is not an anomaly ifits distance to its k-th current nearest neighbor is less thanthe score of the weakest anomaly among top N anomaliesfound so far
A large number of non-anomalies can be pruned withoutcarrying out a full data search
Complexity nearly O(n)
Chawla and Chandola Anomaly Detection
Introduction Data Mining Methods Density-based anomaly Commute Time Approach Addressing Scalability Anomalies in Complex Data Evaluating Anomaly Detection Methods Applications Problem solutionsDistance-based anomalies DB(pD) outlier Distance-based methods (DB(kN) Pruning rule Examples of pruning technique Strengths and weaknesses - Distance-based techniques
Examples of pruning technique
Non-anomalies are pruned earlier
Chawla and Chandola Anomaly Detection
Introduction Data Mining Methods Density-based anomaly Commute Time Approach Addressing Scalability Anomalies in Complex Data Evaluating Anomaly Detection Methods Applications Problem solutionsDistance-based anomalies DB(pD) outlier Distance-based methods (DB(kN) Pruning rule Examples of pruning technique Strengths and weaknesses - Distance-based techniques
Strengths and weaknesses - Distance-based techniques
Do not make any assumption about the distribution of thedata
Scalable for large dataset (O(n))
Capable of finding only global anomalies
Can lead to non-intuitive results in Top-k situations
0 10 20 30 40 50 60 700
10
20
30
40
50
60
70
dimension 1
dim
en
sio
n 2
p1
p2
p3
p4
Chawla and Chandola Anomaly Detection
Introduction Data Mining Methods Density-based anomaly Commute Time Approach Addressing Scalability Anomalies in Complex Data Evaluating Anomaly Detection Methods Applications Problem solutionsDensity-based anomaly Strengths and Weaknesses
Density-based anomaly
Calculate the density of an object based on the density of itsk nearest neighbours
density(p) = 1
sum
qisinNk(p)distk(p q)
|Nk(p)|
relative-density(p) =
density(p)1
|Nk(p)|sum
qisinNk(p)density(q)
anomaly-score(p) =1
relative-density(p)
LOF indicates a degree of local outlier-ness [6]
Chawla and Chandola Anomaly Detection
Introduction Data Mining Methods Density-based anomaly Commute Time Approach Addressing Scalability Anomalies in Complex Data Evaluating Anomaly Detection Methods Applications Problem solutionsDensity-based anomaly Strengths and Weaknesses
Strengths and Weaknesses
Can detect global and local anomalies
Cannot use pruning technique and has a complexity of O(n2)
Require a method combining the strengths of distance anddensity based approaches A distance based approach whichcan capture density
C
C
O
O1
1
2
2
Chawla and Chandola Anomaly Detection
Introduction Data Mining Methods Density-based anomaly Commute Time Approach Addressing Scalability Anomalies in Complex Data Evaluating Anomaly Detection Methods Applications Problem solutionsCommute time Computation of commute time Anomaly detection using commute time (CDOF) Fast estimation of commute time Scalability for Density-based method PINN Algorithm (ICDM 2010) PINN Guarantee Examples high-dim distance-based outliers Examples high-dim density-based outliers Examples local density-based outliers
Commute time
Commute time between i and j is the expected number ofsteps that a random walk starting at i will take to reach jonce and go back to i for the first time
Commute time can capture both the distance between pointsand the data densities
Chawla and Chandola Anomaly Detection
Introduction Data Mining Methods Density-based anomaly Commute Time Approach Addressing Scalability Anomalies in Complex Data Evaluating Anomaly Detection Methods Applications Problem solutionsCommute time Computation of commute time Anomaly detection using commute time (CDOF) Fast estimation of commute time Scalability for Density-based method PINN Algorithm (ICDM 2010) PINN Guarantee Examples high-dim distance-based outliers Examples high-dim density-based outliers Examples local density-based outliers
Computation of commute time
Commute time can be computed using graph Laplacian matrixL
cij = VG(ei minus ej)TL+(ei minus ej)L+ pseudo-inverse of LVG graph volumeei i-th column of the identity matrix
Commute time is Euclidean distance in the space spanned byeigenvectors of L
cij = VG[(Sminus12V T )(ei minus ej)]T [(Sminus12V T )(ei minus ej)]
V S eigenvectors and eigenvalues of L
Chawla and Chandola Anomaly Detection
Introduction Data Mining Methods Density-based anomaly Commute Time Approach Addressing Scalability Anomalies in Complex Data Evaluating Anomaly Detection Methods Applications Problem solutionsCommute time Computation of commute time Anomaly detection using commute time (CDOF) Fast estimation of commute time Scalability for Density-based method PINN Algorithm (ICDM 2010) PINN Guarantee Examples high-dim distance-based outliers Examples high-dim density-based outliers Examples local density-based outliers
Anomaly detection using commute time (CDOF)
Construct the mutual k nearest neighbor graph G from thedataset
Compute the Laplacian matrix L of G and its eigensystems
Find top N anomalies using the distance-based technique incommute time with pruning rule
Complexity O(n3)
Commute time method can detect global local and groupanomalies
Chawla and Chandola Anomaly Detection
Introduction Data Mining Methods Density-based anomaly Commute Time Approach Addressing Scalability Anomalies in Complex Data Evaluating Anomaly Detection Methods Applications Problem solutionsCommute time Computation of commute time Anomaly detection using commute time (CDOF) Fast estimation of commute time Scalability for Density-based method PINN Algorithm (ICDM 2010) PINN Guarantee Examples high-dim distance-based outliers Examples high-dim density-based outliers Examples local density-based outliers
Fast estimation of commute time
Speilman and Srivastava [31] combined random projection anda linear time solver to build a structure where we can computethe compute time between two nodes in O(log n) time
Complexity of CDOF O(n3)rarr O(n log n)
Uses a near linear time solver for a linear system of equationAx = b
Spielman and Teng solvers Also see work by Iannis Koutisfrom CMU
Chawla and Chandola Anomaly Detection
Introduction Data Mining Methods Density-based anomaly Commute Time Approach Addressing Scalability Anomalies in Complex Data Evaluating Anomaly Detection Methods Applications Problem solutionsCommute time Computation of commute time Anomaly detection using commute time (CDOF) Fast estimation of commute time Scalability for Density-based method PINN Algorithm (ICDM 2010) PINN Guarantee Examples high-dim distance-based outliers Examples high-dim density-based outliers Examples local density-based outliers
Scalability for Density-based method
The pruning rule for Distance-based methods does not applyto Density-based approaches
We can go from O(n2) to nearly O(n log n) by using an index
One solution for the curse of high dimensionality is to use ofrandom projections
Chawla and Chandola Anomaly Detection
Introduction Data Mining Methods Density-based anomaly Commute Time Approach Addressing Scalability Anomalies in Complex Data Evaluating Anomaly Detection Methods Applications Problem solutionsCommute time Computation of commute time Anomaly detection using commute time (CDOF) Fast estimation of commute time Scalability for Density-based method PINN Algorithm (ICDM 2010) PINN Guarantee Examples high-dim distance-based outliers Examples high-dim density-based outliers Examples local density-based outliers
PINN Algorithm (ICDM 2010)
Chawla and Chandola Anomaly Detection
Introduction Data Mining Methods Density-based anomaly Commute Time Approach Addressing Scalability Anomalies in Complex Data Evaluating Anomaly Detection Methods Applications Problem solutionsCommute time Computation of commute time Anomaly detection using commute time (CDOF) Fast estimation of commute time Scalability for Density-based method PINN Algorithm (ICDM 2010) PINN Guarantee Examples high-dim distance-based outliers Examples high-dim density-based outliers Examples local density-based outliers
PINN Guarantee
The PINN Algorithm provides probabilistic guarantees
Under certain assumptions about intrinsic dimensionality (c)with high probability
1minus ε1 + ε
middot LOF (p) le LOF (p) le 1 + ε
1minus ε middot LOF (p)
In practice we do not know the intrinsic dimensionality ofdata However random projections are quite robust
Chawla and Chandola Anomaly Detection
Introduction Data Mining Methods Density-based anomaly Commute Time Approach Addressing Scalability Anomalies in Complex Data Evaluating Anomaly Detection Methods Applications Problem solutionsCommute time Computation of commute time Anomaly detection using commute time (CDOF) Fast estimation of commute time Scalability for Density-based method PINN Algorithm (ICDM 2010) PINN Guarantee Examples high-dim distance-based outliers Examples high-dim density-based outliers Examples local density-based outliers
Examples high-dim distance-based outliers
On a large database of images the bright images show up asdistance based outliers
Chawla and Chandola Anomaly Detection
Introduction Data Mining Methods Density-based anomaly Commute Time Approach Addressing Scalability Anomalies in Complex Data Evaluating Anomaly Detection Methods Applications Problem solutionsCommute time Computation of commute time Anomaly detection using commute time (CDOF) Fast estimation of commute time Scalability for Density-based method PINN Algorithm (ICDM 2010) PINN Guarantee Examples high-dim distance-based outliers Examples high-dim density-based outliers Examples local density-based outliers
Examples high-dim density-based outliers
On a large database of images occluded images show up asdensity based outliers
Chawla and Chandola Anomaly Detection
Introduction Data Mining Methods Density-based anomaly Commute Time Approach Addressing Scalability Anomalies in Complex Data Evaluating Anomaly Detection Methods Applications Problem solutionsCommute time Computation of commute time Anomaly detection using commute time (CDOF) Fast estimation of commute time Scalability for Density-based method PINN Algorithm (ICDM 2010) PINN Guarantee Examples high-dim distance-based outliers Examples high-dim density-based outliers Examples local density-based outliers
Examples local density-based outliers
Examples of images ranked by LOF
Chawla and Chandola Anomaly Detection
Introduction Data Mining Methods Density-based anomaly Commute Time Approach Addressing Scalability Anomalies in Complex Data Evaluating Anomaly Detection Methods Applications Problem solutions
Addressing Scalability
Chawla and Chandola Anomaly Detection
Introduction Data Mining Methods Density-based anomaly Commute Time Approach Addressing Scalability Anomalies in Complex Data Evaluating Anomaly Detection Methods Applications Problem solutions
Using GPUs for Anomaly Detection
Well suited for data parallel algorithms Using CUDA - Compute Unified Device
Architecture (Nvidia)
Need to re-engineer existing algorithms Utilization of device memory Minimize CPUhArrGPU transfer of data Keep threads homogeneous
Most model based algorithms arenaturally setup for the testing phase
Model building needs careful redesign
What about unsupervised algorithms
Kernel
Host
Grid
Device
Block(00)
Block(01)
Block(02)
Block(10)
Block(11)
Block(12)
Thread Block
Thread(00)
Thread(01)
Thread(02)
Thread(03)
Thread(10)
Thread(11)
Thread(12)
Thread(13)
Thread(20)
Thread(21)
Thread(22)
Thread(23)
Host Host Memory
SM 2
SM 1
SM 0
Registers Registers Registers
SP 0 SP 1 SP 7
Shared Memory
Global Memory
Texture Memory
Constant Memory
Device
Chawla and Chandola Anomaly Detection
Introduction Data Mining Methods Density-based anomaly Commute Time Approach Addressing Scalability Anomalies in Complex Data Evaluating Anomaly Detection Methods Applications Problem solutions
Implementing DB(kN) on GPUs
Return top N data instances whose distances tok-th nearest neighbor are largest (SerialDB(kN) is O(n2))
Involves computing pairwise distances
Load block i and block j to shared memory Data layout in memory should be optimized
Each thread computes distance between a pairof instances
Can utilize this time to load next chunk of datafrom host to device memory
Writes results to corresponding output block
Sorting can be done efficiently in CUDA [29]
d
n
T
n
n
Chawla and Chandola Anomaly Detection
Introduction Data Mining Methods Density-based anomaly Commute Time Approach Addressing Scalability Anomalies in Complex Data Evaluating Anomaly Detection Methods Applications Problem solutionsCategorical Data Discrete Sequences and Time Series Contextual Anomalies Collective Anomalies
Moving Beyond Multi-dimensional Record Data
Categorical (Mixed)
Fraud Detection
Cyber Networks
Time Series
Sensor Networks
Healthcare
Discrete Sequences
Genomic
System Calls
Spatial
GIS
Image analysis
Spatio-temporal
Remote sensing
Climate
Graphs
Social networks
Epidemiology
Chawla and Chandola Anomaly Detection
Introduction Data Mining Methods Density-based anomaly Commute Time Approach Addressing Scalability Anomalies in Complex Data Evaluating Anomaly Detection Methods Applications Problem solutionsCategorical Data Discrete Sequences and Time Series Contextual Anomalies Collective Anomalies
Handling Categorical Data
Each attribute can belong to one of many categories
No ordering between categories
Mixed data (categorical and continuous attributes)
cap-shape cap-surface middot middot middot habitat type
convex smooth urban poisonousconvex smooth grasses ediblebell smooth meadows edibleconvex scaly urban poisonousconvex smooth grasses ediblemiddot middot middot
Table Mushroom Data Set [2]
Chawla and Chandola Anomaly Detection
Introduction Data Mining Methods Density-based anomaly Commute Time Approach Addressing Scalability Anomalies in Complex Data Evaluating Anomaly Detection Methods Applications Problem solutionsCategorical Data Discrete Sequences and Time Series Contextual Anomalies Collective Anomalies
Approaches to Identify Categorical Anomalies
Using Association Analysis [24]
Binarize data
Learn rules (X rArr Y ) Choose high confidence
rules (P (Y |X))
For test record Z = 〈XY 〉find rules of the formP (Y |X)
Y is not observed whenX is observed
Using Bayesian Networks [33]
Learn Bayesian networkstructure and parameters
Compute P (Z) for test datarecord Z
Flag anomaly if P (Z) lt δ
Using Similarity Metrics [10]
Use a similarity measure (S(X1 X2))
Apply distancedensityclustering based method (eg lof)
Chawla and Chandola Anomaly Detection
Introduction Data Mining Methods Density-based anomaly Commute Time Approach Addressing Scalability Anomalies in Complex Data Evaluating Anomaly Detection Methods Applications Problem solutionsCategorical Data Discrete Sequences and Time Series Contextual Anomalies Collective Anomalies
Conditional Probability Test [18]
Identify unusual combinations of attribute values
r(at bt) =P (at bt)
P (at)P (bt)
A capB = φ Assumption If r(at bt) is low and is observed in test record t
then t is anomalous For a test record t
For each mutually exclusive pair of attribute sets ABcompute r(at bt)
Score t based on all r-values Assign minimum r-value as score Take product of all r-values
Need to compare exponential pairs of subsets Only consider subsets upto size k Ignore subsets with frequency less than a threshold α Avoid comparing independent subsets of attributes
micro(AB) ge βmicroChawla and Chandola Anomaly Detection
Introduction Data Mining Methods Density-based anomaly Commute Time Approach Addressing Scalability Anomalies in Complex Data Evaluating Anomaly Detection Methods Applications Problem solutionsCategorical Data Discrete Sequences and Time Series Contextual Anomalies Collective Anomalies
Estimating Probabilities for CPT [18]
Maximum LikelihoodEstimation
P (at bt)
P (at)P (bt)=C(at bt)
Ntimes N
C(at)times N
C(bt)
C(at) Number of traininginstances with A = at
N Total number of traininginstances
Laplace Smoothing
E(p) =C(p) + 1
N + 2
r(at bt) =E(at bt)
E(at)times E(bt)
Speedup Tricks
Replace rare attributevalues with genericattribute (reduce arity)
Use efficient datastructure to querying forcounts(AD Trees [26])
ADTrees work fasterfor low arity attributes
Chawla and Chandola Anomaly Detection
Introduction Data Mining Methods Density-based anomaly Commute Time Approach Addressing Scalability Anomalies in Complex Data Evaluating Anomaly Detection Methods Applications Problem solutionsCategorical Data Discrete Sequences and Time Series Contextual Anomalies Collective Anomalies
Finding Anomalies in Discrete Sequences
Many problem formulations
1 Anomalous symbols in asequence
2 Anomalous subsequence in asequence
3 Anomalous sequence in adatabase of sequences
See [11] for a comparativeevaluation [9] for a survey
login pwdmail ssh mail web logoutlogin pwdmail web web web web logoutlogin pwdmail ssh mail web web logoutlogin pwdwebmail ssh webmail logoutloginpwd loginpwd loginpwd logout
Chawla and Chandola Anomaly Detection
Introduction Data Mining Methods Density-based anomaly Commute Time Approach Addressing Scalability Anomalies in Complex Data Evaluating Anomaly Detection Methods Applications Problem solutionsCategorical Data Discrete Sequences and Time Series Contextual Anomalies Collective Anomalies
Treating Sequences as Points
Utilize a distancesimilarity measure Plug into a distancedensityclustering based method
Simplest Hamming Distance
h(Ai Bi) = 1 Ai 6= Bi= 0 Ai = Bi
H(AB) =nsumi=1
h(Ai Bi)
Issues Unequal lengths misalignment Normalized Length of Longest Common Subsequence
D(AB) = 1minus |LCS(AB)|radic|A||B|
Standard Dynamic Programming method is slow Faster versions available (Hunt Szymnaski method [7])
Weaknesses Cannot localize anomalies within a sequence Weak anomaly signals might get lost
Chawla and Chandola Anomaly Detection
Introduction Data Mining Methods Density-based anomaly Commute Time Approach Addressing Scalability Anomalies in Complex Data Evaluating Anomaly Detection Methods Applications Problem solutionsCategorical Data Discrete Sequences and Time Series Contextual Anomalies Collective Anomalies
Using Sliding Windows
Slide a window of size k
Extract all windows from a sequence (nminus k + 1)
Training (Creating a normal dictionary) Store all uniquewindows in all normal sequences and their counts
Testing For each window find the frequency in normal dictionary Anomaly score is inverse of the aggregate frequencies for all
windows (normalized by length)
Many variants exist For each window find the hamming distance to the closest
window in the normal dictionary [16]
Issues Penalizes low frequency windows in the normal dictionary Rewards high frequency windows that might not be relevant Can construct anomalous sequences that will escape detection
Chawla and Chandola Anomaly Detection
Introduction Data Mining Methods Density-based anomaly Commute Time Approach Addressing Scalability Anomalies in Complex Data Evaluating Anomaly Detection Methods Applications Problem solutionsCategorical Data Discrete Sequences and Time Series Contextual Anomalies Collective Anomalies
Using Probabilistic Models
Probability of occurrence of sequence S
P (S) =nprodi=1
P (Si|S1 Siminus1)
Short memory property of sequences
P (Si|S1 Siminus1) = P (Si|Siminusk Siminus1)
Conditional probability estimates for a symbol Si
P (Si|Siminusk Siminus1) =f(Si|Siminusk Si)f(Si|Siminusk Siminus1)
f is estimated from the normal dictionary
Anomaly score for a test sequence is inverse of the normalizedprobability of occurrence
Issues What if the suffix occurs very infrequently in thenormal data (or not at all)
Replace with the longest suffix that occurs sufficient number oftimes [32] - Probabilistic Suffix Trees
Significantly reduces the size of the modelChawla and Chandola Anomaly Detection
Introduction Data Mining Methods Density-based anomaly Commute Time Approach Addressing Scalability Anomalies in Complex Data Evaluating Anomaly Detection Methods Applications Problem solutionsCategorical Data Discrete Sequences and Time Series Contextual Anomalies Collective Anomalies
Finding Contextual Anomalies
Sometimes contextual information isavailable about data
Not used directly as a feature Are well understood no anomalies in
the context Can reduce false positives and yield
interesting anomalies
Example adapted from [30]
Clearest Outlier
Conditional Anomaly
Maximum Daily Temperature
Number
ofFever
Cases
Contextual anomalies - Anomalous with respect to a context Context is defined using environmental variables
Spatial (Latitude Longitude) Graph context (Edges Weights) Temporal location Domain specific (Demographic other)
How to incorporate context Reduce to traditional anomaly detection (subset on context) Explicitly model contextual information (time series spatial)
Chawla and Chandola Anomaly Detection
Introduction Data Mining Methods Density-based anomaly Commute Time Approach Addressing Scalability Anomalies in Complex Data Evaluating Anomaly Detection Methods Applications Problem solutionsCategorical Data Discrete Sequences and Time Series Contextual Anomalies Collective Anomalies
Conditional Anomaly Detection
Data instance d rArru1 u2 udU v1 v2 vdV
dU environmentalattributes
dV indicator attributes u1
u2
U1
U2
U3
v1
v2
V1V2
V3
p(V1|U3) = 02
p(V2|U3) = 02
p(V3|U3) = 06
Algorithm [30]
1 Learn a Gaussian Mixture Model (GMM)U = U1 U2 UnU
each with dimensionality dU2 Learn a set of Gaussians U = V1 V2 VnV
each withdimensionality dV
3 Learn a probabilistic mapping function p(Vj |Ui)4 Score a test instance d = [uv]
S =
nUsumi=1
p(u|Ui)nVsumj=1
p(v|Vj)p(Vj |Ui)
Chawla and Chandola Anomaly Detection
Introduction Data Mining Methods Density-based anomaly Commute Time Approach Addressing Scalability Anomalies in Complex Data Evaluating Anomaly Detection Methods Applications Problem solutionsCategorical Data Discrete Sequences and Time Series Contextual Anomalies Collective Anomalies
Finding Collective Anomalies
Find a collection of data points
Each point by itself is normal
The collection as a whole isanomalous
Relevant when data has inherentstructure and
When domain definition ofanomalies cannot be described aspoint anomalies
A Simple Solution
1 Break data intogroups
2 Compute features foreach group
3 Apply traditionalanomaly detection
Examples
1 Time series
2 Image
3 Spatial clusters ofgalaxies
Chawla and Chandola Anomaly Detection
Introduction Data Mining Methods Density-based anomaly Commute Time Approach Addressing Scalability Anomalies in Complex Data Evaluating Anomaly Detection Methods Applications Problem solutionsCategorical Data Discrete Sequences and Time Series Contextual Anomalies Collective Anomalies
Using Latent Dirichlet Allocation for Group Anomalies
Find anomalous groups in data [34]
Example Spatial clusters of galaxies topics red green emissive words continuous features
Flexible Genre Model (FGM)
For each group
1 Draw a genre 1 2 T 3 ym simM(π)2 Draw topic distribution forym SK 3 θm sim Dir(αym)
3 Draw K topicsβmk sim P (βmk|ηk)k=12K
4 For each point in group
1 Draw topic membershipzmn simM(θn)
2 Generate pointxmn isin P (xmn|βmzmn)
α
zmn
xmn
N
θm
T
π
ηK
ym
β
MK
Model Parameters
M(π) -Multinomial
Genre - Dir(αt)
Topic generatorsP (|ηk)- GIW
Point generatorsP (xmn|βnk) -MultivariateGaussian
Chawla and Chandola Anomaly Detection
Introduction Data Mining Methods Density-based anomaly Commute Time Approach Addressing Scalability Anomalies in Complex Data Evaluating Anomaly Detection Methods Applications Problem solutionsCategorical Data Discrete Sequences and Time Series Contextual Anomalies Collective Anomalies
Inference and Testing for FGM
Inference and Learning Parameters
Approximate inference of latentvariables (Gibbs Sampling)
Use samples to learn parameters(Single step Monte Carlo EM)
Topic 1
Topic 2
Topic 3
Anomaly Detection
Infer the topic distribution θm
Compute negative log likelihood wrt αt
Rationale An anomalous group will be unlikely to begenerated from any genre
Geometric interpretation Mapping each group into a Tdimensional space and finding anomalies
Chawla and Chandola Anomaly Detection
Introduction Data Mining Methods Density-based anomaly Commute Time Approach Addressing Scalability Anomalies in Complex Data Evaluating Anomaly Detection Methods Applications Problem solutions
Evaluating Anomaly Detection Methods - Labels
Labeled validation data set exists Confusion matrix Traditional evaluation metrics
Class imbalance
ROC Curve
Validation set does not exist Use domain expertise to find TP
and FP FN is harder to estimate
Pseudo false negativeestimation techniques [25]
Predicteda n
Actuala TP FNn FP TN
Acc =TP + TNsum
Rec (R) =TP
TP + FN
Prec (P ) =TP
TP + FP
F =2 lowastR lowast PR+ P
Chawla and Chandola Anomaly Detection
Introduction Data Mining Methods Density-based anomaly Commute Time Approach Addressing Scalability Anomalies in Complex Data Evaluating Anomaly Detection Methods Applications Problem solutions
Evaluating Anomaly Detection Methods - Scores
Convert to binary output Use threshold δ on score (Scale
issues [21]) Take top x as anomalies
ROC curve by varying x or δ
Quality of output Does the output ldquosuggestrdquo x or δ Which output is better
Chawla and Chandola Anomaly Detection
Introduction Data Mining Methods Density-based anomaly Commute Time Approach Addressing Scalability Anomalies in Complex Data Evaluating Anomaly Detection Methods Applications Problem solutions
Unifying Scores
Different methods assign scores in differentranges
kNN-based scores [0 1] Lof scores [1 6] ABOD scores [0 80000]
Anomalies have lower scores
Direct scaling to [0 1] might lose distinctionbetween normal and anomalies
Desired scaling Stretch interesting rangesand shrink irrelevant ones
Generalized Procedure for Normalizing Outlier Scores [21] Regularity rArr S(o) ge 0forallo S(o) asymp 0 if o is normal andS(o) 0 if o is anomalous
Normality S is regular and S(o) isin [0 1]forallo
Chawla and Chandola Anomaly Detection
Introduction Data Mining Methods Density-based anomaly Commute Time Approach Addressing Scalability Anomalies in Complex Data Evaluating Anomaly Detection Methods Applications Problem solutions
Regularization and Normalization of Scores
Regularization
1 R(o) = max0 S(o)minus baseS2 R(o) = Smax minus S(o)
3 R(o) = minus log SmaxS(o)
Normalization
1 N(o) = S(o)Smax
2 N(o) = max(
0 erf(S(o)minusmicroSσS radic2
))(Gaussian Scaling)
Suited for high dimensional data
3 N(o) = max(
0cdfγS (o)minusmicroγ
1minusmicroγ
)(Gamma Scaling)
Where cdfγS (o) = P (k S(o) θ) P is the regularized Gamma function Suited for low dimensional data
Chawla and Chandola Anomaly Detection
Introduction Data Mining Methods Density-based anomaly Commute Time Approach Addressing Scalability Anomalies in Complex Data Evaluating Anomaly Detection Methods Applications Problem solutions
Generating Labeled Data for Validation
Generating Both Normal and Anomalous Data
Use generative models for normal and anomalous behavior
Several generators available Multivariate continuous data [27] Multivariate categorical data [5] Discrete sequences using HMM [12]
Drawbacks Might not capture the domain characteristics
Injecting Anomalies - Random Perturbation[30]
Given data point z = xy x and y arepartitions of feature space
Take a random sample D of the entire data set
Let zprime = xprimeyprime isin D such that distancebetween y and yprime is maximum
Replace x with xprime and add z back to data setx
yz
zprime
Injected anomaly
Chawla and Chandola Anomaly Detection
Introduction Data Mining Methods Density-based anomaly Commute Time Approach Addressing Scalability Anomalies in Complex Data Evaluating Anomaly Detection Methods Applications Problem solutionsWhat is Network Anomaly Detection Motivation How Much Serious
Applications Overview
How to set up an anomaly detection solution for agiven application domain
Available data Define anomalies define normal behavior Identify requirements and constraints (online
real-time limited resources) What domain knowledge available
Feature identification Defining normal and anomalous behavior Tuning parameters
Available ground truth (training validation)
Chawla and Chandola Anomaly Detection
Introduction Data Mining Methods Density-based anomaly Commute Time Approach Addressing Scalability Anomalies in Complex Data Evaluating Anomaly Detection Methods Applications Problem solutionsWhat is Network Anomaly Detection Motivation How Much Serious
What is Network Anomaly Detection
Anomaly Detection or Intrusion Detection
Traditional Intrusion Detection Systems (IDS) finding attackscorresponding to predefined pattern data set known as signaturestherefore system is absolutely vulnerable against zero-day attacks
Network Anomaly Detection Systems (NADS) to detectzero-day attacks without any pre-identified signature besides profilenormal behavior of the network and address suspected incidents
Network Anomaly Detection finding unusual and largechanges in the network traffic
Examples intentional attacks (eg Distributed Denial ofService - DDoS) or unusual network traffic (eg flash crowds)
Chawla and Chandola Anomaly Detection
Introduction Data Mining Methods Density-based anomaly Commute Time Approach Addressing Scalability Anomalies in Complex Data Evaluating Anomaly Detection Methods Applications Problem solutionsWhat is Network Anomaly Detection Motivation How Much Serious
Motivation How Much Serious
According to Symantec report released in early 2011 morethan 286 million new threats have been detected in 2010which is a huge number
1656227
2704836
1000000
1500000
2000000
2500000
3000000
20547 18827 69107 113025 140690
624267
1656227
2704836
0
500000
1000000
1500000
2000000
2500000
3000000
2002 2003 2004 2005 2006 2007 2008 July2009-June2010
Chawla and Chandola Anomaly Detection
Introduction Data Mining Methods Density-based anomaly Commute Time Approach Addressing Scalability Anomalies in Complex Data Evaluating Anomaly Detection Methods Applications Problem solutionsNetwork Topology Network Anomalies Detection Problem Network Anomalies Detection Problem Why care about OD Flows
Network Topology
A Typical network
1 y
Router
2
3
41t
x2t
x1t
x3t
x4t
Origin-Destination (OD) flow is the traffic that enters at anorigin node and exits at a destination node of a backbonenetwork x1t x1t
Link measurement is the traffic enters at an node during aninterval y1t
Relationship between link traffic and OD flow traffic iscaptured by the routing matrix A
Chawla and Chandola Anomaly Detection
Introduction Data Mining Methods Density-based anomaly Commute Time Approach Addressing Scalability Anomalies in Complex Data Evaluating Anomaly Detection Methods Applications Problem solutionsNetwork Topology Network Anomalies Detection Problem Network Anomalies Detection Problem Why care about OD Flows
Network Anomalies Detection Problem
Chawla and Chandola Anomaly Detection
Introduction Data Mining Methods Density-based anomaly Commute Time Approach Addressing Scalability Anomalies in Complex Data Evaluating Anomaly Detection Methods Applications Problem solutionsNetwork Topology Network Anomalies Detection Problem Network Anomalies Detection Problem Why care about OD Flows
Network Anomalies Detection Problem
Chawla and Chandola Anomaly Detection
Introduction Data Mining Methods Density-based anomaly Commute Time Approach Addressing Scalability Anomalies in Complex Data Evaluating Anomaly Detection Methods Applications Problem solutionsNetwork Topology Network Anomalies Detection Problem Network Anomalies Detection Problem Why care about OD Flows
Why care about OD Flows
Volume anomaly typically arises on an OD flow (trafficarriving at one node and destined for another node)
If we only monitor traffic on network links volume arisingfrom an OD flow may not be noticeable Thus naiveapproach wont work if OD flow info is not available
Figure source [22]
Chawla and Chandola Anomaly Detection
Introduction Data Mining Methods Density-based anomaly Commute Time Approach Addressing Scalability Anomalies in Complex Data Evaluating Anomaly Detection Methods Applications Problem solutionsPCA and Subspace Method Subspace Method Algorithm Subspace Analysis Results Discussion Typical Characteristics of Anomaly Limitation of Volume Entropy Based versus Volume Based Fraud Detection Epidemeology Anomaly Detection in Climate and Weather Anomalies in Climate Validation of Anomalies
PCA and Subspace Method
Chawla and Chandola Anomaly Detection
Introduction Data Mining Methods Density-based anomaly Commute Time Approach Addressing Scalability Anomalies in Complex Data Evaluating Anomaly Detection Methods Applications Problem solutionsPCA and Subspace Method Subspace Method Algorithm Subspace Analysis Results Discussion Typical Characteristics of Anomaly Limitation of Volume Entropy Based versus Volume Based Fraud Detection Epidemeology Anomaly Detection in Climate and Weather Anomalies in Climate Validation of Anomalies
Subspace Method Algorithm
Step1- Determine the PCs based on eigenvaluedecomposition of the covariance matrix of the dataset
Step2- Choose first top k principle components with thehighest eigenvalues as matrix P
Step3-normal traffic subspace called Z
Z = PP TZ = CZ
Step4-abnormal traffic subspace called Z
Z = (I minus PP T )Z = CZ
Step5-If the norm of a vector is large then it is an rdquoanomalyrdquo
Chawla and Chandola Anomaly Detection
Introduction Data Mining Methods Density-based anomaly Commute Time Approach Addressing Scalability Anomalies in Complex Data Evaluating Anomaly Detection Methods Applications Problem solutionsPCA and Subspace Method Subspace Method Algorithm Subspace Analysis Results Discussion Typical Characteristics of Anomaly Limitation of Volume Entropy Based versus Volume Based Fraud Detection Epidemeology Anomaly Detection in Climate and Weather Anomalies in Climate Validation of Anomalies
Subspace Analysis Results
Note that during anomaly normal component does not changethat much while residual component changes quite a lot
Thus anomalies can be detected by setting some threshold
Figure source [22]
Chawla and Chandola Anomaly Detection
Introduction Data Mining Methods Density-based anomaly Commute Time Approach Addressing Scalability Anomalies in Complex Data Evaluating Anomaly Detection Methods Applications Problem solutionsPCA and Subspace Method Subspace Method Algorithm Subspace Analysis Results Discussion Typical Characteristics of Anomaly Limitation of Volume Entropy Based versus Volume Based Fraud Detection Epidemeology Anomaly Detection in Climate and Weather Anomalies in Climate Validation of Anomalies
Discussion Typical Characteristics of Anomaly
Most Anomalies induce a change in distributionalaspects of packet header fields (called features)
Most important features include 5-tuple Source ampdestination IP addresses Source and destination portnumbers and IP protocol
raquo DOS attack ndash multiple source IP address concentrated on asingle destination IP address
raquo Network scan ndash dispersed distribution of destination addresses
raquo Most wormsviruses also induce some change in distribution ofcertain features
raquo However these changes can be very subtle and mining them islike searching for needles in a haystack
Unlike many previous approach this paper aims todetect events which disturb the distribution of trafficfeatures rather than traffic volume
Chawla and Chandola Anomaly Detection
Introduction Data Mining Methods Density-based anomaly Commute Time Approach Addressing Scalability Anomalies in Complex Data Evaluating Anomaly Detection Methods Applications Problem solutionsPCA and Subspace Method Subspace Method Algorithm Subspace Analysis Results Discussion Typical Characteristics of Anomaly Limitation of Volume Entropy Based versus Volume Based Fraud Detection Epidemeology Anomaly Detection in Climate and Weather Anomalies in Climate Validation of Anomalies
Limitation of Volume
Figure source [22]
Port scan anomaly (traffic feature changes however traffic volume
remains more or less the same)
We can use entropy tocapture the variationsin the traffic feature
bullTakes value 0 when distribution is maximally concentratedbullTakes value log2N when distribution is maximally dispersed
But stands out in
feature entropy
which also reveals
its structure
Port scan
dwarfed
in volume
metricshellip
Chawla and Chandola Anomaly Detection
Introduction Data Mining Methods Density-based anomaly Commute Time Approach Addressing Scalability Anomalies in Complex Data Evaluating Anomaly Detection Methods Applications Problem solutionsPCA and Subspace Method Subspace Method Algorithm Subspace Analysis Results Discussion Typical Characteristics of Anomaly Limitation of Volume Entropy Based versus Volume Based Fraud Detection Epidemeology Anomaly Detection in Climate and Weather Anomalies in Climate Validation of Anomalies
Entropy Based versus Volume Based
DoSDDoS Attacks- a spike in traffic data toward adominant destination IP
Scan anomaly-a spike in traffic data from a dominant sourceIP
Flash Crowd anomaly- again a spike in traffic data to adominant destination IP
Worm anomaly-a Spike in traffic with a dominant port
Chawla and Chandola Anomaly Detection
Introduction Data Mining Methods Density-based anomaly Commute Time Approach Addressing Scalability Anomalies in Complex Data Evaluating Anomaly Detection Methods Applications Problem solutionsPCA and Subspace Method Subspace Method Algorithm Subspace Analysis Results Discussion Typical Characteristics of Anomaly Limitation of Volume Entropy Based versus Volume Based Fraud Detection Epidemeology Anomaly Detection in Climate and Weather Anomalies in Climate Validation of Anomalies
Fraud Detection
Domain Question Identifyfraudulent activities or players fromobserved transaction data
Data Transactions between different
players in the system Meta information about the
individuals An underlying graph structure
Challenges Track and model human behavior Anomalies caused by adaptive
human adversaries Massive data sizes
Insurance (autohealtha)
ClaimantProvider Payer
Telecommunications Customer
Provider
Credit Cards Customer
Supplier Bank
Web Advertising User Advertiser
Publisher
ahttpwwwcheatingculturecompast-cases-of-medicare-fraud
Chawla and Chandola Anomaly Detection
Introduction Data Mining Methods Density-based anomaly Commute Time Approach Addressing Scalability Anomalies in Complex Data Evaluating Anomaly Detection Methods Applications Problem solutionsPCA and Subspace Method Subspace Method Algorithm Subspace Analysis Results Discussion Typical Characteristics of Anomaly Limitation of Volume Entropy Based versus Volume Based Fraud Detection Epidemeology Anomaly Detection in Climate and Weather Anomalies in Climate Validation of Anomalies
A Generic Fraud Detection Method
Activity Monitoring [13]1 Build profiles for individuals (customers users etc) based on
historic data User X makes n calls on an average in January
2 Compare current behavior with historical profile for significantdeviations
Clustering based [4]1 Cluster historical profiles of customers2 Identify small clusters or outlying profiles as anomalies
Strengths Anomaly detection is fast (good for real time) Results are easy to explain
Weaknesses Need to create and maintain a large number of profiles Not dynamic Adequate historical data might not be available Too many false positives
Chawla and Chandola Anomaly Detection
Introduction Data Mining Methods Density-based anomaly Commute Time Approach Addressing Scalability Anomalies in Complex Data Evaluating Anomaly Detection Methods Applications Problem solutionsPCA and Subspace Method Subspace Method Algorithm Subspace Analysis Results Discussion Typical Characteristics of Anomaly Limitation of Volume Entropy Based versus Volume Based Fraud Detection Epidemeology Anomaly Detection in Climate and Weather Anomalies in Climate Validation of Anomalies
Exploiting Graph Structure - Weighted Graphs
Represent data as a weighted graph Communication networks (phone email SMS) Provider referral networks
Objective Identify anomalous nodes
For each node extract several features based on the propertiesof the induced sub-graph (egonet) of neighboring nodes [1]
Choose features that can highlight anomalous nodes
1 Ni degree of node2 Ei number of edges in egonet3 Wi total weight of egonet4 λi principal eigen vector of weighted adjacency matrix of
egonet
Data is transformed into a point in a multi-dimensional space
Chawla and Chandola Anomaly Detection
Introduction Data Mining Methods Density-based anomaly Commute Time Approach Addressing Scalability Anomalies in Complex Data Evaluating Anomaly Detection Methods Applications Problem solutionsPCA and Subspace Method Subspace Method Algorithm Subspace Analysis Results Discussion Typical Characteristics of Anomaly Limitation of Volume Entropy Based versus Volume Based Fraud Detection Epidemeology Anomaly Detection in Climate and Weather Anomalies in Climate Validation of Anomalies
Identifying Anomalies
Traditional anomaly detection (lof) Can be slow but can identify any type of anomalous structure
Faster method to identify specific types of anomalousstructures
Identify relevant feature pairs and power law relationship
Eg Egonet Density Power Law Ni vs Ei - detect nearcliques and stars
Ei prop Nαi 1 le α le 2
Anomaly score for node i wrt a pair of features (y = Cxθ)
Si =max(yi Cx
θi )
min(yi Cxθi )lowast log (|yi minus Cxθi |+ 1)
Chawla and Chandola Anomaly Detection
Introduction Data Mining Methods Density-based anomaly Commute Time Approach Addressing Scalability Anomalies in Complex Data Evaluating Anomaly Detection Methods Applications Problem solutionsPCA and Subspace Method Subspace Method Algorithm Subspace Analysis Results Discussion Typical Characteristics of Anomaly Limitation of Volume Entropy Based versus Volume Based Fraud Detection Epidemeology Anomaly Detection in Climate and Weather Anomalies in Climate Validation of Anomalies
Exploiting Graph Structure - Bipartite Graphs
Represent data as a bipartite graph Healthcare Data (Beneficiaries vs Providers) Insider trading (Traders vs Stocks)
Objective Identify anomalous links
Given a query node a isin V1 find the ldquorelevancerdquoof all other nodes in V1 to a
RelevanceScore(a b) prop Number of times aldquorandom walkrdquo from a reaches b
Use the relevance scores to compute thenormality scores for a node t isin V2
Find set St = a|〈a t〉 isin E Compute |St| times |St| similarity matrix using
relevance vectors for a isin St Normality Score = mean of non-diagonal entries
of similarity matrix
V1 E V2a1
a2
a3
an
t1
t2
t3
tn
Chawla and Chandola Anomaly Detection
Introduction Data Mining Methods Density-based anomaly Commute Time Approach Addressing Scalability Anomalies in Complex Data Evaluating Anomaly Detection Methods Applications Problem solutionsPCA and Subspace Method Subspace Method Algorithm Subspace Analysis Results Discussion Typical Characteristics of Anomaly Limitation of Volume Entropy Based versus Volume Based Fraud Detection Epidemeology Anomaly Detection in Climate and Weather Anomalies in Climate Validation of Anomalies
Detecting Disease Outbreaks
Domain Question Early detection of disease
outbreaks Anthrax attack
Data Emergency department visits Grocery data (Example [14]) Clinical visits Weatherclimate data
Challenges Weak signals in the data
ED cases involving cough rArrFlu or SARS
Integration of multiple signals(lag analysis)
Account for spatial and temporalcorrelations
Chawla and Chandola Anomaly Detection
Introduction Data Mining Methods Density-based anomaly Commute Time Approach Addressing Scalability Anomalies in Complex Data Evaluating Anomaly Detection Methods Applications Problem solutionsPCA and Subspace Method Subspace Method Algorithm Subspace Analysis Results Discussion Typical Characteristics of Anomaly Limitation of Volume Entropy Based versus Volume Based Fraud Detection Epidemeology Anomaly Detection in Climate and Weather Anomalies in Climate Validation of Anomalies
Whatrsquos Significant About Recent Events (WSARE) [33]
1 Learn Bayesian network from historical data Environmental and response variables
2 Sample from the BN (DBbaseline|Current Environment)3 Compute contingency table for rules for DBbaseline andDBcurrent
Rules are single assignment rules (Xi = Y ji ) or conjunctions4 Find p-value for rules using χ2-test
Null Hypothesis Rows and columns of tables for DBbaselineand DBcurrent are independent
5 Find rule with largest p-value Repeat Step 2
Chawla and Chandola Anomaly Detection
Introduction Data Mining Methods Density-based anomaly Commute Time Approach Addressing Scalability Anomalies in Complex Data Evaluating Anomaly Detection Methods Applications Problem solutionsPCA and Subspace Method Subspace Method Algorithm Subspace Analysis Results Discussion Typical Characteristics of Anomaly Limitation of Volume Entropy Based versus Volume Based Fraud Detection Epidemeology Anomaly Detection in Climate and Weather Anomalies in Climate Validation of Anomalies
Incorporating Spatial and Temporal Relationships
WSARE does not explicitly model the spatial and temporalrelationships
What happened yesterday What happened in the adjoining neighborhood (yesterday)
Bayesian Network Spatio-Temporal (BNST) modelingframework [17]
Add nodes for temporal and spatial dependencies Need more data to train
Chawla and Chandola Anomaly Detection
Introduction Data Mining Methods Density-based anomaly Commute Time Approach Addressing Scalability Anomalies in Complex Data Evaluating Anomaly Detection Methods Applications Problem solutionsPCA and Subspace Method Subspace Method Algorithm Subspace Analysis Results Discussion Typical Characteristics of Anomaly Limitation of Volume Entropy Based versus Volume Based Fraud Detection Epidemeology Anomaly Detection in Climate and Weather Anomalies in Climate Validation of Anomalies
Anomaly Detection in Climate and Weather
Science Questions Identify natural and anthropogenic disasters Identify long time scale events - droughts atmospheric rivers
cold fronts etc
Data Ground observations Remote sensing data (satellites
air-borne) Climate model simulation outputs Multiple variables spatio-temporal (often has height dimension
as well)
Challenges Model spatio-temporal relationships across multiple variables Explain the cause of anomalies Massive data sizes
Climate and weather extreme events are well defined
Key challenge is to find significant events and explain the cause
Chawla and Chandola Anomaly Detection
Introduction Data Mining Methods Density-based anomaly Commute Time Approach Addressing Scalability Anomalies in Complex Data Evaluating Anomaly Detection Methods Applications Problem solutionsPCA and Subspace Method Subspace Method Algorithm Subspace Analysis Results Discussion Typical Characteristics of Anomaly Limitation of Volume Entropy Based versus Volume Based Fraud Detection Epidemeology Anomaly Detection in Climate and Weather Anomalies in Climate Validation of Anomalies
Anomalies are Widely Used in Climate
Most analysis done on ldquoanomalyrdquo time series
Difference from a ldquobase periodrdquo (Toosimplistic)
Brings spatial smoothness (eg a mountaintop and nearby valley can have very differenttemperatures) Removes seasonality
Understand climate and weatherphenomenon
Southern Oscillation Index (SOI) Difference between Sea Level Pressure
(SLP) anomalies for Tahiti and DarwinAustralia
Figure Global AverageTemperature Anomaly(1975 - 2007) Srcwwwmetofficegovuk
Chawla and Chandola Anomaly Detection
Introduction Data Mining Methods Density-based anomaly Commute Time Approach Addressing Scalability Anomalies in Complex Data Evaluating Anomaly Detection Methods Applications Problem solutionsPCA and Subspace Method Subspace Method Algorithm Subspace Analysis Results Discussion Typical Characteristics of Anomaly Limitation of Volume Entropy Based versus Volume Based Fraud Detection Epidemeology Anomaly Detection in Climate and Weather Anomalies in Climate Validation of Anomalies
Constructing Anomalies from Raw Data
Anomaly time series for a given location i
vprimei = vi minus bi
where bi is the base (reference)
How to choose bi Mean of all data for location i Monthly mean values (account for seasonality) Monthly z-score values Median (more robust) Using a shorter ldquoreference periodrdquo
30 year moving window
Different methods show statistically significant differences[19] What is the right strategy Weighted mean of different strategies (Pick weights using
Monte Carlo sampling)
Chawla and Chandola Anomaly Detection
Introduction Data Mining Methods Density-based anomaly Commute Time Approach Addressing Scalability Anomalies in Complex Data Evaluating Anomaly Detection Methods Applications Problem solutionsPCA and Subspace Method Subspace Method Algorithm Subspace Analysis Results Discussion Typical Characteristics of Anomaly Limitation of Volume Entropy Based versus Volume Based Fraud Detection Epidemeology Anomaly Detection in Climate and Weather Anomalies in Climate Validation of Anomalies
Anomaly Detection for Identifying Droughts
Science question Identify significant drought patterns usinghistorical observation data or future simulation data or both
Find persistent spatiotemporal anomalies in precipitation data
A two step approach
1 Find precipitationanomalies usingthresholds
2 Find large connectedcomponents across spaceand time
Matlab - bwlabelbwlabeln
Followup Science questionExplain cause
(drought190120061avi)
Figure Video courtsey Dr ArindamBanerjee
Chawla and Chandola Anomaly Detection
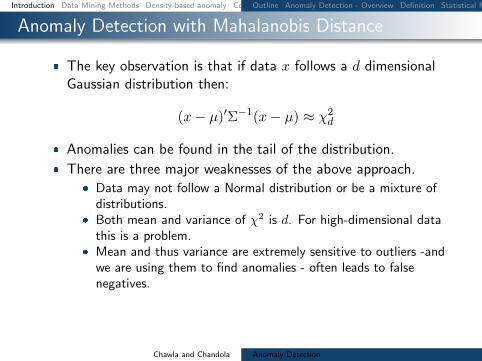
Introduction Data Mining Methods Density-based anomaly Commute Time Approach Addressing Scalability Anomalies in Complex Data Evaluating Anomaly Detection Methods Applications Problem solutionsOutline Anomaly Detection - Overview Definition Statistical Methods Anomaly Detection with Mahalanobis Distance Mahalanobis vs Euclidean Distance
Anomaly Detection with Mahalanobis Distance
The key observation is that if data x follows a d dimensionalGaussian distribution then
(xminus micro)primeΣminus1(xminus micro) asymp χ2d
Anomalies can be found in the tail of the distribution
There are three major weaknesses of the above approach Data may not follow a Normal distribution or be a mixture of
distributions Both mean and variance of χ2 is d For high-dimensional data
this is a problem Mean and thus variance are extremely sensitive to outliers -and
we are using them to find anomalies - often leads to falsenegatives
Chawla and Chandola Anomaly Detection
Introduction Data Mining Methods Density-based anomaly Commute Time Approach Addressing Scalability Anomalies in Complex Data Evaluating Anomaly Detection Methods Applications Problem solutionsOutline Anomaly Detection - Overview Definition Statistical Methods Anomaly Detection with Mahalanobis Distance Mahalanobis vs Euclidean Distance
Mahalanobis vs Euclidean Distance
Mahalanobis normalizes for variance
minus10 minus5 0 5 10minus10
minus8
minus6
minus4
minus2
0
2
4
6
8
10
14
61
16
29
Point Pairs Mahalanobis Euclidean
(1429) 507 1178
(1661) 483 684
Chawla and Chandola Anomaly Detection
Introduction Data Mining Methods Density-based anomaly Commute Time Approach Addressing Scalability Anomalies in Complex Data Evaluating Anomaly Detection Methods Applications Problem solutionsDistance-based anomalies DB(pD) outlier Distance-based methods (DB(kN) Pruning rule Examples of pruning technique Strengths and weaknesses - Distance-based techniques
Distance-based anomalies
Intuition A data point which is far away from its nearestneighbors is a candidate anomaly
Several definitions which capture the above intuition
DB(pD) anomaly [20] an object o in a data set T is aDB(pD) anomaly if at least a fraction p of objects in T havedistances greater than D from o
Generalizes the notion of ldquothree standard deviation from themeanrdquo
This definition had a huge influence on subsequentdevelopment in outlier detection
Chawla and Chandola Anomaly Detection
Introduction Data Mining Methods Density-based anomaly Commute Time Approach Addressing Scalability Anomalies in Complex Data Evaluating Anomaly Detection Methods Applications Problem solutionsDistance-based anomalies DB(pD) outlier Distance-based methods (DB(kN) Pruning rule Examples of pruning technique Strengths and weaknesses - Distance-based techniques
DB(pD) outlier
To build some intuition consider data generated from theNormal distribution N(0 1) Then if O is a DB(pD) outlier
1
(2π)12
int O+D
OminusDeminus
x2
2 dx le 1minus p
Example If O is 3 (3 standard deviations away from themean) then it is a DB(01 0999) outlier
Thus for particular settings of D and p DB(pD) capturesstandard outliers
But much more general (eg any distance metric)
Chawla and Chandola Anomaly Detection
Introduction Data Mining Methods Density-based anomaly Commute Time Approach Addressing Scalability Anomalies in Complex Data Evaluating Anomaly Detection Methods Applications Problem solutionsDistance-based anomalies DB(pD) outlier Distance-based methods (DB(kN) Pruning rule Examples of pruning technique Strengths and weaknesses - Distance-based techniques
Distance-based methods (DB(kN)
DB(kN) anomaly [28] top N data instances whosedistances to its k-th nearest neighbor are largest
Several advantages Ranking for anomalies is more intuitiveSetting of parameters generally easier
A Simple Nested Loop (SNL) algorithm can be used to selectthe top N DB(kN) outliers Time complexity is O(n2d)where n is the database size and d is the dimensionality
Chawla and Chandola Anomaly Detection
Introduction Data Mining Methods Density-based anomaly Commute Time Approach Addressing Scalability Anomalies in Complex Data Evaluating Anomaly Detection Methods Applications Problem solutionsDistance-based anomalies DB(pD) outlier Distance-based methods (DB(kN) Pruning rule Examples of pruning technique Strengths and weaknesses - Distance-based techniques
Pruning rule
DB(kN) anomaly [3] a data instance is not an anomaly ifits distance to its k-th current nearest neighbor is less thanthe score of the weakest anomaly among top N anomaliesfound so far
A large number of non-anomalies can be pruned withoutcarrying out a full data search
Complexity nearly O(n)
Chawla and Chandola Anomaly Detection
Introduction Data Mining Methods Density-based anomaly Commute Time Approach Addressing Scalability Anomalies in Complex Data Evaluating Anomaly Detection Methods Applications Problem solutionsDistance-based anomalies DB(pD) outlier Distance-based methods (DB(kN) Pruning rule Examples of pruning technique Strengths and weaknesses - Distance-based techniques
Examples of pruning technique
Non-anomalies are pruned earlier
Chawla and Chandola Anomaly Detection
Introduction Data Mining Methods Density-based anomaly Commute Time Approach Addressing Scalability Anomalies in Complex Data Evaluating Anomaly Detection Methods Applications Problem solutionsDistance-based anomalies DB(pD) outlier Distance-based methods (DB(kN) Pruning rule Examples of pruning technique Strengths and weaknesses - Distance-based techniques
Strengths and weaknesses - Distance-based techniques
Do not make any assumption about the distribution of thedata
Scalable for large dataset (O(n))
Capable of finding only global anomalies
Can lead to non-intuitive results in Top-k situations
0 10 20 30 40 50 60 700
10
20
30
40
50
60
70
dimension 1
dim
en
sio
n 2
p1
p2
p3
p4
Chawla and Chandola Anomaly Detection
Introduction Data Mining Methods Density-based anomaly Commute Time Approach Addressing Scalability Anomalies in Complex Data Evaluating Anomaly Detection Methods Applications Problem solutionsDensity-based anomaly Strengths and Weaknesses
Density-based anomaly
Calculate the density of an object based on the density of itsk nearest neighbours
density(p) = 1
sum
qisinNk(p)distk(p q)
|Nk(p)|
relative-density(p) =
density(p)1
|Nk(p)|sum
qisinNk(p)density(q)
anomaly-score(p) =1
relative-density(p)
LOF indicates a degree of local outlier-ness [6]
Chawla and Chandola Anomaly Detection
Introduction Data Mining Methods Density-based anomaly Commute Time Approach Addressing Scalability Anomalies in Complex Data Evaluating Anomaly Detection Methods Applications Problem solutionsDensity-based anomaly Strengths and Weaknesses
Strengths and Weaknesses
Can detect global and local anomalies
Cannot use pruning technique and has a complexity of O(n2)
Require a method combining the strengths of distance anddensity based approaches A distance based approach whichcan capture density
C
C
O
O1
1
2
2
Chawla and Chandola Anomaly Detection
Introduction Data Mining Methods Density-based anomaly Commute Time Approach Addressing Scalability Anomalies in Complex Data Evaluating Anomaly Detection Methods Applications Problem solutionsCommute time Computation of commute time Anomaly detection using commute time (CDOF) Fast estimation of commute time Scalability for Density-based method PINN Algorithm (ICDM 2010) PINN Guarantee Examples high-dim distance-based outliers Examples high-dim density-based outliers Examples local density-based outliers
Commute time
Commute time between i and j is the expected number ofsteps that a random walk starting at i will take to reach jonce and go back to i for the first time
Commute time can capture both the distance between pointsand the data densities
Chawla and Chandola Anomaly Detection
Introduction Data Mining Methods Density-based anomaly Commute Time Approach Addressing Scalability Anomalies in Complex Data Evaluating Anomaly Detection Methods Applications Problem solutionsCommute time Computation of commute time Anomaly detection using commute time (CDOF) Fast estimation of commute time Scalability for Density-based method PINN Algorithm (ICDM 2010) PINN Guarantee Examples high-dim distance-based outliers Examples high-dim density-based outliers Examples local density-based outliers
Computation of commute time
Commute time can be computed using graph Laplacian matrixL
cij = VG(ei minus ej)TL+(ei minus ej)L+ pseudo-inverse of LVG graph volumeei i-th column of the identity matrix
Commute time is Euclidean distance in the space spanned byeigenvectors of L
cij = VG[(Sminus12V T )(ei minus ej)]T [(Sminus12V T )(ei minus ej)]
V S eigenvectors and eigenvalues of L
Chawla and Chandola Anomaly Detection
Introduction Data Mining Methods Density-based anomaly Commute Time Approach Addressing Scalability Anomalies in Complex Data Evaluating Anomaly Detection Methods Applications Problem solutionsCommute time Computation of commute time Anomaly detection using commute time (CDOF) Fast estimation of commute time Scalability for Density-based method PINN Algorithm (ICDM 2010) PINN Guarantee Examples high-dim distance-based outliers Examples high-dim density-based outliers Examples local density-based outliers
Anomaly detection using commute time (CDOF)
Construct the mutual k nearest neighbor graph G from thedataset
Compute the Laplacian matrix L of G and its eigensystems
Find top N anomalies using the distance-based technique incommute time with pruning rule
Complexity O(n3)
Commute time method can detect global local and groupanomalies
Chawla and Chandola Anomaly Detection
Introduction Data Mining Methods Density-based anomaly Commute Time Approach Addressing Scalability Anomalies in Complex Data Evaluating Anomaly Detection Methods Applications Problem solutionsCommute time Computation of commute time Anomaly detection using commute time (CDOF) Fast estimation of commute time Scalability for Density-based method PINN Algorithm (ICDM 2010) PINN Guarantee Examples high-dim distance-based outliers Examples high-dim density-based outliers Examples local density-based outliers
Fast estimation of commute time
Speilman and Srivastava [31] combined random projection anda linear time solver to build a structure where we can computethe compute time between two nodes in O(log n) time
Complexity of CDOF O(n3)rarr O(n log n)
Uses a near linear time solver for a linear system of equationAx = b
Spielman and Teng solvers Also see work by Iannis Koutisfrom CMU
Chawla and Chandola Anomaly Detection
Introduction Data Mining Methods Density-based anomaly Commute Time Approach Addressing Scalability Anomalies in Complex Data Evaluating Anomaly Detection Methods Applications Problem solutionsCommute time Computation of commute time Anomaly detection using commute time (CDOF) Fast estimation of commute time Scalability for Density-based method PINN Algorithm (ICDM 2010) PINN Guarantee Examples high-dim distance-based outliers Examples high-dim density-based outliers Examples local density-based outliers
Scalability for Density-based method
The pruning rule for Distance-based methods does not applyto Density-based approaches
We can go from O(n2) to nearly O(n log n) by using an index
One solution for the curse of high dimensionality is to use ofrandom projections
Chawla and Chandola Anomaly Detection
Introduction Data Mining Methods Density-based anomaly Commute Time Approach Addressing Scalability Anomalies in Complex Data Evaluating Anomaly Detection Methods Applications Problem solutionsCommute time Computation of commute time Anomaly detection using commute time (CDOF) Fast estimation of commute time Scalability for Density-based method PINN Algorithm (ICDM 2010) PINN Guarantee Examples high-dim distance-based outliers Examples high-dim density-based outliers Examples local density-based outliers
PINN Algorithm (ICDM 2010)
Chawla and Chandola Anomaly Detection
Introduction Data Mining Methods Density-based anomaly Commute Time Approach Addressing Scalability Anomalies in Complex Data Evaluating Anomaly Detection Methods Applications Problem solutionsCommute time Computation of commute time Anomaly detection using commute time (CDOF) Fast estimation of commute time Scalability for Density-based method PINN Algorithm (ICDM 2010) PINN Guarantee Examples high-dim distance-based outliers Examples high-dim density-based outliers Examples local density-based outliers
PINN Guarantee
The PINN Algorithm provides probabilistic guarantees
Under certain assumptions about intrinsic dimensionality (c)with high probability
1minus ε1 + ε
middot LOF (p) le LOF (p) le 1 + ε
1minus ε middot LOF (p)
In practice we do not know the intrinsic dimensionality ofdata However random projections are quite robust
Chawla and Chandola Anomaly Detection
Introduction Data Mining Methods Density-based anomaly Commute Time Approach Addressing Scalability Anomalies in Complex Data Evaluating Anomaly Detection Methods Applications Problem solutionsCommute time Computation of commute time Anomaly detection using commute time (CDOF) Fast estimation of commute time Scalability for Density-based method PINN Algorithm (ICDM 2010) PINN Guarantee Examples high-dim distance-based outliers Examples high-dim density-based outliers Examples local density-based outliers
Examples high-dim distance-based outliers
On a large database of images the bright images show up asdistance based outliers
Chawla and Chandola Anomaly Detection
Introduction Data Mining Methods Density-based anomaly Commute Time Approach Addressing Scalability Anomalies in Complex Data Evaluating Anomaly Detection Methods Applications Problem solutionsCommute time Computation of commute time Anomaly detection using commute time (CDOF) Fast estimation of commute time Scalability for Density-based method PINN Algorithm (ICDM 2010) PINN Guarantee Examples high-dim distance-based outliers Examples high-dim density-based outliers Examples local density-based outliers
Examples high-dim density-based outliers
On a large database of images occluded images show up asdensity based outliers
Chawla and Chandola Anomaly Detection
Introduction Data Mining Methods Density-based anomaly Commute Time Approach Addressing Scalability Anomalies in Complex Data Evaluating Anomaly Detection Methods Applications Problem solutionsCommute time Computation of commute time Anomaly detection using commute time (CDOF) Fast estimation of commute time Scalability for Density-based method PINN Algorithm (ICDM 2010) PINN Guarantee Examples high-dim distance-based outliers Examples high-dim density-based outliers Examples local density-based outliers
Examples local density-based outliers
Examples of images ranked by LOF
Chawla and Chandola Anomaly Detection
Introduction Data Mining Methods Density-based anomaly Commute Time Approach Addressing Scalability Anomalies in Complex Data Evaluating Anomaly Detection Methods Applications Problem solutions
Addressing Scalability
Chawla and Chandola Anomaly Detection
Introduction Data Mining Methods Density-based anomaly Commute Time Approach Addressing Scalability Anomalies in Complex Data Evaluating Anomaly Detection Methods Applications Problem solutions
Using GPUs for Anomaly Detection
Well suited for data parallel algorithms Using CUDA - Compute Unified Device
Architecture (Nvidia)
Need to re-engineer existing algorithms Utilization of device memory Minimize CPUhArrGPU transfer of data Keep threads homogeneous
Most model based algorithms arenaturally setup for the testing phase
Model building needs careful redesign
What about unsupervised algorithms
Kernel
Host
Grid
Device
Block(00)
Block(01)
Block(02)
Block(10)
Block(11)
Block(12)
Thread Block
Thread(00)
Thread(01)
Thread(02)
Thread(03)
Thread(10)
Thread(11)
Thread(12)
Thread(13)
Thread(20)
Thread(21)
Thread(22)
Thread(23)
Host Host Memory
SM 2
SM 1
SM 0
Registers Registers Registers
SP 0 SP 1 SP 7
Shared Memory
Global Memory
Texture Memory
Constant Memory
Device
Chawla and Chandola Anomaly Detection
Introduction Data Mining Methods Density-based anomaly Commute Time Approach Addressing Scalability Anomalies in Complex Data Evaluating Anomaly Detection Methods Applications Problem solutions
Implementing DB(kN) on GPUs
Return top N data instances whose distances tok-th nearest neighbor are largest (SerialDB(kN) is O(n2))
Involves computing pairwise distances
Load block i and block j to shared memory Data layout in memory should be optimized
Each thread computes distance between a pairof instances
Can utilize this time to load next chunk of datafrom host to device memory
Writes results to corresponding output block
Sorting can be done efficiently in CUDA [29]
d
n
T
n
n
Chawla and Chandola Anomaly Detection
Introduction Data Mining Methods Density-based anomaly Commute Time Approach Addressing Scalability Anomalies in Complex Data Evaluating Anomaly Detection Methods Applications Problem solutionsCategorical Data Discrete Sequences and Time Series Contextual Anomalies Collective Anomalies
Moving Beyond Multi-dimensional Record Data
Categorical (Mixed)
Fraud Detection
Cyber Networks
Time Series
Sensor Networks
Healthcare
Discrete Sequences
Genomic
System Calls
Spatial
GIS
Image analysis
Spatio-temporal
Remote sensing
Climate
Graphs
Social networks
Epidemiology
Chawla and Chandola Anomaly Detection
Introduction Data Mining Methods Density-based anomaly Commute Time Approach Addressing Scalability Anomalies in Complex Data Evaluating Anomaly Detection Methods Applications Problem solutionsCategorical Data Discrete Sequences and Time Series Contextual Anomalies Collective Anomalies
Handling Categorical Data
Each attribute can belong to one of many categories
No ordering between categories
Mixed data (categorical and continuous attributes)
cap-shape cap-surface middot middot middot habitat type
convex smooth urban poisonousconvex smooth grasses ediblebell smooth meadows edibleconvex scaly urban poisonousconvex smooth grasses ediblemiddot middot middot
Table Mushroom Data Set [2]
Chawla and Chandola Anomaly Detection
Introduction Data Mining Methods Density-based anomaly Commute Time Approach Addressing Scalability Anomalies in Complex Data Evaluating Anomaly Detection Methods Applications Problem solutionsCategorical Data Discrete Sequences and Time Series Contextual Anomalies Collective Anomalies
Approaches to Identify Categorical Anomalies
Using Association Analysis [24]
Binarize data
Learn rules (X rArr Y ) Choose high confidence
rules (P (Y |X))
For test record Z = 〈XY 〉find rules of the formP (Y |X)
Y is not observed whenX is observed
Using Bayesian Networks [33]
Learn Bayesian networkstructure and parameters
Compute P (Z) for test datarecord Z
Flag anomaly if P (Z) lt δ
Using Similarity Metrics [10]
Use a similarity measure (S(X1 X2))
Apply distancedensityclustering based method (eg lof)
Chawla and Chandola Anomaly Detection
Introduction Data Mining Methods Density-based anomaly Commute Time Approach Addressing Scalability Anomalies in Complex Data Evaluating Anomaly Detection Methods Applications Problem solutionsCategorical Data Discrete Sequences and Time Series Contextual Anomalies Collective Anomalies
Conditional Probability Test [18]
Identify unusual combinations of attribute values
r(at bt) =P (at bt)
P (at)P (bt)
A capB = φ Assumption If r(at bt) is low and is observed in test record t
then t is anomalous For a test record t
For each mutually exclusive pair of attribute sets ABcompute r(at bt)
Score t based on all r-values Assign minimum r-value as score Take product of all r-values
Need to compare exponential pairs of subsets Only consider subsets upto size k Ignore subsets with frequency less than a threshold α Avoid comparing independent subsets of attributes
micro(AB) ge βmicroChawla and Chandola Anomaly Detection
Introduction Data Mining Methods Density-based anomaly Commute Time Approach Addressing Scalability Anomalies in Complex Data Evaluating Anomaly Detection Methods Applications Problem solutionsCategorical Data Discrete Sequences and Time Series Contextual Anomalies Collective Anomalies
Estimating Probabilities for CPT [18]
Maximum LikelihoodEstimation
P (at bt)
P (at)P (bt)=C(at bt)
Ntimes N
C(at)times N
C(bt)
C(at) Number of traininginstances with A = at
N Total number of traininginstances
Laplace Smoothing
E(p) =C(p) + 1
N + 2
r(at bt) =E(at bt)
E(at)times E(bt)
Speedup Tricks
Replace rare attributevalues with genericattribute (reduce arity)
Use efficient datastructure to querying forcounts(AD Trees [26])
ADTrees work fasterfor low arity attributes
Chawla and Chandola Anomaly Detection
Introduction Data Mining Methods Density-based anomaly Commute Time Approach Addressing Scalability Anomalies in Complex Data Evaluating Anomaly Detection Methods Applications Problem solutionsCategorical Data Discrete Sequences and Time Series Contextual Anomalies Collective Anomalies
Finding Anomalies in Discrete Sequences
Many problem formulations
1 Anomalous symbols in asequence
2 Anomalous subsequence in asequence
3 Anomalous sequence in adatabase of sequences
See [11] for a comparativeevaluation [9] for a survey
login pwdmail ssh mail web logoutlogin pwdmail web web web web logoutlogin pwdmail ssh mail web web logoutlogin pwdwebmail ssh webmail logoutloginpwd loginpwd loginpwd logout
Chawla and Chandola Anomaly Detection
Introduction Data Mining Methods Density-based anomaly Commute Time Approach Addressing Scalability Anomalies in Complex Data Evaluating Anomaly Detection Methods Applications Problem solutionsCategorical Data Discrete Sequences and Time Series Contextual Anomalies Collective Anomalies
Treating Sequences as Points
Utilize a distancesimilarity measure Plug into a distancedensityclustering based method
Simplest Hamming Distance
h(Ai Bi) = 1 Ai 6= Bi= 0 Ai = Bi
H(AB) =nsumi=1
h(Ai Bi)
Issues Unequal lengths misalignment Normalized Length of Longest Common Subsequence
D(AB) = 1minus |LCS(AB)|radic|A||B|
Standard Dynamic Programming method is slow Faster versions available (Hunt Szymnaski method [7])
Weaknesses Cannot localize anomalies within a sequence Weak anomaly signals might get lost
Chawla and Chandola Anomaly Detection
Introduction Data Mining Methods Density-based anomaly Commute Time Approach Addressing Scalability Anomalies in Complex Data Evaluating Anomaly Detection Methods Applications Problem solutionsCategorical Data Discrete Sequences and Time Series Contextual Anomalies Collective Anomalies
Using Sliding Windows
Slide a window of size k
Extract all windows from a sequence (nminus k + 1)
Training (Creating a normal dictionary) Store all uniquewindows in all normal sequences and their counts
Testing For each window find the frequency in normal dictionary Anomaly score is inverse of the aggregate frequencies for all
windows (normalized by length)
Many variants exist For each window find the hamming distance to the closest
window in the normal dictionary [16]
Issues Penalizes low frequency windows in the normal dictionary Rewards high frequency windows that might not be relevant Can construct anomalous sequences that will escape detection
Chawla and Chandola Anomaly Detection
Introduction Data Mining Methods Density-based anomaly Commute Time Approach Addressing Scalability Anomalies in Complex Data Evaluating Anomaly Detection Methods Applications Problem solutionsCategorical Data Discrete Sequences and Time Series Contextual Anomalies Collective Anomalies
Using Probabilistic Models
Probability of occurrence of sequence S
P (S) =nprodi=1
P (Si|S1 Siminus1)
Short memory property of sequences
P (Si|S1 Siminus1) = P (Si|Siminusk Siminus1)
Conditional probability estimates for a symbol Si
P (Si|Siminusk Siminus1) =f(Si|Siminusk Si)f(Si|Siminusk Siminus1)
f is estimated from the normal dictionary
Anomaly score for a test sequence is inverse of the normalizedprobability of occurrence
Issues What if the suffix occurs very infrequently in thenormal data (or not at all)
Replace with the longest suffix that occurs sufficient number oftimes [32] - Probabilistic Suffix Trees
Significantly reduces the size of the modelChawla and Chandola Anomaly Detection
Introduction Data Mining Methods Density-based anomaly Commute Time Approach Addressing Scalability Anomalies in Complex Data Evaluating Anomaly Detection Methods Applications Problem solutionsCategorical Data Discrete Sequences and Time Series Contextual Anomalies Collective Anomalies
Finding Contextual Anomalies
Sometimes contextual information isavailable about data
Not used directly as a feature Are well understood no anomalies in
the context Can reduce false positives and yield
interesting anomalies
Example adapted from [30]
Clearest Outlier
Conditional Anomaly
Maximum Daily Temperature
Number
ofFever
Cases
Contextual anomalies - Anomalous with respect to a context Context is defined using environmental variables
Spatial (Latitude Longitude) Graph context (Edges Weights) Temporal location Domain specific (Demographic other)
How to incorporate context Reduce to traditional anomaly detection (subset on context) Explicitly model contextual information (time series spatial)
Chawla and Chandola Anomaly Detection
Introduction Data Mining Methods Density-based anomaly Commute Time Approach Addressing Scalability Anomalies in Complex Data Evaluating Anomaly Detection Methods Applications Problem solutionsCategorical Data Discrete Sequences and Time Series Contextual Anomalies Collective Anomalies
Conditional Anomaly Detection
Data instance d rArru1 u2 udU v1 v2 vdV
dU environmentalattributes
dV indicator attributes u1
u2
U1
U2
U3
v1
v2
V1V2
V3
p(V1|U3) = 02
p(V2|U3) = 02
p(V3|U3) = 06
Algorithm [30]
1 Learn a Gaussian Mixture Model (GMM)U = U1 U2 UnU
each with dimensionality dU2 Learn a set of Gaussians U = V1 V2 VnV
each withdimensionality dV
3 Learn a probabilistic mapping function p(Vj |Ui)4 Score a test instance d = [uv]
S =
nUsumi=1
p(u|Ui)nVsumj=1
p(v|Vj)p(Vj |Ui)
Chawla and Chandola Anomaly Detection
Introduction Data Mining Methods Density-based anomaly Commute Time Approach Addressing Scalability Anomalies in Complex Data Evaluating Anomaly Detection Methods Applications Problem solutionsCategorical Data Discrete Sequences and Time Series Contextual Anomalies Collective Anomalies
Finding Collective Anomalies
Find a collection of data points
Each point by itself is normal
The collection as a whole isanomalous
Relevant when data has inherentstructure and
When domain definition ofanomalies cannot be described aspoint anomalies
A Simple Solution
1 Break data intogroups
2 Compute features foreach group
3 Apply traditionalanomaly detection
Examples
1 Time series
2 Image
3 Spatial clusters ofgalaxies
Chawla and Chandola Anomaly Detection
Introduction Data Mining Methods Density-based anomaly Commute Time Approach Addressing Scalability Anomalies in Complex Data Evaluating Anomaly Detection Methods Applications Problem solutionsCategorical Data Discrete Sequences and Time Series Contextual Anomalies Collective Anomalies
Using Latent Dirichlet Allocation for Group Anomalies
Find anomalous groups in data [34]
Example Spatial clusters of galaxies topics red green emissive words continuous features
Flexible Genre Model (FGM)
For each group
1 Draw a genre 1 2 T 3 ym simM(π)2 Draw topic distribution forym SK 3 θm sim Dir(αym)
3 Draw K topicsβmk sim P (βmk|ηk)k=12K
4 For each point in group
1 Draw topic membershipzmn simM(θn)
2 Generate pointxmn isin P (xmn|βmzmn)
α
zmn
xmn
N
θm
T
π
ηK
ym
β
MK
Model Parameters
M(π) -Multinomial
Genre - Dir(αt)
Topic generatorsP (|ηk)- GIW
Point generatorsP (xmn|βnk) -MultivariateGaussian
Chawla and Chandola Anomaly Detection
Introduction Data Mining Methods Density-based anomaly Commute Time Approach Addressing Scalability Anomalies in Complex Data Evaluating Anomaly Detection Methods Applications Problem solutionsCategorical Data Discrete Sequences and Time Series Contextual Anomalies Collective Anomalies
Inference and Testing for FGM
Inference and Learning Parameters
Approximate inference of latentvariables (Gibbs Sampling)
Use samples to learn parameters(Single step Monte Carlo EM)
Topic 1
Topic 2
Topic 3
Anomaly Detection
Infer the topic distribution θm
Compute negative log likelihood wrt αt
Rationale An anomalous group will be unlikely to begenerated from any genre
Geometric interpretation Mapping each group into a Tdimensional space and finding anomalies
Chawla and Chandola Anomaly Detection
Introduction Data Mining Methods Density-based anomaly Commute Time Approach Addressing Scalability Anomalies in Complex Data Evaluating Anomaly Detection Methods Applications Problem solutions
Evaluating Anomaly Detection Methods - Labels
Labeled validation data set exists Confusion matrix Traditional evaluation metrics
Class imbalance
ROC Curve
Validation set does not exist Use domain expertise to find TP
and FP FN is harder to estimate
Pseudo false negativeestimation techniques [25]
Predicteda n
Actuala TP FNn FP TN
Acc =TP + TNsum
Rec (R) =TP
TP + FN
Prec (P ) =TP
TP + FP
F =2 lowastR lowast PR+ P
Chawla and Chandola Anomaly Detection
Introduction Data Mining Methods Density-based anomaly Commute Time Approach Addressing Scalability Anomalies in Complex Data Evaluating Anomaly Detection Methods Applications Problem solutions
Evaluating Anomaly Detection Methods - Scores
Convert to binary output Use threshold δ on score (Scale
issues [21]) Take top x as anomalies
ROC curve by varying x or δ
Quality of output Does the output ldquosuggestrdquo x or δ Which output is better
Chawla and Chandola Anomaly Detection
Introduction Data Mining Methods Density-based anomaly Commute Time Approach Addressing Scalability Anomalies in Complex Data Evaluating Anomaly Detection Methods Applications Problem solutions
Unifying Scores
Different methods assign scores in differentranges
kNN-based scores [0 1] Lof scores [1 6] ABOD scores [0 80000]
Anomalies have lower scores
Direct scaling to [0 1] might lose distinctionbetween normal and anomalies
Desired scaling Stretch interesting rangesand shrink irrelevant ones
Generalized Procedure for Normalizing Outlier Scores [21] Regularity rArr S(o) ge 0forallo S(o) asymp 0 if o is normal andS(o) 0 if o is anomalous
Normality S is regular and S(o) isin [0 1]forallo
Chawla and Chandola Anomaly Detection
Introduction Data Mining Methods Density-based anomaly Commute Time Approach Addressing Scalability Anomalies in Complex Data Evaluating Anomaly Detection Methods Applications Problem solutions
Regularization and Normalization of Scores
Regularization
1 R(o) = max0 S(o)minus baseS2 R(o) = Smax minus S(o)
3 R(o) = minus log SmaxS(o)
Normalization
1 N(o) = S(o)Smax
2 N(o) = max(
0 erf(S(o)minusmicroSσS radic2
))(Gaussian Scaling)
Suited for high dimensional data
3 N(o) = max(
0cdfγS (o)minusmicroγ
1minusmicroγ
)(Gamma Scaling)
Where cdfγS (o) = P (k S(o) θ) P is the regularized Gamma function Suited for low dimensional data
Chawla and Chandola Anomaly Detection
Introduction Data Mining Methods Density-based anomaly Commute Time Approach Addressing Scalability Anomalies in Complex Data Evaluating Anomaly Detection Methods Applications Problem solutions
Generating Labeled Data for Validation
Generating Both Normal and Anomalous Data
Use generative models for normal and anomalous behavior
Several generators available Multivariate continuous data [27] Multivariate categorical data [5] Discrete sequences using HMM [12]
Drawbacks Might not capture the domain characteristics
Injecting Anomalies - Random Perturbation[30]
Given data point z = xy x and y arepartitions of feature space
Take a random sample D of the entire data set
Let zprime = xprimeyprime isin D such that distancebetween y and yprime is maximum
Replace x with xprime and add z back to data setx
yz
zprime
Injected anomaly
Chawla and Chandola Anomaly Detection
Introduction Data Mining Methods Density-based anomaly Commute Time Approach Addressing Scalability Anomalies in Complex Data Evaluating Anomaly Detection Methods Applications Problem solutionsWhat is Network Anomaly Detection Motivation How Much Serious
Applications Overview
How to set up an anomaly detection solution for agiven application domain
Available data Define anomalies define normal behavior Identify requirements and constraints (online
real-time limited resources) What domain knowledge available
Feature identification Defining normal and anomalous behavior Tuning parameters
Available ground truth (training validation)
Chawla and Chandola Anomaly Detection
Introduction Data Mining Methods Density-based anomaly Commute Time Approach Addressing Scalability Anomalies in Complex Data Evaluating Anomaly Detection Methods Applications Problem solutionsWhat is Network Anomaly Detection Motivation How Much Serious
What is Network Anomaly Detection
Anomaly Detection or Intrusion Detection
Traditional Intrusion Detection Systems (IDS) finding attackscorresponding to predefined pattern data set known as signaturestherefore system is absolutely vulnerable against zero-day attacks
Network Anomaly Detection Systems (NADS) to detectzero-day attacks without any pre-identified signature besides profilenormal behavior of the network and address suspected incidents
Network Anomaly Detection finding unusual and largechanges in the network traffic
Examples intentional attacks (eg Distributed Denial ofService - DDoS) or unusual network traffic (eg flash crowds)
Chawla and Chandola Anomaly Detection
Introduction Data Mining Methods Density-based anomaly Commute Time Approach Addressing Scalability Anomalies in Complex Data Evaluating Anomaly Detection Methods Applications Problem solutionsWhat is Network Anomaly Detection Motivation How Much Serious
Motivation How Much Serious
According to Symantec report released in early 2011 morethan 286 million new threats have been detected in 2010which is a huge number
1656227
2704836
1000000
1500000
2000000
2500000
3000000
20547 18827 69107 113025 140690
624267
1656227
2704836
0
500000
1000000
1500000
2000000
2500000
3000000
2002 2003 2004 2005 2006 2007 2008 July2009-June2010
Chawla and Chandola Anomaly Detection
Introduction Data Mining Methods Density-based anomaly Commute Time Approach Addressing Scalability Anomalies in Complex Data Evaluating Anomaly Detection Methods Applications Problem solutionsNetwork Topology Network Anomalies Detection Problem Network Anomalies Detection Problem Why care about OD Flows
Network Topology
A Typical network
1 y
Router
2
3
41t
x2t
x1t
x3t
x4t
Origin-Destination (OD) flow is the traffic that enters at anorigin node and exits at a destination node of a backbonenetwork x1t x1t
Link measurement is the traffic enters at an node during aninterval y1t
Relationship between link traffic and OD flow traffic iscaptured by the routing matrix A
Chawla and Chandola Anomaly Detection
Introduction Data Mining Methods Density-based anomaly Commute Time Approach Addressing Scalability Anomalies in Complex Data Evaluating Anomaly Detection Methods Applications Problem solutionsNetwork Topology Network Anomalies Detection Problem Network Anomalies Detection Problem Why care about OD Flows
Network Anomalies Detection Problem
Chawla and Chandola Anomaly Detection
Introduction Data Mining Methods Density-based anomaly Commute Time Approach Addressing Scalability Anomalies in Complex Data Evaluating Anomaly Detection Methods Applications Problem solutionsNetwork Topology Network Anomalies Detection Problem Network Anomalies Detection Problem Why care about OD Flows
Network Anomalies Detection Problem
Chawla and Chandola Anomaly Detection
Introduction Data Mining Methods Density-based anomaly Commute Time Approach Addressing Scalability Anomalies in Complex Data Evaluating Anomaly Detection Methods Applications Problem solutionsNetwork Topology Network Anomalies Detection Problem Network Anomalies Detection Problem Why care about OD Flows
Why care about OD Flows
Volume anomaly typically arises on an OD flow (trafficarriving at one node and destined for another node)
If we only monitor traffic on network links volume arisingfrom an OD flow may not be noticeable Thus naiveapproach wont work if OD flow info is not available
Figure source [22]
Chawla and Chandola Anomaly Detection
Introduction Data Mining Methods Density-based anomaly Commute Time Approach Addressing Scalability Anomalies in Complex Data Evaluating Anomaly Detection Methods Applications Problem solutionsPCA and Subspace Method Subspace Method Algorithm Subspace Analysis Results Discussion Typical Characteristics of Anomaly Limitation of Volume Entropy Based versus Volume Based Fraud Detection Epidemeology Anomaly Detection in Climate and Weather Anomalies in Climate Validation of Anomalies
PCA and Subspace Method
Chawla and Chandola Anomaly Detection
Introduction Data Mining Methods Density-based anomaly Commute Time Approach Addressing Scalability Anomalies in Complex Data Evaluating Anomaly Detection Methods Applications Problem solutionsPCA and Subspace Method Subspace Method Algorithm Subspace Analysis Results Discussion Typical Characteristics of Anomaly Limitation of Volume Entropy Based versus Volume Based Fraud Detection Epidemeology Anomaly Detection in Climate and Weather Anomalies in Climate Validation of Anomalies
Subspace Method Algorithm
Step1- Determine the PCs based on eigenvaluedecomposition of the covariance matrix of the dataset
Step2- Choose first top k principle components with thehighest eigenvalues as matrix P
Step3-normal traffic subspace called Z
Z = PP TZ = CZ
Step4-abnormal traffic subspace called Z
Z = (I minus PP T )Z = CZ
Step5-If the norm of a vector is large then it is an rdquoanomalyrdquo
Chawla and Chandola Anomaly Detection
Introduction Data Mining Methods Density-based anomaly Commute Time Approach Addressing Scalability Anomalies in Complex Data Evaluating Anomaly Detection Methods Applications Problem solutionsPCA and Subspace Method Subspace Method Algorithm Subspace Analysis Results Discussion Typical Characteristics of Anomaly Limitation of Volume Entropy Based versus Volume Based Fraud Detection Epidemeology Anomaly Detection in Climate and Weather Anomalies in Climate Validation of Anomalies
Subspace Analysis Results
Note that during anomaly normal component does not changethat much while residual component changes quite a lot
Thus anomalies can be detected by setting some threshold
Figure source [22]
Chawla and Chandola Anomaly Detection
Introduction Data Mining Methods Density-based anomaly Commute Time Approach Addressing Scalability Anomalies in Complex Data Evaluating Anomaly Detection Methods Applications Problem solutionsPCA and Subspace Method Subspace Method Algorithm Subspace Analysis Results Discussion Typical Characteristics of Anomaly Limitation of Volume Entropy Based versus Volume Based Fraud Detection Epidemeology Anomaly Detection in Climate and Weather Anomalies in Climate Validation of Anomalies
Discussion Typical Characteristics of Anomaly
Most Anomalies induce a change in distributionalaspects of packet header fields (called features)
Most important features include 5-tuple Source ampdestination IP addresses Source and destination portnumbers and IP protocol
raquo DOS attack ndash multiple source IP address concentrated on asingle destination IP address
raquo Network scan ndash dispersed distribution of destination addresses
raquo Most wormsviruses also induce some change in distribution ofcertain features
raquo However these changes can be very subtle and mining them islike searching for needles in a haystack
Unlike many previous approach this paper aims todetect events which disturb the distribution of trafficfeatures rather than traffic volume
Chawla and Chandola Anomaly Detection
Introduction Data Mining Methods Density-based anomaly Commute Time Approach Addressing Scalability Anomalies in Complex Data Evaluating Anomaly Detection Methods Applications Problem solutionsPCA and Subspace Method Subspace Method Algorithm Subspace Analysis Results Discussion Typical Characteristics of Anomaly Limitation of Volume Entropy Based versus Volume Based Fraud Detection Epidemeology Anomaly Detection in Climate and Weather Anomalies in Climate Validation of Anomalies
Limitation of Volume
Figure source [22]
Port scan anomaly (traffic feature changes however traffic volume
remains more or less the same)
We can use entropy tocapture the variationsin the traffic feature
bullTakes value 0 when distribution is maximally concentratedbullTakes value log2N when distribution is maximally dispersed
But stands out in
feature entropy
which also reveals
its structure
Port scan
dwarfed
in volume
metricshellip
Chawla and Chandola Anomaly Detection
Introduction Data Mining Methods Density-based anomaly Commute Time Approach Addressing Scalability Anomalies in Complex Data Evaluating Anomaly Detection Methods Applications Problem solutionsPCA and Subspace Method Subspace Method Algorithm Subspace Analysis Results Discussion Typical Characteristics of Anomaly Limitation of Volume Entropy Based versus Volume Based Fraud Detection Epidemeology Anomaly Detection in Climate and Weather Anomalies in Climate Validation of Anomalies
Entropy Based versus Volume Based
DoSDDoS Attacks- a spike in traffic data toward adominant destination IP
Scan anomaly-a spike in traffic data from a dominant sourceIP
Flash Crowd anomaly- again a spike in traffic data to adominant destination IP
Worm anomaly-a Spike in traffic with a dominant port
Chawla and Chandola Anomaly Detection
Introduction Data Mining Methods Density-based anomaly Commute Time Approach Addressing Scalability Anomalies in Complex Data Evaluating Anomaly Detection Methods Applications Problem solutionsPCA and Subspace Method Subspace Method Algorithm Subspace Analysis Results Discussion Typical Characteristics of Anomaly Limitation of Volume Entropy Based versus Volume Based Fraud Detection Epidemeology Anomaly Detection in Climate and Weather Anomalies in Climate Validation of Anomalies
Fraud Detection
Domain Question Identifyfraudulent activities or players fromobserved transaction data
Data Transactions between different
players in the system Meta information about the
individuals An underlying graph structure
Challenges Track and model human behavior Anomalies caused by adaptive
human adversaries Massive data sizes
Insurance (autohealtha)
ClaimantProvider Payer
Telecommunications Customer
Provider
Credit Cards Customer
Supplier Bank
Web Advertising User Advertiser
Publisher
ahttpwwwcheatingculturecompast-cases-of-medicare-fraud
Chawla and Chandola Anomaly Detection
Introduction Data Mining Methods Density-based anomaly Commute Time Approach Addressing Scalability Anomalies in Complex Data Evaluating Anomaly Detection Methods Applications Problem solutionsPCA and Subspace Method Subspace Method Algorithm Subspace Analysis Results Discussion Typical Characteristics of Anomaly Limitation of Volume Entropy Based versus Volume Based Fraud Detection Epidemeology Anomaly Detection in Climate and Weather Anomalies in Climate Validation of Anomalies
A Generic Fraud Detection Method
Activity Monitoring [13]1 Build profiles for individuals (customers users etc) based on
historic data User X makes n calls on an average in January
2 Compare current behavior with historical profile for significantdeviations
Clustering based [4]1 Cluster historical profiles of customers2 Identify small clusters or outlying profiles as anomalies
Strengths Anomaly detection is fast (good for real time) Results are easy to explain
Weaknesses Need to create and maintain a large number of profiles Not dynamic Adequate historical data might not be available Too many false positives
Chawla and Chandola Anomaly Detection
Introduction Data Mining Methods Density-based anomaly Commute Time Approach Addressing Scalability Anomalies in Complex Data Evaluating Anomaly Detection Methods Applications Problem solutionsPCA and Subspace Method Subspace Method Algorithm Subspace Analysis Results Discussion Typical Characteristics of Anomaly Limitation of Volume Entropy Based versus Volume Based Fraud Detection Epidemeology Anomaly Detection in Climate and Weather Anomalies in Climate Validation of Anomalies
Exploiting Graph Structure - Weighted Graphs
Represent data as a weighted graph Communication networks (phone email SMS) Provider referral networks
Objective Identify anomalous nodes
For each node extract several features based on the propertiesof the induced sub-graph (egonet) of neighboring nodes [1]
Choose features that can highlight anomalous nodes
1 Ni degree of node2 Ei number of edges in egonet3 Wi total weight of egonet4 λi principal eigen vector of weighted adjacency matrix of
egonet
Data is transformed into a point in a multi-dimensional space
Chawla and Chandola Anomaly Detection
Introduction Data Mining Methods Density-based anomaly Commute Time Approach Addressing Scalability Anomalies in Complex Data Evaluating Anomaly Detection Methods Applications Problem solutionsPCA and Subspace Method Subspace Method Algorithm Subspace Analysis Results Discussion Typical Characteristics of Anomaly Limitation of Volume Entropy Based versus Volume Based Fraud Detection Epidemeology Anomaly Detection in Climate and Weather Anomalies in Climate Validation of Anomalies
Identifying Anomalies
Traditional anomaly detection (lof) Can be slow but can identify any type of anomalous structure
Faster method to identify specific types of anomalousstructures
Identify relevant feature pairs and power law relationship
Eg Egonet Density Power Law Ni vs Ei - detect nearcliques and stars
Ei prop Nαi 1 le α le 2
Anomaly score for node i wrt a pair of features (y = Cxθ)
Si =max(yi Cx
θi )
min(yi Cxθi )lowast log (|yi minus Cxθi |+ 1)
Chawla and Chandola Anomaly Detection
Introduction Data Mining Methods Density-based anomaly Commute Time Approach Addressing Scalability Anomalies in Complex Data Evaluating Anomaly Detection Methods Applications Problem solutionsPCA and Subspace Method Subspace Method Algorithm Subspace Analysis Results Discussion Typical Characteristics of Anomaly Limitation of Volume Entropy Based versus Volume Based Fraud Detection Epidemeology Anomaly Detection in Climate and Weather Anomalies in Climate Validation of Anomalies
Exploiting Graph Structure - Bipartite Graphs
Represent data as a bipartite graph Healthcare Data (Beneficiaries vs Providers) Insider trading (Traders vs Stocks)
Objective Identify anomalous links
Given a query node a isin V1 find the ldquorelevancerdquoof all other nodes in V1 to a
RelevanceScore(a b) prop Number of times aldquorandom walkrdquo from a reaches b
Use the relevance scores to compute thenormality scores for a node t isin V2
Find set St = a|〈a t〉 isin E Compute |St| times |St| similarity matrix using
relevance vectors for a isin St Normality Score = mean of non-diagonal entries
of similarity matrix
V1 E V2a1
a2
a3
an
t1
t2
t3
tn
Chawla and Chandola Anomaly Detection
Introduction Data Mining Methods Density-based anomaly Commute Time Approach Addressing Scalability Anomalies in Complex Data Evaluating Anomaly Detection Methods Applications Problem solutionsPCA and Subspace Method Subspace Method Algorithm Subspace Analysis Results Discussion Typical Characteristics of Anomaly Limitation of Volume Entropy Based versus Volume Based Fraud Detection Epidemeology Anomaly Detection in Climate and Weather Anomalies in Climate Validation of Anomalies
Detecting Disease Outbreaks
Domain Question Early detection of disease
outbreaks Anthrax attack
Data Emergency department visits Grocery data (Example [14]) Clinical visits Weatherclimate data
Challenges Weak signals in the data
ED cases involving cough rArrFlu or SARS
Integration of multiple signals(lag analysis)
Account for spatial and temporalcorrelations
Chawla and Chandola Anomaly Detection
Introduction Data Mining Methods Density-based anomaly Commute Time Approach Addressing Scalability Anomalies in Complex Data Evaluating Anomaly Detection Methods Applications Problem solutionsPCA and Subspace Method Subspace Method Algorithm Subspace Analysis Results Discussion Typical Characteristics of Anomaly Limitation of Volume Entropy Based versus Volume Based Fraud Detection Epidemeology Anomaly Detection in Climate and Weather Anomalies in Climate Validation of Anomalies
Whatrsquos Significant About Recent Events (WSARE) [33]
1 Learn Bayesian network from historical data Environmental and response variables
2 Sample from the BN (DBbaseline|Current Environment)3 Compute contingency table for rules for DBbaseline andDBcurrent
Rules are single assignment rules (Xi = Y ji ) or conjunctions4 Find p-value for rules using χ2-test
Null Hypothesis Rows and columns of tables for DBbaselineand DBcurrent are independent
5 Find rule with largest p-value Repeat Step 2
Chawla and Chandola Anomaly Detection
Introduction Data Mining Methods Density-based anomaly Commute Time Approach Addressing Scalability Anomalies in Complex Data Evaluating Anomaly Detection Methods Applications Problem solutionsPCA and Subspace Method Subspace Method Algorithm Subspace Analysis Results Discussion Typical Characteristics of Anomaly Limitation of Volume Entropy Based versus Volume Based Fraud Detection Epidemeology Anomaly Detection in Climate and Weather Anomalies in Climate Validation of Anomalies
Incorporating Spatial and Temporal Relationships
WSARE does not explicitly model the spatial and temporalrelationships
What happened yesterday What happened in the adjoining neighborhood (yesterday)
Bayesian Network Spatio-Temporal (BNST) modelingframework [17]
Add nodes for temporal and spatial dependencies Need more data to train
Chawla and Chandola Anomaly Detection
Introduction Data Mining Methods Density-based anomaly Commute Time Approach Addressing Scalability Anomalies in Complex Data Evaluating Anomaly Detection Methods Applications Problem solutionsPCA and Subspace Method Subspace Method Algorithm Subspace Analysis Results Discussion Typical Characteristics of Anomaly Limitation of Volume Entropy Based versus Volume Based Fraud Detection Epidemeology Anomaly Detection in Climate and Weather Anomalies in Climate Validation of Anomalies
Anomaly Detection in Climate and Weather
Science Questions Identify natural and anthropogenic disasters Identify long time scale events - droughts atmospheric rivers
cold fronts etc
Data Ground observations Remote sensing data (satellites
air-borne) Climate model simulation outputs Multiple variables spatio-temporal (often has height dimension
as well)
Challenges Model spatio-temporal relationships across multiple variables Explain the cause of anomalies Massive data sizes
Climate and weather extreme events are well defined
Key challenge is to find significant events and explain the cause
Chawla and Chandola Anomaly Detection
Introduction Data Mining Methods Density-based anomaly Commute Time Approach Addressing Scalability Anomalies in Complex Data Evaluating Anomaly Detection Methods Applications Problem solutionsPCA and Subspace Method Subspace Method Algorithm Subspace Analysis Results Discussion Typical Characteristics of Anomaly Limitation of Volume Entropy Based versus Volume Based Fraud Detection Epidemeology Anomaly Detection in Climate and Weather Anomalies in Climate Validation of Anomalies
Anomalies are Widely Used in Climate
Most analysis done on ldquoanomalyrdquo time series
Difference from a ldquobase periodrdquo (Toosimplistic)
Brings spatial smoothness (eg a mountaintop and nearby valley can have very differenttemperatures) Removes seasonality
Understand climate and weatherphenomenon
Southern Oscillation Index (SOI) Difference between Sea Level Pressure
(SLP) anomalies for Tahiti and DarwinAustralia
Figure Global AverageTemperature Anomaly(1975 - 2007) Srcwwwmetofficegovuk
Chawla and Chandola Anomaly Detection
Introduction Data Mining Methods Density-based anomaly Commute Time Approach Addressing Scalability Anomalies in Complex Data Evaluating Anomaly Detection Methods Applications Problem solutionsPCA and Subspace Method Subspace Method Algorithm Subspace Analysis Results Discussion Typical Characteristics of Anomaly Limitation of Volume Entropy Based versus Volume Based Fraud Detection Epidemeology Anomaly Detection in Climate and Weather Anomalies in Climate Validation of Anomalies
Constructing Anomalies from Raw Data
Anomaly time series for a given location i
vprimei = vi minus bi
where bi is the base (reference)
How to choose bi Mean of all data for location i Monthly mean values (account for seasonality) Monthly z-score values Median (more robust) Using a shorter ldquoreference periodrdquo
30 year moving window
Different methods show statistically significant differences[19] What is the right strategy Weighted mean of different strategies (Pick weights using
Monte Carlo sampling)
Chawla and Chandola Anomaly Detection
Introduction Data Mining Methods Density-based anomaly Commute Time Approach Addressing Scalability Anomalies in Complex Data Evaluating Anomaly Detection Methods Applications Problem solutionsPCA and Subspace Method Subspace Method Algorithm Subspace Analysis Results Discussion Typical Characteristics of Anomaly Limitation of Volume Entropy Based versus Volume Based Fraud Detection Epidemeology Anomaly Detection in Climate and Weather Anomalies in Climate Validation of Anomalies
Anomaly Detection for Identifying Droughts
Science question Identify significant drought patterns usinghistorical observation data or future simulation data or both
Find persistent spatiotemporal anomalies in precipitation data
A two step approach
1 Find precipitationanomalies usingthresholds
2 Find large connectedcomponents across spaceand time
Matlab - bwlabelbwlabeln
Followup Science questionExplain cause
(drought190120061avi)
Figure Video courtsey Dr ArindamBanerjee
Chawla and Chandola Anomaly Detection
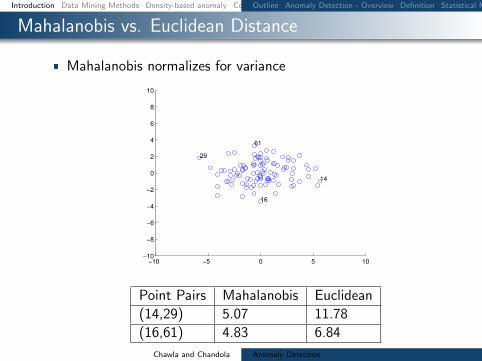
Introduction Data Mining Methods Density-based anomaly Commute Time Approach Addressing Scalability Anomalies in Complex Data Evaluating Anomaly Detection Methods Applications Problem solutionsOutline Anomaly Detection - Overview Definition Statistical Methods Anomaly Detection with Mahalanobis Distance Mahalanobis vs Euclidean Distance
Mahalanobis vs Euclidean Distance
Mahalanobis normalizes for variance
minus10 minus5 0 5 10minus10
minus8
minus6
minus4
minus2
0
2
4
6
8
10
14
61
16
29
Point Pairs Mahalanobis Euclidean
(1429) 507 1178
(1661) 483 684
Chawla and Chandola Anomaly Detection
Introduction Data Mining Methods Density-based anomaly Commute Time Approach Addressing Scalability Anomalies in Complex Data Evaluating Anomaly Detection Methods Applications Problem solutionsDistance-based anomalies DB(pD) outlier Distance-based methods (DB(kN) Pruning rule Examples of pruning technique Strengths and weaknesses - Distance-based techniques
Distance-based anomalies
Intuition A data point which is far away from its nearestneighbors is a candidate anomaly
Several definitions which capture the above intuition
DB(pD) anomaly [20] an object o in a data set T is aDB(pD) anomaly if at least a fraction p of objects in T havedistances greater than D from o
Generalizes the notion of ldquothree standard deviation from themeanrdquo
This definition had a huge influence on subsequentdevelopment in outlier detection
Chawla and Chandola Anomaly Detection
Introduction Data Mining Methods Density-based anomaly Commute Time Approach Addressing Scalability Anomalies in Complex Data Evaluating Anomaly Detection Methods Applications Problem solutionsDistance-based anomalies DB(pD) outlier Distance-based methods (DB(kN) Pruning rule Examples of pruning technique Strengths and weaknesses - Distance-based techniques
DB(pD) outlier
To build some intuition consider data generated from theNormal distribution N(0 1) Then if O is a DB(pD) outlier
1
(2π)12
int O+D
OminusDeminus
x2
2 dx le 1minus p
Example If O is 3 (3 standard deviations away from themean) then it is a DB(01 0999) outlier
Thus for particular settings of D and p DB(pD) capturesstandard outliers
But much more general (eg any distance metric)
Chawla and Chandola Anomaly Detection
Introduction Data Mining Methods Density-based anomaly Commute Time Approach Addressing Scalability Anomalies in Complex Data Evaluating Anomaly Detection Methods Applications Problem solutionsDistance-based anomalies DB(pD) outlier Distance-based methods (DB(kN) Pruning rule Examples of pruning technique Strengths and weaknesses - Distance-based techniques
Distance-based methods (DB(kN)
DB(kN) anomaly [28] top N data instances whosedistances to its k-th nearest neighbor are largest
Several advantages Ranking for anomalies is more intuitiveSetting of parameters generally easier
A Simple Nested Loop (SNL) algorithm can be used to selectthe top N DB(kN) outliers Time complexity is O(n2d)where n is the database size and d is the dimensionality
Chawla and Chandola Anomaly Detection
Introduction Data Mining Methods Density-based anomaly Commute Time Approach Addressing Scalability Anomalies in Complex Data Evaluating Anomaly Detection Methods Applications Problem solutionsDistance-based anomalies DB(pD) outlier Distance-based methods (DB(kN) Pruning rule Examples of pruning technique Strengths and weaknesses - Distance-based techniques
Pruning rule
DB(kN) anomaly [3] a data instance is not an anomaly ifits distance to its k-th current nearest neighbor is less thanthe score of the weakest anomaly among top N anomaliesfound so far
A large number of non-anomalies can be pruned withoutcarrying out a full data search
Complexity nearly O(n)
Chawla and Chandola Anomaly Detection
Introduction Data Mining Methods Density-based anomaly Commute Time Approach Addressing Scalability Anomalies in Complex Data Evaluating Anomaly Detection Methods Applications Problem solutionsDistance-based anomalies DB(pD) outlier Distance-based methods (DB(kN) Pruning rule Examples of pruning technique Strengths and weaknesses - Distance-based techniques
Examples of pruning technique
Non-anomalies are pruned earlier
Chawla and Chandola Anomaly Detection
Introduction Data Mining Methods Density-based anomaly Commute Time Approach Addressing Scalability Anomalies in Complex Data Evaluating Anomaly Detection Methods Applications Problem solutionsDistance-based anomalies DB(pD) outlier Distance-based methods (DB(kN) Pruning rule Examples of pruning technique Strengths and weaknesses - Distance-based techniques
Strengths and weaknesses - Distance-based techniques
Do not make any assumption about the distribution of thedata
Scalable for large dataset (O(n))
Capable of finding only global anomalies
Can lead to non-intuitive results in Top-k situations
0 10 20 30 40 50 60 700
10
20
30
40
50
60
70
dimension 1
dim
en
sio
n 2
p1
p2
p3
p4
Chawla and Chandola Anomaly Detection
Introduction Data Mining Methods Density-based anomaly Commute Time Approach Addressing Scalability Anomalies in Complex Data Evaluating Anomaly Detection Methods Applications Problem solutionsDensity-based anomaly Strengths and Weaknesses
Density-based anomaly
Calculate the density of an object based on the density of itsk nearest neighbours
density(p) = 1
sum
qisinNk(p)distk(p q)
|Nk(p)|
relative-density(p) =
density(p)1
|Nk(p)|sum
qisinNk(p)density(q)
anomaly-score(p) =1
relative-density(p)
LOF indicates a degree of local outlier-ness [6]
Chawla and Chandola Anomaly Detection
Introduction Data Mining Methods Density-based anomaly Commute Time Approach Addressing Scalability Anomalies in Complex Data Evaluating Anomaly Detection Methods Applications Problem solutionsDensity-based anomaly Strengths and Weaknesses
Strengths and Weaknesses
Can detect global and local anomalies
Cannot use pruning technique and has a complexity of O(n2)
Require a method combining the strengths of distance anddensity based approaches A distance based approach whichcan capture density
C
C
O
O1
1
2
2
Chawla and Chandola Anomaly Detection
Introduction Data Mining Methods Density-based anomaly Commute Time Approach Addressing Scalability Anomalies in Complex Data Evaluating Anomaly Detection Methods Applications Problem solutionsCommute time Computation of commute time Anomaly detection using commute time (CDOF) Fast estimation of commute time Scalability for Density-based method PINN Algorithm (ICDM 2010) PINN Guarantee Examples high-dim distance-based outliers Examples high-dim density-based outliers Examples local density-based outliers
Commute time
Commute time between i and j is the expected number ofsteps that a random walk starting at i will take to reach jonce and go back to i for the first time
Commute time can capture both the distance between pointsand the data densities
Chawla and Chandola Anomaly Detection
Introduction Data Mining Methods Density-based anomaly Commute Time Approach Addressing Scalability Anomalies in Complex Data Evaluating Anomaly Detection Methods Applications Problem solutionsCommute time Computation of commute time Anomaly detection using commute time (CDOF) Fast estimation of commute time Scalability for Density-based method PINN Algorithm (ICDM 2010) PINN Guarantee Examples high-dim distance-based outliers Examples high-dim density-based outliers Examples local density-based outliers
Computation of commute time
Commute time can be computed using graph Laplacian matrixL
cij = VG(ei minus ej)TL+(ei minus ej)L+ pseudo-inverse of LVG graph volumeei i-th column of the identity matrix
Commute time is Euclidean distance in the space spanned byeigenvectors of L
cij = VG[(Sminus12V T )(ei minus ej)]T [(Sminus12V T )(ei minus ej)]
V S eigenvectors and eigenvalues of L
Chawla and Chandola Anomaly Detection
Introduction Data Mining Methods Density-based anomaly Commute Time Approach Addressing Scalability Anomalies in Complex Data Evaluating Anomaly Detection Methods Applications Problem solutionsCommute time Computation of commute time Anomaly detection using commute time (CDOF) Fast estimation of commute time Scalability for Density-based method PINN Algorithm (ICDM 2010) PINN Guarantee Examples high-dim distance-based outliers Examples high-dim density-based outliers Examples local density-based outliers
Anomaly detection using commute time (CDOF)
Construct the mutual k nearest neighbor graph G from thedataset
Compute the Laplacian matrix L of G and its eigensystems
Find top N anomalies using the distance-based technique incommute time with pruning rule
Complexity O(n3)
Commute time method can detect global local and groupanomalies
Chawla and Chandola Anomaly Detection
Introduction Data Mining Methods Density-based anomaly Commute Time Approach Addressing Scalability Anomalies in Complex Data Evaluating Anomaly Detection Methods Applications Problem solutionsCommute time Computation of commute time Anomaly detection using commute time (CDOF) Fast estimation of commute time Scalability for Density-based method PINN Algorithm (ICDM 2010) PINN Guarantee Examples high-dim distance-based outliers Examples high-dim density-based outliers Examples local density-based outliers
Fast estimation of commute time
Speilman and Srivastava [31] combined random projection anda linear time solver to build a structure where we can computethe compute time between two nodes in O(log n) time
Complexity of CDOF O(n3)rarr O(n log n)
Uses a near linear time solver for a linear system of equationAx = b
Spielman and Teng solvers Also see work by Iannis Koutisfrom CMU
Chawla and Chandola Anomaly Detection
Introduction Data Mining Methods Density-based anomaly Commute Time Approach Addressing Scalability Anomalies in Complex Data Evaluating Anomaly Detection Methods Applications Problem solutionsCommute time Computation of commute time Anomaly detection using commute time (CDOF) Fast estimation of commute time Scalability for Density-based method PINN Algorithm (ICDM 2010) PINN Guarantee Examples high-dim distance-based outliers Examples high-dim density-based outliers Examples local density-based outliers
Scalability for Density-based method
The pruning rule for Distance-based methods does not applyto Density-based approaches
We can go from O(n2) to nearly O(n log n) by using an index
One solution for the curse of high dimensionality is to use ofrandom projections
Chawla and Chandola Anomaly Detection
Introduction Data Mining Methods Density-based anomaly Commute Time Approach Addressing Scalability Anomalies in Complex Data Evaluating Anomaly Detection Methods Applications Problem solutionsCommute time Computation of commute time Anomaly detection using commute time (CDOF) Fast estimation of commute time Scalability for Density-based method PINN Algorithm (ICDM 2010) PINN Guarantee Examples high-dim distance-based outliers Examples high-dim density-based outliers Examples local density-based outliers
PINN Algorithm (ICDM 2010)
Chawla and Chandola Anomaly Detection
Introduction Data Mining Methods Density-based anomaly Commute Time Approach Addressing Scalability Anomalies in Complex Data Evaluating Anomaly Detection Methods Applications Problem solutionsCommute time Computation of commute time Anomaly detection using commute time (CDOF) Fast estimation of commute time Scalability for Density-based method PINN Algorithm (ICDM 2010) PINN Guarantee Examples high-dim distance-based outliers Examples high-dim density-based outliers Examples local density-based outliers
PINN Guarantee
The PINN Algorithm provides probabilistic guarantees
Under certain assumptions about intrinsic dimensionality (c)with high probability
1minus ε1 + ε
middot LOF (p) le LOF (p) le 1 + ε
1minus ε middot LOF (p)
In practice we do not know the intrinsic dimensionality ofdata However random projections are quite robust
Chawla and Chandola Anomaly Detection
Introduction Data Mining Methods Density-based anomaly Commute Time Approach Addressing Scalability Anomalies in Complex Data Evaluating Anomaly Detection Methods Applications Problem solutionsCommute time Computation of commute time Anomaly detection using commute time (CDOF) Fast estimation of commute time Scalability for Density-based method PINN Algorithm (ICDM 2010) PINN Guarantee Examples high-dim distance-based outliers Examples high-dim density-based outliers Examples local density-based outliers
Examples high-dim distance-based outliers
On a large database of images the bright images show up asdistance based outliers
Chawla and Chandola Anomaly Detection
Introduction Data Mining Methods Density-based anomaly Commute Time Approach Addressing Scalability Anomalies in Complex Data Evaluating Anomaly Detection Methods Applications Problem solutionsCommute time Computation of commute time Anomaly detection using commute time (CDOF) Fast estimation of commute time Scalability for Density-based method PINN Algorithm (ICDM 2010) PINN Guarantee Examples high-dim distance-based outliers Examples high-dim density-based outliers Examples local density-based outliers
Examples high-dim density-based outliers
On a large database of images occluded images show up asdensity based outliers
Chawla and Chandola Anomaly Detection
Introduction Data Mining Methods Density-based anomaly Commute Time Approach Addressing Scalability Anomalies in Complex Data Evaluating Anomaly Detection Methods Applications Problem solutionsCommute time Computation of commute time Anomaly detection using commute time (CDOF) Fast estimation of commute time Scalability for Density-based method PINN Algorithm (ICDM 2010) PINN Guarantee Examples high-dim distance-based outliers Examples high-dim density-based outliers Examples local density-based outliers
Examples local density-based outliers
Examples of images ranked by LOF
Chawla and Chandola Anomaly Detection
Introduction Data Mining Methods Density-based anomaly Commute Time Approach Addressing Scalability Anomalies in Complex Data Evaluating Anomaly Detection Methods Applications Problem solutions
Addressing Scalability
Chawla and Chandola Anomaly Detection
Introduction Data Mining Methods Density-based anomaly Commute Time Approach Addressing Scalability Anomalies in Complex Data Evaluating Anomaly Detection Methods Applications Problem solutions
Using GPUs for Anomaly Detection
Well suited for data parallel algorithms Using CUDA - Compute Unified Device
Architecture (Nvidia)
Need to re-engineer existing algorithms Utilization of device memory Minimize CPUhArrGPU transfer of data Keep threads homogeneous
Most model based algorithms arenaturally setup for the testing phase
Model building needs careful redesign
What about unsupervised algorithms
Kernel
Host
Grid
Device
Block(00)
Block(01)
Block(02)
Block(10)
Block(11)
Block(12)
Thread Block
Thread(00)
Thread(01)
Thread(02)
Thread(03)
Thread(10)
Thread(11)
Thread(12)
Thread(13)
Thread(20)
Thread(21)
Thread(22)
Thread(23)
Host Host Memory
SM 2
SM 1
SM 0
Registers Registers Registers
SP 0 SP 1 SP 7
Shared Memory
Global Memory
Texture Memory
Constant Memory
Device
Chawla and Chandola Anomaly Detection
Introduction Data Mining Methods Density-based anomaly Commute Time Approach Addressing Scalability Anomalies in Complex Data Evaluating Anomaly Detection Methods Applications Problem solutions
Implementing DB(kN) on GPUs
Return top N data instances whose distances tok-th nearest neighbor are largest (SerialDB(kN) is O(n2))
Involves computing pairwise distances
Load block i and block j to shared memory Data layout in memory should be optimized
Each thread computes distance between a pairof instances
Can utilize this time to load next chunk of datafrom host to device memory
Writes results to corresponding output block
Sorting can be done efficiently in CUDA [29]
d
n
T
n
n
Chawla and Chandola Anomaly Detection
Introduction Data Mining Methods Density-based anomaly Commute Time Approach Addressing Scalability Anomalies in Complex Data Evaluating Anomaly Detection Methods Applications Problem solutionsCategorical Data Discrete Sequences and Time Series Contextual Anomalies Collective Anomalies
Moving Beyond Multi-dimensional Record Data
Categorical (Mixed)
Fraud Detection
Cyber Networks
Time Series
Sensor Networks
Healthcare
Discrete Sequences
Genomic
System Calls
Spatial
GIS
Image analysis
Spatio-temporal
Remote sensing
Climate
Graphs
Social networks
Epidemiology
Chawla and Chandola Anomaly Detection
Introduction Data Mining Methods Density-based anomaly Commute Time Approach Addressing Scalability Anomalies in Complex Data Evaluating Anomaly Detection Methods Applications Problem solutionsCategorical Data Discrete Sequences and Time Series Contextual Anomalies Collective Anomalies
Handling Categorical Data
Each attribute can belong to one of many categories
No ordering between categories
Mixed data (categorical and continuous attributes)
cap-shape cap-surface middot middot middot habitat type
convex smooth urban poisonousconvex smooth grasses ediblebell smooth meadows edibleconvex scaly urban poisonousconvex smooth grasses ediblemiddot middot middot
Table Mushroom Data Set [2]
Chawla and Chandola Anomaly Detection
Introduction Data Mining Methods Density-based anomaly Commute Time Approach Addressing Scalability Anomalies in Complex Data Evaluating Anomaly Detection Methods Applications Problem solutionsCategorical Data Discrete Sequences and Time Series Contextual Anomalies Collective Anomalies
Approaches to Identify Categorical Anomalies
Using Association Analysis [24]
Binarize data
Learn rules (X rArr Y ) Choose high confidence
rules (P (Y |X))
For test record Z = 〈XY 〉find rules of the formP (Y |X)
Y is not observed whenX is observed
Using Bayesian Networks [33]
Learn Bayesian networkstructure and parameters
Compute P (Z) for test datarecord Z
Flag anomaly if P (Z) lt δ
Using Similarity Metrics [10]
Use a similarity measure (S(X1 X2))
Apply distancedensityclustering based method (eg lof)
Chawla and Chandola Anomaly Detection
Introduction Data Mining Methods Density-based anomaly Commute Time Approach Addressing Scalability Anomalies in Complex Data Evaluating Anomaly Detection Methods Applications Problem solutionsCategorical Data Discrete Sequences and Time Series Contextual Anomalies Collective Anomalies
Conditional Probability Test [18]
Identify unusual combinations of attribute values
r(at bt) =P (at bt)
P (at)P (bt)
A capB = φ Assumption If r(at bt) is low and is observed in test record t
then t is anomalous For a test record t
For each mutually exclusive pair of attribute sets ABcompute r(at bt)
Score t based on all r-values Assign minimum r-value as score Take product of all r-values
Need to compare exponential pairs of subsets Only consider subsets upto size k Ignore subsets with frequency less than a threshold α Avoid comparing independent subsets of attributes
micro(AB) ge βmicroChawla and Chandola Anomaly Detection
Introduction Data Mining Methods Density-based anomaly Commute Time Approach Addressing Scalability Anomalies in Complex Data Evaluating Anomaly Detection Methods Applications Problem solutionsCategorical Data Discrete Sequences and Time Series Contextual Anomalies Collective Anomalies
Estimating Probabilities for CPT [18]
Maximum LikelihoodEstimation
P (at bt)
P (at)P (bt)=C(at bt)
Ntimes N
C(at)times N
C(bt)
C(at) Number of traininginstances with A = at
N Total number of traininginstances
Laplace Smoothing
E(p) =C(p) + 1
N + 2
r(at bt) =E(at bt)
E(at)times E(bt)
Speedup Tricks
Replace rare attributevalues with genericattribute (reduce arity)
Use efficient datastructure to querying forcounts(AD Trees [26])
ADTrees work fasterfor low arity attributes
Chawla and Chandola Anomaly Detection
Introduction Data Mining Methods Density-based anomaly Commute Time Approach Addressing Scalability Anomalies in Complex Data Evaluating Anomaly Detection Methods Applications Problem solutionsCategorical Data Discrete Sequences and Time Series Contextual Anomalies Collective Anomalies
Finding Anomalies in Discrete Sequences
Many problem formulations
1 Anomalous symbols in asequence
2 Anomalous subsequence in asequence
3 Anomalous sequence in adatabase of sequences
See [11] for a comparativeevaluation [9] for a survey
login pwdmail ssh mail web logoutlogin pwdmail web web web web logoutlogin pwdmail ssh mail web web logoutlogin pwdwebmail ssh webmail logoutloginpwd loginpwd loginpwd logout
Chawla and Chandola Anomaly Detection
Introduction Data Mining Methods Density-based anomaly Commute Time Approach Addressing Scalability Anomalies in Complex Data Evaluating Anomaly Detection Methods Applications Problem solutionsCategorical Data Discrete Sequences and Time Series Contextual Anomalies Collective Anomalies
Treating Sequences as Points
Utilize a distancesimilarity measure Plug into a distancedensityclustering based method
Simplest Hamming Distance
h(Ai Bi) = 1 Ai 6= Bi= 0 Ai = Bi
H(AB) =nsumi=1
h(Ai Bi)
Issues Unequal lengths misalignment Normalized Length of Longest Common Subsequence
D(AB) = 1minus |LCS(AB)|radic|A||B|
Standard Dynamic Programming method is slow Faster versions available (Hunt Szymnaski method [7])
Weaknesses Cannot localize anomalies within a sequence Weak anomaly signals might get lost
Chawla and Chandola Anomaly Detection
Introduction Data Mining Methods Density-based anomaly Commute Time Approach Addressing Scalability Anomalies in Complex Data Evaluating Anomaly Detection Methods Applications Problem solutionsCategorical Data Discrete Sequences and Time Series Contextual Anomalies Collective Anomalies
Using Sliding Windows
Slide a window of size k
Extract all windows from a sequence (nminus k + 1)
Training (Creating a normal dictionary) Store all uniquewindows in all normal sequences and their counts
Testing For each window find the frequency in normal dictionary Anomaly score is inverse of the aggregate frequencies for all
windows (normalized by length)
Many variants exist For each window find the hamming distance to the closest
window in the normal dictionary [16]
Issues Penalizes low frequency windows in the normal dictionary Rewards high frequency windows that might not be relevant Can construct anomalous sequences that will escape detection
Chawla and Chandola Anomaly Detection
Introduction Data Mining Methods Density-based anomaly Commute Time Approach Addressing Scalability Anomalies in Complex Data Evaluating Anomaly Detection Methods Applications Problem solutionsCategorical Data Discrete Sequences and Time Series Contextual Anomalies Collective Anomalies
Using Probabilistic Models
Probability of occurrence of sequence S
P (S) =nprodi=1
P (Si|S1 Siminus1)
Short memory property of sequences
P (Si|S1 Siminus1) = P (Si|Siminusk Siminus1)
Conditional probability estimates for a symbol Si
P (Si|Siminusk Siminus1) =f(Si|Siminusk Si)f(Si|Siminusk Siminus1)
f is estimated from the normal dictionary
Anomaly score for a test sequence is inverse of the normalizedprobability of occurrence
Issues What if the suffix occurs very infrequently in thenormal data (or not at all)
Replace with the longest suffix that occurs sufficient number oftimes [32] - Probabilistic Suffix Trees
Significantly reduces the size of the modelChawla and Chandola Anomaly Detection
Introduction Data Mining Methods Density-based anomaly Commute Time Approach Addressing Scalability Anomalies in Complex Data Evaluating Anomaly Detection Methods Applications Problem solutionsCategorical Data Discrete Sequences and Time Series Contextual Anomalies Collective Anomalies
Finding Contextual Anomalies
Sometimes contextual information isavailable about data
Not used directly as a feature Are well understood no anomalies in
the context Can reduce false positives and yield
interesting anomalies
Example adapted from [30]
Clearest Outlier
Conditional Anomaly
Maximum Daily Temperature
Number
ofFever
Cases
Contextual anomalies - Anomalous with respect to a context Context is defined using environmental variables
Spatial (Latitude Longitude) Graph context (Edges Weights) Temporal location Domain specific (Demographic other)
How to incorporate context Reduce to traditional anomaly detection (subset on context) Explicitly model contextual information (time series spatial)
Chawla and Chandola Anomaly Detection
Introduction Data Mining Methods Density-based anomaly Commute Time Approach Addressing Scalability Anomalies in Complex Data Evaluating Anomaly Detection Methods Applications Problem solutionsCategorical Data Discrete Sequences and Time Series Contextual Anomalies Collective Anomalies
Conditional Anomaly Detection
Data instance d rArru1 u2 udU v1 v2 vdV
dU environmentalattributes
dV indicator attributes u1
u2
U1
U2
U3
v1
v2
V1V2
V3
p(V1|U3) = 02
p(V2|U3) = 02
p(V3|U3) = 06
Algorithm [30]
1 Learn a Gaussian Mixture Model (GMM)U = U1 U2 UnU
each with dimensionality dU2 Learn a set of Gaussians U = V1 V2 VnV
each withdimensionality dV
3 Learn a probabilistic mapping function p(Vj |Ui)4 Score a test instance d = [uv]
S =
nUsumi=1
p(u|Ui)nVsumj=1
p(v|Vj)p(Vj |Ui)
Chawla and Chandola Anomaly Detection
Introduction Data Mining Methods Density-based anomaly Commute Time Approach Addressing Scalability Anomalies in Complex Data Evaluating Anomaly Detection Methods Applications Problem solutionsCategorical Data Discrete Sequences and Time Series Contextual Anomalies Collective Anomalies
Finding Collective Anomalies
Find a collection of data points
Each point by itself is normal
The collection as a whole isanomalous
Relevant when data has inherentstructure and
When domain definition ofanomalies cannot be described aspoint anomalies
A Simple Solution
1 Break data intogroups
2 Compute features foreach group
3 Apply traditionalanomaly detection
Examples
1 Time series
2 Image
3 Spatial clusters ofgalaxies
Chawla and Chandola Anomaly Detection
Introduction Data Mining Methods Density-based anomaly Commute Time Approach Addressing Scalability Anomalies in Complex Data Evaluating Anomaly Detection Methods Applications Problem solutionsCategorical Data Discrete Sequences and Time Series Contextual Anomalies Collective Anomalies
Using Latent Dirichlet Allocation for Group Anomalies
Find anomalous groups in data [34]
Example Spatial clusters of galaxies topics red green emissive words continuous features
Flexible Genre Model (FGM)
For each group
1 Draw a genre 1 2 T 3 ym simM(π)2 Draw topic distribution forym SK 3 θm sim Dir(αym)
3 Draw K topicsβmk sim P (βmk|ηk)k=12K
4 For each point in group
1 Draw topic membershipzmn simM(θn)
2 Generate pointxmn isin P (xmn|βmzmn)
α
zmn
xmn
N
θm
T
π
ηK
ym
β
MK
Model Parameters
M(π) -Multinomial
Genre - Dir(αt)
Topic generatorsP (|ηk)- GIW
Point generatorsP (xmn|βnk) -MultivariateGaussian
Chawla and Chandola Anomaly Detection
Introduction Data Mining Methods Density-based anomaly Commute Time Approach Addressing Scalability Anomalies in Complex Data Evaluating Anomaly Detection Methods Applications Problem solutionsCategorical Data Discrete Sequences and Time Series Contextual Anomalies Collective Anomalies
Inference and Testing for FGM
Inference and Learning Parameters
Approximate inference of latentvariables (Gibbs Sampling)
Use samples to learn parameters(Single step Monte Carlo EM)
Topic 1
Topic 2
Topic 3
Anomaly Detection
Infer the topic distribution θm
Compute negative log likelihood wrt αt
Rationale An anomalous group will be unlikely to begenerated from any genre
Geometric interpretation Mapping each group into a Tdimensional space and finding anomalies
Chawla and Chandola Anomaly Detection
Introduction Data Mining Methods Density-based anomaly Commute Time Approach Addressing Scalability Anomalies in Complex Data Evaluating Anomaly Detection Methods Applications Problem solutions
Evaluating Anomaly Detection Methods - Labels
Labeled validation data set exists Confusion matrix Traditional evaluation metrics
Class imbalance
ROC Curve
Validation set does not exist Use domain expertise to find TP
and FP FN is harder to estimate
Pseudo false negativeestimation techniques [25]
Predicteda n
Actuala TP FNn FP TN
Acc =TP + TNsum
Rec (R) =TP
TP + FN
Prec (P ) =TP
TP + FP
F =2 lowastR lowast PR+ P
Chawla and Chandola Anomaly Detection
Introduction Data Mining Methods Density-based anomaly Commute Time Approach Addressing Scalability Anomalies in Complex Data Evaluating Anomaly Detection Methods Applications Problem solutions
Evaluating Anomaly Detection Methods - Scores
Convert to binary output Use threshold δ on score (Scale
issues [21]) Take top x as anomalies
ROC curve by varying x or δ
Quality of output Does the output ldquosuggestrdquo x or δ Which output is better
Chawla and Chandola Anomaly Detection
Introduction Data Mining Methods Density-based anomaly Commute Time Approach Addressing Scalability Anomalies in Complex Data Evaluating Anomaly Detection Methods Applications Problem solutions
Unifying Scores
Different methods assign scores in differentranges
kNN-based scores [0 1] Lof scores [1 6] ABOD scores [0 80000]
Anomalies have lower scores
Direct scaling to [0 1] might lose distinctionbetween normal and anomalies
Desired scaling Stretch interesting rangesand shrink irrelevant ones
Generalized Procedure for Normalizing Outlier Scores [21] Regularity rArr S(o) ge 0forallo S(o) asymp 0 if o is normal andS(o) 0 if o is anomalous
Normality S is regular and S(o) isin [0 1]forallo
Chawla and Chandola Anomaly Detection
Introduction Data Mining Methods Density-based anomaly Commute Time Approach Addressing Scalability Anomalies in Complex Data Evaluating Anomaly Detection Methods Applications Problem solutions
Regularization and Normalization of Scores
Regularization
1 R(o) = max0 S(o)minus baseS2 R(o) = Smax minus S(o)
3 R(o) = minus log SmaxS(o)
Normalization
1 N(o) = S(o)Smax
2 N(o) = max(
0 erf(S(o)minusmicroSσS radic2
))(Gaussian Scaling)
Suited for high dimensional data
3 N(o) = max(
0cdfγS (o)minusmicroγ
1minusmicroγ
)(Gamma Scaling)
Where cdfγS (o) = P (k S(o) θ) P is the regularized Gamma function Suited for low dimensional data
Chawla and Chandola Anomaly Detection
Introduction Data Mining Methods Density-based anomaly Commute Time Approach Addressing Scalability Anomalies in Complex Data Evaluating Anomaly Detection Methods Applications Problem solutions
Generating Labeled Data for Validation
Generating Both Normal and Anomalous Data
Use generative models for normal and anomalous behavior
Several generators available Multivariate continuous data [27] Multivariate categorical data [5] Discrete sequences using HMM [12]
Drawbacks Might not capture the domain characteristics
Injecting Anomalies - Random Perturbation[30]
Given data point z = xy x and y arepartitions of feature space
Take a random sample D of the entire data set
Let zprime = xprimeyprime isin D such that distancebetween y and yprime is maximum
Replace x with xprime and add z back to data setx
yz
zprime
Injected anomaly
Chawla and Chandola Anomaly Detection
Introduction Data Mining Methods Density-based anomaly Commute Time Approach Addressing Scalability Anomalies in Complex Data Evaluating Anomaly Detection Methods Applications Problem solutionsWhat is Network Anomaly Detection Motivation How Much Serious
Applications Overview
How to set up an anomaly detection solution for agiven application domain
Available data Define anomalies define normal behavior Identify requirements and constraints (online
real-time limited resources) What domain knowledge available
Feature identification Defining normal and anomalous behavior Tuning parameters
Available ground truth (training validation)
Chawla and Chandola Anomaly Detection
Introduction Data Mining Methods Density-based anomaly Commute Time Approach Addressing Scalability Anomalies in Complex Data Evaluating Anomaly Detection Methods Applications Problem solutionsWhat is Network Anomaly Detection Motivation How Much Serious
What is Network Anomaly Detection
Anomaly Detection or Intrusion Detection
Traditional Intrusion Detection Systems (IDS) finding attackscorresponding to predefined pattern data set known as signaturestherefore system is absolutely vulnerable against zero-day attacks
Network Anomaly Detection Systems (NADS) to detectzero-day attacks without any pre-identified signature besides profilenormal behavior of the network and address suspected incidents
Network Anomaly Detection finding unusual and largechanges in the network traffic
Examples intentional attacks (eg Distributed Denial ofService - DDoS) or unusual network traffic (eg flash crowds)
Chawla and Chandola Anomaly Detection
Introduction Data Mining Methods Density-based anomaly Commute Time Approach Addressing Scalability Anomalies in Complex Data Evaluating Anomaly Detection Methods Applications Problem solutionsWhat is Network Anomaly Detection Motivation How Much Serious
Motivation How Much Serious
According to Symantec report released in early 2011 morethan 286 million new threats have been detected in 2010which is a huge number
1656227
2704836
1000000
1500000
2000000
2500000
3000000
20547 18827 69107 113025 140690
624267
1656227
2704836
0
500000
1000000
1500000
2000000
2500000
3000000
2002 2003 2004 2005 2006 2007 2008 July2009-June2010
Chawla and Chandola Anomaly Detection
Introduction Data Mining Methods Density-based anomaly Commute Time Approach Addressing Scalability Anomalies in Complex Data Evaluating Anomaly Detection Methods Applications Problem solutionsNetwork Topology Network Anomalies Detection Problem Network Anomalies Detection Problem Why care about OD Flows
Network Topology
A Typical network
1 y
Router
2
3
41t
x2t
x1t
x3t
x4t
Origin-Destination (OD) flow is the traffic that enters at anorigin node and exits at a destination node of a backbonenetwork x1t x1t
Link measurement is the traffic enters at an node during aninterval y1t
Relationship between link traffic and OD flow traffic iscaptured by the routing matrix A
Chawla and Chandola Anomaly Detection
Introduction Data Mining Methods Density-based anomaly Commute Time Approach Addressing Scalability Anomalies in Complex Data Evaluating Anomaly Detection Methods Applications Problem solutionsNetwork Topology Network Anomalies Detection Problem Network Anomalies Detection Problem Why care about OD Flows
Network Anomalies Detection Problem
Chawla and Chandola Anomaly Detection
Introduction Data Mining Methods Density-based anomaly Commute Time Approach Addressing Scalability Anomalies in Complex Data Evaluating Anomaly Detection Methods Applications Problem solutionsNetwork Topology Network Anomalies Detection Problem Network Anomalies Detection Problem Why care about OD Flows
Network Anomalies Detection Problem
Chawla and Chandola Anomaly Detection
Introduction Data Mining Methods Density-based anomaly Commute Time Approach Addressing Scalability Anomalies in Complex Data Evaluating Anomaly Detection Methods Applications Problem solutionsNetwork Topology Network Anomalies Detection Problem Network Anomalies Detection Problem Why care about OD Flows
Why care about OD Flows
Volume anomaly typically arises on an OD flow (trafficarriving at one node and destined for another node)
If we only monitor traffic on network links volume arisingfrom an OD flow may not be noticeable Thus naiveapproach wont work if OD flow info is not available
Figure source [22]
Chawla and Chandola Anomaly Detection
Introduction Data Mining Methods Density-based anomaly Commute Time Approach Addressing Scalability Anomalies in Complex Data Evaluating Anomaly Detection Methods Applications Problem solutionsPCA and Subspace Method Subspace Method Algorithm Subspace Analysis Results Discussion Typical Characteristics of Anomaly Limitation of Volume Entropy Based versus Volume Based Fraud Detection Epidemeology Anomaly Detection in Climate and Weather Anomalies in Climate Validation of Anomalies
PCA and Subspace Method
Chawla and Chandola Anomaly Detection
Introduction Data Mining Methods Density-based anomaly Commute Time Approach Addressing Scalability Anomalies in Complex Data Evaluating Anomaly Detection Methods Applications Problem solutionsPCA and Subspace Method Subspace Method Algorithm Subspace Analysis Results Discussion Typical Characteristics of Anomaly Limitation of Volume Entropy Based versus Volume Based Fraud Detection Epidemeology Anomaly Detection in Climate and Weather Anomalies in Climate Validation of Anomalies
Subspace Method Algorithm
Step1- Determine the PCs based on eigenvaluedecomposition of the covariance matrix of the dataset
Step2- Choose first top k principle components with thehighest eigenvalues as matrix P
Step3-normal traffic subspace called Z
Z = PP TZ = CZ
Step4-abnormal traffic subspace called Z
Z = (I minus PP T )Z = CZ
Step5-If the norm of a vector is large then it is an rdquoanomalyrdquo
Chawla and Chandola Anomaly Detection
Introduction Data Mining Methods Density-based anomaly Commute Time Approach Addressing Scalability Anomalies in Complex Data Evaluating Anomaly Detection Methods Applications Problem solutionsPCA and Subspace Method Subspace Method Algorithm Subspace Analysis Results Discussion Typical Characteristics of Anomaly Limitation of Volume Entropy Based versus Volume Based Fraud Detection Epidemeology Anomaly Detection in Climate and Weather Anomalies in Climate Validation of Anomalies
Subspace Analysis Results
Note that during anomaly normal component does not changethat much while residual component changes quite a lot
Thus anomalies can be detected by setting some threshold
Figure source [22]
Chawla and Chandola Anomaly Detection
Introduction Data Mining Methods Density-based anomaly Commute Time Approach Addressing Scalability Anomalies in Complex Data Evaluating Anomaly Detection Methods Applications Problem solutionsPCA and Subspace Method Subspace Method Algorithm Subspace Analysis Results Discussion Typical Characteristics of Anomaly Limitation of Volume Entropy Based versus Volume Based Fraud Detection Epidemeology Anomaly Detection in Climate and Weather Anomalies in Climate Validation of Anomalies
Discussion Typical Characteristics of Anomaly
Most Anomalies induce a change in distributionalaspects of packet header fields (called features)
Most important features include 5-tuple Source ampdestination IP addresses Source and destination portnumbers and IP protocol
raquo DOS attack ndash multiple source IP address concentrated on asingle destination IP address
raquo Network scan ndash dispersed distribution of destination addresses
raquo Most wormsviruses also induce some change in distribution ofcertain features
raquo However these changes can be very subtle and mining them islike searching for needles in a haystack
Unlike many previous approach this paper aims todetect events which disturb the distribution of trafficfeatures rather than traffic volume
Chawla and Chandola Anomaly Detection
Introduction Data Mining Methods Density-based anomaly Commute Time Approach Addressing Scalability Anomalies in Complex Data Evaluating Anomaly Detection Methods Applications Problem solutionsPCA and Subspace Method Subspace Method Algorithm Subspace Analysis Results Discussion Typical Characteristics of Anomaly Limitation of Volume Entropy Based versus Volume Based Fraud Detection Epidemeology Anomaly Detection in Climate and Weather Anomalies in Climate Validation of Anomalies
Limitation of Volume
Figure source [22]
Port scan anomaly (traffic feature changes however traffic volume
remains more or less the same)
We can use entropy tocapture the variationsin the traffic feature
bullTakes value 0 when distribution is maximally concentratedbullTakes value log2N when distribution is maximally dispersed
But stands out in
feature entropy
which also reveals
its structure
Port scan
dwarfed
in volume
metricshellip
Chawla and Chandola Anomaly Detection
Introduction Data Mining Methods Density-based anomaly Commute Time Approach Addressing Scalability Anomalies in Complex Data Evaluating Anomaly Detection Methods Applications Problem solutionsPCA and Subspace Method Subspace Method Algorithm Subspace Analysis Results Discussion Typical Characteristics of Anomaly Limitation of Volume Entropy Based versus Volume Based Fraud Detection Epidemeology Anomaly Detection in Climate and Weather Anomalies in Climate Validation of Anomalies
Entropy Based versus Volume Based
DoSDDoS Attacks- a spike in traffic data toward adominant destination IP
Scan anomaly-a spike in traffic data from a dominant sourceIP
Flash Crowd anomaly- again a spike in traffic data to adominant destination IP
Worm anomaly-a Spike in traffic with a dominant port
Chawla and Chandola Anomaly Detection
Introduction Data Mining Methods Density-based anomaly Commute Time Approach Addressing Scalability Anomalies in Complex Data Evaluating Anomaly Detection Methods Applications Problem solutionsPCA and Subspace Method Subspace Method Algorithm Subspace Analysis Results Discussion Typical Characteristics of Anomaly Limitation of Volume Entropy Based versus Volume Based Fraud Detection Epidemeology Anomaly Detection in Climate and Weather Anomalies in Climate Validation of Anomalies
Fraud Detection
Domain Question Identifyfraudulent activities or players fromobserved transaction data
Data Transactions between different
players in the system Meta information about the
individuals An underlying graph structure
Challenges Track and model human behavior Anomalies caused by adaptive
human adversaries Massive data sizes
Insurance (autohealtha)
ClaimantProvider Payer
Telecommunications Customer
Provider
Credit Cards Customer
Supplier Bank
Web Advertising User Advertiser
Publisher
ahttpwwwcheatingculturecompast-cases-of-medicare-fraud
Chawla and Chandola Anomaly Detection
Introduction Data Mining Methods Density-based anomaly Commute Time Approach Addressing Scalability Anomalies in Complex Data Evaluating Anomaly Detection Methods Applications Problem solutionsPCA and Subspace Method Subspace Method Algorithm Subspace Analysis Results Discussion Typical Characteristics of Anomaly Limitation of Volume Entropy Based versus Volume Based Fraud Detection Epidemeology Anomaly Detection in Climate and Weather Anomalies in Climate Validation of Anomalies
A Generic Fraud Detection Method
Activity Monitoring [13]1 Build profiles for individuals (customers users etc) based on
historic data User X makes n calls on an average in January
2 Compare current behavior with historical profile for significantdeviations
Clustering based [4]1 Cluster historical profiles of customers2 Identify small clusters or outlying profiles as anomalies
Strengths Anomaly detection is fast (good for real time) Results are easy to explain
Weaknesses Need to create and maintain a large number of profiles Not dynamic Adequate historical data might not be available Too many false positives
Chawla and Chandola Anomaly Detection
Introduction Data Mining Methods Density-based anomaly Commute Time Approach Addressing Scalability Anomalies in Complex Data Evaluating Anomaly Detection Methods Applications Problem solutionsPCA and Subspace Method Subspace Method Algorithm Subspace Analysis Results Discussion Typical Characteristics of Anomaly Limitation of Volume Entropy Based versus Volume Based Fraud Detection Epidemeology Anomaly Detection in Climate and Weather Anomalies in Climate Validation of Anomalies
Exploiting Graph Structure - Weighted Graphs
Represent data as a weighted graph Communication networks (phone email SMS) Provider referral networks
Objective Identify anomalous nodes
For each node extract several features based on the propertiesof the induced sub-graph (egonet) of neighboring nodes [1]
Choose features that can highlight anomalous nodes
1 Ni degree of node2 Ei number of edges in egonet3 Wi total weight of egonet4 λi principal eigen vector of weighted adjacency matrix of
egonet
Data is transformed into a point in a multi-dimensional space
Chawla and Chandola Anomaly Detection
Introduction Data Mining Methods Density-based anomaly Commute Time Approach Addressing Scalability Anomalies in Complex Data Evaluating Anomaly Detection Methods Applications Problem solutionsPCA and Subspace Method Subspace Method Algorithm Subspace Analysis Results Discussion Typical Characteristics of Anomaly Limitation of Volume Entropy Based versus Volume Based Fraud Detection Epidemeology Anomaly Detection in Climate and Weather Anomalies in Climate Validation of Anomalies
Identifying Anomalies
Traditional anomaly detection (lof) Can be slow but can identify any type of anomalous structure
Faster method to identify specific types of anomalousstructures
Identify relevant feature pairs and power law relationship
Eg Egonet Density Power Law Ni vs Ei - detect nearcliques and stars
Ei prop Nαi 1 le α le 2
Anomaly score for node i wrt a pair of features (y = Cxθ)
Si =max(yi Cx
θi )
min(yi Cxθi )lowast log (|yi minus Cxθi |+ 1)
Chawla and Chandola Anomaly Detection
Introduction Data Mining Methods Density-based anomaly Commute Time Approach Addressing Scalability Anomalies in Complex Data Evaluating Anomaly Detection Methods Applications Problem solutionsPCA and Subspace Method Subspace Method Algorithm Subspace Analysis Results Discussion Typical Characteristics of Anomaly Limitation of Volume Entropy Based versus Volume Based Fraud Detection Epidemeology Anomaly Detection in Climate and Weather Anomalies in Climate Validation of Anomalies
Exploiting Graph Structure - Bipartite Graphs
Represent data as a bipartite graph Healthcare Data (Beneficiaries vs Providers) Insider trading (Traders vs Stocks)
Objective Identify anomalous links
Given a query node a isin V1 find the ldquorelevancerdquoof all other nodes in V1 to a
RelevanceScore(a b) prop Number of times aldquorandom walkrdquo from a reaches b
Use the relevance scores to compute thenormality scores for a node t isin V2
Find set St = a|〈a t〉 isin E Compute |St| times |St| similarity matrix using
relevance vectors for a isin St Normality Score = mean of non-diagonal entries
of similarity matrix
V1 E V2a1
a2
a3
an
t1
t2
t3
tn
Chawla and Chandola Anomaly Detection
Introduction Data Mining Methods Density-based anomaly Commute Time Approach Addressing Scalability Anomalies in Complex Data Evaluating Anomaly Detection Methods Applications Problem solutionsPCA and Subspace Method Subspace Method Algorithm Subspace Analysis Results Discussion Typical Characteristics of Anomaly Limitation of Volume Entropy Based versus Volume Based Fraud Detection Epidemeology Anomaly Detection in Climate and Weather Anomalies in Climate Validation of Anomalies
Detecting Disease Outbreaks
Domain Question Early detection of disease
outbreaks Anthrax attack
Data Emergency department visits Grocery data (Example [14]) Clinical visits Weatherclimate data
Challenges Weak signals in the data
ED cases involving cough rArrFlu or SARS
Integration of multiple signals(lag analysis)
Account for spatial and temporalcorrelations
Chawla and Chandola Anomaly Detection
Introduction Data Mining Methods Density-based anomaly Commute Time Approach Addressing Scalability Anomalies in Complex Data Evaluating Anomaly Detection Methods Applications Problem solutionsPCA and Subspace Method Subspace Method Algorithm Subspace Analysis Results Discussion Typical Characteristics of Anomaly Limitation of Volume Entropy Based versus Volume Based Fraud Detection Epidemeology Anomaly Detection in Climate and Weather Anomalies in Climate Validation of Anomalies
Whatrsquos Significant About Recent Events (WSARE) [33]
1 Learn Bayesian network from historical data Environmental and response variables
2 Sample from the BN (DBbaseline|Current Environment)3 Compute contingency table for rules for DBbaseline andDBcurrent
Rules are single assignment rules (Xi = Y ji ) or conjunctions4 Find p-value for rules using χ2-test
Null Hypothesis Rows and columns of tables for DBbaselineand DBcurrent are independent
5 Find rule with largest p-value Repeat Step 2
Chawla and Chandola Anomaly Detection
Introduction Data Mining Methods Density-based anomaly Commute Time Approach Addressing Scalability Anomalies in Complex Data Evaluating Anomaly Detection Methods Applications Problem solutionsPCA and Subspace Method Subspace Method Algorithm Subspace Analysis Results Discussion Typical Characteristics of Anomaly Limitation of Volume Entropy Based versus Volume Based Fraud Detection Epidemeology Anomaly Detection in Climate and Weather Anomalies in Climate Validation of Anomalies
Incorporating Spatial and Temporal Relationships
WSARE does not explicitly model the spatial and temporalrelationships
What happened yesterday What happened in the adjoining neighborhood (yesterday)
Bayesian Network Spatio-Temporal (BNST) modelingframework [17]
Add nodes for temporal and spatial dependencies Need more data to train
Chawla and Chandola Anomaly Detection
Introduction Data Mining Methods Density-based anomaly Commute Time Approach Addressing Scalability Anomalies in Complex Data Evaluating Anomaly Detection Methods Applications Problem solutionsPCA and Subspace Method Subspace Method Algorithm Subspace Analysis Results Discussion Typical Characteristics of Anomaly Limitation of Volume Entropy Based versus Volume Based Fraud Detection Epidemeology Anomaly Detection in Climate and Weather Anomalies in Climate Validation of Anomalies
Anomaly Detection in Climate and Weather
Science Questions Identify natural and anthropogenic disasters Identify long time scale events - droughts atmospheric rivers
cold fronts etc
Data Ground observations Remote sensing data (satellites
air-borne) Climate model simulation outputs Multiple variables spatio-temporal (often has height dimension
as well)
Challenges Model spatio-temporal relationships across multiple variables Explain the cause of anomalies Massive data sizes
Climate and weather extreme events are well defined
Key challenge is to find significant events and explain the cause
Chawla and Chandola Anomaly Detection
Introduction Data Mining Methods Density-based anomaly Commute Time Approach Addressing Scalability Anomalies in Complex Data Evaluating Anomaly Detection Methods Applications Problem solutionsPCA and Subspace Method Subspace Method Algorithm Subspace Analysis Results Discussion Typical Characteristics of Anomaly Limitation of Volume Entropy Based versus Volume Based Fraud Detection Epidemeology Anomaly Detection in Climate and Weather Anomalies in Climate Validation of Anomalies
Anomalies are Widely Used in Climate
Most analysis done on ldquoanomalyrdquo time series
Difference from a ldquobase periodrdquo (Toosimplistic)
Brings spatial smoothness (eg a mountaintop and nearby valley can have very differenttemperatures) Removes seasonality
Understand climate and weatherphenomenon
Southern Oscillation Index (SOI) Difference between Sea Level Pressure
(SLP) anomalies for Tahiti and DarwinAustralia
Figure Global AverageTemperature Anomaly(1975 - 2007) Srcwwwmetofficegovuk
Chawla and Chandola Anomaly Detection
Introduction Data Mining Methods Density-based anomaly Commute Time Approach Addressing Scalability Anomalies in Complex Data Evaluating Anomaly Detection Methods Applications Problem solutionsPCA and Subspace Method Subspace Method Algorithm Subspace Analysis Results Discussion Typical Characteristics of Anomaly Limitation of Volume Entropy Based versus Volume Based Fraud Detection Epidemeology Anomaly Detection in Climate and Weather Anomalies in Climate Validation of Anomalies
Constructing Anomalies from Raw Data
Anomaly time series for a given location i
vprimei = vi minus bi
where bi is the base (reference)
How to choose bi Mean of all data for location i Monthly mean values (account for seasonality) Monthly z-score values Median (more robust) Using a shorter ldquoreference periodrdquo
30 year moving window
Different methods show statistically significant differences[19] What is the right strategy Weighted mean of different strategies (Pick weights using
Monte Carlo sampling)
Chawla and Chandola Anomaly Detection
Introduction Data Mining Methods Density-based anomaly Commute Time Approach Addressing Scalability Anomalies in Complex Data Evaluating Anomaly Detection Methods Applications Problem solutionsPCA and Subspace Method Subspace Method Algorithm Subspace Analysis Results Discussion Typical Characteristics of Anomaly Limitation of Volume Entropy Based versus Volume Based Fraud Detection Epidemeology Anomaly Detection in Climate and Weather Anomalies in Climate Validation of Anomalies
Anomaly Detection for Identifying Droughts
Science question Identify significant drought patterns usinghistorical observation data or future simulation data or both
Find persistent spatiotemporal anomalies in precipitation data
A two step approach
1 Find precipitationanomalies usingthresholds
2 Find large connectedcomponents across spaceand time
Matlab - bwlabelbwlabeln
Followup Science questionExplain cause
(drought190120061avi)
Figure Video courtsey Dr ArindamBanerjee
Chawla and Chandola Anomaly Detection
Introduction Data Mining Methods Density-based anomaly Commute Time Approach Addressing Scalability Anomalies in Complex Data Evaluating Anomaly Detection Methods Applications Problem solutionsDistance-based anomalies DB(pD) outlier Distance-based methods (DB(kN) Pruning rule Examples of pruning technique Strengths and weaknesses - Distance-based techniques
Distance-based anomalies
Intuition A data point which is far away from its nearestneighbors is a candidate anomaly
Several definitions which capture the above intuition
DB(pD) anomaly [20] an object o in a data set T is aDB(pD) anomaly if at least a fraction p of objects in T havedistances greater than D from o
Generalizes the notion of ldquothree standard deviation from themeanrdquo
This definition had a huge influence on subsequentdevelopment in outlier detection
Chawla and Chandola Anomaly Detection
Introduction Data Mining Methods Density-based anomaly Commute Time Approach Addressing Scalability Anomalies in Complex Data Evaluating Anomaly Detection Methods Applications Problem solutionsDistance-based anomalies DB(pD) outlier Distance-based methods (DB(kN) Pruning rule Examples of pruning technique Strengths and weaknesses - Distance-based techniques
DB(pD) outlier
To build some intuition consider data generated from theNormal distribution N(0 1) Then if O is a DB(pD) outlier
1
(2π)12
int O+D
OminusDeminus
x2
2 dx le 1minus p
Example If O is 3 (3 standard deviations away from themean) then it is a DB(01 0999) outlier
Thus for particular settings of D and p DB(pD) capturesstandard outliers
But much more general (eg any distance metric)
Chawla and Chandola Anomaly Detection
Introduction Data Mining Methods Density-based anomaly Commute Time Approach Addressing Scalability Anomalies in Complex Data Evaluating Anomaly Detection Methods Applications Problem solutionsDistance-based anomalies DB(pD) outlier Distance-based methods (DB(kN) Pruning rule Examples of pruning technique Strengths and weaknesses - Distance-based techniques
Distance-based methods (DB(kN)
DB(kN) anomaly [28] top N data instances whosedistances to its k-th nearest neighbor are largest
Several advantages Ranking for anomalies is more intuitiveSetting of parameters generally easier
A Simple Nested Loop (SNL) algorithm can be used to selectthe top N DB(kN) outliers Time complexity is O(n2d)where n is the database size and d is the dimensionality
Chawla and Chandola Anomaly Detection
Introduction Data Mining Methods Density-based anomaly Commute Time Approach Addressing Scalability Anomalies in Complex Data Evaluating Anomaly Detection Methods Applications Problem solutionsDistance-based anomalies DB(pD) outlier Distance-based methods (DB(kN) Pruning rule Examples of pruning technique Strengths and weaknesses - Distance-based techniques
Pruning rule
DB(kN) anomaly [3] a data instance is not an anomaly ifits distance to its k-th current nearest neighbor is less thanthe score of the weakest anomaly among top N anomaliesfound so far
A large number of non-anomalies can be pruned withoutcarrying out a full data search
Complexity nearly O(n)
Chawla and Chandola Anomaly Detection
Introduction Data Mining Methods Density-based anomaly Commute Time Approach Addressing Scalability Anomalies in Complex Data Evaluating Anomaly Detection Methods Applications Problem solutionsDistance-based anomalies DB(pD) outlier Distance-based methods (DB(kN) Pruning rule Examples of pruning technique Strengths and weaknesses - Distance-based techniques
Examples of pruning technique
Non-anomalies are pruned earlier
Chawla and Chandola Anomaly Detection
Introduction Data Mining Methods Density-based anomaly Commute Time Approach Addressing Scalability Anomalies in Complex Data Evaluating Anomaly Detection Methods Applications Problem solutionsDistance-based anomalies DB(pD) outlier Distance-based methods (DB(kN) Pruning rule Examples of pruning technique Strengths and weaknesses - Distance-based techniques
Strengths and weaknesses - Distance-based techniques
Do not make any assumption about the distribution of thedata
Scalable for large dataset (O(n))
Capable of finding only global anomalies
Can lead to non-intuitive results in Top-k situations
0 10 20 30 40 50 60 700
10
20
30
40
50
60
70
dimension 1
dim
en
sio
n 2
p1
p2
p3
p4
Chawla and Chandola Anomaly Detection
Introduction Data Mining Methods Density-based anomaly Commute Time Approach Addressing Scalability Anomalies in Complex Data Evaluating Anomaly Detection Methods Applications Problem solutionsDensity-based anomaly Strengths and Weaknesses
Density-based anomaly
Calculate the density of an object based on the density of itsk nearest neighbours
density(p) = 1
sum
qisinNk(p)distk(p q)
|Nk(p)|
relative-density(p) =
density(p)1
|Nk(p)|sum
qisinNk(p)density(q)
anomaly-score(p) =1
relative-density(p)
LOF indicates a degree of local outlier-ness [6]
Chawla and Chandola Anomaly Detection
Introduction Data Mining Methods Density-based anomaly Commute Time Approach Addressing Scalability Anomalies in Complex Data Evaluating Anomaly Detection Methods Applications Problem solutionsDensity-based anomaly Strengths and Weaknesses
Strengths and Weaknesses
Can detect global and local anomalies
Cannot use pruning technique and has a complexity of O(n2)
Require a method combining the strengths of distance anddensity based approaches A distance based approach whichcan capture density
C
C
O
O1
1
2
2
Chawla and Chandola Anomaly Detection
Introduction Data Mining Methods Density-based anomaly Commute Time Approach Addressing Scalability Anomalies in Complex Data Evaluating Anomaly Detection Methods Applications Problem solutionsCommute time Computation of commute time Anomaly detection using commute time (CDOF) Fast estimation of commute time Scalability for Density-based method PINN Algorithm (ICDM 2010) PINN Guarantee Examples high-dim distance-based outliers Examples high-dim density-based outliers Examples local density-based outliers
Commute time
Commute time between i and j is the expected number ofsteps that a random walk starting at i will take to reach jonce and go back to i for the first time
Commute time can capture both the distance between pointsand the data densities
Chawla and Chandola Anomaly Detection
Introduction Data Mining Methods Density-based anomaly Commute Time Approach Addressing Scalability Anomalies in Complex Data Evaluating Anomaly Detection Methods Applications Problem solutionsCommute time Computation of commute time Anomaly detection using commute time (CDOF) Fast estimation of commute time Scalability for Density-based method PINN Algorithm (ICDM 2010) PINN Guarantee Examples high-dim distance-based outliers Examples high-dim density-based outliers Examples local density-based outliers
Computation of commute time
Commute time can be computed using graph Laplacian matrixL
cij = VG(ei minus ej)TL+(ei minus ej)L+ pseudo-inverse of LVG graph volumeei i-th column of the identity matrix
Commute time is Euclidean distance in the space spanned byeigenvectors of L
cij = VG[(Sminus12V T )(ei minus ej)]T [(Sminus12V T )(ei minus ej)]
V S eigenvectors and eigenvalues of L
Chawla and Chandola Anomaly Detection
Introduction Data Mining Methods Density-based anomaly Commute Time Approach Addressing Scalability Anomalies in Complex Data Evaluating Anomaly Detection Methods Applications Problem solutionsCommute time Computation of commute time Anomaly detection using commute time (CDOF) Fast estimation of commute time Scalability for Density-based method PINN Algorithm (ICDM 2010) PINN Guarantee Examples high-dim distance-based outliers Examples high-dim density-based outliers Examples local density-based outliers
Anomaly detection using commute time (CDOF)
Construct the mutual k nearest neighbor graph G from thedataset
Compute the Laplacian matrix L of G and its eigensystems
Find top N anomalies using the distance-based technique incommute time with pruning rule
Complexity O(n3)
Commute time method can detect global local and groupanomalies
Chawla and Chandola Anomaly Detection
Introduction Data Mining Methods Density-based anomaly Commute Time Approach Addressing Scalability Anomalies in Complex Data Evaluating Anomaly Detection Methods Applications Problem solutionsCommute time Computation of commute time Anomaly detection using commute time (CDOF) Fast estimation of commute time Scalability for Density-based method PINN Algorithm (ICDM 2010) PINN Guarantee Examples high-dim distance-based outliers Examples high-dim density-based outliers Examples local density-based outliers
Fast estimation of commute time
Speilman and Srivastava [31] combined random projection anda linear time solver to build a structure where we can computethe compute time between two nodes in O(log n) time
Complexity of CDOF O(n3)rarr O(n log n)
Uses a near linear time solver for a linear system of equationAx = b
Spielman and Teng solvers Also see work by Iannis Koutisfrom CMU
Chawla and Chandola Anomaly Detection
Introduction Data Mining Methods Density-based anomaly Commute Time Approach Addressing Scalability Anomalies in Complex Data Evaluating Anomaly Detection Methods Applications Problem solutionsCommute time Computation of commute time Anomaly detection using commute time (CDOF) Fast estimation of commute time Scalability for Density-based method PINN Algorithm (ICDM 2010) PINN Guarantee Examples high-dim distance-based outliers Examples high-dim density-based outliers Examples local density-based outliers
Scalability for Density-based method
The pruning rule for Distance-based methods does not applyto Density-based approaches
We can go from O(n2) to nearly O(n log n) by using an index
One solution for the curse of high dimensionality is to use ofrandom projections
Chawla and Chandola Anomaly Detection
Introduction Data Mining Methods Density-based anomaly Commute Time Approach Addressing Scalability Anomalies in Complex Data Evaluating Anomaly Detection Methods Applications Problem solutionsCommute time Computation of commute time Anomaly detection using commute time (CDOF) Fast estimation of commute time Scalability for Density-based method PINN Algorithm (ICDM 2010) PINN Guarantee Examples high-dim distance-based outliers Examples high-dim density-based outliers Examples local density-based outliers
PINN Algorithm (ICDM 2010)
Chawla and Chandola Anomaly Detection
Introduction Data Mining Methods Density-based anomaly Commute Time Approach Addressing Scalability Anomalies in Complex Data Evaluating Anomaly Detection Methods Applications Problem solutionsCommute time Computation of commute time Anomaly detection using commute time (CDOF) Fast estimation of commute time Scalability for Density-based method PINN Algorithm (ICDM 2010) PINN Guarantee Examples high-dim distance-based outliers Examples high-dim density-based outliers Examples local density-based outliers
PINN Guarantee
The PINN Algorithm provides probabilistic guarantees
Under certain assumptions about intrinsic dimensionality (c)with high probability
1minus ε1 + ε
middot LOF (p) le LOF (p) le 1 + ε
1minus ε middot LOF (p)
In practice we do not know the intrinsic dimensionality ofdata However random projections are quite robust
Chawla and Chandola Anomaly Detection
Introduction Data Mining Methods Density-based anomaly Commute Time Approach Addressing Scalability Anomalies in Complex Data Evaluating Anomaly Detection Methods Applications Problem solutionsCommute time Computation of commute time Anomaly detection using commute time (CDOF) Fast estimation of commute time Scalability for Density-based method PINN Algorithm (ICDM 2010) PINN Guarantee Examples high-dim distance-based outliers Examples high-dim density-based outliers Examples local density-based outliers
Examples high-dim distance-based outliers
On a large database of images the bright images show up asdistance based outliers
Chawla and Chandola Anomaly Detection
Introduction Data Mining Methods Density-based anomaly Commute Time Approach Addressing Scalability Anomalies in Complex Data Evaluating Anomaly Detection Methods Applications Problem solutionsCommute time Computation of commute time Anomaly detection using commute time (CDOF) Fast estimation of commute time Scalability for Density-based method PINN Algorithm (ICDM 2010) PINN Guarantee Examples high-dim distance-based outliers Examples high-dim density-based outliers Examples local density-based outliers
Examples high-dim density-based outliers
On a large database of images occluded images show up asdensity based outliers
Chawla and Chandola Anomaly Detection
Introduction Data Mining Methods Density-based anomaly Commute Time Approach Addressing Scalability Anomalies in Complex Data Evaluating Anomaly Detection Methods Applications Problem solutionsCommute time Computation of commute time Anomaly detection using commute time (CDOF) Fast estimation of commute time Scalability for Density-based method PINN Algorithm (ICDM 2010) PINN Guarantee Examples high-dim distance-based outliers Examples high-dim density-based outliers Examples local density-based outliers
Examples local density-based outliers
Examples of images ranked by LOF
Chawla and Chandola Anomaly Detection
Introduction Data Mining Methods Density-based anomaly Commute Time Approach Addressing Scalability Anomalies in Complex Data Evaluating Anomaly Detection Methods Applications Problem solutions
Addressing Scalability
Chawla and Chandola Anomaly Detection
Introduction Data Mining Methods Density-based anomaly Commute Time Approach Addressing Scalability Anomalies in Complex Data Evaluating Anomaly Detection Methods Applications Problem solutions
Using GPUs for Anomaly Detection
Well suited for data parallel algorithms Using CUDA - Compute Unified Device
Architecture (Nvidia)
Need to re-engineer existing algorithms Utilization of device memory Minimize CPUhArrGPU transfer of data Keep threads homogeneous
Most model based algorithms arenaturally setup for the testing phase
Model building needs careful redesign
What about unsupervised algorithms
Kernel
Host
Grid
Device
Block(00)
Block(01)
Block(02)
Block(10)
Block(11)
Block(12)
Thread Block
Thread(00)
Thread(01)
Thread(02)
Thread(03)
Thread(10)
Thread(11)
Thread(12)
Thread(13)
Thread(20)
Thread(21)
Thread(22)
Thread(23)
Host Host Memory
SM 2
SM 1
SM 0
Registers Registers Registers
SP 0 SP 1 SP 7
Shared Memory
Global Memory
Texture Memory
Constant Memory
Device
Chawla and Chandola Anomaly Detection
Introduction Data Mining Methods Density-based anomaly Commute Time Approach Addressing Scalability Anomalies in Complex Data Evaluating Anomaly Detection Methods Applications Problem solutions
Implementing DB(kN) on GPUs
Return top N data instances whose distances tok-th nearest neighbor are largest (SerialDB(kN) is O(n2))
Involves computing pairwise distances
Load block i and block j to shared memory Data layout in memory should be optimized
Each thread computes distance between a pairof instances
Can utilize this time to load next chunk of datafrom host to device memory
Writes results to corresponding output block
Sorting can be done efficiently in CUDA [29]
d
n
T
n
n
Chawla and Chandola Anomaly Detection
Introduction Data Mining Methods Density-based anomaly Commute Time Approach Addressing Scalability Anomalies in Complex Data Evaluating Anomaly Detection Methods Applications Problem solutionsCategorical Data Discrete Sequences and Time Series Contextual Anomalies Collective Anomalies
Moving Beyond Multi-dimensional Record Data
Categorical (Mixed)
Fraud Detection
Cyber Networks
Time Series
Sensor Networks
Healthcare
Discrete Sequences
Genomic
System Calls
Spatial
GIS
Image analysis
Spatio-temporal
Remote sensing
Climate
Graphs
Social networks
Epidemiology
Chawla and Chandola Anomaly Detection
Introduction Data Mining Methods Density-based anomaly Commute Time Approach Addressing Scalability Anomalies in Complex Data Evaluating Anomaly Detection Methods Applications Problem solutionsCategorical Data Discrete Sequences and Time Series Contextual Anomalies Collective Anomalies
Handling Categorical Data
Each attribute can belong to one of many categories
No ordering between categories
Mixed data (categorical and continuous attributes)
cap-shape cap-surface middot middot middot habitat type
convex smooth urban poisonousconvex smooth grasses ediblebell smooth meadows edibleconvex scaly urban poisonousconvex smooth grasses ediblemiddot middot middot
Table Mushroom Data Set [2]
Chawla and Chandola Anomaly Detection
Introduction Data Mining Methods Density-based anomaly Commute Time Approach Addressing Scalability Anomalies in Complex Data Evaluating Anomaly Detection Methods Applications Problem solutionsCategorical Data Discrete Sequences and Time Series Contextual Anomalies Collective Anomalies
Approaches to Identify Categorical Anomalies
Using Association Analysis [24]
Binarize data
Learn rules (X rArr Y ) Choose high confidence
rules (P (Y |X))
For test record Z = 〈XY 〉find rules of the formP (Y |X)
Y is not observed whenX is observed
Using Bayesian Networks [33]
Learn Bayesian networkstructure and parameters
Compute P (Z) for test datarecord Z
Flag anomaly if P (Z) lt δ
Using Similarity Metrics [10]
Use a similarity measure (S(X1 X2))
Apply distancedensityclustering based method (eg lof)
Chawla and Chandola Anomaly Detection
Introduction Data Mining Methods Density-based anomaly Commute Time Approach Addressing Scalability Anomalies in Complex Data Evaluating Anomaly Detection Methods Applications Problem solutionsCategorical Data Discrete Sequences and Time Series Contextual Anomalies Collective Anomalies
Conditional Probability Test [18]
Identify unusual combinations of attribute values
r(at bt) =P (at bt)
P (at)P (bt)
A capB = φ Assumption If r(at bt) is low and is observed in test record t
then t is anomalous For a test record t
For each mutually exclusive pair of attribute sets ABcompute r(at bt)
Score t based on all r-values Assign minimum r-value as score Take product of all r-values
Need to compare exponential pairs of subsets Only consider subsets upto size k Ignore subsets with frequency less than a threshold α Avoid comparing independent subsets of attributes
micro(AB) ge βmicroChawla and Chandola Anomaly Detection
Introduction Data Mining Methods Density-based anomaly Commute Time Approach Addressing Scalability Anomalies in Complex Data Evaluating Anomaly Detection Methods Applications Problem solutionsCategorical Data Discrete Sequences and Time Series Contextual Anomalies Collective Anomalies
Estimating Probabilities for CPT [18]
Maximum LikelihoodEstimation
P (at bt)
P (at)P (bt)=C(at bt)
Ntimes N
C(at)times N
C(bt)
C(at) Number of traininginstances with A = at
N Total number of traininginstances
Laplace Smoothing
E(p) =C(p) + 1
N + 2
r(at bt) =E(at bt)
E(at)times E(bt)
Speedup Tricks
Replace rare attributevalues with genericattribute (reduce arity)
Use efficient datastructure to querying forcounts(AD Trees [26])
ADTrees work fasterfor low arity attributes
Chawla and Chandola Anomaly Detection
Introduction Data Mining Methods Density-based anomaly Commute Time Approach Addressing Scalability Anomalies in Complex Data Evaluating Anomaly Detection Methods Applications Problem solutionsCategorical Data Discrete Sequences and Time Series Contextual Anomalies Collective Anomalies
Finding Anomalies in Discrete Sequences
Many problem formulations
1 Anomalous symbols in asequence
2 Anomalous subsequence in asequence
3 Anomalous sequence in adatabase of sequences
See [11] for a comparativeevaluation [9] for a survey
login pwdmail ssh mail web logoutlogin pwdmail web web web web logoutlogin pwdmail ssh mail web web logoutlogin pwdwebmail ssh webmail logoutloginpwd loginpwd loginpwd logout
Chawla and Chandola Anomaly Detection
Introduction Data Mining Methods Density-based anomaly Commute Time Approach Addressing Scalability Anomalies in Complex Data Evaluating Anomaly Detection Methods Applications Problem solutionsCategorical Data Discrete Sequences and Time Series Contextual Anomalies Collective Anomalies
Treating Sequences as Points
Utilize a distancesimilarity measure Plug into a distancedensityclustering based method
Simplest Hamming Distance
h(Ai Bi) = 1 Ai 6= Bi= 0 Ai = Bi
H(AB) =nsumi=1
h(Ai Bi)
Issues Unequal lengths misalignment Normalized Length of Longest Common Subsequence
D(AB) = 1minus |LCS(AB)|radic|A||B|
Standard Dynamic Programming method is slow Faster versions available (Hunt Szymnaski method [7])
Weaknesses Cannot localize anomalies within a sequence Weak anomaly signals might get lost
Chawla and Chandola Anomaly Detection
Introduction Data Mining Methods Density-based anomaly Commute Time Approach Addressing Scalability Anomalies in Complex Data Evaluating Anomaly Detection Methods Applications Problem solutionsCategorical Data Discrete Sequences and Time Series Contextual Anomalies Collective Anomalies
Using Sliding Windows
Slide a window of size k
Extract all windows from a sequence (nminus k + 1)
Training (Creating a normal dictionary) Store all uniquewindows in all normal sequences and their counts
Testing For each window find the frequency in normal dictionary Anomaly score is inverse of the aggregate frequencies for all
windows (normalized by length)
Many variants exist For each window find the hamming distance to the closest
window in the normal dictionary [16]
Issues Penalizes low frequency windows in the normal dictionary Rewards high frequency windows that might not be relevant Can construct anomalous sequences that will escape detection
Chawla and Chandola Anomaly Detection
Introduction Data Mining Methods Density-based anomaly Commute Time Approach Addressing Scalability Anomalies in Complex Data Evaluating Anomaly Detection Methods Applications Problem solutionsCategorical Data Discrete Sequences and Time Series Contextual Anomalies Collective Anomalies
Using Probabilistic Models
Probability of occurrence of sequence S
P (S) =nprodi=1
P (Si|S1 Siminus1)
Short memory property of sequences
P (Si|S1 Siminus1) = P (Si|Siminusk Siminus1)
Conditional probability estimates for a symbol Si
P (Si|Siminusk Siminus1) =f(Si|Siminusk Si)f(Si|Siminusk Siminus1)
f is estimated from the normal dictionary
Anomaly score for a test sequence is inverse of the normalizedprobability of occurrence
Issues What if the suffix occurs very infrequently in thenormal data (or not at all)
Replace with the longest suffix that occurs sufficient number oftimes [32] - Probabilistic Suffix Trees
Significantly reduces the size of the modelChawla and Chandola Anomaly Detection
Introduction Data Mining Methods Density-based anomaly Commute Time Approach Addressing Scalability Anomalies in Complex Data Evaluating Anomaly Detection Methods Applications Problem solutionsCategorical Data Discrete Sequences and Time Series Contextual Anomalies Collective Anomalies
Finding Contextual Anomalies
Sometimes contextual information isavailable about data
Not used directly as a feature Are well understood no anomalies in
the context Can reduce false positives and yield
interesting anomalies
Example adapted from [30]
Clearest Outlier
Conditional Anomaly
Maximum Daily Temperature
Number
ofFever
Cases
Contextual anomalies - Anomalous with respect to a context Context is defined using environmental variables
Spatial (Latitude Longitude) Graph context (Edges Weights) Temporal location Domain specific (Demographic other)
How to incorporate context Reduce to traditional anomaly detection (subset on context) Explicitly model contextual information (time series spatial)
Chawla and Chandola Anomaly Detection
Introduction Data Mining Methods Density-based anomaly Commute Time Approach Addressing Scalability Anomalies in Complex Data Evaluating Anomaly Detection Methods Applications Problem solutionsCategorical Data Discrete Sequences and Time Series Contextual Anomalies Collective Anomalies
Conditional Anomaly Detection
Data instance d rArru1 u2 udU v1 v2 vdV
dU environmentalattributes
dV indicator attributes u1
u2
U1
U2
U3
v1
v2
V1V2
V3
p(V1|U3) = 02
p(V2|U3) = 02
p(V3|U3) = 06
Algorithm [30]
1 Learn a Gaussian Mixture Model (GMM)U = U1 U2 UnU
each with dimensionality dU2 Learn a set of Gaussians U = V1 V2 VnV
each withdimensionality dV
3 Learn a probabilistic mapping function p(Vj |Ui)4 Score a test instance d = [uv]
S =
nUsumi=1
p(u|Ui)nVsumj=1
p(v|Vj)p(Vj |Ui)
Chawla and Chandola Anomaly Detection
Introduction Data Mining Methods Density-based anomaly Commute Time Approach Addressing Scalability Anomalies in Complex Data Evaluating Anomaly Detection Methods Applications Problem solutionsCategorical Data Discrete Sequences and Time Series Contextual Anomalies Collective Anomalies
Finding Collective Anomalies
Find a collection of data points
Each point by itself is normal
The collection as a whole isanomalous
Relevant when data has inherentstructure and
When domain definition ofanomalies cannot be described aspoint anomalies
A Simple Solution
1 Break data intogroups
2 Compute features foreach group
3 Apply traditionalanomaly detection
Examples
1 Time series
2 Image
3 Spatial clusters ofgalaxies
Chawla and Chandola Anomaly Detection
Introduction Data Mining Methods Density-based anomaly Commute Time Approach Addressing Scalability Anomalies in Complex Data Evaluating Anomaly Detection Methods Applications Problem solutionsCategorical Data Discrete Sequences and Time Series Contextual Anomalies Collective Anomalies
Using Latent Dirichlet Allocation for Group Anomalies
Find anomalous groups in data [34]
Example Spatial clusters of galaxies topics red green emissive words continuous features
Flexible Genre Model (FGM)
For each group
1 Draw a genre 1 2 T 3 ym simM(π)2 Draw topic distribution forym SK 3 θm sim Dir(αym)
3 Draw K topicsβmk sim P (βmk|ηk)k=12K
4 For each point in group
1 Draw topic membershipzmn simM(θn)
2 Generate pointxmn isin P (xmn|βmzmn)
α
zmn
xmn
N
θm
T
π
ηK
ym
β
MK
Model Parameters
M(π) -Multinomial
Genre - Dir(αt)
Topic generatorsP (|ηk)- GIW
Point generatorsP (xmn|βnk) -MultivariateGaussian
Chawla and Chandola Anomaly Detection
Introduction Data Mining Methods Density-based anomaly Commute Time Approach Addressing Scalability Anomalies in Complex Data Evaluating Anomaly Detection Methods Applications Problem solutionsCategorical Data Discrete Sequences and Time Series Contextual Anomalies Collective Anomalies
Inference and Testing for FGM
Inference and Learning Parameters
Approximate inference of latentvariables (Gibbs Sampling)
Use samples to learn parameters(Single step Monte Carlo EM)
Topic 1
Topic 2
Topic 3
Anomaly Detection
Infer the topic distribution θm
Compute negative log likelihood wrt αt
Rationale An anomalous group will be unlikely to begenerated from any genre
Geometric interpretation Mapping each group into a Tdimensional space and finding anomalies
Chawla and Chandola Anomaly Detection
Introduction Data Mining Methods Density-based anomaly Commute Time Approach Addressing Scalability Anomalies in Complex Data Evaluating Anomaly Detection Methods Applications Problem solutions
Evaluating Anomaly Detection Methods - Labels
Labeled validation data set exists Confusion matrix Traditional evaluation metrics
Class imbalance
ROC Curve
Validation set does not exist Use domain expertise to find TP
and FP FN is harder to estimate
Pseudo false negativeestimation techniques [25]
Predicteda n
Actuala TP FNn FP TN
Acc =TP + TNsum
Rec (R) =TP
TP + FN
Prec (P ) =TP
TP + FP
F =2 lowastR lowast PR+ P
Chawla and Chandola Anomaly Detection
Introduction Data Mining Methods Density-based anomaly Commute Time Approach Addressing Scalability Anomalies in Complex Data Evaluating Anomaly Detection Methods Applications Problem solutions
Evaluating Anomaly Detection Methods - Scores
Convert to binary output Use threshold δ on score (Scale
issues [21]) Take top x as anomalies
ROC curve by varying x or δ
Quality of output Does the output ldquosuggestrdquo x or δ Which output is better
Chawla and Chandola Anomaly Detection
Introduction Data Mining Methods Density-based anomaly Commute Time Approach Addressing Scalability Anomalies in Complex Data Evaluating Anomaly Detection Methods Applications Problem solutions
Unifying Scores
Different methods assign scores in differentranges
kNN-based scores [0 1] Lof scores [1 6] ABOD scores [0 80000]
Anomalies have lower scores
Direct scaling to [0 1] might lose distinctionbetween normal and anomalies
Desired scaling Stretch interesting rangesand shrink irrelevant ones
Generalized Procedure for Normalizing Outlier Scores [21] Regularity rArr S(o) ge 0forallo S(o) asymp 0 if o is normal andS(o) 0 if o is anomalous
Normality S is regular and S(o) isin [0 1]forallo
Chawla and Chandola Anomaly Detection
Introduction Data Mining Methods Density-based anomaly Commute Time Approach Addressing Scalability Anomalies in Complex Data Evaluating Anomaly Detection Methods Applications Problem solutions
Regularization and Normalization of Scores
Regularization
1 R(o) = max0 S(o)minus baseS2 R(o) = Smax minus S(o)
3 R(o) = minus log SmaxS(o)
Normalization
1 N(o) = S(o)Smax
2 N(o) = max(
0 erf(S(o)minusmicroSσS radic2
))(Gaussian Scaling)
Suited for high dimensional data
3 N(o) = max(
0cdfγS (o)minusmicroγ
1minusmicroγ
)(Gamma Scaling)
Where cdfγS (o) = P (k S(o) θ) P is the regularized Gamma function Suited for low dimensional data
Chawla and Chandola Anomaly Detection
Introduction Data Mining Methods Density-based anomaly Commute Time Approach Addressing Scalability Anomalies in Complex Data Evaluating Anomaly Detection Methods Applications Problem solutions
Generating Labeled Data for Validation
Generating Both Normal and Anomalous Data
Use generative models for normal and anomalous behavior
Several generators available Multivariate continuous data [27] Multivariate categorical data [5] Discrete sequences using HMM [12]
Drawbacks Might not capture the domain characteristics
Injecting Anomalies - Random Perturbation[30]
Given data point z = xy x and y arepartitions of feature space
Take a random sample D of the entire data set
Let zprime = xprimeyprime isin D such that distancebetween y and yprime is maximum
Replace x with xprime and add z back to data setx
yz
zprime
Injected anomaly
Chawla and Chandola Anomaly Detection
Introduction Data Mining Methods Density-based anomaly Commute Time Approach Addressing Scalability Anomalies in Complex Data Evaluating Anomaly Detection Methods Applications Problem solutionsWhat is Network Anomaly Detection Motivation How Much Serious
Applications Overview
How to set up an anomaly detection solution for agiven application domain
Available data Define anomalies define normal behavior Identify requirements and constraints (online
real-time limited resources) What domain knowledge available
Feature identification Defining normal and anomalous behavior Tuning parameters
Available ground truth (training validation)
Chawla and Chandola Anomaly Detection
Introduction Data Mining Methods Density-based anomaly Commute Time Approach Addressing Scalability Anomalies in Complex Data Evaluating Anomaly Detection Methods Applications Problem solutionsWhat is Network Anomaly Detection Motivation How Much Serious
What is Network Anomaly Detection
Anomaly Detection or Intrusion Detection
Traditional Intrusion Detection Systems (IDS) finding attackscorresponding to predefined pattern data set known as signaturestherefore system is absolutely vulnerable against zero-day attacks
Network Anomaly Detection Systems (NADS) to detectzero-day attacks without any pre-identified signature besides profilenormal behavior of the network and address suspected incidents
Network Anomaly Detection finding unusual and largechanges in the network traffic
Examples intentional attacks (eg Distributed Denial ofService - DDoS) or unusual network traffic (eg flash crowds)
Chawla and Chandola Anomaly Detection
Introduction Data Mining Methods Density-based anomaly Commute Time Approach Addressing Scalability Anomalies in Complex Data Evaluating Anomaly Detection Methods Applications Problem solutionsWhat is Network Anomaly Detection Motivation How Much Serious
Motivation How Much Serious
According to Symantec report released in early 2011 morethan 286 million new threats have been detected in 2010which is a huge number
1656227
2704836
1000000
1500000
2000000
2500000
3000000
20547 18827 69107 113025 140690
624267
1656227
2704836
0
500000
1000000
1500000
2000000
2500000
3000000
2002 2003 2004 2005 2006 2007 2008 July2009-June2010
Chawla and Chandola Anomaly Detection
Introduction Data Mining Methods Density-based anomaly Commute Time Approach Addressing Scalability Anomalies in Complex Data Evaluating Anomaly Detection Methods Applications Problem solutionsNetwork Topology Network Anomalies Detection Problem Network Anomalies Detection Problem Why care about OD Flows
Network Topology
A Typical network
1 y
Router
2
3
41t
x2t
x1t
x3t
x4t
Origin-Destination (OD) flow is the traffic that enters at anorigin node and exits at a destination node of a backbonenetwork x1t x1t
Link measurement is the traffic enters at an node during aninterval y1t
Relationship between link traffic and OD flow traffic iscaptured by the routing matrix A
Chawla and Chandola Anomaly Detection
Introduction Data Mining Methods Density-based anomaly Commute Time Approach Addressing Scalability Anomalies in Complex Data Evaluating Anomaly Detection Methods Applications Problem solutionsNetwork Topology Network Anomalies Detection Problem Network Anomalies Detection Problem Why care about OD Flows
Network Anomalies Detection Problem
Chawla and Chandola Anomaly Detection
Introduction Data Mining Methods Density-based anomaly Commute Time Approach Addressing Scalability Anomalies in Complex Data Evaluating Anomaly Detection Methods Applications Problem solutionsNetwork Topology Network Anomalies Detection Problem Network Anomalies Detection Problem Why care about OD Flows
Network Anomalies Detection Problem
Chawla and Chandola Anomaly Detection
Introduction Data Mining Methods Density-based anomaly Commute Time Approach Addressing Scalability Anomalies in Complex Data Evaluating Anomaly Detection Methods Applications Problem solutionsNetwork Topology Network Anomalies Detection Problem Network Anomalies Detection Problem Why care about OD Flows
Why care about OD Flows
Volume anomaly typically arises on an OD flow (trafficarriving at one node and destined for another node)
If we only monitor traffic on network links volume arisingfrom an OD flow may not be noticeable Thus naiveapproach wont work if OD flow info is not available
Figure source [22]
Chawla and Chandola Anomaly Detection
Introduction Data Mining Methods Density-based anomaly Commute Time Approach Addressing Scalability Anomalies in Complex Data Evaluating Anomaly Detection Methods Applications Problem solutionsPCA and Subspace Method Subspace Method Algorithm Subspace Analysis Results Discussion Typical Characteristics of Anomaly Limitation of Volume Entropy Based versus Volume Based Fraud Detection Epidemeology Anomaly Detection in Climate and Weather Anomalies in Climate Validation of Anomalies
PCA and Subspace Method
Chawla and Chandola Anomaly Detection
Introduction Data Mining Methods Density-based anomaly Commute Time Approach Addressing Scalability Anomalies in Complex Data Evaluating Anomaly Detection Methods Applications Problem solutionsPCA and Subspace Method Subspace Method Algorithm Subspace Analysis Results Discussion Typical Characteristics of Anomaly Limitation of Volume Entropy Based versus Volume Based Fraud Detection Epidemeology Anomaly Detection in Climate and Weather Anomalies in Climate Validation of Anomalies
Subspace Method Algorithm
Step1- Determine the PCs based on eigenvaluedecomposition of the covariance matrix of the dataset
Step2- Choose first top k principle components with thehighest eigenvalues as matrix P
Step3-normal traffic subspace called Z
Z = PP TZ = CZ
Step4-abnormal traffic subspace called Z
Z = (I minus PP T )Z = CZ
Step5-If the norm of a vector is large then it is an rdquoanomalyrdquo
Chawla and Chandola Anomaly Detection
Introduction Data Mining Methods Density-based anomaly Commute Time Approach Addressing Scalability Anomalies in Complex Data Evaluating Anomaly Detection Methods Applications Problem solutionsPCA and Subspace Method Subspace Method Algorithm Subspace Analysis Results Discussion Typical Characteristics of Anomaly Limitation of Volume Entropy Based versus Volume Based Fraud Detection Epidemeology Anomaly Detection in Climate and Weather Anomalies in Climate Validation of Anomalies
Subspace Analysis Results
Note that during anomaly normal component does not changethat much while residual component changes quite a lot
Thus anomalies can be detected by setting some threshold
Figure source [22]
Chawla and Chandola Anomaly Detection
Introduction Data Mining Methods Density-based anomaly Commute Time Approach Addressing Scalability Anomalies in Complex Data Evaluating Anomaly Detection Methods Applications Problem solutionsPCA and Subspace Method Subspace Method Algorithm Subspace Analysis Results Discussion Typical Characteristics of Anomaly Limitation of Volume Entropy Based versus Volume Based Fraud Detection Epidemeology Anomaly Detection in Climate and Weather Anomalies in Climate Validation of Anomalies
Discussion Typical Characteristics of Anomaly
Most Anomalies induce a change in distributionalaspects of packet header fields (called features)
Most important features include 5-tuple Source ampdestination IP addresses Source and destination portnumbers and IP protocol
raquo DOS attack ndash multiple source IP address concentrated on asingle destination IP address
raquo Network scan ndash dispersed distribution of destination addresses
raquo Most wormsviruses also induce some change in distribution ofcertain features
raquo However these changes can be very subtle and mining them islike searching for needles in a haystack
Unlike many previous approach this paper aims todetect events which disturb the distribution of trafficfeatures rather than traffic volume
Chawla and Chandola Anomaly Detection
Introduction Data Mining Methods Density-based anomaly Commute Time Approach Addressing Scalability Anomalies in Complex Data Evaluating Anomaly Detection Methods Applications Problem solutionsPCA and Subspace Method Subspace Method Algorithm Subspace Analysis Results Discussion Typical Characteristics of Anomaly Limitation of Volume Entropy Based versus Volume Based Fraud Detection Epidemeology Anomaly Detection in Climate and Weather Anomalies in Climate Validation of Anomalies
Limitation of Volume
Figure source [22]
Port scan anomaly (traffic feature changes however traffic volume
remains more or less the same)
We can use entropy tocapture the variationsin the traffic feature
bullTakes value 0 when distribution is maximally concentratedbullTakes value log2N when distribution is maximally dispersed
But stands out in
feature entropy
which also reveals
its structure
Port scan
dwarfed
in volume
metricshellip
Chawla and Chandola Anomaly Detection
Introduction Data Mining Methods Density-based anomaly Commute Time Approach Addressing Scalability Anomalies in Complex Data Evaluating Anomaly Detection Methods Applications Problem solutionsPCA and Subspace Method Subspace Method Algorithm Subspace Analysis Results Discussion Typical Characteristics of Anomaly Limitation of Volume Entropy Based versus Volume Based Fraud Detection Epidemeology Anomaly Detection in Climate and Weather Anomalies in Climate Validation of Anomalies
Entropy Based versus Volume Based
DoSDDoS Attacks- a spike in traffic data toward adominant destination IP
Scan anomaly-a spike in traffic data from a dominant sourceIP
Flash Crowd anomaly- again a spike in traffic data to adominant destination IP
Worm anomaly-a Spike in traffic with a dominant port
Chawla and Chandola Anomaly Detection
Introduction Data Mining Methods Density-based anomaly Commute Time Approach Addressing Scalability Anomalies in Complex Data Evaluating Anomaly Detection Methods Applications Problem solutionsPCA and Subspace Method Subspace Method Algorithm Subspace Analysis Results Discussion Typical Characteristics of Anomaly Limitation of Volume Entropy Based versus Volume Based Fraud Detection Epidemeology Anomaly Detection in Climate and Weather Anomalies in Climate Validation of Anomalies
Fraud Detection
Domain Question Identifyfraudulent activities or players fromobserved transaction data
Data Transactions between different
players in the system Meta information about the
individuals An underlying graph structure
Challenges Track and model human behavior Anomalies caused by adaptive
human adversaries Massive data sizes
Insurance (autohealtha)
ClaimantProvider Payer
Telecommunications Customer
Provider
Credit Cards Customer
Supplier Bank
Web Advertising User Advertiser
Publisher
ahttpwwwcheatingculturecompast-cases-of-medicare-fraud
Chawla and Chandola Anomaly Detection
Introduction Data Mining Methods Density-based anomaly Commute Time Approach Addressing Scalability Anomalies in Complex Data Evaluating Anomaly Detection Methods Applications Problem solutionsPCA and Subspace Method Subspace Method Algorithm Subspace Analysis Results Discussion Typical Characteristics of Anomaly Limitation of Volume Entropy Based versus Volume Based Fraud Detection Epidemeology Anomaly Detection in Climate and Weather Anomalies in Climate Validation of Anomalies
A Generic Fraud Detection Method
Activity Monitoring [13]1 Build profiles for individuals (customers users etc) based on
historic data User X makes n calls on an average in January
2 Compare current behavior with historical profile for significantdeviations
Clustering based [4]1 Cluster historical profiles of customers2 Identify small clusters or outlying profiles as anomalies
Strengths Anomaly detection is fast (good for real time) Results are easy to explain
Weaknesses Need to create and maintain a large number of profiles Not dynamic Adequate historical data might not be available Too many false positives
Chawla and Chandola Anomaly Detection
Introduction Data Mining Methods Density-based anomaly Commute Time Approach Addressing Scalability Anomalies in Complex Data Evaluating Anomaly Detection Methods Applications Problem solutionsPCA and Subspace Method Subspace Method Algorithm Subspace Analysis Results Discussion Typical Characteristics of Anomaly Limitation of Volume Entropy Based versus Volume Based Fraud Detection Epidemeology Anomaly Detection in Climate and Weather Anomalies in Climate Validation of Anomalies
Exploiting Graph Structure - Weighted Graphs
Represent data as a weighted graph Communication networks (phone email SMS) Provider referral networks
Objective Identify anomalous nodes
For each node extract several features based on the propertiesof the induced sub-graph (egonet) of neighboring nodes [1]
Choose features that can highlight anomalous nodes
1 Ni degree of node2 Ei number of edges in egonet3 Wi total weight of egonet4 λi principal eigen vector of weighted adjacency matrix of
egonet
Data is transformed into a point in a multi-dimensional space
Chawla and Chandola Anomaly Detection
Introduction Data Mining Methods Density-based anomaly Commute Time Approach Addressing Scalability Anomalies in Complex Data Evaluating Anomaly Detection Methods Applications Problem solutionsPCA and Subspace Method Subspace Method Algorithm Subspace Analysis Results Discussion Typical Characteristics of Anomaly Limitation of Volume Entropy Based versus Volume Based Fraud Detection Epidemeology Anomaly Detection in Climate and Weather Anomalies in Climate Validation of Anomalies
Identifying Anomalies
Traditional anomaly detection (lof) Can be slow but can identify any type of anomalous structure
Faster method to identify specific types of anomalousstructures
Identify relevant feature pairs and power law relationship
Eg Egonet Density Power Law Ni vs Ei - detect nearcliques and stars
Ei prop Nαi 1 le α le 2
Anomaly score for node i wrt a pair of features (y = Cxθ)
Si =max(yi Cx
θi )
min(yi Cxθi )lowast log (|yi minus Cxθi |+ 1)
Chawla and Chandola Anomaly Detection
Introduction Data Mining Methods Density-based anomaly Commute Time Approach Addressing Scalability Anomalies in Complex Data Evaluating Anomaly Detection Methods Applications Problem solutionsPCA and Subspace Method Subspace Method Algorithm Subspace Analysis Results Discussion Typical Characteristics of Anomaly Limitation of Volume Entropy Based versus Volume Based Fraud Detection Epidemeology Anomaly Detection in Climate and Weather Anomalies in Climate Validation of Anomalies
Exploiting Graph Structure - Bipartite Graphs
Represent data as a bipartite graph Healthcare Data (Beneficiaries vs Providers) Insider trading (Traders vs Stocks)
Objective Identify anomalous links
Given a query node a isin V1 find the ldquorelevancerdquoof all other nodes in V1 to a
RelevanceScore(a b) prop Number of times aldquorandom walkrdquo from a reaches b
Use the relevance scores to compute thenormality scores for a node t isin V2
Find set St = a|〈a t〉 isin E Compute |St| times |St| similarity matrix using
relevance vectors for a isin St Normality Score = mean of non-diagonal entries
of similarity matrix
V1 E V2a1
a2
a3
an
t1
t2
t3
tn
Chawla and Chandola Anomaly Detection
Introduction Data Mining Methods Density-based anomaly Commute Time Approach Addressing Scalability Anomalies in Complex Data Evaluating Anomaly Detection Methods Applications Problem solutionsPCA and Subspace Method Subspace Method Algorithm Subspace Analysis Results Discussion Typical Characteristics of Anomaly Limitation of Volume Entropy Based versus Volume Based Fraud Detection Epidemeology Anomaly Detection in Climate and Weather Anomalies in Climate Validation of Anomalies
Detecting Disease Outbreaks
Domain Question Early detection of disease
outbreaks Anthrax attack
Data Emergency department visits Grocery data (Example [14]) Clinical visits Weatherclimate data
Challenges Weak signals in the data
ED cases involving cough rArrFlu or SARS
Integration of multiple signals(lag analysis)
Account for spatial and temporalcorrelations
Chawla and Chandola Anomaly Detection
Introduction Data Mining Methods Density-based anomaly Commute Time Approach Addressing Scalability Anomalies in Complex Data Evaluating Anomaly Detection Methods Applications Problem solutionsPCA and Subspace Method Subspace Method Algorithm Subspace Analysis Results Discussion Typical Characteristics of Anomaly Limitation of Volume Entropy Based versus Volume Based Fraud Detection Epidemeology Anomaly Detection in Climate and Weather Anomalies in Climate Validation of Anomalies
Whatrsquos Significant About Recent Events (WSARE) [33]
1 Learn Bayesian network from historical data Environmental and response variables
2 Sample from the BN (DBbaseline|Current Environment)3 Compute contingency table for rules for DBbaseline andDBcurrent
Rules are single assignment rules (Xi = Y ji ) or conjunctions4 Find p-value for rules using χ2-test
Null Hypothesis Rows and columns of tables for DBbaselineand DBcurrent are independent
5 Find rule with largest p-value Repeat Step 2
Chawla and Chandola Anomaly Detection
Introduction Data Mining Methods Density-based anomaly Commute Time Approach Addressing Scalability Anomalies in Complex Data Evaluating Anomaly Detection Methods Applications Problem solutionsPCA and Subspace Method Subspace Method Algorithm Subspace Analysis Results Discussion Typical Characteristics of Anomaly Limitation of Volume Entropy Based versus Volume Based Fraud Detection Epidemeology Anomaly Detection in Climate and Weather Anomalies in Climate Validation of Anomalies
Incorporating Spatial and Temporal Relationships
WSARE does not explicitly model the spatial and temporalrelationships
What happened yesterday What happened in the adjoining neighborhood (yesterday)
Bayesian Network Spatio-Temporal (BNST) modelingframework [17]
Add nodes for temporal and spatial dependencies Need more data to train
Chawla and Chandola Anomaly Detection
Introduction Data Mining Methods Density-based anomaly Commute Time Approach Addressing Scalability Anomalies in Complex Data Evaluating Anomaly Detection Methods Applications Problem solutionsPCA and Subspace Method Subspace Method Algorithm Subspace Analysis Results Discussion Typical Characteristics of Anomaly Limitation of Volume Entropy Based versus Volume Based Fraud Detection Epidemeology Anomaly Detection in Climate and Weather Anomalies in Climate Validation of Anomalies
Anomaly Detection in Climate and Weather
Science Questions Identify natural and anthropogenic disasters Identify long time scale events - droughts atmospheric rivers
cold fronts etc
Data Ground observations Remote sensing data (satellites
air-borne) Climate model simulation outputs Multiple variables spatio-temporal (often has height dimension
as well)
Challenges Model spatio-temporal relationships across multiple variables Explain the cause of anomalies Massive data sizes
Climate and weather extreme events are well defined
Key challenge is to find significant events and explain the cause
Chawla and Chandola Anomaly Detection
Introduction Data Mining Methods Density-based anomaly Commute Time Approach Addressing Scalability Anomalies in Complex Data Evaluating Anomaly Detection Methods Applications Problem solutionsPCA and Subspace Method Subspace Method Algorithm Subspace Analysis Results Discussion Typical Characteristics of Anomaly Limitation of Volume Entropy Based versus Volume Based Fraud Detection Epidemeology Anomaly Detection in Climate and Weather Anomalies in Climate Validation of Anomalies
Anomalies are Widely Used in Climate
Most analysis done on ldquoanomalyrdquo time series
Difference from a ldquobase periodrdquo (Toosimplistic)
Brings spatial smoothness (eg a mountaintop and nearby valley can have very differenttemperatures) Removes seasonality
Understand climate and weatherphenomenon
Southern Oscillation Index (SOI) Difference between Sea Level Pressure
(SLP) anomalies for Tahiti and DarwinAustralia
Figure Global AverageTemperature Anomaly(1975 - 2007) Srcwwwmetofficegovuk
Chawla and Chandola Anomaly Detection
Introduction Data Mining Methods Density-based anomaly Commute Time Approach Addressing Scalability Anomalies in Complex Data Evaluating Anomaly Detection Methods Applications Problem solutionsPCA and Subspace Method Subspace Method Algorithm Subspace Analysis Results Discussion Typical Characteristics of Anomaly Limitation of Volume Entropy Based versus Volume Based Fraud Detection Epidemeology Anomaly Detection in Climate and Weather Anomalies in Climate Validation of Anomalies
Constructing Anomalies from Raw Data
Anomaly time series for a given location i
vprimei = vi minus bi
where bi is the base (reference)
How to choose bi Mean of all data for location i Monthly mean values (account for seasonality) Monthly z-score values Median (more robust) Using a shorter ldquoreference periodrdquo
30 year moving window
Different methods show statistically significant differences[19] What is the right strategy Weighted mean of different strategies (Pick weights using
Monte Carlo sampling)
Chawla and Chandola Anomaly Detection
Introduction Data Mining Methods Density-based anomaly Commute Time Approach Addressing Scalability Anomalies in Complex Data Evaluating Anomaly Detection Methods Applications Problem solutionsPCA and Subspace Method Subspace Method Algorithm Subspace Analysis Results Discussion Typical Characteristics of Anomaly Limitation of Volume Entropy Based versus Volume Based Fraud Detection Epidemeology Anomaly Detection in Climate and Weather Anomalies in Climate Validation of Anomalies
Anomaly Detection for Identifying Droughts
Science question Identify significant drought patterns usinghistorical observation data or future simulation data or both
Find persistent spatiotemporal anomalies in precipitation data
A two step approach
1 Find precipitationanomalies usingthresholds
2 Find large connectedcomponents across spaceand time
Matlab - bwlabelbwlabeln
Followup Science questionExplain cause
(drought190120061avi)
Figure Video courtsey Dr ArindamBanerjee
Chawla and Chandola Anomaly Detection
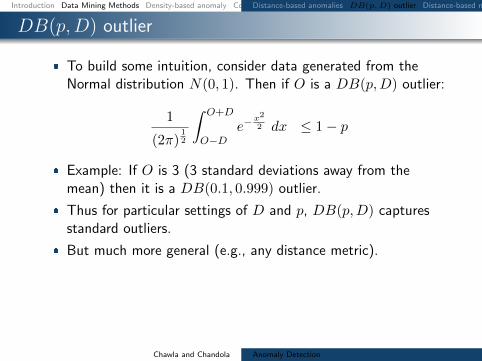
Introduction Data Mining Methods Density-based anomaly Commute Time Approach Addressing Scalability Anomalies in Complex Data Evaluating Anomaly Detection Methods Applications Problem solutionsDistance-based anomalies DB(pD) outlier Distance-based methods (DB(kN) Pruning rule Examples of pruning technique Strengths and weaknesses - Distance-based techniques
DB(pD) outlier
To build some intuition consider data generated from theNormal distribution N(0 1) Then if O is a DB(pD) outlier
1
(2π)12
int O+D
OminusDeminus
x2
2 dx le 1minus p
Example If O is 3 (3 standard deviations away from themean) then it is a DB(01 0999) outlier
Thus for particular settings of D and p DB(pD) capturesstandard outliers
But much more general (eg any distance metric)
Chawla and Chandola Anomaly Detection
Introduction Data Mining Methods Density-based anomaly Commute Time Approach Addressing Scalability Anomalies in Complex Data Evaluating Anomaly Detection Methods Applications Problem solutionsDistance-based anomalies DB(pD) outlier Distance-based methods (DB(kN) Pruning rule Examples of pruning technique Strengths and weaknesses - Distance-based techniques
Distance-based methods (DB(kN)
DB(kN) anomaly [28] top N data instances whosedistances to its k-th nearest neighbor are largest
Several advantages Ranking for anomalies is more intuitiveSetting of parameters generally easier
A Simple Nested Loop (SNL) algorithm can be used to selectthe top N DB(kN) outliers Time complexity is O(n2d)where n is the database size and d is the dimensionality
Chawla and Chandola Anomaly Detection
Introduction Data Mining Methods Density-based anomaly Commute Time Approach Addressing Scalability Anomalies in Complex Data Evaluating Anomaly Detection Methods Applications Problem solutionsDistance-based anomalies DB(pD) outlier Distance-based methods (DB(kN) Pruning rule Examples of pruning technique Strengths and weaknesses - Distance-based techniques
Pruning rule
DB(kN) anomaly [3] a data instance is not an anomaly ifits distance to its k-th current nearest neighbor is less thanthe score of the weakest anomaly among top N anomaliesfound so far
A large number of non-anomalies can be pruned withoutcarrying out a full data search
Complexity nearly O(n)
Chawla and Chandola Anomaly Detection
Introduction Data Mining Methods Density-based anomaly Commute Time Approach Addressing Scalability Anomalies in Complex Data Evaluating Anomaly Detection Methods Applications Problem solutionsDistance-based anomalies DB(pD) outlier Distance-based methods (DB(kN) Pruning rule Examples of pruning technique Strengths and weaknesses - Distance-based techniques
Examples of pruning technique
Non-anomalies are pruned earlier
Chawla and Chandola Anomaly Detection
Introduction Data Mining Methods Density-based anomaly Commute Time Approach Addressing Scalability Anomalies in Complex Data Evaluating Anomaly Detection Methods Applications Problem solutionsDistance-based anomalies DB(pD) outlier Distance-based methods (DB(kN) Pruning rule Examples of pruning technique Strengths and weaknesses - Distance-based techniques
Strengths and weaknesses - Distance-based techniques
Do not make any assumption about the distribution of thedata
Scalable for large dataset (O(n))
Capable of finding only global anomalies
Can lead to non-intuitive results in Top-k situations
0 10 20 30 40 50 60 700
10
20
30
40
50
60
70
dimension 1
dim
en
sio
n 2
p1
p2
p3
p4
Chawla and Chandola Anomaly Detection
Introduction Data Mining Methods Density-based anomaly Commute Time Approach Addressing Scalability Anomalies in Complex Data Evaluating Anomaly Detection Methods Applications Problem solutionsDensity-based anomaly Strengths and Weaknesses
Density-based anomaly
Calculate the density of an object based on the density of itsk nearest neighbours
density(p) = 1
sum
qisinNk(p)distk(p q)
|Nk(p)|
relative-density(p) =
density(p)1
|Nk(p)|sum
qisinNk(p)density(q)
anomaly-score(p) =1
relative-density(p)
LOF indicates a degree of local outlier-ness [6]
Chawla and Chandola Anomaly Detection
Introduction Data Mining Methods Density-based anomaly Commute Time Approach Addressing Scalability Anomalies in Complex Data Evaluating Anomaly Detection Methods Applications Problem solutionsDensity-based anomaly Strengths and Weaknesses
Strengths and Weaknesses
Can detect global and local anomalies
Cannot use pruning technique and has a complexity of O(n2)
Require a method combining the strengths of distance anddensity based approaches A distance based approach whichcan capture density
C
C
O
O1
1
2
2
Chawla and Chandola Anomaly Detection
Introduction Data Mining Methods Density-based anomaly Commute Time Approach Addressing Scalability Anomalies in Complex Data Evaluating Anomaly Detection Methods Applications Problem solutionsCommute time Computation of commute time Anomaly detection using commute time (CDOF) Fast estimation of commute time Scalability for Density-based method PINN Algorithm (ICDM 2010) PINN Guarantee Examples high-dim distance-based outliers Examples high-dim density-based outliers Examples local density-based outliers
Commute time
Commute time between i and j is the expected number ofsteps that a random walk starting at i will take to reach jonce and go back to i for the first time
Commute time can capture both the distance between pointsand the data densities
Chawla and Chandola Anomaly Detection
Introduction Data Mining Methods Density-based anomaly Commute Time Approach Addressing Scalability Anomalies in Complex Data Evaluating Anomaly Detection Methods Applications Problem solutionsCommute time Computation of commute time Anomaly detection using commute time (CDOF) Fast estimation of commute time Scalability for Density-based method PINN Algorithm (ICDM 2010) PINN Guarantee Examples high-dim distance-based outliers Examples high-dim density-based outliers Examples local density-based outliers
Computation of commute time
Commute time can be computed using graph Laplacian matrixL
cij = VG(ei minus ej)TL+(ei minus ej)L+ pseudo-inverse of LVG graph volumeei i-th column of the identity matrix
Commute time is Euclidean distance in the space spanned byeigenvectors of L
cij = VG[(Sminus12V T )(ei minus ej)]T [(Sminus12V T )(ei minus ej)]
V S eigenvectors and eigenvalues of L
Chawla and Chandola Anomaly Detection
Introduction Data Mining Methods Density-based anomaly Commute Time Approach Addressing Scalability Anomalies in Complex Data Evaluating Anomaly Detection Methods Applications Problem solutionsCommute time Computation of commute time Anomaly detection using commute time (CDOF) Fast estimation of commute time Scalability for Density-based method PINN Algorithm (ICDM 2010) PINN Guarantee Examples high-dim distance-based outliers Examples high-dim density-based outliers Examples local density-based outliers
Anomaly detection using commute time (CDOF)
Construct the mutual k nearest neighbor graph G from thedataset
Compute the Laplacian matrix L of G and its eigensystems
Find top N anomalies using the distance-based technique incommute time with pruning rule
Complexity O(n3)
Commute time method can detect global local and groupanomalies
Chawla and Chandola Anomaly Detection
Introduction Data Mining Methods Density-based anomaly Commute Time Approach Addressing Scalability Anomalies in Complex Data Evaluating Anomaly Detection Methods Applications Problem solutionsCommute time Computation of commute time Anomaly detection using commute time (CDOF) Fast estimation of commute time Scalability for Density-based method PINN Algorithm (ICDM 2010) PINN Guarantee Examples high-dim distance-based outliers Examples high-dim density-based outliers Examples local density-based outliers
Fast estimation of commute time
Speilman and Srivastava [31] combined random projection anda linear time solver to build a structure where we can computethe compute time between two nodes in O(log n) time
Complexity of CDOF O(n3)rarr O(n log n)
Uses a near linear time solver for a linear system of equationAx = b
Spielman and Teng solvers Also see work by Iannis Koutisfrom CMU
Chawla and Chandola Anomaly Detection
Introduction Data Mining Methods Density-based anomaly Commute Time Approach Addressing Scalability Anomalies in Complex Data Evaluating Anomaly Detection Methods Applications Problem solutionsCommute time Computation of commute time Anomaly detection using commute time (CDOF) Fast estimation of commute time Scalability for Density-based method PINN Algorithm (ICDM 2010) PINN Guarantee Examples high-dim distance-based outliers Examples high-dim density-based outliers Examples local density-based outliers
Scalability for Density-based method
The pruning rule for Distance-based methods does not applyto Density-based approaches
We can go from O(n2) to nearly O(n log n) by using an index
One solution for the curse of high dimensionality is to use ofrandom projections
Chawla and Chandola Anomaly Detection
Introduction Data Mining Methods Density-based anomaly Commute Time Approach Addressing Scalability Anomalies in Complex Data Evaluating Anomaly Detection Methods Applications Problem solutionsCommute time Computation of commute time Anomaly detection using commute time (CDOF) Fast estimation of commute time Scalability for Density-based method PINN Algorithm (ICDM 2010) PINN Guarantee Examples high-dim distance-based outliers Examples high-dim density-based outliers Examples local density-based outliers
PINN Algorithm (ICDM 2010)
Chawla and Chandola Anomaly Detection
Introduction Data Mining Methods Density-based anomaly Commute Time Approach Addressing Scalability Anomalies in Complex Data Evaluating Anomaly Detection Methods Applications Problem solutionsCommute time Computation of commute time Anomaly detection using commute time (CDOF) Fast estimation of commute time Scalability for Density-based method PINN Algorithm (ICDM 2010) PINN Guarantee Examples high-dim distance-based outliers Examples high-dim density-based outliers Examples local density-based outliers
PINN Guarantee
The PINN Algorithm provides probabilistic guarantees
Under certain assumptions about intrinsic dimensionality (c)with high probability
1minus ε1 + ε
middot LOF (p) le LOF (p) le 1 + ε
1minus ε middot LOF (p)
In practice we do not know the intrinsic dimensionality ofdata However random projections are quite robust
Chawla and Chandola Anomaly Detection
Introduction Data Mining Methods Density-based anomaly Commute Time Approach Addressing Scalability Anomalies in Complex Data Evaluating Anomaly Detection Methods Applications Problem solutionsCommute time Computation of commute time Anomaly detection using commute time (CDOF) Fast estimation of commute time Scalability for Density-based method PINN Algorithm (ICDM 2010) PINN Guarantee Examples high-dim distance-based outliers Examples high-dim density-based outliers Examples local density-based outliers
Examples high-dim distance-based outliers
On a large database of images the bright images show up asdistance based outliers
Chawla and Chandola Anomaly Detection
Introduction Data Mining Methods Density-based anomaly Commute Time Approach Addressing Scalability Anomalies in Complex Data Evaluating Anomaly Detection Methods Applications Problem solutionsCommute time Computation of commute time Anomaly detection using commute time (CDOF) Fast estimation of commute time Scalability for Density-based method PINN Algorithm (ICDM 2010) PINN Guarantee Examples high-dim distance-based outliers Examples high-dim density-based outliers Examples local density-based outliers
Examples high-dim density-based outliers
On a large database of images occluded images show up asdensity based outliers
Chawla and Chandola Anomaly Detection
Introduction Data Mining Methods Density-based anomaly Commute Time Approach Addressing Scalability Anomalies in Complex Data Evaluating Anomaly Detection Methods Applications Problem solutionsCommute time Computation of commute time Anomaly detection using commute time (CDOF) Fast estimation of commute time Scalability for Density-based method PINN Algorithm (ICDM 2010) PINN Guarantee Examples high-dim distance-based outliers Examples high-dim density-based outliers Examples local density-based outliers
Examples local density-based outliers
Examples of images ranked by LOF
Chawla and Chandola Anomaly Detection
Introduction Data Mining Methods Density-based anomaly Commute Time Approach Addressing Scalability Anomalies in Complex Data Evaluating Anomaly Detection Methods Applications Problem solutions
Addressing Scalability
Chawla and Chandola Anomaly Detection
Introduction Data Mining Methods Density-based anomaly Commute Time Approach Addressing Scalability Anomalies in Complex Data Evaluating Anomaly Detection Methods Applications Problem solutions
Using GPUs for Anomaly Detection
Well suited for data parallel algorithms Using CUDA - Compute Unified Device
Architecture (Nvidia)
Need to re-engineer existing algorithms Utilization of device memory Minimize CPUhArrGPU transfer of data Keep threads homogeneous
Most model based algorithms arenaturally setup for the testing phase
Model building needs careful redesign
What about unsupervised algorithms
Kernel
Host
Grid
Device
Block(00)
Block(01)
Block(02)
Block(10)
Block(11)
Block(12)
Thread Block
Thread(00)
Thread(01)
Thread(02)
Thread(03)
Thread(10)
Thread(11)
Thread(12)
Thread(13)
Thread(20)
Thread(21)
Thread(22)
Thread(23)
Host Host Memory
SM 2
SM 1
SM 0
Registers Registers Registers
SP 0 SP 1 SP 7
Shared Memory
Global Memory
Texture Memory
Constant Memory
Device
Chawla and Chandola Anomaly Detection
Introduction Data Mining Methods Density-based anomaly Commute Time Approach Addressing Scalability Anomalies in Complex Data Evaluating Anomaly Detection Methods Applications Problem solutions
Implementing DB(kN) on GPUs
Return top N data instances whose distances tok-th nearest neighbor are largest (SerialDB(kN) is O(n2))
Involves computing pairwise distances
Load block i and block j to shared memory Data layout in memory should be optimized
Each thread computes distance between a pairof instances
Can utilize this time to load next chunk of datafrom host to device memory
Writes results to corresponding output block
Sorting can be done efficiently in CUDA [29]
d
n
T
n
n
Chawla and Chandola Anomaly Detection
Introduction Data Mining Methods Density-based anomaly Commute Time Approach Addressing Scalability Anomalies in Complex Data Evaluating Anomaly Detection Methods Applications Problem solutionsCategorical Data Discrete Sequences and Time Series Contextual Anomalies Collective Anomalies
Moving Beyond Multi-dimensional Record Data
Categorical (Mixed)
Fraud Detection
Cyber Networks
Time Series
Sensor Networks
Healthcare
Discrete Sequences
Genomic
System Calls
Spatial
GIS
Image analysis
Spatio-temporal
Remote sensing
Climate
Graphs
Social networks
Epidemiology
Chawla and Chandola Anomaly Detection
Introduction Data Mining Methods Density-based anomaly Commute Time Approach Addressing Scalability Anomalies in Complex Data Evaluating Anomaly Detection Methods Applications Problem solutionsCategorical Data Discrete Sequences and Time Series Contextual Anomalies Collective Anomalies
Handling Categorical Data
Each attribute can belong to one of many categories
No ordering between categories
Mixed data (categorical and continuous attributes)
cap-shape cap-surface middot middot middot habitat type
convex smooth urban poisonousconvex smooth grasses ediblebell smooth meadows edibleconvex scaly urban poisonousconvex smooth grasses ediblemiddot middot middot
Table Mushroom Data Set [2]
Chawla and Chandola Anomaly Detection
Introduction Data Mining Methods Density-based anomaly Commute Time Approach Addressing Scalability Anomalies in Complex Data Evaluating Anomaly Detection Methods Applications Problem solutionsCategorical Data Discrete Sequences and Time Series Contextual Anomalies Collective Anomalies
Approaches to Identify Categorical Anomalies
Using Association Analysis [24]
Binarize data
Learn rules (X rArr Y ) Choose high confidence
rules (P (Y |X))
For test record Z = 〈XY 〉find rules of the formP (Y |X)
Y is not observed whenX is observed
Using Bayesian Networks [33]
Learn Bayesian networkstructure and parameters
Compute P (Z) for test datarecord Z
Flag anomaly if P (Z) lt δ
Using Similarity Metrics [10]
Use a similarity measure (S(X1 X2))
Apply distancedensityclustering based method (eg lof)
Chawla and Chandola Anomaly Detection
Introduction Data Mining Methods Density-based anomaly Commute Time Approach Addressing Scalability Anomalies in Complex Data Evaluating Anomaly Detection Methods Applications Problem solutionsCategorical Data Discrete Sequences and Time Series Contextual Anomalies Collective Anomalies
Conditional Probability Test [18]
Identify unusual combinations of attribute values
r(at bt) =P (at bt)
P (at)P (bt)
A capB = φ Assumption If r(at bt) is low and is observed in test record t
then t is anomalous For a test record t
For each mutually exclusive pair of attribute sets ABcompute r(at bt)
Score t based on all r-values Assign minimum r-value as score Take product of all r-values
Need to compare exponential pairs of subsets Only consider subsets upto size k Ignore subsets with frequency less than a threshold α Avoid comparing independent subsets of attributes
micro(AB) ge βmicroChawla and Chandola Anomaly Detection
Introduction Data Mining Methods Density-based anomaly Commute Time Approach Addressing Scalability Anomalies in Complex Data Evaluating Anomaly Detection Methods Applications Problem solutionsCategorical Data Discrete Sequences and Time Series Contextual Anomalies Collective Anomalies
Estimating Probabilities for CPT [18]
Maximum LikelihoodEstimation
P (at bt)
P (at)P (bt)=C(at bt)
Ntimes N
C(at)times N
C(bt)
C(at) Number of traininginstances with A = at
N Total number of traininginstances
Laplace Smoothing
E(p) =C(p) + 1
N + 2
r(at bt) =E(at bt)
E(at)times E(bt)
Speedup Tricks
Replace rare attributevalues with genericattribute (reduce arity)
Use efficient datastructure to querying forcounts(AD Trees [26])
ADTrees work fasterfor low arity attributes
Chawla and Chandola Anomaly Detection
Introduction Data Mining Methods Density-based anomaly Commute Time Approach Addressing Scalability Anomalies in Complex Data Evaluating Anomaly Detection Methods Applications Problem solutionsCategorical Data Discrete Sequences and Time Series Contextual Anomalies Collective Anomalies
Finding Anomalies in Discrete Sequences
Many problem formulations
1 Anomalous symbols in asequence
2 Anomalous subsequence in asequence
3 Anomalous sequence in adatabase of sequences
See [11] for a comparativeevaluation [9] for a survey
login pwdmail ssh mail web logoutlogin pwdmail web web web web logoutlogin pwdmail ssh mail web web logoutlogin pwdwebmail ssh webmail logoutloginpwd loginpwd loginpwd logout
Chawla and Chandola Anomaly Detection
Introduction Data Mining Methods Density-based anomaly Commute Time Approach Addressing Scalability Anomalies in Complex Data Evaluating Anomaly Detection Methods Applications Problem solutionsCategorical Data Discrete Sequences and Time Series Contextual Anomalies Collective Anomalies
Treating Sequences as Points
Utilize a distancesimilarity measure Plug into a distancedensityclustering based method
Simplest Hamming Distance
h(Ai Bi) = 1 Ai 6= Bi= 0 Ai = Bi
H(AB) =nsumi=1
h(Ai Bi)
Issues Unequal lengths misalignment Normalized Length of Longest Common Subsequence
D(AB) = 1minus |LCS(AB)|radic|A||B|
Standard Dynamic Programming method is slow Faster versions available (Hunt Szymnaski method [7])
Weaknesses Cannot localize anomalies within a sequence Weak anomaly signals might get lost
Chawla and Chandola Anomaly Detection
Introduction Data Mining Methods Density-based anomaly Commute Time Approach Addressing Scalability Anomalies in Complex Data Evaluating Anomaly Detection Methods Applications Problem solutionsCategorical Data Discrete Sequences and Time Series Contextual Anomalies Collective Anomalies
Using Sliding Windows
Slide a window of size k
Extract all windows from a sequence (nminus k + 1)
Training (Creating a normal dictionary) Store all uniquewindows in all normal sequences and their counts
Testing For each window find the frequency in normal dictionary Anomaly score is inverse of the aggregate frequencies for all
windows (normalized by length)
Many variants exist For each window find the hamming distance to the closest
window in the normal dictionary [16]
Issues Penalizes low frequency windows in the normal dictionary Rewards high frequency windows that might not be relevant Can construct anomalous sequences that will escape detection
Chawla and Chandola Anomaly Detection
Introduction Data Mining Methods Density-based anomaly Commute Time Approach Addressing Scalability Anomalies in Complex Data Evaluating Anomaly Detection Methods Applications Problem solutionsCategorical Data Discrete Sequences and Time Series Contextual Anomalies Collective Anomalies
Using Probabilistic Models
Probability of occurrence of sequence S
P (S) =nprodi=1
P (Si|S1 Siminus1)
Short memory property of sequences
P (Si|S1 Siminus1) = P (Si|Siminusk Siminus1)
Conditional probability estimates for a symbol Si
P (Si|Siminusk Siminus1) =f(Si|Siminusk Si)f(Si|Siminusk Siminus1)
f is estimated from the normal dictionary
Anomaly score for a test sequence is inverse of the normalizedprobability of occurrence
Issues What if the suffix occurs very infrequently in thenormal data (or not at all)
Replace with the longest suffix that occurs sufficient number oftimes [32] - Probabilistic Suffix Trees
Significantly reduces the size of the modelChawla and Chandola Anomaly Detection
Introduction Data Mining Methods Density-based anomaly Commute Time Approach Addressing Scalability Anomalies in Complex Data Evaluating Anomaly Detection Methods Applications Problem solutionsCategorical Data Discrete Sequences and Time Series Contextual Anomalies Collective Anomalies
Finding Contextual Anomalies
Sometimes contextual information isavailable about data
Not used directly as a feature Are well understood no anomalies in
the context Can reduce false positives and yield
interesting anomalies
Example adapted from [30]
Clearest Outlier
Conditional Anomaly
Maximum Daily Temperature
Number
ofFever
Cases
Contextual anomalies - Anomalous with respect to a context Context is defined using environmental variables
Spatial (Latitude Longitude) Graph context (Edges Weights) Temporal location Domain specific (Demographic other)
How to incorporate context Reduce to traditional anomaly detection (subset on context) Explicitly model contextual information (time series spatial)
Chawla and Chandola Anomaly Detection
Introduction Data Mining Methods Density-based anomaly Commute Time Approach Addressing Scalability Anomalies in Complex Data Evaluating Anomaly Detection Methods Applications Problem solutionsCategorical Data Discrete Sequences and Time Series Contextual Anomalies Collective Anomalies
Conditional Anomaly Detection
Data instance d rArru1 u2 udU v1 v2 vdV
dU environmentalattributes
dV indicator attributes u1
u2
U1
U2
U3
v1
v2
V1V2
V3
p(V1|U3) = 02
p(V2|U3) = 02
p(V3|U3) = 06
Algorithm [30]
1 Learn a Gaussian Mixture Model (GMM)U = U1 U2 UnU
each with dimensionality dU2 Learn a set of Gaussians U = V1 V2 VnV
each withdimensionality dV
3 Learn a probabilistic mapping function p(Vj |Ui)4 Score a test instance d = [uv]
S =
nUsumi=1
p(u|Ui)nVsumj=1
p(v|Vj)p(Vj |Ui)
Chawla and Chandola Anomaly Detection
Introduction Data Mining Methods Density-based anomaly Commute Time Approach Addressing Scalability Anomalies in Complex Data Evaluating Anomaly Detection Methods Applications Problem solutionsCategorical Data Discrete Sequences and Time Series Contextual Anomalies Collective Anomalies
Finding Collective Anomalies
Find a collection of data points
Each point by itself is normal
The collection as a whole isanomalous
Relevant when data has inherentstructure and
When domain definition ofanomalies cannot be described aspoint anomalies
A Simple Solution
1 Break data intogroups
2 Compute features foreach group
3 Apply traditionalanomaly detection
Examples
1 Time series
2 Image
3 Spatial clusters ofgalaxies
Chawla and Chandola Anomaly Detection
Introduction Data Mining Methods Density-based anomaly Commute Time Approach Addressing Scalability Anomalies in Complex Data Evaluating Anomaly Detection Methods Applications Problem solutionsCategorical Data Discrete Sequences and Time Series Contextual Anomalies Collective Anomalies
Using Latent Dirichlet Allocation for Group Anomalies
Find anomalous groups in data [34]
Example Spatial clusters of galaxies topics red green emissive words continuous features
Flexible Genre Model (FGM)
For each group
1 Draw a genre 1 2 T 3 ym simM(π)2 Draw topic distribution forym SK 3 θm sim Dir(αym)
3 Draw K topicsβmk sim P (βmk|ηk)k=12K
4 For each point in group
1 Draw topic membershipzmn simM(θn)
2 Generate pointxmn isin P (xmn|βmzmn)
α
zmn
xmn
N
θm
T
π
ηK
ym
β
MK
Model Parameters
M(π) -Multinomial
Genre - Dir(αt)
Topic generatorsP (|ηk)- GIW
Point generatorsP (xmn|βnk) -MultivariateGaussian
Chawla and Chandola Anomaly Detection
Introduction Data Mining Methods Density-based anomaly Commute Time Approach Addressing Scalability Anomalies in Complex Data Evaluating Anomaly Detection Methods Applications Problem solutionsCategorical Data Discrete Sequences and Time Series Contextual Anomalies Collective Anomalies
Inference and Testing for FGM
Inference and Learning Parameters
Approximate inference of latentvariables (Gibbs Sampling)
Use samples to learn parameters(Single step Monte Carlo EM)
Topic 1
Topic 2
Topic 3
Anomaly Detection
Infer the topic distribution θm
Compute negative log likelihood wrt αt
Rationale An anomalous group will be unlikely to begenerated from any genre
Geometric interpretation Mapping each group into a Tdimensional space and finding anomalies
Chawla and Chandola Anomaly Detection
Introduction Data Mining Methods Density-based anomaly Commute Time Approach Addressing Scalability Anomalies in Complex Data Evaluating Anomaly Detection Methods Applications Problem solutions
Evaluating Anomaly Detection Methods - Labels
Labeled validation data set exists Confusion matrix Traditional evaluation metrics
Class imbalance
ROC Curve
Validation set does not exist Use domain expertise to find TP
and FP FN is harder to estimate
Pseudo false negativeestimation techniques [25]
Predicteda n
Actuala TP FNn FP TN
Acc =TP + TNsum
Rec (R) =TP
TP + FN
Prec (P ) =TP
TP + FP
F =2 lowastR lowast PR+ P
Chawla and Chandola Anomaly Detection
Introduction Data Mining Methods Density-based anomaly Commute Time Approach Addressing Scalability Anomalies in Complex Data Evaluating Anomaly Detection Methods Applications Problem solutions
Evaluating Anomaly Detection Methods - Scores
Convert to binary output Use threshold δ on score (Scale
issues [21]) Take top x as anomalies
ROC curve by varying x or δ
Quality of output Does the output ldquosuggestrdquo x or δ Which output is better
Chawla and Chandola Anomaly Detection
Introduction Data Mining Methods Density-based anomaly Commute Time Approach Addressing Scalability Anomalies in Complex Data Evaluating Anomaly Detection Methods Applications Problem solutions
Unifying Scores
Different methods assign scores in differentranges
kNN-based scores [0 1] Lof scores [1 6] ABOD scores [0 80000]
Anomalies have lower scores
Direct scaling to [0 1] might lose distinctionbetween normal and anomalies
Desired scaling Stretch interesting rangesand shrink irrelevant ones
Generalized Procedure for Normalizing Outlier Scores [21] Regularity rArr S(o) ge 0forallo S(o) asymp 0 if o is normal andS(o) 0 if o is anomalous
Normality S is regular and S(o) isin [0 1]forallo
Chawla and Chandola Anomaly Detection
Introduction Data Mining Methods Density-based anomaly Commute Time Approach Addressing Scalability Anomalies in Complex Data Evaluating Anomaly Detection Methods Applications Problem solutions
Regularization and Normalization of Scores
Regularization
1 R(o) = max0 S(o)minus baseS2 R(o) = Smax minus S(o)
3 R(o) = minus log SmaxS(o)
Normalization
1 N(o) = S(o)Smax
2 N(o) = max(
0 erf(S(o)minusmicroSσS radic2
))(Gaussian Scaling)
Suited for high dimensional data
3 N(o) = max(
0cdfγS (o)minusmicroγ
1minusmicroγ
)(Gamma Scaling)
Where cdfγS (o) = P (k S(o) θ) P is the regularized Gamma function Suited for low dimensional data
Chawla and Chandola Anomaly Detection
Introduction Data Mining Methods Density-based anomaly Commute Time Approach Addressing Scalability Anomalies in Complex Data Evaluating Anomaly Detection Methods Applications Problem solutions
Generating Labeled Data for Validation
Generating Both Normal and Anomalous Data
Use generative models for normal and anomalous behavior
Several generators available Multivariate continuous data [27] Multivariate categorical data [5] Discrete sequences using HMM [12]
Drawbacks Might not capture the domain characteristics
Injecting Anomalies - Random Perturbation[30]
Given data point z = xy x and y arepartitions of feature space
Take a random sample D of the entire data set
Let zprime = xprimeyprime isin D such that distancebetween y and yprime is maximum
Replace x with xprime and add z back to data setx
yz
zprime
Injected anomaly
Chawla and Chandola Anomaly Detection
Introduction Data Mining Methods Density-based anomaly Commute Time Approach Addressing Scalability Anomalies in Complex Data Evaluating Anomaly Detection Methods Applications Problem solutionsWhat is Network Anomaly Detection Motivation How Much Serious
Applications Overview
How to set up an anomaly detection solution for agiven application domain
Available data Define anomalies define normal behavior Identify requirements and constraints (online
real-time limited resources) What domain knowledge available
Feature identification Defining normal and anomalous behavior Tuning parameters
Available ground truth (training validation)
Chawla and Chandola Anomaly Detection
Introduction Data Mining Methods Density-based anomaly Commute Time Approach Addressing Scalability Anomalies in Complex Data Evaluating Anomaly Detection Methods Applications Problem solutionsWhat is Network Anomaly Detection Motivation How Much Serious
What is Network Anomaly Detection
Anomaly Detection or Intrusion Detection
Traditional Intrusion Detection Systems (IDS) finding attackscorresponding to predefined pattern data set known as signaturestherefore system is absolutely vulnerable against zero-day attacks
Network Anomaly Detection Systems (NADS) to detectzero-day attacks without any pre-identified signature besides profilenormal behavior of the network and address suspected incidents
Network Anomaly Detection finding unusual and largechanges in the network traffic
Examples intentional attacks (eg Distributed Denial ofService - DDoS) or unusual network traffic (eg flash crowds)
Chawla and Chandola Anomaly Detection
Introduction Data Mining Methods Density-based anomaly Commute Time Approach Addressing Scalability Anomalies in Complex Data Evaluating Anomaly Detection Methods Applications Problem solutionsWhat is Network Anomaly Detection Motivation How Much Serious
Motivation How Much Serious
According to Symantec report released in early 2011 morethan 286 million new threats have been detected in 2010which is a huge number
1656227
2704836
1000000
1500000
2000000
2500000
3000000
20547 18827 69107 113025 140690
624267
1656227
2704836
0
500000
1000000
1500000
2000000
2500000
3000000
2002 2003 2004 2005 2006 2007 2008 July2009-June2010
Chawla and Chandola Anomaly Detection
Introduction Data Mining Methods Density-based anomaly Commute Time Approach Addressing Scalability Anomalies in Complex Data Evaluating Anomaly Detection Methods Applications Problem solutionsNetwork Topology Network Anomalies Detection Problem Network Anomalies Detection Problem Why care about OD Flows
Network Topology
A Typical network
1 y
Router
2
3
41t
x2t
x1t
x3t
x4t
Origin-Destination (OD) flow is the traffic that enters at anorigin node and exits at a destination node of a backbonenetwork x1t x1t
Link measurement is the traffic enters at an node during aninterval y1t
Relationship between link traffic and OD flow traffic iscaptured by the routing matrix A
Chawla and Chandola Anomaly Detection
Introduction Data Mining Methods Density-based anomaly Commute Time Approach Addressing Scalability Anomalies in Complex Data Evaluating Anomaly Detection Methods Applications Problem solutionsNetwork Topology Network Anomalies Detection Problem Network Anomalies Detection Problem Why care about OD Flows
Network Anomalies Detection Problem
Chawla and Chandola Anomaly Detection
Introduction Data Mining Methods Density-based anomaly Commute Time Approach Addressing Scalability Anomalies in Complex Data Evaluating Anomaly Detection Methods Applications Problem solutionsNetwork Topology Network Anomalies Detection Problem Network Anomalies Detection Problem Why care about OD Flows
Network Anomalies Detection Problem
Chawla and Chandola Anomaly Detection
Introduction Data Mining Methods Density-based anomaly Commute Time Approach Addressing Scalability Anomalies in Complex Data Evaluating Anomaly Detection Methods Applications Problem solutionsNetwork Topology Network Anomalies Detection Problem Network Anomalies Detection Problem Why care about OD Flows
Why care about OD Flows
Volume anomaly typically arises on an OD flow (trafficarriving at one node and destined for another node)
If we only monitor traffic on network links volume arisingfrom an OD flow may not be noticeable Thus naiveapproach wont work if OD flow info is not available
Figure source [22]
Chawla and Chandola Anomaly Detection
Introduction Data Mining Methods Density-based anomaly Commute Time Approach Addressing Scalability Anomalies in Complex Data Evaluating Anomaly Detection Methods Applications Problem solutionsPCA and Subspace Method Subspace Method Algorithm Subspace Analysis Results Discussion Typical Characteristics of Anomaly Limitation of Volume Entropy Based versus Volume Based Fraud Detection Epidemeology Anomaly Detection in Climate and Weather Anomalies in Climate Validation of Anomalies
PCA and Subspace Method
Chawla and Chandola Anomaly Detection
Introduction Data Mining Methods Density-based anomaly Commute Time Approach Addressing Scalability Anomalies in Complex Data Evaluating Anomaly Detection Methods Applications Problem solutionsPCA and Subspace Method Subspace Method Algorithm Subspace Analysis Results Discussion Typical Characteristics of Anomaly Limitation of Volume Entropy Based versus Volume Based Fraud Detection Epidemeology Anomaly Detection in Climate and Weather Anomalies in Climate Validation of Anomalies
Subspace Method Algorithm
Step1- Determine the PCs based on eigenvaluedecomposition of the covariance matrix of the dataset
Step2- Choose first top k principle components with thehighest eigenvalues as matrix P
Step3-normal traffic subspace called Z
Z = PP TZ = CZ
Step4-abnormal traffic subspace called Z
Z = (I minus PP T )Z = CZ
Step5-If the norm of a vector is large then it is an rdquoanomalyrdquo
Chawla and Chandola Anomaly Detection
Introduction Data Mining Methods Density-based anomaly Commute Time Approach Addressing Scalability Anomalies in Complex Data Evaluating Anomaly Detection Methods Applications Problem solutionsPCA and Subspace Method Subspace Method Algorithm Subspace Analysis Results Discussion Typical Characteristics of Anomaly Limitation of Volume Entropy Based versus Volume Based Fraud Detection Epidemeology Anomaly Detection in Climate and Weather Anomalies in Climate Validation of Anomalies
Subspace Analysis Results
Note that during anomaly normal component does not changethat much while residual component changes quite a lot
Thus anomalies can be detected by setting some threshold
Figure source [22]
Chawla and Chandola Anomaly Detection
Introduction Data Mining Methods Density-based anomaly Commute Time Approach Addressing Scalability Anomalies in Complex Data Evaluating Anomaly Detection Methods Applications Problem solutionsPCA and Subspace Method Subspace Method Algorithm Subspace Analysis Results Discussion Typical Characteristics of Anomaly Limitation of Volume Entropy Based versus Volume Based Fraud Detection Epidemeology Anomaly Detection in Climate and Weather Anomalies in Climate Validation of Anomalies
Discussion Typical Characteristics of Anomaly
Most Anomalies induce a change in distributionalaspects of packet header fields (called features)
Most important features include 5-tuple Source ampdestination IP addresses Source and destination portnumbers and IP protocol
raquo DOS attack ndash multiple source IP address concentrated on asingle destination IP address
raquo Network scan ndash dispersed distribution of destination addresses
raquo Most wormsviruses also induce some change in distribution ofcertain features
raquo However these changes can be very subtle and mining them islike searching for needles in a haystack
Unlike many previous approach this paper aims todetect events which disturb the distribution of trafficfeatures rather than traffic volume
Chawla and Chandola Anomaly Detection
Introduction Data Mining Methods Density-based anomaly Commute Time Approach Addressing Scalability Anomalies in Complex Data Evaluating Anomaly Detection Methods Applications Problem solutionsPCA and Subspace Method Subspace Method Algorithm Subspace Analysis Results Discussion Typical Characteristics of Anomaly Limitation of Volume Entropy Based versus Volume Based Fraud Detection Epidemeology Anomaly Detection in Climate and Weather Anomalies in Climate Validation of Anomalies
Limitation of Volume
Figure source [22]
Port scan anomaly (traffic feature changes however traffic volume
remains more or less the same)
We can use entropy tocapture the variationsin the traffic feature
bullTakes value 0 when distribution is maximally concentratedbullTakes value log2N when distribution is maximally dispersed
But stands out in
feature entropy
which also reveals
its structure
Port scan
dwarfed
in volume
metricshellip
Chawla and Chandola Anomaly Detection
Introduction Data Mining Methods Density-based anomaly Commute Time Approach Addressing Scalability Anomalies in Complex Data Evaluating Anomaly Detection Methods Applications Problem solutionsPCA and Subspace Method Subspace Method Algorithm Subspace Analysis Results Discussion Typical Characteristics of Anomaly Limitation of Volume Entropy Based versus Volume Based Fraud Detection Epidemeology Anomaly Detection in Climate and Weather Anomalies in Climate Validation of Anomalies
Entropy Based versus Volume Based
DoSDDoS Attacks- a spike in traffic data toward adominant destination IP
Scan anomaly-a spike in traffic data from a dominant sourceIP
Flash Crowd anomaly- again a spike in traffic data to adominant destination IP
Worm anomaly-a Spike in traffic with a dominant port
Chawla and Chandola Anomaly Detection
Introduction Data Mining Methods Density-based anomaly Commute Time Approach Addressing Scalability Anomalies in Complex Data Evaluating Anomaly Detection Methods Applications Problem solutionsPCA and Subspace Method Subspace Method Algorithm Subspace Analysis Results Discussion Typical Characteristics of Anomaly Limitation of Volume Entropy Based versus Volume Based Fraud Detection Epidemeology Anomaly Detection in Climate and Weather Anomalies in Climate Validation of Anomalies
Fraud Detection
Domain Question Identifyfraudulent activities or players fromobserved transaction data
Data Transactions between different
players in the system Meta information about the
individuals An underlying graph structure
Challenges Track and model human behavior Anomalies caused by adaptive
human adversaries Massive data sizes
Insurance (autohealtha)
ClaimantProvider Payer
Telecommunications Customer
Provider
Credit Cards Customer
Supplier Bank
Web Advertising User Advertiser
Publisher
ahttpwwwcheatingculturecompast-cases-of-medicare-fraud
Chawla and Chandola Anomaly Detection
Introduction Data Mining Methods Density-based anomaly Commute Time Approach Addressing Scalability Anomalies in Complex Data Evaluating Anomaly Detection Methods Applications Problem solutionsPCA and Subspace Method Subspace Method Algorithm Subspace Analysis Results Discussion Typical Characteristics of Anomaly Limitation of Volume Entropy Based versus Volume Based Fraud Detection Epidemeology Anomaly Detection in Climate and Weather Anomalies in Climate Validation of Anomalies
A Generic Fraud Detection Method
Activity Monitoring [13]1 Build profiles for individuals (customers users etc) based on
historic data User X makes n calls on an average in January
2 Compare current behavior with historical profile for significantdeviations
Clustering based [4]1 Cluster historical profiles of customers2 Identify small clusters or outlying profiles as anomalies
Strengths Anomaly detection is fast (good for real time) Results are easy to explain
Weaknesses Need to create and maintain a large number of profiles Not dynamic Adequate historical data might not be available Too many false positives
Chawla and Chandola Anomaly Detection
Introduction Data Mining Methods Density-based anomaly Commute Time Approach Addressing Scalability Anomalies in Complex Data Evaluating Anomaly Detection Methods Applications Problem solutionsPCA and Subspace Method Subspace Method Algorithm Subspace Analysis Results Discussion Typical Characteristics of Anomaly Limitation of Volume Entropy Based versus Volume Based Fraud Detection Epidemeology Anomaly Detection in Climate and Weather Anomalies in Climate Validation of Anomalies
Exploiting Graph Structure - Weighted Graphs
Represent data as a weighted graph Communication networks (phone email SMS) Provider referral networks
Objective Identify anomalous nodes
For each node extract several features based on the propertiesof the induced sub-graph (egonet) of neighboring nodes [1]
Choose features that can highlight anomalous nodes
1 Ni degree of node2 Ei number of edges in egonet3 Wi total weight of egonet4 λi principal eigen vector of weighted adjacency matrix of
egonet
Data is transformed into a point in a multi-dimensional space
Chawla and Chandola Anomaly Detection
Introduction Data Mining Methods Density-based anomaly Commute Time Approach Addressing Scalability Anomalies in Complex Data Evaluating Anomaly Detection Methods Applications Problem solutionsPCA and Subspace Method Subspace Method Algorithm Subspace Analysis Results Discussion Typical Characteristics of Anomaly Limitation of Volume Entropy Based versus Volume Based Fraud Detection Epidemeology Anomaly Detection in Climate and Weather Anomalies in Climate Validation of Anomalies
Identifying Anomalies
Traditional anomaly detection (lof) Can be slow but can identify any type of anomalous structure
Faster method to identify specific types of anomalousstructures
Identify relevant feature pairs and power law relationship
Eg Egonet Density Power Law Ni vs Ei - detect nearcliques and stars
Ei prop Nαi 1 le α le 2
Anomaly score for node i wrt a pair of features (y = Cxθ)
Si =max(yi Cx
θi )
min(yi Cxθi )lowast log (|yi minus Cxθi |+ 1)
Chawla and Chandola Anomaly Detection
Introduction Data Mining Methods Density-based anomaly Commute Time Approach Addressing Scalability Anomalies in Complex Data Evaluating Anomaly Detection Methods Applications Problem solutionsPCA and Subspace Method Subspace Method Algorithm Subspace Analysis Results Discussion Typical Characteristics of Anomaly Limitation of Volume Entropy Based versus Volume Based Fraud Detection Epidemeology Anomaly Detection in Climate and Weather Anomalies in Climate Validation of Anomalies
Exploiting Graph Structure - Bipartite Graphs
Represent data as a bipartite graph Healthcare Data (Beneficiaries vs Providers) Insider trading (Traders vs Stocks)
Objective Identify anomalous links
Given a query node a isin V1 find the ldquorelevancerdquoof all other nodes in V1 to a
RelevanceScore(a b) prop Number of times aldquorandom walkrdquo from a reaches b
Use the relevance scores to compute thenormality scores for a node t isin V2
Find set St = a|〈a t〉 isin E Compute |St| times |St| similarity matrix using
relevance vectors for a isin St Normality Score = mean of non-diagonal entries
of similarity matrix
V1 E V2a1
a2
a3
an
t1
t2
t3
tn
Chawla and Chandola Anomaly Detection
Introduction Data Mining Methods Density-based anomaly Commute Time Approach Addressing Scalability Anomalies in Complex Data Evaluating Anomaly Detection Methods Applications Problem solutionsPCA and Subspace Method Subspace Method Algorithm Subspace Analysis Results Discussion Typical Characteristics of Anomaly Limitation of Volume Entropy Based versus Volume Based Fraud Detection Epidemeology Anomaly Detection in Climate and Weather Anomalies in Climate Validation of Anomalies
Detecting Disease Outbreaks
Domain Question Early detection of disease
outbreaks Anthrax attack
Data Emergency department visits Grocery data (Example [14]) Clinical visits Weatherclimate data
Challenges Weak signals in the data
ED cases involving cough rArrFlu or SARS
Integration of multiple signals(lag analysis)
Account for spatial and temporalcorrelations
Chawla and Chandola Anomaly Detection
Introduction Data Mining Methods Density-based anomaly Commute Time Approach Addressing Scalability Anomalies in Complex Data Evaluating Anomaly Detection Methods Applications Problem solutionsPCA and Subspace Method Subspace Method Algorithm Subspace Analysis Results Discussion Typical Characteristics of Anomaly Limitation of Volume Entropy Based versus Volume Based Fraud Detection Epidemeology Anomaly Detection in Climate and Weather Anomalies in Climate Validation of Anomalies
Whatrsquos Significant About Recent Events (WSARE) [33]
1 Learn Bayesian network from historical data Environmental and response variables
2 Sample from the BN (DBbaseline|Current Environment)3 Compute contingency table for rules for DBbaseline andDBcurrent
Rules are single assignment rules (Xi = Y ji ) or conjunctions4 Find p-value for rules using χ2-test
Null Hypothesis Rows and columns of tables for DBbaselineand DBcurrent are independent
5 Find rule with largest p-value Repeat Step 2
Chawla and Chandola Anomaly Detection
Introduction Data Mining Methods Density-based anomaly Commute Time Approach Addressing Scalability Anomalies in Complex Data Evaluating Anomaly Detection Methods Applications Problem solutionsPCA and Subspace Method Subspace Method Algorithm Subspace Analysis Results Discussion Typical Characteristics of Anomaly Limitation of Volume Entropy Based versus Volume Based Fraud Detection Epidemeology Anomaly Detection in Climate and Weather Anomalies in Climate Validation of Anomalies
Incorporating Spatial and Temporal Relationships
WSARE does not explicitly model the spatial and temporalrelationships
What happened yesterday What happened in the adjoining neighborhood (yesterday)
Bayesian Network Spatio-Temporal (BNST) modelingframework [17]
Add nodes for temporal and spatial dependencies Need more data to train
Chawla and Chandola Anomaly Detection
Introduction Data Mining Methods Density-based anomaly Commute Time Approach Addressing Scalability Anomalies in Complex Data Evaluating Anomaly Detection Methods Applications Problem solutionsPCA and Subspace Method Subspace Method Algorithm Subspace Analysis Results Discussion Typical Characteristics of Anomaly Limitation of Volume Entropy Based versus Volume Based Fraud Detection Epidemeology Anomaly Detection in Climate and Weather Anomalies in Climate Validation of Anomalies
Anomaly Detection in Climate and Weather
Science Questions Identify natural and anthropogenic disasters Identify long time scale events - droughts atmospheric rivers
cold fronts etc
Data Ground observations Remote sensing data (satellites
air-borne) Climate model simulation outputs Multiple variables spatio-temporal (often has height dimension
as well)
Challenges Model spatio-temporal relationships across multiple variables Explain the cause of anomalies Massive data sizes
Climate and weather extreme events are well defined
Key challenge is to find significant events and explain the cause
Chawla and Chandola Anomaly Detection
Introduction Data Mining Methods Density-based anomaly Commute Time Approach Addressing Scalability Anomalies in Complex Data Evaluating Anomaly Detection Methods Applications Problem solutionsPCA and Subspace Method Subspace Method Algorithm Subspace Analysis Results Discussion Typical Characteristics of Anomaly Limitation of Volume Entropy Based versus Volume Based Fraud Detection Epidemeology Anomaly Detection in Climate and Weather Anomalies in Climate Validation of Anomalies
Anomalies are Widely Used in Climate
Most analysis done on ldquoanomalyrdquo time series
Difference from a ldquobase periodrdquo (Toosimplistic)
Brings spatial smoothness (eg a mountaintop and nearby valley can have very differenttemperatures) Removes seasonality
Understand climate and weatherphenomenon
Southern Oscillation Index (SOI) Difference between Sea Level Pressure
(SLP) anomalies for Tahiti and DarwinAustralia
Figure Global AverageTemperature Anomaly(1975 - 2007) Srcwwwmetofficegovuk
Chawla and Chandola Anomaly Detection
Introduction Data Mining Methods Density-based anomaly Commute Time Approach Addressing Scalability Anomalies in Complex Data Evaluating Anomaly Detection Methods Applications Problem solutionsPCA and Subspace Method Subspace Method Algorithm Subspace Analysis Results Discussion Typical Characteristics of Anomaly Limitation of Volume Entropy Based versus Volume Based Fraud Detection Epidemeology Anomaly Detection in Climate and Weather Anomalies in Climate Validation of Anomalies
Constructing Anomalies from Raw Data
Anomaly time series for a given location i
vprimei = vi minus bi
where bi is the base (reference)
How to choose bi Mean of all data for location i Monthly mean values (account for seasonality) Monthly z-score values Median (more robust) Using a shorter ldquoreference periodrdquo
30 year moving window
Different methods show statistically significant differences[19] What is the right strategy Weighted mean of different strategies (Pick weights using
Monte Carlo sampling)
Chawla and Chandola Anomaly Detection
Introduction Data Mining Methods Density-based anomaly Commute Time Approach Addressing Scalability Anomalies in Complex Data Evaluating Anomaly Detection Methods Applications Problem solutionsPCA and Subspace Method Subspace Method Algorithm Subspace Analysis Results Discussion Typical Characteristics of Anomaly Limitation of Volume Entropy Based versus Volume Based Fraud Detection Epidemeology Anomaly Detection in Climate and Weather Anomalies in Climate Validation of Anomalies
Anomaly Detection for Identifying Droughts
Science question Identify significant drought patterns usinghistorical observation data or future simulation data or both
Find persistent spatiotemporal anomalies in precipitation data
A two step approach
1 Find precipitationanomalies usingthresholds
2 Find large connectedcomponents across spaceand time
Matlab - bwlabelbwlabeln
Followup Science questionExplain cause
(drought190120061avi)
Figure Video courtsey Dr ArindamBanerjee
Chawla and Chandola Anomaly Detection
Introduction Data Mining Methods Density-based anomaly Commute Time Approach Addressing Scalability Anomalies in Complex Data Evaluating Anomaly Detection Methods Applications Problem solutionsDistance-based anomalies DB(pD) outlier Distance-based methods (DB(kN) Pruning rule Examples of pruning technique Strengths and weaknesses - Distance-based techniques
Pruning rule
DB(kN) anomaly [3] a data instance is not an anomaly ifits distance to its k-th current nearest neighbor is less thanthe score of the weakest anomaly among top N anomaliesfound so far
A large number of non-anomalies can be pruned withoutcarrying out a full data search
Complexity nearly O(n)
Chawla and Chandola Anomaly Detection
Introduction Data Mining Methods Density-based anomaly Commute Time Approach Addressing Scalability Anomalies in Complex Data Evaluating Anomaly Detection Methods Applications Problem solutionsDistance-based anomalies DB(pD) outlier Distance-based methods (DB(kN) Pruning rule Examples of pruning technique Strengths and weaknesses - Distance-based techniques
Examples of pruning technique
Non-anomalies are pruned earlier
Chawla and Chandola Anomaly Detection
Introduction Data Mining Methods Density-based anomaly Commute Time Approach Addressing Scalability Anomalies in Complex Data Evaluating Anomaly Detection Methods Applications Problem solutionsDistance-based anomalies DB(pD) outlier Distance-based methods (DB(kN) Pruning rule Examples of pruning technique Strengths and weaknesses - Distance-based techniques
Strengths and weaknesses - Distance-based techniques
Do not make any assumption about the distribution of thedata
Scalable for large dataset (O(n))
Capable of finding only global anomalies
Can lead to non-intuitive results in Top-k situations
0 10 20 30 40 50 60 700
10
20
30
40
50
60
70
dimension 1
dim
en
sio
n 2
p1
p2
p3
p4
Chawla and Chandola Anomaly Detection
Introduction Data Mining Methods Density-based anomaly Commute Time Approach Addressing Scalability Anomalies in Complex Data Evaluating Anomaly Detection Methods Applications Problem solutionsDensity-based anomaly Strengths and Weaknesses
Density-based anomaly
Calculate the density of an object based on the density of itsk nearest neighbours
density(p) = 1
sum
qisinNk(p)distk(p q)
|Nk(p)|
relative-density(p) =
density(p)1
|Nk(p)|sum
qisinNk(p)density(q)
anomaly-score(p) =1
relative-density(p)
LOF indicates a degree of local outlier-ness [6]
Chawla and Chandola Anomaly Detection
Introduction Data Mining Methods Density-based anomaly Commute Time Approach Addressing Scalability Anomalies in Complex Data Evaluating Anomaly Detection Methods Applications Problem solutionsDensity-based anomaly Strengths and Weaknesses
Strengths and Weaknesses
Can detect global and local anomalies
Cannot use pruning technique and has a complexity of O(n2)
Require a method combining the strengths of distance anddensity based approaches A distance based approach whichcan capture density
C
C
O
O1
1
2
2
Chawla and Chandola Anomaly Detection
Introduction Data Mining Methods Density-based anomaly Commute Time Approach Addressing Scalability Anomalies in Complex Data Evaluating Anomaly Detection Methods Applications Problem solutionsCommute time Computation of commute time Anomaly detection using commute time (CDOF) Fast estimation of commute time Scalability for Density-based method PINN Algorithm (ICDM 2010) PINN Guarantee Examples high-dim distance-based outliers Examples high-dim density-based outliers Examples local density-based outliers
Commute time
Commute time between i and j is the expected number ofsteps that a random walk starting at i will take to reach jonce and go back to i for the first time
Commute time can capture both the distance between pointsand the data densities
Chawla and Chandola Anomaly Detection
Introduction Data Mining Methods Density-based anomaly Commute Time Approach Addressing Scalability Anomalies in Complex Data Evaluating Anomaly Detection Methods Applications Problem solutionsCommute time Computation of commute time Anomaly detection using commute time (CDOF) Fast estimation of commute time Scalability for Density-based method PINN Algorithm (ICDM 2010) PINN Guarantee Examples high-dim distance-based outliers Examples high-dim density-based outliers Examples local density-based outliers
Computation of commute time
Commute time can be computed using graph Laplacian matrixL
cij = VG(ei minus ej)TL+(ei minus ej)L+ pseudo-inverse of LVG graph volumeei i-th column of the identity matrix
Commute time is Euclidean distance in the space spanned byeigenvectors of L
cij = VG[(Sminus12V T )(ei minus ej)]T [(Sminus12V T )(ei minus ej)]
V S eigenvectors and eigenvalues of L
Chawla and Chandola Anomaly Detection
Introduction Data Mining Methods Density-based anomaly Commute Time Approach Addressing Scalability Anomalies in Complex Data Evaluating Anomaly Detection Methods Applications Problem solutionsCommute time Computation of commute time Anomaly detection using commute time (CDOF) Fast estimation of commute time Scalability for Density-based method PINN Algorithm (ICDM 2010) PINN Guarantee Examples high-dim distance-based outliers Examples high-dim density-based outliers Examples local density-based outliers
Anomaly detection using commute time (CDOF)
Construct the mutual k nearest neighbor graph G from thedataset
Compute the Laplacian matrix L of G and its eigensystems
Find top N anomalies using the distance-based technique incommute time with pruning rule
Complexity O(n3)
Commute time method can detect global local and groupanomalies
Chawla and Chandola Anomaly Detection
Introduction Data Mining Methods Density-based anomaly Commute Time Approach Addressing Scalability Anomalies in Complex Data Evaluating Anomaly Detection Methods Applications Problem solutionsCommute time Computation of commute time Anomaly detection using commute time (CDOF) Fast estimation of commute time Scalability for Density-based method PINN Algorithm (ICDM 2010) PINN Guarantee Examples high-dim distance-based outliers Examples high-dim density-based outliers Examples local density-based outliers
Fast estimation of commute time
Speilman and Srivastava [31] combined random projection anda linear time solver to build a structure where we can computethe compute time between two nodes in O(log n) time
Complexity of CDOF O(n3)rarr O(n log n)
Uses a near linear time solver for a linear system of equationAx = b
Spielman and Teng solvers Also see work by Iannis Koutisfrom CMU
Chawla and Chandola Anomaly Detection
Introduction Data Mining Methods Density-based anomaly Commute Time Approach Addressing Scalability Anomalies in Complex Data Evaluating Anomaly Detection Methods Applications Problem solutionsCommute time Computation of commute time Anomaly detection using commute time (CDOF) Fast estimation of commute time Scalability for Density-based method PINN Algorithm (ICDM 2010) PINN Guarantee Examples high-dim distance-based outliers Examples high-dim density-based outliers Examples local density-based outliers
Scalability for Density-based method
The pruning rule for Distance-based methods does not applyto Density-based approaches
We can go from O(n2) to nearly O(n log n) by using an index
One solution for the curse of high dimensionality is to use ofrandom projections
Chawla and Chandola Anomaly Detection
Introduction Data Mining Methods Density-based anomaly Commute Time Approach Addressing Scalability Anomalies in Complex Data Evaluating Anomaly Detection Methods Applications Problem solutionsCommute time Computation of commute time Anomaly detection using commute time (CDOF) Fast estimation of commute time Scalability for Density-based method PINN Algorithm (ICDM 2010) PINN Guarantee Examples high-dim distance-based outliers Examples high-dim density-based outliers Examples local density-based outliers
PINN Algorithm (ICDM 2010)
Chawla and Chandola Anomaly Detection
Introduction Data Mining Methods Density-based anomaly Commute Time Approach Addressing Scalability Anomalies in Complex Data Evaluating Anomaly Detection Methods Applications Problem solutionsCommute time Computation of commute time Anomaly detection using commute time (CDOF) Fast estimation of commute time Scalability for Density-based method PINN Algorithm (ICDM 2010) PINN Guarantee Examples high-dim distance-based outliers Examples high-dim density-based outliers Examples local density-based outliers
PINN Guarantee
The PINN Algorithm provides probabilistic guarantees
Under certain assumptions about intrinsic dimensionality (c)with high probability
1minus ε1 + ε
middot LOF (p) le LOF (p) le 1 + ε
1minus ε middot LOF (p)
In practice we do not know the intrinsic dimensionality ofdata However random projections are quite robust
Chawla and Chandola Anomaly Detection
Introduction Data Mining Methods Density-based anomaly Commute Time Approach Addressing Scalability Anomalies in Complex Data Evaluating Anomaly Detection Methods Applications Problem solutionsCommute time Computation of commute time Anomaly detection using commute time (CDOF) Fast estimation of commute time Scalability for Density-based method PINN Algorithm (ICDM 2010) PINN Guarantee Examples high-dim distance-based outliers Examples high-dim density-based outliers Examples local density-based outliers
Examples high-dim distance-based outliers
On a large database of images the bright images show up asdistance based outliers
Chawla and Chandola Anomaly Detection
Introduction Data Mining Methods Density-based anomaly Commute Time Approach Addressing Scalability Anomalies in Complex Data Evaluating Anomaly Detection Methods Applications Problem solutionsCommute time Computation of commute time Anomaly detection using commute time (CDOF) Fast estimation of commute time Scalability for Density-based method PINN Algorithm (ICDM 2010) PINN Guarantee Examples high-dim distance-based outliers Examples high-dim density-based outliers Examples local density-based outliers
Examples high-dim density-based outliers
On a large database of images occluded images show up asdensity based outliers
Chawla and Chandola Anomaly Detection
Introduction Data Mining Methods Density-based anomaly Commute Time Approach Addressing Scalability Anomalies in Complex Data Evaluating Anomaly Detection Methods Applications Problem solutionsCommute time Computation of commute time Anomaly detection using commute time (CDOF) Fast estimation of commute time Scalability for Density-based method PINN Algorithm (ICDM 2010) PINN Guarantee Examples high-dim distance-based outliers Examples high-dim density-based outliers Examples local density-based outliers
Examples local density-based outliers
Examples of images ranked by LOF
Chawla and Chandola Anomaly Detection
Introduction Data Mining Methods Density-based anomaly Commute Time Approach Addressing Scalability Anomalies in Complex Data Evaluating Anomaly Detection Methods Applications Problem solutions
Addressing Scalability
Chawla and Chandola Anomaly Detection
Introduction Data Mining Methods Density-based anomaly Commute Time Approach Addressing Scalability Anomalies in Complex Data Evaluating Anomaly Detection Methods Applications Problem solutions
Using GPUs for Anomaly Detection
Well suited for data parallel algorithms Using CUDA - Compute Unified Device
Architecture (Nvidia)
Need to re-engineer existing algorithms Utilization of device memory Minimize CPUhArrGPU transfer of data Keep threads homogeneous
Most model based algorithms arenaturally setup for the testing phase
Model building needs careful redesign
What about unsupervised algorithms
Kernel
Host
Grid
Device
Block(00)
Block(01)
Block(02)
Block(10)
Block(11)
Block(12)
Thread Block
Thread(00)
Thread(01)
Thread(02)
Thread(03)
Thread(10)
Thread(11)
Thread(12)
Thread(13)
Thread(20)
Thread(21)
Thread(22)
Thread(23)
Host Host Memory
SM 2
SM 1
SM 0
Registers Registers Registers
SP 0 SP 1 SP 7
Shared Memory
Global Memory
Texture Memory
Constant Memory
Device
Chawla and Chandola Anomaly Detection
Introduction Data Mining Methods Density-based anomaly Commute Time Approach Addressing Scalability Anomalies in Complex Data Evaluating Anomaly Detection Methods Applications Problem solutions
Implementing DB(kN) on GPUs
Return top N data instances whose distances tok-th nearest neighbor are largest (SerialDB(kN) is O(n2))
Involves computing pairwise distances
Load block i and block j to shared memory Data layout in memory should be optimized
Each thread computes distance between a pairof instances
Can utilize this time to load next chunk of datafrom host to device memory
Writes results to corresponding output block
Sorting can be done efficiently in CUDA [29]
d
n
T
n
n
Chawla and Chandola Anomaly Detection
Introduction Data Mining Methods Density-based anomaly Commute Time Approach Addressing Scalability Anomalies in Complex Data Evaluating Anomaly Detection Methods Applications Problem solutionsCategorical Data Discrete Sequences and Time Series Contextual Anomalies Collective Anomalies
Moving Beyond Multi-dimensional Record Data
Categorical (Mixed)
Fraud Detection
Cyber Networks
Time Series
Sensor Networks
Healthcare
Discrete Sequences
Genomic
System Calls
Spatial
GIS
Image analysis
Spatio-temporal
Remote sensing
Climate
Graphs
Social networks
Epidemiology
Chawla and Chandola Anomaly Detection
Introduction Data Mining Methods Density-based anomaly Commute Time Approach Addressing Scalability Anomalies in Complex Data Evaluating Anomaly Detection Methods Applications Problem solutionsCategorical Data Discrete Sequences and Time Series Contextual Anomalies Collective Anomalies
Handling Categorical Data
Each attribute can belong to one of many categories
No ordering between categories
Mixed data (categorical and continuous attributes)
cap-shape cap-surface middot middot middot habitat type
convex smooth urban poisonousconvex smooth grasses ediblebell smooth meadows edibleconvex scaly urban poisonousconvex smooth grasses ediblemiddot middot middot
Table Mushroom Data Set [2]
Chawla and Chandola Anomaly Detection
Introduction Data Mining Methods Density-based anomaly Commute Time Approach Addressing Scalability Anomalies in Complex Data Evaluating Anomaly Detection Methods Applications Problem solutionsCategorical Data Discrete Sequences and Time Series Contextual Anomalies Collective Anomalies
Approaches to Identify Categorical Anomalies
Using Association Analysis [24]
Binarize data
Learn rules (X rArr Y ) Choose high confidence
rules (P (Y |X))
For test record Z = 〈XY 〉find rules of the formP (Y |X)
Y is not observed whenX is observed
Using Bayesian Networks [33]
Learn Bayesian networkstructure and parameters
Compute P (Z) for test datarecord Z
Flag anomaly if P (Z) lt δ
Using Similarity Metrics [10]
Use a similarity measure (S(X1 X2))
Apply distancedensityclustering based method (eg lof)
Chawla and Chandola Anomaly Detection
Introduction Data Mining Methods Density-based anomaly Commute Time Approach Addressing Scalability Anomalies in Complex Data Evaluating Anomaly Detection Methods Applications Problem solutionsCategorical Data Discrete Sequences and Time Series Contextual Anomalies Collective Anomalies
Conditional Probability Test [18]
Identify unusual combinations of attribute values
r(at bt) =P (at bt)
P (at)P (bt)
A capB = φ Assumption If r(at bt) is low and is observed in test record t
then t is anomalous For a test record t
For each mutually exclusive pair of attribute sets ABcompute r(at bt)
Score t based on all r-values Assign minimum r-value as score Take product of all r-values
Need to compare exponential pairs of subsets Only consider subsets upto size k Ignore subsets with frequency less than a threshold α Avoid comparing independent subsets of attributes
micro(AB) ge βmicroChawla and Chandola Anomaly Detection
Introduction Data Mining Methods Density-based anomaly Commute Time Approach Addressing Scalability Anomalies in Complex Data Evaluating Anomaly Detection Methods Applications Problem solutionsCategorical Data Discrete Sequences and Time Series Contextual Anomalies Collective Anomalies
Estimating Probabilities for CPT [18]
Maximum LikelihoodEstimation
P (at bt)
P (at)P (bt)=C(at bt)
Ntimes N
C(at)times N
C(bt)
C(at) Number of traininginstances with A = at
N Total number of traininginstances
Laplace Smoothing
E(p) =C(p) + 1
N + 2
r(at bt) =E(at bt)
E(at)times E(bt)
Speedup Tricks
Replace rare attributevalues with genericattribute (reduce arity)
Use efficient datastructure to querying forcounts(AD Trees [26])
ADTrees work fasterfor low arity attributes
Chawla and Chandola Anomaly Detection
Introduction Data Mining Methods Density-based anomaly Commute Time Approach Addressing Scalability Anomalies in Complex Data Evaluating Anomaly Detection Methods Applications Problem solutionsCategorical Data Discrete Sequences and Time Series Contextual Anomalies Collective Anomalies
Finding Anomalies in Discrete Sequences
Many problem formulations
1 Anomalous symbols in asequence
2 Anomalous subsequence in asequence
3 Anomalous sequence in adatabase of sequences
See [11] for a comparativeevaluation [9] for a survey
login pwdmail ssh mail web logoutlogin pwdmail web web web web logoutlogin pwdmail ssh mail web web logoutlogin pwdwebmail ssh webmail logoutloginpwd loginpwd loginpwd logout
Chawla and Chandola Anomaly Detection
Introduction Data Mining Methods Density-based anomaly Commute Time Approach Addressing Scalability Anomalies in Complex Data Evaluating Anomaly Detection Methods Applications Problem solutionsCategorical Data Discrete Sequences and Time Series Contextual Anomalies Collective Anomalies
Treating Sequences as Points
Utilize a distancesimilarity measure Plug into a distancedensityclustering based method
Simplest Hamming Distance
h(Ai Bi) = 1 Ai 6= Bi= 0 Ai = Bi
H(AB) =nsumi=1
h(Ai Bi)
Issues Unequal lengths misalignment Normalized Length of Longest Common Subsequence
D(AB) = 1minus |LCS(AB)|radic|A||B|
Standard Dynamic Programming method is slow Faster versions available (Hunt Szymnaski method [7])
Weaknesses Cannot localize anomalies within a sequence Weak anomaly signals might get lost
Chawla and Chandola Anomaly Detection
Introduction Data Mining Methods Density-based anomaly Commute Time Approach Addressing Scalability Anomalies in Complex Data Evaluating Anomaly Detection Methods Applications Problem solutionsCategorical Data Discrete Sequences and Time Series Contextual Anomalies Collective Anomalies
Using Sliding Windows
Slide a window of size k
Extract all windows from a sequence (nminus k + 1)
Training (Creating a normal dictionary) Store all uniquewindows in all normal sequences and their counts
Testing For each window find the frequency in normal dictionary Anomaly score is inverse of the aggregate frequencies for all
windows (normalized by length)
Many variants exist For each window find the hamming distance to the closest
window in the normal dictionary [16]
Issues Penalizes low frequency windows in the normal dictionary Rewards high frequency windows that might not be relevant Can construct anomalous sequences that will escape detection
Chawla and Chandola Anomaly Detection
Introduction Data Mining Methods Density-based anomaly Commute Time Approach Addressing Scalability Anomalies in Complex Data Evaluating Anomaly Detection Methods Applications Problem solutionsCategorical Data Discrete Sequences and Time Series Contextual Anomalies Collective Anomalies
Using Probabilistic Models
Probability of occurrence of sequence S
P (S) =nprodi=1
P (Si|S1 Siminus1)
Short memory property of sequences
P (Si|S1 Siminus1) = P (Si|Siminusk Siminus1)
Conditional probability estimates for a symbol Si
P (Si|Siminusk Siminus1) =f(Si|Siminusk Si)f(Si|Siminusk Siminus1)
f is estimated from the normal dictionary
Anomaly score for a test sequence is inverse of the normalizedprobability of occurrence
Issues What if the suffix occurs very infrequently in thenormal data (or not at all)
Replace with the longest suffix that occurs sufficient number oftimes [32] - Probabilistic Suffix Trees
Significantly reduces the size of the modelChawla and Chandola Anomaly Detection
Introduction Data Mining Methods Density-based anomaly Commute Time Approach Addressing Scalability Anomalies in Complex Data Evaluating Anomaly Detection Methods Applications Problem solutionsCategorical Data Discrete Sequences and Time Series Contextual Anomalies Collective Anomalies
Finding Contextual Anomalies
Sometimes contextual information isavailable about data
Not used directly as a feature Are well understood no anomalies in
the context Can reduce false positives and yield
interesting anomalies
Example adapted from [30]
Clearest Outlier
Conditional Anomaly
Maximum Daily Temperature
Number
ofFever
Cases
Contextual anomalies - Anomalous with respect to a context Context is defined using environmental variables
Spatial (Latitude Longitude) Graph context (Edges Weights) Temporal location Domain specific (Demographic other)
How to incorporate context Reduce to traditional anomaly detection (subset on context) Explicitly model contextual information (time series spatial)
Chawla and Chandola Anomaly Detection
Introduction Data Mining Methods Density-based anomaly Commute Time Approach Addressing Scalability Anomalies in Complex Data Evaluating Anomaly Detection Methods Applications Problem solutionsCategorical Data Discrete Sequences and Time Series Contextual Anomalies Collective Anomalies
Conditional Anomaly Detection
Data instance d rArru1 u2 udU v1 v2 vdV
dU environmentalattributes
dV indicator attributes u1
u2
U1
U2
U3
v1
v2
V1V2
V3
p(V1|U3) = 02
p(V2|U3) = 02
p(V3|U3) = 06
Algorithm [30]
1 Learn a Gaussian Mixture Model (GMM)U = U1 U2 UnU
each with dimensionality dU2 Learn a set of Gaussians U = V1 V2 VnV
each withdimensionality dV
3 Learn a probabilistic mapping function p(Vj |Ui)4 Score a test instance d = [uv]
S =
nUsumi=1
p(u|Ui)nVsumj=1
p(v|Vj)p(Vj |Ui)
Chawla and Chandola Anomaly Detection
Introduction Data Mining Methods Density-based anomaly Commute Time Approach Addressing Scalability Anomalies in Complex Data Evaluating Anomaly Detection Methods Applications Problem solutionsCategorical Data Discrete Sequences and Time Series Contextual Anomalies Collective Anomalies
Finding Collective Anomalies
Find a collection of data points
Each point by itself is normal
The collection as a whole isanomalous
Relevant when data has inherentstructure and
When domain definition ofanomalies cannot be described aspoint anomalies
A Simple Solution
1 Break data intogroups
2 Compute features foreach group
3 Apply traditionalanomaly detection
Examples
1 Time series
2 Image
3 Spatial clusters ofgalaxies
Chawla and Chandola Anomaly Detection
Introduction Data Mining Methods Density-based anomaly Commute Time Approach Addressing Scalability Anomalies in Complex Data Evaluating Anomaly Detection Methods Applications Problem solutionsCategorical Data Discrete Sequences and Time Series Contextual Anomalies Collective Anomalies
Using Latent Dirichlet Allocation for Group Anomalies
Find anomalous groups in data [34]
Example Spatial clusters of galaxies topics red green emissive words continuous features
Flexible Genre Model (FGM)
For each group
1 Draw a genre 1 2 T 3 ym simM(π)2 Draw topic distribution forym SK 3 θm sim Dir(αym)
3 Draw K topicsβmk sim P (βmk|ηk)k=12K
4 For each point in group
1 Draw topic membershipzmn simM(θn)
2 Generate pointxmn isin P (xmn|βmzmn)
α
zmn
xmn
N
θm
T
π
ηK
ym
β
MK
Model Parameters
M(π) -Multinomial
Genre - Dir(αt)
Topic generatorsP (|ηk)- GIW
Point generatorsP (xmn|βnk) -MultivariateGaussian
Chawla and Chandola Anomaly Detection
Introduction Data Mining Methods Density-based anomaly Commute Time Approach Addressing Scalability Anomalies in Complex Data Evaluating Anomaly Detection Methods Applications Problem solutionsCategorical Data Discrete Sequences and Time Series Contextual Anomalies Collective Anomalies
Inference and Testing for FGM
Inference and Learning Parameters
Approximate inference of latentvariables (Gibbs Sampling)
Use samples to learn parameters(Single step Monte Carlo EM)
Topic 1
Topic 2
Topic 3
Anomaly Detection
Infer the topic distribution θm
Compute negative log likelihood wrt αt
Rationale An anomalous group will be unlikely to begenerated from any genre
Geometric interpretation Mapping each group into a Tdimensional space and finding anomalies
Chawla and Chandola Anomaly Detection
Introduction Data Mining Methods Density-based anomaly Commute Time Approach Addressing Scalability Anomalies in Complex Data Evaluating Anomaly Detection Methods Applications Problem solutions
Evaluating Anomaly Detection Methods - Labels
Labeled validation data set exists Confusion matrix Traditional evaluation metrics
Class imbalance
ROC Curve
Validation set does not exist Use domain expertise to find TP
and FP FN is harder to estimate
Pseudo false negativeestimation techniques [25]
Predicteda n
Actuala TP FNn FP TN
Acc =TP + TNsum
Rec (R) =TP
TP + FN
Prec (P ) =TP
TP + FP
F =2 lowastR lowast PR+ P
Chawla and Chandola Anomaly Detection
Introduction Data Mining Methods Density-based anomaly Commute Time Approach Addressing Scalability Anomalies in Complex Data Evaluating Anomaly Detection Methods Applications Problem solutions
Evaluating Anomaly Detection Methods - Scores
Convert to binary output Use threshold δ on score (Scale
issues [21]) Take top x as anomalies
ROC curve by varying x or δ
Quality of output Does the output ldquosuggestrdquo x or δ Which output is better
Chawla and Chandola Anomaly Detection
Introduction Data Mining Methods Density-based anomaly Commute Time Approach Addressing Scalability Anomalies in Complex Data Evaluating Anomaly Detection Methods Applications Problem solutions
Unifying Scores
Different methods assign scores in differentranges
kNN-based scores [0 1] Lof scores [1 6] ABOD scores [0 80000]
Anomalies have lower scores
Direct scaling to [0 1] might lose distinctionbetween normal and anomalies
Desired scaling Stretch interesting rangesand shrink irrelevant ones
Generalized Procedure for Normalizing Outlier Scores [21] Regularity rArr S(o) ge 0forallo S(o) asymp 0 if o is normal andS(o) 0 if o is anomalous
Normality S is regular and S(o) isin [0 1]forallo
Chawla and Chandola Anomaly Detection
Introduction Data Mining Methods Density-based anomaly Commute Time Approach Addressing Scalability Anomalies in Complex Data Evaluating Anomaly Detection Methods Applications Problem solutions
Regularization and Normalization of Scores
Regularization
1 R(o) = max0 S(o)minus baseS2 R(o) = Smax minus S(o)
3 R(o) = minus log SmaxS(o)
Normalization
1 N(o) = S(o)Smax
2 N(o) = max(
0 erf(S(o)minusmicroSσS radic2
))(Gaussian Scaling)
Suited for high dimensional data
3 N(o) = max(
0cdfγS (o)minusmicroγ
1minusmicroγ
)(Gamma Scaling)
Where cdfγS (o) = P (k S(o) θ) P is the regularized Gamma function Suited for low dimensional data
Chawla and Chandola Anomaly Detection
Introduction Data Mining Methods Density-based anomaly Commute Time Approach Addressing Scalability Anomalies in Complex Data Evaluating Anomaly Detection Methods Applications Problem solutions
Generating Labeled Data for Validation
Generating Both Normal and Anomalous Data
Use generative models for normal and anomalous behavior
Several generators available Multivariate continuous data [27] Multivariate categorical data [5] Discrete sequences using HMM [12]
Drawbacks Might not capture the domain characteristics
Injecting Anomalies - Random Perturbation[30]
Given data point z = xy x and y arepartitions of feature space
Take a random sample D of the entire data set
Let zprime = xprimeyprime isin D such that distancebetween y and yprime is maximum
Replace x with xprime and add z back to data setx
yz
zprime
Injected anomaly
Chawla and Chandola Anomaly Detection
Introduction Data Mining Methods Density-based anomaly Commute Time Approach Addressing Scalability Anomalies in Complex Data Evaluating Anomaly Detection Methods Applications Problem solutionsWhat is Network Anomaly Detection Motivation How Much Serious
Applications Overview
How to set up an anomaly detection solution for agiven application domain
Available data Define anomalies define normal behavior Identify requirements and constraints (online
real-time limited resources) What domain knowledge available
Feature identification Defining normal and anomalous behavior Tuning parameters
Available ground truth (training validation)
Chawla and Chandola Anomaly Detection
Introduction Data Mining Methods Density-based anomaly Commute Time Approach Addressing Scalability Anomalies in Complex Data Evaluating Anomaly Detection Methods Applications Problem solutionsWhat is Network Anomaly Detection Motivation How Much Serious
What is Network Anomaly Detection
Anomaly Detection or Intrusion Detection
Traditional Intrusion Detection Systems (IDS) finding attackscorresponding to predefined pattern data set known as signaturestherefore system is absolutely vulnerable against zero-day attacks
Network Anomaly Detection Systems (NADS) to detectzero-day attacks without any pre-identified signature besides profilenormal behavior of the network and address suspected incidents
Network Anomaly Detection finding unusual and largechanges in the network traffic
Examples intentional attacks (eg Distributed Denial ofService - DDoS) or unusual network traffic (eg flash crowds)
Chawla and Chandola Anomaly Detection
Introduction Data Mining Methods Density-based anomaly Commute Time Approach Addressing Scalability Anomalies in Complex Data Evaluating Anomaly Detection Methods Applications Problem solutionsWhat is Network Anomaly Detection Motivation How Much Serious
Motivation How Much Serious
According to Symantec report released in early 2011 morethan 286 million new threats have been detected in 2010which is a huge number
1656227
2704836
1000000
1500000
2000000
2500000
3000000
20547 18827 69107 113025 140690
624267
1656227
2704836
0
500000
1000000
1500000
2000000
2500000
3000000
2002 2003 2004 2005 2006 2007 2008 July2009-June2010
Chawla and Chandola Anomaly Detection
Introduction Data Mining Methods Density-based anomaly Commute Time Approach Addressing Scalability Anomalies in Complex Data Evaluating Anomaly Detection Methods Applications Problem solutionsNetwork Topology Network Anomalies Detection Problem Network Anomalies Detection Problem Why care about OD Flows
Network Topology
A Typical network
1 y
Router
2
3
41t
x2t
x1t
x3t
x4t
Origin-Destination (OD) flow is the traffic that enters at anorigin node and exits at a destination node of a backbonenetwork x1t x1t
Link measurement is the traffic enters at an node during aninterval y1t
Relationship between link traffic and OD flow traffic iscaptured by the routing matrix A
Chawla and Chandola Anomaly Detection
Introduction Data Mining Methods Density-based anomaly Commute Time Approach Addressing Scalability Anomalies in Complex Data Evaluating Anomaly Detection Methods Applications Problem solutionsNetwork Topology Network Anomalies Detection Problem Network Anomalies Detection Problem Why care about OD Flows
Network Anomalies Detection Problem
Chawla and Chandola Anomaly Detection
Introduction Data Mining Methods Density-based anomaly Commute Time Approach Addressing Scalability Anomalies in Complex Data Evaluating Anomaly Detection Methods Applications Problem solutionsNetwork Topology Network Anomalies Detection Problem Network Anomalies Detection Problem Why care about OD Flows
Network Anomalies Detection Problem
Chawla and Chandola Anomaly Detection
Introduction Data Mining Methods Density-based anomaly Commute Time Approach Addressing Scalability Anomalies in Complex Data Evaluating Anomaly Detection Methods Applications Problem solutionsNetwork Topology Network Anomalies Detection Problem Network Anomalies Detection Problem Why care about OD Flows
Why care about OD Flows
Volume anomaly typically arises on an OD flow (trafficarriving at one node and destined for another node)
If we only monitor traffic on network links volume arisingfrom an OD flow may not be noticeable Thus naiveapproach wont work if OD flow info is not available
Figure source [22]
Chawla and Chandola Anomaly Detection
Introduction Data Mining Methods Density-based anomaly Commute Time Approach Addressing Scalability Anomalies in Complex Data Evaluating Anomaly Detection Methods Applications Problem solutionsPCA and Subspace Method Subspace Method Algorithm Subspace Analysis Results Discussion Typical Characteristics of Anomaly Limitation of Volume Entropy Based versus Volume Based Fraud Detection Epidemeology Anomaly Detection in Climate and Weather Anomalies in Climate Validation of Anomalies
PCA and Subspace Method
Chawla and Chandola Anomaly Detection
Introduction Data Mining Methods Density-based anomaly Commute Time Approach Addressing Scalability Anomalies in Complex Data Evaluating Anomaly Detection Methods Applications Problem solutionsPCA and Subspace Method Subspace Method Algorithm Subspace Analysis Results Discussion Typical Characteristics of Anomaly Limitation of Volume Entropy Based versus Volume Based Fraud Detection Epidemeology Anomaly Detection in Climate and Weather Anomalies in Climate Validation of Anomalies
Subspace Method Algorithm
Step1- Determine the PCs based on eigenvaluedecomposition of the covariance matrix of the dataset
Step2- Choose first top k principle components with thehighest eigenvalues as matrix P
Step3-normal traffic subspace called Z
Z = PP TZ = CZ
Step4-abnormal traffic subspace called Z
Z = (I minus PP T )Z = CZ
Step5-If the norm of a vector is large then it is an rdquoanomalyrdquo
Chawla and Chandola Anomaly Detection
Introduction Data Mining Methods Density-based anomaly Commute Time Approach Addressing Scalability Anomalies in Complex Data Evaluating Anomaly Detection Methods Applications Problem solutionsPCA and Subspace Method Subspace Method Algorithm Subspace Analysis Results Discussion Typical Characteristics of Anomaly Limitation of Volume Entropy Based versus Volume Based Fraud Detection Epidemeology Anomaly Detection in Climate and Weather Anomalies in Climate Validation of Anomalies
Subspace Analysis Results
Note that during anomaly normal component does not changethat much while residual component changes quite a lot
Thus anomalies can be detected by setting some threshold
Figure source [22]
Chawla and Chandola Anomaly Detection
Introduction Data Mining Methods Density-based anomaly Commute Time Approach Addressing Scalability Anomalies in Complex Data Evaluating Anomaly Detection Methods Applications Problem solutionsPCA and Subspace Method Subspace Method Algorithm Subspace Analysis Results Discussion Typical Characteristics of Anomaly Limitation of Volume Entropy Based versus Volume Based Fraud Detection Epidemeology Anomaly Detection in Climate and Weather Anomalies in Climate Validation of Anomalies
Discussion Typical Characteristics of Anomaly
Most Anomalies induce a change in distributionalaspects of packet header fields (called features)
Most important features include 5-tuple Source ampdestination IP addresses Source and destination portnumbers and IP protocol
raquo DOS attack ndash multiple source IP address concentrated on asingle destination IP address
raquo Network scan ndash dispersed distribution of destination addresses
raquo Most wormsviruses also induce some change in distribution ofcertain features
raquo However these changes can be very subtle and mining them islike searching for needles in a haystack
Unlike many previous approach this paper aims todetect events which disturb the distribution of trafficfeatures rather than traffic volume
Chawla and Chandola Anomaly Detection
Introduction Data Mining Methods Density-based anomaly Commute Time Approach Addressing Scalability Anomalies in Complex Data Evaluating Anomaly Detection Methods Applications Problem solutionsPCA and Subspace Method Subspace Method Algorithm Subspace Analysis Results Discussion Typical Characteristics of Anomaly Limitation of Volume Entropy Based versus Volume Based Fraud Detection Epidemeology Anomaly Detection in Climate and Weather Anomalies in Climate Validation of Anomalies
Limitation of Volume
Figure source [22]
Port scan anomaly (traffic feature changes however traffic volume
remains more or less the same)
We can use entropy tocapture the variationsin the traffic feature
bullTakes value 0 when distribution is maximally concentratedbullTakes value log2N when distribution is maximally dispersed
But stands out in
feature entropy
which also reveals
its structure
Port scan
dwarfed
in volume
metricshellip
Chawla and Chandola Anomaly Detection
Introduction Data Mining Methods Density-based anomaly Commute Time Approach Addressing Scalability Anomalies in Complex Data Evaluating Anomaly Detection Methods Applications Problem solutionsPCA and Subspace Method Subspace Method Algorithm Subspace Analysis Results Discussion Typical Characteristics of Anomaly Limitation of Volume Entropy Based versus Volume Based Fraud Detection Epidemeology Anomaly Detection in Climate and Weather Anomalies in Climate Validation of Anomalies
Entropy Based versus Volume Based
DoSDDoS Attacks- a spike in traffic data toward adominant destination IP
Scan anomaly-a spike in traffic data from a dominant sourceIP
Flash Crowd anomaly- again a spike in traffic data to adominant destination IP
Worm anomaly-a Spike in traffic with a dominant port
Chawla and Chandola Anomaly Detection
Introduction Data Mining Methods Density-based anomaly Commute Time Approach Addressing Scalability Anomalies in Complex Data Evaluating Anomaly Detection Methods Applications Problem solutionsPCA and Subspace Method Subspace Method Algorithm Subspace Analysis Results Discussion Typical Characteristics of Anomaly Limitation of Volume Entropy Based versus Volume Based Fraud Detection Epidemeology Anomaly Detection in Climate and Weather Anomalies in Climate Validation of Anomalies
Fraud Detection
Domain Question Identifyfraudulent activities or players fromobserved transaction data
Data Transactions between different
players in the system Meta information about the
individuals An underlying graph structure
Challenges Track and model human behavior Anomalies caused by adaptive
human adversaries Massive data sizes
Insurance (autohealtha)
ClaimantProvider Payer
Telecommunications Customer
Provider
Credit Cards Customer
Supplier Bank
Web Advertising User Advertiser
Publisher
ahttpwwwcheatingculturecompast-cases-of-medicare-fraud
Chawla and Chandola Anomaly Detection
Introduction Data Mining Methods Density-based anomaly Commute Time Approach Addressing Scalability Anomalies in Complex Data Evaluating Anomaly Detection Methods Applications Problem solutionsPCA and Subspace Method Subspace Method Algorithm Subspace Analysis Results Discussion Typical Characteristics of Anomaly Limitation of Volume Entropy Based versus Volume Based Fraud Detection Epidemeology Anomaly Detection in Climate and Weather Anomalies in Climate Validation of Anomalies
A Generic Fraud Detection Method
Activity Monitoring [13]1 Build profiles for individuals (customers users etc) based on
historic data User X makes n calls on an average in January
2 Compare current behavior with historical profile for significantdeviations
Clustering based [4]1 Cluster historical profiles of customers2 Identify small clusters or outlying profiles as anomalies
Strengths Anomaly detection is fast (good for real time) Results are easy to explain
Weaknesses Need to create and maintain a large number of profiles Not dynamic Adequate historical data might not be available Too many false positives
Chawla and Chandola Anomaly Detection
Introduction Data Mining Methods Density-based anomaly Commute Time Approach Addressing Scalability Anomalies in Complex Data Evaluating Anomaly Detection Methods Applications Problem solutionsPCA and Subspace Method Subspace Method Algorithm Subspace Analysis Results Discussion Typical Characteristics of Anomaly Limitation of Volume Entropy Based versus Volume Based Fraud Detection Epidemeology Anomaly Detection in Climate and Weather Anomalies in Climate Validation of Anomalies
Exploiting Graph Structure - Weighted Graphs
Represent data as a weighted graph Communication networks (phone email SMS) Provider referral networks
Objective Identify anomalous nodes
For each node extract several features based on the propertiesof the induced sub-graph (egonet) of neighboring nodes [1]
Choose features that can highlight anomalous nodes
1 Ni degree of node2 Ei number of edges in egonet3 Wi total weight of egonet4 λi principal eigen vector of weighted adjacency matrix of
egonet
Data is transformed into a point in a multi-dimensional space
Chawla and Chandola Anomaly Detection
Introduction Data Mining Methods Density-based anomaly Commute Time Approach Addressing Scalability Anomalies in Complex Data Evaluating Anomaly Detection Methods Applications Problem solutionsPCA and Subspace Method Subspace Method Algorithm Subspace Analysis Results Discussion Typical Characteristics of Anomaly Limitation of Volume Entropy Based versus Volume Based Fraud Detection Epidemeology Anomaly Detection in Climate and Weather Anomalies in Climate Validation of Anomalies
Identifying Anomalies
Traditional anomaly detection (lof) Can be slow but can identify any type of anomalous structure
Faster method to identify specific types of anomalousstructures
Identify relevant feature pairs and power law relationship
Eg Egonet Density Power Law Ni vs Ei - detect nearcliques and stars
Ei prop Nαi 1 le α le 2
Anomaly score for node i wrt a pair of features (y = Cxθ)
Si =max(yi Cx
θi )
min(yi Cxθi )lowast log (|yi minus Cxθi |+ 1)
Chawla and Chandola Anomaly Detection
Introduction Data Mining Methods Density-based anomaly Commute Time Approach Addressing Scalability Anomalies in Complex Data Evaluating Anomaly Detection Methods Applications Problem solutionsPCA and Subspace Method Subspace Method Algorithm Subspace Analysis Results Discussion Typical Characteristics of Anomaly Limitation of Volume Entropy Based versus Volume Based Fraud Detection Epidemeology Anomaly Detection in Climate and Weather Anomalies in Climate Validation of Anomalies
Exploiting Graph Structure - Bipartite Graphs
Represent data as a bipartite graph Healthcare Data (Beneficiaries vs Providers) Insider trading (Traders vs Stocks)
Objective Identify anomalous links
Given a query node a isin V1 find the ldquorelevancerdquoof all other nodes in V1 to a
RelevanceScore(a b) prop Number of times aldquorandom walkrdquo from a reaches b
Use the relevance scores to compute thenormality scores for a node t isin V2
Find set St = a|〈a t〉 isin E Compute |St| times |St| similarity matrix using
relevance vectors for a isin St Normality Score = mean of non-diagonal entries
of similarity matrix
V1 E V2a1
a2
a3
an
t1
t2
t3
tn
Chawla and Chandola Anomaly Detection
Introduction Data Mining Methods Density-based anomaly Commute Time Approach Addressing Scalability Anomalies in Complex Data Evaluating Anomaly Detection Methods Applications Problem solutionsPCA and Subspace Method Subspace Method Algorithm Subspace Analysis Results Discussion Typical Characteristics of Anomaly Limitation of Volume Entropy Based versus Volume Based Fraud Detection Epidemeology Anomaly Detection in Climate and Weather Anomalies in Climate Validation of Anomalies
Detecting Disease Outbreaks
Domain Question Early detection of disease
outbreaks Anthrax attack
Data Emergency department visits Grocery data (Example [14]) Clinical visits Weatherclimate data
Challenges Weak signals in the data
ED cases involving cough rArrFlu or SARS
Integration of multiple signals(lag analysis)
Account for spatial and temporalcorrelations
Chawla and Chandola Anomaly Detection
Introduction Data Mining Methods Density-based anomaly Commute Time Approach Addressing Scalability Anomalies in Complex Data Evaluating Anomaly Detection Methods Applications Problem solutionsPCA and Subspace Method Subspace Method Algorithm Subspace Analysis Results Discussion Typical Characteristics of Anomaly Limitation of Volume Entropy Based versus Volume Based Fraud Detection Epidemeology Anomaly Detection in Climate and Weather Anomalies in Climate Validation of Anomalies
Whatrsquos Significant About Recent Events (WSARE) [33]
1 Learn Bayesian network from historical data Environmental and response variables
2 Sample from the BN (DBbaseline|Current Environment)3 Compute contingency table for rules for DBbaseline andDBcurrent
Rules are single assignment rules (Xi = Y ji ) or conjunctions4 Find p-value for rules using χ2-test
Null Hypothesis Rows and columns of tables for DBbaselineand DBcurrent are independent
5 Find rule with largest p-value Repeat Step 2
Chawla and Chandola Anomaly Detection
Introduction Data Mining Methods Density-based anomaly Commute Time Approach Addressing Scalability Anomalies in Complex Data Evaluating Anomaly Detection Methods Applications Problem solutionsPCA and Subspace Method Subspace Method Algorithm Subspace Analysis Results Discussion Typical Characteristics of Anomaly Limitation of Volume Entropy Based versus Volume Based Fraud Detection Epidemeology Anomaly Detection in Climate and Weather Anomalies in Climate Validation of Anomalies
Incorporating Spatial and Temporal Relationships
WSARE does not explicitly model the spatial and temporalrelationships
What happened yesterday What happened in the adjoining neighborhood (yesterday)
Bayesian Network Spatio-Temporal (BNST) modelingframework [17]
Add nodes for temporal and spatial dependencies Need more data to train
Chawla and Chandola Anomaly Detection
Introduction Data Mining Methods Density-based anomaly Commute Time Approach Addressing Scalability Anomalies in Complex Data Evaluating Anomaly Detection Methods Applications Problem solutionsPCA and Subspace Method Subspace Method Algorithm Subspace Analysis Results Discussion Typical Characteristics of Anomaly Limitation of Volume Entropy Based versus Volume Based Fraud Detection Epidemeology Anomaly Detection in Climate and Weather Anomalies in Climate Validation of Anomalies
Anomaly Detection in Climate and Weather
Science Questions Identify natural and anthropogenic disasters Identify long time scale events - droughts atmospheric rivers
cold fronts etc
Data Ground observations Remote sensing data (satellites
air-borne) Climate model simulation outputs Multiple variables spatio-temporal (often has height dimension
as well)
Challenges Model spatio-temporal relationships across multiple variables Explain the cause of anomalies Massive data sizes
Climate and weather extreme events are well defined
Key challenge is to find significant events and explain the cause
Chawla and Chandola Anomaly Detection
Introduction Data Mining Methods Density-based anomaly Commute Time Approach Addressing Scalability Anomalies in Complex Data Evaluating Anomaly Detection Methods Applications Problem solutionsPCA and Subspace Method Subspace Method Algorithm Subspace Analysis Results Discussion Typical Characteristics of Anomaly Limitation of Volume Entropy Based versus Volume Based Fraud Detection Epidemeology Anomaly Detection in Climate and Weather Anomalies in Climate Validation of Anomalies
Anomalies are Widely Used in Climate
Most analysis done on ldquoanomalyrdquo time series
Difference from a ldquobase periodrdquo (Toosimplistic)
Brings spatial smoothness (eg a mountaintop and nearby valley can have very differenttemperatures) Removes seasonality
Understand climate and weatherphenomenon
Southern Oscillation Index (SOI) Difference between Sea Level Pressure
(SLP) anomalies for Tahiti and DarwinAustralia
Figure Global AverageTemperature Anomaly(1975 - 2007) Srcwwwmetofficegovuk
Chawla and Chandola Anomaly Detection
Introduction Data Mining Methods Density-based anomaly Commute Time Approach Addressing Scalability Anomalies in Complex Data Evaluating Anomaly Detection Methods Applications Problem solutionsPCA and Subspace Method Subspace Method Algorithm Subspace Analysis Results Discussion Typical Characteristics of Anomaly Limitation of Volume Entropy Based versus Volume Based Fraud Detection Epidemeology Anomaly Detection in Climate and Weather Anomalies in Climate Validation of Anomalies
Constructing Anomalies from Raw Data
Anomaly time series for a given location i
vprimei = vi minus bi
where bi is the base (reference)
How to choose bi Mean of all data for location i Monthly mean values (account for seasonality) Monthly z-score values Median (more robust) Using a shorter ldquoreference periodrdquo
30 year moving window
Different methods show statistically significant differences[19] What is the right strategy Weighted mean of different strategies (Pick weights using
Monte Carlo sampling)
Chawla and Chandola Anomaly Detection
Introduction Data Mining Methods Density-based anomaly Commute Time Approach Addressing Scalability Anomalies in Complex Data Evaluating Anomaly Detection Methods Applications Problem solutionsPCA and Subspace Method Subspace Method Algorithm Subspace Analysis Results Discussion Typical Characteristics of Anomaly Limitation of Volume Entropy Based versus Volume Based Fraud Detection Epidemeology Anomaly Detection in Climate and Weather Anomalies in Climate Validation of Anomalies
Anomaly Detection for Identifying Droughts
Science question Identify significant drought patterns usinghistorical observation data or future simulation data or both
Find persistent spatiotemporal anomalies in precipitation data
A two step approach
1 Find precipitationanomalies usingthresholds
2 Find large connectedcomponents across spaceand time
Matlab - bwlabelbwlabeln
Followup Science questionExplain cause
(drought190120061avi)
Figure Video courtsey Dr ArindamBanerjee
Chawla and Chandola Anomaly Detection
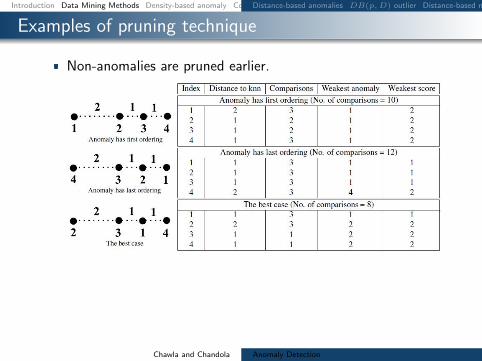
Introduction Data Mining Methods Density-based anomaly Commute Time Approach Addressing Scalability Anomalies in Complex Data Evaluating Anomaly Detection Methods Applications Problem solutionsDistance-based anomalies DB(pD) outlier Distance-based methods (DB(kN) Pruning rule Examples of pruning technique Strengths and weaknesses - Distance-based techniques
Examples of pruning technique
Non-anomalies are pruned earlier
Chawla and Chandola Anomaly Detection
Introduction Data Mining Methods Density-based anomaly Commute Time Approach Addressing Scalability Anomalies in Complex Data Evaluating Anomaly Detection Methods Applications Problem solutionsDistance-based anomalies DB(pD) outlier Distance-based methods (DB(kN) Pruning rule Examples of pruning technique Strengths and weaknesses - Distance-based techniques
Strengths and weaknesses - Distance-based techniques
Do not make any assumption about the distribution of thedata
Scalable for large dataset (O(n))
Capable of finding only global anomalies
Can lead to non-intuitive results in Top-k situations
0 10 20 30 40 50 60 700
10
20
30
40
50
60
70
dimension 1
dim
en
sio
n 2
p1
p2
p3
p4
Chawla and Chandola Anomaly Detection
Introduction Data Mining Methods Density-based anomaly Commute Time Approach Addressing Scalability Anomalies in Complex Data Evaluating Anomaly Detection Methods Applications Problem solutionsDensity-based anomaly Strengths and Weaknesses
Density-based anomaly
Calculate the density of an object based on the density of itsk nearest neighbours
density(p) = 1
sum
qisinNk(p)distk(p q)
|Nk(p)|
relative-density(p) =
density(p)1
|Nk(p)|sum
qisinNk(p)density(q)
anomaly-score(p) =1
relative-density(p)
LOF indicates a degree of local outlier-ness [6]
Chawla and Chandola Anomaly Detection
Introduction Data Mining Methods Density-based anomaly Commute Time Approach Addressing Scalability Anomalies in Complex Data Evaluating Anomaly Detection Methods Applications Problem solutionsDensity-based anomaly Strengths and Weaknesses
Strengths and Weaknesses
Can detect global and local anomalies
Cannot use pruning technique and has a complexity of O(n2)
Require a method combining the strengths of distance anddensity based approaches A distance based approach whichcan capture density
C
C
O
O1
1
2
2
Chawla and Chandola Anomaly Detection
Introduction Data Mining Methods Density-based anomaly Commute Time Approach Addressing Scalability Anomalies in Complex Data Evaluating Anomaly Detection Methods Applications Problem solutionsCommute time Computation of commute time Anomaly detection using commute time (CDOF) Fast estimation of commute time Scalability for Density-based method PINN Algorithm (ICDM 2010) PINN Guarantee Examples high-dim distance-based outliers Examples high-dim density-based outliers Examples local density-based outliers
Commute time
Commute time between i and j is the expected number ofsteps that a random walk starting at i will take to reach jonce and go back to i for the first time
Commute time can capture both the distance between pointsand the data densities
Chawla and Chandola Anomaly Detection
Introduction Data Mining Methods Density-based anomaly Commute Time Approach Addressing Scalability Anomalies in Complex Data Evaluating Anomaly Detection Methods Applications Problem solutionsCommute time Computation of commute time Anomaly detection using commute time (CDOF) Fast estimation of commute time Scalability for Density-based method PINN Algorithm (ICDM 2010) PINN Guarantee Examples high-dim distance-based outliers Examples high-dim density-based outliers Examples local density-based outliers
Computation of commute time
Commute time can be computed using graph Laplacian matrixL
cij = VG(ei minus ej)TL+(ei minus ej)L+ pseudo-inverse of LVG graph volumeei i-th column of the identity matrix
Commute time is Euclidean distance in the space spanned byeigenvectors of L
cij = VG[(Sminus12V T )(ei minus ej)]T [(Sminus12V T )(ei minus ej)]
V S eigenvectors and eigenvalues of L
Chawla and Chandola Anomaly Detection
Introduction Data Mining Methods Density-based anomaly Commute Time Approach Addressing Scalability Anomalies in Complex Data Evaluating Anomaly Detection Methods Applications Problem solutionsCommute time Computation of commute time Anomaly detection using commute time (CDOF) Fast estimation of commute time Scalability for Density-based method PINN Algorithm (ICDM 2010) PINN Guarantee Examples high-dim distance-based outliers Examples high-dim density-based outliers Examples local density-based outliers
Anomaly detection using commute time (CDOF)
Construct the mutual k nearest neighbor graph G from thedataset
Compute the Laplacian matrix L of G and its eigensystems
Find top N anomalies using the distance-based technique incommute time with pruning rule
Complexity O(n3)
Commute time method can detect global local and groupanomalies
Chawla and Chandola Anomaly Detection
Introduction Data Mining Methods Density-based anomaly Commute Time Approach Addressing Scalability Anomalies in Complex Data Evaluating Anomaly Detection Methods Applications Problem solutionsCommute time Computation of commute time Anomaly detection using commute time (CDOF) Fast estimation of commute time Scalability for Density-based method PINN Algorithm (ICDM 2010) PINN Guarantee Examples high-dim distance-based outliers Examples high-dim density-based outliers Examples local density-based outliers
Fast estimation of commute time
Speilman and Srivastava [31] combined random projection anda linear time solver to build a structure where we can computethe compute time between two nodes in O(log n) time
Complexity of CDOF O(n3)rarr O(n log n)
Uses a near linear time solver for a linear system of equationAx = b
Spielman and Teng solvers Also see work by Iannis Koutisfrom CMU
Chawla and Chandola Anomaly Detection
Introduction Data Mining Methods Density-based anomaly Commute Time Approach Addressing Scalability Anomalies in Complex Data Evaluating Anomaly Detection Methods Applications Problem solutionsCommute time Computation of commute time Anomaly detection using commute time (CDOF) Fast estimation of commute time Scalability for Density-based method PINN Algorithm (ICDM 2010) PINN Guarantee Examples high-dim distance-based outliers Examples high-dim density-based outliers Examples local density-based outliers
Scalability for Density-based method
The pruning rule for Distance-based methods does not applyto Density-based approaches
We can go from O(n2) to nearly O(n log n) by using an index
One solution for the curse of high dimensionality is to use ofrandom projections
Chawla and Chandola Anomaly Detection
Introduction Data Mining Methods Density-based anomaly Commute Time Approach Addressing Scalability Anomalies in Complex Data Evaluating Anomaly Detection Methods Applications Problem solutionsCommute time Computation of commute time Anomaly detection using commute time (CDOF) Fast estimation of commute time Scalability for Density-based method PINN Algorithm (ICDM 2010) PINN Guarantee Examples high-dim distance-based outliers Examples high-dim density-based outliers Examples local density-based outliers
PINN Algorithm (ICDM 2010)
Chawla and Chandola Anomaly Detection
Introduction Data Mining Methods Density-based anomaly Commute Time Approach Addressing Scalability Anomalies in Complex Data Evaluating Anomaly Detection Methods Applications Problem solutionsCommute time Computation of commute time Anomaly detection using commute time (CDOF) Fast estimation of commute time Scalability for Density-based method PINN Algorithm (ICDM 2010) PINN Guarantee Examples high-dim distance-based outliers Examples high-dim density-based outliers Examples local density-based outliers
PINN Guarantee
The PINN Algorithm provides probabilistic guarantees
Under certain assumptions about intrinsic dimensionality (c)with high probability
1minus ε1 + ε
middot LOF (p) le LOF (p) le 1 + ε
1minus ε middot LOF (p)
In practice we do not know the intrinsic dimensionality ofdata However random projections are quite robust
Chawla and Chandola Anomaly Detection
Introduction Data Mining Methods Density-based anomaly Commute Time Approach Addressing Scalability Anomalies in Complex Data Evaluating Anomaly Detection Methods Applications Problem solutionsCommute time Computation of commute time Anomaly detection using commute time (CDOF) Fast estimation of commute time Scalability for Density-based method PINN Algorithm (ICDM 2010) PINN Guarantee Examples high-dim distance-based outliers Examples high-dim density-based outliers Examples local density-based outliers
Examples high-dim distance-based outliers
On a large database of images the bright images show up asdistance based outliers
Chawla and Chandola Anomaly Detection
Introduction Data Mining Methods Density-based anomaly Commute Time Approach Addressing Scalability Anomalies in Complex Data Evaluating Anomaly Detection Methods Applications Problem solutionsCommute time Computation of commute time Anomaly detection using commute time (CDOF) Fast estimation of commute time Scalability for Density-based method PINN Algorithm (ICDM 2010) PINN Guarantee Examples high-dim distance-based outliers Examples high-dim density-based outliers Examples local density-based outliers
Examples high-dim density-based outliers
On a large database of images occluded images show up asdensity based outliers
Chawla and Chandola Anomaly Detection
Introduction Data Mining Methods Density-based anomaly Commute Time Approach Addressing Scalability Anomalies in Complex Data Evaluating Anomaly Detection Methods Applications Problem solutionsCommute time Computation of commute time Anomaly detection using commute time (CDOF) Fast estimation of commute time Scalability for Density-based method PINN Algorithm (ICDM 2010) PINN Guarantee Examples high-dim distance-based outliers Examples high-dim density-based outliers Examples local density-based outliers
Examples local density-based outliers
Examples of images ranked by LOF
Chawla and Chandola Anomaly Detection
Introduction Data Mining Methods Density-based anomaly Commute Time Approach Addressing Scalability Anomalies in Complex Data Evaluating Anomaly Detection Methods Applications Problem solutions
Addressing Scalability
Chawla and Chandola Anomaly Detection
Introduction Data Mining Methods Density-based anomaly Commute Time Approach Addressing Scalability Anomalies in Complex Data Evaluating Anomaly Detection Methods Applications Problem solutions
Using GPUs for Anomaly Detection
Well suited for data parallel algorithms Using CUDA - Compute Unified Device
Architecture (Nvidia)
Need to re-engineer existing algorithms Utilization of device memory Minimize CPUhArrGPU transfer of data Keep threads homogeneous
Most model based algorithms arenaturally setup for the testing phase
Model building needs careful redesign
What about unsupervised algorithms
Kernel
Host
Grid
Device
Block(00)
Block(01)
Block(02)
Block(10)
Block(11)
Block(12)
Thread Block
Thread(00)
Thread(01)
Thread(02)
Thread(03)
Thread(10)
Thread(11)
Thread(12)
Thread(13)
Thread(20)
Thread(21)
Thread(22)
Thread(23)
Host Host Memory
SM 2
SM 1
SM 0
Registers Registers Registers
SP 0 SP 1 SP 7
Shared Memory
Global Memory
Texture Memory
Constant Memory
Device
Chawla and Chandola Anomaly Detection
Introduction Data Mining Methods Density-based anomaly Commute Time Approach Addressing Scalability Anomalies in Complex Data Evaluating Anomaly Detection Methods Applications Problem solutions
Implementing DB(kN) on GPUs
Return top N data instances whose distances tok-th nearest neighbor are largest (SerialDB(kN) is O(n2))
Involves computing pairwise distances
Load block i and block j to shared memory Data layout in memory should be optimized
Each thread computes distance between a pairof instances
Can utilize this time to load next chunk of datafrom host to device memory
Writes results to corresponding output block
Sorting can be done efficiently in CUDA [29]
d
n
T
n
n
Chawla and Chandola Anomaly Detection
Introduction Data Mining Methods Density-based anomaly Commute Time Approach Addressing Scalability Anomalies in Complex Data Evaluating Anomaly Detection Methods Applications Problem solutionsCategorical Data Discrete Sequences and Time Series Contextual Anomalies Collective Anomalies
Moving Beyond Multi-dimensional Record Data
Categorical (Mixed)
Fraud Detection
Cyber Networks
Time Series
Sensor Networks
Healthcare
Discrete Sequences
Genomic
System Calls
Spatial
GIS
Image analysis
Spatio-temporal
Remote sensing
Climate
Graphs
Social networks
Epidemiology
Chawla and Chandola Anomaly Detection
Introduction Data Mining Methods Density-based anomaly Commute Time Approach Addressing Scalability Anomalies in Complex Data Evaluating Anomaly Detection Methods Applications Problem solutionsCategorical Data Discrete Sequences and Time Series Contextual Anomalies Collective Anomalies
Handling Categorical Data
Each attribute can belong to one of many categories
No ordering between categories
Mixed data (categorical and continuous attributes)
cap-shape cap-surface middot middot middot habitat type
convex smooth urban poisonousconvex smooth grasses ediblebell smooth meadows edibleconvex scaly urban poisonousconvex smooth grasses ediblemiddot middot middot
Table Mushroom Data Set [2]
Chawla and Chandola Anomaly Detection
Introduction Data Mining Methods Density-based anomaly Commute Time Approach Addressing Scalability Anomalies in Complex Data Evaluating Anomaly Detection Methods Applications Problem solutionsCategorical Data Discrete Sequences and Time Series Contextual Anomalies Collective Anomalies
Approaches to Identify Categorical Anomalies
Using Association Analysis [24]
Binarize data
Learn rules (X rArr Y ) Choose high confidence
rules (P (Y |X))
For test record Z = 〈XY 〉find rules of the formP (Y |X)
Y is not observed whenX is observed
Using Bayesian Networks [33]
Learn Bayesian networkstructure and parameters
Compute P (Z) for test datarecord Z
Flag anomaly if P (Z) lt δ
Using Similarity Metrics [10]
Use a similarity measure (S(X1 X2))
Apply distancedensityclustering based method (eg lof)
Chawla and Chandola Anomaly Detection
Introduction Data Mining Methods Density-based anomaly Commute Time Approach Addressing Scalability Anomalies in Complex Data Evaluating Anomaly Detection Methods Applications Problem solutionsCategorical Data Discrete Sequences and Time Series Contextual Anomalies Collective Anomalies
Conditional Probability Test [18]
Identify unusual combinations of attribute values
r(at bt) =P (at bt)
P (at)P (bt)
A capB = φ Assumption If r(at bt) is low and is observed in test record t
then t is anomalous For a test record t
For each mutually exclusive pair of attribute sets ABcompute r(at bt)
Score t based on all r-values Assign minimum r-value as score Take product of all r-values
Need to compare exponential pairs of subsets Only consider subsets upto size k Ignore subsets with frequency less than a threshold α Avoid comparing independent subsets of attributes
micro(AB) ge βmicroChawla and Chandola Anomaly Detection
Introduction Data Mining Methods Density-based anomaly Commute Time Approach Addressing Scalability Anomalies in Complex Data Evaluating Anomaly Detection Methods Applications Problem solutionsCategorical Data Discrete Sequences and Time Series Contextual Anomalies Collective Anomalies
Estimating Probabilities for CPT [18]
Maximum LikelihoodEstimation
P (at bt)
P (at)P (bt)=C(at bt)
Ntimes N
C(at)times N
C(bt)
C(at) Number of traininginstances with A = at
N Total number of traininginstances
Laplace Smoothing
E(p) =C(p) + 1
N + 2
r(at bt) =E(at bt)
E(at)times E(bt)
Speedup Tricks
Replace rare attributevalues with genericattribute (reduce arity)
Use efficient datastructure to querying forcounts(AD Trees [26])
ADTrees work fasterfor low arity attributes
Chawla and Chandola Anomaly Detection
Introduction Data Mining Methods Density-based anomaly Commute Time Approach Addressing Scalability Anomalies in Complex Data Evaluating Anomaly Detection Methods Applications Problem solutionsCategorical Data Discrete Sequences and Time Series Contextual Anomalies Collective Anomalies
Finding Anomalies in Discrete Sequences
Many problem formulations
1 Anomalous symbols in asequence
2 Anomalous subsequence in asequence
3 Anomalous sequence in adatabase of sequences
See [11] for a comparativeevaluation [9] for a survey
login pwdmail ssh mail web logoutlogin pwdmail web web web web logoutlogin pwdmail ssh mail web web logoutlogin pwdwebmail ssh webmail logoutloginpwd loginpwd loginpwd logout
Chawla and Chandola Anomaly Detection
Introduction Data Mining Methods Density-based anomaly Commute Time Approach Addressing Scalability Anomalies in Complex Data Evaluating Anomaly Detection Methods Applications Problem solutionsCategorical Data Discrete Sequences and Time Series Contextual Anomalies Collective Anomalies
Treating Sequences as Points
Utilize a distancesimilarity measure Plug into a distancedensityclustering based method
Simplest Hamming Distance
h(Ai Bi) = 1 Ai 6= Bi= 0 Ai = Bi
H(AB) =nsumi=1
h(Ai Bi)
Issues Unequal lengths misalignment Normalized Length of Longest Common Subsequence
D(AB) = 1minus |LCS(AB)|radic|A||B|
Standard Dynamic Programming method is slow Faster versions available (Hunt Szymnaski method [7])
Weaknesses Cannot localize anomalies within a sequence Weak anomaly signals might get lost
Chawla and Chandola Anomaly Detection
Introduction Data Mining Methods Density-based anomaly Commute Time Approach Addressing Scalability Anomalies in Complex Data Evaluating Anomaly Detection Methods Applications Problem solutionsCategorical Data Discrete Sequences and Time Series Contextual Anomalies Collective Anomalies
Using Sliding Windows
Slide a window of size k
Extract all windows from a sequence (nminus k + 1)
Training (Creating a normal dictionary) Store all uniquewindows in all normal sequences and their counts
Testing For each window find the frequency in normal dictionary Anomaly score is inverse of the aggregate frequencies for all
windows (normalized by length)
Many variants exist For each window find the hamming distance to the closest
window in the normal dictionary [16]
Issues Penalizes low frequency windows in the normal dictionary Rewards high frequency windows that might not be relevant Can construct anomalous sequences that will escape detection
Chawla and Chandola Anomaly Detection
Introduction Data Mining Methods Density-based anomaly Commute Time Approach Addressing Scalability Anomalies in Complex Data Evaluating Anomaly Detection Methods Applications Problem solutionsCategorical Data Discrete Sequences and Time Series Contextual Anomalies Collective Anomalies
Using Probabilistic Models
Probability of occurrence of sequence S
P (S) =nprodi=1
P (Si|S1 Siminus1)
Short memory property of sequences
P (Si|S1 Siminus1) = P (Si|Siminusk Siminus1)
Conditional probability estimates for a symbol Si
P (Si|Siminusk Siminus1) =f(Si|Siminusk Si)f(Si|Siminusk Siminus1)
f is estimated from the normal dictionary
Anomaly score for a test sequence is inverse of the normalizedprobability of occurrence
Issues What if the suffix occurs very infrequently in thenormal data (or not at all)
Replace with the longest suffix that occurs sufficient number oftimes [32] - Probabilistic Suffix Trees
Significantly reduces the size of the modelChawla and Chandola Anomaly Detection
Introduction Data Mining Methods Density-based anomaly Commute Time Approach Addressing Scalability Anomalies in Complex Data Evaluating Anomaly Detection Methods Applications Problem solutionsCategorical Data Discrete Sequences and Time Series Contextual Anomalies Collective Anomalies
Finding Contextual Anomalies
Sometimes contextual information isavailable about data
Not used directly as a feature Are well understood no anomalies in
the context Can reduce false positives and yield
interesting anomalies
Example adapted from [30]
Clearest Outlier
Conditional Anomaly
Maximum Daily Temperature
Number
ofFever
Cases
Contextual anomalies - Anomalous with respect to a context Context is defined using environmental variables
Spatial (Latitude Longitude) Graph context (Edges Weights) Temporal location Domain specific (Demographic other)
How to incorporate context Reduce to traditional anomaly detection (subset on context) Explicitly model contextual information (time series spatial)
Chawla and Chandola Anomaly Detection
Introduction Data Mining Methods Density-based anomaly Commute Time Approach Addressing Scalability Anomalies in Complex Data Evaluating Anomaly Detection Methods Applications Problem solutionsCategorical Data Discrete Sequences and Time Series Contextual Anomalies Collective Anomalies
Conditional Anomaly Detection
Data instance d rArru1 u2 udU v1 v2 vdV
dU environmentalattributes
dV indicator attributes u1
u2
U1
U2
U3
v1
v2
V1V2
V3
p(V1|U3) = 02
p(V2|U3) = 02
p(V3|U3) = 06
Algorithm [30]
1 Learn a Gaussian Mixture Model (GMM)U = U1 U2 UnU
each with dimensionality dU2 Learn a set of Gaussians U = V1 V2 VnV
each withdimensionality dV
3 Learn a probabilistic mapping function p(Vj |Ui)4 Score a test instance d = [uv]
S =
nUsumi=1
p(u|Ui)nVsumj=1
p(v|Vj)p(Vj |Ui)
Chawla and Chandola Anomaly Detection
Introduction Data Mining Methods Density-based anomaly Commute Time Approach Addressing Scalability Anomalies in Complex Data Evaluating Anomaly Detection Methods Applications Problem solutionsCategorical Data Discrete Sequences and Time Series Contextual Anomalies Collective Anomalies
Finding Collective Anomalies
Find a collection of data points
Each point by itself is normal
The collection as a whole isanomalous
Relevant when data has inherentstructure and
When domain definition ofanomalies cannot be described aspoint anomalies
A Simple Solution
1 Break data intogroups
2 Compute features foreach group
3 Apply traditionalanomaly detection
Examples
1 Time series
2 Image
3 Spatial clusters ofgalaxies
Chawla and Chandola Anomaly Detection
Introduction Data Mining Methods Density-based anomaly Commute Time Approach Addressing Scalability Anomalies in Complex Data Evaluating Anomaly Detection Methods Applications Problem solutionsCategorical Data Discrete Sequences and Time Series Contextual Anomalies Collective Anomalies
Using Latent Dirichlet Allocation for Group Anomalies
Find anomalous groups in data [34]
Example Spatial clusters of galaxies topics red green emissive words continuous features
Flexible Genre Model (FGM)
For each group
1 Draw a genre 1 2 T 3 ym simM(π)2 Draw topic distribution forym SK 3 θm sim Dir(αym)
3 Draw K topicsβmk sim P (βmk|ηk)k=12K
4 For each point in group
1 Draw topic membershipzmn simM(θn)
2 Generate pointxmn isin P (xmn|βmzmn)
α
zmn
xmn
N
θm
T
π
ηK
ym
β
MK
Model Parameters
M(π) -Multinomial
Genre - Dir(αt)
Topic generatorsP (|ηk)- GIW
Point generatorsP (xmn|βnk) -MultivariateGaussian
Chawla and Chandola Anomaly Detection
Introduction Data Mining Methods Density-based anomaly Commute Time Approach Addressing Scalability Anomalies in Complex Data Evaluating Anomaly Detection Methods Applications Problem solutionsCategorical Data Discrete Sequences and Time Series Contextual Anomalies Collective Anomalies
Inference and Testing for FGM
Inference and Learning Parameters
Approximate inference of latentvariables (Gibbs Sampling)
Use samples to learn parameters(Single step Monte Carlo EM)
Topic 1
Topic 2
Topic 3
Anomaly Detection
Infer the topic distribution θm
Compute negative log likelihood wrt αt
Rationale An anomalous group will be unlikely to begenerated from any genre
Geometric interpretation Mapping each group into a Tdimensional space and finding anomalies
Chawla and Chandola Anomaly Detection
Introduction Data Mining Methods Density-based anomaly Commute Time Approach Addressing Scalability Anomalies in Complex Data Evaluating Anomaly Detection Methods Applications Problem solutions
Evaluating Anomaly Detection Methods - Labels
Labeled validation data set exists Confusion matrix Traditional evaluation metrics
Class imbalance
ROC Curve
Validation set does not exist Use domain expertise to find TP
and FP FN is harder to estimate
Pseudo false negativeestimation techniques [25]
Predicteda n
Actuala TP FNn FP TN
Acc =TP + TNsum
Rec (R) =TP
TP + FN
Prec (P ) =TP
TP + FP
F =2 lowastR lowast PR+ P
Chawla and Chandola Anomaly Detection
Introduction Data Mining Methods Density-based anomaly Commute Time Approach Addressing Scalability Anomalies in Complex Data Evaluating Anomaly Detection Methods Applications Problem solutions
Evaluating Anomaly Detection Methods - Scores
Convert to binary output Use threshold δ on score (Scale
issues [21]) Take top x as anomalies
ROC curve by varying x or δ
Quality of output Does the output ldquosuggestrdquo x or δ Which output is better
Chawla and Chandola Anomaly Detection
Introduction Data Mining Methods Density-based anomaly Commute Time Approach Addressing Scalability Anomalies in Complex Data Evaluating Anomaly Detection Methods Applications Problem solutions
Unifying Scores
Different methods assign scores in differentranges
kNN-based scores [0 1] Lof scores [1 6] ABOD scores [0 80000]
Anomalies have lower scores
Direct scaling to [0 1] might lose distinctionbetween normal and anomalies
Desired scaling Stretch interesting rangesand shrink irrelevant ones
Generalized Procedure for Normalizing Outlier Scores [21] Regularity rArr S(o) ge 0forallo S(o) asymp 0 if o is normal andS(o) 0 if o is anomalous
Normality S is regular and S(o) isin [0 1]forallo
Chawla and Chandola Anomaly Detection
Introduction Data Mining Methods Density-based anomaly Commute Time Approach Addressing Scalability Anomalies in Complex Data Evaluating Anomaly Detection Methods Applications Problem solutions
Regularization and Normalization of Scores
Regularization
1 R(o) = max0 S(o)minus baseS2 R(o) = Smax minus S(o)
3 R(o) = minus log SmaxS(o)
Normalization
1 N(o) = S(o)Smax
2 N(o) = max(
0 erf(S(o)minusmicroSσS radic2
))(Gaussian Scaling)
Suited for high dimensional data
3 N(o) = max(
0cdfγS (o)minusmicroγ
1minusmicroγ
)(Gamma Scaling)
Where cdfγS (o) = P (k S(o) θ) P is the regularized Gamma function Suited for low dimensional data
Chawla and Chandola Anomaly Detection
Introduction Data Mining Methods Density-based anomaly Commute Time Approach Addressing Scalability Anomalies in Complex Data Evaluating Anomaly Detection Methods Applications Problem solutions
Generating Labeled Data for Validation
Generating Both Normal and Anomalous Data
Use generative models for normal and anomalous behavior
Several generators available Multivariate continuous data [27] Multivariate categorical data [5] Discrete sequences using HMM [12]
Drawbacks Might not capture the domain characteristics
Injecting Anomalies - Random Perturbation[30]
Given data point z = xy x and y arepartitions of feature space
Take a random sample D of the entire data set
Let zprime = xprimeyprime isin D such that distancebetween y and yprime is maximum
Replace x with xprime and add z back to data setx
yz
zprime
Injected anomaly
Chawla and Chandola Anomaly Detection
Introduction Data Mining Methods Density-based anomaly Commute Time Approach Addressing Scalability Anomalies in Complex Data Evaluating Anomaly Detection Methods Applications Problem solutionsWhat is Network Anomaly Detection Motivation How Much Serious
Applications Overview
How to set up an anomaly detection solution for agiven application domain
Available data Define anomalies define normal behavior Identify requirements and constraints (online
real-time limited resources) What domain knowledge available
Feature identification Defining normal and anomalous behavior Tuning parameters
Available ground truth (training validation)
Chawla and Chandola Anomaly Detection
Introduction Data Mining Methods Density-based anomaly Commute Time Approach Addressing Scalability Anomalies in Complex Data Evaluating Anomaly Detection Methods Applications Problem solutionsWhat is Network Anomaly Detection Motivation How Much Serious
What is Network Anomaly Detection
Anomaly Detection or Intrusion Detection
Traditional Intrusion Detection Systems (IDS) finding attackscorresponding to predefined pattern data set known as signaturestherefore system is absolutely vulnerable against zero-day attacks
Network Anomaly Detection Systems (NADS) to detectzero-day attacks without any pre-identified signature besides profilenormal behavior of the network and address suspected incidents
Network Anomaly Detection finding unusual and largechanges in the network traffic
Examples intentional attacks (eg Distributed Denial ofService - DDoS) or unusual network traffic (eg flash crowds)
Chawla and Chandola Anomaly Detection
Introduction Data Mining Methods Density-based anomaly Commute Time Approach Addressing Scalability Anomalies in Complex Data Evaluating Anomaly Detection Methods Applications Problem solutionsWhat is Network Anomaly Detection Motivation How Much Serious
Motivation How Much Serious
According to Symantec report released in early 2011 morethan 286 million new threats have been detected in 2010which is a huge number
1656227
2704836
1000000
1500000
2000000
2500000
3000000
20547 18827 69107 113025 140690
624267
1656227
2704836
0
500000
1000000
1500000
2000000
2500000
3000000
2002 2003 2004 2005 2006 2007 2008 July2009-June2010
Chawla and Chandola Anomaly Detection
Introduction Data Mining Methods Density-based anomaly Commute Time Approach Addressing Scalability Anomalies in Complex Data Evaluating Anomaly Detection Methods Applications Problem solutionsNetwork Topology Network Anomalies Detection Problem Network Anomalies Detection Problem Why care about OD Flows
Network Topology
A Typical network
1 y
Router
2
3
41t
x2t
x1t
x3t
x4t
Origin-Destination (OD) flow is the traffic that enters at anorigin node and exits at a destination node of a backbonenetwork x1t x1t
Link measurement is the traffic enters at an node during aninterval y1t
Relationship between link traffic and OD flow traffic iscaptured by the routing matrix A
Chawla and Chandola Anomaly Detection
Introduction Data Mining Methods Density-based anomaly Commute Time Approach Addressing Scalability Anomalies in Complex Data Evaluating Anomaly Detection Methods Applications Problem solutionsNetwork Topology Network Anomalies Detection Problem Network Anomalies Detection Problem Why care about OD Flows
Network Anomalies Detection Problem
Chawla and Chandola Anomaly Detection
Introduction Data Mining Methods Density-based anomaly Commute Time Approach Addressing Scalability Anomalies in Complex Data Evaluating Anomaly Detection Methods Applications Problem solutionsNetwork Topology Network Anomalies Detection Problem Network Anomalies Detection Problem Why care about OD Flows
Network Anomalies Detection Problem
Chawla and Chandola Anomaly Detection
Introduction Data Mining Methods Density-based anomaly Commute Time Approach Addressing Scalability Anomalies in Complex Data Evaluating Anomaly Detection Methods Applications Problem solutionsNetwork Topology Network Anomalies Detection Problem Network Anomalies Detection Problem Why care about OD Flows
Why care about OD Flows
Volume anomaly typically arises on an OD flow (trafficarriving at one node and destined for another node)
If we only monitor traffic on network links volume arisingfrom an OD flow may not be noticeable Thus naiveapproach wont work if OD flow info is not available
Figure source [22]
Chawla and Chandola Anomaly Detection
Introduction Data Mining Methods Density-based anomaly Commute Time Approach Addressing Scalability Anomalies in Complex Data Evaluating Anomaly Detection Methods Applications Problem solutionsPCA and Subspace Method Subspace Method Algorithm Subspace Analysis Results Discussion Typical Characteristics of Anomaly Limitation of Volume Entropy Based versus Volume Based Fraud Detection Epidemeology Anomaly Detection in Climate and Weather Anomalies in Climate Validation of Anomalies
PCA and Subspace Method
Chawla and Chandola Anomaly Detection
Introduction Data Mining Methods Density-based anomaly Commute Time Approach Addressing Scalability Anomalies in Complex Data Evaluating Anomaly Detection Methods Applications Problem solutionsPCA and Subspace Method Subspace Method Algorithm Subspace Analysis Results Discussion Typical Characteristics of Anomaly Limitation of Volume Entropy Based versus Volume Based Fraud Detection Epidemeology Anomaly Detection in Climate and Weather Anomalies in Climate Validation of Anomalies
Subspace Method Algorithm
Step1- Determine the PCs based on eigenvaluedecomposition of the covariance matrix of the dataset
Step2- Choose first top k principle components with thehighest eigenvalues as matrix P
Step3-normal traffic subspace called Z
Z = PP TZ = CZ
Step4-abnormal traffic subspace called Z
Z = (I minus PP T )Z = CZ
Step5-If the norm of a vector is large then it is an rdquoanomalyrdquo
Chawla and Chandola Anomaly Detection
Introduction Data Mining Methods Density-based anomaly Commute Time Approach Addressing Scalability Anomalies in Complex Data Evaluating Anomaly Detection Methods Applications Problem solutionsPCA and Subspace Method Subspace Method Algorithm Subspace Analysis Results Discussion Typical Characteristics of Anomaly Limitation of Volume Entropy Based versus Volume Based Fraud Detection Epidemeology Anomaly Detection in Climate and Weather Anomalies in Climate Validation of Anomalies
Subspace Analysis Results
Note that during anomaly normal component does not changethat much while residual component changes quite a lot
Thus anomalies can be detected by setting some threshold
Figure source [22]
Chawla and Chandola Anomaly Detection
Introduction Data Mining Methods Density-based anomaly Commute Time Approach Addressing Scalability Anomalies in Complex Data Evaluating Anomaly Detection Methods Applications Problem solutionsPCA and Subspace Method Subspace Method Algorithm Subspace Analysis Results Discussion Typical Characteristics of Anomaly Limitation of Volume Entropy Based versus Volume Based Fraud Detection Epidemeology Anomaly Detection in Climate and Weather Anomalies in Climate Validation of Anomalies
Discussion Typical Characteristics of Anomaly
Most Anomalies induce a change in distributionalaspects of packet header fields (called features)
Most important features include 5-tuple Source ampdestination IP addresses Source and destination portnumbers and IP protocol
raquo DOS attack ndash multiple source IP address concentrated on asingle destination IP address
raquo Network scan ndash dispersed distribution of destination addresses
raquo Most wormsviruses also induce some change in distribution ofcertain features
raquo However these changes can be very subtle and mining them islike searching for needles in a haystack
Unlike many previous approach this paper aims todetect events which disturb the distribution of trafficfeatures rather than traffic volume
Chawla and Chandola Anomaly Detection
Introduction Data Mining Methods Density-based anomaly Commute Time Approach Addressing Scalability Anomalies in Complex Data Evaluating Anomaly Detection Methods Applications Problem solutionsPCA and Subspace Method Subspace Method Algorithm Subspace Analysis Results Discussion Typical Characteristics of Anomaly Limitation of Volume Entropy Based versus Volume Based Fraud Detection Epidemeology Anomaly Detection in Climate and Weather Anomalies in Climate Validation of Anomalies
Limitation of Volume
Figure source [22]
Port scan anomaly (traffic feature changes however traffic volume
remains more or less the same)
We can use entropy tocapture the variationsin the traffic feature
bullTakes value 0 when distribution is maximally concentratedbullTakes value log2N when distribution is maximally dispersed
But stands out in
feature entropy
which also reveals
its structure
Port scan
dwarfed
in volume
metricshellip
Chawla and Chandola Anomaly Detection
Introduction Data Mining Methods Density-based anomaly Commute Time Approach Addressing Scalability Anomalies in Complex Data Evaluating Anomaly Detection Methods Applications Problem solutionsPCA and Subspace Method Subspace Method Algorithm Subspace Analysis Results Discussion Typical Characteristics of Anomaly Limitation of Volume Entropy Based versus Volume Based Fraud Detection Epidemeology Anomaly Detection in Climate and Weather Anomalies in Climate Validation of Anomalies
Entropy Based versus Volume Based
DoSDDoS Attacks- a spike in traffic data toward adominant destination IP
Scan anomaly-a spike in traffic data from a dominant sourceIP
Flash Crowd anomaly- again a spike in traffic data to adominant destination IP
Worm anomaly-a Spike in traffic with a dominant port
Chawla and Chandola Anomaly Detection
Introduction Data Mining Methods Density-based anomaly Commute Time Approach Addressing Scalability Anomalies in Complex Data Evaluating Anomaly Detection Methods Applications Problem solutionsPCA and Subspace Method Subspace Method Algorithm Subspace Analysis Results Discussion Typical Characteristics of Anomaly Limitation of Volume Entropy Based versus Volume Based Fraud Detection Epidemeology Anomaly Detection in Climate and Weather Anomalies in Climate Validation of Anomalies
Fraud Detection
Domain Question Identifyfraudulent activities or players fromobserved transaction data
Data Transactions between different
players in the system Meta information about the
individuals An underlying graph structure
Challenges Track and model human behavior Anomalies caused by adaptive
human adversaries Massive data sizes
Insurance (autohealtha)
ClaimantProvider Payer
Telecommunications Customer
Provider
Credit Cards Customer
Supplier Bank
Web Advertising User Advertiser
Publisher
ahttpwwwcheatingculturecompast-cases-of-medicare-fraud
Chawla and Chandola Anomaly Detection
Introduction Data Mining Methods Density-based anomaly Commute Time Approach Addressing Scalability Anomalies in Complex Data Evaluating Anomaly Detection Methods Applications Problem solutionsPCA and Subspace Method Subspace Method Algorithm Subspace Analysis Results Discussion Typical Characteristics of Anomaly Limitation of Volume Entropy Based versus Volume Based Fraud Detection Epidemeology Anomaly Detection in Climate and Weather Anomalies in Climate Validation of Anomalies
A Generic Fraud Detection Method
Activity Monitoring [13]1 Build profiles for individuals (customers users etc) based on
historic data User X makes n calls on an average in January
2 Compare current behavior with historical profile for significantdeviations
Clustering based [4]1 Cluster historical profiles of customers2 Identify small clusters or outlying profiles as anomalies
Strengths Anomaly detection is fast (good for real time) Results are easy to explain
Weaknesses Need to create and maintain a large number of profiles Not dynamic Adequate historical data might not be available Too many false positives
Chawla and Chandola Anomaly Detection
Introduction Data Mining Methods Density-based anomaly Commute Time Approach Addressing Scalability Anomalies in Complex Data Evaluating Anomaly Detection Methods Applications Problem solutionsPCA and Subspace Method Subspace Method Algorithm Subspace Analysis Results Discussion Typical Characteristics of Anomaly Limitation of Volume Entropy Based versus Volume Based Fraud Detection Epidemeology Anomaly Detection in Climate and Weather Anomalies in Climate Validation of Anomalies
Exploiting Graph Structure - Weighted Graphs
Represent data as a weighted graph Communication networks (phone email SMS) Provider referral networks
Objective Identify anomalous nodes
For each node extract several features based on the propertiesof the induced sub-graph (egonet) of neighboring nodes [1]
Choose features that can highlight anomalous nodes
1 Ni degree of node2 Ei number of edges in egonet3 Wi total weight of egonet4 λi principal eigen vector of weighted adjacency matrix of
egonet
Data is transformed into a point in a multi-dimensional space
Chawla and Chandola Anomaly Detection
Introduction Data Mining Methods Density-based anomaly Commute Time Approach Addressing Scalability Anomalies in Complex Data Evaluating Anomaly Detection Methods Applications Problem solutionsPCA and Subspace Method Subspace Method Algorithm Subspace Analysis Results Discussion Typical Characteristics of Anomaly Limitation of Volume Entropy Based versus Volume Based Fraud Detection Epidemeology Anomaly Detection in Climate and Weather Anomalies in Climate Validation of Anomalies
Identifying Anomalies
Traditional anomaly detection (lof) Can be slow but can identify any type of anomalous structure
Faster method to identify specific types of anomalousstructures
Identify relevant feature pairs and power law relationship
Eg Egonet Density Power Law Ni vs Ei - detect nearcliques and stars
Ei prop Nαi 1 le α le 2
Anomaly score for node i wrt a pair of features (y = Cxθ)
Si =max(yi Cx
θi )
min(yi Cxθi )lowast log (|yi minus Cxθi |+ 1)
Chawla and Chandola Anomaly Detection
Introduction Data Mining Methods Density-based anomaly Commute Time Approach Addressing Scalability Anomalies in Complex Data Evaluating Anomaly Detection Methods Applications Problem solutionsPCA and Subspace Method Subspace Method Algorithm Subspace Analysis Results Discussion Typical Characteristics of Anomaly Limitation of Volume Entropy Based versus Volume Based Fraud Detection Epidemeology Anomaly Detection in Climate and Weather Anomalies in Climate Validation of Anomalies
Exploiting Graph Structure - Bipartite Graphs
Represent data as a bipartite graph Healthcare Data (Beneficiaries vs Providers) Insider trading (Traders vs Stocks)
Objective Identify anomalous links
Given a query node a isin V1 find the ldquorelevancerdquoof all other nodes in V1 to a
RelevanceScore(a b) prop Number of times aldquorandom walkrdquo from a reaches b
Use the relevance scores to compute thenormality scores for a node t isin V2
Find set St = a|〈a t〉 isin E Compute |St| times |St| similarity matrix using
relevance vectors for a isin St Normality Score = mean of non-diagonal entries
of similarity matrix
V1 E V2a1
a2
a3
an
t1
t2
t3
tn
Chawla and Chandola Anomaly Detection
Introduction Data Mining Methods Density-based anomaly Commute Time Approach Addressing Scalability Anomalies in Complex Data Evaluating Anomaly Detection Methods Applications Problem solutionsPCA and Subspace Method Subspace Method Algorithm Subspace Analysis Results Discussion Typical Characteristics of Anomaly Limitation of Volume Entropy Based versus Volume Based Fraud Detection Epidemeology Anomaly Detection in Climate and Weather Anomalies in Climate Validation of Anomalies
Detecting Disease Outbreaks
Domain Question Early detection of disease
outbreaks Anthrax attack
Data Emergency department visits Grocery data (Example [14]) Clinical visits Weatherclimate data
Challenges Weak signals in the data
ED cases involving cough rArrFlu or SARS
Integration of multiple signals(lag analysis)
Account for spatial and temporalcorrelations
Chawla and Chandola Anomaly Detection
Introduction Data Mining Methods Density-based anomaly Commute Time Approach Addressing Scalability Anomalies in Complex Data Evaluating Anomaly Detection Methods Applications Problem solutionsPCA and Subspace Method Subspace Method Algorithm Subspace Analysis Results Discussion Typical Characteristics of Anomaly Limitation of Volume Entropy Based versus Volume Based Fraud Detection Epidemeology Anomaly Detection in Climate and Weather Anomalies in Climate Validation of Anomalies
Whatrsquos Significant About Recent Events (WSARE) [33]
1 Learn Bayesian network from historical data Environmental and response variables
2 Sample from the BN (DBbaseline|Current Environment)3 Compute contingency table for rules for DBbaseline andDBcurrent
Rules are single assignment rules (Xi = Y ji ) or conjunctions4 Find p-value for rules using χ2-test
Null Hypothesis Rows and columns of tables for DBbaselineand DBcurrent are independent
5 Find rule with largest p-value Repeat Step 2
Chawla and Chandola Anomaly Detection
Introduction Data Mining Methods Density-based anomaly Commute Time Approach Addressing Scalability Anomalies in Complex Data Evaluating Anomaly Detection Methods Applications Problem solutionsPCA and Subspace Method Subspace Method Algorithm Subspace Analysis Results Discussion Typical Characteristics of Anomaly Limitation of Volume Entropy Based versus Volume Based Fraud Detection Epidemeology Anomaly Detection in Climate and Weather Anomalies in Climate Validation of Anomalies
Incorporating Spatial and Temporal Relationships
WSARE does not explicitly model the spatial and temporalrelationships
What happened yesterday What happened in the adjoining neighborhood (yesterday)
Bayesian Network Spatio-Temporal (BNST) modelingframework [17]
Add nodes for temporal and spatial dependencies Need more data to train
Chawla and Chandola Anomaly Detection
Introduction Data Mining Methods Density-based anomaly Commute Time Approach Addressing Scalability Anomalies in Complex Data Evaluating Anomaly Detection Methods Applications Problem solutionsPCA and Subspace Method Subspace Method Algorithm Subspace Analysis Results Discussion Typical Characteristics of Anomaly Limitation of Volume Entropy Based versus Volume Based Fraud Detection Epidemeology Anomaly Detection in Climate and Weather Anomalies in Climate Validation of Anomalies
Anomaly Detection in Climate and Weather
Science Questions Identify natural and anthropogenic disasters Identify long time scale events - droughts atmospheric rivers
cold fronts etc
Data Ground observations Remote sensing data (satellites
air-borne) Climate model simulation outputs Multiple variables spatio-temporal (often has height dimension
as well)
Challenges Model spatio-temporal relationships across multiple variables Explain the cause of anomalies Massive data sizes
Climate and weather extreme events are well defined
Key challenge is to find significant events and explain the cause
Chawla and Chandola Anomaly Detection
Introduction Data Mining Methods Density-based anomaly Commute Time Approach Addressing Scalability Anomalies in Complex Data Evaluating Anomaly Detection Methods Applications Problem solutionsPCA and Subspace Method Subspace Method Algorithm Subspace Analysis Results Discussion Typical Characteristics of Anomaly Limitation of Volume Entropy Based versus Volume Based Fraud Detection Epidemeology Anomaly Detection in Climate and Weather Anomalies in Climate Validation of Anomalies
Anomalies are Widely Used in Climate
Most analysis done on ldquoanomalyrdquo time series
Difference from a ldquobase periodrdquo (Toosimplistic)
Brings spatial smoothness (eg a mountaintop and nearby valley can have very differenttemperatures) Removes seasonality
Understand climate and weatherphenomenon
Southern Oscillation Index (SOI) Difference between Sea Level Pressure
(SLP) anomalies for Tahiti and DarwinAustralia
Figure Global AverageTemperature Anomaly(1975 - 2007) Srcwwwmetofficegovuk
Chawla and Chandola Anomaly Detection
Introduction Data Mining Methods Density-based anomaly Commute Time Approach Addressing Scalability Anomalies in Complex Data Evaluating Anomaly Detection Methods Applications Problem solutionsPCA and Subspace Method Subspace Method Algorithm Subspace Analysis Results Discussion Typical Characteristics of Anomaly Limitation of Volume Entropy Based versus Volume Based Fraud Detection Epidemeology Anomaly Detection in Climate and Weather Anomalies in Climate Validation of Anomalies
Constructing Anomalies from Raw Data
Anomaly time series for a given location i
vprimei = vi minus bi
where bi is the base (reference)
How to choose bi Mean of all data for location i Monthly mean values (account for seasonality) Monthly z-score values Median (more robust) Using a shorter ldquoreference periodrdquo
30 year moving window
Different methods show statistically significant differences[19] What is the right strategy Weighted mean of different strategies (Pick weights using
Monte Carlo sampling)
Chawla and Chandola Anomaly Detection
Introduction Data Mining Methods Density-based anomaly Commute Time Approach Addressing Scalability Anomalies in Complex Data Evaluating Anomaly Detection Methods Applications Problem solutionsPCA and Subspace Method Subspace Method Algorithm Subspace Analysis Results Discussion Typical Characteristics of Anomaly Limitation of Volume Entropy Based versus Volume Based Fraud Detection Epidemeology Anomaly Detection in Climate and Weather Anomalies in Climate Validation of Anomalies
Anomaly Detection for Identifying Droughts
Science question Identify significant drought patterns usinghistorical observation data or future simulation data or both
Find persistent spatiotemporal anomalies in precipitation data
A two step approach
1 Find precipitationanomalies usingthresholds
2 Find large connectedcomponents across spaceand time
Matlab - bwlabelbwlabeln
Followup Science questionExplain cause
(drought190120061avi)
Figure Video courtsey Dr ArindamBanerjee
Chawla and Chandola Anomaly Detection
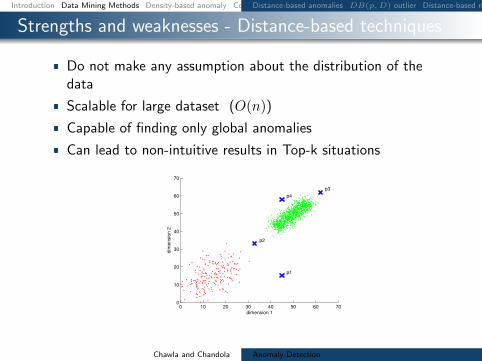
Introduction Data Mining Methods Density-based anomaly Commute Time Approach Addressing Scalability Anomalies in Complex Data Evaluating Anomaly Detection Methods Applications Problem solutionsDistance-based anomalies DB(pD) outlier Distance-based methods (DB(kN) Pruning rule Examples of pruning technique Strengths and weaknesses - Distance-based techniques
Strengths and weaknesses - Distance-based techniques
Do not make any assumption about the distribution of thedata
Scalable for large dataset (O(n))
Capable of finding only global anomalies
Can lead to non-intuitive results in Top-k situations
0 10 20 30 40 50 60 700
10
20
30
40
50
60
70
dimension 1
dim
en
sio
n 2
p1
p2
p3
p4
Chawla and Chandola Anomaly Detection
Introduction Data Mining Methods Density-based anomaly Commute Time Approach Addressing Scalability Anomalies in Complex Data Evaluating Anomaly Detection Methods Applications Problem solutionsDensity-based anomaly Strengths and Weaknesses
Density-based anomaly
Calculate the density of an object based on the density of itsk nearest neighbours
density(p) = 1
sum
qisinNk(p)distk(p q)
|Nk(p)|
relative-density(p) =
density(p)1
|Nk(p)|sum
qisinNk(p)density(q)
anomaly-score(p) =1
relative-density(p)
LOF indicates a degree of local outlier-ness [6]
Chawla and Chandola Anomaly Detection
Introduction Data Mining Methods Density-based anomaly Commute Time Approach Addressing Scalability Anomalies in Complex Data Evaluating Anomaly Detection Methods Applications Problem solutionsDensity-based anomaly Strengths and Weaknesses
Strengths and Weaknesses
Can detect global and local anomalies
Cannot use pruning technique and has a complexity of O(n2)
Require a method combining the strengths of distance anddensity based approaches A distance based approach whichcan capture density
C
C
O
O1
1
2
2
Chawla and Chandola Anomaly Detection
Introduction Data Mining Methods Density-based anomaly Commute Time Approach Addressing Scalability Anomalies in Complex Data Evaluating Anomaly Detection Methods Applications Problem solutionsCommute time Computation of commute time Anomaly detection using commute time (CDOF) Fast estimation of commute time Scalability for Density-based method PINN Algorithm (ICDM 2010) PINN Guarantee Examples high-dim distance-based outliers Examples high-dim density-based outliers Examples local density-based outliers
Commute time
Commute time between i and j is the expected number ofsteps that a random walk starting at i will take to reach jonce and go back to i for the first time
Commute time can capture both the distance between pointsand the data densities
Chawla and Chandola Anomaly Detection
Introduction Data Mining Methods Density-based anomaly Commute Time Approach Addressing Scalability Anomalies in Complex Data Evaluating Anomaly Detection Methods Applications Problem solutionsCommute time Computation of commute time Anomaly detection using commute time (CDOF) Fast estimation of commute time Scalability for Density-based method PINN Algorithm (ICDM 2010) PINN Guarantee Examples high-dim distance-based outliers Examples high-dim density-based outliers Examples local density-based outliers
Computation of commute time
Commute time can be computed using graph Laplacian matrixL
cij = VG(ei minus ej)TL+(ei minus ej)L+ pseudo-inverse of LVG graph volumeei i-th column of the identity matrix
Commute time is Euclidean distance in the space spanned byeigenvectors of L
cij = VG[(Sminus12V T )(ei minus ej)]T [(Sminus12V T )(ei minus ej)]
V S eigenvectors and eigenvalues of L
Chawla and Chandola Anomaly Detection
Introduction Data Mining Methods Density-based anomaly Commute Time Approach Addressing Scalability Anomalies in Complex Data Evaluating Anomaly Detection Methods Applications Problem solutionsCommute time Computation of commute time Anomaly detection using commute time (CDOF) Fast estimation of commute time Scalability for Density-based method PINN Algorithm (ICDM 2010) PINN Guarantee Examples high-dim distance-based outliers Examples high-dim density-based outliers Examples local density-based outliers
Anomaly detection using commute time (CDOF)
Construct the mutual k nearest neighbor graph G from thedataset
Compute the Laplacian matrix L of G and its eigensystems
Find top N anomalies using the distance-based technique incommute time with pruning rule
Complexity O(n3)
Commute time method can detect global local and groupanomalies
Chawla and Chandola Anomaly Detection
Introduction Data Mining Methods Density-based anomaly Commute Time Approach Addressing Scalability Anomalies in Complex Data Evaluating Anomaly Detection Methods Applications Problem solutionsCommute time Computation of commute time Anomaly detection using commute time (CDOF) Fast estimation of commute time Scalability for Density-based method PINN Algorithm (ICDM 2010) PINN Guarantee Examples high-dim distance-based outliers Examples high-dim density-based outliers Examples local density-based outliers
Fast estimation of commute time
Speilman and Srivastava [31] combined random projection anda linear time solver to build a structure where we can computethe compute time between two nodes in O(log n) time
Complexity of CDOF O(n3)rarr O(n log n)
Uses a near linear time solver for a linear system of equationAx = b
Spielman and Teng solvers Also see work by Iannis Koutisfrom CMU
Chawla and Chandola Anomaly Detection
Introduction Data Mining Methods Density-based anomaly Commute Time Approach Addressing Scalability Anomalies in Complex Data Evaluating Anomaly Detection Methods Applications Problem solutionsCommute time Computation of commute time Anomaly detection using commute time (CDOF) Fast estimation of commute time Scalability for Density-based method PINN Algorithm (ICDM 2010) PINN Guarantee Examples high-dim distance-based outliers Examples high-dim density-based outliers Examples local density-based outliers
Scalability for Density-based method
The pruning rule for Distance-based methods does not applyto Density-based approaches
We can go from O(n2) to nearly O(n log n) by using an index
One solution for the curse of high dimensionality is to use ofrandom projections
Chawla and Chandola Anomaly Detection
Introduction Data Mining Methods Density-based anomaly Commute Time Approach Addressing Scalability Anomalies in Complex Data Evaluating Anomaly Detection Methods Applications Problem solutionsCommute time Computation of commute time Anomaly detection using commute time (CDOF) Fast estimation of commute time Scalability for Density-based method PINN Algorithm (ICDM 2010) PINN Guarantee Examples high-dim distance-based outliers Examples high-dim density-based outliers Examples local density-based outliers
PINN Algorithm (ICDM 2010)
Chawla and Chandola Anomaly Detection
Introduction Data Mining Methods Density-based anomaly Commute Time Approach Addressing Scalability Anomalies in Complex Data Evaluating Anomaly Detection Methods Applications Problem solutionsCommute time Computation of commute time Anomaly detection using commute time (CDOF) Fast estimation of commute time Scalability for Density-based method PINN Algorithm (ICDM 2010) PINN Guarantee Examples high-dim distance-based outliers Examples high-dim density-based outliers Examples local density-based outliers
PINN Guarantee
The PINN Algorithm provides probabilistic guarantees
Under certain assumptions about intrinsic dimensionality (c)with high probability
1minus ε1 + ε
middot LOF (p) le LOF (p) le 1 + ε
1minus ε middot LOF (p)
In practice we do not know the intrinsic dimensionality ofdata However random projections are quite robust
Chawla and Chandola Anomaly Detection
Introduction Data Mining Methods Density-based anomaly Commute Time Approach Addressing Scalability Anomalies in Complex Data Evaluating Anomaly Detection Methods Applications Problem solutionsCommute time Computation of commute time Anomaly detection using commute time (CDOF) Fast estimation of commute time Scalability for Density-based method PINN Algorithm (ICDM 2010) PINN Guarantee Examples high-dim distance-based outliers Examples high-dim density-based outliers Examples local density-based outliers
Examples high-dim distance-based outliers
On a large database of images the bright images show up asdistance based outliers
Chawla and Chandola Anomaly Detection
Introduction Data Mining Methods Density-based anomaly Commute Time Approach Addressing Scalability Anomalies in Complex Data Evaluating Anomaly Detection Methods Applications Problem solutionsCommute time Computation of commute time Anomaly detection using commute time (CDOF) Fast estimation of commute time Scalability for Density-based method PINN Algorithm (ICDM 2010) PINN Guarantee Examples high-dim distance-based outliers Examples high-dim density-based outliers Examples local density-based outliers
Examples high-dim density-based outliers
On a large database of images occluded images show up asdensity based outliers
Chawla and Chandola Anomaly Detection
Introduction Data Mining Methods Density-based anomaly Commute Time Approach Addressing Scalability Anomalies in Complex Data Evaluating Anomaly Detection Methods Applications Problem solutionsCommute time Computation of commute time Anomaly detection using commute time (CDOF) Fast estimation of commute time Scalability for Density-based method PINN Algorithm (ICDM 2010) PINN Guarantee Examples high-dim distance-based outliers Examples high-dim density-based outliers Examples local density-based outliers
Examples local density-based outliers
Examples of images ranked by LOF
Chawla and Chandola Anomaly Detection
Introduction Data Mining Methods Density-based anomaly Commute Time Approach Addressing Scalability Anomalies in Complex Data Evaluating Anomaly Detection Methods Applications Problem solutions
Addressing Scalability
Chawla and Chandola Anomaly Detection
Introduction Data Mining Methods Density-based anomaly Commute Time Approach Addressing Scalability Anomalies in Complex Data Evaluating Anomaly Detection Methods Applications Problem solutions
Using GPUs for Anomaly Detection
Well suited for data parallel algorithms Using CUDA - Compute Unified Device
Architecture (Nvidia)
Need to re-engineer existing algorithms Utilization of device memory Minimize CPUhArrGPU transfer of data Keep threads homogeneous
Most model based algorithms arenaturally setup for the testing phase
Model building needs careful redesign
What about unsupervised algorithms
Kernel
Host
Grid
Device
Block(00)
Block(01)
Block(02)
Block(10)
Block(11)
Block(12)
Thread Block
Thread(00)
Thread(01)
Thread(02)
Thread(03)
Thread(10)
Thread(11)
Thread(12)
Thread(13)
Thread(20)
Thread(21)
Thread(22)
Thread(23)
Host Host Memory
SM 2
SM 1
SM 0
Registers Registers Registers
SP 0 SP 1 SP 7
Shared Memory
Global Memory
Texture Memory
Constant Memory
Device
Chawla and Chandola Anomaly Detection
Introduction Data Mining Methods Density-based anomaly Commute Time Approach Addressing Scalability Anomalies in Complex Data Evaluating Anomaly Detection Methods Applications Problem solutions
Implementing DB(kN) on GPUs
Return top N data instances whose distances tok-th nearest neighbor are largest (SerialDB(kN) is O(n2))
Involves computing pairwise distances
Load block i and block j to shared memory Data layout in memory should be optimized
Each thread computes distance between a pairof instances
Can utilize this time to load next chunk of datafrom host to device memory
Writes results to corresponding output block
Sorting can be done efficiently in CUDA [29]
d
n
T
n
n
Chawla and Chandola Anomaly Detection
Introduction Data Mining Methods Density-based anomaly Commute Time Approach Addressing Scalability Anomalies in Complex Data Evaluating Anomaly Detection Methods Applications Problem solutionsCategorical Data Discrete Sequences and Time Series Contextual Anomalies Collective Anomalies
Moving Beyond Multi-dimensional Record Data
Categorical (Mixed)
Fraud Detection
Cyber Networks
Time Series
Sensor Networks
Healthcare
Discrete Sequences
Genomic
System Calls
Spatial
GIS
Image analysis
Spatio-temporal
Remote sensing
Climate
Graphs
Social networks
Epidemiology
Chawla and Chandola Anomaly Detection
Introduction Data Mining Methods Density-based anomaly Commute Time Approach Addressing Scalability Anomalies in Complex Data Evaluating Anomaly Detection Methods Applications Problem solutionsCategorical Data Discrete Sequences and Time Series Contextual Anomalies Collective Anomalies
Handling Categorical Data
Each attribute can belong to one of many categories
No ordering between categories
Mixed data (categorical and continuous attributes)
cap-shape cap-surface middot middot middot habitat type
convex smooth urban poisonousconvex smooth grasses ediblebell smooth meadows edibleconvex scaly urban poisonousconvex smooth grasses ediblemiddot middot middot
Table Mushroom Data Set [2]
Chawla and Chandola Anomaly Detection
Introduction Data Mining Methods Density-based anomaly Commute Time Approach Addressing Scalability Anomalies in Complex Data Evaluating Anomaly Detection Methods Applications Problem solutionsCategorical Data Discrete Sequences and Time Series Contextual Anomalies Collective Anomalies
Approaches to Identify Categorical Anomalies
Using Association Analysis [24]
Binarize data
Learn rules (X rArr Y ) Choose high confidence
rules (P (Y |X))
For test record Z = 〈XY 〉find rules of the formP (Y |X)
Y is not observed whenX is observed
Using Bayesian Networks [33]
Learn Bayesian networkstructure and parameters
Compute P (Z) for test datarecord Z
Flag anomaly if P (Z) lt δ
Using Similarity Metrics [10]
Use a similarity measure (S(X1 X2))
Apply distancedensityclustering based method (eg lof)
Chawla and Chandola Anomaly Detection
Introduction Data Mining Methods Density-based anomaly Commute Time Approach Addressing Scalability Anomalies in Complex Data Evaluating Anomaly Detection Methods Applications Problem solutionsCategorical Data Discrete Sequences and Time Series Contextual Anomalies Collective Anomalies
Conditional Probability Test [18]
Identify unusual combinations of attribute values
r(at bt) =P (at bt)
P (at)P (bt)
A capB = φ Assumption If r(at bt) is low and is observed in test record t
then t is anomalous For a test record t
For each mutually exclusive pair of attribute sets ABcompute r(at bt)
Score t based on all r-values Assign minimum r-value as score Take product of all r-values
Need to compare exponential pairs of subsets Only consider subsets upto size k Ignore subsets with frequency less than a threshold α Avoid comparing independent subsets of attributes
micro(AB) ge βmicroChawla and Chandola Anomaly Detection
Introduction Data Mining Methods Density-based anomaly Commute Time Approach Addressing Scalability Anomalies in Complex Data Evaluating Anomaly Detection Methods Applications Problem solutionsCategorical Data Discrete Sequences and Time Series Contextual Anomalies Collective Anomalies
Estimating Probabilities for CPT [18]
Maximum LikelihoodEstimation
P (at bt)
P (at)P (bt)=C(at bt)
Ntimes N
C(at)times N
C(bt)
C(at) Number of traininginstances with A = at
N Total number of traininginstances
Laplace Smoothing
E(p) =C(p) + 1
N + 2
r(at bt) =E(at bt)
E(at)times E(bt)
Speedup Tricks
Replace rare attributevalues with genericattribute (reduce arity)
Use efficient datastructure to querying forcounts(AD Trees [26])
ADTrees work fasterfor low arity attributes
Chawla and Chandola Anomaly Detection
Introduction Data Mining Methods Density-based anomaly Commute Time Approach Addressing Scalability Anomalies in Complex Data Evaluating Anomaly Detection Methods Applications Problem solutionsCategorical Data Discrete Sequences and Time Series Contextual Anomalies Collective Anomalies
Finding Anomalies in Discrete Sequences
Many problem formulations
1 Anomalous symbols in asequence
2 Anomalous subsequence in asequence
3 Anomalous sequence in adatabase of sequences
See [11] for a comparativeevaluation [9] for a survey
login pwdmail ssh mail web logoutlogin pwdmail web web web web logoutlogin pwdmail ssh mail web web logoutlogin pwdwebmail ssh webmail logoutloginpwd loginpwd loginpwd logout
Chawla and Chandola Anomaly Detection
Introduction Data Mining Methods Density-based anomaly Commute Time Approach Addressing Scalability Anomalies in Complex Data Evaluating Anomaly Detection Methods Applications Problem solutionsCategorical Data Discrete Sequences and Time Series Contextual Anomalies Collective Anomalies
Treating Sequences as Points
Utilize a distancesimilarity measure Plug into a distancedensityclustering based method
Simplest Hamming Distance
h(Ai Bi) = 1 Ai 6= Bi= 0 Ai = Bi
H(AB) =nsumi=1
h(Ai Bi)
Issues Unequal lengths misalignment Normalized Length of Longest Common Subsequence
D(AB) = 1minus |LCS(AB)|radic|A||B|
Standard Dynamic Programming method is slow Faster versions available (Hunt Szymnaski method [7])
Weaknesses Cannot localize anomalies within a sequence Weak anomaly signals might get lost
Chawla and Chandola Anomaly Detection
Introduction Data Mining Methods Density-based anomaly Commute Time Approach Addressing Scalability Anomalies in Complex Data Evaluating Anomaly Detection Methods Applications Problem solutionsCategorical Data Discrete Sequences and Time Series Contextual Anomalies Collective Anomalies
Using Sliding Windows
Slide a window of size k
Extract all windows from a sequence (nminus k + 1)
Training (Creating a normal dictionary) Store all uniquewindows in all normal sequences and their counts
Testing For each window find the frequency in normal dictionary Anomaly score is inverse of the aggregate frequencies for all
windows (normalized by length)
Many variants exist For each window find the hamming distance to the closest
window in the normal dictionary [16]
Issues Penalizes low frequency windows in the normal dictionary Rewards high frequency windows that might not be relevant Can construct anomalous sequences that will escape detection
Chawla and Chandola Anomaly Detection
Introduction Data Mining Methods Density-based anomaly Commute Time Approach Addressing Scalability Anomalies in Complex Data Evaluating Anomaly Detection Methods Applications Problem solutionsCategorical Data Discrete Sequences and Time Series Contextual Anomalies Collective Anomalies
Using Probabilistic Models
Probability of occurrence of sequence S
P (S) =nprodi=1
P (Si|S1 Siminus1)
Short memory property of sequences
P (Si|S1 Siminus1) = P (Si|Siminusk Siminus1)
Conditional probability estimates for a symbol Si
P (Si|Siminusk Siminus1) =f(Si|Siminusk Si)f(Si|Siminusk Siminus1)
f is estimated from the normal dictionary
Anomaly score for a test sequence is inverse of the normalizedprobability of occurrence
Issues What if the suffix occurs very infrequently in thenormal data (or not at all)
Replace with the longest suffix that occurs sufficient number oftimes [32] - Probabilistic Suffix Trees
Significantly reduces the size of the modelChawla and Chandola Anomaly Detection
Introduction Data Mining Methods Density-based anomaly Commute Time Approach Addressing Scalability Anomalies in Complex Data Evaluating Anomaly Detection Methods Applications Problem solutionsCategorical Data Discrete Sequences and Time Series Contextual Anomalies Collective Anomalies
Finding Contextual Anomalies
Sometimes contextual information isavailable about data
Not used directly as a feature Are well understood no anomalies in
the context Can reduce false positives and yield
interesting anomalies
Example adapted from [30]
Clearest Outlier
Conditional Anomaly
Maximum Daily Temperature
Number
ofFever
Cases
Contextual anomalies - Anomalous with respect to a context Context is defined using environmental variables
Spatial (Latitude Longitude) Graph context (Edges Weights) Temporal location Domain specific (Demographic other)
How to incorporate context Reduce to traditional anomaly detection (subset on context) Explicitly model contextual information (time series spatial)
Chawla and Chandola Anomaly Detection
Introduction Data Mining Methods Density-based anomaly Commute Time Approach Addressing Scalability Anomalies in Complex Data Evaluating Anomaly Detection Methods Applications Problem solutionsCategorical Data Discrete Sequences and Time Series Contextual Anomalies Collective Anomalies
Conditional Anomaly Detection
Data instance d rArru1 u2 udU v1 v2 vdV
dU environmentalattributes
dV indicator attributes u1
u2
U1
U2
U3
v1
v2
V1V2
V3
p(V1|U3) = 02
p(V2|U3) = 02
p(V3|U3) = 06
Algorithm [30]
1 Learn a Gaussian Mixture Model (GMM)U = U1 U2 UnU
each with dimensionality dU2 Learn a set of Gaussians U = V1 V2 VnV
each withdimensionality dV
3 Learn a probabilistic mapping function p(Vj |Ui)4 Score a test instance d = [uv]
S =
nUsumi=1
p(u|Ui)nVsumj=1
p(v|Vj)p(Vj |Ui)
Chawla and Chandola Anomaly Detection
Introduction Data Mining Methods Density-based anomaly Commute Time Approach Addressing Scalability Anomalies in Complex Data Evaluating Anomaly Detection Methods Applications Problem solutionsCategorical Data Discrete Sequences and Time Series Contextual Anomalies Collective Anomalies
Finding Collective Anomalies
Find a collection of data points
Each point by itself is normal
The collection as a whole isanomalous
Relevant when data has inherentstructure and
When domain definition ofanomalies cannot be described aspoint anomalies
A Simple Solution
1 Break data intogroups
2 Compute features foreach group
3 Apply traditionalanomaly detection
Examples
1 Time series
2 Image
3 Spatial clusters ofgalaxies
Chawla and Chandola Anomaly Detection
Introduction Data Mining Methods Density-based anomaly Commute Time Approach Addressing Scalability Anomalies in Complex Data Evaluating Anomaly Detection Methods Applications Problem solutionsCategorical Data Discrete Sequences and Time Series Contextual Anomalies Collective Anomalies
Using Latent Dirichlet Allocation for Group Anomalies
Find anomalous groups in data [34]
Example Spatial clusters of galaxies topics red green emissive words continuous features
Flexible Genre Model (FGM)
For each group
1 Draw a genre 1 2 T 3 ym simM(π)2 Draw topic distribution forym SK 3 θm sim Dir(αym)
3 Draw K topicsβmk sim P (βmk|ηk)k=12K
4 For each point in group
1 Draw topic membershipzmn simM(θn)
2 Generate pointxmn isin P (xmn|βmzmn)
α
zmn
xmn
N
θm
T
π
ηK
ym
β
MK
Model Parameters
M(π) -Multinomial
Genre - Dir(αt)
Topic generatorsP (|ηk)- GIW
Point generatorsP (xmn|βnk) -MultivariateGaussian
Chawla and Chandola Anomaly Detection
Introduction Data Mining Methods Density-based anomaly Commute Time Approach Addressing Scalability Anomalies in Complex Data Evaluating Anomaly Detection Methods Applications Problem solutionsCategorical Data Discrete Sequences and Time Series Contextual Anomalies Collective Anomalies
Inference and Testing for FGM
Inference and Learning Parameters
Approximate inference of latentvariables (Gibbs Sampling)
Use samples to learn parameters(Single step Monte Carlo EM)
Topic 1
Topic 2
Topic 3
Anomaly Detection
Infer the topic distribution θm
Compute negative log likelihood wrt αt
Rationale An anomalous group will be unlikely to begenerated from any genre
Geometric interpretation Mapping each group into a Tdimensional space and finding anomalies
Chawla and Chandola Anomaly Detection
Introduction Data Mining Methods Density-based anomaly Commute Time Approach Addressing Scalability Anomalies in Complex Data Evaluating Anomaly Detection Methods Applications Problem solutions
Evaluating Anomaly Detection Methods - Labels
Labeled validation data set exists Confusion matrix Traditional evaluation metrics
Class imbalance
ROC Curve
Validation set does not exist Use domain expertise to find TP
and FP FN is harder to estimate
Pseudo false negativeestimation techniques [25]
Predicteda n
Actuala TP FNn FP TN
Acc =TP + TNsum
Rec (R) =TP
TP + FN
Prec (P ) =TP
TP + FP
F =2 lowastR lowast PR+ P
Chawla and Chandola Anomaly Detection
Introduction Data Mining Methods Density-based anomaly Commute Time Approach Addressing Scalability Anomalies in Complex Data Evaluating Anomaly Detection Methods Applications Problem solutions
Evaluating Anomaly Detection Methods - Scores
Convert to binary output Use threshold δ on score (Scale
issues [21]) Take top x as anomalies
ROC curve by varying x or δ
Quality of output Does the output ldquosuggestrdquo x or δ Which output is better
Chawla and Chandola Anomaly Detection
Introduction Data Mining Methods Density-based anomaly Commute Time Approach Addressing Scalability Anomalies in Complex Data Evaluating Anomaly Detection Methods Applications Problem solutions
Unifying Scores
Different methods assign scores in differentranges
kNN-based scores [0 1] Lof scores [1 6] ABOD scores [0 80000]
Anomalies have lower scores
Direct scaling to [0 1] might lose distinctionbetween normal and anomalies
Desired scaling Stretch interesting rangesand shrink irrelevant ones
Generalized Procedure for Normalizing Outlier Scores [21] Regularity rArr S(o) ge 0forallo S(o) asymp 0 if o is normal andS(o) 0 if o is anomalous
Normality S is regular and S(o) isin [0 1]forallo
Chawla and Chandola Anomaly Detection
Introduction Data Mining Methods Density-based anomaly Commute Time Approach Addressing Scalability Anomalies in Complex Data Evaluating Anomaly Detection Methods Applications Problem solutions
Regularization and Normalization of Scores
Regularization
1 R(o) = max0 S(o)minus baseS2 R(o) = Smax minus S(o)
3 R(o) = minus log SmaxS(o)
Normalization
1 N(o) = S(o)Smax
2 N(o) = max(
0 erf(S(o)minusmicroSσS radic2
))(Gaussian Scaling)
Suited for high dimensional data
3 N(o) = max(
0cdfγS (o)minusmicroγ
1minusmicroγ
)(Gamma Scaling)
Where cdfγS (o) = P (k S(o) θ) P is the regularized Gamma function Suited for low dimensional data
Chawla and Chandola Anomaly Detection
Introduction Data Mining Methods Density-based anomaly Commute Time Approach Addressing Scalability Anomalies in Complex Data Evaluating Anomaly Detection Methods Applications Problem solutions
Generating Labeled Data for Validation
Generating Both Normal and Anomalous Data
Use generative models for normal and anomalous behavior
Several generators available Multivariate continuous data [27] Multivariate categorical data [5] Discrete sequences using HMM [12]
Drawbacks Might not capture the domain characteristics
Injecting Anomalies - Random Perturbation[30]
Given data point z = xy x and y arepartitions of feature space
Take a random sample D of the entire data set
Let zprime = xprimeyprime isin D such that distancebetween y and yprime is maximum
Replace x with xprime and add z back to data setx
yz
zprime
Injected anomaly
Chawla and Chandola Anomaly Detection
Introduction Data Mining Methods Density-based anomaly Commute Time Approach Addressing Scalability Anomalies in Complex Data Evaluating Anomaly Detection Methods Applications Problem solutionsWhat is Network Anomaly Detection Motivation How Much Serious
Applications Overview
How to set up an anomaly detection solution for agiven application domain
Available data Define anomalies define normal behavior Identify requirements and constraints (online
real-time limited resources) What domain knowledge available
Feature identification Defining normal and anomalous behavior Tuning parameters
Available ground truth (training validation)
Chawla and Chandola Anomaly Detection
Introduction Data Mining Methods Density-based anomaly Commute Time Approach Addressing Scalability Anomalies in Complex Data Evaluating Anomaly Detection Methods Applications Problem solutionsWhat is Network Anomaly Detection Motivation How Much Serious
What is Network Anomaly Detection
Anomaly Detection or Intrusion Detection
Traditional Intrusion Detection Systems (IDS) finding attackscorresponding to predefined pattern data set known as signaturestherefore system is absolutely vulnerable against zero-day attacks
Network Anomaly Detection Systems (NADS) to detectzero-day attacks without any pre-identified signature besides profilenormal behavior of the network and address suspected incidents
Network Anomaly Detection finding unusual and largechanges in the network traffic
Examples intentional attacks (eg Distributed Denial ofService - DDoS) or unusual network traffic (eg flash crowds)
Chawla and Chandola Anomaly Detection
Introduction Data Mining Methods Density-based anomaly Commute Time Approach Addressing Scalability Anomalies in Complex Data Evaluating Anomaly Detection Methods Applications Problem solutionsWhat is Network Anomaly Detection Motivation How Much Serious
Motivation How Much Serious
According to Symantec report released in early 2011 morethan 286 million new threats have been detected in 2010which is a huge number
1656227
2704836
1000000
1500000
2000000
2500000
3000000
20547 18827 69107 113025 140690
624267
1656227
2704836
0
500000
1000000
1500000
2000000
2500000
3000000
2002 2003 2004 2005 2006 2007 2008 July2009-June2010
Chawla and Chandola Anomaly Detection
Introduction Data Mining Methods Density-based anomaly Commute Time Approach Addressing Scalability Anomalies in Complex Data Evaluating Anomaly Detection Methods Applications Problem solutionsNetwork Topology Network Anomalies Detection Problem Network Anomalies Detection Problem Why care about OD Flows
Network Topology
A Typical network
1 y
Router
2
3
41t
x2t
x1t
x3t
x4t
Origin-Destination (OD) flow is the traffic that enters at anorigin node and exits at a destination node of a backbonenetwork x1t x1t
Link measurement is the traffic enters at an node during aninterval y1t
Relationship between link traffic and OD flow traffic iscaptured by the routing matrix A
Chawla and Chandola Anomaly Detection
Introduction Data Mining Methods Density-based anomaly Commute Time Approach Addressing Scalability Anomalies in Complex Data Evaluating Anomaly Detection Methods Applications Problem solutionsNetwork Topology Network Anomalies Detection Problem Network Anomalies Detection Problem Why care about OD Flows
Network Anomalies Detection Problem
Chawla and Chandola Anomaly Detection
Introduction Data Mining Methods Density-based anomaly Commute Time Approach Addressing Scalability Anomalies in Complex Data Evaluating Anomaly Detection Methods Applications Problem solutionsNetwork Topology Network Anomalies Detection Problem Network Anomalies Detection Problem Why care about OD Flows
Network Anomalies Detection Problem
Chawla and Chandola Anomaly Detection
Introduction Data Mining Methods Density-based anomaly Commute Time Approach Addressing Scalability Anomalies in Complex Data Evaluating Anomaly Detection Methods Applications Problem solutionsNetwork Topology Network Anomalies Detection Problem Network Anomalies Detection Problem Why care about OD Flows
Why care about OD Flows
Volume anomaly typically arises on an OD flow (trafficarriving at one node and destined for another node)
If we only monitor traffic on network links volume arisingfrom an OD flow may not be noticeable Thus naiveapproach wont work if OD flow info is not available
Figure source [22]
Chawla and Chandola Anomaly Detection
Introduction Data Mining Methods Density-based anomaly Commute Time Approach Addressing Scalability Anomalies in Complex Data Evaluating Anomaly Detection Methods Applications Problem solutionsPCA and Subspace Method Subspace Method Algorithm Subspace Analysis Results Discussion Typical Characteristics of Anomaly Limitation of Volume Entropy Based versus Volume Based Fraud Detection Epidemeology Anomaly Detection in Climate and Weather Anomalies in Climate Validation of Anomalies
PCA and Subspace Method
Chawla and Chandola Anomaly Detection
Introduction Data Mining Methods Density-based anomaly Commute Time Approach Addressing Scalability Anomalies in Complex Data Evaluating Anomaly Detection Methods Applications Problem solutionsPCA and Subspace Method Subspace Method Algorithm Subspace Analysis Results Discussion Typical Characteristics of Anomaly Limitation of Volume Entropy Based versus Volume Based Fraud Detection Epidemeology Anomaly Detection in Climate and Weather Anomalies in Climate Validation of Anomalies
Subspace Method Algorithm
Step1- Determine the PCs based on eigenvaluedecomposition of the covariance matrix of the dataset
Step2- Choose first top k principle components with thehighest eigenvalues as matrix P
Step3-normal traffic subspace called Z
Z = PP TZ = CZ
Step4-abnormal traffic subspace called Z
Z = (I minus PP T )Z = CZ
Step5-If the norm of a vector is large then it is an rdquoanomalyrdquo
Chawla and Chandola Anomaly Detection
Introduction Data Mining Methods Density-based anomaly Commute Time Approach Addressing Scalability Anomalies in Complex Data Evaluating Anomaly Detection Methods Applications Problem solutionsPCA and Subspace Method Subspace Method Algorithm Subspace Analysis Results Discussion Typical Characteristics of Anomaly Limitation of Volume Entropy Based versus Volume Based Fraud Detection Epidemeology Anomaly Detection in Climate and Weather Anomalies in Climate Validation of Anomalies
Subspace Analysis Results
Note that during anomaly normal component does not changethat much while residual component changes quite a lot
Thus anomalies can be detected by setting some threshold
Figure source [22]
Chawla and Chandola Anomaly Detection
Introduction Data Mining Methods Density-based anomaly Commute Time Approach Addressing Scalability Anomalies in Complex Data Evaluating Anomaly Detection Methods Applications Problem solutionsPCA and Subspace Method Subspace Method Algorithm Subspace Analysis Results Discussion Typical Characteristics of Anomaly Limitation of Volume Entropy Based versus Volume Based Fraud Detection Epidemeology Anomaly Detection in Climate and Weather Anomalies in Climate Validation of Anomalies
Discussion Typical Characteristics of Anomaly
Most Anomalies induce a change in distributionalaspects of packet header fields (called features)
Most important features include 5-tuple Source ampdestination IP addresses Source and destination portnumbers and IP protocol
raquo DOS attack ndash multiple source IP address concentrated on asingle destination IP address
raquo Network scan ndash dispersed distribution of destination addresses
raquo Most wormsviruses also induce some change in distribution ofcertain features
raquo However these changes can be very subtle and mining them islike searching for needles in a haystack
Unlike many previous approach this paper aims todetect events which disturb the distribution of trafficfeatures rather than traffic volume
Chawla and Chandola Anomaly Detection
Introduction Data Mining Methods Density-based anomaly Commute Time Approach Addressing Scalability Anomalies in Complex Data Evaluating Anomaly Detection Methods Applications Problem solutionsPCA and Subspace Method Subspace Method Algorithm Subspace Analysis Results Discussion Typical Characteristics of Anomaly Limitation of Volume Entropy Based versus Volume Based Fraud Detection Epidemeology Anomaly Detection in Climate and Weather Anomalies in Climate Validation of Anomalies
Limitation of Volume
Figure source [22]
Port scan anomaly (traffic feature changes however traffic volume
remains more or less the same)
We can use entropy tocapture the variationsin the traffic feature
bullTakes value 0 when distribution is maximally concentratedbullTakes value log2N when distribution is maximally dispersed
But stands out in
feature entropy
which also reveals
its structure
Port scan
dwarfed
in volume
metricshellip
Chawla and Chandola Anomaly Detection
Introduction Data Mining Methods Density-based anomaly Commute Time Approach Addressing Scalability Anomalies in Complex Data Evaluating Anomaly Detection Methods Applications Problem solutionsPCA and Subspace Method Subspace Method Algorithm Subspace Analysis Results Discussion Typical Characteristics of Anomaly Limitation of Volume Entropy Based versus Volume Based Fraud Detection Epidemeology Anomaly Detection in Climate and Weather Anomalies in Climate Validation of Anomalies
Entropy Based versus Volume Based
DoSDDoS Attacks- a spike in traffic data toward adominant destination IP
Scan anomaly-a spike in traffic data from a dominant sourceIP
Flash Crowd anomaly- again a spike in traffic data to adominant destination IP
Worm anomaly-a Spike in traffic with a dominant port
Chawla and Chandola Anomaly Detection
Introduction Data Mining Methods Density-based anomaly Commute Time Approach Addressing Scalability Anomalies in Complex Data Evaluating Anomaly Detection Methods Applications Problem solutionsPCA and Subspace Method Subspace Method Algorithm Subspace Analysis Results Discussion Typical Characteristics of Anomaly Limitation of Volume Entropy Based versus Volume Based Fraud Detection Epidemeology Anomaly Detection in Climate and Weather Anomalies in Climate Validation of Anomalies
Fraud Detection
Domain Question Identifyfraudulent activities or players fromobserved transaction data
Data Transactions between different
players in the system Meta information about the
individuals An underlying graph structure
Challenges Track and model human behavior Anomalies caused by adaptive
human adversaries Massive data sizes
Insurance (autohealtha)
ClaimantProvider Payer
Telecommunications Customer
Provider
Credit Cards Customer
Supplier Bank
Web Advertising User Advertiser
Publisher
ahttpwwwcheatingculturecompast-cases-of-medicare-fraud
Chawla and Chandola Anomaly Detection
Introduction Data Mining Methods Density-based anomaly Commute Time Approach Addressing Scalability Anomalies in Complex Data Evaluating Anomaly Detection Methods Applications Problem solutionsPCA and Subspace Method Subspace Method Algorithm Subspace Analysis Results Discussion Typical Characteristics of Anomaly Limitation of Volume Entropy Based versus Volume Based Fraud Detection Epidemeology Anomaly Detection in Climate and Weather Anomalies in Climate Validation of Anomalies
A Generic Fraud Detection Method
Activity Monitoring [13]1 Build profiles for individuals (customers users etc) based on
historic data User X makes n calls on an average in January
2 Compare current behavior with historical profile for significantdeviations
Clustering based [4]1 Cluster historical profiles of customers2 Identify small clusters or outlying profiles as anomalies
Strengths Anomaly detection is fast (good for real time) Results are easy to explain
Weaknesses Need to create and maintain a large number of profiles Not dynamic Adequate historical data might not be available Too many false positives
Chawla and Chandola Anomaly Detection
Introduction Data Mining Methods Density-based anomaly Commute Time Approach Addressing Scalability Anomalies in Complex Data Evaluating Anomaly Detection Methods Applications Problem solutionsPCA and Subspace Method Subspace Method Algorithm Subspace Analysis Results Discussion Typical Characteristics of Anomaly Limitation of Volume Entropy Based versus Volume Based Fraud Detection Epidemeology Anomaly Detection in Climate and Weather Anomalies in Climate Validation of Anomalies
Exploiting Graph Structure - Weighted Graphs
Represent data as a weighted graph Communication networks (phone email SMS) Provider referral networks
Objective Identify anomalous nodes
For each node extract several features based on the propertiesof the induced sub-graph (egonet) of neighboring nodes [1]
Choose features that can highlight anomalous nodes
1 Ni degree of node2 Ei number of edges in egonet3 Wi total weight of egonet4 λi principal eigen vector of weighted adjacency matrix of
egonet
Data is transformed into a point in a multi-dimensional space
Chawla and Chandola Anomaly Detection
Introduction Data Mining Methods Density-based anomaly Commute Time Approach Addressing Scalability Anomalies in Complex Data Evaluating Anomaly Detection Methods Applications Problem solutionsPCA and Subspace Method Subspace Method Algorithm Subspace Analysis Results Discussion Typical Characteristics of Anomaly Limitation of Volume Entropy Based versus Volume Based Fraud Detection Epidemeology Anomaly Detection in Climate and Weather Anomalies in Climate Validation of Anomalies
Identifying Anomalies
Traditional anomaly detection (lof) Can be slow but can identify any type of anomalous structure
Faster method to identify specific types of anomalousstructures
Identify relevant feature pairs and power law relationship
Eg Egonet Density Power Law Ni vs Ei - detect nearcliques and stars
Ei prop Nαi 1 le α le 2
Anomaly score for node i wrt a pair of features (y = Cxθ)
Si =max(yi Cx
θi )
min(yi Cxθi )lowast log (|yi minus Cxθi |+ 1)
Chawla and Chandola Anomaly Detection
Introduction Data Mining Methods Density-based anomaly Commute Time Approach Addressing Scalability Anomalies in Complex Data Evaluating Anomaly Detection Methods Applications Problem solutionsPCA and Subspace Method Subspace Method Algorithm Subspace Analysis Results Discussion Typical Characteristics of Anomaly Limitation of Volume Entropy Based versus Volume Based Fraud Detection Epidemeology Anomaly Detection in Climate and Weather Anomalies in Climate Validation of Anomalies
Exploiting Graph Structure - Bipartite Graphs
Represent data as a bipartite graph Healthcare Data (Beneficiaries vs Providers) Insider trading (Traders vs Stocks)
Objective Identify anomalous links
Given a query node a isin V1 find the ldquorelevancerdquoof all other nodes in V1 to a
RelevanceScore(a b) prop Number of times aldquorandom walkrdquo from a reaches b
Use the relevance scores to compute thenormality scores for a node t isin V2
Find set St = a|〈a t〉 isin E Compute |St| times |St| similarity matrix using
relevance vectors for a isin St Normality Score = mean of non-diagonal entries
of similarity matrix
V1 E V2a1
a2
a3
an
t1
t2
t3
tn
Chawla and Chandola Anomaly Detection
Introduction Data Mining Methods Density-based anomaly Commute Time Approach Addressing Scalability Anomalies in Complex Data Evaluating Anomaly Detection Methods Applications Problem solutionsPCA and Subspace Method Subspace Method Algorithm Subspace Analysis Results Discussion Typical Characteristics of Anomaly Limitation of Volume Entropy Based versus Volume Based Fraud Detection Epidemeology Anomaly Detection in Climate and Weather Anomalies in Climate Validation of Anomalies
Detecting Disease Outbreaks
Domain Question Early detection of disease
outbreaks Anthrax attack
Data Emergency department visits Grocery data (Example [14]) Clinical visits Weatherclimate data
Challenges Weak signals in the data
ED cases involving cough rArrFlu or SARS
Integration of multiple signals(lag analysis)
Account for spatial and temporalcorrelations
Chawla and Chandola Anomaly Detection
Introduction Data Mining Methods Density-based anomaly Commute Time Approach Addressing Scalability Anomalies in Complex Data Evaluating Anomaly Detection Methods Applications Problem solutionsPCA and Subspace Method Subspace Method Algorithm Subspace Analysis Results Discussion Typical Characteristics of Anomaly Limitation of Volume Entropy Based versus Volume Based Fraud Detection Epidemeology Anomaly Detection in Climate and Weather Anomalies in Climate Validation of Anomalies
Whatrsquos Significant About Recent Events (WSARE) [33]
1 Learn Bayesian network from historical data Environmental and response variables
2 Sample from the BN (DBbaseline|Current Environment)3 Compute contingency table for rules for DBbaseline andDBcurrent
Rules are single assignment rules (Xi = Y ji ) or conjunctions4 Find p-value for rules using χ2-test
Null Hypothesis Rows and columns of tables for DBbaselineand DBcurrent are independent
5 Find rule with largest p-value Repeat Step 2
Chawla and Chandola Anomaly Detection
Introduction Data Mining Methods Density-based anomaly Commute Time Approach Addressing Scalability Anomalies in Complex Data Evaluating Anomaly Detection Methods Applications Problem solutionsPCA and Subspace Method Subspace Method Algorithm Subspace Analysis Results Discussion Typical Characteristics of Anomaly Limitation of Volume Entropy Based versus Volume Based Fraud Detection Epidemeology Anomaly Detection in Climate and Weather Anomalies in Climate Validation of Anomalies
Incorporating Spatial and Temporal Relationships
WSARE does not explicitly model the spatial and temporalrelationships
What happened yesterday What happened in the adjoining neighborhood (yesterday)
Bayesian Network Spatio-Temporal (BNST) modelingframework [17]
Add nodes for temporal and spatial dependencies Need more data to train
Chawla and Chandola Anomaly Detection
Introduction Data Mining Methods Density-based anomaly Commute Time Approach Addressing Scalability Anomalies in Complex Data Evaluating Anomaly Detection Methods Applications Problem solutionsPCA and Subspace Method Subspace Method Algorithm Subspace Analysis Results Discussion Typical Characteristics of Anomaly Limitation of Volume Entropy Based versus Volume Based Fraud Detection Epidemeology Anomaly Detection in Climate and Weather Anomalies in Climate Validation of Anomalies
Anomaly Detection in Climate and Weather
Science Questions Identify natural and anthropogenic disasters Identify long time scale events - droughts atmospheric rivers
cold fronts etc
Data Ground observations Remote sensing data (satellites
air-borne) Climate model simulation outputs Multiple variables spatio-temporal (often has height dimension
as well)
Challenges Model spatio-temporal relationships across multiple variables Explain the cause of anomalies Massive data sizes
Climate and weather extreme events are well defined
Key challenge is to find significant events and explain the cause
Chawla and Chandola Anomaly Detection
Introduction Data Mining Methods Density-based anomaly Commute Time Approach Addressing Scalability Anomalies in Complex Data Evaluating Anomaly Detection Methods Applications Problem solutionsPCA and Subspace Method Subspace Method Algorithm Subspace Analysis Results Discussion Typical Characteristics of Anomaly Limitation of Volume Entropy Based versus Volume Based Fraud Detection Epidemeology Anomaly Detection in Climate and Weather Anomalies in Climate Validation of Anomalies
Anomalies are Widely Used in Climate
Most analysis done on ldquoanomalyrdquo time series
Difference from a ldquobase periodrdquo (Toosimplistic)
Brings spatial smoothness (eg a mountaintop and nearby valley can have very differenttemperatures) Removes seasonality
Understand climate and weatherphenomenon
Southern Oscillation Index (SOI) Difference between Sea Level Pressure
(SLP) anomalies for Tahiti and DarwinAustralia
Figure Global AverageTemperature Anomaly(1975 - 2007) Srcwwwmetofficegovuk
Chawla and Chandola Anomaly Detection
Introduction Data Mining Methods Density-based anomaly Commute Time Approach Addressing Scalability Anomalies in Complex Data Evaluating Anomaly Detection Methods Applications Problem solutionsPCA and Subspace Method Subspace Method Algorithm Subspace Analysis Results Discussion Typical Characteristics of Anomaly Limitation of Volume Entropy Based versus Volume Based Fraud Detection Epidemeology Anomaly Detection in Climate and Weather Anomalies in Climate Validation of Anomalies
Constructing Anomalies from Raw Data
Anomaly time series for a given location i
vprimei = vi minus bi
where bi is the base (reference)
How to choose bi Mean of all data for location i Monthly mean values (account for seasonality) Monthly z-score values Median (more robust) Using a shorter ldquoreference periodrdquo
30 year moving window
Different methods show statistically significant differences[19] What is the right strategy Weighted mean of different strategies (Pick weights using
Monte Carlo sampling)
Chawla and Chandola Anomaly Detection
Introduction Data Mining Methods Density-based anomaly Commute Time Approach Addressing Scalability Anomalies in Complex Data Evaluating Anomaly Detection Methods Applications Problem solutionsPCA and Subspace Method Subspace Method Algorithm Subspace Analysis Results Discussion Typical Characteristics of Anomaly Limitation of Volume Entropy Based versus Volume Based Fraud Detection Epidemeology Anomaly Detection in Climate and Weather Anomalies in Climate Validation of Anomalies
Anomaly Detection for Identifying Droughts
Science question Identify significant drought patterns usinghistorical observation data or future simulation data or both
Find persistent spatiotemporal anomalies in precipitation data
A two step approach
1 Find precipitationanomalies usingthresholds
2 Find large connectedcomponents across spaceand time
Matlab - bwlabelbwlabeln
Followup Science questionExplain cause
(drought190120061avi)
Figure Video courtsey Dr ArindamBanerjee
Chawla and Chandola Anomaly Detection
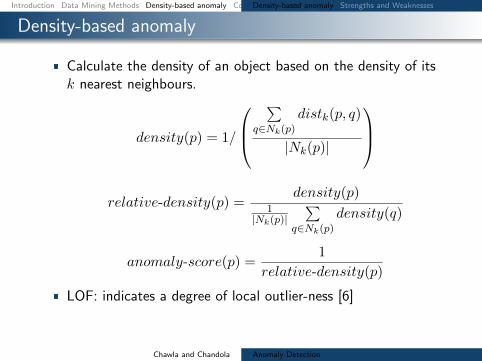
Introduction Data Mining Methods Density-based anomaly Commute Time Approach Addressing Scalability Anomalies in Complex Data Evaluating Anomaly Detection Methods Applications Problem solutionsDensity-based anomaly Strengths and Weaknesses
Density-based anomaly
Calculate the density of an object based on the density of itsk nearest neighbours
density(p) = 1
sum
qisinNk(p)distk(p q)
|Nk(p)|
relative-density(p) =
density(p)1
|Nk(p)|sum
qisinNk(p)density(q)
anomaly-score(p) =1
relative-density(p)
LOF indicates a degree of local outlier-ness [6]
Chawla and Chandola Anomaly Detection
Introduction Data Mining Methods Density-based anomaly Commute Time Approach Addressing Scalability Anomalies in Complex Data Evaluating Anomaly Detection Methods Applications Problem solutionsDensity-based anomaly Strengths and Weaknesses
Strengths and Weaknesses
Can detect global and local anomalies
Cannot use pruning technique and has a complexity of O(n2)
Require a method combining the strengths of distance anddensity based approaches A distance based approach whichcan capture density
C
C
O
O1
1
2
2
Chawla and Chandola Anomaly Detection
Introduction Data Mining Methods Density-based anomaly Commute Time Approach Addressing Scalability Anomalies in Complex Data Evaluating Anomaly Detection Methods Applications Problem solutionsCommute time Computation of commute time Anomaly detection using commute time (CDOF) Fast estimation of commute time Scalability for Density-based method PINN Algorithm (ICDM 2010) PINN Guarantee Examples high-dim distance-based outliers Examples high-dim density-based outliers Examples local density-based outliers
Commute time
Commute time between i and j is the expected number ofsteps that a random walk starting at i will take to reach jonce and go back to i for the first time
Commute time can capture both the distance between pointsand the data densities
Chawla and Chandola Anomaly Detection
Introduction Data Mining Methods Density-based anomaly Commute Time Approach Addressing Scalability Anomalies in Complex Data Evaluating Anomaly Detection Methods Applications Problem solutionsCommute time Computation of commute time Anomaly detection using commute time (CDOF) Fast estimation of commute time Scalability for Density-based method PINN Algorithm (ICDM 2010) PINN Guarantee Examples high-dim distance-based outliers Examples high-dim density-based outliers Examples local density-based outliers
Computation of commute time
Commute time can be computed using graph Laplacian matrixL
cij = VG(ei minus ej)TL+(ei minus ej)L+ pseudo-inverse of LVG graph volumeei i-th column of the identity matrix
Commute time is Euclidean distance in the space spanned byeigenvectors of L
cij = VG[(Sminus12V T )(ei minus ej)]T [(Sminus12V T )(ei minus ej)]
V S eigenvectors and eigenvalues of L
Chawla and Chandola Anomaly Detection
Introduction Data Mining Methods Density-based anomaly Commute Time Approach Addressing Scalability Anomalies in Complex Data Evaluating Anomaly Detection Methods Applications Problem solutionsCommute time Computation of commute time Anomaly detection using commute time (CDOF) Fast estimation of commute time Scalability for Density-based method PINN Algorithm (ICDM 2010) PINN Guarantee Examples high-dim distance-based outliers Examples high-dim density-based outliers Examples local density-based outliers
Anomaly detection using commute time (CDOF)
Construct the mutual k nearest neighbor graph G from thedataset
Compute the Laplacian matrix L of G and its eigensystems
Find top N anomalies using the distance-based technique incommute time with pruning rule
Complexity O(n3)
Commute time method can detect global local and groupanomalies
Chawla and Chandola Anomaly Detection
Introduction Data Mining Methods Density-based anomaly Commute Time Approach Addressing Scalability Anomalies in Complex Data Evaluating Anomaly Detection Methods Applications Problem solutionsCommute time Computation of commute time Anomaly detection using commute time (CDOF) Fast estimation of commute time Scalability for Density-based method PINN Algorithm (ICDM 2010) PINN Guarantee Examples high-dim distance-based outliers Examples high-dim density-based outliers Examples local density-based outliers
Fast estimation of commute time
Speilman and Srivastava [31] combined random projection anda linear time solver to build a structure where we can computethe compute time between two nodes in O(log n) time
Complexity of CDOF O(n3)rarr O(n log n)
Uses a near linear time solver for a linear system of equationAx = b
Spielman and Teng solvers Also see work by Iannis Koutisfrom CMU
Chawla and Chandola Anomaly Detection
Introduction Data Mining Methods Density-based anomaly Commute Time Approach Addressing Scalability Anomalies in Complex Data Evaluating Anomaly Detection Methods Applications Problem solutionsCommute time Computation of commute time Anomaly detection using commute time (CDOF) Fast estimation of commute time Scalability for Density-based method PINN Algorithm (ICDM 2010) PINN Guarantee Examples high-dim distance-based outliers Examples high-dim density-based outliers Examples local density-based outliers
Scalability for Density-based method
The pruning rule for Distance-based methods does not applyto Density-based approaches
We can go from O(n2) to nearly O(n log n) by using an index
One solution for the curse of high dimensionality is to use ofrandom projections
Chawla and Chandola Anomaly Detection
Introduction Data Mining Methods Density-based anomaly Commute Time Approach Addressing Scalability Anomalies in Complex Data Evaluating Anomaly Detection Methods Applications Problem solutionsCommute time Computation of commute time Anomaly detection using commute time (CDOF) Fast estimation of commute time Scalability for Density-based method PINN Algorithm (ICDM 2010) PINN Guarantee Examples high-dim distance-based outliers Examples high-dim density-based outliers Examples local density-based outliers
PINN Algorithm (ICDM 2010)
Chawla and Chandola Anomaly Detection
Introduction Data Mining Methods Density-based anomaly Commute Time Approach Addressing Scalability Anomalies in Complex Data Evaluating Anomaly Detection Methods Applications Problem solutionsCommute time Computation of commute time Anomaly detection using commute time (CDOF) Fast estimation of commute time Scalability for Density-based method PINN Algorithm (ICDM 2010) PINN Guarantee Examples high-dim distance-based outliers Examples high-dim density-based outliers Examples local density-based outliers
PINN Guarantee
The PINN Algorithm provides probabilistic guarantees
Under certain assumptions about intrinsic dimensionality (c)with high probability
1minus ε1 + ε
middot LOF (p) le LOF (p) le 1 + ε
1minus ε middot LOF (p)
In practice we do not know the intrinsic dimensionality ofdata However random projections are quite robust
Chawla and Chandola Anomaly Detection
Introduction Data Mining Methods Density-based anomaly Commute Time Approach Addressing Scalability Anomalies in Complex Data Evaluating Anomaly Detection Methods Applications Problem solutionsCommute time Computation of commute time Anomaly detection using commute time (CDOF) Fast estimation of commute time Scalability for Density-based method PINN Algorithm (ICDM 2010) PINN Guarantee Examples high-dim distance-based outliers Examples high-dim density-based outliers Examples local density-based outliers
Examples high-dim distance-based outliers
On a large database of images the bright images show up asdistance based outliers
Chawla and Chandola Anomaly Detection
Introduction Data Mining Methods Density-based anomaly Commute Time Approach Addressing Scalability Anomalies in Complex Data Evaluating Anomaly Detection Methods Applications Problem solutionsCommute time Computation of commute time Anomaly detection using commute time (CDOF) Fast estimation of commute time Scalability for Density-based method PINN Algorithm (ICDM 2010) PINN Guarantee Examples high-dim distance-based outliers Examples high-dim density-based outliers Examples local density-based outliers
Examples high-dim density-based outliers
On a large database of images occluded images show up asdensity based outliers
Chawla and Chandola Anomaly Detection
Introduction Data Mining Methods Density-based anomaly Commute Time Approach Addressing Scalability Anomalies in Complex Data Evaluating Anomaly Detection Methods Applications Problem solutionsCommute time Computation of commute time Anomaly detection using commute time (CDOF) Fast estimation of commute time Scalability for Density-based method PINN Algorithm (ICDM 2010) PINN Guarantee Examples high-dim distance-based outliers Examples high-dim density-based outliers Examples local density-based outliers
Examples local density-based outliers
Examples of images ranked by LOF
Chawla and Chandola Anomaly Detection
Introduction Data Mining Methods Density-based anomaly Commute Time Approach Addressing Scalability Anomalies in Complex Data Evaluating Anomaly Detection Methods Applications Problem solutions
Addressing Scalability
Chawla and Chandola Anomaly Detection
Introduction Data Mining Methods Density-based anomaly Commute Time Approach Addressing Scalability Anomalies in Complex Data Evaluating Anomaly Detection Methods Applications Problem solutions
Using GPUs for Anomaly Detection
Well suited for data parallel algorithms Using CUDA - Compute Unified Device
Architecture (Nvidia)
Need to re-engineer existing algorithms Utilization of device memory Minimize CPUhArrGPU transfer of data Keep threads homogeneous
Most model based algorithms arenaturally setup for the testing phase
Model building needs careful redesign
What about unsupervised algorithms
Kernel
Host
Grid
Device
Block(00)
Block(01)
Block(02)
Block(10)
Block(11)
Block(12)
Thread Block
Thread(00)
Thread(01)
Thread(02)
Thread(03)
Thread(10)
Thread(11)
Thread(12)
Thread(13)
Thread(20)
Thread(21)
Thread(22)
Thread(23)
Host Host Memory
SM 2
SM 1
SM 0
Registers Registers Registers
SP 0 SP 1 SP 7
Shared Memory
Global Memory
Texture Memory
Constant Memory
Device
Chawla and Chandola Anomaly Detection
Introduction Data Mining Methods Density-based anomaly Commute Time Approach Addressing Scalability Anomalies in Complex Data Evaluating Anomaly Detection Methods Applications Problem solutions
Implementing DB(kN) on GPUs
Return top N data instances whose distances tok-th nearest neighbor are largest (SerialDB(kN) is O(n2))
Involves computing pairwise distances
Load block i and block j to shared memory Data layout in memory should be optimized
Each thread computes distance between a pairof instances
Can utilize this time to load next chunk of datafrom host to device memory
Writes results to corresponding output block
Sorting can be done efficiently in CUDA [29]
d
n
T
n
n
Chawla and Chandola Anomaly Detection
Introduction Data Mining Methods Density-based anomaly Commute Time Approach Addressing Scalability Anomalies in Complex Data Evaluating Anomaly Detection Methods Applications Problem solutionsCategorical Data Discrete Sequences and Time Series Contextual Anomalies Collective Anomalies
Moving Beyond Multi-dimensional Record Data
Categorical (Mixed)
Fraud Detection
Cyber Networks
Time Series
Sensor Networks
Healthcare
Discrete Sequences
Genomic
System Calls
Spatial
GIS
Image analysis
Spatio-temporal
Remote sensing
Climate
Graphs
Social networks
Epidemiology
Chawla and Chandola Anomaly Detection
Introduction Data Mining Methods Density-based anomaly Commute Time Approach Addressing Scalability Anomalies in Complex Data Evaluating Anomaly Detection Methods Applications Problem solutionsCategorical Data Discrete Sequences and Time Series Contextual Anomalies Collective Anomalies
Handling Categorical Data
Each attribute can belong to one of many categories
No ordering between categories
Mixed data (categorical and continuous attributes)
cap-shape cap-surface middot middot middot habitat type
convex smooth urban poisonousconvex smooth grasses ediblebell smooth meadows edibleconvex scaly urban poisonousconvex smooth grasses ediblemiddot middot middot
Table Mushroom Data Set [2]
Chawla and Chandola Anomaly Detection
Introduction Data Mining Methods Density-based anomaly Commute Time Approach Addressing Scalability Anomalies in Complex Data Evaluating Anomaly Detection Methods Applications Problem solutionsCategorical Data Discrete Sequences and Time Series Contextual Anomalies Collective Anomalies
Approaches to Identify Categorical Anomalies
Using Association Analysis [24]
Binarize data
Learn rules (X rArr Y ) Choose high confidence
rules (P (Y |X))
For test record Z = 〈XY 〉find rules of the formP (Y |X)
Y is not observed whenX is observed
Using Bayesian Networks [33]
Learn Bayesian networkstructure and parameters
Compute P (Z) for test datarecord Z
Flag anomaly if P (Z) lt δ
Using Similarity Metrics [10]
Use a similarity measure (S(X1 X2))
Apply distancedensityclustering based method (eg lof)
Chawla and Chandola Anomaly Detection
Introduction Data Mining Methods Density-based anomaly Commute Time Approach Addressing Scalability Anomalies in Complex Data Evaluating Anomaly Detection Methods Applications Problem solutionsCategorical Data Discrete Sequences and Time Series Contextual Anomalies Collective Anomalies
Conditional Probability Test [18]
Identify unusual combinations of attribute values
r(at bt) =P (at bt)
P (at)P (bt)
A capB = φ Assumption If r(at bt) is low and is observed in test record t
then t is anomalous For a test record t
For each mutually exclusive pair of attribute sets ABcompute r(at bt)
Score t based on all r-values Assign minimum r-value as score Take product of all r-values
Need to compare exponential pairs of subsets Only consider subsets upto size k Ignore subsets with frequency less than a threshold α Avoid comparing independent subsets of attributes
micro(AB) ge βmicroChawla and Chandola Anomaly Detection
Introduction Data Mining Methods Density-based anomaly Commute Time Approach Addressing Scalability Anomalies in Complex Data Evaluating Anomaly Detection Methods Applications Problem solutionsCategorical Data Discrete Sequences and Time Series Contextual Anomalies Collective Anomalies
Estimating Probabilities for CPT [18]
Maximum LikelihoodEstimation
P (at bt)
P (at)P (bt)=C(at bt)
Ntimes N
C(at)times N
C(bt)
C(at) Number of traininginstances with A = at
N Total number of traininginstances
Laplace Smoothing
E(p) =C(p) + 1
N + 2
r(at bt) =E(at bt)
E(at)times E(bt)
Speedup Tricks
Replace rare attributevalues with genericattribute (reduce arity)
Use efficient datastructure to querying forcounts(AD Trees [26])
ADTrees work fasterfor low arity attributes
Chawla and Chandola Anomaly Detection
Introduction Data Mining Methods Density-based anomaly Commute Time Approach Addressing Scalability Anomalies in Complex Data Evaluating Anomaly Detection Methods Applications Problem solutionsCategorical Data Discrete Sequences and Time Series Contextual Anomalies Collective Anomalies
Finding Anomalies in Discrete Sequences
Many problem formulations
1 Anomalous symbols in asequence
2 Anomalous subsequence in asequence
3 Anomalous sequence in adatabase of sequences
See [11] for a comparativeevaluation [9] for a survey
login pwdmail ssh mail web logoutlogin pwdmail web web web web logoutlogin pwdmail ssh mail web web logoutlogin pwdwebmail ssh webmail logoutloginpwd loginpwd loginpwd logout
Chawla and Chandola Anomaly Detection
Introduction Data Mining Methods Density-based anomaly Commute Time Approach Addressing Scalability Anomalies in Complex Data Evaluating Anomaly Detection Methods Applications Problem solutionsCategorical Data Discrete Sequences and Time Series Contextual Anomalies Collective Anomalies
Treating Sequences as Points
Utilize a distancesimilarity measure Plug into a distancedensityclustering based method
Simplest Hamming Distance
h(Ai Bi) = 1 Ai 6= Bi= 0 Ai = Bi
H(AB) =nsumi=1
h(Ai Bi)
Issues Unequal lengths misalignment Normalized Length of Longest Common Subsequence
D(AB) = 1minus |LCS(AB)|radic|A||B|
Standard Dynamic Programming method is slow Faster versions available (Hunt Szymnaski method [7])
Weaknesses Cannot localize anomalies within a sequence Weak anomaly signals might get lost
Chawla and Chandola Anomaly Detection
Introduction Data Mining Methods Density-based anomaly Commute Time Approach Addressing Scalability Anomalies in Complex Data Evaluating Anomaly Detection Methods Applications Problem solutionsCategorical Data Discrete Sequences and Time Series Contextual Anomalies Collective Anomalies
Using Sliding Windows
Slide a window of size k
Extract all windows from a sequence (nminus k + 1)
Training (Creating a normal dictionary) Store all uniquewindows in all normal sequences and their counts
Testing For each window find the frequency in normal dictionary Anomaly score is inverse of the aggregate frequencies for all
windows (normalized by length)
Many variants exist For each window find the hamming distance to the closest
window in the normal dictionary [16]
Issues Penalizes low frequency windows in the normal dictionary Rewards high frequency windows that might not be relevant Can construct anomalous sequences that will escape detection
Chawla and Chandola Anomaly Detection
Introduction Data Mining Methods Density-based anomaly Commute Time Approach Addressing Scalability Anomalies in Complex Data Evaluating Anomaly Detection Methods Applications Problem solutionsCategorical Data Discrete Sequences and Time Series Contextual Anomalies Collective Anomalies
Using Probabilistic Models
Probability of occurrence of sequence S
P (S) =nprodi=1
P (Si|S1 Siminus1)
Short memory property of sequences
P (Si|S1 Siminus1) = P (Si|Siminusk Siminus1)
Conditional probability estimates for a symbol Si
P (Si|Siminusk Siminus1) =f(Si|Siminusk Si)f(Si|Siminusk Siminus1)
f is estimated from the normal dictionary
Anomaly score for a test sequence is inverse of the normalizedprobability of occurrence
Issues What if the suffix occurs very infrequently in thenormal data (or not at all)
Replace with the longest suffix that occurs sufficient number oftimes [32] - Probabilistic Suffix Trees
Significantly reduces the size of the modelChawla and Chandola Anomaly Detection
Introduction Data Mining Methods Density-based anomaly Commute Time Approach Addressing Scalability Anomalies in Complex Data Evaluating Anomaly Detection Methods Applications Problem solutionsCategorical Data Discrete Sequences and Time Series Contextual Anomalies Collective Anomalies
Finding Contextual Anomalies
Sometimes contextual information isavailable about data
Not used directly as a feature Are well understood no anomalies in
the context Can reduce false positives and yield
interesting anomalies
Example adapted from [30]
Clearest Outlier
Conditional Anomaly
Maximum Daily Temperature
Number
ofFever
Cases
Contextual anomalies - Anomalous with respect to a context Context is defined using environmental variables
Spatial (Latitude Longitude) Graph context (Edges Weights) Temporal location Domain specific (Demographic other)
How to incorporate context Reduce to traditional anomaly detection (subset on context) Explicitly model contextual information (time series spatial)
Chawla and Chandola Anomaly Detection
Introduction Data Mining Methods Density-based anomaly Commute Time Approach Addressing Scalability Anomalies in Complex Data Evaluating Anomaly Detection Methods Applications Problem solutionsCategorical Data Discrete Sequences and Time Series Contextual Anomalies Collective Anomalies
Conditional Anomaly Detection
Data instance d rArru1 u2 udU v1 v2 vdV
dU environmentalattributes
dV indicator attributes u1
u2
U1
U2
U3
v1
v2
V1V2
V3
p(V1|U3) = 02
p(V2|U3) = 02
p(V3|U3) = 06
Algorithm [30]
1 Learn a Gaussian Mixture Model (GMM)U = U1 U2 UnU
each with dimensionality dU2 Learn a set of Gaussians U = V1 V2 VnV
each withdimensionality dV
3 Learn a probabilistic mapping function p(Vj |Ui)4 Score a test instance d = [uv]
S =
nUsumi=1
p(u|Ui)nVsumj=1
p(v|Vj)p(Vj |Ui)
Chawla and Chandola Anomaly Detection
Introduction Data Mining Methods Density-based anomaly Commute Time Approach Addressing Scalability Anomalies in Complex Data Evaluating Anomaly Detection Methods Applications Problem solutionsCategorical Data Discrete Sequences and Time Series Contextual Anomalies Collective Anomalies
Finding Collective Anomalies
Find a collection of data points
Each point by itself is normal
The collection as a whole isanomalous
Relevant when data has inherentstructure and
When domain definition ofanomalies cannot be described aspoint anomalies
A Simple Solution
1 Break data intogroups
2 Compute features foreach group
3 Apply traditionalanomaly detection
Examples
1 Time series
2 Image
3 Spatial clusters ofgalaxies
Chawla and Chandola Anomaly Detection
Introduction Data Mining Methods Density-based anomaly Commute Time Approach Addressing Scalability Anomalies in Complex Data Evaluating Anomaly Detection Methods Applications Problem solutionsCategorical Data Discrete Sequences and Time Series Contextual Anomalies Collective Anomalies
Using Latent Dirichlet Allocation for Group Anomalies
Find anomalous groups in data [34]
Example Spatial clusters of galaxies topics red green emissive words continuous features
Flexible Genre Model (FGM)
For each group
1 Draw a genre 1 2 T 3 ym simM(π)2 Draw topic distribution forym SK 3 θm sim Dir(αym)
3 Draw K topicsβmk sim P (βmk|ηk)k=12K
4 For each point in group
1 Draw topic membershipzmn simM(θn)
2 Generate pointxmn isin P (xmn|βmzmn)
α
zmn
xmn
N
θm
T
π
ηK
ym
β
MK
Model Parameters
M(π) -Multinomial
Genre - Dir(αt)
Topic generatorsP (|ηk)- GIW
Point generatorsP (xmn|βnk) -MultivariateGaussian
Chawla and Chandola Anomaly Detection
Introduction Data Mining Methods Density-based anomaly Commute Time Approach Addressing Scalability Anomalies in Complex Data Evaluating Anomaly Detection Methods Applications Problem solutionsCategorical Data Discrete Sequences and Time Series Contextual Anomalies Collective Anomalies
Inference and Testing for FGM
Inference and Learning Parameters
Approximate inference of latentvariables (Gibbs Sampling)
Use samples to learn parameters(Single step Monte Carlo EM)
Topic 1
Topic 2
Topic 3
Anomaly Detection
Infer the topic distribution θm
Compute negative log likelihood wrt αt
Rationale An anomalous group will be unlikely to begenerated from any genre
Geometric interpretation Mapping each group into a Tdimensional space and finding anomalies
Chawla and Chandola Anomaly Detection
Introduction Data Mining Methods Density-based anomaly Commute Time Approach Addressing Scalability Anomalies in Complex Data Evaluating Anomaly Detection Methods Applications Problem solutions
Evaluating Anomaly Detection Methods - Labels
Labeled validation data set exists Confusion matrix Traditional evaluation metrics
Class imbalance
ROC Curve
Validation set does not exist Use domain expertise to find TP
and FP FN is harder to estimate
Pseudo false negativeestimation techniques [25]
Predicteda n
Actuala TP FNn FP TN
Acc =TP + TNsum
Rec (R) =TP
TP + FN
Prec (P ) =TP
TP + FP
F =2 lowastR lowast PR+ P
Chawla and Chandola Anomaly Detection
Introduction Data Mining Methods Density-based anomaly Commute Time Approach Addressing Scalability Anomalies in Complex Data Evaluating Anomaly Detection Methods Applications Problem solutions
Evaluating Anomaly Detection Methods - Scores
Convert to binary output Use threshold δ on score (Scale
issues [21]) Take top x as anomalies
ROC curve by varying x or δ
Quality of output Does the output ldquosuggestrdquo x or δ Which output is better
Chawla and Chandola Anomaly Detection
Introduction Data Mining Methods Density-based anomaly Commute Time Approach Addressing Scalability Anomalies in Complex Data Evaluating Anomaly Detection Methods Applications Problem solutions
Unifying Scores
Different methods assign scores in differentranges
kNN-based scores [0 1] Lof scores [1 6] ABOD scores [0 80000]
Anomalies have lower scores
Direct scaling to [0 1] might lose distinctionbetween normal and anomalies
Desired scaling Stretch interesting rangesand shrink irrelevant ones
Generalized Procedure for Normalizing Outlier Scores [21] Regularity rArr S(o) ge 0forallo S(o) asymp 0 if o is normal andS(o) 0 if o is anomalous
Normality S is regular and S(o) isin [0 1]forallo
Chawla and Chandola Anomaly Detection
Introduction Data Mining Methods Density-based anomaly Commute Time Approach Addressing Scalability Anomalies in Complex Data Evaluating Anomaly Detection Methods Applications Problem solutions
Regularization and Normalization of Scores
Regularization
1 R(o) = max0 S(o)minus baseS2 R(o) = Smax minus S(o)
3 R(o) = minus log SmaxS(o)
Normalization
1 N(o) = S(o)Smax
2 N(o) = max(
0 erf(S(o)minusmicroSσS radic2
))(Gaussian Scaling)
Suited for high dimensional data
3 N(o) = max(
0cdfγS (o)minusmicroγ
1minusmicroγ
)(Gamma Scaling)
Where cdfγS (o) = P (k S(o) θ) P is the regularized Gamma function Suited for low dimensional data
Chawla and Chandola Anomaly Detection
Introduction Data Mining Methods Density-based anomaly Commute Time Approach Addressing Scalability Anomalies in Complex Data Evaluating Anomaly Detection Methods Applications Problem solutions
Generating Labeled Data for Validation
Generating Both Normal and Anomalous Data
Use generative models for normal and anomalous behavior
Several generators available Multivariate continuous data [27] Multivariate categorical data [5] Discrete sequences using HMM [12]
Drawbacks Might not capture the domain characteristics
Injecting Anomalies - Random Perturbation[30]
Given data point z = xy x and y arepartitions of feature space
Take a random sample D of the entire data set
Let zprime = xprimeyprime isin D such that distancebetween y and yprime is maximum
Replace x with xprime and add z back to data setx
yz
zprime
Injected anomaly
Chawla and Chandola Anomaly Detection
Introduction Data Mining Methods Density-based anomaly Commute Time Approach Addressing Scalability Anomalies in Complex Data Evaluating Anomaly Detection Methods Applications Problem solutionsWhat is Network Anomaly Detection Motivation How Much Serious
Applications Overview
How to set up an anomaly detection solution for agiven application domain
Available data Define anomalies define normal behavior Identify requirements and constraints (online
real-time limited resources) What domain knowledge available
Feature identification Defining normal and anomalous behavior Tuning parameters
Available ground truth (training validation)
Chawla and Chandola Anomaly Detection
Introduction Data Mining Methods Density-based anomaly Commute Time Approach Addressing Scalability Anomalies in Complex Data Evaluating Anomaly Detection Methods Applications Problem solutionsWhat is Network Anomaly Detection Motivation How Much Serious
What is Network Anomaly Detection
Anomaly Detection or Intrusion Detection
Traditional Intrusion Detection Systems (IDS) finding attackscorresponding to predefined pattern data set known as signaturestherefore system is absolutely vulnerable against zero-day attacks
Network Anomaly Detection Systems (NADS) to detectzero-day attacks without any pre-identified signature besides profilenormal behavior of the network and address suspected incidents
Network Anomaly Detection finding unusual and largechanges in the network traffic
Examples intentional attacks (eg Distributed Denial ofService - DDoS) or unusual network traffic (eg flash crowds)
Chawla and Chandola Anomaly Detection
Introduction Data Mining Methods Density-based anomaly Commute Time Approach Addressing Scalability Anomalies in Complex Data Evaluating Anomaly Detection Methods Applications Problem solutionsWhat is Network Anomaly Detection Motivation How Much Serious
Motivation How Much Serious
According to Symantec report released in early 2011 morethan 286 million new threats have been detected in 2010which is a huge number
1656227
2704836
1000000
1500000
2000000
2500000
3000000
20547 18827 69107 113025 140690
624267
1656227
2704836
0
500000
1000000
1500000
2000000
2500000
3000000
2002 2003 2004 2005 2006 2007 2008 July2009-June2010
Chawla and Chandola Anomaly Detection
Introduction Data Mining Methods Density-based anomaly Commute Time Approach Addressing Scalability Anomalies in Complex Data Evaluating Anomaly Detection Methods Applications Problem solutionsNetwork Topology Network Anomalies Detection Problem Network Anomalies Detection Problem Why care about OD Flows
Network Topology
A Typical network
1 y
Router
2
3
41t
x2t
x1t
x3t
x4t
Origin-Destination (OD) flow is the traffic that enters at anorigin node and exits at a destination node of a backbonenetwork x1t x1t
Link measurement is the traffic enters at an node during aninterval y1t
Relationship between link traffic and OD flow traffic iscaptured by the routing matrix A
Chawla and Chandola Anomaly Detection
Introduction Data Mining Methods Density-based anomaly Commute Time Approach Addressing Scalability Anomalies in Complex Data Evaluating Anomaly Detection Methods Applications Problem solutionsNetwork Topology Network Anomalies Detection Problem Network Anomalies Detection Problem Why care about OD Flows
Network Anomalies Detection Problem
Chawla and Chandola Anomaly Detection
Introduction Data Mining Methods Density-based anomaly Commute Time Approach Addressing Scalability Anomalies in Complex Data Evaluating Anomaly Detection Methods Applications Problem solutionsNetwork Topology Network Anomalies Detection Problem Network Anomalies Detection Problem Why care about OD Flows
Network Anomalies Detection Problem
Chawla and Chandola Anomaly Detection
Introduction Data Mining Methods Density-based anomaly Commute Time Approach Addressing Scalability Anomalies in Complex Data Evaluating Anomaly Detection Methods Applications Problem solutionsNetwork Topology Network Anomalies Detection Problem Network Anomalies Detection Problem Why care about OD Flows
Why care about OD Flows
Volume anomaly typically arises on an OD flow (trafficarriving at one node and destined for another node)
If we only monitor traffic on network links volume arisingfrom an OD flow may not be noticeable Thus naiveapproach wont work if OD flow info is not available
Figure source [22]
Chawla and Chandola Anomaly Detection
Introduction Data Mining Methods Density-based anomaly Commute Time Approach Addressing Scalability Anomalies in Complex Data Evaluating Anomaly Detection Methods Applications Problem solutionsPCA and Subspace Method Subspace Method Algorithm Subspace Analysis Results Discussion Typical Characteristics of Anomaly Limitation of Volume Entropy Based versus Volume Based Fraud Detection Epidemeology Anomaly Detection in Climate and Weather Anomalies in Climate Validation of Anomalies
PCA and Subspace Method
Chawla and Chandola Anomaly Detection
Introduction Data Mining Methods Density-based anomaly Commute Time Approach Addressing Scalability Anomalies in Complex Data Evaluating Anomaly Detection Methods Applications Problem solutionsPCA and Subspace Method Subspace Method Algorithm Subspace Analysis Results Discussion Typical Characteristics of Anomaly Limitation of Volume Entropy Based versus Volume Based Fraud Detection Epidemeology Anomaly Detection in Climate and Weather Anomalies in Climate Validation of Anomalies
Subspace Method Algorithm
Step1- Determine the PCs based on eigenvaluedecomposition of the covariance matrix of the dataset
Step2- Choose first top k principle components with thehighest eigenvalues as matrix P
Step3-normal traffic subspace called Z
Z = PP TZ = CZ
Step4-abnormal traffic subspace called Z
Z = (I minus PP T )Z = CZ
Step5-If the norm of a vector is large then it is an rdquoanomalyrdquo
Chawla and Chandola Anomaly Detection
Introduction Data Mining Methods Density-based anomaly Commute Time Approach Addressing Scalability Anomalies in Complex Data Evaluating Anomaly Detection Methods Applications Problem solutionsPCA and Subspace Method Subspace Method Algorithm Subspace Analysis Results Discussion Typical Characteristics of Anomaly Limitation of Volume Entropy Based versus Volume Based Fraud Detection Epidemeology Anomaly Detection in Climate and Weather Anomalies in Climate Validation of Anomalies
Subspace Analysis Results
Note that during anomaly normal component does not changethat much while residual component changes quite a lot
Thus anomalies can be detected by setting some threshold
Figure source [22]
Chawla and Chandola Anomaly Detection
Introduction Data Mining Methods Density-based anomaly Commute Time Approach Addressing Scalability Anomalies in Complex Data Evaluating Anomaly Detection Methods Applications Problem solutionsPCA and Subspace Method Subspace Method Algorithm Subspace Analysis Results Discussion Typical Characteristics of Anomaly Limitation of Volume Entropy Based versus Volume Based Fraud Detection Epidemeology Anomaly Detection in Climate and Weather Anomalies in Climate Validation of Anomalies
Discussion Typical Characteristics of Anomaly
Most Anomalies induce a change in distributionalaspects of packet header fields (called features)
Most important features include 5-tuple Source ampdestination IP addresses Source and destination portnumbers and IP protocol
raquo DOS attack ndash multiple source IP address concentrated on asingle destination IP address
raquo Network scan ndash dispersed distribution of destination addresses
raquo Most wormsviruses also induce some change in distribution ofcertain features
raquo However these changes can be very subtle and mining them islike searching for needles in a haystack
Unlike many previous approach this paper aims todetect events which disturb the distribution of trafficfeatures rather than traffic volume
Chawla and Chandola Anomaly Detection
Introduction Data Mining Methods Density-based anomaly Commute Time Approach Addressing Scalability Anomalies in Complex Data Evaluating Anomaly Detection Methods Applications Problem solutionsPCA and Subspace Method Subspace Method Algorithm Subspace Analysis Results Discussion Typical Characteristics of Anomaly Limitation of Volume Entropy Based versus Volume Based Fraud Detection Epidemeology Anomaly Detection in Climate and Weather Anomalies in Climate Validation of Anomalies
Limitation of Volume
Figure source [22]
Port scan anomaly (traffic feature changes however traffic volume
remains more or less the same)
We can use entropy tocapture the variationsin the traffic feature
bullTakes value 0 when distribution is maximally concentratedbullTakes value log2N when distribution is maximally dispersed
But stands out in
feature entropy
which also reveals
its structure
Port scan
dwarfed
in volume
metricshellip
Chawla and Chandola Anomaly Detection
Introduction Data Mining Methods Density-based anomaly Commute Time Approach Addressing Scalability Anomalies in Complex Data Evaluating Anomaly Detection Methods Applications Problem solutionsPCA and Subspace Method Subspace Method Algorithm Subspace Analysis Results Discussion Typical Characteristics of Anomaly Limitation of Volume Entropy Based versus Volume Based Fraud Detection Epidemeology Anomaly Detection in Climate and Weather Anomalies in Climate Validation of Anomalies
Entropy Based versus Volume Based
DoSDDoS Attacks- a spike in traffic data toward adominant destination IP
Scan anomaly-a spike in traffic data from a dominant sourceIP
Flash Crowd anomaly- again a spike in traffic data to adominant destination IP
Worm anomaly-a Spike in traffic with a dominant port
Chawla and Chandola Anomaly Detection
Introduction Data Mining Methods Density-based anomaly Commute Time Approach Addressing Scalability Anomalies in Complex Data Evaluating Anomaly Detection Methods Applications Problem solutionsPCA and Subspace Method Subspace Method Algorithm Subspace Analysis Results Discussion Typical Characteristics of Anomaly Limitation of Volume Entropy Based versus Volume Based Fraud Detection Epidemeology Anomaly Detection in Climate and Weather Anomalies in Climate Validation of Anomalies
Fraud Detection
Domain Question Identifyfraudulent activities or players fromobserved transaction data
Data Transactions between different
players in the system Meta information about the
individuals An underlying graph structure
Challenges Track and model human behavior Anomalies caused by adaptive
human adversaries Massive data sizes
Insurance (autohealtha)
ClaimantProvider Payer
Telecommunications Customer
Provider
Credit Cards Customer
Supplier Bank
Web Advertising User Advertiser
Publisher
ahttpwwwcheatingculturecompast-cases-of-medicare-fraud
Chawla and Chandola Anomaly Detection
Introduction Data Mining Methods Density-based anomaly Commute Time Approach Addressing Scalability Anomalies in Complex Data Evaluating Anomaly Detection Methods Applications Problem solutionsPCA and Subspace Method Subspace Method Algorithm Subspace Analysis Results Discussion Typical Characteristics of Anomaly Limitation of Volume Entropy Based versus Volume Based Fraud Detection Epidemeology Anomaly Detection in Climate and Weather Anomalies in Climate Validation of Anomalies
A Generic Fraud Detection Method
Activity Monitoring [13]1 Build profiles for individuals (customers users etc) based on
historic data User X makes n calls on an average in January
2 Compare current behavior with historical profile for significantdeviations
Clustering based [4]1 Cluster historical profiles of customers2 Identify small clusters or outlying profiles as anomalies
Strengths Anomaly detection is fast (good for real time) Results are easy to explain
Weaknesses Need to create and maintain a large number of profiles Not dynamic Adequate historical data might not be available Too many false positives
Chawla and Chandola Anomaly Detection
Introduction Data Mining Methods Density-based anomaly Commute Time Approach Addressing Scalability Anomalies in Complex Data Evaluating Anomaly Detection Methods Applications Problem solutionsPCA and Subspace Method Subspace Method Algorithm Subspace Analysis Results Discussion Typical Characteristics of Anomaly Limitation of Volume Entropy Based versus Volume Based Fraud Detection Epidemeology Anomaly Detection in Climate and Weather Anomalies in Climate Validation of Anomalies
Exploiting Graph Structure - Weighted Graphs
Represent data as a weighted graph Communication networks (phone email SMS) Provider referral networks
Objective Identify anomalous nodes
For each node extract several features based on the propertiesof the induced sub-graph (egonet) of neighboring nodes [1]
Choose features that can highlight anomalous nodes
1 Ni degree of node2 Ei number of edges in egonet3 Wi total weight of egonet4 λi principal eigen vector of weighted adjacency matrix of
egonet
Data is transformed into a point in a multi-dimensional space
Chawla and Chandola Anomaly Detection
Introduction Data Mining Methods Density-based anomaly Commute Time Approach Addressing Scalability Anomalies in Complex Data Evaluating Anomaly Detection Methods Applications Problem solutionsPCA and Subspace Method Subspace Method Algorithm Subspace Analysis Results Discussion Typical Characteristics of Anomaly Limitation of Volume Entropy Based versus Volume Based Fraud Detection Epidemeology Anomaly Detection in Climate and Weather Anomalies in Climate Validation of Anomalies
Identifying Anomalies
Traditional anomaly detection (lof) Can be slow but can identify any type of anomalous structure
Faster method to identify specific types of anomalousstructures
Identify relevant feature pairs and power law relationship
Eg Egonet Density Power Law Ni vs Ei - detect nearcliques and stars
Ei prop Nαi 1 le α le 2
Anomaly score for node i wrt a pair of features (y = Cxθ)
Si =max(yi Cx
θi )
min(yi Cxθi )lowast log (|yi minus Cxθi |+ 1)
Chawla and Chandola Anomaly Detection
Introduction Data Mining Methods Density-based anomaly Commute Time Approach Addressing Scalability Anomalies in Complex Data Evaluating Anomaly Detection Methods Applications Problem solutionsPCA and Subspace Method Subspace Method Algorithm Subspace Analysis Results Discussion Typical Characteristics of Anomaly Limitation of Volume Entropy Based versus Volume Based Fraud Detection Epidemeology Anomaly Detection in Climate and Weather Anomalies in Climate Validation of Anomalies
Exploiting Graph Structure - Bipartite Graphs
Represent data as a bipartite graph Healthcare Data (Beneficiaries vs Providers) Insider trading (Traders vs Stocks)
Objective Identify anomalous links
Given a query node a isin V1 find the ldquorelevancerdquoof all other nodes in V1 to a
RelevanceScore(a b) prop Number of times aldquorandom walkrdquo from a reaches b
Use the relevance scores to compute thenormality scores for a node t isin V2
Find set St = a|〈a t〉 isin E Compute |St| times |St| similarity matrix using
relevance vectors for a isin St Normality Score = mean of non-diagonal entries
of similarity matrix
V1 E V2a1
a2
a3
an
t1
t2
t3
tn
Chawla and Chandola Anomaly Detection
Introduction Data Mining Methods Density-based anomaly Commute Time Approach Addressing Scalability Anomalies in Complex Data Evaluating Anomaly Detection Methods Applications Problem solutionsPCA and Subspace Method Subspace Method Algorithm Subspace Analysis Results Discussion Typical Characteristics of Anomaly Limitation of Volume Entropy Based versus Volume Based Fraud Detection Epidemeology Anomaly Detection in Climate and Weather Anomalies in Climate Validation of Anomalies
Detecting Disease Outbreaks
Domain Question Early detection of disease
outbreaks Anthrax attack
Data Emergency department visits Grocery data (Example [14]) Clinical visits Weatherclimate data
Challenges Weak signals in the data
ED cases involving cough rArrFlu or SARS
Integration of multiple signals(lag analysis)
Account for spatial and temporalcorrelations
Chawla and Chandola Anomaly Detection
Introduction Data Mining Methods Density-based anomaly Commute Time Approach Addressing Scalability Anomalies in Complex Data Evaluating Anomaly Detection Methods Applications Problem solutionsPCA and Subspace Method Subspace Method Algorithm Subspace Analysis Results Discussion Typical Characteristics of Anomaly Limitation of Volume Entropy Based versus Volume Based Fraud Detection Epidemeology Anomaly Detection in Climate and Weather Anomalies in Climate Validation of Anomalies
Whatrsquos Significant About Recent Events (WSARE) [33]
1 Learn Bayesian network from historical data Environmental and response variables
2 Sample from the BN (DBbaseline|Current Environment)3 Compute contingency table for rules for DBbaseline andDBcurrent
Rules are single assignment rules (Xi = Y ji ) or conjunctions4 Find p-value for rules using χ2-test
Null Hypothesis Rows and columns of tables for DBbaselineand DBcurrent are independent
5 Find rule with largest p-value Repeat Step 2
Chawla and Chandola Anomaly Detection
Introduction Data Mining Methods Density-based anomaly Commute Time Approach Addressing Scalability Anomalies in Complex Data Evaluating Anomaly Detection Methods Applications Problem solutionsPCA and Subspace Method Subspace Method Algorithm Subspace Analysis Results Discussion Typical Characteristics of Anomaly Limitation of Volume Entropy Based versus Volume Based Fraud Detection Epidemeology Anomaly Detection in Climate and Weather Anomalies in Climate Validation of Anomalies
Incorporating Spatial and Temporal Relationships
WSARE does not explicitly model the spatial and temporalrelationships
What happened yesterday What happened in the adjoining neighborhood (yesterday)
Bayesian Network Spatio-Temporal (BNST) modelingframework [17]
Add nodes for temporal and spatial dependencies Need more data to train
Chawla and Chandola Anomaly Detection
Introduction Data Mining Methods Density-based anomaly Commute Time Approach Addressing Scalability Anomalies in Complex Data Evaluating Anomaly Detection Methods Applications Problem solutionsPCA and Subspace Method Subspace Method Algorithm Subspace Analysis Results Discussion Typical Characteristics of Anomaly Limitation of Volume Entropy Based versus Volume Based Fraud Detection Epidemeology Anomaly Detection in Climate and Weather Anomalies in Climate Validation of Anomalies
Anomaly Detection in Climate and Weather
Science Questions Identify natural and anthropogenic disasters Identify long time scale events - droughts atmospheric rivers
cold fronts etc
Data Ground observations Remote sensing data (satellites
air-borne) Climate model simulation outputs Multiple variables spatio-temporal (often has height dimension
as well)
Challenges Model spatio-temporal relationships across multiple variables Explain the cause of anomalies Massive data sizes
Climate and weather extreme events are well defined
Key challenge is to find significant events and explain the cause
Chawla and Chandola Anomaly Detection
Introduction Data Mining Methods Density-based anomaly Commute Time Approach Addressing Scalability Anomalies in Complex Data Evaluating Anomaly Detection Methods Applications Problem solutionsPCA and Subspace Method Subspace Method Algorithm Subspace Analysis Results Discussion Typical Characteristics of Anomaly Limitation of Volume Entropy Based versus Volume Based Fraud Detection Epidemeology Anomaly Detection in Climate and Weather Anomalies in Climate Validation of Anomalies
Anomalies are Widely Used in Climate
Most analysis done on ldquoanomalyrdquo time series
Difference from a ldquobase periodrdquo (Toosimplistic)
Brings spatial smoothness (eg a mountaintop and nearby valley can have very differenttemperatures) Removes seasonality
Understand climate and weatherphenomenon
Southern Oscillation Index (SOI) Difference between Sea Level Pressure
(SLP) anomalies for Tahiti and DarwinAustralia
Figure Global AverageTemperature Anomaly(1975 - 2007) Srcwwwmetofficegovuk
Chawla and Chandola Anomaly Detection
Introduction Data Mining Methods Density-based anomaly Commute Time Approach Addressing Scalability Anomalies in Complex Data Evaluating Anomaly Detection Methods Applications Problem solutionsPCA and Subspace Method Subspace Method Algorithm Subspace Analysis Results Discussion Typical Characteristics of Anomaly Limitation of Volume Entropy Based versus Volume Based Fraud Detection Epidemeology Anomaly Detection in Climate and Weather Anomalies in Climate Validation of Anomalies
Constructing Anomalies from Raw Data
Anomaly time series for a given location i
vprimei = vi minus bi
where bi is the base (reference)
How to choose bi Mean of all data for location i Monthly mean values (account for seasonality) Monthly z-score values Median (more robust) Using a shorter ldquoreference periodrdquo
30 year moving window
Different methods show statistically significant differences[19] What is the right strategy Weighted mean of different strategies (Pick weights using
Monte Carlo sampling)
Chawla and Chandola Anomaly Detection
Introduction Data Mining Methods Density-based anomaly Commute Time Approach Addressing Scalability Anomalies in Complex Data Evaluating Anomaly Detection Methods Applications Problem solutionsPCA and Subspace Method Subspace Method Algorithm Subspace Analysis Results Discussion Typical Characteristics of Anomaly Limitation of Volume Entropy Based versus Volume Based Fraud Detection Epidemeology Anomaly Detection in Climate and Weather Anomalies in Climate Validation of Anomalies
Anomaly Detection for Identifying Droughts
Science question Identify significant drought patterns usinghistorical observation data or future simulation data or both
Find persistent spatiotemporal anomalies in precipitation data
A two step approach
1 Find precipitationanomalies usingthresholds
2 Find large connectedcomponents across spaceand time
Matlab - bwlabelbwlabeln
Followup Science questionExplain cause
(drought190120061avi)
Figure Video courtsey Dr ArindamBanerjee
Chawla and Chandola Anomaly Detection
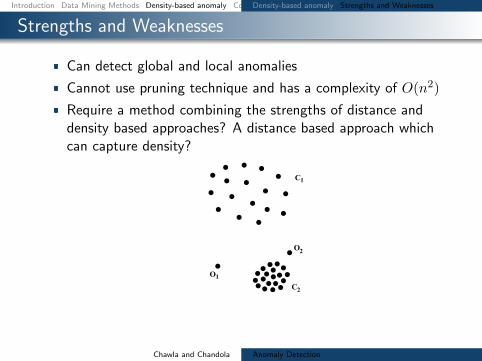
Introduction Data Mining Methods Density-based anomaly Commute Time Approach Addressing Scalability Anomalies in Complex Data Evaluating Anomaly Detection Methods Applications Problem solutionsDensity-based anomaly Strengths and Weaknesses
Strengths and Weaknesses
Can detect global and local anomalies
Cannot use pruning technique and has a complexity of O(n2)
Require a method combining the strengths of distance anddensity based approaches A distance based approach whichcan capture density
C
C
O
O1
1
2
2
Chawla and Chandola Anomaly Detection
Introduction Data Mining Methods Density-based anomaly Commute Time Approach Addressing Scalability Anomalies in Complex Data Evaluating Anomaly Detection Methods Applications Problem solutionsCommute time Computation of commute time Anomaly detection using commute time (CDOF) Fast estimation of commute time Scalability for Density-based method PINN Algorithm (ICDM 2010) PINN Guarantee Examples high-dim distance-based outliers Examples high-dim density-based outliers Examples local density-based outliers
Commute time
Commute time between i and j is the expected number ofsteps that a random walk starting at i will take to reach jonce and go back to i for the first time
Commute time can capture both the distance between pointsand the data densities
Chawla and Chandola Anomaly Detection
Introduction Data Mining Methods Density-based anomaly Commute Time Approach Addressing Scalability Anomalies in Complex Data Evaluating Anomaly Detection Methods Applications Problem solutionsCommute time Computation of commute time Anomaly detection using commute time (CDOF) Fast estimation of commute time Scalability for Density-based method PINN Algorithm (ICDM 2010) PINN Guarantee Examples high-dim distance-based outliers Examples high-dim density-based outliers Examples local density-based outliers
Computation of commute time
Commute time can be computed using graph Laplacian matrixL
cij = VG(ei minus ej)TL+(ei minus ej)L+ pseudo-inverse of LVG graph volumeei i-th column of the identity matrix
Commute time is Euclidean distance in the space spanned byeigenvectors of L
cij = VG[(Sminus12V T )(ei minus ej)]T [(Sminus12V T )(ei minus ej)]
V S eigenvectors and eigenvalues of L
Chawla and Chandola Anomaly Detection
Introduction Data Mining Methods Density-based anomaly Commute Time Approach Addressing Scalability Anomalies in Complex Data Evaluating Anomaly Detection Methods Applications Problem solutionsCommute time Computation of commute time Anomaly detection using commute time (CDOF) Fast estimation of commute time Scalability for Density-based method PINN Algorithm (ICDM 2010) PINN Guarantee Examples high-dim distance-based outliers Examples high-dim density-based outliers Examples local density-based outliers
Anomaly detection using commute time (CDOF)
Construct the mutual k nearest neighbor graph G from thedataset
Compute the Laplacian matrix L of G and its eigensystems
Find top N anomalies using the distance-based technique incommute time with pruning rule
Complexity O(n3)
Commute time method can detect global local and groupanomalies
Chawla and Chandola Anomaly Detection
Introduction Data Mining Methods Density-based anomaly Commute Time Approach Addressing Scalability Anomalies in Complex Data Evaluating Anomaly Detection Methods Applications Problem solutionsCommute time Computation of commute time Anomaly detection using commute time (CDOF) Fast estimation of commute time Scalability for Density-based method PINN Algorithm (ICDM 2010) PINN Guarantee Examples high-dim distance-based outliers Examples high-dim density-based outliers Examples local density-based outliers
Fast estimation of commute time
Speilman and Srivastava [31] combined random projection anda linear time solver to build a structure where we can computethe compute time between two nodes in O(log n) time
Complexity of CDOF O(n3)rarr O(n log n)
Uses a near linear time solver for a linear system of equationAx = b
Spielman and Teng solvers Also see work by Iannis Koutisfrom CMU
Chawla and Chandola Anomaly Detection
Introduction Data Mining Methods Density-based anomaly Commute Time Approach Addressing Scalability Anomalies in Complex Data Evaluating Anomaly Detection Methods Applications Problem solutionsCommute time Computation of commute time Anomaly detection using commute time (CDOF) Fast estimation of commute time Scalability for Density-based method PINN Algorithm (ICDM 2010) PINN Guarantee Examples high-dim distance-based outliers Examples high-dim density-based outliers Examples local density-based outliers
Scalability for Density-based method
The pruning rule for Distance-based methods does not applyto Density-based approaches
We can go from O(n2) to nearly O(n log n) by using an index
One solution for the curse of high dimensionality is to use ofrandom projections
Chawla and Chandola Anomaly Detection
Introduction Data Mining Methods Density-based anomaly Commute Time Approach Addressing Scalability Anomalies in Complex Data Evaluating Anomaly Detection Methods Applications Problem solutionsCommute time Computation of commute time Anomaly detection using commute time (CDOF) Fast estimation of commute time Scalability for Density-based method PINN Algorithm (ICDM 2010) PINN Guarantee Examples high-dim distance-based outliers Examples high-dim density-based outliers Examples local density-based outliers
PINN Algorithm (ICDM 2010)
Chawla and Chandola Anomaly Detection
Introduction Data Mining Methods Density-based anomaly Commute Time Approach Addressing Scalability Anomalies in Complex Data Evaluating Anomaly Detection Methods Applications Problem solutionsCommute time Computation of commute time Anomaly detection using commute time (CDOF) Fast estimation of commute time Scalability for Density-based method PINN Algorithm (ICDM 2010) PINN Guarantee Examples high-dim distance-based outliers Examples high-dim density-based outliers Examples local density-based outliers
PINN Guarantee
The PINN Algorithm provides probabilistic guarantees
Under certain assumptions about intrinsic dimensionality (c)with high probability
1minus ε1 + ε
middot LOF (p) le LOF (p) le 1 + ε
1minus ε middot LOF (p)
In practice we do not know the intrinsic dimensionality ofdata However random projections are quite robust
Chawla and Chandola Anomaly Detection
Introduction Data Mining Methods Density-based anomaly Commute Time Approach Addressing Scalability Anomalies in Complex Data Evaluating Anomaly Detection Methods Applications Problem solutionsCommute time Computation of commute time Anomaly detection using commute time (CDOF) Fast estimation of commute time Scalability for Density-based method PINN Algorithm (ICDM 2010) PINN Guarantee Examples high-dim distance-based outliers Examples high-dim density-based outliers Examples local density-based outliers
Examples high-dim distance-based outliers
On a large database of images the bright images show up asdistance based outliers
Chawla and Chandola Anomaly Detection
Introduction Data Mining Methods Density-based anomaly Commute Time Approach Addressing Scalability Anomalies in Complex Data Evaluating Anomaly Detection Methods Applications Problem solutionsCommute time Computation of commute time Anomaly detection using commute time (CDOF) Fast estimation of commute time Scalability for Density-based method PINN Algorithm (ICDM 2010) PINN Guarantee Examples high-dim distance-based outliers Examples high-dim density-based outliers Examples local density-based outliers
Examples high-dim density-based outliers
On a large database of images occluded images show up asdensity based outliers
Chawla and Chandola Anomaly Detection
Introduction Data Mining Methods Density-based anomaly Commute Time Approach Addressing Scalability Anomalies in Complex Data Evaluating Anomaly Detection Methods Applications Problem solutionsCommute time Computation of commute time Anomaly detection using commute time (CDOF) Fast estimation of commute time Scalability for Density-based method PINN Algorithm (ICDM 2010) PINN Guarantee Examples high-dim distance-based outliers Examples high-dim density-based outliers Examples local density-based outliers
Examples local density-based outliers
Examples of images ranked by LOF
Chawla and Chandola Anomaly Detection
Introduction Data Mining Methods Density-based anomaly Commute Time Approach Addressing Scalability Anomalies in Complex Data Evaluating Anomaly Detection Methods Applications Problem solutions
Addressing Scalability
Chawla and Chandola Anomaly Detection
Introduction Data Mining Methods Density-based anomaly Commute Time Approach Addressing Scalability Anomalies in Complex Data Evaluating Anomaly Detection Methods Applications Problem solutions
Using GPUs for Anomaly Detection
Well suited for data parallel algorithms Using CUDA - Compute Unified Device
Architecture (Nvidia)
Need to re-engineer existing algorithms Utilization of device memory Minimize CPUhArrGPU transfer of data Keep threads homogeneous
Most model based algorithms arenaturally setup for the testing phase
Model building needs careful redesign
What about unsupervised algorithms
Kernel
Host
Grid
Device
Block(00)
Block(01)
Block(02)
Block(10)
Block(11)
Block(12)
Thread Block
Thread(00)
Thread(01)
Thread(02)
Thread(03)
Thread(10)
Thread(11)
Thread(12)
Thread(13)
Thread(20)
Thread(21)
Thread(22)
Thread(23)
Host Host Memory
SM 2
SM 1
SM 0
Registers Registers Registers
SP 0 SP 1 SP 7
Shared Memory
Global Memory
Texture Memory
Constant Memory
Device
Chawla and Chandola Anomaly Detection
Introduction Data Mining Methods Density-based anomaly Commute Time Approach Addressing Scalability Anomalies in Complex Data Evaluating Anomaly Detection Methods Applications Problem solutions
Implementing DB(kN) on GPUs
Return top N data instances whose distances tok-th nearest neighbor are largest (SerialDB(kN) is O(n2))
Involves computing pairwise distances
Load block i and block j to shared memory Data layout in memory should be optimized
Each thread computes distance between a pairof instances
Can utilize this time to load next chunk of datafrom host to device memory
Writes results to corresponding output block
Sorting can be done efficiently in CUDA [29]
d
n
T
n
n
Chawla and Chandola Anomaly Detection
Introduction Data Mining Methods Density-based anomaly Commute Time Approach Addressing Scalability Anomalies in Complex Data Evaluating Anomaly Detection Methods Applications Problem solutionsCategorical Data Discrete Sequences and Time Series Contextual Anomalies Collective Anomalies
Moving Beyond Multi-dimensional Record Data
Categorical (Mixed)
Fraud Detection
Cyber Networks
Time Series
Sensor Networks
Healthcare
Discrete Sequences
Genomic
System Calls
Spatial
GIS
Image analysis
Spatio-temporal
Remote sensing
Climate
Graphs
Social networks
Epidemiology
Chawla and Chandola Anomaly Detection
Introduction Data Mining Methods Density-based anomaly Commute Time Approach Addressing Scalability Anomalies in Complex Data Evaluating Anomaly Detection Methods Applications Problem solutionsCategorical Data Discrete Sequences and Time Series Contextual Anomalies Collective Anomalies
Handling Categorical Data
Each attribute can belong to one of many categories
No ordering between categories
Mixed data (categorical and continuous attributes)
cap-shape cap-surface middot middot middot habitat type
convex smooth urban poisonousconvex smooth grasses ediblebell smooth meadows edibleconvex scaly urban poisonousconvex smooth grasses ediblemiddot middot middot
Table Mushroom Data Set [2]
Chawla and Chandola Anomaly Detection
Introduction Data Mining Methods Density-based anomaly Commute Time Approach Addressing Scalability Anomalies in Complex Data Evaluating Anomaly Detection Methods Applications Problem solutionsCategorical Data Discrete Sequences and Time Series Contextual Anomalies Collective Anomalies
Approaches to Identify Categorical Anomalies
Using Association Analysis [24]
Binarize data
Learn rules (X rArr Y ) Choose high confidence
rules (P (Y |X))
For test record Z = 〈XY 〉find rules of the formP (Y |X)
Y is not observed whenX is observed
Using Bayesian Networks [33]
Learn Bayesian networkstructure and parameters
Compute P (Z) for test datarecord Z
Flag anomaly if P (Z) lt δ
Using Similarity Metrics [10]
Use a similarity measure (S(X1 X2))
Apply distancedensityclustering based method (eg lof)
Chawla and Chandola Anomaly Detection
Introduction Data Mining Methods Density-based anomaly Commute Time Approach Addressing Scalability Anomalies in Complex Data Evaluating Anomaly Detection Methods Applications Problem solutionsCategorical Data Discrete Sequences and Time Series Contextual Anomalies Collective Anomalies
Conditional Probability Test [18]
Identify unusual combinations of attribute values
r(at bt) =P (at bt)
P (at)P (bt)
A capB = φ Assumption If r(at bt) is low and is observed in test record t
then t is anomalous For a test record t
For each mutually exclusive pair of attribute sets ABcompute r(at bt)
Score t based on all r-values Assign minimum r-value as score Take product of all r-values
Need to compare exponential pairs of subsets Only consider subsets upto size k Ignore subsets with frequency less than a threshold α Avoid comparing independent subsets of attributes
micro(AB) ge βmicroChawla and Chandola Anomaly Detection
Introduction Data Mining Methods Density-based anomaly Commute Time Approach Addressing Scalability Anomalies in Complex Data Evaluating Anomaly Detection Methods Applications Problem solutionsCategorical Data Discrete Sequences and Time Series Contextual Anomalies Collective Anomalies
Estimating Probabilities for CPT [18]
Maximum LikelihoodEstimation
P (at bt)
P (at)P (bt)=C(at bt)
Ntimes N
C(at)times N
C(bt)
C(at) Number of traininginstances with A = at
N Total number of traininginstances
Laplace Smoothing
E(p) =C(p) + 1
N + 2
r(at bt) =E(at bt)
E(at)times E(bt)
Speedup Tricks
Replace rare attributevalues with genericattribute (reduce arity)
Use efficient datastructure to querying forcounts(AD Trees [26])
ADTrees work fasterfor low arity attributes
Chawla and Chandola Anomaly Detection
Introduction Data Mining Methods Density-based anomaly Commute Time Approach Addressing Scalability Anomalies in Complex Data Evaluating Anomaly Detection Methods Applications Problem solutionsCategorical Data Discrete Sequences and Time Series Contextual Anomalies Collective Anomalies
Finding Anomalies in Discrete Sequences
Many problem formulations
1 Anomalous symbols in asequence
2 Anomalous subsequence in asequence
3 Anomalous sequence in adatabase of sequences
See [11] for a comparativeevaluation [9] for a survey
login pwdmail ssh mail web logoutlogin pwdmail web web web web logoutlogin pwdmail ssh mail web web logoutlogin pwdwebmail ssh webmail logoutloginpwd loginpwd loginpwd logout
Chawla and Chandola Anomaly Detection
Introduction Data Mining Methods Density-based anomaly Commute Time Approach Addressing Scalability Anomalies in Complex Data Evaluating Anomaly Detection Methods Applications Problem solutionsCategorical Data Discrete Sequences and Time Series Contextual Anomalies Collective Anomalies
Treating Sequences as Points
Utilize a distancesimilarity measure Plug into a distancedensityclustering based method
Simplest Hamming Distance
h(Ai Bi) = 1 Ai 6= Bi= 0 Ai = Bi
H(AB) =nsumi=1
h(Ai Bi)
Issues Unequal lengths misalignment Normalized Length of Longest Common Subsequence
D(AB) = 1minus |LCS(AB)|radic|A||B|
Standard Dynamic Programming method is slow Faster versions available (Hunt Szymnaski method [7])
Weaknesses Cannot localize anomalies within a sequence Weak anomaly signals might get lost
Chawla and Chandola Anomaly Detection
Introduction Data Mining Methods Density-based anomaly Commute Time Approach Addressing Scalability Anomalies in Complex Data Evaluating Anomaly Detection Methods Applications Problem solutionsCategorical Data Discrete Sequences and Time Series Contextual Anomalies Collective Anomalies
Using Sliding Windows
Slide a window of size k
Extract all windows from a sequence (nminus k + 1)
Training (Creating a normal dictionary) Store all uniquewindows in all normal sequences and their counts
Testing For each window find the frequency in normal dictionary Anomaly score is inverse of the aggregate frequencies for all
windows (normalized by length)
Many variants exist For each window find the hamming distance to the closest
window in the normal dictionary [16]
Issues Penalizes low frequency windows in the normal dictionary Rewards high frequency windows that might not be relevant Can construct anomalous sequences that will escape detection
Chawla and Chandola Anomaly Detection
Introduction Data Mining Methods Density-based anomaly Commute Time Approach Addressing Scalability Anomalies in Complex Data Evaluating Anomaly Detection Methods Applications Problem solutionsCategorical Data Discrete Sequences and Time Series Contextual Anomalies Collective Anomalies
Using Probabilistic Models
Probability of occurrence of sequence S
P (S) =nprodi=1
P (Si|S1 Siminus1)
Short memory property of sequences
P (Si|S1 Siminus1) = P (Si|Siminusk Siminus1)
Conditional probability estimates for a symbol Si
P (Si|Siminusk Siminus1) =f(Si|Siminusk Si)f(Si|Siminusk Siminus1)
f is estimated from the normal dictionary
Anomaly score for a test sequence is inverse of the normalizedprobability of occurrence
Issues What if the suffix occurs very infrequently in thenormal data (or not at all)
Replace with the longest suffix that occurs sufficient number oftimes [32] - Probabilistic Suffix Trees
Significantly reduces the size of the modelChawla and Chandola Anomaly Detection
Introduction Data Mining Methods Density-based anomaly Commute Time Approach Addressing Scalability Anomalies in Complex Data Evaluating Anomaly Detection Methods Applications Problem solutionsCategorical Data Discrete Sequences and Time Series Contextual Anomalies Collective Anomalies
Finding Contextual Anomalies
Sometimes contextual information isavailable about data
Not used directly as a feature Are well understood no anomalies in
the context Can reduce false positives and yield
interesting anomalies
Example adapted from [30]
Clearest Outlier
Conditional Anomaly
Maximum Daily Temperature
Number
ofFever
Cases
Contextual anomalies - Anomalous with respect to a context Context is defined using environmental variables
Spatial (Latitude Longitude) Graph context (Edges Weights) Temporal location Domain specific (Demographic other)
How to incorporate context Reduce to traditional anomaly detection (subset on context) Explicitly model contextual information (time series spatial)
Chawla and Chandola Anomaly Detection
Introduction Data Mining Methods Density-based anomaly Commute Time Approach Addressing Scalability Anomalies in Complex Data Evaluating Anomaly Detection Methods Applications Problem solutionsCategorical Data Discrete Sequences and Time Series Contextual Anomalies Collective Anomalies
Conditional Anomaly Detection
Data instance d rArru1 u2 udU v1 v2 vdV
dU environmentalattributes
dV indicator attributes u1
u2
U1
U2
U3
v1
v2
V1V2
V3
p(V1|U3) = 02
p(V2|U3) = 02
p(V3|U3) = 06
Algorithm [30]
1 Learn a Gaussian Mixture Model (GMM)U = U1 U2 UnU
each with dimensionality dU2 Learn a set of Gaussians U = V1 V2 VnV
each withdimensionality dV
3 Learn a probabilistic mapping function p(Vj |Ui)4 Score a test instance d = [uv]
S =
nUsumi=1
p(u|Ui)nVsumj=1
p(v|Vj)p(Vj |Ui)
Chawla and Chandola Anomaly Detection
Introduction Data Mining Methods Density-based anomaly Commute Time Approach Addressing Scalability Anomalies in Complex Data Evaluating Anomaly Detection Methods Applications Problem solutionsCategorical Data Discrete Sequences and Time Series Contextual Anomalies Collective Anomalies
Finding Collective Anomalies
Find a collection of data points
Each point by itself is normal
The collection as a whole isanomalous
Relevant when data has inherentstructure and
When domain definition ofanomalies cannot be described aspoint anomalies
A Simple Solution
1 Break data intogroups
2 Compute features foreach group
3 Apply traditionalanomaly detection
Examples
1 Time series
2 Image
3 Spatial clusters ofgalaxies
Chawla and Chandola Anomaly Detection
Introduction Data Mining Methods Density-based anomaly Commute Time Approach Addressing Scalability Anomalies in Complex Data Evaluating Anomaly Detection Methods Applications Problem solutionsCategorical Data Discrete Sequences and Time Series Contextual Anomalies Collective Anomalies
Using Latent Dirichlet Allocation for Group Anomalies
Find anomalous groups in data [34]
Example Spatial clusters of galaxies topics red green emissive words continuous features
Flexible Genre Model (FGM)
For each group
1 Draw a genre 1 2 T 3 ym simM(π)2 Draw topic distribution forym SK 3 θm sim Dir(αym)
3 Draw K topicsβmk sim P (βmk|ηk)k=12K
4 For each point in group
1 Draw topic membershipzmn simM(θn)
2 Generate pointxmn isin P (xmn|βmzmn)
α
zmn
xmn
N
θm
T
π
ηK
ym
β
MK
Model Parameters
M(π) -Multinomial
Genre - Dir(αt)
Topic generatorsP (|ηk)- GIW
Point generatorsP (xmn|βnk) -MultivariateGaussian
Chawla and Chandola Anomaly Detection
Introduction Data Mining Methods Density-based anomaly Commute Time Approach Addressing Scalability Anomalies in Complex Data Evaluating Anomaly Detection Methods Applications Problem solutionsCategorical Data Discrete Sequences and Time Series Contextual Anomalies Collective Anomalies
Inference and Testing for FGM
Inference and Learning Parameters
Approximate inference of latentvariables (Gibbs Sampling)
Use samples to learn parameters(Single step Monte Carlo EM)
Topic 1
Topic 2
Topic 3
Anomaly Detection
Infer the topic distribution θm
Compute negative log likelihood wrt αt
Rationale An anomalous group will be unlikely to begenerated from any genre
Geometric interpretation Mapping each group into a Tdimensional space and finding anomalies
Chawla and Chandola Anomaly Detection
Introduction Data Mining Methods Density-based anomaly Commute Time Approach Addressing Scalability Anomalies in Complex Data Evaluating Anomaly Detection Methods Applications Problem solutions
Evaluating Anomaly Detection Methods - Labels
Labeled validation data set exists Confusion matrix Traditional evaluation metrics
Class imbalance
ROC Curve
Validation set does not exist Use domain expertise to find TP
and FP FN is harder to estimate
Pseudo false negativeestimation techniques [25]
Predicteda n
Actuala TP FNn FP TN
Acc =TP + TNsum
Rec (R) =TP
TP + FN
Prec (P ) =TP
TP + FP
F =2 lowastR lowast PR+ P
Chawla and Chandola Anomaly Detection
Introduction Data Mining Methods Density-based anomaly Commute Time Approach Addressing Scalability Anomalies in Complex Data Evaluating Anomaly Detection Methods Applications Problem solutions
Evaluating Anomaly Detection Methods - Scores
Convert to binary output Use threshold δ on score (Scale
issues [21]) Take top x as anomalies
ROC curve by varying x or δ
Quality of output Does the output ldquosuggestrdquo x or δ Which output is better
Chawla and Chandola Anomaly Detection
Introduction Data Mining Methods Density-based anomaly Commute Time Approach Addressing Scalability Anomalies in Complex Data Evaluating Anomaly Detection Methods Applications Problem solutions
Unifying Scores
Different methods assign scores in differentranges
kNN-based scores [0 1] Lof scores [1 6] ABOD scores [0 80000]
Anomalies have lower scores
Direct scaling to [0 1] might lose distinctionbetween normal and anomalies
Desired scaling Stretch interesting rangesand shrink irrelevant ones
Generalized Procedure for Normalizing Outlier Scores [21] Regularity rArr S(o) ge 0forallo S(o) asymp 0 if o is normal andS(o) 0 if o is anomalous
Normality S is regular and S(o) isin [0 1]forallo
Chawla and Chandola Anomaly Detection
Introduction Data Mining Methods Density-based anomaly Commute Time Approach Addressing Scalability Anomalies in Complex Data Evaluating Anomaly Detection Methods Applications Problem solutions
Regularization and Normalization of Scores
Regularization
1 R(o) = max0 S(o)minus baseS2 R(o) = Smax minus S(o)
3 R(o) = minus log SmaxS(o)
Normalization
1 N(o) = S(o)Smax
2 N(o) = max(
0 erf(S(o)minusmicroSσS radic2
))(Gaussian Scaling)
Suited for high dimensional data
3 N(o) = max(
0cdfγS (o)minusmicroγ
1minusmicroγ
)(Gamma Scaling)
Where cdfγS (o) = P (k S(o) θ) P is the regularized Gamma function Suited for low dimensional data
Chawla and Chandola Anomaly Detection
Introduction Data Mining Methods Density-based anomaly Commute Time Approach Addressing Scalability Anomalies in Complex Data Evaluating Anomaly Detection Methods Applications Problem solutions
Generating Labeled Data for Validation
Generating Both Normal and Anomalous Data
Use generative models for normal and anomalous behavior
Several generators available Multivariate continuous data [27] Multivariate categorical data [5] Discrete sequences using HMM [12]
Drawbacks Might not capture the domain characteristics
Injecting Anomalies - Random Perturbation[30]
Given data point z = xy x and y arepartitions of feature space
Take a random sample D of the entire data set
Let zprime = xprimeyprime isin D such that distancebetween y and yprime is maximum
Replace x with xprime and add z back to data setx
yz
zprime
Injected anomaly
Chawla and Chandola Anomaly Detection
Introduction Data Mining Methods Density-based anomaly Commute Time Approach Addressing Scalability Anomalies in Complex Data Evaluating Anomaly Detection Methods Applications Problem solutionsWhat is Network Anomaly Detection Motivation How Much Serious
Applications Overview
How to set up an anomaly detection solution for agiven application domain
Available data Define anomalies define normal behavior Identify requirements and constraints (online
real-time limited resources) What domain knowledge available
Feature identification Defining normal and anomalous behavior Tuning parameters
Available ground truth (training validation)
Chawla and Chandola Anomaly Detection
Introduction Data Mining Methods Density-based anomaly Commute Time Approach Addressing Scalability Anomalies in Complex Data Evaluating Anomaly Detection Methods Applications Problem solutionsWhat is Network Anomaly Detection Motivation How Much Serious
What is Network Anomaly Detection
Anomaly Detection or Intrusion Detection
Traditional Intrusion Detection Systems (IDS) finding attackscorresponding to predefined pattern data set known as signaturestherefore system is absolutely vulnerable against zero-day attacks
Network Anomaly Detection Systems (NADS) to detectzero-day attacks without any pre-identified signature besides profilenormal behavior of the network and address suspected incidents
Network Anomaly Detection finding unusual and largechanges in the network traffic
Examples intentional attacks (eg Distributed Denial ofService - DDoS) or unusual network traffic (eg flash crowds)
Chawla and Chandola Anomaly Detection
Introduction Data Mining Methods Density-based anomaly Commute Time Approach Addressing Scalability Anomalies in Complex Data Evaluating Anomaly Detection Methods Applications Problem solutionsWhat is Network Anomaly Detection Motivation How Much Serious
Motivation How Much Serious
According to Symantec report released in early 2011 morethan 286 million new threats have been detected in 2010which is a huge number
1656227
2704836
1000000
1500000
2000000
2500000
3000000
20547 18827 69107 113025 140690
624267
1656227
2704836
0
500000
1000000
1500000
2000000
2500000
3000000
2002 2003 2004 2005 2006 2007 2008 July2009-June2010
Chawla and Chandola Anomaly Detection
Introduction Data Mining Methods Density-based anomaly Commute Time Approach Addressing Scalability Anomalies in Complex Data Evaluating Anomaly Detection Methods Applications Problem solutionsNetwork Topology Network Anomalies Detection Problem Network Anomalies Detection Problem Why care about OD Flows
Network Topology
A Typical network
1 y
Router
2
3
41t
x2t
x1t
x3t
x4t
Origin-Destination (OD) flow is the traffic that enters at anorigin node and exits at a destination node of a backbonenetwork x1t x1t
Link measurement is the traffic enters at an node during aninterval y1t
Relationship between link traffic and OD flow traffic iscaptured by the routing matrix A
Chawla and Chandola Anomaly Detection
Introduction Data Mining Methods Density-based anomaly Commute Time Approach Addressing Scalability Anomalies in Complex Data Evaluating Anomaly Detection Methods Applications Problem solutionsNetwork Topology Network Anomalies Detection Problem Network Anomalies Detection Problem Why care about OD Flows
Network Anomalies Detection Problem
Chawla and Chandola Anomaly Detection
Introduction Data Mining Methods Density-based anomaly Commute Time Approach Addressing Scalability Anomalies in Complex Data Evaluating Anomaly Detection Methods Applications Problem solutionsNetwork Topology Network Anomalies Detection Problem Network Anomalies Detection Problem Why care about OD Flows
Network Anomalies Detection Problem
Chawla and Chandola Anomaly Detection
Introduction Data Mining Methods Density-based anomaly Commute Time Approach Addressing Scalability Anomalies in Complex Data Evaluating Anomaly Detection Methods Applications Problem solutionsNetwork Topology Network Anomalies Detection Problem Network Anomalies Detection Problem Why care about OD Flows
Why care about OD Flows
Volume anomaly typically arises on an OD flow (trafficarriving at one node and destined for another node)
If we only monitor traffic on network links volume arisingfrom an OD flow may not be noticeable Thus naiveapproach wont work if OD flow info is not available
Figure source [22]
Chawla and Chandola Anomaly Detection
Introduction Data Mining Methods Density-based anomaly Commute Time Approach Addressing Scalability Anomalies in Complex Data Evaluating Anomaly Detection Methods Applications Problem solutionsPCA and Subspace Method Subspace Method Algorithm Subspace Analysis Results Discussion Typical Characteristics of Anomaly Limitation of Volume Entropy Based versus Volume Based Fraud Detection Epidemeology Anomaly Detection in Climate and Weather Anomalies in Climate Validation of Anomalies
PCA and Subspace Method
Chawla and Chandola Anomaly Detection
Introduction Data Mining Methods Density-based anomaly Commute Time Approach Addressing Scalability Anomalies in Complex Data Evaluating Anomaly Detection Methods Applications Problem solutionsPCA and Subspace Method Subspace Method Algorithm Subspace Analysis Results Discussion Typical Characteristics of Anomaly Limitation of Volume Entropy Based versus Volume Based Fraud Detection Epidemeology Anomaly Detection in Climate and Weather Anomalies in Climate Validation of Anomalies
Subspace Method Algorithm
Step1- Determine the PCs based on eigenvaluedecomposition of the covariance matrix of the dataset
Step2- Choose first top k principle components with thehighest eigenvalues as matrix P
Step3-normal traffic subspace called Z
Z = PP TZ = CZ
Step4-abnormal traffic subspace called Z
Z = (I minus PP T )Z = CZ
Step5-If the norm of a vector is large then it is an rdquoanomalyrdquo
Chawla and Chandola Anomaly Detection
Introduction Data Mining Methods Density-based anomaly Commute Time Approach Addressing Scalability Anomalies in Complex Data Evaluating Anomaly Detection Methods Applications Problem solutionsPCA and Subspace Method Subspace Method Algorithm Subspace Analysis Results Discussion Typical Characteristics of Anomaly Limitation of Volume Entropy Based versus Volume Based Fraud Detection Epidemeology Anomaly Detection in Climate and Weather Anomalies in Climate Validation of Anomalies
Subspace Analysis Results
Note that during anomaly normal component does not changethat much while residual component changes quite a lot
Thus anomalies can be detected by setting some threshold
Figure source [22]
Chawla and Chandola Anomaly Detection
Introduction Data Mining Methods Density-based anomaly Commute Time Approach Addressing Scalability Anomalies in Complex Data Evaluating Anomaly Detection Methods Applications Problem solutionsPCA and Subspace Method Subspace Method Algorithm Subspace Analysis Results Discussion Typical Characteristics of Anomaly Limitation of Volume Entropy Based versus Volume Based Fraud Detection Epidemeology Anomaly Detection in Climate and Weather Anomalies in Climate Validation of Anomalies
Discussion Typical Characteristics of Anomaly
Most Anomalies induce a change in distributionalaspects of packet header fields (called features)
Most important features include 5-tuple Source ampdestination IP addresses Source and destination portnumbers and IP protocol
raquo DOS attack ndash multiple source IP address concentrated on asingle destination IP address
raquo Network scan ndash dispersed distribution of destination addresses
raquo Most wormsviruses also induce some change in distribution ofcertain features
raquo However these changes can be very subtle and mining them islike searching for needles in a haystack
Unlike many previous approach this paper aims todetect events which disturb the distribution of trafficfeatures rather than traffic volume
Chawla and Chandola Anomaly Detection
Introduction Data Mining Methods Density-based anomaly Commute Time Approach Addressing Scalability Anomalies in Complex Data Evaluating Anomaly Detection Methods Applications Problem solutionsPCA and Subspace Method Subspace Method Algorithm Subspace Analysis Results Discussion Typical Characteristics of Anomaly Limitation of Volume Entropy Based versus Volume Based Fraud Detection Epidemeology Anomaly Detection in Climate and Weather Anomalies in Climate Validation of Anomalies
Limitation of Volume
Figure source [22]
Port scan anomaly (traffic feature changes however traffic volume
remains more or less the same)
We can use entropy tocapture the variationsin the traffic feature
bullTakes value 0 when distribution is maximally concentratedbullTakes value log2N when distribution is maximally dispersed
But stands out in
feature entropy
which also reveals
its structure
Port scan
dwarfed
in volume
metricshellip
Chawla and Chandola Anomaly Detection
Introduction Data Mining Methods Density-based anomaly Commute Time Approach Addressing Scalability Anomalies in Complex Data Evaluating Anomaly Detection Methods Applications Problem solutionsPCA and Subspace Method Subspace Method Algorithm Subspace Analysis Results Discussion Typical Characteristics of Anomaly Limitation of Volume Entropy Based versus Volume Based Fraud Detection Epidemeology Anomaly Detection in Climate and Weather Anomalies in Climate Validation of Anomalies
Entropy Based versus Volume Based
DoSDDoS Attacks- a spike in traffic data toward adominant destination IP
Scan anomaly-a spike in traffic data from a dominant sourceIP
Flash Crowd anomaly- again a spike in traffic data to adominant destination IP
Worm anomaly-a Spike in traffic with a dominant port
Chawla and Chandola Anomaly Detection
Introduction Data Mining Methods Density-based anomaly Commute Time Approach Addressing Scalability Anomalies in Complex Data Evaluating Anomaly Detection Methods Applications Problem solutionsPCA and Subspace Method Subspace Method Algorithm Subspace Analysis Results Discussion Typical Characteristics of Anomaly Limitation of Volume Entropy Based versus Volume Based Fraud Detection Epidemeology Anomaly Detection in Climate and Weather Anomalies in Climate Validation of Anomalies
Fraud Detection
Domain Question Identifyfraudulent activities or players fromobserved transaction data
Data Transactions between different
players in the system Meta information about the
individuals An underlying graph structure
Challenges Track and model human behavior Anomalies caused by adaptive
human adversaries Massive data sizes
Insurance (autohealtha)
ClaimantProvider Payer
Telecommunications Customer
Provider
Credit Cards Customer
Supplier Bank
Web Advertising User Advertiser
Publisher
ahttpwwwcheatingculturecompast-cases-of-medicare-fraud
Chawla and Chandola Anomaly Detection
Introduction Data Mining Methods Density-based anomaly Commute Time Approach Addressing Scalability Anomalies in Complex Data Evaluating Anomaly Detection Methods Applications Problem solutionsPCA and Subspace Method Subspace Method Algorithm Subspace Analysis Results Discussion Typical Characteristics of Anomaly Limitation of Volume Entropy Based versus Volume Based Fraud Detection Epidemeology Anomaly Detection in Climate and Weather Anomalies in Climate Validation of Anomalies
A Generic Fraud Detection Method
Activity Monitoring [13]1 Build profiles for individuals (customers users etc) based on
historic data User X makes n calls on an average in January
2 Compare current behavior with historical profile for significantdeviations
Clustering based [4]1 Cluster historical profiles of customers2 Identify small clusters or outlying profiles as anomalies
Strengths Anomaly detection is fast (good for real time) Results are easy to explain
Weaknesses Need to create and maintain a large number of profiles Not dynamic Adequate historical data might not be available Too many false positives
Chawla and Chandola Anomaly Detection
Introduction Data Mining Methods Density-based anomaly Commute Time Approach Addressing Scalability Anomalies in Complex Data Evaluating Anomaly Detection Methods Applications Problem solutionsPCA and Subspace Method Subspace Method Algorithm Subspace Analysis Results Discussion Typical Characteristics of Anomaly Limitation of Volume Entropy Based versus Volume Based Fraud Detection Epidemeology Anomaly Detection in Climate and Weather Anomalies in Climate Validation of Anomalies
Exploiting Graph Structure - Weighted Graphs
Represent data as a weighted graph Communication networks (phone email SMS) Provider referral networks
Objective Identify anomalous nodes
For each node extract several features based on the propertiesof the induced sub-graph (egonet) of neighboring nodes [1]
Choose features that can highlight anomalous nodes
1 Ni degree of node2 Ei number of edges in egonet3 Wi total weight of egonet4 λi principal eigen vector of weighted adjacency matrix of
egonet
Data is transformed into a point in a multi-dimensional space
Chawla and Chandola Anomaly Detection
Introduction Data Mining Methods Density-based anomaly Commute Time Approach Addressing Scalability Anomalies in Complex Data Evaluating Anomaly Detection Methods Applications Problem solutionsPCA and Subspace Method Subspace Method Algorithm Subspace Analysis Results Discussion Typical Characteristics of Anomaly Limitation of Volume Entropy Based versus Volume Based Fraud Detection Epidemeology Anomaly Detection in Climate and Weather Anomalies in Climate Validation of Anomalies
Identifying Anomalies
Traditional anomaly detection (lof) Can be slow but can identify any type of anomalous structure
Faster method to identify specific types of anomalousstructures
Identify relevant feature pairs and power law relationship
Eg Egonet Density Power Law Ni vs Ei - detect nearcliques and stars
Ei prop Nαi 1 le α le 2
Anomaly score for node i wrt a pair of features (y = Cxθ)
Si =max(yi Cx
θi )
min(yi Cxθi )lowast log (|yi minus Cxθi |+ 1)
Chawla and Chandola Anomaly Detection
Introduction Data Mining Methods Density-based anomaly Commute Time Approach Addressing Scalability Anomalies in Complex Data Evaluating Anomaly Detection Methods Applications Problem solutionsPCA and Subspace Method Subspace Method Algorithm Subspace Analysis Results Discussion Typical Characteristics of Anomaly Limitation of Volume Entropy Based versus Volume Based Fraud Detection Epidemeology Anomaly Detection in Climate and Weather Anomalies in Climate Validation of Anomalies
Exploiting Graph Structure - Bipartite Graphs
Represent data as a bipartite graph Healthcare Data (Beneficiaries vs Providers) Insider trading (Traders vs Stocks)
Objective Identify anomalous links
Given a query node a isin V1 find the ldquorelevancerdquoof all other nodes in V1 to a
RelevanceScore(a b) prop Number of times aldquorandom walkrdquo from a reaches b
Use the relevance scores to compute thenormality scores for a node t isin V2
Find set St = a|〈a t〉 isin E Compute |St| times |St| similarity matrix using
relevance vectors for a isin St Normality Score = mean of non-diagonal entries
of similarity matrix
V1 E V2a1
a2
a3
an
t1
t2
t3
tn
Chawla and Chandola Anomaly Detection
Introduction Data Mining Methods Density-based anomaly Commute Time Approach Addressing Scalability Anomalies in Complex Data Evaluating Anomaly Detection Methods Applications Problem solutionsPCA and Subspace Method Subspace Method Algorithm Subspace Analysis Results Discussion Typical Characteristics of Anomaly Limitation of Volume Entropy Based versus Volume Based Fraud Detection Epidemeology Anomaly Detection in Climate and Weather Anomalies in Climate Validation of Anomalies
Detecting Disease Outbreaks
Domain Question Early detection of disease
outbreaks Anthrax attack
Data Emergency department visits Grocery data (Example [14]) Clinical visits Weatherclimate data
Challenges Weak signals in the data
ED cases involving cough rArrFlu or SARS
Integration of multiple signals(lag analysis)
Account for spatial and temporalcorrelations
Chawla and Chandola Anomaly Detection
Introduction Data Mining Methods Density-based anomaly Commute Time Approach Addressing Scalability Anomalies in Complex Data Evaluating Anomaly Detection Methods Applications Problem solutionsPCA and Subspace Method Subspace Method Algorithm Subspace Analysis Results Discussion Typical Characteristics of Anomaly Limitation of Volume Entropy Based versus Volume Based Fraud Detection Epidemeology Anomaly Detection in Climate and Weather Anomalies in Climate Validation of Anomalies
Whatrsquos Significant About Recent Events (WSARE) [33]
1 Learn Bayesian network from historical data Environmental and response variables
2 Sample from the BN (DBbaseline|Current Environment)3 Compute contingency table for rules for DBbaseline andDBcurrent
Rules are single assignment rules (Xi = Y ji ) or conjunctions4 Find p-value for rules using χ2-test
Null Hypothesis Rows and columns of tables for DBbaselineand DBcurrent are independent
5 Find rule with largest p-value Repeat Step 2
Chawla and Chandola Anomaly Detection
Introduction Data Mining Methods Density-based anomaly Commute Time Approach Addressing Scalability Anomalies in Complex Data Evaluating Anomaly Detection Methods Applications Problem solutionsPCA and Subspace Method Subspace Method Algorithm Subspace Analysis Results Discussion Typical Characteristics of Anomaly Limitation of Volume Entropy Based versus Volume Based Fraud Detection Epidemeology Anomaly Detection in Climate and Weather Anomalies in Climate Validation of Anomalies
Incorporating Spatial and Temporal Relationships
WSARE does not explicitly model the spatial and temporalrelationships
What happened yesterday What happened in the adjoining neighborhood (yesterday)
Bayesian Network Spatio-Temporal (BNST) modelingframework [17]
Add nodes for temporal and spatial dependencies Need more data to train
Chawla and Chandola Anomaly Detection
Introduction Data Mining Methods Density-based anomaly Commute Time Approach Addressing Scalability Anomalies in Complex Data Evaluating Anomaly Detection Methods Applications Problem solutionsPCA and Subspace Method Subspace Method Algorithm Subspace Analysis Results Discussion Typical Characteristics of Anomaly Limitation of Volume Entropy Based versus Volume Based Fraud Detection Epidemeology Anomaly Detection in Climate and Weather Anomalies in Climate Validation of Anomalies
Anomaly Detection in Climate and Weather
Science Questions Identify natural and anthropogenic disasters Identify long time scale events - droughts atmospheric rivers
cold fronts etc
Data Ground observations Remote sensing data (satellites
air-borne) Climate model simulation outputs Multiple variables spatio-temporal (often has height dimension
as well)
Challenges Model spatio-temporal relationships across multiple variables Explain the cause of anomalies Massive data sizes
Climate and weather extreme events are well defined
Key challenge is to find significant events and explain the cause
Chawla and Chandola Anomaly Detection
Introduction Data Mining Methods Density-based anomaly Commute Time Approach Addressing Scalability Anomalies in Complex Data Evaluating Anomaly Detection Methods Applications Problem solutionsPCA and Subspace Method Subspace Method Algorithm Subspace Analysis Results Discussion Typical Characteristics of Anomaly Limitation of Volume Entropy Based versus Volume Based Fraud Detection Epidemeology Anomaly Detection in Climate and Weather Anomalies in Climate Validation of Anomalies
Anomalies are Widely Used in Climate
Most analysis done on ldquoanomalyrdquo time series
Difference from a ldquobase periodrdquo (Toosimplistic)
Brings spatial smoothness (eg a mountaintop and nearby valley can have very differenttemperatures) Removes seasonality
Understand climate and weatherphenomenon
Southern Oscillation Index (SOI) Difference between Sea Level Pressure
(SLP) anomalies for Tahiti and DarwinAustralia
Figure Global AverageTemperature Anomaly(1975 - 2007) Srcwwwmetofficegovuk
Chawla and Chandola Anomaly Detection
Introduction Data Mining Methods Density-based anomaly Commute Time Approach Addressing Scalability Anomalies in Complex Data Evaluating Anomaly Detection Methods Applications Problem solutionsPCA and Subspace Method Subspace Method Algorithm Subspace Analysis Results Discussion Typical Characteristics of Anomaly Limitation of Volume Entropy Based versus Volume Based Fraud Detection Epidemeology Anomaly Detection in Climate and Weather Anomalies in Climate Validation of Anomalies
Constructing Anomalies from Raw Data
Anomaly time series for a given location i
vprimei = vi minus bi
where bi is the base (reference)
How to choose bi Mean of all data for location i Monthly mean values (account for seasonality) Monthly z-score values Median (more robust) Using a shorter ldquoreference periodrdquo
30 year moving window
Different methods show statistically significant differences[19] What is the right strategy Weighted mean of different strategies (Pick weights using
Monte Carlo sampling)
Chawla and Chandola Anomaly Detection
Introduction Data Mining Methods Density-based anomaly Commute Time Approach Addressing Scalability Anomalies in Complex Data Evaluating Anomaly Detection Methods Applications Problem solutionsPCA and Subspace Method Subspace Method Algorithm Subspace Analysis Results Discussion Typical Characteristics of Anomaly Limitation of Volume Entropy Based versus Volume Based Fraud Detection Epidemeology Anomaly Detection in Climate and Weather Anomalies in Climate Validation of Anomalies
Anomaly Detection for Identifying Droughts
Science question Identify significant drought patterns usinghistorical observation data or future simulation data or both
Find persistent spatiotemporal anomalies in precipitation data
A two step approach
1 Find precipitationanomalies usingthresholds
2 Find large connectedcomponents across spaceand time
Matlab - bwlabelbwlabeln
Followup Science questionExplain cause
(drought190120061avi)
Figure Video courtsey Dr ArindamBanerjee
Chawla and Chandola Anomaly Detection
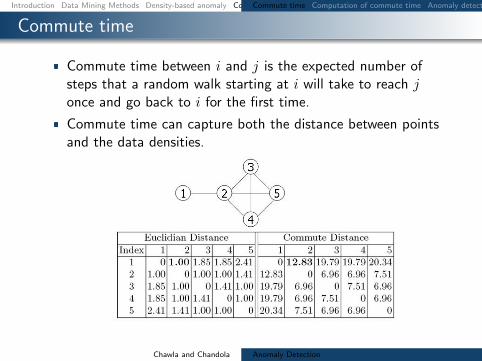
Introduction Data Mining Methods Density-based anomaly Commute Time Approach Addressing Scalability Anomalies in Complex Data Evaluating Anomaly Detection Methods Applications Problem solutionsCommute time Computation of commute time Anomaly detection using commute time (CDOF) Fast estimation of commute time Scalability for Density-based method PINN Algorithm (ICDM 2010) PINN Guarantee Examples high-dim distance-based outliers Examples high-dim density-based outliers Examples local density-based outliers
Commute time
Commute time between i and j is the expected number ofsteps that a random walk starting at i will take to reach jonce and go back to i for the first time
Commute time can capture both the distance between pointsand the data densities
Chawla and Chandola Anomaly Detection
Introduction Data Mining Methods Density-based anomaly Commute Time Approach Addressing Scalability Anomalies in Complex Data Evaluating Anomaly Detection Methods Applications Problem solutionsCommute time Computation of commute time Anomaly detection using commute time (CDOF) Fast estimation of commute time Scalability for Density-based method PINN Algorithm (ICDM 2010) PINN Guarantee Examples high-dim distance-based outliers Examples high-dim density-based outliers Examples local density-based outliers
Computation of commute time
Commute time can be computed using graph Laplacian matrixL
cij = VG(ei minus ej)TL+(ei minus ej)L+ pseudo-inverse of LVG graph volumeei i-th column of the identity matrix
Commute time is Euclidean distance in the space spanned byeigenvectors of L
cij = VG[(Sminus12V T )(ei minus ej)]T [(Sminus12V T )(ei minus ej)]
V S eigenvectors and eigenvalues of L
Chawla and Chandola Anomaly Detection
Introduction Data Mining Methods Density-based anomaly Commute Time Approach Addressing Scalability Anomalies in Complex Data Evaluating Anomaly Detection Methods Applications Problem solutionsCommute time Computation of commute time Anomaly detection using commute time (CDOF) Fast estimation of commute time Scalability for Density-based method PINN Algorithm (ICDM 2010) PINN Guarantee Examples high-dim distance-based outliers Examples high-dim density-based outliers Examples local density-based outliers
Anomaly detection using commute time (CDOF)
Construct the mutual k nearest neighbor graph G from thedataset
Compute the Laplacian matrix L of G and its eigensystems
Find top N anomalies using the distance-based technique incommute time with pruning rule
Complexity O(n3)
Commute time method can detect global local and groupanomalies
Chawla and Chandola Anomaly Detection
Introduction Data Mining Methods Density-based anomaly Commute Time Approach Addressing Scalability Anomalies in Complex Data Evaluating Anomaly Detection Methods Applications Problem solutionsCommute time Computation of commute time Anomaly detection using commute time (CDOF) Fast estimation of commute time Scalability for Density-based method PINN Algorithm (ICDM 2010) PINN Guarantee Examples high-dim distance-based outliers Examples high-dim density-based outliers Examples local density-based outliers
Fast estimation of commute time
Speilman and Srivastava [31] combined random projection anda linear time solver to build a structure where we can computethe compute time between two nodes in O(log n) time
Complexity of CDOF O(n3)rarr O(n log n)
Uses a near linear time solver for a linear system of equationAx = b
Spielman and Teng solvers Also see work by Iannis Koutisfrom CMU
Chawla and Chandola Anomaly Detection
Introduction Data Mining Methods Density-based anomaly Commute Time Approach Addressing Scalability Anomalies in Complex Data Evaluating Anomaly Detection Methods Applications Problem solutionsCommute time Computation of commute time Anomaly detection using commute time (CDOF) Fast estimation of commute time Scalability for Density-based method PINN Algorithm (ICDM 2010) PINN Guarantee Examples high-dim distance-based outliers Examples high-dim density-based outliers Examples local density-based outliers
Scalability for Density-based method
The pruning rule for Distance-based methods does not applyto Density-based approaches
We can go from O(n2) to nearly O(n log n) by using an index
One solution for the curse of high dimensionality is to use ofrandom projections
Chawla and Chandola Anomaly Detection
Introduction Data Mining Methods Density-based anomaly Commute Time Approach Addressing Scalability Anomalies in Complex Data Evaluating Anomaly Detection Methods Applications Problem solutionsCommute time Computation of commute time Anomaly detection using commute time (CDOF) Fast estimation of commute time Scalability for Density-based method PINN Algorithm (ICDM 2010) PINN Guarantee Examples high-dim distance-based outliers Examples high-dim density-based outliers Examples local density-based outliers
PINN Algorithm (ICDM 2010)
Chawla and Chandola Anomaly Detection
Introduction Data Mining Methods Density-based anomaly Commute Time Approach Addressing Scalability Anomalies in Complex Data Evaluating Anomaly Detection Methods Applications Problem solutionsCommute time Computation of commute time Anomaly detection using commute time (CDOF) Fast estimation of commute time Scalability for Density-based method PINN Algorithm (ICDM 2010) PINN Guarantee Examples high-dim distance-based outliers Examples high-dim density-based outliers Examples local density-based outliers
PINN Guarantee
The PINN Algorithm provides probabilistic guarantees
Under certain assumptions about intrinsic dimensionality (c)with high probability
1minus ε1 + ε
middot LOF (p) le LOF (p) le 1 + ε
1minus ε middot LOF (p)
In practice we do not know the intrinsic dimensionality ofdata However random projections are quite robust
Chawla and Chandola Anomaly Detection
Introduction Data Mining Methods Density-based anomaly Commute Time Approach Addressing Scalability Anomalies in Complex Data Evaluating Anomaly Detection Methods Applications Problem solutionsCommute time Computation of commute time Anomaly detection using commute time (CDOF) Fast estimation of commute time Scalability for Density-based method PINN Algorithm (ICDM 2010) PINN Guarantee Examples high-dim distance-based outliers Examples high-dim density-based outliers Examples local density-based outliers
Examples high-dim distance-based outliers
On a large database of images the bright images show up asdistance based outliers
Chawla and Chandola Anomaly Detection
Introduction Data Mining Methods Density-based anomaly Commute Time Approach Addressing Scalability Anomalies in Complex Data Evaluating Anomaly Detection Methods Applications Problem solutionsCommute time Computation of commute time Anomaly detection using commute time (CDOF) Fast estimation of commute time Scalability for Density-based method PINN Algorithm (ICDM 2010) PINN Guarantee Examples high-dim distance-based outliers Examples high-dim density-based outliers Examples local density-based outliers
Examples high-dim density-based outliers
On a large database of images occluded images show up asdensity based outliers
Chawla and Chandola Anomaly Detection
Introduction Data Mining Methods Density-based anomaly Commute Time Approach Addressing Scalability Anomalies in Complex Data Evaluating Anomaly Detection Methods Applications Problem solutionsCommute time Computation of commute time Anomaly detection using commute time (CDOF) Fast estimation of commute time Scalability for Density-based method PINN Algorithm (ICDM 2010) PINN Guarantee Examples high-dim distance-based outliers Examples high-dim density-based outliers Examples local density-based outliers
Examples local density-based outliers
Examples of images ranked by LOF
Chawla and Chandola Anomaly Detection
Introduction Data Mining Methods Density-based anomaly Commute Time Approach Addressing Scalability Anomalies in Complex Data Evaluating Anomaly Detection Methods Applications Problem solutions
Addressing Scalability
Chawla and Chandola Anomaly Detection
Introduction Data Mining Methods Density-based anomaly Commute Time Approach Addressing Scalability Anomalies in Complex Data Evaluating Anomaly Detection Methods Applications Problem solutions
Using GPUs for Anomaly Detection
Well suited for data parallel algorithms Using CUDA - Compute Unified Device
Architecture (Nvidia)
Need to re-engineer existing algorithms Utilization of device memory Minimize CPUhArrGPU transfer of data Keep threads homogeneous
Most model based algorithms arenaturally setup for the testing phase
Model building needs careful redesign
What about unsupervised algorithms
Kernel
Host
Grid
Device
Block(00)
Block(01)
Block(02)
Block(10)
Block(11)
Block(12)
Thread Block
Thread(00)
Thread(01)
Thread(02)
Thread(03)
Thread(10)
Thread(11)
Thread(12)
Thread(13)
Thread(20)
Thread(21)
Thread(22)
Thread(23)
Host Host Memory
SM 2
SM 1
SM 0
Registers Registers Registers
SP 0 SP 1 SP 7
Shared Memory
Global Memory
Texture Memory
Constant Memory
Device
Chawla and Chandola Anomaly Detection
Introduction Data Mining Methods Density-based anomaly Commute Time Approach Addressing Scalability Anomalies in Complex Data Evaluating Anomaly Detection Methods Applications Problem solutions
Implementing DB(kN) on GPUs
Return top N data instances whose distances tok-th nearest neighbor are largest (SerialDB(kN) is O(n2))
Involves computing pairwise distances
Load block i and block j to shared memory Data layout in memory should be optimized
Each thread computes distance between a pairof instances
Can utilize this time to load next chunk of datafrom host to device memory
Writes results to corresponding output block
Sorting can be done efficiently in CUDA [29]
d
n
T
n
n
Chawla and Chandola Anomaly Detection
Introduction Data Mining Methods Density-based anomaly Commute Time Approach Addressing Scalability Anomalies in Complex Data Evaluating Anomaly Detection Methods Applications Problem solutionsCategorical Data Discrete Sequences and Time Series Contextual Anomalies Collective Anomalies
Moving Beyond Multi-dimensional Record Data
Categorical (Mixed)
Fraud Detection
Cyber Networks
Time Series
Sensor Networks
Healthcare
Discrete Sequences
Genomic
System Calls
Spatial
GIS
Image analysis
Spatio-temporal
Remote sensing
Climate
Graphs
Social networks
Epidemiology
Chawla and Chandola Anomaly Detection
Introduction Data Mining Methods Density-based anomaly Commute Time Approach Addressing Scalability Anomalies in Complex Data Evaluating Anomaly Detection Methods Applications Problem solutionsCategorical Data Discrete Sequences and Time Series Contextual Anomalies Collective Anomalies
Handling Categorical Data
Each attribute can belong to one of many categories
No ordering between categories
Mixed data (categorical and continuous attributes)
cap-shape cap-surface middot middot middot habitat type
convex smooth urban poisonousconvex smooth grasses ediblebell smooth meadows edibleconvex scaly urban poisonousconvex smooth grasses ediblemiddot middot middot
Table Mushroom Data Set [2]
Chawla and Chandola Anomaly Detection
Introduction Data Mining Methods Density-based anomaly Commute Time Approach Addressing Scalability Anomalies in Complex Data Evaluating Anomaly Detection Methods Applications Problem solutionsCategorical Data Discrete Sequences and Time Series Contextual Anomalies Collective Anomalies
Approaches to Identify Categorical Anomalies
Using Association Analysis [24]
Binarize data
Learn rules (X rArr Y ) Choose high confidence
rules (P (Y |X))
For test record Z = 〈XY 〉find rules of the formP (Y |X)
Y is not observed whenX is observed
Using Bayesian Networks [33]
Learn Bayesian networkstructure and parameters
Compute P (Z) for test datarecord Z
Flag anomaly if P (Z) lt δ
Using Similarity Metrics [10]
Use a similarity measure (S(X1 X2))
Apply distancedensityclustering based method (eg lof)
Chawla and Chandola Anomaly Detection
Introduction Data Mining Methods Density-based anomaly Commute Time Approach Addressing Scalability Anomalies in Complex Data Evaluating Anomaly Detection Methods Applications Problem solutionsCategorical Data Discrete Sequences and Time Series Contextual Anomalies Collective Anomalies
Conditional Probability Test [18]
Identify unusual combinations of attribute values
r(at bt) =P (at bt)
P (at)P (bt)
A capB = φ Assumption If r(at bt) is low and is observed in test record t
then t is anomalous For a test record t
For each mutually exclusive pair of attribute sets ABcompute r(at bt)
Score t based on all r-values Assign minimum r-value as score Take product of all r-values
Need to compare exponential pairs of subsets Only consider subsets upto size k Ignore subsets with frequency less than a threshold α Avoid comparing independent subsets of attributes
micro(AB) ge βmicroChawla and Chandola Anomaly Detection
Introduction Data Mining Methods Density-based anomaly Commute Time Approach Addressing Scalability Anomalies in Complex Data Evaluating Anomaly Detection Methods Applications Problem solutionsCategorical Data Discrete Sequences and Time Series Contextual Anomalies Collective Anomalies
Estimating Probabilities for CPT [18]
Maximum LikelihoodEstimation
P (at bt)
P (at)P (bt)=C(at bt)
Ntimes N
C(at)times N
C(bt)
C(at) Number of traininginstances with A = at
N Total number of traininginstances
Laplace Smoothing
E(p) =C(p) + 1
N + 2
r(at bt) =E(at bt)
E(at)times E(bt)
Speedup Tricks
Replace rare attributevalues with genericattribute (reduce arity)
Use efficient datastructure to querying forcounts(AD Trees [26])
ADTrees work fasterfor low arity attributes
Chawla and Chandola Anomaly Detection
Introduction Data Mining Methods Density-based anomaly Commute Time Approach Addressing Scalability Anomalies in Complex Data Evaluating Anomaly Detection Methods Applications Problem solutionsCategorical Data Discrete Sequences and Time Series Contextual Anomalies Collective Anomalies
Finding Anomalies in Discrete Sequences
Many problem formulations
1 Anomalous symbols in asequence
2 Anomalous subsequence in asequence
3 Anomalous sequence in adatabase of sequences
See [11] for a comparativeevaluation [9] for a survey
login pwdmail ssh mail web logoutlogin pwdmail web web web web logoutlogin pwdmail ssh mail web web logoutlogin pwdwebmail ssh webmail logoutloginpwd loginpwd loginpwd logout
Chawla and Chandola Anomaly Detection
Introduction Data Mining Methods Density-based anomaly Commute Time Approach Addressing Scalability Anomalies in Complex Data Evaluating Anomaly Detection Methods Applications Problem solutionsCategorical Data Discrete Sequences and Time Series Contextual Anomalies Collective Anomalies
Treating Sequences as Points
Utilize a distancesimilarity measure Plug into a distancedensityclustering based method
Simplest Hamming Distance
h(Ai Bi) = 1 Ai 6= Bi= 0 Ai = Bi
H(AB) =nsumi=1
h(Ai Bi)
Issues Unequal lengths misalignment Normalized Length of Longest Common Subsequence
D(AB) = 1minus |LCS(AB)|radic|A||B|
Standard Dynamic Programming method is slow Faster versions available (Hunt Szymnaski method [7])
Weaknesses Cannot localize anomalies within a sequence Weak anomaly signals might get lost
Chawla and Chandola Anomaly Detection
Introduction Data Mining Methods Density-based anomaly Commute Time Approach Addressing Scalability Anomalies in Complex Data Evaluating Anomaly Detection Methods Applications Problem solutionsCategorical Data Discrete Sequences and Time Series Contextual Anomalies Collective Anomalies
Using Sliding Windows
Slide a window of size k
Extract all windows from a sequence (nminus k + 1)
Training (Creating a normal dictionary) Store all uniquewindows in all normal sequences and their counts
Testing For each window find the frequency in normal dictionary Anomaly score is inverse of the aggregate frequencies for all
windows (normalized by length)
Many variants exist For each window find the hamming distance to the closest
window in the normal dictionary [16]
Issues Penalizes low frequency windows in the normal dictionary Rewards high frequency windows that might not be relevant Can construct anomalous sequences that will escape detection
Chawla and Chandola Anomaly Detection
Introduction Data Mining Methods Density-based anomaly Commute Time Approach Addressing Scalability Anomalies in Complex Data Evaluating Anomaly Detection Methods Applications Problem solutionsCategorical Data Discrete Sequences and Time Series Contextual Anomalies Collective Anomalies
Using Probabilistic Models
Probability of occurrence of sequence S
P (S) =nprodi=1
P (Si|S1 Siminus1)
Short memory property of sequences
P (Si|S1 Siminus1) = P (Si|Siminusk Siminus1)
Conditional probability estimates for a symbol Si
P (Si|Siminusk Siminus1) =f(Si|Siminusk Si)f(Si|Siminusk Siminus1)
f is estimated from the normal dictionary
Anomaly score for a test sequence is inverse of the normalizedprobability of occurrence
Issues What if the suffix occurs very infrequently in thenormal data (or not at all)
Replace with the longest suffix that occurs sufficient number oftimes [32] - Probabilistic Suffix Trees
Significantly reduces the size of the modelChawla and Chandola Anomaly Detection
Introduction Data Mining Methods Density-based anomaly Commute Time Approach Addressing Scalability Anomalies in Complex Data Evaluating Anomaly Detection Methods Applications Problem solutionsCategorical Data Discrete Sequences and Time Series Contextual Anomalies Collective Anomalies
Finding Contextual Anomalies
Sometimes contextual information isavailable about data
Not used directly as a feature Are well understood no anomalies in
the context Can reduce false positives and yield
interesting anomalies
Example adapted from [30]
Clearest Outlier
Conditional Anomaly
Maximum Daily Temperature
Number
ofFever
Cases
Contextual anomalies - Anomalous with respect to a context Context is defined using environmental variables
Spatial (Latitude Longitude) Graph context (Edges Weights) Temporal location Domain specific (Demographic other)
How to incorporate context Reduce to traditional anomaly detection (subset on context) Explicitly model contextual information (time series spatial)
Chawla and Chandola Anomaly Detection
Introduction Data Mining Methods Density-based anomaly Commute Time Approach Addressing Scalability Anomalies in Complex Data Evaluating Anomaly Detection Methods Applications Problem solutionsCategorical Data Discrete Sequences and Time Series Contextual Anomalies Collective Anomalies
Conditional Anomaly Detection
Data instance d rArru1 u2 udU v1 v2 vdV
dU environmentalattributes
dV indicator attributes u1
u2
U1
U2
U3
v1
v2
V1V2
V3
p(V1|U3) = 02
p(V2|U3) = 02
p(V3|U3) = 06
Algorithm [30]
1 Learn a Gaussian Mixture Model (GMM)U = U1 U2 UnU
each with dimensionality dU2 Learn a set of Gaussians U = V1 V2 VnV
each withdimensionality dV
3 Learn a probabilistic mapping function p(Vj |Ui)4 Score a test instance d = [uv]
S =
nUsumi=1
p(u|Ui)nVsumj=1
p(v|Vj)p(Vj |Ui)
Chawla and Chandola Anomaly Detection
Introduction Data Mining Methods Density-based anomaly Commute Time Approach Addressing Scalability Anomalies in Complex Data Evaluating Anomaly Detection Methods Applications Problem solutionsCategorical Data Discrete Sequences and Time Series Contextual Anomalies Collective Anomalies
Finding Collective Anomalies
Find a collection of data points
Each point by itself is normal
The collection as a whole isanomalous
Relevant when data has inherentstructure and
When domain definition ofanomalies cannot be described aspoint anomalies
A Simple Solution
1 Break data intogroups
2 Compute features foreach group
3 Apply traditionalanomaly detection
Examples
1 Time series
2 Image
3 Spatial clusters ofgalaxies
Chawla and Chandola Anomaly Detection
Introduction Data Mining Methods Density-based anomaly Commute Time Approach Addressing Scalability Anomalies in Complex Data Evaluating Anomaly Detection Methods Applications Problem solutionsCategorical Data Discrete Sequences and Time Series Contextual Anomalies Collective Anomalies
Using Latent Dirichlet Allocation for Group Anomalies
Find anomalous groups in data [34]
Example Spatial clusters of galaxies topics red green emissive words continuous features
Flexible Genre Model (FGM)
For each group
1 Draw a genre 1 2 T 3 ym simM(π)2 Draw topic distribution forym SK 3 θm sim Dir(αym)
3 Draw K topicsβmk sim P (βmk|ηk)k=12K
4 For each point in group
1 Draw topic membershipzmn simM(θn)
2 Generate pointxmn isin P (xmn|βmzmn)
α
zmn
xmn
N
θm
T
π
ηK
ym
β
MK
Model Parameters
M(π) -Multinomial
Genre - Dir(αt)
Topic generatorsP (|ηk)- GIW
Point generatorsP (xmn|βnk) -MultivariateGaussian
Chawla and Chandola Anomaly Detection
Introduction Data Mining Methods Density-based anomaly Commute Time Approach Addressing Scalability Anomalies in Complex Data Evaluating Anomaly Detection Methods Applications Problem solutionsCategorical Data Discrete Sequences and Time Series Contextual Anomalies Collective Anomalies
Inference and Testing for FGM
Inference and Learning Parameters
Approximate inference of latentvariables (Gibbs Sampling)
Use samples to learn parameters(Single step Monte Carlo EM)
Topic 1
Topic 2
Topic 3
Anomaly Detection
Infer the topic distribution θm
Compute negative log likelihood wrt αt
Rationale An anomalous group will be unlikely to begenerated from any genre
Geometric interpretation Mapping each group into a Tdimensional space and finding anomalies
Chawla and Chandola Anomaly Detection
Introduction Data Mining Methods Density-based anomaly Commute Time Approach Addressing Scalability Anomalies in Complex Data Evaluating Anomaly Detection Methods Applications Problem solutions
Evaluating Anomaly Detection Methods - Labels
Labeled validation data set exists Confusion matrix Traditional evaluation metrics
Class imbalance
ROC Curve
Validation set does not exist Use domain expertise to find TP
and FP FN is harder to estimate
Pseudo false negativeestimation techniques [25]
Predicteda n
Actuala TP FNn FP TN
Acc =TP + TNsum
Rec (R) =TP
TP + FN
Prec (P ) =TP
TP + FP
F =2 lowastR lowast PR+ P
Chawla and Chandola Anomaly Detection
Introduction Data Mining Methods Density-based anomaly Commute Time Approach Addressing Scalability Anomalies in Complex Data Evaluating Anomaly Detection Methods Applications Problem solutions
Evaluating Anomaly Detection Methods - Scores
Convert to binary output Use threshold δ on score (Scale
issues [21]) Take top x as anomalies
ROC curve by varying x or δ
Quality of output Does the output ldquosuggestrdquo x or δ Which output is better
Chawla and Chandola Anomaly Detection
Introduction Data Mining Methods Density-based anomaly Commute Time Approach Addressing Scalability Anomalies in Complex Data Evaluating Anomaly Detection Methods Applications Problem solutions
Unifying Scores
Different methods assign scores in differentranges
kNN-based scores [0 1] Lof scores [1 6] ABOD scores [0 80000]
Anomalies have lower scores
Direct scaling to [0 1] might lose distinctionbetween normal and anomalies
Desired scaling Stretch interesting rangesand shrink irrelevant ones
Generalized Procedure for Normalizing Outlier Scores [21] Regularity rArr S(o) ge 0forallo S(o) asymp 0 if o is normal andS(o) 0 if o is anomalous
Normality S is regular and S(o) isin [0 1]forallo
Chawla and Chandola Anomaly Detection
Introduction Data Mining Methods Density-based anomaly Commute Time Approach Addressing Scalability Anomalies in Complex Data Evaluating Anomaly Detection Methods Applications Problem solutions
Regularization and Normalization of Scores
Regularization
1 R(o) = max0 S(o)minus baseS2 R(o) = Smax minus S(o)
3 R(o) = minus log SmaxS(o)
Normalization
1 N(o) = S(o)Smax
2 N(o) = max(
0 erf(S(o)minusmicroSσS radic2
))(Gaussian Scaling)
Suited for high dimensional data
3 N(o) = max(
0cdfγS (o)minusmicroγ
1minusmicroγ
)(Gamma Scaling)
Where cdfγS (o) = P (k S(o) θ) P is the regularized Gamma function Suited for low dimensional data
Chawla and Chandola Anomaly Detection
Introduction Data Mining Methods Density-based anomaly Commute Time Approach Addressing Scalability Anomalies in Complex Data Evaluating Anomaly Detection Methods Applications Problem solutions
Generating Labeled Data for Validation
Generating Both Normal and Anomalous Data
Use generative models for normal and anomalous behavior
Several generators available Multivariate continuous data [27] Multivariate categorical data [5] Discrete sequences using HMM [12]
Drawbacks Might not capture the domain characteristics
Injecting Anomalies - Random Perturbation[30]
Given data point z = xy x and y arepartitions of feature space
Take a random sample D of the entire data set
Let zprime = xprimeyprime isin D such that distancebetween y and yprime is maximum
Replace x with xprime and add z back to data setx
yz
zprime
Injected anomaly
Chawla and Chandola Anomaly Detection
Introduction Data Mining Methods Density-based anomaly Commute Time Approach Addressing Scalability Anomalies in Complex Data Evaluating Anomaly Detection Methods Applications Problem solutionsWhat is Network Anomaly Detection Motivation How Much Serious
Applications Overview
How to set up an anomaly detection solution for agiven application domain
Available data Define anomalies define normal behavior Identify requirements and constraints (online
real-time limited resources) What domain knowledge available
Feature identification Defining normal and anomalous behavior Tuning parameters
Available ground truth (training validation)
Chawla and Chandola Anomaly Detection
Introduction Data Mining Methods Density-based anomaly Commute Time Approach Addressing Scalability Anomalies in Complex Data Evaluating Anomaly Detection Methods Applications Problem solutionsWhat is Network Anomaly Detection Motivation How Much Serious
What is Network Anomaly Detection
Anomaly Detection or Intrusion Detection
Traditional Intrusion Detection Systems (IDS) finding attackscorresponding to predefined pattern data set known as signaturestherefore system is absolutely vulnerable against zero-day attacks
Network Anomaly Detection Systems (NADS) to detectzero-day attacks without any pre-identified signature besides profilenormal behavior of the network and address suspected incidents
Network Anomaly Detection finding unusual and largechanges in the network traffic
Examples intentional attacks (eg Distributed Denial ofService - DDoS) or unusual network traffic (eg flash crowds)
Chawla and Chandola Anomaly Detection
Introduction Data Mining Methods Density-based anomaly Commute Time Approach Addressing Scalability Anomalies in Complex Data Evaluating Anomaly Detection Methods Applications Problem solutionsWhat is Network Anomaly Detection Motivation How Much Serious
Motivation How Much Serious
According to Symantec report released in early 2011 morethan 286 million new threats have been detected in 2010which is a huge number
1656227
2704836
1000000
1500000
2000000
2500000
3000000
20547 18827 69107 113025 140690
624267
1656227
2704836
0
500000
1000000
1500000
2000000
2500000
3000000
2002 2003 2004 2005 2006 2007 2008 July2009-June2010
Chawla and Chandola Anomaly Detection
Introduction Data Mining Methods Density-based anomaly Commute Time Approach Addressing Scalability Anomalies in Complex Data Evaluating Anomaly Detection Methods Applications Problem solutionsNetwork Topology Network Anomalies Detection Problem Network Anomalies Detection Problem Why care about OD Flows
Network Topology
A Typical network
1 y
Router
2
3
41t
x2t
x1t
x3t
x4t
Origin-Destination (OD) flow is the traffic that enters at anorigin node and exits at a destination node of a backbonenetwork x1t x1t
Link measurement is the traffic enters at an node during aninterval y1t
Relationship between link traffic and OD flow traffic iscaptured by the routing matrix A
Chawla and Chandola Anomaly Detection
Introduction Data Mining Methods Density-based anomaly Commute Time Approach Addressing Scalability Anomalies in Complex Data Evaluating Anomaly Detection Methods Applications Problem solutionsNetwork Topology Network Anomalies Detection Problem Network Anomalies Detection Problem Why care about OD Flows
Network Anomalies Detection Problem
Chawla and Chandola Anomaly Detection
Introduction Data Mining Methods Density-based anomaly Commute Time Approach Addressing Scalability Anomalies in Complex Data Evaluating Anomaly Detection Methods Applications Problem solutionsNetwork Topology Network Anomalies Detection Problem Network Anomalies Detection Problem Why care about OD Flows
Network Anomalies Detection Problem
Chawla and Chandola Anomaly Detection
Introduction Data Mining Methods Density-based anomaly Commute Time Approach Addressing Scalability Anomalies in Complex Data Evaluating Anomaly Detection Methods Applications Problem solutionsNetwork Topology Network Anomalies Detection Problem Network Anomalies Detection Problem Why care about OD Flows
Why care about OD Flows
Volume anomaly typically arises on an OD flow (trafficarriving at one node and destined for another node)
If we only monitor traffic on network links volume arisingfrom an OD flow may not be noticeable Thus naiveapproach wont work if OD flow info is not available
Figure source [22]
Chawla and Chandola Anomaly Detection
Introduction Data Mining Methods Density-based anomaly Commute Time Approach Addressing Scalability Anomalies in Complex Data Evaluating Anomaly Detection Methods Applications Problem solutionsPCA and Subspace Method Subspace Method Algorithm Subspace Analysis Results Discussion Typical Characteristics of Anomaly Limitation of Volume Entropy Based versus Volume Based Fraud Detection Epidemeology Anomaly Detection in Climate and Weather Anomalies in Climate Validation of Anomalies
PCA and Subspace Method
Chawla and Chandola Anomaly Detection
Introduction Data Mining Methods Density-based anomaly Commute Time Approach Addressing Scalability Anomalies in Complex Data Evaluating Anomaly Detection Methods Applications Problem solutionsPCA and Subspace Method Subspace Method Algorithm Subspace Analysis Results Discussion Typical Characteristics of Anomaly Limitation of Volume Entropy Based versus Volume Based Fraud Detection Epidemeology Anomaly Detection in Climate and Weather Anomalies in Climate Validation of Anomalies
Subspace Method Algorithm
Step1- Determine the PCs based on eigenvaluedecomposition of the covariance matrix of the dataset
Step2- Choose first top k principle components with thehighest eigenvalues as matrix P
Step3-normal traffic subspace called Z
Z = PP TZ = CZ
Step4-abnormal traffic subspace called Z
Z = (I minus PP T )Z = CZ
Step5-If the norm of a vector is large then it is an rdquoanomalyrdquo
Chawla and Chandola Anomaly Detection
Introduction Data Mining Methods Density-based anomaly Commute Time Approach Addressing Scalability Anomalies in Complex Data Evaluating Anomaly Detection Methods Applications Problem solutionsPCA and Subspace Method Subspace Method Algorithm Subspace Analysis Results Discussion Typical Characteristics of Anomaly Limitation of Volume Entropy Based versus Volume Based Fraud Detection Epidemeology Anomaly Detection in Climate and Weather Anomalies in Climate Validation of Anomalies
Subspace Analysis Results
Note that during anomaly normal component does not changethat much while residual component changes quite a lot
Thus anomalies can be detected by setting some threshold
Figure source [22]
Chawla and Chandola Anomaly Detection
Introduction Data Mining Methods Density-based anomaly Commute Time Approach Addressing Scalability Anomalies in Complex Data Evaluating Anomaly Detection Methods Applications Problem solutionsPCA and Subspace Method Subspace Method Algorithm Subspace Analysis Results Discussion Typical Characteristics of Anomaly Limitation of Volume Entropy Based versus Volume Based Fraud Detection Epidemeology Anomaly Detection in Climate and Weather Anomalies in Climate Validation of Anomalies
Discussion Typical Characteristics of Anomaly
Most Anomalies induce a change in distributionalaspects of packet header fields (called features)
Most important features include 5-tuple Source ampdestination IP addresses Source and destination portnumbers and IP protocol
raquo DOS attack ndash multiple source IP address concentrated on asingle destination IP address
raquo Network scan ndash dispersed distribution of destination addresses
raquo Most wormsviruses also induce some change in distribution ofcertain features
raquo However these changes can be very subtle and mining them islike searching for needles in a haystack
Unlike many previous approach this paper aims todetect events which disturb the distribution of trafficfeatures rather than traffic volume
Chawla and Chandola Anomaly Detection
Introduction Data Mining Methods Density-based anomaly Commute Time Approach Addressing Scalability Anomalies in Complex Data Evaluating Anomaly Detection Methods Applications Problem solutionsPCA and Subspace Method Subspace Method Algorithm Subspace Analysis Results Discussion Typical Characteristics of Anomaly Limitation of Volume Entropy Based versus Volume Based Fraud Detection Epidemeology Anomaly Detection in Climate and Weather Anomalies in Climate Validation of Anomalies
Limitation of Volume
Figure source [22]
Port scan anomaly (traffic feature changes however traffic volume
remains more or less the same)
We can use entropy tocapture the variationsin the traffic feature
bullTakes value 0 when distribution is maximally concentratedbullTakes value log2N when distribution is maximally dispersed
But stands out in
feature entropy
which also reveals
its structure
Port scan
dwarfed
in volume
metricshellip
Chawla and Chandola Anomaly Detection
Introduction Data Mining Methods Density-based anomaly Commute Time Approach Addressing Scalability Anomalies in Complex Data Evaluating Anomaly Detection Methods Applications Problem solutionsPCA and Subspace Method Subspace Method Algorithm Subspace Analysis Results Discussion Typical Characteristics of Anomaly Limitation of Volume Entropy Based versus Volume Based Fraud Detection Epidemeology Anomaly Detection in Climate and Weather Anomalies in Climate Validation of Anomalies
Entropy Based versus Volume Based
DoSDDoS Attacks- a spike in traffic data toward adominant destination IP
Scan anomaly-a spike in traffic data from a dominant sourceIP
Flash Crowd anomaly- again a spike in traffic data to adominant destination IP
Worm anomaly-a Spike in traffic with a dominant port
Chawla and Chandola Anomaly Detection
Introduction Data Mining Methods Density-based anomaly Commute Time Approach Addressing Scalability Anomalies in Complex Data Evaluating Anomaly Detection Methods Applications Problem solutionsPCA and Subspace Method Subspace Method Algorithm Subspace Analysis Results Discussion Typical Characteristics of Anomaly Limitation of Volume Entropy Based versus Volume Based Fraud Detection Epidemeology Anomaly Detection in Climate and Weather Anomalies in Climate Validation of Anomalies
Fraud Detection
Domain Question Identifyfraudulent activities or players fromobserved transaction data
Data Transactions between different
players in the system Meta information about the
individuals An underlying graph structure
Challenges Track and model human behavior Anomalies caused by adaptive
human adversaries Massive data sizes
Insurance (autohealtha)
ClaimantProvider Payer
Telecommunications Customer
Provider
Credit Cards Customer
Supplier Bank
Web Advertising User Advertiser
Publisher
ahttpwwwcheatingculturecompast-cases-of-medicare-fraud
Chawla and Chandola Anomaly Detection
Introduction Data Mining Methods Density-based anomaly Commute Time Approach Addressing Scalability Anomalies in Complex Data Evaluating Anomaly Detection Methods Applications Problem solutionsPCA and Subspace Method Subspace Method Algorithm Subspace Analysis Results Discussion Typical Characteristics of Anomaly Limitation of Volume Entropy Based versus Volume Based Fraud Detection Epidemeology Anomaly Detection in Climate and Weather Anomalies in Climate Validation of Anomalies
A Generic Fraud Detection Method
Activity Monitoring [13]1 Build profiles for individuals (customers users etc) based on
historic data User X makes n calls on an average in January
2 Compare current behavior with historical profile for significantdeviations
Clustering based [4]1 Cluster historical profiles of customers2 Identify small clusters or outlying profiles as anomalies
Strengths Anomaly detection is fast (good for real time) Results are easy to explain
Weaknesses Need to create and maintain a large number of profiles Not dynamic Adequate historical data might not be available Too many false positives
Chawla and Chandola Anomaly Detection
Introduction Data Mining Methods Density-based anomaly Commute Time Approach Addressing Scalability Anomalies in Complex Data Evaluating Anomaly Detection Methods Applications Problem solutionsPCA and Subspace Method Subspace Method Algorithm Subspace Analysis Results Discussion Typical Characteristics of Anomaly Limitation of Volume Entropy Based versus Volume Based Fraud Detection Epidemeology Anomaly Detection in Climate and Weather Anomalies in Climate Validation of Anomalies
Exploiting Graph Structure - Weighted Graphs
Represent data as a weighted graph Communication networks (phone email SMS) Provider referral networks
Objective Identify anomalous nodes
For each node extract several features based on the propertiesof the induced sub-graph (egonet) of neighboring nodes [1]
Choose features that can highlight anomalous nodes
1 Ni degree of node2 Ei number of edges in egonet3 Wi total weight of egonet4 λi principal eigen vector of weighted adjacency matrix of
egonet
Data is transformed into a point in a multi-dimensional space
Chawla and Chandola Anomaly Detection
Introduction Data Mining Methods Density-based anomaly Commute Time Approach Addressing Scalability Anomalies in Complex Data Evaluating Anomaly Detection Methods Applications Problem solutionsPCA and Subspace Method Subspace Method Algorithm Subspace Analysis Results Discussion Typical Characteristics of Anomaly Limitation of Volume Entropy Based versus Volume Based Fraud Detection Epidemeology Anomaly Detection in Climate and Weather Anomalies in Climate Validation of Anomalies
Identifying Anomalies
Traditional anomaly detection (lof) Can be slow but can identify any type of anomalous structure
Faster method to identify specific types of anomalousstructures
Identify relevant feature pairs and power law relationship
Eg Egonet Density Power Law Ni vs Ei - detect nearcliques and stars
Ei prop Nαi 1 le α le 2
Anomaly score for node i wrt a pair of features (y = Cxθ)
Si =max(yi Cx
θi )
min(yi Cxθi )lowast log (|yi minus Cxθi |+ 1)
Chawla and Chandola Anomaly Detection
Introduction Data Mining Methods Density-based anomaly Commute Time Approach Addressing Scalability Anomalies in Complex Data Evaluating Anomaly Detection Methods Applications Problem solutionsPCA and Subspace Method Subspace Method Algorithm Subspace Analysis Results Discussion Typical Characteristics of Anomaly Limitation of Volume Entropy Based versus Volume Based Fraud Detection Epidemeology Anomaly Detection in Climate and Weather Anomalies in Climate Validation of Anomalies
Exploiting Graph Structure - Bipartite Graphs
Represent data as a bipartite graph Healthcare Data (Beneficiaries vs Providers) Insider trading (Traders vs Stocks)
Objective Identify anomalous links
Given a query node a isin V1 find the ldquorelevancerdquoof all other nodes in V1 to a
RelevanceScore(a b) prop Number of times aldquorandom walkrdquo from a reaches b
Use the relevance scores to compute thenormality scores for a node t isin V2
Find set St = a|〈a t〉 isin E Compute |St| times |St| similarity matrix using
relevance vectors for a isin St Normality Score = mean of non-diagonal entries
of similarity matrix
V1 E V2a1
a2
a3
an
t1
t2
t3
tn
Chawla and Chandola Anomaly Detection
Introduction Data Mining Methods Density-based anomaly Commute Time Approach Addressing Scalability Anomalies in Complex Data Evaluating Anomaly Detection Methods Applications Problem solutionsPCA and Subspace Method Subspace Method Algorithm Subspace Analysis Results Discussion Typical Characteristics of Anomaly Limitation of Volume Entropy Based versus Volume Based Fraud Detection Epidemeology Anomaly Detection in Climate and Weather Anomalies in Climate Validation of Anomalies
Detecting Disease Outbreaks
Domain Question Early detection of disease
outbreaks Anthrax attack
Data Emergency department visits Grocery data (Example [14]) Clinical visits Weatherclimate data
Challenges Weak signals in the data
ED cases involving cough rArrFlu or SARS
Integration of multiple signals(lag analysis)
Account for spatial and temporalcorrelations
Chawla and Chandola Anomaly Detection
Introduction Data Mining Methods Density-based anomaly Commute Time Approach Addressing Scalability Anomalies in Complex Data Evaluating Anomaly Detection Methods Applications Problem solutionsPCA and Subspace Method Subspace Method Algorithm Subspace Analysis Results Discussion Typical Characteristics of Anomaly Limitation of Volume Entropy Based versus Volume Based Fraud Detection Epidemeology Anomaly Detection in Climate and Weather Anomalies in Climate Validation of Anomalies
Whatrsquos Significant About Recent Events (WSARE) [33]
1 Learn Bayesian network from historical data Environmental and response variables
2 Sample from the BN (DBbaseline|Current Environment)3 Compute contingency table for rules for DBbaseline andDBcurrent
Rules are single assignment rules (Xi = Y ji ) or conjunctions4 Find p-value for rules using χ2-test
Null Hypothesis Rows and columns of tables for DBbaselineand DBcurrent are independent
5 Find rule with largest p-value Repeat Step 2
Chawla and Chandola Anomaly Detection
Introduction Data Mining Methods Density-based anomaly Commute Time Approach Addressing Scalability Anomalies in Complex Data Evaluating Anomaly Detection Methods Applications Problem solutionsPCA and Subspace Method Subspace Method Algorithm Subspace Analysis Results Discussion Typical Characteristics of Anomaly Limitation of Volume Entropy Based versus Volume Based Fraud Detection Epidemeology Anomaly Detection in Climate and Weather Anomalies in Climate Validation of Anomalies
Incorporating Spatial and Temporal Relationships
WSARE does not explicitly model the spatial and temporalrelationships
What happened yesterday What happened in the adjoining neighborhood (yesterday)
Bayesian Network Spatio-Temporal (BNST) modelingframework [17]
Add nodes for temporal and spatial dependencies Need more data to train
Chawla and Chandola Anomaly Detection
Introduction Data Mining Methods Density-based anomaly Commute Time Approach Addressing Scalability Anomalies in Complex Data Evaluating Anomaly Detection Methods Applications Problem solutionsPCA and Subspace Method Subspace Method Algorithm Subspace Analysis Results Discussion Typical Characteristics of Anomaly Limitation of Volume Entropy Based versus Volume Based Fraud Detection Epidemeology Anomaly Detection in Climate and Weather Anomalies in Climate Validation of Anomalies
Anomaly Detection in Climate and Weather
Science Questions Identify natural and anthropogenic disasters Identify long time scale events - droughts atmospheric rivers
cold fronts etc
Data Ground observations Remote sensing data (satellites
air-borne) Climate model simulation outputs Multiple variables spatio-temporal (often has height dimension
as well)
Challenges Model spatio-temporal relationships across multiple variables Explain the cause of anomalies Massive data sizes
Climate and weather extreme events are well defined
Key challenge is to find significant events and explain the cause
Chawla and Chandola Anomaly Detection
Introduction Data Mining Methods Density-based anomaly Commute Time Approach Addressing Scalability Anomalies in Complex Data Evaluating Anomaly Detection Methods Applications Problem solutionsPCA and Subspace Method Subspace Method Algorithm Subspace Analysis Results Discussion Typical Characteristics of Anomaly Limitation of Volume Entropy Based versus Volume Based Fraud Detection Epidemeology Anomaly Detection in Climate and Weather Anomalies in Climate Validation of Anomalies
Anomalies are Widely Used in Climate
Most analysis done on ldquoanomalyrdquo time series
Difference from a ldquobase periodrdquo (Toosimplistic)
Brings spatial smoothness (eg a mountaintop and nearby valley can have very differenttemperatures) Removes seasonality
Understand climate and weatherphenomenon
Southern Oscillation Index (SOI) Difference between Sea Level Pressure
(SLP) anomalies for Tahiti and DarwinAustralia
Figure Global AverageTemperature Anomaly(1975 - 2007) Srcwwwmetofficegovuk
Chawla and Chandola Anomaly Detection
Introduction Data Mining Methods Density-based anomaly Commute Time Approach Addressing Scalability Anomalies in Complex Data Evaluating Anomaly Detection Methods Applications Problem solutionsPCA and Subspace Method Subspace Method Algorithm Subspace Analysis Results Discussion Typical Characteristics of Anomaly Limitation of Volume Entropy Based versus Volume Based Fraud Detection Epidemeology Anomaly Detection in Climate and Weather Anomalies in Climate Validation of Anomalies
Constructing Anomalies from Raw Data
Anomaly time series for a given location i
vprimei = vi minus bi
where bi is the base (reference)
How to choose bi Mean of all data for location i Monthly mean values (account for seasonality) Monthly z-score values Median (more robust) Using a shorter ldquoreference periodrdquo
30 year moving window
Different methods show statistically significant differences[19] What is the right strategy Weighted mean of different strategies (Pick weights using
Monte Carlo sampling)
Chawla and Chandola Anomaly Detection
Introduction Data Mining Methods Density-based anomaly Commute Time Approach Addressing Scalability Anomalies in Complex Data Evaluating Anomaly Detection Methods Applications Problem solutionsPCA and Subspace Method Subspace Method Algorithm Subspace Analysis Results Discussion Typical Characteristics of Anomaly Limitation of Volume Entropy Based versus Volume Based Fraud Detection Epidemeology Anomaly Detection in Climate and Weather Anomalies in Climate Validation of Anomalies
Anomaly Detection for Identifying Droughts
Science question Identify significant drought patterns usinghistorical observation data or future simulation data or both
Find persistent spatiotemporal anomalies in precipitation data
A two step approach
1 Find precipitationanomalies usingthresholds
2 Find large connectedcomponents across spaceand time
Matlab - bwlabelbwlabeln
Followup Science questionExplain cause
(drought190120061avi)
Figure Video courtsey Dr ArindamBanerjee
Chawla and Chandola Anomaly Detection
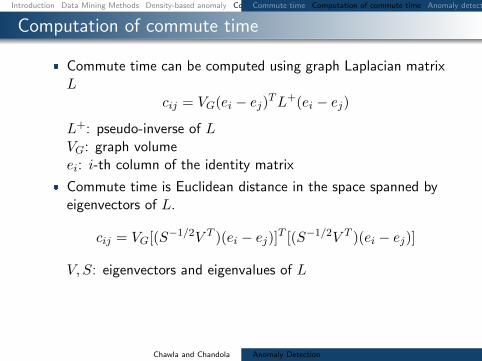
Introduction Data Mining Methods Density-based anomaly Commute Time Approach Addressing Scalability Anomalies in Complex Data Evaluating Anomaly Detection Methods Applications Problem solutionsCommute time Computation of commute time Anomaly detection using commute time (CDOF) Fast estimation of commute time Scalability for Density-based method PINN Algorithm (ICDM 2010) PINN Guarantee Examples high-dim distance-based outliers Examples high-dim density-based outliers Examples local density-based outliers
Computation of commute time
Commute time can be computed using graph Laplacian matrixL
cij = VG(ei minus ej)TL+(ei minus ej)L+ pseudo-inverse of LVG graph volumeei i-th column of the identity matrix
Commute time is Euclidean distance in the space spanned byeigenvectors of L
cij = VG[(Sminus12V T )(ei minus ej)]T [(Sminus12V T )(ei minus ej)]
V S eigenvectors and eigenvalues of L
Chawla and Chandola Anomaly Detection
Introduction Data Mining Methods Density-based anomaly Commute Time Approach Addressing Scalability Anomalies in Complex Data Evaluating Anomaly Detection Methods Applications Problem solutionsCommute time Computation of commute time Anomaly detection using commute time (CDOF) Fast estimation of commute time Scalability for Density-based method PINN Algorithm (ICDM 2010) PINN Guarantee Examples high-dim distance-based outliers Examples high-dim density-based outliers Examples local density-based outliers
Anomaly detection using commute time (CDOF)
Construct the mutual k nearest neighbor graph G from thedataset
Compute the Laplacian matrix L of G and its eigensystems
Find top N anomalies using the distance-based technique incommute time with pruning rule
Complexity O(n3)
Commute time method can detect global local and groupanomalies
Chawla and Chandola Anomaly Detection
Introduction Data Mining Methods Density-based anomaly Commute Time Approach Addressing Scalability Anomalies in Complex Data Evaluating Anomaly Detection Methods Applications Problem solutionsCommute time Computation of commute time Anomaly detection using commute time (CDOF) Fast estimation of commute time Scalability for Density-based method PINN Algorithm (ICDM 2010) PINN Guarantee Examples high-dim distance-based outliers Examples high-dim density-based outliers Examples local density-based outliers
Fast estimation of commute time
Speilman and Srivastava [31] combined random projection anda linear time solver to build a structure where we can computethe compute time between two nodes in O(log n) time
Complexity of CDOF O(n3)rarr O(n log n)
Uses a near linear time solver for a linear system of equationAx = b
Spielman and Teng solvers Also see work by Iannis Koutisfrom CMU
Chawla and Chandola Anomaly Detection
Introduction Data Mining Methods Density-based anomaly Commute Time Approach Addressing Scalability Anomalies in Complex Data Evaluating Anomaly Detection Methods Applications Problem solutionsCommute time Computation of commute time Anomaly detection using commute time (CDOF) Fast estimation of commute time Scalability for Density-based method PINN Algorithm (ICDM 2010) PINN Guarantee Examples high-dim distance-based outliers Examples high-dim density-based outliers Examples local density-based outliers
Scalability for Density-based method
The pruning rule for Distance-based methods does not applyto Density-based approaches
We can go from O(n2) to nearly O(n log n) by using an index
One solution for the curse of high dimensionality is to use ofrandom projections
Chawla and Chandola Anomaly Detection
Introduction Data Mining Methods Density-based anomaly Commute Time Approach Addressing Scalability Anomalies in Complex Data Evaluating Anomaly Detection Methods Applications Problem solutionsCommute time Computation of commute time Anomaly detection using commute time (CDOF) Fast estimation of commute time Scalability for Density-based method PINN Algorithm (ICDM 2010) PINN Guarantee Examples high-dim distance-based outliers Examples high-dim density-based outliers Examples local density-based outliers
PINN Algorithm (ICDM 2010)
Chawla and Chandola Anomaly Detection
Introduction Data Mining Methods Density-based anomaly Commute Time Approach Addressing Scalability Anomalies in Complex Data Evaluating Anomaly Detection Methods Applications Problem solutionsCommute time Computation of commute time Anomaly detection using commute time (CDOF) Fast estimation of commute time Scalability for Density-based method PINN Algorithm (ICDM 2010) PINN Guarantee Examples high-dim distance-based outliers Examples high-dim density-based outliers Examples local density-based outliers
PINN Guarantee
The PINN Algorithm provides probabilistic guarantees
Under certain assumptions about intrinsic dimensionality (c)with high probability
1minus ε1 + ε
middot LOF (p) le LOF (p) le 1 + ε
1minus ε middot LOF (p)
In practice we do not know the intrinsic dimensionality ofdata However random projections are quite robust
Chawla and Chandola Anomaly Detection
Introduction Data Mining Methods Density-based anomaly Commute Time Approach Addressing Scalability Anomalies in Complex Data Evaluating Anomaly Detection Methods Applications Problem solutionsCommute time Computation of commute time Anomaly detection using commute time (CDOF) Fast estimation of commute time Scalability for Density-based method PINN Algorithm (ICDM 2010) PINN Guarantee Examples high-dim distance-based outliers Examples high-dim density-based outliers Examples local density-based outliers
Examples high-dim distance-based outliers
On a large database of images the bright images show up asdistance based outliers
Chawla and Chandola Anomaly Detection
Introduction Data Mining Methods Density-based anomaly Commute Time Approach Addressing Scalability Anomalies in Complex Data Evaluating Anomaly Detection Methods Applications Problem solutionsCommute time Computation of commute time Anomaly detection using commute time (CDOF) Fast estimation of commute time Scalability for Density-based method PINN Algorithm (ICDM 2010) PINN Guarantee Examples high-dim distance-based outliers Examples high-dim density-based outliers Examples local density-based outliers
Examples high-dim density-based outliers
On a large database of images occluded images show up asdensity based outliers
Chawla and Chandola Anomaly Detection
Introduction Data Mining Methods Density-based anomaly Commute Time Approach Addressing Scalability Anomalies in Complex Data Evaluating Anomaly Detection Methods Applications Problem solutionsCommute time Computation of commute time Anomaly detection using commute time (CDOF) Fast estimation of commute time Scalability for Density-based method PINN Algorithm (ICDM 2010) PINN Guarantee Examples high-dim distance-based outliers Examples high-dim density-based outliers Examples local density-based outliers
Examples local density-based outliers
Examples of images ranked by LOF
Chawla and Chandola Anomaly Detection
Introduction Data Mining Methods Density-based anomaly Commute Time Approach Addressing Scalability Anomalies in Complex Data Evaluating Anomaly Detection Methods Applications Problem solutions
Addressing Scalability
Chawla and Chandola Anomaly Detection
Introduction Data Mining Methods Density-based anomaly Commute Time Approach Addressing Scalability Anomalies in Complex Data Evaluating Anomaly Detection Methods Applications Problem solutions
Using GPUs for Anomaly Detection
Well suited for data parallel algorithms Using CUDA - Compute Unified Device
Architecture (Nvidia)
Need to re-engineer existing algorithms Utilization of device memory Minimize CPUhArrGPU transfer of data Keep threads homogeneous
Most model based algorithms arenaturally setup for the testing phase
Model building needs careful redesign
What about unsupervised algorithms
Kernel
Host
Grid
Device
Block(00)
Block(01)
Block(02)
Block(10)
Block(11)
Block(12)
Thread Block
Thread(00)
Thread(01)
Thread(02)
Thread(03)
Thread(10)
Thread(11)
Thread(12)
Thread(13)
Thread(20)
Thread(21)
Thread(22)
Thread(23)
Host Host Memory
SM 2
SM 1
SM 0
Registers Registers Registers
SP 0 SP 1 SP 7
Shared Memory
Global Memory
Texture Memory
Constant Memory
Device
Chawla and Chandola Anomaly Detection
Introduction Data Mining Methods Density-based anomaly Commute Time Approach Addressing Scalability Anomalies in Complex Data Evaluating Anomaly Detection Methods Applications Problem solutions
Implementing DB(kN) on GPUs
Return top N data instances whose distances tok-th nearest neighbor are largest (SerialDB(kN) is O(n2))
Involves computing pairwise distances
Load block i and block j to shared memory Data layout in memory should be optimized
Each thread computes distance between a pairof instances
Can utilize this time to load next chunk of datafrom host to device memory
Writes results to corresponding output block
Sorting can be done efficiently in CUDA [29]
d
n
T
n
n
Chawla and Chandola Anomaly Detection
Introduction Data Mining Methods Density-based anomaly Commute Time Approach Addressing Scalability Anomalies in Complex Data Evaluating Anomaly Detection Methods Applications Problem solutionsCategorical Data Discrete Sequences and Time Series Contextual Anomalies Collective Anomalies
Moving Beyond Multi-dimensional Record Data
Categorical (Mixed)
Fraud Detection
Cyber Networks
Time Series
Sensor Networks
Healthcare
Discrete Sequences
Genomic
System Calls
Spatial
GIS
Image analysis
Spatio-temporal
Remote sensing
Climate
Graphs
Social networks
Epidemiology
Chawla and Chandola Anomaly Detection
Introduction Data Mining Methods Density-based anomaly Commute Time Approach Addressing Scalability Anomalies in Complex Data Evaluating Anomaly Detection Methods Applications Problem solutionsCategorical Data Discrete Sequences and Time Series Contextual Anomalies Collective Anomalies
Handling Categorical Data
Each attribute can belong to one of many categories
No ordering between categories
Mixed data (categorical and continuous attributes)
cap-shape cap-surface middot middot middot habitat type
convex smooth urban poisonousconvex smooth grasses ediblebell smooth meadows edibleconvex scaly urban poisonousconvex smooth grasses ediblemiddot middot middot
Table Mushroom Data Set [2]
Chawla and Chandola Anomaly Detection
Introduction Data Mining Methods Density-based anomaly Commute Time Approach Addressing Scalability Anomalies in Complex Data Evaluating Anomaly Detection Methods Applications Problem solutionsCategorical Data Discrete Sequences and Time Series Contextual Anomalies Collective Anomalies
Approaches to Identify Categorical Anomalies
Using Association Analysis [24]
Binarize data
Learn rules (X rArr Y ) Choose high confidence
rules (P (Y |X))
For test record Z = 〈XY 〉find rules of the formP (Y |X)
Y is not observed whenX is observed
Using Bayesian Networks [33]
Learn Bayesian networkstructure and parameters
Compute P (Z) for test datarecord Z
Flag anomaly if P (Z) lt δ
Using Similarity Metrics [10]
Use a similarity measure (S(X1 X2))
Apply distancedensityclustering based method (eg lof)
Chawla and Chandola Anomaly Detection
Introduction Data Mining Methods Density-based anomaly Commute Time Approach Addressing Scalability Anomalies in Complex Data Evaluating Anomaly Detection Methods Applications Problem solutionsCategorical Data Discrete Sequences and Time Series Contextual Anomalies Collective Anomalies
Conditional Probability Test [18]
Identify unusual combinations of attribute values
r(at bt) =P (at bt)
P (at)P (bt)
A capB = φ Assumption If r(at bt) is low and is observed in test record t
then t is anomalous For a test record t
For each mutually exclusive pair of attribute sets ABcompute r(at bt)
Score t based on all r-values Assign minimum r-value as score Take product of all r-values
Need to compare exponential pairs of subsets Only consider subsets upto size k Ignore subsets with frequency less than a threshold α Avoid comparing independent subsets of attributes
micro(AB) ge βmicroChawla and Chandola Anomaly Detection
Introduction Data Mining Methods Density-based anomaly Commute Time Approach Addressing Scalability Anomalies in Complex Data Evaluating Anomaly Detection Methods Applications Problem solutionsCategorical Data Discrete Sequences and Time Series Contextual Anomalies Collective Anomalies
Estimating Probabilities for CPT [18]
Maximum LikelihoodEstimation
P (at bt)
P (at)P (bt)=C(at bt)
Ntimes N
C(at)times N
C(bt)
C(at) Number of traininginstances with A = at
N Total number of traininginstances
Laplace Smoothing
E(p) =C(p) + 1
N + 2
r(at bt) =E(at bt)
E(at)times E(bt)
Speedup Tricks
Replace rare attributevalues with genericattribute (reduce arity)
Use efficient datastructure to querying forcounts(AD Trees [26])
ADTrees work fasterfor low arity attributes
Chawla and Chandola Anomaly Detection
Introduction Data Mining Methods Density-based anomaly Commute Time Approach Addressing Scalability Anomalies in Complex Data Evaluating Anomaly Detection Methods Applications Problem solutionsCategorical Data Discrete Sequences and Time Series Contextual Anomalies Collective Anomalies
Finding Anomalies in Discrete Sequences
Many problem formulations
1 Anomalous symbols in asequence
2 Anomalous subsequence in asequence
3 Anomalous sequence in adatabase of sequences
See [11] for a comparativeevaluation [9] for a survey
login pwdmail ssh mail web logoutlogin pwdmail web web web web logoutlogin pwdmail ssh mail web web logoutlogin pwdwebmail ssh webmail logoutloginpwd loginpwd loginpwd logout
Chawla and Chandola Anomaly Detection
Introduction Data Mining Methods Density-based anomaly Commute Time Approach Addressing Scalability Anomalies in Complex Data Evaluating Anomaly Detection Methods Applications Problem solutionsCategorical Data Discrete Sequences and Time Series Contextual Anomalies Collective Anomalies
Treating Sequences as Points
Utilize a distancesimilarity measure Plug into a distancedensityclustering based method
Simplest Hamming Distance
h(Ai Bi) = 1 Ai 6= Bi= 0 Ai = Bi
H(AB) =nsumi=1
h(Ai Bi)
Issues Unequal lengths misalignment Normalized Length of Longest Common Subsequence
D(AB) = 1minus |LCS(AB)|radic|A||B|
Standard Dynamic Programming method is slow Faster versions available (Hunt Szymnaski method [7])
Weaknesses Cannot localize anomalies within a sequence Weak anomaly signals might get lost
Chawla and Chandola Anomaly Detection
Introduction Data Mining Methods Density-based anomaly Commute Time Approach Addressing Scalability Anomalies in Complex Data Evaluating Anomaly Detection Methods Applications Problem solutionsCategorical Data Discrete Sequences and Time Series Contextual Anomalies Collective Anomalies
Using Sliding Windows
Slide a window of size k
Extract all windows from a sequence (nminus k + 1)
Training (Creating a normal dictionary) Store all uniquewindows in all normal sequences and their counts
Testing For each window find the frequency in normal dictionary Anomaly score is inverse of the aggregate frequencies for all
windows (normalized by length)
Many variants exist For each window find the hamming distance to the closest
window in the normal dictionary [16]
Issues Penalizes low frequency windows in the normal dictionary Rewards high frequency windows that might not be relevant Can construct anomalous sequences that will escape detection
Chawla and Chandola Anomaly Detection
Introduction Data Mining Methods Density-based anomaly Commute Time Approach Addressing Scalability Anomalies in Complex Data Evaluating Anomaly Detection Methods Applications Problem solutionsCategorical Data Discrete Sequences and Time Series Contextual Anomalies Collective Anomalies
Using Probabilistic Models
Probability of occurrence of sequence S
P (S) =nprodi=1
P (Si|S1 Siminus1)
Short memory property of sequences
P (Si|S1 Siminus1) = P (Si|Siminusk Siminus1)
Conditional probability estimates for a symbol Si
P (Si|Siminusk Siminus1) =f(Si|Siminusk Si)f(Si|Siminusk Siminus1)
f is estimated from the normal dictionary
Anomaly score for a test sequence is inverse of the normalizedprobability of occurrence
Issues What if the suffix occurs very infrequently in thenormal data (or not at all)
Replace with the longest suffix that occurs sufficient number oftimes [32] - Probabilistic Suffix Trees
Significantly reduces the size of the modelChawla and Chandola Anomaly Detection
Introduction Data Mining Methods Density-based anomaly Commute Time Approach Addressing Scalability Anomalies in Complex Data Evaluating Anomaly Detection Methods Applications Problem solutionsCategorical Data Discrete Sequences and Time Series Contextual Anomalies Collective Anomalies
Finding Contextual Anomalies
Sometimes contextual information isavailable about data
Not used directly as a feature Are well understood no anomalies in
the context Can reduce false positives and yield
interesting anomalies
Example adapted from [30]
Clearest Outlier
Conditional Anomaly
Maximum Daily Temperature
Number
ofFever
Cases
Contextual anomalies - Anomalous with respect to a context Context is defined using environmental variables
Spatial (Latitude Longitude) Graph context (Edges Weights) Temporal location Domain specific (Demographic other)
How to incorporate context Reduce to traditional anomaly detection (subset on context) Explicitly model contextual information (time series spatial)
Chawla and Chandola Anomaly Detection
Introduction Data Mining Methods Density-based anomaly Commute Time Approach Addressing Scalability Anomalies in Complex Data Evaluating Anomaly Detection Methods Applications Problem solutionsCategorical Data Discrete Sequences and Time Series Contextual Anomalies Collective Anomalies
Conditional Anomaly Detection
Data instance d rArru1 u2 udU v1 v2 vdV
dU environmentalattributes
dV indicator attributes u1
u2
U1
U2
U3
v1
v2
V1V2
V3
p(V1|U3) = 02
p(V2|U3) = 02
p(V3|U3) = 06
Algorithm [30]
1 Learn a Gaussian Mixture Model (GMM)U = U1 U2 UnU
each with dimensionality dU2 Learn a set of Gaussians U = V1 V2 VnV
each withdimensionality dV
3 Learn a probabilistic mapping function p(Vj |Ui)4 Score a test instance d = [uv]
S =
nUsumi=1
p(u|Ui)nVsumj=1
p(v|Vj)p(Vj |Ui)
Chawla and Chandola Anomaly Detection
Introduction Data Mining Methods Density-based anomaly Commute Time Approach Addressing Scalability Anomalies in Complex Data Evaluating Anomaly Detection Methods Applications Problem solutionsCategorical Data Discrete Sequences and Time Series Contextual Anomalies Collective Anomalies
Finding Collective Anomalies
Find a collection of data points
Each point by itself is normal
The collection as a whole isanomalous
Relevant when data has inherentstructure and
When domain definition ofanomalies cannot be described aspoint anomalies
A Simple Solution
1 Break data intogroups
2 Compute features foreach group
3 Apply traditionalanomaly detection
Examples
1 Time series
2 Image
3 Spatial clusters ofgalaxies
Chawla and Chandola Anomaly Detection
Introduction Data Mining Methods Density-based anomaly Commute Time Approach Addressing Scalability Anomalies in Complex Data Evaluating Anomaly Detection Methods Applications Problem solutionsCategorical Data Discrete Sequences and Time Series Contextual Anomalies Collective Anomalies
Using Latent Dirichlet Allocation for Group Anomalies
Find anomalous groups in data [34]
Example Spatial clusters of galaxies topics red green emissive words continuous features
Flexible Genre Model (FGM)
For each group
1 Draw a genre 1 2 T 3 ym simM(π)2 Draw topic distribution forym SK 3 θm sim Dir(αym)
3 Draw K topicsβmk sim P (βmk|ηk)k=12K
4 For each point in group
1 Draw topic membershipzmn simM(θn)
2 Generate pointxmn isin P (xmn|βmzmn)
α
zmn
xmn
N
θm
T
π
ηK
ym
β
MK
Model Parameters
M(π) -Multinomial
Genre - Dir(αt)
Topic generatorsP (|ηk)- GIW
Point generatorsP (xmn|βnk) -MultivariateGaussian
Chawla and Chandola Anomaly Detection
Introduction Data Mining Methods Density-based anomaly Commute Time Approach Addressing Scalability Anomalies in Complex Data Evaluating Anomaly Detection Methods Applications Problem solutionsCategorical Data Discrete Sequences and Time Series Contextual Anomalies Collective Anomalies
Inference and Testing for FGM
Inference and Learning Parameters
Approximate inference of latentvariables (Gibbs Sampling)
Use samples to learn parameters(Single step Monte Carlo EM)
Topic 1
Topic 2
Topic 3
Anomaly Detection
Infer the topic distribution θm
Compute negative log likelihood wrt αt
Rationale An anomalous group will be unlikely to begenerated from any genre
Geometric interpretation Mapping each group into a Tdimensional space and finding anomalies
Chawla and Chandola Anomaly Detection
Introduction Data Mining Methods Density-based anomaly Commute Time Approach Addressing Scalability Anomalies in Complex Data Evaluating Anomaly Detection Methods Applications Problem solutions
Evaluating Anomaly Detection Methods - Labels
Labeled validation data set exists Confusion matrix Traditional evaluation metrics
Class imbalance
ROC Curve
Validation set does not exist Use domain expertise to find TP
and FP FN is harder to estimate
Pseudo false negativeestimation techniques [25]
Predicteda n
Actuala TP FNn FP TN
Acc =TP + TNsum
Rec (R) =TP
TP + FN
Prec (P ) =TP
TP + FP
F =2 lowastR lowast PR+ P
Chawla and Chandola Anomaly Detection
Introduction Data Mining Methods Density-based anomaly Commute Time Approach Addressing Scalability Anomalies in Complex Data Evaluating Anomaly Detection Methods Applications Problem solutions
Evaluating Anomaly Detection Methods - Scores
Convert to binary output Use threshold δ on score (Scale
issues [21]) Take top x as anomalies
ROC curve by varying x or δ
Quality of output Does the output ldquosuggestrdquo x or δ Which output is better
Chawla and Chandola Anomaly Detection
Introduction Data Mining Methods Density-based anomaly Commute Time Approach Addressing Scalability Anomalies in Complex Data Evaluating Anomaly Detection Methods Applications Problem solutions
Unifying Scores
Different methods assign scores in differentranges
kNN-based scores [0 1] Lof scores [1 6] ABOD scores [0 80000]
Anomalies have lower scores
Direct scaling to [0 1] might lose distinctionbetween normal and anomalies
Desired scaling Stretch interesting rangesand shrink irrelevant ones
Generalized Procedure for Normalizing Outlier Scores [21] Regularity rArr S(o) ge 0forallo S(o) asymp 0 if o is normal andS(o) 0 if o is anomalous
Normality S is regular and S(o) isin [0 1]forallo
Chawla and Chandola Anomaly Detection
Introduction Data Mining Methods Density-based anomaly Commute Time Approach Addressing Scalability Anomalies in Complex Data Evaluating Anomaly Detection Methods Applications Problem solutions
Regularization and Normalization of Scores
Regularization
1 R(o) = max0 S(o)minus baseS2 R(o) = Smax minus S(o)
3 R(o) = minus log SmaxS(o)
Normalization
1 N(o) = S(o)Smax
2 N(o) = max(
0 erf(S(o)minusmicroSσS radic2
))(Gaussian Scaling)
Suited for high dimensional data
3 N(o) = max(
0cdfγS (o)minusmicroγ
1minusmicroγ
)(Gamma Scaling)
Where cdfγS (o) = P (k S(o) θ) P is the regularized Gamma function Suited for low dimensional data
Chawla and Chandola Anomaly Detection
Introduction Data Mining Methods Density-based anomaly Commute Time Approach Addressing Scalability Anomalies in Complex Data Evaluating Anomaly Detection Methods Applications Problem solutions
Generating Labeled Data for Validation
Generating Both Normal and Anomalous Data
Use generative models for normal and anomalous behavior
Several generators available Multivariate continuous data [27] Multivariate categorical data [5] Discrete sequences using HMM [12]
Drawbacks Might not capture the domain characteristics
Injecting Anomalies - Random Perturbation[30]
Given data point z = xy x and y arepartitions of feature space
Take a random sample D of the entire data set
Let zprime = xprimeyprime isin D such that distancebetween y and yprime is maximum
Replace x with xprime and add z back to data setx
yz
zprime
Injected anomaly
Chawla and Chandola Anomaly Detection
Introduction Data Mining Methods Density-based anomaly Commute Time Approach Addressing Scalability Anomalies in Complex Data Evaluating Anomaly Detection Methods Applications Problem solutionsWhat is Network Anomaly Detection Motivation How Much Serious
Applications Overview
How to set up an anomaly detection solution for agiven application domain
Available data Define anomalies define normal behavior Identify requirements and constraints (online
real-time limited resources) What domain knowledge available
Feature identification Defining normal and anomalous behavior Tuning parameters
Available ground truth (training validation)
Chawla and Chandola Anomaly Detection
Introduction Data Mining Methods Density-based anomaly Commute Time Approach Addressing Scalability Anomalies in Complex Data Evaluating Anomaly Detection Methods Applications Problem solutionsWhat is Network Anomaly Detection Motivation How Much Serious
What is Network Anomaly Detection
Anomaly Detection or Intrusion Detection
Traditional Intrusion Detection Systems (IDS) finding attackscorresponding to predefined pattern data set known as signaturestherefore system is absolutely vulnerable against zero-day attacks
Network Anomaly Detection Systems (NADS) to detectzero-day attacks without any pre-identified signature besides profilenormal behavior of the network and address suspected incidents
Network Anomaly Detection finding unusual and largechanges in the network traffic
Examples intentional attacks (eg Distributed Denial ofService - DDoS) or unusual network traffic (eg flash crowds)
Chawla and Chandola Anomaly Detection
Introduction Data Mining Methods Density-based anomaly Commute Time Approach Addressing Scalability Anomalies in Complex Data Evaluating Anomaly Detection Methods Applications Problem solutionsWhat is Network Anomaly Detection Motivation How Much Serious
Motivation How Much Serious
According to Symantec report released in early 2011 morethan 286 million new threats have been detected in 2010which is a huge number
1656227
2704836
1000000
1500000
2000000
2500000
3000000
20547 18827 69107 113025 140690
624267
1656227
2704836
0
500000
1000000
1500000
2000000
2500000
3000000
2002 2003 2004 2005 2006 2007 2008 July2009-June2010
Chawla and Chandola Anomaly Detection
Introduction Data Mining Methods Density-based anomaly Commute Time Approach Addressing Scalability Anomalies in Complex Data Evaluating Anomaly Detection Methods Applications Problem solutionsNetwork Topology Network Anomalies Detection Problem Network Anomalies Detection Problem Why care about OD Flows
Network Topology
A Typical network
1 y
Router
2
3
41t
x2t
x1t
x3t
x4t
Origin-Destination (OD) flow is the traffic that enters at anorigin node and exits at a destination node of a backbonenetwork x1t x1t
Link measurement is the traffic enters at an node during aninterval y1t
Relationship between link traffic and OD flow traffic iscaptured by the routing matrix A
Chawla and Chandola Anomaly Detection
Introduction Data Mining Methods Density-based anomaly Commute Time Approach Addressing Scalability Anomalies in Complex Data Evaluating Anomaly Detection Methods Applications Problem solutionsNetwork Topology Network Anomalies Detection Problem Network Anomalies Detection Problem Why care about OD Flows
Network Anomalies Detection Problem
Chawla and Chandola Anomaly Detection
Introduction Data Mining Methods Density-based anomaly Commute Time Approach Addressing Scalability Anomalies in Complex Data Evaluating Anomaly Detection Methods Applications Problem solutionsNetwork Topology Network Anomalies Detection Problem Network Anomalies Detection Problem Why care about OD Flows
Network Anomalies Detection Problem
Chawla and Chandola Anomaly Detection
Introduction Data Mining Methods Density-based anomaly Commute Time Approach Addressing Scalability Anomalies in Complex Data Evaluating Anomaly Detection Methods Applications Problem solutionsNetwork Topology Network Anomalies Detection Problem Network Anomalies Detection Problem Why care about OD Flows
Why care about OD Flows
Volume anomaly typically arises on an OD flow (trafficarriving at one node and destined for another node)
If we only monitor traffic on network links volume arisingfrom an OD flow may not be noticeable Thus naiveapproach wont work if OD flow info is not available
Figure source [22]
Chawla and Chandola Anomaly Detection
Introduction Data Mining Methods Density-based anomaly Commute Time Approach Addressing Scalability Anomalies in Complex Data Evaluating Anomaly Detection Methods Applications Problem solutionsPCA and Subspace Method Subspace Method Algorithm Subspace Analysis Results Discussion Typical Characteristics of Anomaly Limitation of Volume Entropy Based versus Volume Based Fraud Detection Epidemeology Anomaly Detection in Climate and Weather Anomalies in Climate Validation of Anomalies
PCA and Subspace Method
Chawla and Chandola Anomaly Detection
Introduction Data Mining Methods Density-based anomaly Commute Time Approach Addressing Scalability Anomalies in Complex Data Evaluating Anomaly Detection Methods Applications Problem solutionsPCA and Subspace Method Subspace Method Algorithm Subspace Analysis Results Discussion Typical Characteristics of Anomaly Limitation of Volume Entropy Based versus Volume Based Fraud Detection Epidemeology Anomaly Detection in Climate and Weather Anomalies in Climate Validation of Anomalies
Subspace Method Algorithm
Step1- Determine the PCs based on eigenvaluedecomposition of the covariance matrix of the dataset
Step2- Choose first top k principle components with thehighest eigenvalues as matrix P
Step3-normal traffic subspace called Z
Z = PP TZ = CZ
Step4-abnormal traffic subspace called Z
Z = (I minus PP T )Z = CZ
Step5-If the norm of a vector is large then it is an rdquoanomalyrdquo
Chawla and Chandola Anomaly Detection
Introduction Data Mining Methods Density-based anomaly Commute Time Approach Addressing Scalability Anomalies in Complex Data Evaluating Anomaly Detection Methods Applications Problem solutionsPCA and Subspace Method Subspace Method Algorithm Subspace Analysis Results Discussion Typical Characteristics of Anomaly Limitation of Volume Entropy Based versus Volume Based Fraud Detection Epidemeology Anomaly Detection in Climate and Weather Anomalies in Climate Validation of Anomalies
Subspace Analysis Results
Note that during anomaly normal component does not changethat much while residual component changes quite a lot
Thus anomalies can be detected by setting some threshold
Figure source [22]
Chawla and Chandola Anomaly Detection
Introduction Data Mining Methods Density-based anomaly Commute Time Approach Addressing Scalability Anomalies in Complex Data Evaluating Anomaly Detection Methods Applications Problem solutionsPCA and Subspace Method Subspace Method Algorithm Subspace Analysis Results Discussion Typical Characteristics of Anomaly Limitation of Volume Entropy Based versus Volume Based Fraud Detection Epidemeology Anomaly Detection in Climate and Weather Anomalies in Climate Validation of Anomalies
Discussion Typical Characteristics of Anomaly
Most Anomalies induce a change in distributionalaspects of packet header fields (called features)
Most important features include 5-tuple Source ampdestination IP addresses Source and destination portnumbers and IP protocol
raquo DOS attack ndash multiple source IP address concentrated on asingle destination IP address
raquo Network scan ndash dispersed distribution of destination addresses
raquo Most wormsviruses also induce some change in distribution ofcertain features
raquo However these changes can be very subtle and mining them islike searching for needles in a haystack
Unlike many previous approach this paper aims todetect events which disturb the distribution of trafficfeatures rather than traffic volume
Chawla and Chandola Anomaly Detection
Introduction Data Mining Methods Density-based anomaly Commute Time Approach Addressing Scalability Anomalies in Complex Data Evaluating Anomaly Detection Methods Applications Problem solutionsPCA and Subspace Method Subspace Method Algorithm Subspace Analysis Results Discussion Typical Characteristics of Anomaly Limitation of Volume Entropy Based versus Volume Based Fraud Detection Epidemeology Anomaly Detection in Climate and Weather Anomalies in Climate Validation of Anomalies
Limitation of Volume
Figure source [22]
Port scan anomaly (traffic feature changes however traffic volume
remains more or less the same)
We can use entropy tocapture the variationsin the traffic feature
bullTakes value 0 when distribution is maximally concentratedbullTakes value log2N when distribution is maximally dispersed
But stands out in
feature entropy
which also reveals
its structure
Port scan
dwarfed
in volume
metricshellip
Chawla and Chandola Anomaly Detection
Introduction Data Mining Methods Density-based anomaly Commute Time Approach Addressing Scalability Anomalies in Complex Data Evaluating Anomaly Detection Methods Applications Problem solutionsPCA and Subspace Method Subspace Method Algorithm Subspace Analysis Results Discussion Typical Characteristics of Anomaly Limitation of Volume Entropy Based versus Volume Based Fraud Detection Epidemeology Anomaly Detection in Climate and Weather Anomalies in Climate Validation of Anomalies
Entropy Based versus Volume Based
DoSDDoS Attacks- a spike in traffic data toward adominant destination IP
Scan anomaly-a spike in traffic data from a dominant sourceIP
Flash Crowd anomaly- again a spike in traffic data to adominant destination IP
Worm anomaly-a Spike in traffic with a dominant port
Chawla and Chandola Anomaly Detection
Introduction Data Mining Methods Density-based anomaly Commute Time Approach Addressing Scalability Anomalies in Complex Data Evaluating Anomaly Detection Methods Applications Problem solutionsPCA and Subspace Method Subspace Method Algorithm Subspace Analysis Results Discussion Typical Characteristics of Anomaly Limitation of Volume Entropy Based versus Volume Based Fraud Detection Epidemeology Anomaly Detection in Climate and Weather Anomalies in Climate Validation of Anomalies
Fraud Detection
Domain Question Identifyfraudulent activities or players fromobserved transaction data
Data Transactions between different
players in the system Meta information about the
individuals An underlying graph structure
Challenges Track and model human behavior Anomalies caused by adaptive
human adversaries Massive data sizes
Insurance (autohealtha)
ClaimantProvider Payer
Telecommunications Customer
Provider
Credit Cards Customer
Supplier Bank
Web Advertising User Advertiser
Publisher
ahttpwwwcheatingculturecompast-cases-of-medicare-fraud
Chawla and Chandola Anomaly Detection
Introduction Data Mining Methods Density-based anomaly Commute Time Approach Addressing Scalability Anomalies in Complex Data Evaluating Anomaly Detection Methods Applications Problem solutionsPCA and Subspace Method Subspace Method Algorithm Subspace Analysis Results Discussion Typical Characteristics of Anomaly Limitation of Volume Entropy Based versus Volume Based Fraud Detection Epidemeology Anomaly Detection in Climate and Weather Anomalies in Climate Validation of Anomalies
A Generic Fraud Detection Method
Activity Monitoring [13]1 Build profiles for individuals (customers users etc) based on
historic data User X makes n calls on an average in January
2 Compare current behavior with historical profile for significantdeviations
Clustering based [4]1 Cluster historical profiles of customers2 Identify small clusters or outlying profiles as anomalies
Strengths Anomaly detection is fast (good for real time) Results are easy to explain
Weaknesses Need to create and maintain a large number of profiles Not dynamic Adequate historical data might not be available Too many false positives
Chawla and Chandola Anomaly Detection
Introduction Data Mining Methods Density-based anomaly Commute Time Approach Addressing Scalability Anomalies in Complex Data Evaluating Anomaly Detection Methods Applications Problem solutionsPCA and Subspace Method Subspace Method Algorithm Subspace Analysis Results Discussion Typical Characteristics of Anomaly Limitation of Volume Entropy Based versus Volume Based Fraud Detection Epidemeology Anomaly Detection in Climate and Weather Anomalies in Climate Validation of Anomalies
Exploiting Graph Structure - Weighted Graphs
Represent data as a weighted graph Communication networks (phone email SMS) Provider referral networks
Objective Identify anomalous nodes
For each node extract several features based on the propertiesof the induced sub-graph (egonet) of neighboring nodes [1]
Choose features that can highlight anomalous nodes
1 Ni degree of node2 Ei number of edges in egonet3 Wi total weight of egonet4 λi principal eigen vector of weighted adjacency matrix of
egonet
Data is transformed into a point in a multi-dimensional space
Chawla and Chandola Anomaly Detection
Introduction Data Mining Methods Density-based anomaly Commute Time Approach Addressing Scalability Anomalies in Complex Data Evaluating Anomaly Detection Methods Applications Problem solutionsPCA and Subspace Method Subspace Method Algorithm Subspace Analysis Results Discussion Typical Characteristics of Anomaly Limitation of Volume Entropy Based versus Volume Based Fraud Detection Epidemeology Anomaly Detection in Climate and Weather Anomalies in Climate Validation of Anomalies
Identifying Anomalies
Traditional anomaly detection (lof) Can be slow but can identify any type of anomalous structure
Faster method to identify specific types of anomalousstructures
Identify relevant feature pairs and power law relationship
Eg Egonet Density Power Law Ni vs Ei - detect nearcliques and stars
Ei prop Nαi 1 le α le 2
Anomaly score for node i wrt a pair of features (y = Cxθ)
Si =max(yi Cx
θi )
min(yi Cxθi )lowast log (|yi minus Cxθi |+ 1)
Chawla and Chandola Anomaly Detection
Introduction Data Mining Methods Density-based anomaly Commute Time Approach Addressing Scalability Anomalies in Complex Data Evaluating Anomaly Detection Methods Applications Problem solutionsPCA and Subspace Method Subspace Method Algorithm Subspace Analysis Results Discussion Typical Characteristics of Anomaly Limitation of Volume Entropy Based versus Volume Based Fraud Detection Epidemeology Anomaly Detection in Climate and Weather Anomalies in Climate Validation of Anomalies
Exploiting Graph Structure - Bipartite Graphs
Represent data as a bipartite graph Healthcare Data (Beneficiaries vs Providers) Insider trading (Traders vs Stocks)
Objective Identify anomalous links
Given a query node a isin V1 find the ldquorelevancerdquoof all other nodes in V1 to a
RelevanceScore(a b) prop Number of times aldquorandom walkrdquo from a reaches b
Use the relevance scores to compute thenormality scores for a node t isin V2
Find set St = a|〈a t〉 isin E Compute |St| times |St| similarity matrix using
relevance vectors for a isin St Normality Score = mean of non-diagonal entries
of similarity matrix
V1 E V2a1
a2
a3
an
t1
t2
t3
tn
Chawla and Chandola Anomaly Detection
Introduction Data Mining Methods Density-based anomaly Commute Time Approach Addressing Scalability Anomalies in Complex Data Evaluating Anomaly Detection Methods Applications Problem solutionsPCA and Subspace Method Subspace Method Algorithm Subspace Analysis Results Discussion Typical Characteristics of Anomaly Limitation of Volume Entropy Based versus Volume Based Fraud Detection Epidemeology Anomaly Detection in Climate and Weather Anomalies in Climate Validation of Anomalies
Detecting Disease Outbreaks
Domain Question Early detection of disease
outbreaks Anthrax attack
Data Emergency department visits Grocery data (Example [14]) Clinical visits Weatherclimate data
Challenges Weak signals in the data
ED cases involving cough rArrFlu or SARS
Integration of multiple signals(lag analysis)
Account for spatial and temporalcorrelations
Chawla and Chandola Anomaly Detection
Introduction Data Mining Methods Density-based anomaly Commute Time Approach Addressing Scalability Anomalies in Complex Data Evaluating Anomaly Detection Methods Applications Problem solutionsPCA and Subspace Method Subspace Method Algorithm Subspace Analysis Results Discussion Typical Characteristics of Anomaly Limitation of Volume Entropy Based versus Volume Based Fraud Detection Epidemeology Anomaly Detection in Climate and Weather Anomalies in Climate Validation of Anomalies
Whatrsquos Significant About Recent Events (WSARE) [33]
1 Learn Bayesian network from historical data Environmental and response variables
2 Sample from the BN (DBbaseline|Current Environment)3 Compute contingency table for rules for DBbaseline andDBcurrent
Rules are single assignment rules (Xi = Y ji ) or conjunctions4 Find p-value for rules using χ2-test
Null Hypothesis Rows and columns of tables for DBbaselineand DBcurrent are independent
5 Find rule with largest p-value Repeat Step 2
Chawla and Chandola Anomaly Detection
Introduction Data Mining Methods Density-based anomaly Commute Time Approach Addressing Scalability Anomalies in Complex Data Evaluating Anomaly Detection Methods Applications Problem solutionsPCA and Subspace Method Subspace Method Algorithm Subspace Analysis Results Discussion Typical Characteristics of Anomaly Limitation of Volume Entropy Based versus Volume Based Fraud Detection Epidemeology Anomaly Detection in Climate and Weather Anomalies in Climate Validation of Anomalies
Incorporating Spatial and Temporal Relationships
WSARE does not explicitly model the spatial and temporalrelationships
What happened yesterday What happened in the adjoining neighborhood (yesterday)
Bayesian Network Spatio-Temporal (BNST) modelingframework [17]
Add nodes for temporal and spatial dependencies Need more data to train
Chawla and Chandola Anomaly Detection
Introduction Data Mining Methods Density-based anomaly Commute Time Approach Addressing Scalability Anomalies in Complex Data Evaluating Anomaly Detection Methods Applications Problem solutionsPCA and Subspace Method Subspace Method Algorithm Subspace Analysis Results Discussion Typical Characteristics of Anomaly Limitation of Volume Entropy Based versus Volume Based Fraud Detection Epidemeology Anomaly Detection in Climate and Weather Anomalies in Climate Validation of Anomalies
Anomaly Detection in Climate and Weather
Science Questions Identify natural and anthropogenic disasters Identify long time scale events - droughts atmospheric rivers
cold fronts etc
Data Ground observations Remote sensing data (satellites
air-borne) Climate model simulation outputs Multiple variables spatio-temporal (often has height dimension
as well)
Challenges Model spatio-temporal relationships across multiple variables Explain the cause of anomalies Massive data sizes
Climate and weather extreme events are well defined
Key challenge is to find significant events and explain the cause
Chawla and Chandola Anomaly Detection
Introduction Data Mining Methods Density-based anomaly Commute Time Approach Addressing Scalability Anomalies in Complex Data Evaluating Anomaly Detection Methods Applications Problem solutionsPCA and Subspace Method Subspace Method Algorithm Subspace Analysis Results Discussion Typical Characteristics of Anomaly Limitation of Volume Entropy Based versus Volume Based Fraud Detection Epidemeology Anomaly Detection in Climate and Weather Anomalies in Climate Validation of Anomalies
Anomalies are Widely Used in Climate
Most analysis done on ldquoanomalyrdquo time series
Difference from a ldquobase periodrdquo (Toosimplistic)
Brings spatial smoothness (eg a mountaintop and nearby valley can have very differenttemperatures) Removes seasonality
Understand climate and weatherphenomenon
Southern Oscillation Index (SOI) Difference between Sea Level Pressure
(SLP) anomalies for Tahiti and DarwinAustralia
Figure Global AverageTemperature Anomaly(1975 - 2007) Srcwwwmetofficegovuk
Chawla and Chandola Anomaly Detection
Introduction Data Mining Methods Density-based anomaly Commute Time Approach Addressing Scalability Anomalies in Complex Data Evaluating Anomaly Detection Methods Applications Problem solutionsPCA and Subspace Method Subspace Method Algorithm Subspace Analysis Results Discussion Typical Characteristics of Anomaly Limitation of Volume Entropy Based versus Volume Based Fraud Detection Epidemeology Anomaly Detection in Climate and Weather Anomalies in Climate Validation of Anomalies
Constructing Anomalies from Raw Data
Anomaly time series for a given location i
vprimei = vi minus bi
where bi is the base (reference)
How to choose bi Mean of all data for location i Monthly mean values (account for seasonality) Monthly z-score values Median (more robust) Using a shorter ldquoreference periodrdquo
30 year moving window
Different methods show statistically significant differences[19] What is the right strategy Weighted mean of different strategies (Pick weights using
Monte Carlo sampling)
Chawla and Chandola Anomaly Detection
Introduction Data Mining Methods Density-based anomaly Commute Time Approach Addressing Scalability Anomalies in Complex Data Evaluating Anomaly Detection Methods Applications Problem solutionsPCA and Subspace Method Subspace Method Algorithm Subspace Analysis Results Discussion Typical Characteristics of Anomaly Limitation of Volume Entropy Based versus Volume Based Fraud Detection Epidemeology Anomaly Detection in Climate and Weather Anomalies in Climate Validation of Anomalies
Anomaly Detection for Identifying Droughts
Science question Identify significant drought patterns usinghistorical observation data or future simulation data or both
Find persistent spatiotemporal anomalies in precipitation data
A two step approach
1 Find precipitationanomalies usingthresholds
2 Find large connectedcomponents across spaceand time
Matlab - bwlabelbwlabeln
Followup Science questionExplain cause
(drought190120061avi)
Figure Video courtsey Dr ArindamBanerjee
Chawla and Chandola Anomaly Detection
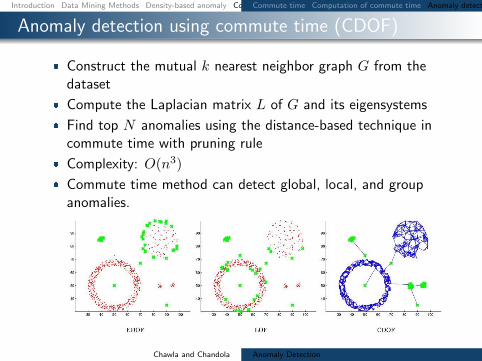
Introduction Data Mining Methods Density-based anomaly Commute Time Approach Addressing Scalability Anomalies in Complex Data Evaluating Anomaly Detection Methods Applications Problem solutionsCommute time Computation of commute time Anomaly detection using commute time (CDOF) Fast estimation of commute time Scalability for Density-based method PINN Algorithm (ICDM 2010) PINN Guarantee Examples high-dim distance-based outliers Examples high-dim density-based outliers Examples local density-based outliers
Anomaly detection using commute time (CDOF)
Construct the mutual k nearest neighbor graph G from thedataset
Compute the Laplacian matrix L of G and its eigensystems
Find top N anomalies using the distance-based technique incommute time with pruning rule
Complexity O(n3)
Commute time method can detect global local and groupanomalies
Chawla and Chandola Anomaly Detection
Introduction Data Mining Methods Density-based anomaly Commute Time Approach Addressing Scalability Anomalies in Complex Data Evaluating Anomaly Detection Methods Applications Problem solutionsCommute time Computation of commute time Anomaly detection using commute time (CDOF) Fast estimation of commute time Scalability for Density-based method PINN Algorithm (ICDM 2010) PINN Guarantee Examples high-dim distance-based outliers Examples high-dim density-based outliers Examples local density-based outliers
Fast estimation of commute time
Speilman and Srivastava [31] combined random projection anda linear time solver to build a structure where we can computethe compute time between two nodes in O(log n) time
Complexity of CDOF O(n3)rarr O(n log n)
Uses a near linear time solver for a linear system of equationAx = b
Spielman and Teng solvers Also see work by Iannis Koutisfrom CMU
Chawla and Chandola Anomaly Detection
Introduction Data Mining Methods Density-based anomaly Commute Time Approach Addressing Scalability Anomalies in Complex Data Evaluating Anomaly Detection Methods Applications Problem solutionsCommute time Computation of commute time Anomaly detection using commute time (CDOF) Fast estimation of commute time Scalability for Density-based method PINN Algorithm (ICDM 2010) PINN Guarantee Examples high-dim distance-based outliers Examples high-dim density-based outliers Examples local density-based outliers
Scalability for Density-based method
The pruning rule for Distance-based methods does not applyto Density-based approaches
We can go from O(n2) to nearly O(n log n) by using an index
One solution for the curse of high dimensionality is to use ofrandom projections
Chawla and Chandola Anomaly Detection
Introduction Data Mining Methods Density-based anomaly Commute Time Approach Addressing Scalability Anomalies in Complex Data Evaluating Anomaly Detection Methods Applications Problem solutionsCommute time Computation of commute time Anomaly detection using commute time (CDOF) Fast estimation of commute time Scalability for Density-based method PINN Algorithm (ICDM 2010) PINN Guarantee Examples high-dim distance-based outliers Examples high-dim density-based outliers Examples local density-based outliers
PINN Algorithm (ICDM 2010)
Chawla and Chandola Anomaly Detection
Introduction Data Mining Methods Density-based anomaly Commute Time Approach Addressing Scalability Anomalies in Complex Data Evaluating Anomaly Detection Methods Applications Problem solutionsCommute time Computation of commute time Anomaly detection using commute time (CDOF) Fast estimation of commute time Scalability for Density-based method PINN Algorithm (ICDM 2010) PINN Guarantee Examples high-dim distance-based outliers Examples high-dim density-based outliers Examples local density-based outliers
PINN Guarantee
The PINN Algorithm provides probabilistic guarantees
Under certain assumptions about intrinsic dimensionality (c)with high probability
1minus ε1 + ε
middot LOF (p) le LOF (p) le 1 + ε
1minus ε middot LOF (p)
In practice we do not know the intrinsic dimensionality ofdata However random projections are quite robust
Chawla and Chandola Anomaly Detection
Introduction Data Mining Methods Density-based anomaly Commute Time Approach Addressing Scalability Anomalies in Complex Data Evaluating Anomaly Detection Methods Applications Problem solutionsCommute time Computation of commute time Anomaly detection using commute time (CDOF) Fast estimation of commute time Scalability for Density-based method PINN Algorithm (ICDM 2010) PINN Guarantee Examples high-dim distance-based outliers Examples high-dim density-based outliers Examples local density-based outliers
Examples high-dim distance-based outliers
On a large database of images the bright images show up asdistance based outliers
Chawla and Chandola Anomaly Detection
Introduction Data Mining Methods Density-based anomaly Commute Time Approach Addressing Scalability Anomalies in Complex Data Evaluating Anomaly Detection Methods Applications Problem solutionsCommute time Computation of commute time Anomaly detection using commute time (CDOF) Fast estimation of commute time Scalability for Density-based method PINN Algorithm (ICDM 2010) PINN Guarantee Examples high-dim distance-based outliers Examples high-dim density-based outliers Examples local density-based outliers
Examples high-dim density-based outliers
On a large database of images occluded images show up asdensity based outliers
Chawla and Chandola Anomaly Detection
Introduction Data Mining Methods Density-based anomaly Commute Time Approach Addressing Scalability Anomalies in Complex Data Evaluating Anomaly Detection Methods Applications Problem solutionsCommute time Computation of commute time Anomaly detection using commute time (CDOF) Fast estimation of commute time Scalability for Density-based method PINN Algorithm (ICDM 2010) PINN Guarantee Examples high-dim distance-based outliers Examples high-dim density-based outliers Examples local density-based outliers
Examples local density-based outliers
Examples of images ranked by LOF
Chawla and Chandola Anomaly Detection
Introduction Data Mining Methods Density-based anomaly Commute Time Approach Addressing Scalability Anomalies in Complex Data Evaluating Anomaly Detection Methods Applications Problem solutions
Addressing Scalability
Chawla and Chandola Anomaly Detection
Introduction Data Mining Methods Density-based anomaly Commute Time Approach Addressing Scalability Anomalies in Complex Data Evaluating Anomaly Detection Methods Applications Problem solutions
Using GPUs for Anomaly Detection
Well suited for data parallel algorithms Using CUDA - Compute Unified Device
Architecture (Nvidia)
Need to re-engineer existing algorithms Utilization of device memory Minimize CPUhArrGPU transfer of data Keep threads homogeneous
Most model based algorithms arenaturally setup for the testing phase
Model building needs careful redesign
What about unsupervised algorithms
Kernel
Host
Grid
Device
Block(00)
Block(01)
Block(02)
Block(10)
Block(11)
Block(12)
Thread Block
Thread(00)
Thread(01)
Thread(02)
Thread(03)
Thread(10)
Thread(11)
Thread(12)
Thread(13)
Thread(20)
Thread(21)
Thread(22)
Thread(23)
Host Host Memory
SM 2
SM 1
SM 0
Registers Registers Registers
SP 0 SP 1 SP 7
Shared Memory
Global Memory
Texture Memory
Constant Memory
Device
Chawla and Chandola Anomaly Detection
Introduction Data Mining Methods Density-based anomaly Commute Time Approach Addressing Scalability Anomalies in Complex Data Evaluating Anomaly Detection Methods Applications Problem solutions
Implementing DB(kN) on GPUs
Return top N data instances whose distances tok-th nearest neighbor are largest (SerialDB(kN) is O(n2))
Involves computing pairwise distances
Load block i and block j to shared memory Data layout in memory should be optimized
Each thread computes distance between a pairof instances
Can utilize this time to load next chunk of datafrom host to device memory
Writes results to corresponding output block
Sorting can be done efficiently in CUDA [29]
d
n
T
n
n
Chawla and Chandola Anomaly Detection
Introduction Data Mining Methods Density-based anomaly Commute Time Approach Addressing Scalability Anomalies in Complex Data Evaluating Anomaly Detection Methods Applications Problem solutionsCategorical Data Discrete Sequences and Time Series Contextual Anomalies Collective Anomalies
Moving Beyond Multi-dimensional Record Data
Categorical (Mixed)
Fraud Detection
Cyber Networks
Time Series
Sensor Networks
Healthcare
Discrete Sequences
Genomic
System Calls
Spatial
GIS
Image analysis
Spatio-temporal
Remote sensing
Climate
Graphs
Social networks
Epidemiology
Chawla and Chandola Anomaly Detection
Introduction Data Mining Methods Density-based anomaly Commute Time Approach Addressing Scalability Anomalies in Complex Data Evaluating Anomaly Detection Methods Applications Problem solutionsCategorical Data Discrete Sequences and Time Series Contextual Anomalies Collective Anomalies
Handling Categorical Data
Each attribute can belong to one of many categories
No ordering between categories
Mixed data (categorical and continuous attributes)
cap-shape cap-surface middot middot middot habitat type
convex smooth urban poisonousconvex smooth grasses ediblebell smooth meadows edibleconvex scaly urban poisonousconvex smooth grasses ediblemiddot middot middot
Table Mushroom Data Set [2]
Chawla and Chandola Anomaly Detection
Introduction Data Mining Methods Density-based anomaly Commute Time Approach Addressing Scalability Anomalies in Complex Data Evaluating Anomaly Detection Methods Applications Problem solutionsCategorical Data Discrete Sequences and Time Series Contextual Anomalies Collective Anomalies
Approaches to Identify Categorical Anomalies
Using Association Analysis [24]
Binarize data
Learn rules (X rArr Y ) Choose high confidence
rules (P (Y |X))
For test record Z = 〈XY 〉find rules of the formP (Y |X)
Y is not observed whenX is observed
Using Bayesian Networks [33]
Learn Bayesian networkstructure and parameters
Compute P (Z) for test datarecord Z
Flag anomaly if P (Z) lt δ
Using Similarity Metrics [10]
Use a similarity measure (S(X1 X2))
Apply distancedensityclustering based method (eg lof)
Chawla and Chandola Anomaly Detection
Introduction Data Mining Methods Density-based anomaly Commute Time Approach Addressing Scalability Anomalies in Complex Data Evaluating Anomaly Detection Methods Applications Problem solutionsCategorical Data Discrete Sequences and Time Series Contextual Anomalies Collective Anomalies
Conditional Probability Test [18]
Identify unusual combinations of attribute values
r(at bt) =P (at bt)
P (at)P (bt)
A capB = φ Assumption If r(at bt) is low and is observed in test record t
then t is anomalous For a test record t
For each mutually exclusive pair of attribute sets ABcompute r(at bt)
Score t based on all r-values Assign minimum r-value as score Take product of all r-values
Need to compare exponential pairs of subsets Only consider subsets upto size k Ignore subsets with frequency less than a threshold α Avoid comparing independent subsets of attributes
micro(AB) ge βmicroChawla and Chandola Anomaly Detection
Introduction Data Mining Methods Density-based anomaly Commute Time Approach Addressing Scalability Anomalies in Complex Data Evaluating Anomaly Detection Methods Applications Problem solutionsCategorical Data Discrete Sequences and Time Series Contextual Anomalies Collective Anomalies
Estimating Probabilities for CPT [18]
Maximum LikelihoodEstimation
P (at bt)
P (at)P (bt)=C(at bt)
Ntimes N
C(at)times N
C(bt)
C(at) Number of traininginstances with A = at
N Total number of traininginstances
Laplace Smoothing
E(p) =C(p) + 1
N + 2
r(at bt) =E(at bt)
E(at)times E(bt)
Speedup Tricks
Replace rare attributevalues with genericattribute (reduce arity)
Use efficient datastructure to querying forcounts(AD Trees [26])
ADTrees work fasterfor low arity attributes
Chawla and Chandola Anomaly Detection
Introduction Data Mining Methods Density-based anomaly Commute Time Approach Addressing Scalability Anomalies in Complex Data Evaluating Anomaly Detection Methods Applications Problem solutionsCategorical Data Discrete Sequences and Time Series Contextual Anomalies Collective Anomalies
Finding Anomalies in Discrete Sequences
Many problem formulations
1 Anomalous symbols in asequence
2 Anomalous subsequence in asequence
3 Anomalous sequence in adatabase of sequences
See [11] for a comparativeevaluation [9] for a survey
login pwdmail ssh mail web logoutlogin pwdmail web web web web logoutlogin pwdmail ssh mail web web logoutlogin pwdwebmail ssh webmail logoutloginpwd loginpwd loginpwd logout
Chawla and Chandola Anomaly Detection
Introduction Data Mining Methods Density-based anomaly Commute Time Approach Addressing Scalability Anomalies in Complex Data Evaluating Anomaly Detection Methods Applications Problem solutionsCategorical Data Discrete Sequences and Time Series Contextual Anomalies Collective Anomalies
Treating Sequences as Points
Utilize a distancesimilarity measure Plug into a distancedensityclustering based method
Simplest Hamming Distance
h(Ai Bi) = 1 Ai 6= Bi= 0 Ai = Bi
H(AB) =nsumi=1
h(Ai Bi)
Issues Unequal lengths misalignment Normalized Length of Longest Common Subsequence
D(AB) = 1minus |LCS(AB)|radic|A||B|
Standard Dynamic Programming method is slow Faster versions available (Hunt Szymnaski method [7])
Weaknesses Cannot localize anomalies within a sequence Weak anomaly signals might get lost
Chawla and Chandola Anomaly Detection
Introduction Data Mining Methods Density-based anomaly Commute Time Approach Addressing Scalability Anomalies in Complex Data Evaluating Anomaly Detection Methods Applications Problem solutionsCategorical Data Discrete Sequences and Time Series Contextual Anomalies Collective Anomalies
Using Sliding Windows
Slide a window of size k
Extract all windows from a sequence (nminus k + 1)
Training (Creating a normal dictionary) Store all uniquewindows in all normal sequences and their counts
Testing For each window find the frequency in normal dictionary Anomaly score is inverse of the aggregate frequencies for all
windows (normalized by length)
Many variants exist For each window find the hamming distance to the closest
window in the normal dictionary [16]
Issues Penalizes low frequency windows in the normal dictionary Rewards high frequency windows that might not be relevant Can construct anomalous sequences that will escape detection
Chawla and Chandola Anomaly Detection
Introduction Data Mining Methods Density-based anomaly Commute Time Approach Addressing Scalability Anomalies in Complex Data Evaluating Anomaly Detection Methods Applications Problem solutionsCategorical Data Discrete Sequences and Time Series Contextual Anomalies Collective Anomalies
Using Probabilistic Models
Probability of occurrence of sequence S
P (S) =nprodi=1
P (Si|S1 Siminus1)
Short memory property of sequences
P (Si|S1 Siminus1) = P (Si|Siminusk Siminus1)
Conditional probability estimates for a symbol Si
P (Si|Siminusk Siminus1) =f(Si|Siminusk Si)f(Si|Siminusk Siminus1)
f is estimated from the normal dictionary
Anomaly score for a test sequence is inverse of the normalizedprobability of occurrence
Issues What if the suffix occurs very infrequently in thenormal data (or not at all)
Replace with the longest suffix that occurs sufficient number oftimes [32] - Probabilistic Suffix Trees
Significantly reduces the size of the modelChawla and Chandola Anomaly Detection
Introduction Data Mining Methods Density-based anomaly Commute Time Approach Addressing Scalability Anomalies in Complex Data Evaluating Anomaly Detection Methods Applications Problem solutionsCategorical Data Discrete Sequences and Time Series Contextual Anomalies Collective Anomalies
Finding Contextual Anomalies
Sometimes contextual information isavailable about data
Not used directly as a feature Are well understood no anomalies in
the context Can reduce false positives and yield
interesting anomalies
Example adapted from [30]
Clearest Outlier
Conditional Anomaly
Maximum Daily Temperature
Number
ofFever
Cases
Contextual anomalies - Anomalous with respect to a context Context is defined using environmental variables
Spatial (Latitude Longitude) Graph context (Edges Weights) Temporal location Domain specific (Demographic other)
How to incorporate context Reduce to traditional anomaly detection (subset on context) Explicitly model contextual information (time series spatial)
Chawla and Chandola Anomaly Detection
Introduction Data Mining Methods Density-based anomaly Commute Time Approach Addressing Scalability Anomalies in Complex Data Evaluating Anomaly Detection Methods Applications Problem solutionsCategorical Data Discrete Sequences and Time Series Contextual Anomalies Collective Anomalies
Conditional Anomaly Detection
Data instance d rArru1 u2 udU v1 v2 vdV
dU environmentalattributes
dV indicator attributes u1
u2
U1
U2
U3
v1
v2
V1V2
V3
p(V1|U3) = 02
p(V2|U3) = 02
p(V3|U3) = 06
Algorithm [30]
1 Learn a Gaussian Mixture Model (GMM)U = U1 U2 UnU
each with dimensionality dU2 Learn a set of Gaussians U = V1 V2 VnV
each withdimensionality dV
3 Learn a probabilistic mapping function p(Vj |Ui)4 Score a test instance d = [uv]
S =
nUsumi=1
p(u|Ui)nVsumj=1
p(v|Vj)p(Vj |Ui)
Chawla and Chandola Anomaly Detection
Introduction Data Mining Methods Density-based anomaly Commute Time Approach Addressing Scalability Anomalies in Complex Data Evaluating Anomaly Detection Methods Applications Problem solutionsCategorical Data Discrete Sequences and Time Series Contextual Anomalies Collective Anomalies
Finding Collective Anomalies
Find a collection of data points
Each point by itself is normal
The collection as a whole isanomalous
Relevant when data has inherentstructure and
When domain definition ofanomalies cannot be described aspoint anomalies
A Simple Solution
1 Break data intogroups
2 Compute features foreach group
3 Apply traditionalanomaly detection
Examples
1 Time series
2 Image
3 Spatial clusters ofgalaxies
Chawla and Chandola Anomaly Detection
Introduction Data Mining Methods Density-based anomaly Commute Time Approach Addressing Scalability Anomalies in Complex Data Evaluating Anomaly Detection Methods Applications Problem solutionsCategorical Data Discrete Sequences and Time Series Contextual Anomalies Collective Anomalies
Using Latent Dirichlet Allocation for Group Anomalies
Find anomalous groups in data [34]
Example Spatial clusters of galaxies topics red green emissive words continuous features
Flexible Genre Model (FGM)
For each group
1 Draw a genre 1 2 T 3 ym simM(π)2 Draw topic distribution forym SK 3 θm sim Dir(αym)
3 Draw K topicsβmk sim P (βmk|ηk)k=12K
4 For each point in group
1 Draw topic membershipzmn simM(θn)
2 Generate pointxmn isin P (xmn|βmzmn)
α
zmn
xmn
N
θm
T
π
ηK
ym
β
MK
Model Parameters
M(π) -Multinomial
Genre - Dir(αt)
Topic generatorsP (|ηk)- GIW
Point generatorsP (xmn|βnk) -MultivariateGaussian
Chawla and Chandola Anomaly Detection
Introduction Data Mining Methods Density-based anomaly Commute Time Approach Addressing Scalability Anomalies in Complex Data Evaluating Anomaly Detection Methods Applications Problem solutionsCategorical Data Discrete Sequences and Time Series Contextual Anomalies Collective Anomalies
Inference and Testing for FGM
Inference and Learning Parameters
Approximate inference of latentvariables (Gibbs Sampling)
Use samples to learn parameters(Single step Monte Carlo EM)
Topic 1
Topic 2
Topic 3
Anomaly Detection
Infer the topic distribution θm
Compute negative log likelihood wrt αt
Rationale An anomalous group will be unlikely to begenerated from any genre
Geometric interpretation Mapping each group into a Tdimensional space and finding anomalies
Chawla and Chandola Anomaly Detection
Introduction Data Mining Methods Density-based anomaly Commute Time Approach Addressing Scalability Anomalies in Complex Data Evaluating Anomaly Detection Methods Applications Problem solutions
Evaluating Anomaly Detection Methods - Labels
Labeled validation data set exists Confusion matrix Traditional evaluation metrics
Class imbalance
ROC Curve
Validation set does not exist Use domain expertise to find TP
and FP FN is harder to estimate
Pseudo false negativeestimation techniques [25]
Predicteda n
Actuala TP FNn FP TN
Acc =TP + TNsum
Rec (R) =TP
TP + FN
Prec (P ) =TP
TP + FP
F =2 lowastR lowast PR+ P
Chawla and Chandola Anomaly Detection
Introduction Data Mining Methods Density-based anomaly Commute Time Approach Addressing Scalability Anomalies in Complex Data Evaluating Anomaly Detection Methods Applications Problem solutions
Evaluating Anomaly Detection Methods - Scores
Convert to binary output Use threshold δ on score (Scale
issues [21]) Take top x as anomalies
ROC curve by varying x or δ
Quality of output Does the output ldquosuggestrdquo x or δ Which output is better
Chawla and Chandola Anomaly Detection
Introduction Data Mining Methods Density-based anomaly Commute Time Approach Addressing Scalability Anomalies in Complex Data Evaluating Anomaly Detection Methods Applications Problem solutions
Unifying Scores
Different methods assign scores in differentranges
kNN-based scores [0 1] Lof scores [1 6] ABOD scores [0 80000]
Anomalies have lower scores
Direct scaling to [0 1] might lose distinctionbetween normal and anomalies
Desired scaling Stretch interesting rangesand shrink irrelevant ones
Generalized Procedure for Normalizing Outlier Scores [21] Regularity rArr S(o) ge 0forallo S(o) asymp 0 if o is normal andS(o) 0 if o is anomalous
Normality S is regular and S(o) isin [0 1]forallo
Chawla and Chandola Anomaly Detection
Introduction Data Mining Methods Density-based anomaly Commute Time Approach Addressing Scalability Anomalies in Complex Data Evaluating Anomaly Detection Methods Applications Problem solutions
Regularization and Normalization of Scores
Regularization
1 R(o) = max0 S(o)minus baseS2 R(o) = Smax minus S(o)
3 R(o) = minus log SmaxS(o)
Normalization
1 N(o) = S(o)Smax
2 N(o) = max(
0 erf(S(o)minusmicroSσS radic2
))(Gaussian Scaling)
Suited for high dimensional data
3 N(o) = max(
0cdfγS (o)minusmicroγ
1minusmicroγ
)(Gamma Scaling)
Where cdfγS (o) = P (k S(o) θ) P is the regularized Gamma function Suited for low dimensional data
Chawla and Chandola Anomaly Detection
Introduction Data Mining Methods Density-based anomaly Commute Time Approach Addressing Scalability Anomalies in Complex Data Evaluating Anomaly Detection Methods Applications Problem solutions
Generating Labeled Data for Validation
Generating Both Normal and Anomalous Data
Use generative models for normal and anomalous behavior
Several generators available Multivariate continuous data [27] Multivariate categorical data [5] Discrete sequences using HMM [12]
Drawbacks Might not capture the domain characteristics
Injecting Anomalies - Random Perturbation[30]
Given data point z = xy x and y arepartitions of feature space
Take a random sample D of the entire data set
Let zprime = xprimeyprime isin D such that distancebetween y and yprime is maximum
Replace x with xprime and add z back to data setx
yz
zprime
Injected anomaly
Chawla and Chandola Anomaly Detection
Introduction Data Mining Methods Density-based anomaly Commute Time Approach Addressing Scalability Anomalies in Complex Data Evaluating Anomaly Detection Methods Applications Problem solutionsWhat is Network Anomaly Detection Motivation How Much Serious
Applications Overview
How to set up an anomaly detection solution for agiven application domain
Available data Define anomalies define normal behavior Identify requirements and constraints (online
real-time limited resources) What domain knowledge available
Feature identification Defining normal and anomalous behavior Tuning parameters
Available ground truth (training validation)
Chawla and Chandola Anomaly Detection
Introduction Data Mining Methods Density-based anomaly Commute Time Approach Addressing Scalability Anomalies in Complex Data Evaluating Anomaly Detection Methods Applications Problem solutionsWhat is Network Anomaly Detection Motivation How Much Serious
What is Network Anomaly Detection
Anomaly Detection or Intrusion Detection
Traditional Intrusion Detection Systems (IDS) finding attackscorresponding to predefined pattern data set known as signaturestherefore system is absolutely vulnerable against zero-day attacks
Network Anomaly Detection Systems (NADS) to detectzero-day attacks without any pre-identified signature besides profilenormal behavior of the network and address suspected incidents
Network Anomaly Detection finding unusual and largechanges in the network traffic
Examples intentional attacks (eg Distributed Denial ofService - DDoS) or unusual network traffic (eg flash crowds)
Chawla and Chandola Anomaly Detection
Introduction Data Mining Methods Density-based anomaly Commute Time Approach Addressing Scalability Anomalies in Complex Data Evaluating Anomaly Detection Methods Applications Problem solutionsWhat is Network Anomaly Detection Motivation How Much Serious
Motivation How Much Serious
According to Symantec report released in early 2011 morethan 286 million new threats have been detected in 2010which is a huge number
1656227
2704836
1000000
1500000
2000000
2500000
3000000
20547 18827 69107 113025 140690
624267
1656227
2704836
0
500000
1000000
1500000
2000000
2500000
3000000
2002 2003 2004 2005 2006 2007 2008 July2009-June2010
Chawla and Chandola Anomaly Detection
Introduction Data Mining Methods Density-based anomaly Commute Time Approach Addressing Scalability Anomalies in Complex Data Evaluating Anomaly Detection Methods Applications Problem solutionsNetwork Topology Network Anomalies Detection Problem Network Anomalies Detection Problem Why care about OD Flows
Network Topology
A Typical network
1 y
Router
2
3
41t
x2t
x1t
x3t
x4t
Origin-Destination (OD) flow is the traffic that enters at anorigin node and exits at a destination node of a backbonenetwork x1t x1t
Link measurement is the traffic enters at an node during aninterval y1t
Relationship between link traffic and OD flow traffic iscaptured by the routing matrix A
Chawla and Chandola Anomaly Detection
Introduction Data Mining Methods Density-based anomaly Commute Time Approach Addressing Scalability Anomalies in Complex Data Evaluating Anomaly Detection Methods Applications Problem solutionsNetwork Topology Network Anomalies Detection Problem Network Anomalies Detection Problem Why care about OD Flows
Network Anomalies Detection Problem
Chawla and Chandola Anomaly Detection
Introduction Data Mining Methods Density-based anomaly Commute Time Approach Addressing Scalability Anomalies in Complex Data Evaluating Anomaly Detection Methods Applications Problem solutionsNetwork Topology Network Anomalies Detection Problem Network Anomalies Detection Problem Why care about OD Flows
Network Anomalies Detection Problem
Chawla and Chandola Anomaly Detection
Introduction Data Mining Methods Density-based anomaly Commute Time Approach Addressing Scalability Anomalies in Complex Data Evaluating Anomaly Detection Methods Applications Problem solutionsNetwork Topology Network Anomalies Detection Problem Network Anomalies Detection Problem Why care about OD Flows
Why care about OD Flows
Volume anomaly typically arises on an OD flow (trafficarriving at one node and destined for another node)
If we only monitor traffic on network links volume arisingfrom an OD flow may not be noticeable Thus naiveapproach wont work if OD flow info is not available
Figure source [22]
Chawla and Chandola Anomaly Detection
Introduction Data Mining Methods Density-based anomaly Commute Time Approach Addressing Scalability Anomalies in Complex Data Evaluating Anomaly Detection Methods Applications Problem solutionsPCA and Subspace Method Subspace Method Algorithm Subspace Analysis Results Discussion Typical Characteristics of Anomaly Limitation of Volume Entropy Based versus Volume Based Fraud Detection Epidemeology Anomaly Detection in Climate and Weather Anomalies in Climate Validation of Anomalies
PCA and Subspace Method
Chawla and Chandola Anomaly Detection
Introduction Data Mining Methods Density-based anomaly Commute Time Approach Addressing Scalability Anomalies in Complex Data Evaluating Anomaly Detection Methods Applications Problem solutionsPCA and Subspace Method Subspace Method Algorithm Subspace Analysis Results Discussion Typical Characteristics of Anomaly Limitation of Volume Entropy Based versus Volume Based Fraud Detection Epidemeology Anomaly Detection in Climate and Weather Anomalies in Climate Validation of Anomalies
Subspace Method Algorithm
Step1- Determine the PCs based on eigenvaluedecomposition of the covariance matrix of the dataset
Step2- Choose first top k principle components with thehighest eigenvalues as matrix P
Step3-normal traffic subspace called Z
Z = PP TZ = CZ
Step4-abnormal traffic subspace called Z
Z = (I minus PP T )Z = CZ
Step5-If the norm of a vector is large then it is an rdquoanomalyrdquo
Chawla and Chandola Anomaly Detection
Introduction Data Mining Methods Density-based anomaly Commute Time Approach Addressing Scalability Anomalies in Complex Data Evaluating Anomaly Detection Methods Applications Problem solutionsPCA and Subspace Method Subspace Method Algorithm Subspace Analysis Results Discussion Typical Characteristics of Anomaly Limitation of Volume Entropy Based versus Volume Based Fraud Detection Epidemeology Anomaly Detection in Climate and Weather Anomalies in Climate Validation of Anomalies
Subspace Analysis Results
Note that during anomaly normal component does not changethat much while residual component changes quite a lot
Thus anomalies can be detected by setting some threshold
Figure source [22]
Chawla and Chandola Anomaly Detection
Introduction Data Mining Methods Density-based anomaly Commute Time Approach Addressing Scalability Anomalies in Complex Data Evaluating Anomaly Detection Methods Applications Problem solutionsPCA and Subspace Method Subspace Method Algorithm Subspace Analysis Results Discussion Typical Characteristics of Anomaly Limitation of Volume Entropy Based versus Volume Based Fraud Detection Epidemeology Anomaly Detection in Climate and Weather Anomalies in Climate Validation of Anomalies
Discussion Typical Characteristics of Anomaly
Most Anomalies induce a change in distributionalaspects of packet header fields (called features)
Most important features include 5-tuple Source ampdestination IP addresses Source and destination portnumbers and IP protocol
raquo DOS attack ndash multiple source IP address concentrated on asingle destination IP address
raquo Network scan ndash dispersed distribution of destination addresses
raquo Most wormsviruses also induce some change in distribution ofcertain features
raquo However these changes can be very subtle and mining them islike searching for needles in a haystack
Unlike many previous approach this paper aims todetect events which disturb the distribution of trafficfeatures rather than traffic volume
Chawla and Chandola Anomaly Detection
Introduction Data Mining Methods Density-based anomaly Commute Time Approach Addressing Scalability Anomalies in Complex Data Evaluating Anomaly Detection Methods Applications Problem solutionsPCA and Subspace Method Subspace Method Algorithm Subspace Analysis Results Discussion Typical Characteristics of Anomaly Limitation of Volume Entropy Based versus Volume Based Fraud Detection Epidemeology Anomaly Detection in Climate and Weather Anomalies in Climate Validation of Anomalies
Limitation of Volume
Figure source [22]
Port scan anomaly (traffic feature changes however traffic volume
remains more or less the same)
We can use entropy tocapture the variationsin the traffic feature
bullTakes value 0 when distribution is maximally concentratedbullTakes value log2N when distribution is maximally dispersed
But stands out in
feature entropy
which also reveals
its structure
Port scan
dwarfed
in volume
metricshellip
Chawla and Chandola Anomaly Detection
Introduction Data Mining Methods Density-based anomaly Commute Time Approach Addressing Scalability Anomalies in Complex Data Evaluating Anomaly Detection Methods Applications Problem solutionsPCA and Subspace Method Subspace Method Algorithm Subspace Analysis Results Discussion Typical Characteristics of Anomaly Limitation of Volume Entropy Based versus Volume Based Fraud Detection Epidemeology Anomaly Detection in Climate and Weather Anomalies in Climate Validation of Anomalies
Entropy Based versus Volume Based
DoSDDoS Attacks- a spike in traffic data toward adominant destination IP
Scan anomaly-a spike in traffic data from a dominant sourceIP
Flash Crowd anomaly- again a spike in traffic data to adominant destination IP
Worm anomaly-a Spike in traffic with a dominant port
Chawla and Chandola Anomaly Detection
Introduction Data Mining Methods Density-based anomaly Commute Time Approach Addressing Scalability Anomalies in Complex Data Evaluating Anomaly Detection Methods Applications Problem solutionsPCA and Subspace Method Subspace Method Algorithm Subspace Analysis Results Discussion Typical Characteristics of Anomaly Limitation of Volume Entropy Based versus Volume Based Fraud Detection Epidemeology Anomaly Detection in Climate and Weather Anomalies in Climate Validation of Anomalies
Fraud Detection
Domain Question Identifyfraudulent activities or players fromobserved transaction data
Data Transactions between different
players in the system Meta information about the
individuals An underlying graph structure
Challenges Track and model human behavior Anomalies caused by adaptive
human adversaries Massive data sizes
Insurance (autohealtha)
ClaimantProvider Payer
Telecommunications Customer
Provider
Credit Cards Customer
Supplier Bank
Web Advertising User Advertiser
Publisher
ahttpwwwcheatingculturecompast-cases-of-medicare-fraud
Chawla and Chandola Anomaly Detection
Introduction Data Mining Methods Density-based anomaly Commute Time Approach Addressing Scalability Anomalies in Complex Data Evaluating Anomaly Detection Methods Applications Problem solutionsPCA and Subspace Method Subspace Method Algorithm Subspace Analysis Results Discussion Typical Characteristics of Anomaly Limitation of Volume Entropy Based versus Volume Based Fraud Detection Epidemeology Anomaly Detection in Climate and Weather Anomalies in Climate Validation of Anomalies
A Generic Fraud Detection Method
Activity Monitoring [13]1 Build profiles for individuals (customers users etc) based on
historic data User X makes n calls on an average in January
2 Compare current behavior with historical profile for significantdeviations
Clustering based [4]1 Cluster historical profiles of customers2 Identify small clusters or outlying profiles as anomalies
Strengths Anomaly detection is fast (good for real time) Results are easy to explain
Weaknesses Need to create and maintain a large number of profiles Not dynamic Adequate historical data might not be available Too many false positives
Chawla and Chandola Anomaly Detection
Introduction Data Mining Methods Density-based anomaly Commute Time Approach Addressing Scalability Anomalies in Complex Data Evaluating Anomaly Detection Methods Applications Problem solutionsPCA and Subspace Method Subspace Method Algorithm Subspace Analysis Results Discussion Typical Characteristics of Anomaly Limitation of Volume Entropy Based versus Volume Based Fraud Detection Epidemeology Anomaly Detection in Climate and Weather Anomalies in Climate Validation of Anomalies
Exploiting Graph Structure - Weighted Graphs
Represent data as a weighted graph Communication networks (phone email SMS) Provider referral networks
Objective Identify anomalous nodes
For each node extract several features based on the propertiesof the induced sub-graph (egonet) of neighboring nodes [1]
Choose features that can highlight anomalous nodes
1 Ni degree of node2 Ei number of edges in egonet3 Wi total weight of egonet4 λi principal eigen vector of weighted adjacency matrix of
egonet
Data is transformed into a point in a multi-dimensional space
Chawla and Chandola Anomaly Detection
Introduction Data Mining Methods Density-based anomaly Commute Time Approach Addressing Scalability Anomalies in Complex Data Evaluating Anomaly Detection Methods Applications Problem solutionsPCA and Subspace Method Subspace Method Algorithm Subspace Analysis Results Discussion Typical Characteristics of Anomaly Limitation of Volume Entropy Based versus Volume Based Fraud Detection Epidemeology Anomaly Detection in Climate and Weather Anomalies in Climate Validation of Anomalies
Identifying Anomalies
Traditional anomaly detection (lof) Can be slow but can identify any type of anomalous structure
Faster method to identify specific types of anomalousstructures
Identify relevant feature pairs and power law relationship
Eg Egonet Density Power Law Ni vs Ei - detect nearcliques and stars
Ei prop Nαi 1 le α le 2
Anomaly score for node i wrt a pair of features (y = Cxθ)
Si =max(yi Cx
θi )
min(yi Cxθi )lowast log (|yi minus Cxθi |+ 1)
Chawla and Chandola Anomaly Detection
Introduction Data Mining Methods Density-based anomaly Commute Time Approach Addressing Scalability Anomalies in Complex Data Evaluating Anomaly Detection Methods Applications Problem solutionsPCA and Subspace Method Subspace Method Algorithm Subspace Analysis Results Discussion Typical Characteristics of Anomaly Limitation of Volume Entropy Based versus Volume Based Fraud Detection Epidemeology Anomaly Detection in Climate and Weather Anomalies in Climate Validation of Anomalies
Exploiting Graph Structure - Bipartite Graphs
Represent data as a bipartite graph Healthcare Data (Beneficiaries vs Providers) Insider trading (Traders vs Stocks)
Objective Identify anomalous links
Given a query node a isin V1 find the ldquorelevancerdquoof all other nodes in V1 to a
RelevanceScore(a b) prop Number of times aldquorandom walkrdquo from a reaches b
Use the relevance scores to compute thenormality scores for a node t isin V2
Find set St = a|〈a t〉 isin E Compute |St| times |St| similarity matrix using
relevance vectors for a isin St Normality Score = mean of non-diagonal entries
of similarity matrix
V1 E V2a1
a2
a3
an
t1
t2
t3
tn
Chawla and Chandola Anomaly Detection
Introduction Data Mining Methods Density-based anomaly Commute Time Approach Addressing Scalability Anomalies in Complex Data Evaluating Anomaly Detection Methods Applications Problem solutionsPCA and Subspace Method Subspace Method Algorithm Subspace Analysis Results Discussion Typical Characteristics of Anomaly Limitation of Volume Entropy Based versus Volume Based Fraud Detection Epidemeology Anomaly Detection in Climate and Weather Anomalies in Climate Validation of Anomalies
Detecting Disease Outbreaks
Domain Question Early detection of disease
outbreaks Anthrax attack
Data Emergency department visits Grocery data (Example [14]) Clinical visits Weatherclimate data
Challenges Weak signals in the data
ED cases involving cough rArrFlu or SARS
Integration of multiple signals(lag analysis)
Account for spatial and temporalcorrelations
Chawla and Chandola Anomaly Detection
Introduction Data Mining Methods Density-based anomaly Commute Time Approach Addressing Scalability Anomalies in Complex Data Evaluating Anomaly Detection Methods Applications Problem solutionsPCA and Subspace Method Subspace Method Algorithm Subspace Analysis Results Discussion Typical Characteristics of Anomaly Limitation of Volume Entropy Based versus Volume Based Fraud Detection Epidemeology Anomaly Detection in Climate and Weather Anomalies in Climate Validation of Anomalies
Whatrsquos Significant About Recent Events (WSARE) [33]
1 Learn Bayesian network from historical data Environmental and response variables
2 Sample from the BN (DBbaseline|Current Environment)3 Compute contingency table for rules for DBbaseline andDBcurrent
Rules are single assignment rules (Xi = Y ji ) or conjunctions4 Find p-value for rules using χ2-test
Null Hypothesis Rows and columns of tables for DBbaselineand DBcurrent are independent
5 Find rule with largest p-value Repeat Step 2
Chawla and Chandola Anomaly Detection
Introduction Data Mining Methods Density-based anomaly Commute Time Approach Addressing Scalability Anomalies in Complex Data Evaluating Anomaly Detection Methods Applications Problem solutionsPCA and Subspace Method Subspace Method Algorithm Subspace Analysis Results Discussion Typical Characteristics of Anomaly Limitation of Volume Entropy Based versus Volume Based Fraud Detection Epidemeology Anomaly Detection in Climate and Weather Anomalies in Climate Validation of Anomalies
Incorporating Spatial and Temporal Relationships
WSARE does not explicitly model the spatial and temporalrelationships
What happened yesterday What happened in the adjoining neighborhood (yesterday)
Bayesian Network Spatio-Temporal (BNST) modelingframework [17]
Add nodes for temporal and spatial dependencies Need more data to train
Chawla and Chandola Anomaly Detection
Introduction Data Mining Methods Density-based anomaly Commute Time Approach Addressing Scalability Anomalies in Complex Data Evaluating Anomaly Detection Methods Applications Problem solutionsPCA and Subspace Method Subspace Method Algorithm Subspace Analysis Results Discussion Typical Characteristics of Anomaly Limitation of Volume Entropy Based versus Volume Based Fraud Detection Epidemeology Anomaly Detection in Climate and Weather Anomalies in Climate Validation of Anomalies
Anomaly Detection in Climate and Weather
Science Questions Identify natural and anthropogenic disasters Identify long time scale events - droughts atmospheric rivers
cold fronts etc
Data Ground observations Remote sensing data (satellites
air-borne) Climate model simulation outputs Multiple variables spatio-temporal (often has height dimension
as well)
Challenges Model spatio-temporal relationships across multiple variables Explain the cause of anomalies Massive data sizes
Climate and weather extreme events are well defined
Key challenge is to find significant events and explain the cause
Chawla and Chandola Anomaly Detection
Introduction Data Mining Methods Density-based anomaly Commute Time Approach Addressing Scalability Anomalies in Complex Data Evaluating Anomaly Detection Methods Applications Problem solutionsPCA and Subspace Method Subspace Method Algorithm Subspace Analysis Results Discussion Typical Characteristics of Anomaly Limitation of Volume Entropy Based versus Volume Based Fraud Detection Epidemeology Anomaly Detection in Climate and Weather Anomalies in Climate Validation of Anomalies
Anomalies are Widely Used in Climate
Most analysis done on ldquoanomalyrdquo time series
Difference from a ldquobase periodrdquo (Toosimplistic)
Brings spatial smoothness (eg a mountaintop and nearby valley can have very differenttemperatures) Removes seasonality
Understand climate and weatherphenomenon
Southern Oscillation Index (SOI) Difference between Sea Level Pressure
(SLP) anomalies for Tahiti and DarwinAustralia
Figure Global AverageTemperature Anomaly(1975 - 2007) Srcwwwmetofficegovuk
Chawla and Chandola Anomaly Detection
Introduction Data Mining Methods Density-based anomaly Commute Time Approach Addressing Scalability Anomalies in Complex Data Evaluating Anomaly Detection Methods Applications Problem solutionsPCA and Subspace Method Subspace Method Algorithm Subspace Analysis Results Discussion Typical Characteristics of Anomaly Limitation of Volume Entropy Based versus Volume Based Fraud Detection Epidemeology Anomaly Detection in Climate and Weather Anomalies in Climate Validation of Anomalies
Constructing Anomalies from Raw Data
Anomaly time series for a given location i
vprimei = vi minus bi
where bi is the base (reference)
How to choose bi Mean of all data for location i Monthly mean values (account for seasonality) Monthly z-score values Median (more robust) Using a shorter ldquoreference periodrdquo
30 year moving window
Different methods show statistically significant differences[19] What is the right strategy Weighted mean of different strategies (Pick weights using
Monte Carlo sampling)
Chawla and Chandola Anomaly Detection
Introduction Data Mining Methods Density-based anomaly Commute Time Approach Addressing Scalability Anomalies in Complex Data Evaluating Anomaly Detection Methods Applications Problem solutionsPCA and Subspace Method Subspace Method Algorithm Subspace Analysis Results Discussion Typical Characteristics of Anomaly Limitation of Volume Entropy Based versus Volume Based Fraud Detection Epidemeology Anomaly Detection in Climate and Weather Anomalies in Climate Validation of Anomalies
Anomaly Detection for Identifying Droughts
Science question Identify significant drought patterns usinghistorical observation data or future simulation data or both
Find persistent spatiotemporal anomalies in precipitation data
A two step approach
1 Find precipitationanomalies usingthresholds
2 Find large connectedcomponents across spaceand time
Matlab - bwlabelbwlabeln
Followup Science questionExplain cause
(drought190120061avi)
Figure Video courtsey Dr ArindamBanerjee
Chawla and Chandola Anomaly Detection
Introduction Data Mining Methods Density-based anomaly Commute Time Approach Addressing Scalability Anomalies in Complex Data Evaluating Anomaly Detection Methods Applications Problem solutionsCommute time Computation of commute time Anomaly detection using commute time (CDOF) Fast estimation of commute time Scalability for Density-based method PINN Algorithm (ICDM 2010) PINN Guarantee Examples high-dim distance-based outliers Examples high-dim density-based outliers Examples local density-based outliers
Scalability for Density-based method
The pruning rule for Distance-based methods does not applyto Density-based approaches
We can go from O(n2) to nearly O(n log n) by using an index
One solution for the curse of high dimensionality is to use ofrandom projections
Chawla and Chandola Anomaly Detection
Introduction Data Mining Methods Density-based anomaly Commute Time Approach Addressing Scalability Anomalies in Complex Data Evaluating Anomaly Detection Methods Applications Problem solutionsCommute time Computation of commute time Anomaly detection using commute time (CDOF) Fast estimation of commute time Scalability for Density-based method PINN Algorithm (ICDM 2010) PINN Guarantee Examples high-dim distance-based outliers Examples high-dim density-based outliers Examples local density-based outliers
PINN Algorithm (ICDM 2010)
Chawla and Chandola Anomaly Detection
Introduction Data Mining Methods Density-based anomaly Commute Time Approach Addressing Scalability Anomalies in Complex Data Evaluating Anomaly Detection Methods Applications Problem solutionsCommute time Computation of commute time Anomaly detection using commute time (CDOF) Fast estimation of commute time Scalability for Density-based method PINN Algorithm (ICDM 2010) PINN Guarantee Examples high-dim distance-based outliers Examples high-dim density-based outliers Examples local density-based outliers
PINN Guarantee
The PINN Algorithm provides probabilistic guarantees
Under certain assumptions about intrinsic dimensionality (c)with high probability
1minus ε1 + ε
middot LOF (p) le LOF (p) le 1 + ε
1minus ε middot LOF (p)
In practice we do not know the intrinsic dimensionality ofdata However random projections are quite robust
Chawla and Chandola Anomaly Detection
Introduction Data Mining Methods Density-based anomaly Commute Time Approach Addressing Scalability Anomalies in Complex Data Evaluating Anomaly Detection Methods Applications Problem solutionsCommute time Computation of commute time Anomaly detection using commute time (CDOF) Fast estimation of commute time Scalability for Density-based method PINN Algorithm (ICDM 2010) PINN Guarantee Examples high-dim distance-based outliers Examples high-dim density-based outliers Examples local density-based outliers
Examples high-dim distance-based outliers
On a large database of images the bright images show up asdistance based outliers
Chawla and Chandola Anomaly Detection
Introduction Data Mining Methods Density-based anomaly Commute Time Approach Addressing Scalability Anomalies in Complex Data Evaluating Anomaly Detection Methods Applications Problem solutionsCommute time Computation of commute time Anomaly detection using commute time (CDOF) Fast estimation of commute time Scalability for Density-based method PINN Algorithm (ICDM 2010) PINN Guarantee Examples high-dim distance-based outliers Examples high-dim density-based outliers Examples local density-based outliers
Examples high-dim density-based outliers
On a large database of images occluded images show up asdensity based outliers
Chawla and Chandola Anomaly Detection
Introduction Data Mining Methods Density-based anomaly Commute Time Approach Addressing Scalability Anomalies in Complex Data Evaluating Anomaly Detection Methods Applications Problem solutionsCommute time Computation of commute time Anomaly detection using commute time (CDOF) Fast estimation of commute time Scalability for Density-based method PINN Algorithm (ICDM 2010) PINN Guarantee Examples high-dim distance-based outliers Examples high-dim density-based outliers Examples local density-based outliers
Examples local density-based outliers
Examples of images ranked by LOF
Chawla and Chandola Anomaly Detection
Introduction Data Mining Methods Density-based anomaly Commute Time Approach Addressing Scalability Anomalies in Complex Data Evaluating Anomaly Detection Methods Applications Problem solutions
Addressing Scalability
Chawla and Chandola Anomaly Detection
Introduction Data Mining Methods Density-based anomaly Commute Time Approach Addressing Scalability Anomalies in Complex Data Evaluating Anomaly Detection Methods Applications Problem solutions
Using GPUs for Anomaly Detection
Well suited for data parallel algorithms Using CUDA - Compute Unified Device
Architecture (Nvidia)
Need to re-engineer existing algorithms Utilization of device memory Minimize CPUhArrGPU transfer of data Keep threads homogeneous
Most model based algorithms arenaturally setup for the testing phase
Model building needs careful redesign
What about unsupervised algorithms
Kernel
Host
Grid
Device
Block(00)
Block(01)
Block(02)
Block(10)
Block(11)
Block(12)
Thread Block
Thread(00)
Thread(01)
Thread(02)
Thread(03)
Thread(10)
Thread(11)
Thread(12)
Thread(13)
Thread(20)
Thread(21)
Thread(22)
Thread(23)
Host Host Memory
SM 2
SM 1
SM 0
Registers Registers Registers
SP 0 SP 1 SP 7
Shared Memory
Global Memory
Texture Memory
Constant Memory
Device
Chawla and Chandola Anomaly Detection
Introduction Data Mining Methods Density-based anomaly Commute Time Approach Addressing Scalability Anomalies in Complex Data Evaluating Anomaly Detection Methods Applications Problem solutions
Implementing DB(kN) on GPUs
Return top N data instances whose distances tok-th nearest neighbor are largest (SerialDB(kN) is O(n2))
Involves computing pairwise distances
Load block i and block j to shared memory Data layout in memory should be optimized
Each thread computes distance between a pairof instances
Can utilize this time to load next chunk of datafrom host to device memory
Writes results to corresponding output block
Sorting can be done efficiently in CUDA [29]
d
n
T
n
n
Chawla and Chandola Anomaly Detection
Introduction Data Mining Methods Density-based anomaly Commute Time Approach Addressing Scalability Anomalies in Complex Data Evaluating Anomaly Detection Methods Applications Problem solutionsCategorical Data Discrete Sequences and Time Series Contextual Anomalies Collective Anomalies
Moving Beyond Multi-dimensional Record Data
Categorical (Mixed)
Fraud Detection
Cyber Networks
Time Series
Sensor Networks
Healthcare
Discrete Sequences
Genomic
System Calls
Spatial
GIS
Image analysis
Spatio-temporal
Remote sensing
Climate
Graphs
Social networks
Epidemiology
Chawla and Chandola Anomaly Detection
Introduction Data Mining Methods Density-based anomaly Commute Time Approach Addressing Scalability Anomalies in Complex Data Evaluating Anomaly Detection Methods Applications Problem solutionsCategorical Data Discrete Sequences and Time Series Contextual Anomalies Collective Anomalies
Handling Categorical Data
Each attribute can belong to one of many categories
No ordering between categories
Mixed data (categorical and continuous attributes)
cap-shape cap-surface middot middot middot habitat type
convex smooth urban poisonousconvex smooth grasses ediblebell smooth meadows edibleconvex scaly urban poisonousconvex smooth grasses ediblemiddot middot middot
Table Mushroom Data Set [2]
Chawla and Chandola Anomaly Detection
Introduction Data Mining Methods Density-based anomaly Commute Time Approach Addressing Scalability Anomalies in Complex Data Evaluating Anomaly Detection Methods Applications Problem solutionsCategorical Data Discrete Sequences and Time Series Contextual Anomalies Collective Anomalies
Approaches to Identify Categorical Anomalies
Using Association Analysis [24]
Binarize data
Learn rules (X rArr Y ) Choose high confidence
rules (P (Y |X))
For test record Z = 〈XY 〉find rules of the formP (Y |X)
Y is not observed whenX is observed
Using Bayesian Networks [33]
Learn Bayesian networkstructure and parameters
Compute P (Z) for test datarecord Z
Flag anomaly if P (Z) lt δ
Using Similarity Metrics [10]
Use a similarity measure (S(X1 X2))
Apply distancedensityclustering based method (eg lof)
Chawla and Chandola Anomaly Detection
Introduction Data Mining Methods Density-based anomaly Commute Time Approach Addressing Scalability Anomalies in Complex Data Evaluating Anomaly Detection Methods Applications Problem solutionsCategorical Data Discrete Sequences and Time Series Contextual Anomalies Collective Anomalies
Conditional Probability Test [18]
Identify unusual combinations of attribute values
r(at bt) =P (at bt)
P (at)P (bt)
A capB = φ Assumption If r(at bt) is low and is observed in test record t
then t is anomalous For a test record t
For each mutually exclusive pair of attribute sets ABcompute r(at bt)
Score t based on all r-values Assign minimum r-value as score Take product of all r-values
Need to compare exponential pairs of subsets Only consider subsets upto size k Ignore subsets with frequency less than a threshold α Avoid comparing independent subsets of attributes
micro(AB) ge βmicroChawla and Chandola Anomaly Detection
Introduction Data Mining Methods Density-based anomaly Commute Time Approach Addressing Scalability Anomalies in Complex Data Evaluating Anomaly Detection Methods Applications Problem solutionsCategorical Data Discrete Sequences and Time Series Contextual Anomalies Collective Anomalies
Estimating Probabilities for CPT [18]
Maximum LikelihoodEstimation
P (at bt)
P (at)P (bt)=C(at bt)
Ntimes N
C(at)times N
C(bt)
C(at) Number of traininginstances with A = at
N Total number of traininginstances
Laplace Smoothing
E(p) =C(p) + 1
N + 2
r(at bt) =E(at bt)
E(at)times E(bt)
Speedup Tricks
Replace rare attributevalues with genericattribute (reduce arity)
Use efficient datastructure to querying forcounts(AD Trees [26])
ADTrees work fasterfor low arity attributes
Chawla and Chandola Anomaly Detection
Introduction Data Mining Methods Density-based anomaly Commute Time Approach Addressing Scalability Anomalies in Complex Data Evaluating Anomaly Detection Methods Applications Problem solutionsCategorical Data Discrete Sequences and Time Series Contextual Anomalies Collective Anomalies
Finding Anomalies in Discrete Sequences
Many problem formulations
1 Anomalous symbols in asequence
2 Anomalous subsequence in asequence
3 Anomalous sequence in adatabase of sequences
See [11] for a comparativeevaluation [9] for a survey
login pwdmail ssh mail web logoutlogin pwdmail web web web web logoutlogin pwdmail ssh mail web web logoutlogin pwdwebmail ssh webmail logoutloginpwd loginpwd loginpwd logout
Chawla and Chandola Anomaly Detection
Introduction Data Mining Methods Density-based anomaly Commute Time Approach Addressing Scalability Anomalies in Complex Data Evaluating Anomaly Detection Methods Applications Problem solutionsCategorical Data Discrete Sequences and Time Series Contextual Anomalies Collective Anomalies
Treating Sequences as Points
Utilize a distancesimilarity measure Plug into a distancedensityclustering based method
Simplest Hamming Distance
h(Ai Bi) = 1 Ai 6= Bi= 0 Ai = Bi
H(AB) =nsumi=1
h(Ai Bi)
Issues Unequal lengths misalignment Normalized Length of Longest Common Subsequence
D(AB) = 1minus |LCS(AB)|radic|A||B|
Standard Dynamic Programming method is slow Faster versions available (Hunt Szymnaski method [7])
Weaknesses Cannot localize anomalies within a sequence Weak anomaly signals might get lost
Chawla and Chandola Anomaly Detection
Introduction Data Mining Methods Density-based anomaly Commute Time Approach Addressing Scalability Anomalies in Complex Data Evaluating Anomaly Detection Methods Applications Problem solutionsCategorical Data Discrete Sequences and Time Series Contextual Anomalies Collective Anomalies
Using Sliding Windows
Slide a window of size k
Extract all windows from a sequence (nminus k + 1)
Training (Creating a normal dictionary) Store all uniquewindows in all normal sequences and their counts
Testing For each window find the frequency in normal dictionary Anomaly score is inverse of the aggregate frequencies for all
windows (normalized by length)
Many variants exist For each window find the hamming distance to the closest
window in the normal dictionary [16]
Issues Penalizes low frequency windows in the normal dictionary Rewards high frequency windows that might not be relevant Can construct anomalous sequences that will escape detection
Chawla and Chandola Anomaly Detection
Introduction Data Mining Methods Density-based anomaly Commute Time Approach Addressing Scalability Anomalies in Complex Data Evaluating Anomaly Detection Methods Applications Problem solutionsCategorical Data Discrete Sequences and Time Series Contextual Anomalies Collective Anomalies
Using Probabilistic Models
Probability of occurrence of sequence S
P (S) =nprodi=1
P (Si|S1 Siminus1)
Short memory property of sequences
P (Si|S1 Siminus1) = P (Si|Siminusk Siminus1)
Conditional probability estimates for a symbol Si
P (Si|Siminusk Siminus1) =f(Si|Siminusk Si)f(Si|Siminusk Siminus1)
f is estimated from the normal dictionary
Anomaly score for a test sequence is inverse of the normalizedprobability of occurrence
Issues What if the suffix occurs very infrequently in thenormal data (or not at all)
Replace with the longest suffix that occurs sufficient number oftimes [32] - Probabilistic Suffix Trees
Significantly reduces the size of the modelChawla and Chandola Anomaly Detection
Introduction Data Mining Methods Density-based anomaly Commute Time Approach Addressing Scalability Anomalies in Complex Data Evaluating Anomaly Detection Methods Applications Problem solutionsCategorical Data Discrete Sequences and Time Series Contextual Anomalies Collective Anomalies
Finding Contextual Anomalies
Sometimes contextual information isavailable about data
Not used directly as a feature Are well understood no anomalies in
the context Can reduce false positives and yield
interesting anomalies
Example adapted from [30]
Clearest Outlier
Conditional Anomaly
Maximum Daily Temperature
Number
ofFever
Cases
Contextual anomalies - Anomalous with respect to a context Context is defined using environmental variables
Spatial (Latitude Longitude) Graph context (Edges Weights) Temporal location Domain specific (Demographic other)
How to incorporate context Reduce to traditional anomaly detection (subset on context) Explicitly model contextual information (time series spatial)
Chawla and Chandola Anomaly Detection
Introduction Data Mining Methods Density-based anomaly Commute Time Approach Addressing Scalability Anomalies in Complex Data Evaluating Anomaly Detection Methods Applications Problem solutionsCategorical Data Discrete Sequences and Time Series Contextual Anomalies Collective Anomalies
Conditional Anomaly Detection
Data instance d rArru1 u2 udU v1 v2 vdV
dU environmentalattributes
dV indicator attributes u1
u2
U1
U2
U3
v1
v2
V1V2
V3
p(V1|U3) = 02
p(V2|U3) = 02
p(V3|U3) = 06
Algorithm [30]
1 Learn a Gaussian Mixture Model (GMM)U = U1 U2 UnU
each with dimensionality dU2 Learn a set of Gaussians U = V1 V2 VnV
each withdimensionality dV
3 Learn a probabilistic mapping function p(Vj |Ui)4 Score a test instance d = [uv]
S =
nUsumi=1
p(u|Ui)nVsumj=1
p(v|Vj)p(Vj |Ui)
Chawla and Chandola Anomaly Detection
Introduction Data Mining Methods Density-based anomaly Commute Time Approach Addressing Scalability Anomalies in Complex Data Evaluating Anomaly Detection Methods Applications Problem solutionsCategorical Data Discrete Sequences and Time Series Contextual Anomalies Collective Anomalies
Finding Collective Anomalies
Find a collection of data points
Each point by itself is normal
The collection as a whole isanomalous
Relevant when data has inherentstructure and
When domain definition ofanomalies cannot be described aspoint anomalies
A Simple Solution
1 Break data intogroups
2 Compute features foreach group
3 Apply traditionalanomaly detection
Examples
1 Time series
2 Image
3 Spatial clusters ofgalaxies
Chawla and Chandola Anomaly Detection
Introduction Data Mining Methods Density-based anomaly Commute Time Approach Addressing Scalability Anomalies in Complex Data Evaluating Anomaly Detection Methods Applications Problem solutionsCategorical Data Discrete Sequences and Time Series Contextual Anomalies Collective Anomalies
Using Latent Dirichlet Allocation for Group Anomalies
Find anomalous groups in data [34]
Example Spatial clusters of galaxies topics red green emissive words continuous features
Flexible Genre Model (FGM)
For each group
1 Draw a genre 1 2 T 3 ym simM(π)2 Draw topic distribution forym SK 3 θm sim Dir(αym)
3 Draw K topicsβmk sim P (βmk|ηk)k=12K
4 For each point in group
1 Draw topic membershipzmn simM(θn)
2 Generate pointxmn isin P (xmn|βmzmn)
α
zmn
xmn
N
θm
T
π
ηK
ym
β
MK
Model Parameters
M(π) -Multinomial
Genre - Dir(αt)
Topic generatorsP (|ηk)- GIW
Point generatorsP (xmn|βnk) -MultivariateGaussian
Chawla and Chandola Anomaly Detection
Introduction Data Mining Methods Density-based anomaly Commute Time Approach Addressing Scalability Anomalies in Complex Data Evaluating Anomaly Detection Methods Applications Problem solutionsCategorical Data Discrete Sequences and Time Series Contextual Anomalies Collective Anomalies
Inference and Testing for FGM
Inference and Learning Parameters
Approximate inference of latentvariables (Gibbs Sampling)
Use samples to learn parameters(Single step Monte Carlo EM)
Topic 1
Topic 2
Topic 3
Anomaly Detection
Infer the topic distribution θm
Compute negative log likelihood wrt αt
Rationale An anomalous group will be unlikely to begenerated from any genre
Geometric interpretation Mapping each group into a Tdimensional space and finding anomalies
Chawla and Chandola Anomaly Detection
Introduction Data Mining Methods Density-based anomaly Commute Time Approach Addressing Scalability Anomalies in Complex Data Evaluating Anomaly Detection Methods Applications Problem solutions
Evaluating Anomaly Detection Methods - Labels
Labeled validation data set exists Confusion matrix Traditional evaluation metrics
Class imbalance
ROC Curve
Validation set does not exist Use domain expertise to find TP
and FP FN is harder to estimate
Pseudo false negativeestimation techniques [25]
Predicteda n
Actuala TP FNn FP TN
Acc =TP + TNsum
Rec (R) =TP
TP + FN
Prec (P ) =TP
TP + FP
F =2 lowastR lowast PR+ P
Chawla and Chandola Anomaly Detection
Introduction Data Mining Methods Density-based anomaly Commute Time Approach Addressing Scalability Anomalies in Complex Data Evaluating Anomaly Detection Methods Applications Problem solutions
Evaluating Anomaly Detection Methods - Scores
Convert to binary output Use threshold δ on score (Scale
issues [21]) Take top x as anomalies
ROC curve by varying x or δ
Quality of output Does the output ldquosuggestrdquo x or δ Which output is better
Chawla and Chandola Anomaly Detection
Introduction Data Mining Methods Density-based anomaly Commute Time Approach Addressing Scalability Anomalies in Complex Data Evaluating Anomaly Detection Methods Applications Problem solutions
Unifying Scores
Different methods assign scores in differentranges
kNN-based scores [0 1] Lof scores [1 6] ABOD scores [0 80000]
Anomalies have lower scores
Direct scaling to [0 1] might lose distinctionbetween normal and anomalies
Desired scaling Stretch interesting rangesand shrink irrelevant ones
Generalized Procedure for Normalizing Outlier Scores [21] Regularity rArr S(o) ge 0forallo S(o) asymp 0 if o is normal andS(o) 0 if o is anomalous
Normality S is regular and S(o) isin [0 1]forallo
Chawla and Chandola Anomaly Detection
Introduction Data Mining Methods Density-based anomaly Commute Time Approach Addressing Scalability Anomalies in Complex Data Evaluating Anomaly Detection Methods Applications Problem solutions
Regularization and Normalization of Scores
Regularization
1 R(o) = max0 S(o)minus baseS2 R(o) = Smax minus S(o)
3 R(o) = minus log SmaxS(o)
Normalization
1 N(o) = S(o)Smax
2 N(o) = max(
0 erf(S(o)minusmicroSσS radic2
))(Gaussian Scaling)
Suited for high dimensional data
3 N(o) = max(
0cdfγS (o)minusmicroγ
1minusmicroγ
)(Gamma Scaling)
Where cdfγS (o) = P (k S(o) θ) P is the regularized Gamma function Suited for low dimensional data
Chawla and Chandola Anomaly Detection
Introduction Data Mining Methods Density-based anomaly Commute Time Approach Addressing Scalability Anomalies in Complex Data Evaluating Anomaly Detection Methods Applications Problem solutions
Generating Labeled Data for Validation
Generating Both Normal and Anomalous Data
Use generative models for normal and anomalous behavior
Several generators available Multivariate continuous data [27] Multivariate categorical data [5] Discrete sequences using HMM [12]
Drawbacks Might not capture the domain characteristics
Injecting Anomalies - Random Perturbation[30]
Given data point z = xy x and y arepartitions of feature space
Take a random sample D of the entire data set
Let zprime = xprimeyprime isin D such that distancebetween y and yprime is maximum
Replace x with xprime and add z back to data setx
yz
zprime
Injected anomaly
Chawla and Chandola Anomaly Detection
Introduction Data Mining Methods Density-based anomaly Commute Time Approach Addressing Scalability Anomalies in Complex Data Evaluating Anomaly Detection Methods Applications Problem solutionsWhat is Network Anomaly Detection Motivation How Much Serious
Applications Overview
How to set up an anomaly detection solution for agiven application domain
Available data Define anomalies define normal behavior Identify requirements and constraints (online
real-time limited resources) What domain knowledge available
Feature identification Defining normal and anomalous behavior Tuning parameters
Available ground truth (training validation)
Chawla and Chandola Anomaly Detection
Introduction Data Mining Methods Density-based anomaly Commute Time Approach Addressing Scalability Anomalies in Complex Data Evaluating Anomaly Detection Methods Applications Problem solutionsWhat is Network Anomaly Detection Motivation How Much Serious
What is Network Anomaly Detection
Anomaly Detection or Intrusion Detection
Traditional Intrusion Detection Systems (IDS) finding attackscorresponding to predefined pattern data set known as signaturestherefore system is absolutely vulnerable against zero-day attacks
Network Anomaly Detection Systems (NADS) to detectzero-day attacks without any pre-identified signature besides profilenormal behavior of the network and address suspected incidents
Network Anomaly Detection finding unusual and largechanges in the network traffic
Examples intentional attacks (eg Distributed Denial ofService - DDoS) or unusual network traffic (eg flash crowds)
Chawla and Chandola Anomaly Detection
Introduction Data Mining Methods Density-based anomaly Commute Time Approach Addressing Scalability Anomalies in Complex Data Evaluating Anomaly Detection Methods Applications Problem solutionsWhat is Network Anomaly Detection Motivation How Much Serious
Motivation How Much Serious
According to Symantec report released in early 2011 morethan 286 million new threats have been detected in 2010which is a huge number
1656227
2704836
1000000
1500000
2000000
2500000
3000000
20547 18827 69107 113025 140690
624267
1656227
2704836
0
500000
1000000
1500000
2000000
2500000
3000000
2002 2003 2004 2005 2006 2007 2008 July2009-June2010
Chawla and Chandola Anomaly Detection
Introduction Data Mining Methods Density-based anomaly Commute Time Approach Addressing Scalability Anomalies in Complex Data Evaluating Anomaly Detection Methods Applications Problem solutionsNetwork Topology Network Anomalies Detection Problem Network Anomalies Detection Problem Why care about OD Flows
Network Topology
A Typical network
1 y
Router
2
3
41t
x2t
x1t
x3t
x4t
Origin-Destination (OD) flow is the traffic that enters at anorigin node and exits at a destination node of a backbonenetwork x1t x1t
Link measurement is the traffic enters at an node during aninterval y1t
Relationship between link traffic and OD flow traffic iscaptured by the routing matrix A
Chawla and Chandola Anomaly Detection
Introduction Data Mining Methods Density-based anomaly Commute Time Approach Addressing Scalability Anomalies in Complex Data Evaluating Anomaly Detection Methods Applications Problem solutionsNetwork Topology Network Anomalies Detection Problem Network Anomalies Detection Problem Why care about OD Flows
Network Anomalies Detection Problem
Chawla and Chandola Anomaly Detection
Introduction Data Mining Methods Density-based anomaly Commute Time Approach Addressing Scalability Anomalies in Complex Data Evaluating Anomaly Detection Methods Applications Problem solutionsNetwork Topology Network Anomalies Detection Problem Network Anomalies Detection Problem Why care about OD Flows
Network Anomalies Detection Problem
Chawla and Chandola Anomaly Detection
Introduction Data Mining Methods Density-based anomaly Commute Time Approach Addressing Scalability Anomalies in Complex Data Evaluating Anomaly Detection Methods Applications Problem solutionsNetwork Topology Network Anomalies Detection Problem Network Anomalies Detection Problem Why care about OD Flows
Why care about OD Flows
Volume anomaly typically arises on an OD flow (trafficarriving at one node and destined for another node)
If we only monitor traffic on network links volume arisingfrom an OD flow may not be noticeable Thus naiveapproach wont work if OD flow info is not available
Figure source [22]
Chawla and Chandola Anomaly Detection
Introduction Data Mining Methods Density-based anomaly Commute Time Approach Addressing Scalability Anomalies in Complex Data Evaluating Anomaly Detection Methods Applications Problem solutionsPCA and Subspace Method Subspace Method Algorithm Subspace Analysis Results Discussion Typical Characteristics of Anomaly Limitation of Volume Entropy Based versus Volume Based Fraud Detection Epidemeology Anomaly Detection in Climate and Weather Anomalies in Climate Validation of Anomalies
PCA and Subspace Method
Chawla and Chandola Anomaly Detection
Introduction Data Mining Methods Density-based anomaly Commute Time Approach Addressing Scalability Anomalies in Complex Data Evaluating Anomaly Detection Methods Applications Problem solutionsPCA and Subspace Method Subspace Method Algorithm Subspace Analysis Results Discussion Typical Characteristics of Anomaly Limitation of Volume Entropy Based versus Volume Based Fraud Detection Epidemeology Anomaly Detection in Climate and Weather Anomalies in Climate Validation of Anomalies
Subspace Method Algorithm
Step1- Determine the PCs based on eigenvaluedecomposition of the covariance matrix of the dataset
Step2- Choose first top k principle components with thehighest eigenvalues as matrix P
Step3-normal traffic subspace called Z
Z = PP TZ = CZ
Step4-abnormal traffic subspace called Z
Z = (I minus PP T )Z = CZ
Step5-If the norm of a vector is large then it is an rdquoanomalyrdquo
Chawla and Chandola Anomaly Detection
Introduction Data Mining Methods Density-based anomaly Commute Time Approach Addressing Scalability Anomalies in Complex Data Evaluating Anomaly Detection Methods Applications Problem solutionsPCA and Subspace Method Subspace Method Algorithm Subspace Analysis Results Discussion Typical Characteristics of Anomaly Limitation of Volume Entropy Based versus Volume Based Fraud Detection Epidemeology Anomaly Detection in Climate and Weather Anomalies in Climate Validation of Anomalies
Subspace Analysis Results
Note that during anomaly normal component does not changethat much while residual component changes quite a lot
Thus anomalies can be detected by setting some threshold
Figure source [22]
Chawla and Chandola Anomaly Detection
Introduction Data Mining Methods Density-based anomaly Commute Time Approach Addressing Scalability Anomalies in Complex Data Evaluating Anomaly Detection Methods Applications Problem solutionsPCA and Subspace Method Subspace Method Algorithm Subspace Analysis Results Discussion Typical Characteristics of Anomaly Limitation of Volume Entropy Based versus Volume Based Fraud Detection Epidemeology Anomaly Detection in Climate and Weather Anomalies in Climate Validation of Anomalies
Discussion Typical Characteristics of Anomaly
Most Anomalies induce a change in distributionalaspects of packet header fields (called features)
Most important features include 5-tuple Source ampdestination IP addresses Source and destination portnumbers and IP protocol
raquo DOS attack ndash multiple source IP address concentrated on asingle destination IP address
raquo Network scan ndash dispersed distribution of destination addresses
raquo Most wormsviruses also induce some change in distribution ofcertain features
raquo However these changes can be very subtle and mining them islike searching for needles in a haystack
Unlike many previous approach this paper aims todetect events which disturb the distribution of trafficfeatures rather than traffic volume
Chawla and Chandola Anomaly Detection
Introduction Data Mining Methods Density-based anomaly Commute Time Approach Addressing Scalability Anomalies in Complex Data Evaluating Anomaly Detection Methods Applications Problem solutionsPCA and Subspace Method Subspace Method Algorithm Subspace Analysis Results Discussion Typical Characteristics of Anomaly Limitation of Volume Entropy Based versus Volume Based Fraud Detection Epidemeology Anomaly Detection in Climate and Weather Anomalies in Climate Validation of Anomalies
Limitation of Volume
Figure source [22]
Port scan anomaly (traffic feature changes however traffic volume
remains more or less the same)
We can use entropy tocapture the variationsin the traffic feature
bullTakes value 0 when distribution is maximally concentratedbullTakes value log2N when distribution is maximally dispersed
But stands out in
feature entropy
which also reveals
its structure
Port scan
dwarfed
in volume
metricshellip
Chawla and Chandola Anomaly Detection
Introduction Data Mining Methods Density-based anomaly Commute Time Approach Addressing Scalability Anomalies in Complex Data Evaluating Anomaly Detection Methods Applications Problem solutionsPCA and Subspace Method Subspace Method Algorithm Subspace Analysis Results Discussion Typical Characteristics of Anomaly Limitation of Volume Entropy Based versus Volume Based Fraud Detection Epidemeology Anomaly Detection in Climate and Weather Anomalies in Climate Validation of Anomalies
Entropy Based versus Volume Based
DoSDDoS Attacks- a spike in traffic data toward adominant destination IP
Scan anomaly-a spike in traffic data from a dominant sourceIP
Flash Crowd anomaly- again a spike in traffic data to adominant destination IP
Worm anomaly-a Spike in traffic with a dominant port
Chawla and Chandola Anomaly Detection
Introduction Data Mining Methods Density-based anomaly Commute Time Approach Addressing Scalability Anomalies in Complex Data Evaluating Anomaly Detection Methods Applications Problem solutionsPCA and Subspace Method Subspace Method Algorithm Subspace Analysis Results Discussion Typical Characteristics of Anomaly Limitation of Volume Entropy Based versus Volume Based Fraud Detection Epidemeology Anomaly Detection in Climate and Weather Anomalies in Climate Validation of Anomalies
Fraud Detection
Domain Question Identifyfraudulent activities or players fromobserved transaction data
Data Transactions between different
players in the system Meta information about the
individuals An underlying graph structure
Challenges Track and model human behavior Anomalies caused by adaptive
human adversaries Massive data sizes
Insurance (autohealtha)
ClaimantProvider Payer
Telecommunications Customer
Provider
Credit Cards Customer
Supplier Bank
Web Advertising User Advertiser
Publisher
ahttpwwwcheatingculturecompast-cases-of-medicare-fraud
Chawla and Chandola Anomaly Detection
Introduction Data Mining Methods Density-based anomaly Commute Time Approach Addressing Scalability Anomalies in Complex Data Evaluating Anomaly Detection Methods Applications Problem solutionsPCA and Subspace Method Subspace Method Algorithm Subspace Analysis Results Discussion Typical Characteristics of Anomaly Limitation of Volume Entropy Based versus Volume Based Fraud Detection Epidemeology Anomaly Detection in Climate and Weather Anomalies in Climate Validation of Anomalies
A Generic Fraud Detection Method
Activity Monitoring [13]1 Build profiles for individuals (customers users etc) based on
historic data User X makes n calls on an average in January
2 Compare current behavior with historical profile for significantdeviations
Clustering based [4]1 Cluster historical profiles of customers2 Identify small clusters or outlying profiles as anomalies
Strengths Anomaly detection is fast (good for real time) Results are easy to explain
Weaknesses Need to create and maintain a large number of profiles Not dynamic Adequate historical data might not be available Too many false positives
Chawla and Chandola Anomaly Detection
Introduction Data Mining Methods Density-based anomaly Commute Time Approach Addressing Scalability Anomalies in Complex Data Evaluating Anomaly Detection Methods Applications Problem solutionsPCA and Subspace Method Subspace Method Algorithm Subspace Analysis Results Discussion Typical Characteristics of Anomaly Limitation of Volume Entropy Based versus Volume Based Fraud Detection Epidemeology Anomaly Detection in Climate and Weather Anomalies in Climate Validation of Anomalies
Exploiting Graph Structure - Weighted Graphs
Represent data as a weighted graph Communication networks (phone email SMS) Provider referral networks
Objective Identify anomalous nodes
For each node extract several features based on the propertiesof the induced sub-graph (egonet) of neighboring nodes [1]
Choose features that can highlight anomalous nodes
1 Ni degree of node2 Ei number of edges in egonet3 Wi total weight of egonet4 λi principal eigen vector of weighted adjacency matrix of
egonet
Data is transformed into a point in a multi-dimensional space
Chawla and Chandola Anomaly Detection
Introduction Data Mining Methods Density-based anomaly Commute Time Approach Addressing Scalability Anomalies in Complex Data Evaluating Anomaly Detection Methods Applications Problem solutionsPCA and Subspace Method Subspace Method Algorithm Subspace Analysis Results Discussion Typical Characteristics of Anomaly Limitation of Volume Entropy Based versus Volume Based Fraud Detection Epidemeology Anomaly Detection in Climate and Weather Anomalies in Climate Validation of Anomalies
Identifying Anomalies
Traditional anomaly detection (lof) Can be slow but can identify any type of anomalous structure
Faster method to identify specific types of anomalousstructures
Identify relevant feature pairs and power law relationship
Eg Egonet Density Power Law Ni vs Ei - detect nearcliques and stars
Ei prop Nαi 1 le α le 2
Anomaly score for node i wrt a pair of features (y = Cxθ)
Si =max(yi Cx
θi )
min(yi Cxθi )lowast log (|yi minus Cxθi |+ 1)
Chawla and Chandola Anomaly Detection
Introduction Data Mining Methods Density-based anomaly Commute Time Approach Addressing Scalability Anomalies in Complex Data Evaluating Anomaly Detection Methods Applications Problem solutionsPCA and Subspace Method Subspace Method Algorithm Subspace Analysis Results Discussion Typical Characteristics of Anomaly Limitation of Volume Entropy Based versus Volume Based Fraud Detection Epidemeology Anomaly Detection in Climate and Weather Anomalies in Climate Validation of Anomalies
Exploiting Graph Structure - Bipartite Graphs
Represent data as a bipartite graph Healthcare Data (Beneficiaries vs Providers) Insider trading (Traders vs Stocks)
Objective Identify anomalous links
Given a query node a isin V1 find the ldquorelevancerdquoof all other nodes in V1 to a
RelevanceScore(a b) prop Number of times aldquorandom walkrdquo from a reaches b
Use the relevance scores to compute thenormality scores for a node t isin V2
Find set St = a|〈a t〉 isin E Compute |St| times |St| similarity matrix using
relevance vectors for a isin St Normality Score = mean of non-diagonal entries
of similarity matrix
V1 E V2a1
a2
a3
an
t1
t2
t3
tn
Chawla and Chandola Anomaly Detection
Introduction Data Mining Methods Density-based anomaly Commute Time Approach Addressing Scalability Anomalies in Complex Data Evaluating Anomaly Detection Methods Applications Problem solutionsPCA and Subspace Method Subspace Method Algorithm Subspace Analysis Results Discussion Typical Characteristics of Anomaly Limitation of Volume Entropy Based versus Volume Based Fraud Detection Epidemeology Anomaly Detection in Climate and Weather Anomalies in Climate Validation of Anomalies
Detecting Disease Outbreaks
Domain Question Early detection of disease
outbreaks Anthrax attack
Data Emergency department visits Grocery data (Example [14]) Clinical visits Weatherclimate data
Challenges Weak signals in the data
ED cases involving cough rArrFlu or SARS
Integration of multiple signals(lag analysis)
Account for spatial and temporalcorrelations
Chawla and Chandola Anomaly Detection
Introduction Data Mining Methods Density-based anomaly Commute Time Approach Addressing Scalability Anomalies in Complex Data Evaluating Anomaly Detection Methods Applications Problem solutionsPCA and Subspace Method Subspace Method Algorithm Subspace Analysis Results Discussion Typical Characteristics of Anomaly Limitation of Volume Entropy Based versus Volume Based Fraud Detection Epidemeology Anomaly Detection in Climate and Weather Anomalies in Climate Validation of Anomalies
Whatrsquos Significant About Recent Events (WSARE) [33]
1 Learn Bayesian network from historical data Environmental and response variables
2 Sample from the BN (DBbaseline|Current Environment)3 Compute contingency table for rules for DBbaseline andDBcurrent
Rules are single assignment rules (Xi = Y ji ) or conjunctions4 Find p-value for rules using χ2-test
Null Hypothesis Rows and columns of tables for DBbaselineand DBcurrent are independent
5 Find rule with largest p-value Repeat Step 2
Chawla and Chandola Anomaly Detection
Introduction Data Mining Methods Density-based anomaly Commute Time Approach Addressing Scalability Anomalies in Complex Data Evaluating Anomaly Detection Methods Applications Problem solutionsPCA and Subspace Method Subspace Method Algorithm Subspace Analysis Results Discussion Typical Characteristics of Anomaly Limitation of Volume Entropy Based versus Volume Based Fraud Detection Epidemeology Anomaly Detection in Climate and Weather Anomalies in Climate Validation of Anomalies
Incorporating Spatial and Temporal Relationships
WSARE does not explicitly model the spatial and temporalrelationships
What happened yesterday What happened in the adjoining neighborhood (yesterday)
Bayesian Network Spatio-Temporal (BNST) modelingframework [17]
Add nodes for temporal and spatial dependencies Need more data to train
Chawla and Chandola Anomaly Detection
Introduction Data Mining Methods Density-based anomaly Commute Time Approach Addressing Scalability Anomalies in Complex Data Evaluating Anomaly Detection Methods Applications Problem solutionsPCA and Subspace Method Subspace Method Algorithm Subspace Analysis Results Discussion Typical Characteristics of Anomaly Limitation of Volume Entropy Based versus Volume Based Fraud Detection Epidemeology Anomaly Detection in Climate and Weather Anomalies in Climate Validation of Anomalies
Anomaly Detection in Climate and Weather
Science Questions Identify natural and anthropogenic disasters Identify long time scale events - droughts atmospheric rivers
cold fronts etc
Data Ground observations Remote sensing data (satellites
air-borne) Climate model simulation outputs Multiple variables spatio-temporal (often has height dimension
as well)
Challenges Model spatio-temporal relationships across multiple variables Explain the cause of anomalies Massive data sizes
Climate and weather extreme events are well defined
Key challenge is to find significant events and explain the cause
Chawla and Chandola Anomaly Detection
Introduction Data Mining Methods Density-based anomaly Commute Time Approach Addressing Scalability Anomalies in Complex Data Evaluating Anomaly Detection Methods Applications Problem solutionsPCA and Subspace Method Subspace Method Algorithm Subspace Analysis Results Discussion Typical Characteristics of Anomaly Limitation of Volume Entropy Based versus Volume Based Fraud Detection Epidemeology Anomaly Detection in Climate and Weather Anomalies in Climate Validation of Anomalies
Anomalies are Widely Used in Climate
Most analysis done on ldquoanomalyrdquo time series
Difference from a ldquobase periodrdquo (Toosimplistic)
Brings spatial smoothness (eg a mountaintop and nearby valley can have very differenttemperatures) Removes seasonality
Understand climate and weatherphenomenon
Southern Oscillation Index (SOI) Difference between Sea Level Pressure
(SLP) anomalies for Tahiti and DarwinAustralia
Figure Global AverageTemperature Anomaly(1975 - 2007) Srcwwwmetofficegovuk
Chawla and Chandola Anomaly Detection
Introduction Data Mining Methods Density-based anomaly Commute Time Approach Addressing Scalability Anomalies in Complex Data Evaluating Anomaly Detection Methods Applications Problem solutionsPCA and Subspace Method Subspace Method Algorithm Subspace Analysis Results Discussion Typical Characteristics of Anomaly Limitation of Volume Entropy Based versus Volume Based Fraud Detection Epidemeology Anomaly Detection in Climate and Weather Anomalies in Climate Validation of Anomalies
Constructing Anomalies from Raw Data
Anomaly time series for a given location i
vprimei = vi minus bi
where bi is the base (reference)
How to choose bi Mean of all data for location i Monthly mean values (account for seasonality) Monthly z-score values Median (more robust) Using a shorter ldquoreference periodrdquo
30 year moving window
Different methods show statistically significant differences[19] What is the right strategy Weighted mean of different strategies (Pick weights using
Monte Carlo sampling)
Chawla and Chandola Anomaly Detection
Introduction Data Mining Methods Density-based anomaly Commute Time Approach Addressing Scalability Anomalies in Complex Data Evaluating Anomaly Detection Methods Applications Problem solutionsPCA and Subspace Method Subspace Method Algorithm Subspace Analysis Results Discussion Typical Characteristics of Anomaly Limitation of Volume Entropy Based versus Volume Based Fraud Detection Epidemeology Anomaly Detection in Climate and Weather Anomalies in Climate Validation of Anomalies
Anomaly Detection for Identifying Droughts
Science question Identify significant drought patterns usinghistorical observation data or future simulation data or both
Find persistent spatiotemporal anomalies in precipitation data
A two step approach
1 Find precipitationanomalies usingthresholds
2 Find large connectedcomponents across spaceand time
Matlab - bwlabelbwlabeln
Followup Science questionExplain cause
(drought190120061avi)
Figure Video courtsey Dr ArindamBanerjee
Chawla and Chandola Anomaly Detection
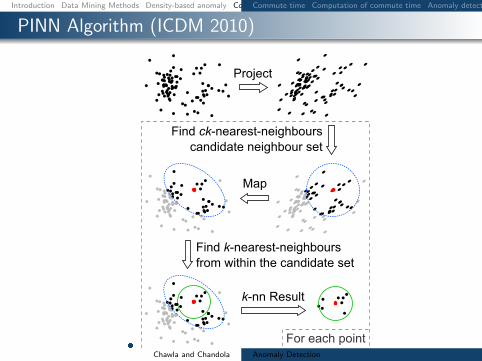
Introduction Data Mining Methods Density-based anomaly Commute Time Approach Addressing Scalability Anomalies in Complex Data Evaluating Anomaly Detection Methods Applications Problem solutionsCommute time Computation of commute time Anomaly detection using commute time (CDOF) Fast estimation of commute time Scalability for Density-based method PINN Algorithm (ICDM 2010) PINN Guarantee Examples high-dim distance-based outliers Examples high-dim density-based outliers Examples local density-based outliers
PINN Algorithm (ICDM 2010)
Chawla and Chandola Anomaly Detection
Introduction Data Mining Methods Density-based anomaly Commute Time Approach Addressing Scalability Anomalies in Complex Data Evaluating Anomaly Detection Methods Applications Problem solutionsCommute time Computation of commute time Anomaly detection using commute time (CDOF) Fast estimation of commute time Scalability for Density-based method PINN Algorithm (ICDM 2010) PINN Guarantee Examples high-dim distance-based outliers Examples high-dim density-based outliers Examples local density-based outliers
PINN Guarantee
The PINN Algorithm provides probabilistic guarantees
Under certain assumptions about intrinsic dimensionality (c)with high probability
1minus ε1 + ε
middot LOF (p) le LOF (p) le 1 + ε
1minus ε middot LOF (p)
In practice we do not know the intrinsic dimensionality ofdata However random projections are quite robust
Chawla and Chandola Anomaly Detection
Introduction Data Mining Methods Density-based anomaly Commute Time Approach Addressing Scalability Anomalies in Complex Data Evaluating Anomaly Detection Methods Applications Problem solutionsCommute time Computation of commute time Anomaly detection using commute time (CDOF) Fast estimation of commute time Scalability for Density-based method PINN Algorithm (ICDM 2010) PINN Guarantee Examples high-dim distance-based outliers Examples high-dim density-based outliers Examples local density-based outliers
Examples high-dim distance-based outliers
On a large database of images the bright images show up asdistance based outliers
Chawla and Chandola Anomaly Detection
Introduction Data Mining Methods Density-based anomaly Commute Time Approach Addressing Scalability Anomalies in Complex Data Evaluating Anomaly Detection Methods Applications Problem solutionsCommute time Computation of commute time Anomaly detection using commute time (CDOF) Fast estimation of commute time Scalability for Density-based method PINN Algorithm (ICDM 2010) PINN Guarantee Examples high-dim distance-based outliers Examples high-dim density-based outliers Examples local density-based outliers
Examples high-dim density-based outliers
On a large database of images occluded images show up asdensity based outliers
Chawla and Chandola Anomaly Detection
Introduction Data Mining Methods Density-based anomaly Commute Time Approach Addressing Scalability Anomalies in Complex Data Evaluating Anomaly Detection Methods Applications Problem solutionsCommute time Computation of commute time Anomaly detection using commute time (CDOF) Fast estimation of commute time Scalability for Density-based method PINN Algorithm (ICDM 2010) PINN Guarantee Examples high-dim distance-based outliers Examples high-dim density-based outliers Examples local density-based outliers
Examples local density-based outliers
Examples of images ranked by LOF
Chawla and Chandola Anomaly Detection
Introduction Data Mining Methods Density-based anomaly Commute Time Approach Addressing Scalability Anomalies in Complex Data Evaluating Anomaly Detection Methods Applications Problem solutions
Addressing Scalability
Chawla and Chandola Anomaly Detection
Introduction Data Mining Methods Density-based anomaly Commute Time Approach Addressing Scalability Anomalies in Complex Data Evaluating Anomaly Detection Methods Applications Problem solutions
Using GPUs for Anomaly Detection
Well suited for data parallel algorithms Using CUDA - Compute Unified Device
Architecture (Nvidia)
Need to re-engineer existing algorithms Utilization of device memory Minimize CPUhArrGPU transfer of data Keep threads homogeneous
Most model based algorithms arenaturally setup for the testing phase
Model building needs careful redesign
What about unsupervised algorithms
Kernel
Host
Grid
Device
Block(00)
Block(01)
Block(02)
Block(10)
Block(11)
Block(12)
Thread Block
Thread(00)
Thread(01)
Thread(02)
Thread(03)
Thread(10)
Thread(11)
Thread(12)
Thread(13)
Thread(20)
Thread(21)
Thread(22)
Thread(23)
Host Host Memory
SM 2
SM 1
SM 0
Registers Registers Registers
SP 0 SP 1 SP 7
Shared Memory
Global Memory
Texture Memory
Constant Memory
Device
Chawla and Chandola Anomaly Detection
Introduction Data Mining Methods Density-based anomaly Commute Time Approach Addressing Scalability Anomalies in Complex Data Evaluating Anomaly Detection Methods Applications Problem solutions
Implementing DB(kN) on GPUs
Return top N data instances whose distances tok-th nearest neighbor are largest (SerialDB(kN) is O(n2))
Involves computing pairwise distances
Load block i and block j to shared memory Data layout in memory should be optimized
Each thread computes distance between a pairof instances
Can utilize this time to load next chunk of datafrom host to device memory
Writes results to corresponding output block
Sorting can be done efficiently in CUDA [29]
d
n
T
n
n
Chawla and Chandola Anomaly Detection
Introduction Data Mining Methods Density-based anomaly Commute Time Approach Addressing Scalability Anomalies in Complex Data Evaluating Anomaly Detection Methods Applications Problem solutionsCategorical Data Discrete Sequences and Time Series Contextual Anomalies Collective Anomalies
Moving Beyond Multi-dimensional Record Data
Categorical (Mixed)
Fraud Detection
Cyber Networks
Time Series
Sensor Networks
Healthcare
Discrete Sequences
Genomic
System Calls
Spatial
GIS
Image analysis
Spatio-temporal
Remote sensing
Climate
Graphs
Social networks
Epidemiology
Chawla and Chandola Anomaly Detection
Introduction Data Mining Methods Density-based anomaly Commute Time Approach Addressing Scalability Anomalies in Complex Data Evaluating Anomaly Detection Methods Applications Problem solutionsCategorical Data Discrete Sequences and Time Series Contextual Anomalies Collective Anomalies
Handling Categorical Data
Each attribute can belong to one of many categories
No ordering between categories
Mixed data (categorical and continuous attributes)
cap-shape cap-surface middot middot middot habitat type
convex smooth urban poisonousconvex smooth grasses ediblebell smooth meadows edibleconvex scaly urban poisonousconvex smooth grasses ediblemiddot middot middot
Table Mushroom Data Set [2]
Chawla and Chandola Anomaly Detection
Introduction Data Mining Methods Density-based anomaly Commute Time Approach Addressing Scalability Anomalies in Complex Data Evaluating Anomaly Detection Methods Applications Problem solutionsCategorical Data Discrete Sequences and Time Series Contextual Anomalies Collective Anomalies
Approaches to Identify Categorical Anomalies
Using Association Analysis [24]
Binarize data
Learn rules (X rArr Y ) Choose high confidence
rules (P (Y |X))
For test record Z = 〈XY 〉find rules of the formP (Y |X)
Y is not observed whenX is observed
Using Bayesian Networks [33]
Learn Bayesian networkstructure and parameters
Compute P (Z) for test datarecord Z
Flag anomaly if P (Z) lt δ
Using Similarity Metrics [10]
Use a similarity measure (S(X1 X2))
Apply distancedensityclustering based method (eg lof)
Chawla and Chandola Anomaly Detection
Introduction Data Mining Methods Density-based anomaly Commute Time Approach Addressing Scalability Anomalies in Complex Data Evaluating Anomaly Detection Methods Applications Problem solutionsCategorical Data Discrete Sequences and Time Series Contextual Anomalies Collective Anomalies
Conditional Probability Test [18]
Identify unusual combinations of attribute values
r(at bt) =P (at bt)
P (at)P (bt)
A capB = φ Assumption If r(at bt) is low and is observed in test record t
then t is anomalous For a test record t
For each mutually exclusive pair of attribute sets ABcompute r(at bt)
Score t based on all r-values Assign minimum r-value as score Take product of all r-values
Need to compare exponential pairs of subsets Only consider subsets upto size k Ignore subsets with frequency less than a threshold α Avoid comparing independent subsets of attributes
micro(AB) ge βmicroChawla and Chandola Anomaly Detection
Introduction Data Mining Methods Density-based anomaly Commute Time Approach Addressing Scalability Anomalies in Complex Data Evaluating Anomaly Detection Methods Applications Problem solutionsCategorical Data Discrete Sequences and Time Series Contextual Anomalies Collective Anomalies
Estimating Probabilities for CPT [18]
Maximum LikelihoodEstimation
P (at bt)
P (at)P (bt)=C(at bt)
Ntimes N
C(at)times N
C(bt)
C(at) Number of traininginstances with A = at
N Total number of traininginstances
Laplace Smoothing
E(p) =C(p) + 1
N + 2
r(at bt) =E(at bt)
E(at)times E(bt)
Speedup Tricks
Replace rare attributevalues with genericattribute (reduce arity)
Use efficient datastructure to querying forcounts(AD Trees [26])
ADTrees work fasterfor low arity attributes
Chawla and Chandola Anomaly Detection
Introduction Data Mining Methods Density-based anomaly Commute Time Approach Addressing Scalability Anomalies in Complex Data Evaluating Anomaly Detection Methods Applications Problem solutionsCategorical Data Discrete Sequences and Time Series Contextual Anomalies Collective Anomalies
Finding Anomalies in Discrete Sequences
Many problem formulations
1 Anomalous symbols in asequence
2 Anomalous subsequence in asequence
3 Anomalous sequence in adatabase of sequences
See [11] for a comparativeevaluation [9] for a survey
login pwdmail ssh mail web logoutlogin pwdmail web web web web logoutlogin pwdmail ssh mail web web logoutlogin pwdwebmail ssh webmail logoutloginpwd loginpwd loginpwd logout
Chawla and Chandola Anomaly Detection
Introduction Data Mining Methods Density-based anomaly Commute Time Approach Addressing Scalability Anomalies in Complex Data Evaluating Anomaly Detection Methods Applications Problem solutionsCategorical Data Discrete Sequences and Time Series Contextual Anomalies Collective Anomalies
Treating Sequences as Points
Utilize a distancesimilarity measure Plug into a distancedensityclustering based method
Simplest Hamming Distance
h(Ai Bi) = 1 Ai 6= Bi= 0 Ai = Bi
H(AB) =nsumi=1
h(Ai Bi)
Issues Unequal lengths misalignment Normalized Length of Longest Common Subsequence
D(AB) = 1minus |LCS(AB)|radic|A||B|
Standard Dynamic Programming method is slow Faster versions available (Hunt Szymnaski method [7])
Weaknesses Cannot localize anomalies within a sequence Weak anomaly signals might get lost
Chawla and Chandola Anomaly Detection
Introduction Data Mining Methods Density-based anomaly Commute Time Approach Addressing Scalability Anomalies in Complex Data Evaluating Anomaly Detection Methods Applications Problem solutionsCategorical Data Discrete Sequences and Time Series Contextual Anomalies Collective Anomalies
Using Sliding Windows
Slide a window of size k
Extract all windows from a sequence (nminus k + 1)
Training (Creating a normal dictionary) Store all uniquewindows in all normal sequences and their counts
Testing For each window find the frequency in normal dictionary Anomaly score is inverse of the aggregate frequencies for all
windows (normalized by length)
Many variants exist For each window find the hamming distance to the closest
window in the normal dictionary [16]
Issues Penalizes low frequency windows in the normal dictionary Rewards high frequency windows that might not be relevant Can construct anomalous sequences that will escape detection
Chawla and Chandola Anomaly Detection
Introduction Data Mining Methods Density-based anomaly Commute Time Approach Addressing Scalability Anomalies in Complex Data Evaluating Anomaly Detection Methods Applications Problem solutionsCategorical Data Discrete Sequences and Time Series Contextual Anomalies Collective Anomalies
Using Probabilistic Models
Probability of occurrence of sequence S
P (S) =nprodi=1
P (Si|S1 Siminus1)
Short memory property of sequences
P (Si|S1 Siminus1) = P (Si|Siminusk Siminus1)
Conditional probability estimates for a symbol Si
P (Si|Siminusk Siminus1) =f(Si|Siminusk Si)f(Si|Siminusk Siminus1)
f is estimated from the normal dictionary
Anomaly score for a test sequence is inverse of the normalizedprobability of occurrence
Issues What if the suffix occurs very infrequently in thenormal data (or not at all)
Replace with the longest suffix that occurs sufficient number oftimes [32] - Probabilistic Suffix Trees
Significantly reduces the size of the modelChawla and Chandola Anomaly Detection
Introduction Data Mining Methods Density-based anomaly Commute Time Approach Addressing Scalability Anomalies in Complex Data Evaluating Anomaly Detection Methods Applications Problem solutionsCategorical Data Discrete Sequences and Time Series Contextual Anomalies Collective Anomalies
Finding Contextual Anomalies
Sometimes contextual information isavailable about data
Not used directly as a feature Are well understood no anomalies in
the context Can reduce false positives and yield
interesting anomalies
Example adapted from [30]
Clearest Outlier
Conditional Anomaly
Maximum Daily Temperature
Number
ofFever
Cases
Contextual anomalies - Anomalous with respect to a context Context is defined using environmental variables
Spatial (Latitude Longitude) Graph context (Edges Weights) Temporal location Domain specific (Demographic other)
How to incorporate context Reduce to traditional anomaly detection (subset on context) Explicitly model contextual information (time series spatial)
Chawla and Chandola Anomaly Detection
Introduction Data Mining Methods Density-based anomaly Commute Time Approach Addressing Scalability Anomalies in Complex Data Evaluating Anomaly Detection Methods Applications Problem solutionsCategorical Data Discrete Sequences and Time Series Contextual Anomalies Collective Anomalies
Conditional Anomaly Detection
Data instance d rArru1 u2 udU v1 v2 vdV
dU environmentalattributes
dV indicator attributes u1
u2
U1
U2
U3
v1
v2
V1V2
V3
p(V1|U3) = 02
p(V2|U3) = 02
p(V3|U3) = 06
Algorithm [30]
1 Learn a Gaussian Mixture Model (GMM)U = U1 U2 UnU
each with dimensionality dU2 Learn a set of Gaussians U = V1 V2 VnV
each withdimensionality dV
3 Learn a probabilistic mapping function p(Vj |Ui)4 Score a test instance d = [uv]
S =
nUsumi=1
p(u|Ui)nVsumj=1
p(v|Vj)p(Vj |Ui)
Chawla and Chandola Anomaly Detection
Introduction Data Mining Methods Density-based anomaly Commute Time Approach Addressing Scalability Anomalies in Complex Data Evaluating Anomaly Detection Methods Applications Problem solutionsCategorical Data Discrete Sequences and Time Series Contextual Anomalies Collective Anomalies
Finding Collective Anomalies
Find a collection of data points
Each point by itself is normal
The collection as a whole isanomalous
Relevant when data has inherentstructure and
When domain definition ofanomalies cannot be described aspoint anomalies
A Simple Solution
1 Break data intogroups
2 Compute features foreach group
3 Apply traditionalanomaly detection
Examples
1 Time series
2 Image
3 Spatial clusters ofgalaxies
Chawla and Chandola Anomaly Detection
Introduction Data Mining Methods Density-based anomaly Commute Time Approach Addressing Scalability Anomalies in Complex Data Evaluating Anomaly Detection Methods Applications Problem solutionsCategorical Data Discrete Sequences and Time Series Contextual Anomalies Collective Anomalies
Using Latent Dirichlet Allocation for Group Anomalies
Find anomalous groups in data [34]
Example Spatial clusters of galaxies topics red green emissive words continuous features
Flexible Genre Model (FGM)
For each group
1 Draw a genre 1 2 T 3 ym simM(π)2 Draw topic distribution forym SK 3 θm sim Dir(αym)
3 Draw K topicsβmk sim P (βmk|ηk)k=12K
4 For each point in group
1 Draw topic membershipzmn simM(θn)
2 Generate pointxmn isin P (xmn|βmzmn)
α
zmn
xmn
N
θm
T
π
ηK
ym
β
MK
Model Parameters
M(π) -Multinomial
Genre - Dir(αt)
Topic generatorsP (|ηk)- GIW
Point generatorsP (xmn|βnk) -MultivariateGaussian
Chawla and Chandola Anomaly Detection
Introduction Data Mining Methods Density-based anomaly Commute Time Approach Addressing Scalability Anomalies in Complex Data Evaluating Anomaly Detection Methods Applications Problem solutionsCategorical Data Discrete Sequences and Time Series Contextual Anomalies Collective Anomalies
Inference and Testing for FGM
Inference and Learning Parameters
Approximate inference of latentvariables (Gibbs Sampling)
Use samples to learn parameters(Single step Monte Carlo EM)
Topic 1
Topic 2
Topic 3
Anomaly Detection
Infer the topic distribution θm
Compute negative log likelihood wrt αt
Rationale An anomalous group will be unlikely to begenerated from any genre
Geometric interpretation Mapping each group into a Tdimensional space and finding anomalies
Chawla and Chandola Anomaly Detection
Introduction Data Mining Methods Density-based anomaly Commute Time Approach Addressing Scalability Anomalies in Complex Data Evaluating Anomaly Detection Methods Applications Problem solutions
Evaluating Anomaly Detection Methods - Labels
Labeled validation data set exists Confusion matrix Traditional evaluation metrics
Class imbalance
ROC Curve
Validation set does not exist Use domain expertise to find TP
and FP FN is harder to estimate
Pseudo false negativeestimation techniques [25]
Predicteda n
Actuala TP FNn FP TN
Acc =TP + TNsum
Rec (R) =TP
TP + FN
Prec (P ) =TP
TP + FP
F =2 lowastR lowast PR+ P
Chawla and Chandola Anomaly Detection
Introduction Data Mining Methods Density-based anomaly Commute Time Approach Addressing Scalability Anomalies in Complex Data Evaluating Anomaly Detection Methods Applications Problem solutions
Evaluating Anomaly Detection Methods - Scores
Convert to binary output Use threshold δ on score (Scale
issues [21]) Take top x as anomalies
ROC curve by varying x or δ
Quality of output Does the output ldquosuggestrdquo x or δ Which output is better
Chawla and Chandola Anomaly Detection
Introduction Data Mining Methods Density-based anomaly Commute Time Approach Addressing Scalability Anomalies in Complex Data Evaluating Anomaly Detection Methods Applications Problem solutions
Unifying Scores
Different methods assign scores in differentranges
kNN-based scores [0 1] Lof scores [1 6] ABOD scores [0 80000]
Anomalies have lower scores
Direct scaling to [0 1] might lose distinctionbetween normal and anomalies
Desired scaling Stretch interesting rangesand shrink irrelevant ones
Generalized Procedure for Normalizing Outlier Scores [21] Regularity rArr S(o) ge 0forallo S(o) asymp 0 if o is normal andS(o) 0 if o is anomalous
Normality S is regular and S(o) isin [0 1]forallo
Chawla and Chandola Anomaly Detection
Introduction Data Mining Methods Density-based anomaly Commute Time Approach Addressing Scalability Anomalies in Complex Data Evaluating Anomaly Detection Methods Applications Problem solutions
Regularization and Normalization of Scores
Regularization
1 R(o) = max0 S(o)minus baseS2 R(o) = Smax minus S(o)
3 R(o) = minus log SmaxS(o)
Normalization
1 N(o) = S(o)Smax
2 N(o) = max(
0 erf(S(o)minusmicroSσS radic2
))(Gaussian Scaling)
Suited for high dimensional data
3 N(o) = max(
0cdfγS (o)minusmicroγ
1minusmicroγ
)(Gamma Scaling)
Where cdfγS (o) = P (k S(o) θ) P is the regularized Gamma function Suited for low dimensional data
Chawla and Chandola Anomaly Detection
Introduction Data Mining Methods Density-based anomaly Commute Time Approach Addressing Scalability Anomalies in Complex Data Evaluating Anomaly Detection Methods Applications Problem solutions
Generating Labeled Data for Validation
Generating Both Normal and Anomalous Data
Use generative models for normal and anomalous behavior
Several generators available Multivariate continuous data [27] Multivariate categorical data [5] Discrete sequences using HMM [12]
Drawbacks Might not capture the domain characteristics
Injecting Anomalies - Random Perturbation[30]
Given data point z = xy x and y arepartitions of feature space
Take a random sample D of the entire data set
Let zprime = xprimeyprime isin D such that distancebetween y and yprime is maximum
Replace x with xprime and add z back to data setx
yz
zprime
Injected anomaly
Chawla and Chandola Anomaly Detection
Introduction Data Mining Methods Density-based anomaly Commute Time Approach Addressing Scalability Anomalies in Complex Data Evaluating Anomaly Detection Methods Applications Problem solutionsWhat is Network Anomaly Detection Motivation How Much Serious
Applications Overview
How to set up an anomaly detection solution for agiven application domain
Available data Define anomalies define normal behavior Identify requirements and constraints (online
real-time limited resources) What domain knowledge available
Feature identification Defining normal and anomalous behavior Tuning parameters
Available ground truth (training validation)
Chawla and Chandola Anomaly Detection
Introduction Data Mining Methods Density-based anomaly Commute Time Approach Addressing Scalability Anomalies in Complex Data Evaluating Anomaly Detection Methods Applications Problem solutionsWhat is Network Anomaly Detection Motivation How Much Serious
What is Network Anomaly Detection
Anomaly Detection or Intrusion Detection
Traditional Intrusion Detection Systems (IDS) finding attackscorresponding to predefined pattern data set known as signaturestherefore system is absolutely vulnerable against zero-day attacks
Network Anomaly Detection Systems (NADS) to detectzero-day attacks without any pre-identified signature besides profilenormal behavior of the network and address suspected incidents
Network Anomaly Detection finding unusual and largechanges in the network traffic
Examples intentional attacks (eg Distributed Denial ofService - DDoS) or unusual network traffic (eg flash crowds)
Chawla and Chandola Anomaly Detection
Introduction Data Mining Methods Density-based anomaly Commute Time Approach Addressing Scalability Anomalies in Complex Data Evaluating Anomaly Detection Methods Applications Problem solutionsWhat is Network Anomaly Detection Motivation How Much Serious
Motivation How Much Serious
According to Symantec report released in early 2011 morethan 286 million new threats have been detected in 2010which is a huge number
1656227
2704836
1000000
1500000
2000000
2500000
3000000
20547 18827 69107 113025 140690
624267
1656227
2704836
0
500000
1000000
1500000
2000000
2500000
3000000
2002 2003 2004 2005 2006 2007 2008 July2009-June2010
Chawla and Chandola Anomaly Detection
Introduction Data Mining Methods Density-based anomaly Commute Time Approach Addressing Scalability Anomalies in Complex Data Evaluating Anomaly Detection Methods Applications Problem solutionsNetwork Topology Network Anomalies Detection Problem Network Anomalies Detection Problem Why care about OD Flows
Network Topology
A Typical network
1 y
Router
2
3
41t
x2t
x1t
x3t
x4t
Origin-Destination (OD) flow is the traffic that enters at anorigin node and exits at a destination node of a backbonenetwork x1t x1t
Link measurement is the traffic enters at an node during aninterval y1t
Relationship between link traffic and OD flow traffic iscaptured by the routing matrix A
Chawla and Chandola Anomaly Detection
Introduction Data Mining Methods Density-based anomaly Commute Time Approach Addressing Scalability Anomalies in Complex Data Evaluating Anomaly Detection Methods Applications Problem solutionsNetwork Topology Network Anomalies Detection Problem Network Anomalies Detection Problem Why care about OD Flows
Network Anomalies Detection Problem
Chawla and Chandola Anomaly Detection
Introduction Data Mining Methods Density-based anomaly Commute Time Approach Addressing Scalability Anomalies in Complex Data Evaluating Anomaly Detection Methods Applications Problem solutionsNetwork Topology Network Anomalies Detection Problem Network Anomalies Detection Problem Why care about OD Flows
Network Anomalies Detection Problem
Chawla and Chandola Anomaly Detection
Introduction Data Mining Methods Density-based anomaly Commute Time Approach Addressing Scalability Anomalies in Complex Data Evaluating Anomaly Detection Methods Applications Problem solutionsNetwork Topology Network Anomalies Detection Problem Network Anomalies Detection Problem Why care about OD Flows
Why care about OD Flows
Volume anomaly typically arises on an OD flow (trafficarriving at one node and destined for another node)
If we only monitor traffic on network links volume arisingfrom an OD flow may not be noticeable Thus naiveapproach wont work if OD flow info is not available
Figure source [22]
Chawla and Chandola Anomaly Detection
Introduction Data Mining Methods Density-based anomaly Commute Time Approach Addressing Scalability Anomalies in Complex Data Evaluating Anomaly Detection Methods Applications Problem solutionsPCA and Subspace Method Subspace Method Algorithm Subspace Analysis Results Discussion Typical Characteristics of Anomaly Limitation of Volume Entropy Based versus Volume Based Fraud Detection Epidemeology Anomaly Detection in Climate and Weather Anomalies in Climate Validation of Anomalies
PCA and Subspace Method
Chawla and Chandola Anomaly Detection
Introduction Data Mining Methods Density-based anomaly Commute Time Approach Addressing Scalability Anomalies in Complex Data Evaluating Anomaly Detection Methods Applications Problem solutionsPCA and Subspace Method Subspace Method Algorithm Subspace Analysis Results Discussion Typical Characteristics of Anomaly Limitation of Volume Entropy Based versus Volume Based Fraud Detection Epidemeology Anomaly Detection in Climate and Weather Anomalies in Climate Validation of Anomalies
Subspace Method Algorithm
Step1- Determine the PCs based on eigenvaluedecomposition of the covariance matrix of the dataset
Step2- Choose first top k principle components with thehighest eigenvalues as matrix P
Step3-normal traffic subspace called Z
Z = PP TZ = CZ
Step4-abnormal traffic subspace called Z
Z = (I minus PP T )Z = CZ
Step5-If the norm of a vector is large then it is an rdquoanomalyrdquo
Chawla and Chandola Anomaly Detection
Introduction Data Mining Methods Density-based anomaly Commute Time Approach Addressing Scalability Anomalies in Complex Data Evaluating Anomaly Detection Methods Applications Problem solutionsPCA and Subspace Method Subspace Method Algorithm Subspace Analysis Results Discussion Typical Characteristics of Anomaly Limitation of Volume Entropy Based versus Volume Based Fraud Detection Epidemeology Anomaly Detection in Climate and Weather Anomalies in Climate Validation of Anomalies
Subspace Analysis Results
Note that during anomaly normal component does not changethat much while residual component changes quite a lot
Thus anomalies can be detected by setting some threshold
Figure source [22]
Chawla and Chandola Anomaly Detection
Introduction Data Mining Methods Density-based anomaly Commute Time Approach Addressing Scalability Anomalies in Complex Data Evaluating Anomaly Detection Methods Applications Problem solutionsPCA and Subspace Method Subspace Method Algorithm Subspace Analysis Results Discussion Typical Characteristics of Anomaly Limitation of Volume Entropy Based versus Volume Based Fraud Detection Epidemeology Anomaly Detection in Climate and Weather Anomalies in Climate Validation of Anomalies
Discussion Typical Characteristics of Anomaly
Most Anomalies induce a change in distributionalaspects of packet header fields (called features)
Most important features include 5-tuple Source ampdestination IP addresses Source and destination portnumbers and IP protocol
raquo DOS attack ndash multiple source IP address concentrated on asingle destination IP address
raquo Network scan ndash dispersed distribution of destination addresses
raquo Most wormsviruses also induce some change in distribution ofcertain features
raquo However these changes can be very subtle and mining them islike searching for needles in a haystack
Unlike many previous approach this paper aims todetect events which disturb the distribution of trafficfeatures rather than traffic volume
Chawla and Chandola Anomaly Detection
Introduction Data Mining Methods Density-based anomaly Commute Time Approach Addressing Scalability Anomalies in Complex Data Evaluating Anomaly Detection Methods Applications Problem solutionsPCA and Subspace Method Subspace Method Algorithm Subspace Analysis Results Discussion Typical Characteristics of Anomaly Limitation of Volume Entropy Based versus Volume Based Fraud Detection Epidemeology Anomaly Detection in Climate and Weather Anomalies in Climate Validation of Anomalies
Limitation of Volume
Figure source [22]
Port scan anomaly (traffic feature changes however traffic volume
remains more or less the same)
We can use entropy tocapture the variationsin the traffic feature
bullTakes value 0 when distribution is maximally concentratedbullTakes value log2N when distribution is maximally dispersed
But stands out in
feature entropy
which also reveals
its structure
Port scan
dwarfed
in volume
metricshellip
Chawla and Chandola Anomaly Detection
Introduction Data Mining Methods Density-based anomaly Commute Time Approach Addressing Scalability Anomalies in Complex Data Evaluating Anomaly Detection Methods Applications Problem solutionsPCA and Subspace Method Subspace Method Algorithm Subspace Analysis Results Discussion Typical Characteristics of Anomaly Limitation of Volume Entropy Based versus Volume Based Fraud Detection Epidemeology Anomaly Detection in Climate and Weather Anomalies in Climate Validation of Anomalies
Entropy Based versus Volume Based
DoSDDoS Attacks- a spike in traffic data toward adominant destination IP
Scan anomaly-a spike in traffic data from a dominant sourceIP
Flash Crowd anomaly- again a spike in traffic data to adominant destination IP
Worm anomaly-a Spike in traffic with a dominant port
Chawla and Chandola Anomaly Detection
Introduction Data Mining Methods Density-based anomaly Commute Time Approach Addressing Scalability Anomalies in Complex Data Evaluating Anomaly Detection Methods Applications Problem solutionsPCA and Subspace Method Subspace Method Algorithm Subspace Analysis Results Discussion Typical Characteristics of Anomaly Limitation of Volume Entropy Based versus Volume Based Fraud Detection Epidemeology Anomaly Detection in Climate and Weather Anomalies in Climate Validation of Anomalies
Fraud Detection
Domain Question Identifyfraudulent activities or players fromobserved transaction data
Data Transactions between different
players in the system Meta information about the
individuals An underlying graph structure
Challenges Track and model human behavior Anomalies caused by adaptive
human adversaries Massive data sizes
Insurance (autohealtha)
ClaimantProvider Payer
Telecommunications Customer
Provider
Credit Cards Customer
Supplier Bank
Web Advertising User Advertiser
Publisher
ahttpwwwcheatingculturecompast-cases-of-medicare-fraud
Chawla and Chandola Anomaly Detection
Introduction Data Mining Methods Density-based anomaly Commute Time Approach Addressing Scalability Anomalies in Complex Data Evaluating Anomaly Detection Methods Applications Problem solutionsPCA and Subspace Method Subspace Method Algorithm Subspace Analysis Results Discussion Typical Characteristics of Anomaly Limitation of Volume Entropy Based versus Volume Based Fraud Detection Epidemeology Anomaly Detection in Climate and Weather Anomalies in Climate Validation of Anomalies
A Generic Fraud Detection Method
Activity Monitoring [13]1 Build profiles for individuals (customers users etc) based on
historic data User X makes n calls on an average in January
2 Compare current behavior with historical profile for significantdeviations
Clustering based [4]1 Cluster historical profiles of customers2 Identify small clusters or outlying profiles as anomalies
Strengths Anomaly detection is fast (good for real time) Results are easy to explain
Weaknesses Need to create and maintain a large number of profiles Not dynamic Adequate historical data might not be available Too many false positives
Chawla and Chandola Anomaly Detection
Introduction Data Mining Methods Density-based anomaly Commute Time Approach Addressing Scalability Anomalies in Complex Data Evaluating Anomaly Detection Methods Applications Problem solutionsPCA and Subspace Method Subspace Method Algorithm Subspace Analysis Results Discussion Typical Characteristics of Anomaly Limitation of Volume Entropy Based versus Volume Based Fraud Detection Epidemeology Anomaly Detection in Climate and Weather Anomalies in Climate Validation of Anomalies
Exploiting Graph Structure - Weighted Graphs
Represent data as a weighted graph Communication networks (phone email SMS) Provider referral networks
Objective Identify anomalous nodes
For each node extract several features based on the propertiesof the induced sub-graph (egonet) of neighboring nodes [1]
Choose features that can highlight anomalous nodes
1 Ni degree of node2 Ei number of edges in egonet3 Wi total weight of egonet4 λi principal eigen vector of weighted adjacency matrix of
egonet
Data is transformed into a point in a multi-dimensional space
Chawla and Chandola Anomaly Detection
Introduction Data Mining Methods Density-based anomaly Commute Time Approach Addressing Scalability Anomalies in Complex Data Evaluating Anomaly Detection Methods Applications Problem solutionsPCA and Subspace Method Subspace Method Algorithm Subspace Analysis Results Discussion Typical Characteristics of Anomaly Limitation of Volume Entropy Based versus Volume Based Fraud Detection Epidemeology Anomaly Detection in Climate and Weather Anomalies in Climate Validation of Anomalies
Identifying Anomalies
Traditional anomaly detection (lof) Can be slow but can identify any type of anomalous structure
Faster method to identify specific types of anomalousstructures
Identify relevant feature pairs and power law relationship
Eg Egonet Density Power Law Ni vs Ei - detect nearcliques and stars
Ei prop Nαi 1 le α le 2
Anomaly score for node i wrt a pair of features (y = Cxθ)
Si =max(yi Cx
θi )
min(yi Cxθi )lowast log (|yi minus Cxθi |+ 1)
Chawla and Chandola Anomaly Detection
Introduction Data Mining Methods Density-based anomaly Commute Time Approach Addressing Scalability Anomalies in Complex Data Evaluating Anomaly Detection Methods Applications Problem solutionsPCA and Subspace Method Subspace Method Algorithm Subspace Analysis Results Discussion Typical Characteristics of Anomaly Limitation of Volume Entropy Based versus Volume Based Fraud Detection Epidemeology Anomaly Detection in Climate and Weather Anomalies in Climate Validation of Anomalies
Exploiting Graph Structure - Bipartite Graphs
Represent data as a bipartite graph Healthcare Data (Beneficiaries vs Providers) Insider trading (Traders vs Stocks)
Objective Identify anomalous links
Given a query node a isin V1 find the ldquorelevancerdquoof all other nodes in V1 to a
RelevanceScore(a b) prop Number of times aldquorandom walkrdquo from a reaches b
Use the relevance scores to compute thenormality scores for a node t isin V2
Find set St = a|〈a t〉 isin E Compute |St| times |St| similarity matrix using
relevance vectors for a isin St Normality Score = mean of non-diagonal entries
of similarity matrix
V1 E V2a1
a2
a3
an
t1
t2
t3
tn
Chawla and Chandola Anomaly Detection
Introduction Data Mining Methods Density-based anomaly Commute Time Approach Addressing Scalability Anomalies in Complex Data Evaluating Anomaly Detection Methods Applications Problem solutionsPCA and Subspace Method Subspace Method Algorithm Subspace Analysis Results Discussion Typical Characteristics of Anomaly Limitation of Volume Entropy Based versus Volume Based Fraud Detection Epidemeology Anomaly Detection in Climate and Weather Anomalies in Climate Validation of Anomalies
Detecting Disease Outbreaks
Domain Question Early detection of disease
outbreaks Anthrax attack
Data Emergency department visits Grocery data (Example [14]) Clinical visits Weatherclimate data
Challenges Weak signals in the data
ED cases involving cough rArrFlu or SARS
Integration of multiple signals(lag analysis)
Account for spatial and temporalcorrelations
Chawla and Chandola Anomaly Detection
Introduction Data Mining Methods Density-based anomaly Commute Time Approach Addressing Scalability Anomalies in Complex Data Evaluating Anomaly Detection Methods Applications Problem solutionsPCA and Subspace Method Subspace Method Algorithm Subspace Analysis Results Discussion Typical Characteristics of Anomaly Limitation of Volume Entropy Based versus Volume Based Fraud Detection Epidemeology Anomaly Detection in Climate and Weather Anomalies in Climate Validation of Anomalies
Whatrsquos Significant About Recent Events (WSARE) [33]
1 Learn Bayesian network from historical data Environmental and response variables
2 Sample from the BN (DBbaseline|Current Environment)3 Compute contingency table for rules for DBbaseline andDBcurrent
Rules are single assignment rules (Xi = Y ji ) or conjunctions4 Find p-value for rules using χ2-test
Null Hypothesis Rows and columns of tables for DBbaselineand DBcurrent are independent
5 Find rule with largest p-value Repeat Step 2
Chawla and Chandola Anomaly Detection
Introduction Data Mining Methods Density-based anomaly Commute Time Approach Addressing Scalability Anomalies in Complex Data Evaluating Anomaly Detection Methods Applications Problem solutionsPCA and Subspace Method Subspace Method Algorithm Subspace Analysis Results Discussion Typical Characteristics of Anomaly Limitation of Volume Entropy Based versus Volume Based Fraud Detection Epidemeology Anomaly Detection in Climate and Weather Anomalies in Climate Validation of Anomalies
Incorporating Spatial and Temporal Relationships
WSARE does not explicitly model the spatial and temporalrelationships
What happened yesterday What happened in the adjoining neighborhood (yesterday)
Bayesian Network Spatio-Temporal (BNST) modelingframework [17]
Add nodes for temporal and spatial dependencies Need more data to train
Chawla and Chandola Anomaly Detection
Introduction Data Mining Methods Density-based anomaly Commute Time Approach Addressing Scalability Anomalies in Complex Data Evaluating Anomaly Detection Methods Applications Problem solutionsPCA and Subspace Method Subspace Method Algorithm Subspace Analysis Results Discussion Typical Characteristics of Anomaly Limitation of Volume Entropy Based versus Volume Based Fraud Detection Epidemeology Anomaly Detection in Climate and Weather Anomalies in Climate Validation of Anomalies
Anomaly Detection in Climate and Weather
Science Questions Identify natural and anthropogenic disasters Identify long time scale events - droughts atmospheric rivers
cold fronts etc
Data Ground observations Remote sensing data (satellites
air-borne) Climate model simulation outputs Multiple variables spatio-temporal (often has height dimension
as well)
Challenges Model spatio-temporal relationships across multiple variables Explain the cause of anomalies Massive data sizes
Climate and weather extreme events are well defined
Key challenge is to find significant events and explain the cause
Chawla and Chandola Anomaly Detection
Introduction Data Mining Methods Density-based anomaly Commute Time Approach Addressing Scalability Anomalies in Complex Data Evaluating Anomaly Detection Methods Applications Problem solutionsPCA and Subspace Method Subspace Method Algorithm Subspace Analysis Results Discussion Typical Characteristics of Anomaly Limitation of Volume Entropy Based versus Volume Based Fraud Detection Epidemeology Anomaly Detection in Climate and Weather Anomalies in Climate Validation of Anomalies
Anomalies are Widely Used in Climate
Most analysis done on ldquoanomalyrdquo time series
Difference from a ldquobase periodrdquo (Toosimplistic)
Brings spatial smoothness (eg a mountaintop and nearby valley can have very differenttemperatures) Removes seasonality
Understand climate and weatherphenomenon
Southern Oscillation Index (SOI) Difference between Sea Level Pressure
(SLP) anomalies for Tahiti and DarwinAustralia
Figure Global AverageTemperature Anomaly(1975 - 2007) Srcwwwmetofficegovuk
Chawla and Chandola Anomaly Detection
Introduction Data Mining Methods Density-based anomaly Commute Time Approach Addressing Scalability Anomalies in Complex Data Evaluating Anomaly Detection Methods Applications Problem solutionsPCA and Subspace Method Subspace Method Algorithm Subspace Analysis Results Discussion Typical Characteristics of Anomaly Limitation of Volume Entropy Based versus Volume Based Fraud Detection Epidemeology Anomaly Detection in Climate and Weather Anomalies in Climate Validation of Anomalies
Constructing Anomalies from Raw Data
Anomaly time series for a given location i
vprimei = vi minus bi
where bi is the base (reference)
How to choose bi Mean of all data for location i Monthly mean values (account for seasonality) Monthly z-score values Median (more robust) Using a shorter ldquoreference periodrdquo
30 year moving window
Different methods show statistically significant differences[19] What is the right strategy Weighted mean of different strategies (Pick weights using
Monte Carlo sampling)
Chawla and Chandola Anomaly Detection
Introduction Data Mining Methods Density-based anomaly Commute Time Approach Addressing Scalability Anomalies in Complex Data Evaluating Anomaly Detection Methods Applications Problem solutionsPCA and Subspace Method Subspace Method Algorithm Subspace Analysis Results Discussion Typical Characteristics of Anomaly Limitation of Volume Entropy Based versus Volume Based Fraud Detection Epidemeology Anomaly Detection in Climate and Weather Anomalies in Climate Validation of Anomalies
Anomaly Detection for Identifying Droughts
Science question Identify significant drought patterns usinghistorical observation data or future simulation data or both
Find persistent spatiotemporal anomalies in precipitation data
A two step approach
1 Find precipitationanomalies usingthresholds
2 Find large connectedcomponents across spaceand time
Matlab - bwlabelbwlabeln
Followup Science questionExplain cause
(drought190120061avi)
Figure Video courtsey Dr ArindamBanerjee
Chawla and Chandola Anomaly Detection
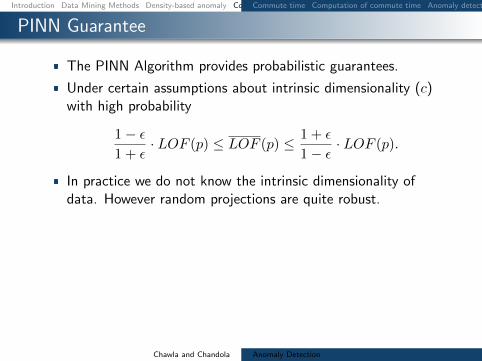
Introduction Data Mining Methods Density-based anomaly Commute Time Approach Addressing Scalability Anomalies in Complex Data Evaluating Anomaly Detection Methods Applications Problem solutionsCommute time Computation of commute time Anomaly detection using commute time (CDOF) Fast estimation of commute time Scalability for Density-based method PINN Algorithm (ICDM 2010) PINN Guarantee Examples high-dim distance-based outliers Examples high-dim density-based outliers Examples local density-based outliers
PINN Guarantee
The PINN Algorithm provides probabilistic guarantees
Under certain assumptions about intrinsic dimensionality (c)with high probability
1minus ε1 + ε
middot LOF (p) le LOF (p) le 1 + ε
1minus ε middot LOF (p)
In practice we do not know the intrinsic dimensionality ofdata However random projections are quite robust
Chawla and Chandola Anomaly Detection
Introduction Data Mining Methods Density-based anomaly Commute Time Approach Addressing Scalability Anomalies in Complex Data Evaluating Anomaly Detection Methods Applications Problem solutionsCommute time Computation of commute time Anomaly detection using commute time (CDOF) Fast estimation of commute time Scalability for Density-based method PINN Algorithm (ICDM 2010) PINN Guarantee Examples high-dim distance-based outliers Examples high-dim density-based outliers Examples local density-based outliers
Examples high-dim distance-based outliers
On a large database of images the bright images show up asdistance based outliers
Chawla and Chandola Anomaly Detection
Introduction Data Mining Methods Density-based anomaly Commute Time Approach Addressing Scalability Anomalies in Complex Data Evaluating Anomaly Detection Methods Applications Problem solutionsCommute time Computation of commute time Anomaly detection using commute time (CDOF) Fast estimation of commute time Scalability for Density-based method PINN Algorithm (ICDM 2010) PINN Guarantee Examples high-dim distance-based outliers Examples high-dim density-based outliers Examples local density-based outliers
Examples high-dim density-based outliers
On a large database of images occluded images show up asdensity based outliers
Chawla and Chandola Anomaly Detection
Introduction Data Mining Methods Density-based anomaly Commute Time Approach Addressing Scalability Anomalies in Complex Data Evaluating Anomaly Detection Methods Applications Problem solutionsCommute time Computation of commute time Anomaly detection using commute time (CDOF) Fast estimation of commute time Scalability for Density-based method PINN Algorithm (ICDM 2010) PINN Guarantee Examples high-dim distance-based outliers Examples high-dim density-based outliers Examples local density-based outliers
Examples local density-based outliers
Examples of images ranked by LOF
Chawla and Chandola Anomaly Detection
Introduction Data Mining Methods Density-based anomaly Commute Time Approach Addressing Scalability Anomalies in Complex Data Evaluating Anomaly Detection Methods Applications Problem solutions
Addressing Scalability
Chawla and Chandola Anomaly Detection
Introduction Data Mining Methods Density-based anomaly Commute Time Approach Addressing Scalability Anomalies in Complex Data Evaluating Anomaly Detection Methods Applications Problem solutions
Using GPUs for Anomaly Detection
Well suited for data parallel algorithms Using CUDA - Compute Unified Device
Architecture (Nvidia)
Need to re-engineer existing algorithms Utilization of device memory Minimize CPUhArrGPU transfer of data Keep threads homogeneous
Most model based algorithms arenaturally setup for the testing phase
Model building needs careful redesign
What about unsupervised algorithms
Kernel
Host
Grid
Device
Block(00)
Block(01)
Block(02)
Block(10)
Block(11)
Block(12)
Thread Block
Thread(00)
Thread(01)
Thread(02)
Thread(03)
Thread(10)
Thread(11)
Thread(12)
Thread(13)
Thread(20)
Thread(21)
Thread(22)
Thread(23)
Host Host Memory
SM 2
SM 1
SM 0
Registers Registers Registers
SP 0 SP 1 SP 7
Shared Memory
Global Memory
Texture Memory
Constant Memory
Device
Chawla and Chandola Anomaly Detection
Introduction Data Mining Methods Density-based anomaly Commute Time Approach Addressing Scalability Anomalies in Complex Data Evaluating Anomaly Detection Methods Applications Problem solutions
Implementing DB(kN) on GPUs
Return top N data instances whose distances tok-th nearest neighbor are largest (SerialDB(kN) is O(n2))
Involves computing pairwise distances
Load block i and block j to shared memory Data layout in memory should be optimized
Each thread computes distance between a pairof instances
Can utilize this time to load next chunk of datafrom host to device memory
Writes results to corresponding output block
Sorting can be done efficiently in CUDA [29]
d
n
T
n
n
Chawla and Chandola Anomaly Detection
Introduction Data Mining Methods Density-based anomaly Commute Time Approach Addressing Scalability Anomalies in Complex Data Evaluating Anomaly Detection Methods Applications Problem solutionsCategorical Data Discrete Sequences and Time Series Contextual Anomalies Collective Anomalies
Moving Beyond Multi-dimensional Record Data
Categorical (Mixed)
Fraud Detection
Cyber Networks
Time Series
Sensor Networks
Healthcare
Discrete Sequences
Genomic
System Calls
Spatial
GIS
Image analysis
Spatio-temporal
Remote sensing
Climate
Graphs
Social networks
Epidemiology
Chawla and Chandola Anomaly Detection
Introduction Data Mining Methods Density-based anomaly Commute Time Approach Addressing Scalability Anomalies in Complex Data Evaluating Anomaly Detection Methods Applications Problem solutionsCategorical Data Discrete Sequences and Time Series Contextual Anomalies Collective Anomalies
Handling Categorical Data
Each attribute can belong to one of many categories
No ordering between categories
Mixed data (categorical and continuous attributes)
cap-shape cap-surface middot middot middot habitat type
convex smooth urban poisonousconvex smooth grasses ediblebell smooth meadows edibleconvex scaly urban poisonousconvex smooth grasses ediblemiddot middot middot
Table Mushroom Data Set [2]
Chawla and Chandola Anomaly Detection
Introduction Data Mining Methods Density-based anomaly Commute Time Approach Addressing Scalability Anomalies in Complex Data Evaluating Anomaly Detection Methods Applications Problem solutionsCategorical Data Discrete Sequences and Time Series Contextual Anomalies Collective Anomalies
Approaches to Identify Categorical Anomalies
Using Association Analysis [24]
Binarize data
Learn rules (X rArr Y ) Choose high confidence
rules (P (Y |X))
For test record Z = 〈XY 〉find rules of the formP (Y |X)
Y is not observed whenX is observed
Using Bayesian Networks [33]
Learn Bayesian networkstructure and parameters
Compute P (Z) for test datarecord Z
Flag anomaly if P (Z) lt δ
Using Similarity Metrics [10]
Use a similarity measure (S(X1 X2))
Apply distancedensityclustering based method (eg lof)
Chawla and Chandola Anomaly Detection
Introduction Data Mining Methods Density-based anomaly Commute Time Approach Addressing Scalability Anomalies in Complex Data Evaluating Anomaly Detection Methods Applications Problem solutionsCategorical Data Discrete Sequences and Time Series Contextual Anomalies Collective Anomalies
Conditional Probability Test [18]
Identify unusual combinations of attribute values
r(at bt) =P (at bt)
P (at)P (bt)
A capB = φ Assumption If r(at bt) is low and is observed in test record t
then t is anomalous For a test record t
For each mutually exclusive pair of attribute sets ABcompute r(at bt)
Score t based on all r-values Assign minimum r-value as score Take product of all r-values
Need to compare exponential pairs of subsets Only consider subsets upto size k Ignore subsets with frequency less than a threshold α Avoid comparing independent subsets of attributes
micro(AB) ge βmicroChawla and Chandola Anomaly Detection
Introduction Data Mining Methods Density-based anomaly Commute Time Approach Addressing Scalability Anomalies in Complex Data Evaluating Anomaly Detection Methods Applications Problem solutionsCategorical Data Discrete Sequences and Time Series Contextual Anomalies Collective Anomalies
Estimating Probabilities for CPT [18]
Maximum LikelihoodEstimation
P (at bt)
P (at)P (bt)=C(at bt)
Ntimes N
C(at)times N
C(bt)
C(at) Number of traininginstances with A = at
N Total number of traininginstances
Laplace Smoothing
E(p) =C(p) + 1
N + 2
r(at bt) =E(at bt)
E(at)times E(bt)
Speedup Tricks
Replace rare attributevalues with genericattribute (reduce arity)
Use efficient datastructure to querying forcounts(AD Trees [26])
ADTrees work fasterfor low arity attributes
Chawla and Chandola Anomaly Detection
Introduction Data Mining Methods Density-based anomaly Commute Time Approach Addressing Scalability Anomalies in Complex Data Evaluating Anomaly Detection Methods Applications Problem solutionsCategorical Data Discrete Sequences and Time Series Contextual Anomalies Collective Anomalies
Finding Anomalies in Discrete Sequences
Many problem formulations
1 Anomalous symbols in asequence
2 Anomalous subsequence in asequence
3 Anomalous sequence in adatabase of sequences
See [11] for a comparativeevaluation [9] for a survey
login pwdmail ssh mail web logoutlogin pwdmail web web web web logoutlogin pwdmail ssh mail web web logoutlogin pwdwebmail ssh webmail logoutloginpwd loginpwd loginpwd logout
Chawla and Chandola Anomaly Detection
Introduction Data Mining Methods Density-based anomaly Commute Time Approach Addressing Scalability Anomalies in Complex Data Evaluating Anomaly Detection Methods Applications Problem solutionsCategorical Data Discrete Sequences and Time Series Contextual Anomalies Collective Anomalies
Treating Sequences as Points
Utilize a distancesimilarity measure Plug into a distancedensityclustering based method
Simplest Hamming Distance
h(Ai Bi) = 1 Ai 6= Bi= 0 Ai = Bi
H(AB) =nsumi=1
h(Ai Bi)
Issues Unequal lengths misalignment Normalized Length of Longest Common Subsequence
D(AB) = 1minus |LCS(AB)|radic|A||B|
Standard Dynamic Programming method is slow Faster versions available (Hunt Szymnaski method [7])
Weaknesses Cannot localize anomalies within a sequence Weak anomaly signals might get lost
Chawla and Chandola Anomaly Detection
Introduction Data Mining Methods Density-based anomaly Commute Time Approach Addressing Scalability Anomalies in Complex Data Evaluating Anomaly Detection Methods Applications Problem solutionsCategorical Data Discrete Sequences and Time Series Contextual Anomalies Collective Anomalies
Using Sliding Windows
Slide a window of size k
Extract all windows from a sequence (nminus k + 1)
Training (Creating a normal dictionary) Store all uniquewindows in all normal sequences and their counts
Testing For each window find the frequency in normal dictionary Anomaly score is inverse of the aggregate frequencies for all
windows (normalized by length)
Many variants exist For each window find the hamming distance to the closest
window in the normal dictionary [16]
Issues Penalizes low frequency windows in the normal dictionary Rewards high frequency windows that might not be relevant Can construct anomalous sequences that will escape detection
Chawla and Chandola Anomaly Detection
Introduction Data Mining Methods Density-based anomaly Commute Time Approach Addressing Scalability Anomalies in Complex Data Evaluating Anomaly Detection Methods Applications Problem solutionsCategorical Data Discrete Sequences and Time Series Contextual Anomalies Collective Anomalies
Using Probabilistic Models
Probability of occurrence of sequence S
P (S) =nprodi=1
P (Si|S1 Siminus1)
Short memory property of sequences
P (Si|S1 Siminus1) = P (Si|Siminusk Siminus1)
Conditional probability estimates for a symbol Si
P (Si|Siminusk Siminus1) =f(Si|Siminusk Si)f(Si|Siminusk Siminus1)
f is estimated from the normal dictionary
Anomaly score for a test sequence is inverse of the normalizedprobability of occurrence
Issues What if the suffix occurs very infrequently in thenormal data (or not at all)
Replace with the longest suffix that occurs sufficient number oftimes [32] - Probabilistic Suffix Trees
Significantly reduces the size of the modelChawla and Chandola Anomaly Detection
Introduction Data Mining Methods Density-based anomaly Commute Time Approach Addressing Scalability Anomalies in Complex Data Evaluating Anomaly Detection Methods Applications Problem solutionsCategorical Data Discrete Sequences and Time Series Contextual Anomalies Collective Anomalies
Finding Contextual Anomalies
Sometimes contextual information isavailable about data
Not used directly as a feature Are well understood no anomalies in
the context Can reduce false positives and yield
interesting anomalies
Example adapted from [30]
Clearest Outlier
Conditional Anomaly
Maximum Daily Temperature
Number
ofFever
Cases
Contextual anomalies - Anomalous with respect to a context Context is defined using environmental variables
Spatial (Latitude Longitude) Graph context (Edges Weights) Temporal location Domain specific (Demographic other)
How to incorporate context Reduce to traditional anomaly detection (subset on context) Explicitly model contextual information (time series spatial)
Chawla and Chandola Anomaly Detection
Introduction Data Mining Methods Density-based anomaly Commute Time Approach Addressing Scalability Anomalies in Complex Data Evaluating Anomaly Detection Methods Applications Problem solutionsCategorical Data Discrete Sequences and Time Series Contextual Anomalies Collective Anomalies
Conditional Anomaly Detection
Data instance d rArru1 u2 udU v1 v2 vdV
dU environmentalattributes
dV indicator attributes u1
u2
U1
U2
U3
v1
v2
V1V2
V3
p(V1|U3) = 02
p(V2|U3) = 02
p(V3|U3) = 06
Algorithm [30]
1 Learn a Gaussian Mixture Model (GMM)U = U1 U2 UnU
each with dimensionality dU2 Learn a set of Gaussians U = V1 V2 VnV
each withdimensionality dV
3 Learn a probabilistic mapping function p(Vj |Ui)4 Score a test instance d = [uv]
S =
nUsumi=1
p(u|Ui)nVsumj=1
p(v|Vj)p(Vj |Ui)
Chawla and Chandola Anomaly Detection
Introduction Data Mining Methods Density-based anomaly Commute Time Approach Addressing Scalability Anomalies in Complex Data Evaluating Anomaly Detection Methods Applications Problem solutionsCategorical Data Discrete Sequences and Time Series Contextual Anomalies Collective Anomalies
Finding Collective Anomalies
Find a collection of data points
Each point by itself is normal
The collection as a whole isanomalous
Relevant when data has inherentstructure and
When domain definition ofanomalies cannot be described aspoint anomalies
A Simple Solution
1 Break data intogroups
2 Compute features foreach group
3 Apply traditionalanomaly detection
Examples
1 Time series
2 Image
3 Spatial clusters ofgalaxies
Chawla and Chandola Anomaly Detection
Introduction Data Mining Methods Density-based anomaly Commute Time Approach Addressing Scalability Anomalies in Complex Data Evaluating Anomaly Detection Methods Applications Problem solutionsCategorical Data Discrete Sequences and Time Series Contextual Anomalies Collective Anomalies
Using Latent Dirichlet Allocation for Group Anomalies
Find anomalous groups in data [34]
Example Spatial clusters of galaxies topics red green emissive words continuous features
Flexible Genre Model (FGM)
For each group
1 Draw a genre 1 2 T 3 ym simM(π)2 Draw topic distribution forym SK 3 θm sim Dir(αym)
3 Draw K topicsβmk sim P (βmk|ηk)k=12K
4 For each point in group
1 Draw topic membershipzmn simM(θn)
2 Generate pointxmn isin P (xmn|βmzmn)
α
zmn
xmn
N
θm
T
π
ηK
ym
β
MK
Model Parameters
M(π) -Multinomial
Genre - Dir(αt)
Topic generatorsP (|ηk)- GIW
Point generatorsP (xmn|βnk) -MultivariateGaussian
Chawla and Chandola Anomaly Detection
Introduction Data Mining Methods Density-based anomaly Commute Time Approach Addressing Scalability Anomalies in Complex Data Evaluating Anomaly Detection Methods Applications Problem solutionsCategorical Data Discrete Sequences and Time Series Contextual Anomalies Collective Anomalies
Inference and Testing for FGM
Inference and Learning Parameters
Approximate inference of latentvariables (Gibbs Sampling)
Use samples to learn parameters(Single step Monte Carlo EM)
Topic 1
Topic 2
Topic 3
Anomaly Detection
Infer the topic distribution θm
Compute negative log likelihood wrt αt
Rationale An anomalous group will be unlikely to begenerated from any genre
Geometric interpretation Mapping each group into a Tdimensional space and finding anomalies
Chawla and Chandola Anomaly Detection
Introduction Data Mining Methods Density-based anomaly Commute Time Approach Addressing Scalability Anomalies in Complex Data Evaluating Anomaly Detection Methods Applications Problem solutions
Evaluating Anomaly Detection Methods - Labels
Labeled validation data set exists Confusion matrix Traditional evaluation metrics
Class imbalance
ROC Curve
Validation set does not exist Use domain expertise to find TP
and FP FN is harder to estimate
Pseudo false negativeestimation techniques [25]
Predicteda n
Actuala TP FNn FP TN
Acc =TP + TNsum
Rec (R) =TP
TP + FN
Prec (P ) =TP
TP + FP
F =2 lowastR lowast PR+ P
Chawla and Chandola Anomaly Detection
Introduction Data Mining Methods Density-based anomaly Commute Time Approach Addressing Scalability Anomalies in Complex Data Evaluating Anomaly Detection Methods Applications Problem solutions
Evaluating Anomaly Detection Methods - Scores
Convert to binary output Use threshold δ on score (Scale
issues [21]) Take top x as anomalies
ROC curve by varying x or δ
Quality of output Does the output ldquosuggestrdquo x or δ Which output is better
Chawla and Chandola Anomaly Detection
Introduction Data Mining Methods Density-based anomaly Commute Time Approach Addressing Scalability Anomalies in Complex Data Evaluating Anomaly Detection Methods Applications Problem solutions
Unifying Scores
Different methods assign scores in differentranges
kNN-based scores [0 1] Lof scores [1 6] ABOD scores [0 80000]
Anomalies have lower scores
Direct scaling to [0 1] might lose distinctionbetween normal and anomalies
Desired scaling Stretch interesting rangesand shrink irrelevant ones
Generalized Procedure for Normalizing Outlier Scores [21] Regularity rArr S(o) ge 0forallo S(o) asymp 0 if o is normal andS(o) 0 if o is anomalous
Normality S is regular and S(o) isin [0 1]forallo
Chawla and Chandola Anomaly Detection
Introduction Data Mining Methods Density-based anomaly Commute Time Approach Addressing Scalability Anomalies in Complex Data Evaluating Anomaly Detection Methods Applications Problem solutions
Regularization and Normalization of Scores
Regularization
1 R(o) = max0 S(o)minus baseS2 R(o) = Smax minus S(o)
3 R(o) = minus log SmaxS(o)
Normalization
1 N(o) = S(o)Smax
2 N(o) = max(
0 erf(S(o)minusmicroSσS radic2
))(Gaussian Scaling)
Suited for high dimensional data
3 N(o) = max(
0cdfγS (o)minusmicroγ
1minusmicroγ
)(Gamma Scaling)
Where cdfγS (o) = P (k S(o) θ) P is the regularized Gamma function Suited for low dimensional data
Chawla and Chandola Anomaly Detection
Introduction Data Mining Methods Density-based anomaly Commute Time Approach Addressing Scalability Anomalies in Complex Data Evaluating Anomaly Detection Methods Applications Problem solutions
Generating Labeled Data for Validation
Generating Both Normal and Anomalous Data
Use generative models for normal and anomalous behavior
Several generators available Multivariate continuous data [27] Multivariate categorical data [5] Discrete sequences using HMM [12]
Drawbacks Might not capture the domain characteristics
Injecting Anomalies - Random Perturbation[30]
Given data point z = xy x and y arepartitions of feature space
Take a random sample D of the entire data set
Let zprime = xprimeyprime isin D such that distancebetween y and yprime is maximum
Replace x with xprime and add z back to data setx
yz
zprime
Injected anomaly
Chawla and Chandola Anomaly Detection
Introduction Data Mining Methods Density-based anomaly Commute Time Approach Addressing Scalability Anomalies in Complex Data Evaluating Anomaly Detection Methods Applications Problem solutionsWhat is Network Anomaly Detection Motivation How Much Serious
Applications Overview
How to set up an anomaly detection solution for agiven application domain
Available data Define anomalies define normal behavior Identify requirements and constraints (online
real-time limited resources) What domain knowledge available
Feature identification Defining normal and anomalous behavior Tuning parameters
Available ground truth (training validation)
Chawla and Chandola Anomaly Detection
Introduction Data Mining Methods Density-based anomaly Commute Time Approach Addressing Scalability Anomalies in Complex Data Evaluating Anomaly Detection Methods Applications Problem solutionsWhat is Network Anomaly Detection Motivation How Much Serious
What is Network Anomaly Detection
Anomaly Detection or Intrusion Detection
Traditional Intrusion Detection Systems (IDS) finding attackscorresponding to predefined pattern data set known as signaturestherefore system is absolutely vulnerable against zero-day attacks
Network Anomaly Detection Systems (NADS) to detectzero-day attacks without any pre-identified signature besides profilenormal behavior of the network and address suspected incidents
Network Anomaly Detection finding unusual and largechanges in the network traffic
Examples intentional attacks (eg Distributed Denial ofService - DDoS) or unusual network traffic (eg flash crowds)
Chawla and Chandola Anomaly Detection
Introduction Data Mining Methods Density-based anomaly Commute Time Approach Addressing Scalability Anomalies in Complex Data Evaluating Anomaly Detection Methods Applications Problem solutionsWhat is Network Anomaly Detection Motivation How Much Serious
Motivation How Much Serious
According to Symantec report released in early 2011 morethan 286 million new threats have been detected in 2010which is a huge number
1656227
2704836
1000000
1500000
2000000
2500000
3000000
20547 18827 69107 113025 140690
624267
1656227
2704836
0
500000
1000000
1500000
2000000
2500000
3000000
2002 2003 2004 2005 2006 2007 2008 July2009-June2010
Chawla and Chandola Anomaly Detection
Introduction Data Mining Methods Density-based anomaly Commute Time Approach Addressing Scalability Anomalies in Complex Data Evaluating Anomaly Detection Methods Applications Problem solutionsNetwork Topology Network Anomalies Detection Problem Network Anomalies Detection Problem Why care about OD Flows
Network Topology
A Typical network
1 y
Router
2
3
41t
x2t
x1t
x3t
x4t
Origin-Destination (OD) flow is the traffic that enters at anorigin node and exits at a destination node of a backbonenetwork x1t x1t
Link measurement is the traffic enters at an node during aninterval y1t
Relationship between link traffic and OD flow traffic iscaptured by the routing matrix A
Chawla and Chandola Anomaly Detection
Introduction Data Mining Methods Density-based anomaly Commute Time Approach Addressing Scalability Anomalies in Complex Data Evaluating Anomaly Detection Methods Applications Problem solutionsNetwork Topology Network Anomalies Detection Problem Network Anomalies Detection Problem Why care about OD Flows
Network Anomalies Detection Problem
Chawla and Chandola Anomaly Detection
Introduction Data Mining Methods Density-based anomaly Commute Time Approach Addressing Scalability Anomalies in Complex Data Evaluating Anomaly Detection Methods Applications Problem solutionsNetwork Topology Network Anomalies Detection Problem Network Anomalies Detection Problem Why care about OD Flows
Network Anomalies Detection Problem
Chawla and Chandola Anomaly Detection
Introduction Data Mining Methods Density-based anomaly Commute Time Approach Addressing Scalability Anomalies in Complex Data Evaluating Anomaly Detection Methods Applications Problem solutionsNetwork Topology Network Anomalies Detection Problem Network Anomalies Detection Problem Why care about OD Flows
Why care about OD Flows
Volume anomaly typically arises on an OD flow (trafficarriving at one node and destined for another node)
If we only monitor traffic on network links volume arisingfrom an OD flow may not be noticeable Thus naiveapproach wont work if OD flow info is not available
Figure source [22]
Chawla and Chandola Anomaly Detection
Introduction Data Mining Methods Density-based anomaly Commute Time Approach Addressing Scalability Anomalies in Complex Data Evaluating Anomaly Detection Methods Applications Problem solutionsPCA and Subspace Method Subspace Method Algorithm Subspace Analysis Results Discussion Typical Characteristics of Anomaly Limitation of Volume Entropy Based versus Volume Based Fraud Detection Epidemeology Anomaly Detection in Climate and Weather Anomalies in Climate Validation of Anomalies
PCA and Subspace Method
Chawla and Chandola Anomaly Detection
Introduction Data Mining Methods Density-based anomaly Commute Time Approach Addressing Scalability Anomalies in Complex Data Evaluating Anomaly Detection Methods Applications Problem solutionsPCA and Subspace Method Subspace Method Algorithm Subspace Analysis Results Discussion Typical Characteristics of Anomaly Limitation of Volume Entropy Based versus Volume Based Fraud Detection Epidemeology Anomaly Detection in Climate and Weather Anomalies in Climate Validation of Anomalies
Subspace Method Algorithm
Step1- Determine the PCs based on eigenvaluedecomposition of the covariance matrix of the dataset
Step2- Choose first top k principle components with thehighest eigenvalues as matrix P
Step3-normal traffic subspace called Z
Z = PP TZ = CZ
Step4-abnormal traffic subspace called Z
Z = (I minus PP T )Z = CZ
Step5-If the norm of a vector is large then it is an rdquoanomalyrdquo
Chawla and Chandola Anomaly Detection
Introduction Data Mining Methods Density-based anomaly Commute Time Approach Addressing Scalability Anomalies in Complex Data Evaluating Anomaly Detection Methods Applications Problem solutionsPCA and Subspace Method Subspace Method Algorithm Subspace Analysis Results Discussion Typical Characteristics of Anomaly Limitation of Volume Entropy Based versus Volume Based Fraud Detection Epidemeology Anomaly Detection in Climate and Weather Anomalies in Climate Validation of Anomalies
Subspace Analysis Results
Note that during anomaly normal component does not changethat much while residual component changes quite a lot
Thus anomalies can be detected by setting some threshold
Figure source [22]
Chawla and Chandola Anomaly Detection
Introduction Data Mining Methods Density-based anomaly Commute Time Approach Addressing Scalability Anomalies in Complex Data Evaluating Anomaly Detection Methods Applications Problem solutionsPCA and Subspace Method Subspace Method Algorithm Subspace Analysis Results Discussion Typical Characteristics of Anomaly Limitation of Volume Entropy Based versus Volume Based Fraud Detection Epidemeology Anomaly Detection in Climate and Weather Anomalies in Climate Validation of Anomalies
Discussion Typical Characteristics of Anomaly
Most Anomalies induce a change in distributionalaspects of packet header fields (called features)
Most important features include 5-tuple Source ampdestination IP addresses Source and destination portnumbers and IP protocol
raquo DOS attack ndash multiple source IP address concentrated on asingle destination IP address
raquo Network scan ndash dispersed distribution of destination addresses
raquo Most wormsviruses also induce some change in distribution ofcertain features
raquo However these changes can be very subtle and mining them islike searching for needles in a haystack
Unlike many previous approach this paper aims todetect events which disturb the distribution of trafficfeatures rather than traffic volume
Chawla and Chandola Anomaly Detection
Introduction Data Mining Methods Density-based anomaly Commute Time Approach Addressing Scalability Anomalies in Complex Data Evaluating Anomaly Detection Methods Applications Problem solutionsPCA and Subspace Method Subspace Method Algorithm Subspace Analysis Results Discussion Typical Characteristics of Anomaly Limitation of Volume Entropy Based versus Volume Based Fraud Detection Epidemeology Anomaly Detection in Climate and Weather Anomalies in Climate Validation of Anomalies
Limitation of Volume
Figure source [22]
Port scan anomaly (traffic feature changes however traffic volume
remains more or less the same)
We can use entropy tocapture the variationsin the traffic feature
bullTakes value 0 when distribution is maximally concentratedbullTakes value log2N when distribution is maximally dispersed
But stands out in
feature entropy
which also reveals
its structure
Port scan
dwarfed
in volume
metricshellip
Chawla and Chandola Anomaly Detection
Introduction Data Mining Methods Density-based anomaly Commute Time Approach Addressing Scalability Anomalies in Complex Data Evaluating Anomaly Detection Methods Applications Problem solutionsPCA and Subspace Method Subspace Method Algorithm Subspace Analysis Results Discussion Typical Characteristics of Anomaly Limitation of Volume Entropy Based versus Volume Based Fraud Detection Epidemeology Anomaly Detection in Climate and Weather Anomalies in Climate Validation of Anomalies
Entropy Based versus Volume Based
DoSDDoS Attacks- a spike in traffic data toward adominant destination IP
Scan anomaly-a spike in traffic data from a dominant sourceIP
Flash Crowd anomaly- again a spike in traffic data to adominant destination IP
Worm anomaly-a Spike in traffic with a dominant port
Chawla and Chandola Anomaly Detection
Introduction Data Mining Methods Density-based anomaly Commute Time Approach Addressing Scalability Anomalies in Complex Data Evaluating Anomaly Detection Methods Applications Problem solutionsPCA and Subspace Method Subspace Method Algorithm Subspace Analysis Results Discussion Typical Characteristics of Anomaly Limitation of Volume Entropy Based versus Volume Based Fraud Detection Epidemeology Anomaly Detection in Climate and Weather Anomalies in Climate Validation of Anomalies
Fraud Detection
Domain Question Identifyfraudulent activities or players fromobserved transaction data
Data Transactions between different
players in the system Meta information about the
individuals An underlying graph structure
Challenges Track and model human behavior Anomalies caused by adaptive
human adversaries Massive data sizes
Insurance (autohealtha)
ClaimantProvider Payer
Telecommunications Customer
Provider
Credit Cards Customer
Supplier Bank
Web Advertising User Advertiser
Publisher
ahttpwwwcheatingculturecompast-cases-of-medicare-fraud
Chawla and Chandola Anomaly Detection
Introduction Data Mining Methods Density-based anomaly Commute Time Approach Addressing Scalability Anomalies in Complex Data Evaluating Anomaly Detection Methods Applications Problem solutionsPCA and Subspace Method Subspace Method Algorithm Subspace Analysis Results Discussion Typical Characteristics of Anomaly Limitation of Volume Entropy Based versus Volume Based Fraud Detection Epidemeology Anomaly Detection in Climate and Weather Anomalies in Climate Validation of Anomalies
A Generic Fraud Detection Method
Activity Monitoring [13]1 Build profiles for individuals (customers users etc) based on
historic data User X makes n calls on an average in January
2 Compare current behavior with historical profile for significantdeviations
Clustering based [4]1 Cluster historical profiles of customers2 Identify small clusters or outlying profiles as anomalies
Strengths Anomaly detection is fast (good for real time) Results are easy to explain
Weaknesses Need to create and maintain a large number of profiles Not dynamic Adequate historical data might not be available Too many false positives
Chawla and Chandola Anomaly Detection
Introduction Data Mining Methods Density-based anomaly Commute Time Approach Addressing Scalability Anomalies in Complex Data Evaluating Anomaly Detection Methods Applications Problem solutionsPCA and Subspace Method Subspace Method Algorithm Subspace Analysis Results Discussion Typical Characteristics of Anomaly Limitation of Volume Entropy Based versus Volume Based Fraud Detection Epidemeology Anomaly Detection in Climate and Weather Anomalies in Climate Validation of Anomalies
Exploiting Graph Structure - Weighted Graphs
Represent data as a weighted graph Communication networks (phone email SMS) Provider referral networks
Objective Identify anomalous nodes
For each node extract several features based on the propertiesof the induced sub-graph (egonet) of neighboring nodes [1]
Choose features that can highlight anomalous nodes
1 Ni degree of node2 Ei number of edges in egonet3 Wi total weight of egonet4 λi principal eigen vector of weighted adjacency matrix of
egonet
Data is transformed into a point in a multi-dimensional space
Chawla and Chandola Anomaly Detection
Introduction Data Mining Methods Density-based anomaly Commute Time Approach Addressing Scalability Anomalies in Complex Data Evaluating Anomaly Detection Methods Applications Problem solutionsPCA and Subspace Method Subspace Method Algorithm Subspace Analysis Results Discussion Typical Characteristics of Anomaly Limitation of Volume Entropy Based versus Volume Based Fraud Detection Epidemeology Anomaly Detection in Climate and Weather Anomalies in Climate Validation of Anomalies
Identifying Anomalies
Traditional anomaly detection (lof) Can be slow but can identify any type of anomalous structure
Faster method to identify specific types of anomalousstructures
Identify relevant feature pairs and power law relationship
Eg Egonet Density Power Law Ni vs Ei - detect nearcliques and stars
Ei prop Nαi 1 le α le 2
Anomaly score for node i wrt a pair of features (y = Cxθ)
Si =max(yi Cx
θi )
min(yi Cxθi )lowast log (|yi minus Cxθi |+ 1)
Chawla and Chandola Anomaly Detection
Introduction Data Mining Methods Density-based anomaly Commute Time Approach Addressing Scalability Anomalies in Complex Data Evaluating Anomaly Detection Methods Applications Problem solutionsPCA and Subspace Method Subspace Method Algorithm Subspace Analysis Results Discussion Typical Characteristics of Anomaly Limitation of Volume Entropy Based versus Volume Based Fraud Detection Epidemeology Anomaly Detection in Climate and Weather Anomalies in Climate Validation of Anomalies
Exploiting Graph Structure - Bipartite Graphs
Represent data as a bipartite graph Healthcare Data (Beneficiaries vs Providers) Insider trading (Traders vs Stocks)
Objective Identify anomalous links
Given a query node a isin V1 find the ldquorelevancerdquoof all other nodes in V1 to a
RelevanceScore(a b) prop Number of times aldquorandom walkrdquo from a reaches b
Use the relevance scores to compute thenormality scores for a node t isin V2
Find set St = a|〈a t〉 isin E Compute |St| times |St| similarity matrix using
relevance vectors for a isin St Normality Score = mean of non-diagonal entries
of similarity matrix
V1 E V2a1
a2
a3
an
t1
t2
t3
tn
Chawla and Chandola Anomaly Detection
Introduction Data Mining Methods Density-based anomaly Commute Time Approach Addressing Scalability Anomalies in Complex Data Evaluating Anomaly Detection Methods Applications Problem solutionsPCA and Subspace Method Subspace Method Algorithm Subspace Analysis Results Discussion Typical Characteristics of Anomaly Limitation of Volume Entropy Based versus Volume Based Fraud Detection Epidemeology Anomaly Detection in Climate and Weather Anomalies in Climate Validation of Anomalies
Detecting Disease Outbreaks
Domain Question Early detection of disease
outbreaks Anthrax attack
Data Emergency department visits Grocery data (Example [14]) Clinical visits Weatherclimate data
Challenges Weak signals in the data
ED cases involving cough rArrFlu or SARS
Integration of multiple signals(lag analysis)
Account for spatial and temporalcorrelations
Chawla and Chandola Anomaly Detection
Introduction Data Mining Methods Density-based anomaly Commute Time Approach Addressing Scalability Anomalies in Complex Data Evaluating Anomaly Detection Methods Applications Problem solutionsPCA and Subspace Method Subspace Method Algorithm Subspace Analysis Results Discussion Typical Characteristics of Anomaly Limitation of Volume Entropy Based versus Volume Based Fraud Detection Epidemeology Anomaly Detection in Climate and Weather Anomalies in Climate Validation of Anomalies
Whatrsquos Significant About Recent Events (WSARE) [33]
1 Learn Bayesian network from historical data Environmental and response variables
2 Sample from the BN (DBbaseline|Current Environment)3 Compute contingency table for rules for DBbaseline andDBcurrent
Rules are single assignment rules (Xi = Y ji ) or conjunctions4 Find p-value for rules using χ2-test
Null Hypothesis Rows and columns of tables for DBbaselineand DBcurrent are independent
5 Find rule with largest p-value Repeat Step 2
Chawla and Chandola Anomaly Detection
Introduction Data Mining Methods Density-based anomaly Commute Time Approach Addressing Scalability Anomalies in Complex Data Evaluating Anomaly Detection Methods Applications Problem solutionsPCA and Subspace Method Subspace Method Algorithm Subspace Analysis Results Discussion Typical Characteristics of Anomaly Limitation of Volume Entropy Based versus Volume Based Fraud Detection Epidemeology Anomaly Detection in Climate and Weather Anomalies in Climate Validation of Anomalies
Incorporating Spatial and Temporal Relationships
WSARE does not explicitly model the spatial and temporalrelationships
What happened yesterday What happened in the adjoining neighborhood (yesterday)
Bayesian Network Spatio-Temporal (BNST) modelingframework [17]
Add nodes for temporal and spatial dependencies Need more data to train
Chawla and Chandola Anomaly Detection
Introduction Data Mining Methods Density-based anomaly Commute Time Approach Addressing Scalability Anomalies in Complex Data Evaluating Anomaly Detection Methods Applications Problem solutionsPCA and Subspace Method Subspace Method Algorithm Subspace Analysis Results Discussion Typical Characteristics of Anomaly Limitation of Volume Entropy Based versus Volume Based Fraud Detection Epidemeology Anomaly Detection in Climate and Weather Anomalies in Climate Validation of Anomalies
Anomaly Detection in Climate and Weather
Science Questions Identify natural and anthropogenic disasters Identify long time scale events - droughts atmospheric rivers
cold fronts etc
Data Ground observations Remote sensing data (satellites
air-borne) Climate model simulation outputs Multiple variables spatio-temporal (often has height dimension
as well)
Challenges Model spatio-temporal relationships across multiple variables Explain the cause of anomalies Massive data sizes
Climate and weather extreme events are well defined
Key challenge is to find significant events and explain the cause
Chawla and Chandola Anomaly Detection
Introduction Data Mining Methods Density-based anomaly Commute Time Approach Addressing Scalability Anomalies in Complex Data Evaluating Anomaly Detection Methods Applications Problem solutionsPCA and Subspace Method Subspace Method Algorithm Subspace Analysis Results Discussion Typical Characteristics of Anomaly Limitation of Volume Entropy Based versus Volume Based Fraud Detection Epidemeology Anomaly Detection in Climate and Weather Anomalies in Climate Validation of Anomalies
Anomalies are Widely Used in Climate
Most analysis done on ldquoanomalyrdquo time series
Difference from a ldquobase periodrdquo (Toosimplistic)
Brings spatial smoothness (eg a mountaintop and nearby valley can have very differenttemperatures) Removes seasonality
Understand climate and weatherphenomenon
Southern Oscillation Index (SOI) Difference between Sea Level Pressure
(SLP) anomalies for Tahiti and DarwinAustralia
Figure Global AverageTemperature Anomaly(1975 - 2007) Srcwwwmetofficegovuk
Chawla and Chandola Anomaly Detection
Introduction Data Mining Methods Density-based anomaly Commute Time Approach Addressing Scalability Anomalies in Complex Data Evaluating Anomaly Detection Methods Applications Problem solutionsPCA and Subspace Method Subspace Method Algorithm Subspace Analysis Results Discussion Typical Characteristics of Anomaly Limitation of Volume Entropy Based versus Volume Based Fraud Detection Epidemeology Anomaly Detection in Climate and Weather Anomalies in Climate Validation of Anomalies
Constructing Anomalies from Raw Data
Anomaly time series for a given location i
vprimei = vi minus bi
where bi is the base (reference)
How to choose bi Mean of all data for location i Monthly mean values (account for seasonality) Monthly z-score values Median (more robust) Using a shorter ldquoreference periodrdquo
30 year moving window
Different methods show statistically significant differences[19] What is the right strategy Weighted mean of different strategies (Pick weights using
Monte Carlo sampling)
Chawla and Chandola Anomaly Detection
Introduction Data Mining Methods Density-based anomaly Commute Time Approach Addressing Scalability Anomalies in Complex Data Evaluating Anomaly Detection Methods Applications Problem solutionsPCA and Subspace Method Subspace Method Algorithm Subspace Analysis Results Discussion Typical Characteristics of Anomaly Limitation of Volume Entropy Based versus Volume Based Fraud Detection Epidemeology Anomaly Detection in Climate and Weather Anomalies in Climate Validation of Anomalies
Anomaly Detection for Identifying Droughts
Science question Identify significant drought patterns usinghistorical observation data or future simulation data or both
Find persistent spatiotemporal anomalies in precipitation data
A two step approach
1 Find precipitationanomalies usingthresholds
2 Find large connectedcomponents across spaceand time
Matlab - bwlabelbwlabeln
Followup Science questionExplain cause
(drought190120061avi)
Figure Video courtsey Dr ArindamBanerjee
Chawla and Chandola Anomaly Detection
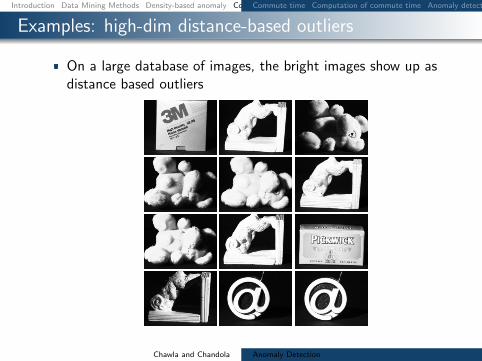
Introduction Data Mining Methods Density-based anomaly Commute Time Approach Addressing Scalability Anomalies in Complex Data Evaluating Anomaly Detection Methods Applications Problem solutionsCommute time Computation of commute time Anomaly detection using commute time (CDOF) Fast estimation of commute time Scalability for Density-based method PINN Algorithm (ICDM 2010) PINN Guarantee Examples high-dim distance-based outliers Examples high-dim density-based outliers Examples local density-based outliers
Examples high-dim distance-based outliers
On a large database of images the bright images show up asdistance based outliers
Chawla and Chandola Anomaly Detection
Introduction Data Mining Methods Density-based anomaly Commute Time Approach Addressing Scalability Anomalies in Complex Data Evaluating Anomaly Detection Methods Applications Problem solutionsCommute time Computation of commute time Anomaly detection using commute time (CDOF) Fast estimation of commute time Scalability for Density-based method PINN Algorithm (ICDM 2010) PINN Guarantee Examples high-dim distance-based outliers Examples high-dim density-based outliers Examples local density-based outliers
Examples high-dim density-based outliers
On a large database of images occluded images show up asdensity based outliers
Chawla and Chandola Anomaly Detection
Introduction Data Mining Methods Density-based anomaly Commute Time Approach Addressing Scalability Anomalies in Complex Data Evaluating Anomaly Detection Methods Applications Problem solutionsCommute time Computation of commute time Anomaly detection using commute time (CDOF) Fast estimation of commute time Scalability for Density-based method PINN Algorithm (ICDM 2010) PINN Guarantee Examples high-dim distance-based outliers Examples high-dim density-based outliers Examples local density-based outliers
Examples local density-based outliers
Examples of images ranked by LOF
Chawla and Chandola Anomaly Detection
Introduction Data Mining Methods Density-based anomaly Commute Time Approach Addressing Scalability Anomalies in Complex Data Evaluating Anomaly Detection Methods Applications Problem solutions
Addressing Scalability
Chawla and Chandola Anomaly Detection
Introduction Data Mining Methods Density-based anomaly Commute Time Approach Addressing Scalability Anomalies in Complex Data Evaluating Anomaly Detection Methods Applications Problem solutions
Using GPUs for Anomaly Detection
Well suited for data parallel algorithms Using CUDA - Compute Unified Device
Architecture (Nvidia)
Need to re-engineer existing algorithms Utilization of device memory Minimize CPUhArrGPU transfer of data Keep threads homogeneous
Most model based algorithms arenaturally setup for the testing phase
Model building needs careful redesign
What about unsupervised algorithms
Kernel
Host
Grid
Device
Block(00)
Block(01)
Block(02)
Block(10)
Block(11)
Block(12)
Thread Block
Thread(00)
Thread(01)
Thread(02)
Thread(03)
Thread(10)
Thread(11)
Thread(12)
Thread(13)
Thread(20)
Thread(21)
Thread(22)
Thread(23)
Host Host Memory
SM 2
SM 1
SM 0
Registers Registers Registers
SP 0 SP 1 SP 7
Shared Memory
Global Memory
Texture Memory
Constant Memory
Device
Chawla and Chandola Anomaly Detection
Introduction Data Mining Methods Density-based anomaly Commute Time Approach Addressing Scalability Anomalies in Complex Data Evaluating Anomaly Detection Methods Applications Problem solutions
Implementing DB(kN) on GPUs
Return top N data instances whose distances tok-th nearest neighbor are largest (SerialDB(kN) is O(n2))
Involves computing pairwise distances
Load block i and block j to shared memory Data layout in memory should be optimized
Each thread computes distance between a pairof instances
Can utilize this time to load next chunk of datafrom host to device memory
Writes results to corresponding output block
Sorting can be done efficiently in CUDA [29]
d
n
T
n
n
Chawla and Chandola Anomaly Detection
Introduction Data Mining Methods Density-based anomaly Commute Time Approach Addressing Scalability Anomalies in Complex Data Evaluating Anomaly Detection Methods Applications Problem solutionsCategorical Data Discrete Sequences and Time Series Contextual Anomalies Collective Anomalies
Moving Beyond Multi-dimensional Record Data
Categorical (Mixed)
Fraud Detection
Cyber Networks
Time Series
Sensor Networks
Healthcare
Discrete Sequences
Genomic
System Calls
Spatial
GIS
Image analysis
Spatio-temporal
Remote sensing
Climate
Graphs
Social networks
Epidemiology
Chawla and Chandola Anomaly Detection
Introduction Data Mining Methods Density-based anomaly Commute Time Approach Addressing Scalability Anomalies in Complex Data Evaluating Anomaly Detection Methods Applications Problem solutionsCategorical Data Discrete Sequences and Time Series Contextual Anomalies Collective Anomalies
Handling Categorical Data
Each attribute can belong to one of many categories
No ordering between categories
Mixed data (categorical and continuous attributes)
cap-shape cap-surface middot middot middot habitat type
convex smooth urban poisonousconvex smooth grasses ediblebell smooth meadows edibleconvex scaly urban poisonousconvex smooth grasses ediblemiddot middot middot
Table Mushroom Data Set [2]
Chawla and Chandola Anomaly Detection
Introduction Data Mining Methods Density-based anomaly Commute Time Approach Addressing Scalability Anomalies in Complex Data Evaluating Anomaly Detection Methods Applications Problem solutionsCategorical Data Discrete Sequences and Time Series Contextual Anomalies Collective Anomalies
Approaches to Identify Categorical Anomalies
Using Association Analysis [24]
Binarize data
Learn rules (X rArr Y ) Choose high confidence
rules (P (Y |X))
For test record Z = 〈XY 〉find rules of the formP (Y |X)
Y is not observed whenX is observed
Using Bayesian Networks [33]
Learn Bayesian networkstructure and parameters
Compute P (Z) for test datarecord Z
Flag anomaly if P (Z) lt δ
Using Similarity Metrics [10]
Use a similarity measure (S(X1 X2))
Apply distancedensityclustering based method (eg lof)
Chawla and Chandola Anomaly Detection
Introduction Data Mining Methods Density-based anomaly Commute Time Approach Addressing Scalability Anomalies in Complex Data Evaluating Anomaly Detection Methods Applications Problem solutionsCategorical Data Discrete Sequences and Time Series Contextual Anomalies Collective Anomalies
Conditional Probability Test [18]
Identify unusual combinations of attribute values
r(at bt) =P (at bt)
P (at)P (bt)
A capB = φ Assumption If r(at bt) is low and is observed in test record t
then t is anomalous For a test record t
For each mutually exclusive pair of attribute sets ABcompute r(at bt)
Score t based on all r-values Assign minimum r-value as score Take product of all r-values
Need to compare exponential pairs of subsets Only consider subsets upto size k Ignore subsets with frequency less than a threshold α Avoid comparing independent subsets of attributes
micro(AB) ge βmicroChawla and Chandola Anomaly Detection
Introduction Data Mining Methods Density-based anomaly Commute Time Approach Addressing Scalability Anomalies in Complex Data Evaluating Anomaly Detection Methods Applications Problem solutionsCategorical Data Discrete Sequences and Time Series Contextual Anomalies Collective Anomalies
Estimating Probabilities for CPT [18]
Maximum LikelihoodEstimation
P (at bt)
P (at)P (bt)=C(at bt)
Ntimes N
C(at)times N
C(bt)
C(at) Number of traininginstances with A = at
N Total number of traininginstances
Laplace Smoothing
E(p) =C(p) + 1
N + 2
r(at bt) =E(at bt)
E(at)times E(bt)
Speedup Tricks
Replace rare attributevalues with genericattribute (reduce arity)
Use efficient datastructure to querying forcounts(AD Trees [26])
ADTrees work fasterfor low arity attributes
Chawla and Chandola Anomaly Detection
Introduction Data Mining Methods Density-based anomaly Commute Time Approach Addressing Scalability Anomalies in Complex Data Evaluating Anomaly Detection Methods Applications Problem solutionsCategorical Data Discrete Sequences and Time Series Contextual Anomalies Collective Anomalies
Finding Anomalies in Discrete Sequences
Many problem formulations
1 Anomalous symbols in asequence
2 Anomalous subsequence in asequence
3 Anomalous sequence in adatabase of sequences
See [11] for a comparativeevaluation [9] for a survey
login pwdmail ssh mail web logoutlogin pwdmail web web web web logoutlogin pwdmail ssh mail web web logoutlogin pwdwebmail ssh webmail logoutloginpwd loginpwd loginpwd logout
Chawla and Chandola Anomaly Detection
Introduction Data Mining Methods Density-based anomaly Commute Time Approach Addressing Scalability Anomalies in Complex Data Evaluating Anomaly Detection Methods Applications Problem solutionsCategorical Data Discrete Sequences and Time Series Contextual Anomalies Collective Anomalies
Treating Sequences as Points
Utilize a distancesimilarity measure Plug into a distancedensityclustering based method
Simplest Hamming Distance
h(Ai Bi) = 1 Ai 6= Bi= 0 Ai = Bi
H(AB) =nsumi=1
h(Ai Bi)
Issues Unequal lengths misalignment Normalized Length of Longest Common Subsequence
D(AB) = 1minus |LCS(AB)|radic|A||B|
Standard Dynamic Programming method is slow Faster versions available (Hunt Szymnaski method [7])
Weaknesses Cannot localize anomalies within a sequence Weak anomaly signals might get lost
Chawla and Chandola Anomaly Detection
Introduction Data Mining Methods Density-based anomaly Commute Time Approach Addressing Scalability Anomalies in Complex Data Evaluating Anomaly Detection Methods Applications Problem solutionsCategorical Data Discrete Sequences and Time Series Contextual Anomalies Collective Anomalies
Using Sliding Windows
Slide a window of size k
Extract all windows from a sequence (nminus k + 1)
Training (Creating a normal dictionary) Store all uniquewindows in all normal sequences and their counts
Testing For each window find the frequency in normal dictionary Anomaly score is inverse of the aggregate frequencies for all
windows (normalized by length)
Many variants exist For each window find the hamming distance to the closest
window in the normal dictionary [16]
Issues Penalizes low frequency windows in the normal dictionary Rewards high frequency windows that might not be relevant Can construct anomalous sequences that will escape detection
Chawla and Chandola Anomaly Detection
Introduction Data Mining Methods Density-based anomaly Commute Time Approach Addressing Scalability Anomalies in Complex Data Evaluating Anomaly Detection Methods Applications Problem solutionsCategorical Data Discrete Sequences and Time Series Contextual Anomalies Collective Anomalies
Using Probabilistic Models
Probability of occurrence of sequence S
P (S) =nprodi=1
P (Si|S1 Siminus1)
Short memory property of sequences
P (Si|S1 Siminus1) = P (Si|Siminusk Siminus1)
Conditional probability estimates for a symbol Si
P (Si|Siminusk Siminus1) =f(Si|Siminusk Si)f(Si|Siminusk Siminus1)
f is estimated from the normal dictionary
Anomaly score for a test sequence is inverse of the normalizedprobability of occurrence
Issues What if the suffix occurs very infrequently in thenormal data (or not at all)
Replace with the longest suffix that occurs sufficient number oftimes [32] - Probabilistic Suffix Trees
Significantly reduces the size of the modelChawla and Chandola Anomaly Detection
Introduction Data Mining Methods Density-based anomaly Commute Time Approach Addressing Scalability Anomalies in Complex Data Evaluating Anomaly Detection Methods Applications Problem solutionsCategorical Data Discrete Sequences and Time Series Contextual Anomalies Collective Anomalies
Finding Contextual Anomalies
Sometimes contextual information isavailable about data
Not used directly as a feature Are well understood no anomalies in
the context Can reduce false positives and yield
interesting anomalies
Example adapted from [30]
Clearest Outlier
Conditional Anomaly
Maximum Daily Temperature
Number
ofFever
Cases
Contextual anomalies - Anomalous with respect to a context Context is defined using environmental variables
Spatial (Latitude Longitude) Graph context (Edges Weights) Temporal location Domain specific (Demographic other)
How to incorporate context Reduce to traditional anomaly detection (subset on context) Explicitly model contextual information (time series spatial)
Chawla and Chandola Anomaly Detection
Introduction Data Mining Methods Density-based anomaly Commute Time Approach Addressing Scalability Anomalies in Complex Data Evaluating Anomaly Detection Methods Applications Problem solutionsCategorical Data Discrete Sequences and Time Series Contextual Anomalies Collective Anomalies
Conditional Anomaly Detection
Data instance d rArru1 u2 udU v1 v2 vdV
dU environmentalattributes
dV indicator attributes u1
u2
U1
U2
U3
v1
v2
V1V2
V3
p(V1|U3) = 02
p(V2|U3) = 02
p(V3|U3) = 06
Algorithm [30]
1 Learn a Gaussian Mixture Model (GMM)U = U1 U2 UnU
each with dimensionality dU2 Learn a set of Gaussians U = V1 V2 VnV
each withdimensionality dV
3 Learn a probabilistic mapping function p(Vj |Ui)4 Score a test instance d = [uv]
S =
nUsumi=1
p(u|Ui)nVsumj=1
p(v|Vj)p(Vj |Ui)
Chawla and Chandola Anomaly Detection
Introduction Data Mining Methods Density-based anomaly Commute Time Approach Addressing Scalability Anomalies in Complex Data Evaluating Anomaly Detection Methods Applications Problem solutionsCategorical Data Discrete Sequences and Time Series Contextual Anomalies Collective Anomalies
Finding Collective Anomalies
Find a collection of data points
Each point by itself is normal
The collection as a whole isanomalous
Relevant when data has inherentstructure and
When domain definition ofanomalies cannot be described aspoint anomalies
A Simple Solution
1 Break data intogroups
2 Compute features foreach group
3 Apply traditionalanomaly detection
Examples
1 Time series
2 Image
3 Spatial clusters ofgalaxies
Chawla and Chandola Anomaly Detection
Introduction Data Mining Methods Density-based anomaly Commute Time Approach Addressing Scalability Anomalies in Complex Data Evaluating Anomaly Detection Methods Applications Problem solutionsCategorical Data Discrete Sequences and Time Series Contextual Anomalies Collective Anomalies
Using Latent Dirichlet Allocation for Group Anomalies
Find anomalous groups in data [34]
Example Spatial clusters of galaxies topics red green emissive words continuous features
Flexible Genre Model (FGM)
For each group
1 Draw a genre 1 2 T 3 ym simM(π)2 Draw topic distribution forym SK 3 θm sim Dir(αym)
3 Draw K topicsβmk sim P (βmk|ηk)k=12K
4 For each point in group
1 Draw topic membershipzmn simM(θn)
2 Generate pointxmn isin P (xmn|βmzmn)
α
zmn
xmn
N
θm
T
π
ηK
ym
β
MK
Model Parameters
M(π) -Multinomial
Genre - Dir(αt)
Topic generatorsP (|ηk)- GIW
Point generatorsP (xmn|βnk) -MultivariateGaussian
Chawla and Chandola Anomaly Detection
Introduction Data Mining Methods Density-based anomaly Commute Time Approach Addressing Scalability Anomalies in Complex Data Evaluating Anomaly Detection Methods Applications Problem solutionsCategorical Data Discrete Sequences and Time Series Contextual Anomalies Collective Anomalies
Inference and Testing for FGM
Inference and Learning Parameters
Approximate inference of latentvariables (Gibbs Sampling)
Use samples to learn parameters(Single step Monte Carlo EM)
Topic 1
Topic 2
Topic 3
Anomaly Detection
Infer the topic distribution θm
Compute negative log likelihood wrt αt
Rationale An anomalous group will be unlikely to begenerated from any genre
Geometric interpretation Mapping each group into a Tdimensional space and finding anomalies
Chawla and Chandola Anomaly Detection
Introduction Data Mining Methods Density-based anomaly Commute Time Approach Addressing Scalability Anomalies in Complex Data Evaluating Anomaly Detection Methods Applications Problem solutions
Evaluating Anomaly Detection Methods - Labels
Labeled validation data set exists Confusion matrix Traditional evaluation metrics
Class imbalance
ROC Curve
Validation set does not exist Use domain expertise to find TP
and FP FN is harder to estimate
Pseudo false negativeestimation techniques [25]
Predicteda n
Actuala TP FNn FP TN
Acc =TP + TNsum
Rec (R) =TP
TP + FN
Prec (P ) =TP
TP + FP
F =2 lowastR lowast PR+ P
Chawla and Chandola Anomaly Detection
Introduction Data Mining Methods Density-based anomaly Commute Time Approach Addressing Scalability Anomalies in Complex Data Evaluating Anomaly Detection Methods Applications Problem solutions
Evaluating Anomaly Detection Methods - Scores
Convert to binary output Use threshold δ on score (Scale
issues [21]) Take top x as anomalies
ROC curve by varying x or δ
Quality of output Does the output ldquosuggestrdquo x or δ Which output is better
Chawla and Chandola Anomaly Detection
Introduction Data Mining Methods Density-based anomaly Commute Time Approach Addressing Scalability Anomalies in Complex Data Evaluating Anomaly Detection Methods Applications Problem solutions
Unifying Scores
Different methods assign scores in differentranges
kNN-based scores [0 1] Lof scores [1 6] ABOD scores [0 80000]
Anomalies have lower scores
Direct scaling to [0 1] might lose distinctionbetween normal and anomalies
Desired scaling Stretch interesting rangesand shrink irrelevant ones
Generalized Procedure for Normalizing Outlier Scores [21] Regularity rArr S(o) ge 0forallo S(o) asymp 0 if o is normal andS(o) 0 if o is anomalous
Normality S is regular and S(o) isin [0 1]forallo
Chawla and Chandola Anomaly Detection
Introduction Data Mining Methods Density-based anomaly Commute Time Approach Addressing Scalability Anomalies in Complex Data Evaluating Anomaly Detection Methods Applications Problem solutions
Regularization and Normalization of Scores
Regularization
1 R(o) = max0 S(o)minus baseS2 R(o) = Smax minus S(o)
3 R(o) = minus log SmaxS(o)
Normalization
1 N(o) = S(o)Smax
2 N(o) = max(
0 erf(S(o)minusmicroSσS radic2
))(Gaussian Scaling)
Suited for high dimensional data
3 N(o) = max(
0cdfγS (o)minusmicroγ
1minusmicroγ
)(Gamma Scaling)
Where cdfγS (o) = P (k S(o) θ) P is the regularized Gamma function Suited for low dimensional data
Chawla and Chandola Anomaly Detection
Introduction Data Mining Methods Density-based anomaly Commute Time Approach Addressing Scalability Anomalies in Complex Data Evaluating Anomaly Detection Methods Applications Problem solutions
Generating Labeled Data for Validation
Generating Both Normal and Anomalous Data
Use generative models for normal and anomalous behavior
Several generators available Multivariate continuous data [27] Multivariate categorical data [5] Discrete sequences using HMM [12]
Drawbacks Might not capture the domain characteristics
Injecting Anomalies - Random Perturbation[30]
Given data point z = xy x and y arepartitions of feature space
Take a random sample D of the entire data set
Let zprime = xprimeyprime isin D such that distancebetween y and yprime is maximum
Replace x with xprime and add z back to data setx
yz
zprime
Injected anomaly
Chawla and Chandola Anomaly Detection
Introduction Data Mining Methods Density-based anomaly Commute Time Approach Addressing Scalability Anomalies in Complex Data Evaluating Anomaly Detection Methods Applications Problem solutionsWhat is Network Anomaly Detection Motivation How Much Serious
Applications Overview
How to set up an anomaly detection solution for agiven application domain
Available data Define anomalies define normal behavior Identify requirements and constraints (online
real-time limited resources) What domain knowledge available
Feature identification Defining normal and anomalous behavior Tuning parameters
Available ground truth (training validation)
Chawla and Chandola Anomaly Detection
Introduction Data Mining Methods Density-based anomaly Commute Time Approach Addressing Scalability Anomalies in Complex Data Evaluating Anomaly Detection Methods Applications Problem solutionsWhat is Network Anomaly Detection Motivation How Much Serious
What is Network Anomaly Detection
Anomaly Detection or Intrusion Detection
Traditional Intrusion Detection Systems (IDS) finding attackscorresponding to predefined pattern data set known as signaturestherefore system is absolutely vulnerable against zero-day attacks
Network Anomaly Detection Systems (NADS) to detectzero-day attacks without any pre-identified signature besides profilenormal behavior of the network and address suspected incidents
Network Anomaly Detection finding unusual and largechanges in the network traffic
Examples intentional attacks (eg Distributed Denial ofService - DDoS) or unusual network traffic (eg flash crowds)
Chawla and Chandola Anomaly Detection
Introduction Data Mining Methods Density-based anomaly Commute Time Approach Addressing Scalability Anomalies in Complex Data Evaluating Anomaly Detection Methods Applications Problem solutionsWhat is Network Anomaly Detection Motivation How Much Serious
Motivation How Much Serious
According to Symantec report released in early 2011 morethan 286 million new threats have been detected in 2010which is a huge number
1656227
2704836
1000000
1500000
2000000
2500000
3000000
20547 18827 69107 113025 140690
624267
1656227
2704836
0
500000
1000000
1500000
2000000
2500000
3000000
2002 2003 2004 2005 2006 2007 2008 July2009-June2010
Chawla and Chandola Anomaly Detection
Introduction Data Mining Methods Density-based anomaly Commute Time Approach Addressing Scalability Anomalies in Complex Data Evaluating Anomaly Detection Methods Applications Problem solutionsNetwork Topology Network Anomalies Detection Problem Network Anomalies Detection Problem Why care about OD Flows
Network Topology
A Typical network
1 y
Router
2
3
41t
x2t
x1t
x3t
x4t
Origin-Destination (OD) flow is the traffic that enters at anorigin node and exits at a destination node of a backbonenetwork x1t x1t
Link measurement is the traffic enters at an node during aninterval y1t
Relationship between link traffic and OD flow traffic iscaptured by the routing matrix A
Chawla and Chandola Anomaly Detection
Introduction Data Mining Methods Density-based anomaly Commute Time Approach Addressing Scalability Anomalies in Complex Data Evaluating Anomaly Detection Methods Applications Problem solutionsNetwork Topology Network Anomalies Detection Problem Network Anomalies Detection Problem Why care about OD Flows
Network Anomalies Detection Problem
Chawla and Chandola Anomaly Detection
Introduction Data Mining Methods Density-based anomaly Commute Time Approach Addressing Scalability Anomalies in Complex Data Evaluating Anomaly Detection Methods Applications Problem solutionsNetwork Topology Network Anomalies Detection Problem Network Anomalies Detection Problem Why care about OD Flows
Network Anomalies Detection Problem
Chawla and Chandola Anomaly Detection
Introduction Data Mining Methods Density-based anomaly Commute Time Approach Addressing Scalability Anomalies in Complex Data Evaluating Anomaly Detection Methods Applications Problem solutionsNetwork Topology Network Anomalies Detection Problem Network Anomalies Detection Problem Why care about OD Flows
Why care about OD Flows
Volume anomaly typically arises on an OD flow (trafficarriving at one node and destined for another node)
If we only monitor traffic on network links volume arisingfrom an OD flow may not be noticeable Thus naiveapproach wont work if OD flow info is not available
Figure source [22]
Chawla and Chandola Anomaly Detection
Introduction Data Mining Methods Density-based anomaly Commute Time Approach Addressing Scalability Anomalies in Complex Data Evaluating Anomaly Detection Methods Applications Problem solutionsPCA and Subspace Method Subspace Method Algorithm Subspace Analysis Results Discussion Typical Characteristics of Anomaly Limitation of Volume Entropy Based versus Volume Based Fraud Detection Epidemeology Anomaly Detection in Climate and Weather Anomalies in Climate Validation of Anomalies
PCA and Subspace Method
Chawla and Chandola Anomaly Detection
Introduction Data Mining Methods Density-based anomaly Commute Time Approach Addressing Scalability Anomalies in Complex Data Evaluating Anomaly Detection Methods Applications Problem solutionsPCA and Subspace Method Subspace Method Algorithm Subspace Analysis Results Discussion Typical Characteristics of Anomaly Limitation of Volume Entropy Based versus Volume Based Fraud Detection Epidemeology Anomaly Detection in Climate and Weather Anomalies in Climate Validation of Anomalies
Subspace Method Algorithm
Step1- Determine the PCs based on eigenvaluedecomposition of the covariance matrix of the dataset
Step2- Choose first top k principle components with thehighest eigenvalues as matrix P
Step3-normal traffic subspace called Z
Z = PP TZ = CZ
Step4-abnormal traffic subspace called Z
Z = (I minus PP T )Z = CZ
Step5-If the norm of a vector is large then it is an rdquoanomalyrdquo
Chawla and Chandola Anomaly Detection
Introduction Data Mining Methods Density-based anomaly Commute Time Approach Addressing Scalability Anomalies in Complex Data Evaluating Anomaly Detection Methods Applications Problem solutionsPCA and Subspace Method Subspace Method Algorithm Subspace Analysis Results Discussion Typical Characteristics of Anomaly Limitation of Volume Entropy Based versus Volume Based Fraud Detection Epidemeology Anomaly Detection in Climate and Weather Anomalies in Climate Validation of Anomalies
Subspace Analysis Results
Note that during anomaly normal component does not changethat much while residual component changes quite a lot
Thus anomalies can be detected by setting some threshold
Figure source [22]
Chawla and Chandola Anomaly Detection
Introduction Data Mining Methods Density-based anomaly Commute Time Approach Addressing Scalability Anomalies in Complex Data Evaluating Anomaly Detection Methods Applications Problem solutionsPCA and Subspace Method Subspace Method Algorithm Subspace Analysis Results Discussion Typical Characteristics of Anomaly Limitation of Volume Entropy Based versus Volume Based Fraud Detection Epidemeology Anomaly Detection in Climate and Weather Anomalies in Climate Validation of Anomalies
Discussion Typical Characteristics of Anomaly
Most Anomalies induce a change in distributionalaspects of packet header fields (called features)
Most important features include 5-tuple Source ampdestination IP addresses Source and destination portnumbers and IP protocol
raquo DOS attack ndash multiple source IP address concentrated on asingle destination IP address
raquo Network scan ndash dispersed distribution of destination addresses
raquo Most wormsviruses also induce some change in distribution ofcertain features
raquo However these changes can be very subtle and mining them islike searching for needles in a haystack
Unlike many previous approach this paper aims todetect events which disturb the distribution of trafficfeatures rather than traffic volume
Chawla and Chandola Anomaly Detection
Introduction Data Mining Methods Density-based anomaly Commute Time Approach Addressing Scalability Anomalies in Complex Data Evaluating Anomaly Detection Methods Applications Problem solutionsPCA and Subspace Method Subspace Method Algorithm Subspace Analysis Results Discussion Typical Characteristics of Anomaly Limitation of Volume Entropy Based versus Volume Based Fraud Detection Epidemeology Anomaly Detection in Climate and Weather Anomalies in Climate Validation of Anomalies
Limitation of Volume
Figure source [22]
Port scan anomaly (traffic feature changes however traffic volume
remains more or less the same)
We can use entropy tocapture the variationsin the traffic feature
bullTakes value 0 when distribution is maximally concentratedbullTakes value log2N when distribution is maximally dispersed
But stands out in
feature entropy
which also reveals
its structure
Port scan
dwarfed
in volume
metricshellip
Chawla and Chandola Anomaly Detection
Introduction Data Mining Methods Density-based anomaly Commute Time Approach Addressing Scalability Anomalies in Complex Data Evaluating Anomaly Detection Methods Applications Problem solutionsPCA and Subspace Method Subspace Method Algorithm Subspace Analysis Results Discussion Typical Characteristics of Anomaly Limitation of Volume Entropy Based versus Volume Based Fraud Detection Epidemeology Anomaly Detection in Climate and Weather Anomalies in Climate Validation of Anomalies
Entropy Based versus Volume Based
DoSDDoS Attacks- a spike in traffic data toward adominant destination IP
Scan anomaly-a spike in traffic data from a dominant sourceIP
Flash Crowd anomaly- again a spike in traffic data to adominant destination IP
Worm anomaly-a Spike in traffic with a dominant port
Chawla and Chandola Anomaly Detection
Introduction Data Mining Methods Density-based anomaly Commute Time Approach Addressing Scalability Anomalies in Complex Data Evaluating Anomaly Detection Methods Applications Problem solutionsPCA and Subspace Method Subspace Method Algorithm Subspace Analysis Results Discussion Typical Characteristics of Anomaly Limitation of Volume Entropy Based versus Volume Based Fraud Detection Epidemeology Anomaly Detection in Climate and Weather Anomalies in Climate Validation of Anomalies
Fraud Detection
Domain Question Identifyfraudulent activities or players fromobserved transaction data
Data Transactions between different
players in the system Meta information about the
individuals An underlying graph structure
Challenges Track and model human behavior Anomalies caused by adaptive
human adversaries Massive data sizes
Insurance (autohealtha)
ClaimantProvider Payer
Telecommunications Customer
Provider
Credit Cards Customer
Supplier Bank
Web Advertising User Advertiser
Publisher
ahttpwwwcheatingculturecompast-cases-of-medicare-fraud
Chawla and Chandola Anomaly Detection
Introduction Data Mining Methods Density-based anomaly Commute Time Approach Addressing Scalability Anomalies in Complex Data Evaluating Anomaly Detection Methods Applications Problem solutionsPCA and Subspace Method Subspace Method Algorithm Subspace Analysis Results Discussion Typical Characteristics of Anomaly Limitation of Volume Entropy Based versus Volume Based Fraud Detection Epidemeology Anomaly Detection in Climate and Weather Anomalies in Climate Validation of Anomalies
A Generic Fraud Detection Method
Activity Monitoring [13]1 Build profiles for individuals (customers users etc) based on
historic data User X makes n calls on an average in January
2 Compare current behavior with historical profile for significantdeviations
Clustering based [4]1 Cluster historical profiles of customers2 Identify small clusters or outlying profiles as anomalies
Strengths Anomaly detection is fast (good for real time) Results are easy to explain
Weaknesses Need to create and maintain a large number of profiles Not dynamic Adequate historical data might not be available Too many false positives
Chawla and Chandola Anomaly Detection
Introduction Data Mining Methods Density-based anomaly Commute Time Approach Addressing Scalability Anomalies in Complex Data Evaluating Anomaly Detection Methods Applications Problem solutionsPCA and Subspace Method Subspace Method Algorithm Subspace Analysis Results Discussion Typical Characteristics of Anomaly Limitation of Volume Entropy Based versus Volume Based Fraud Detection Epidemeology Anomaly Detection in Climate and Weather Anomalies in Climate Validation of Anomalies
Exploiting Graph Structure - Weighted Graphs
Represent data as a weighted graph Communication networks (phone email SMS) Provider referral networks
Objective Identify anomalous nodes
For each node extract several features based on the propertiesof the induced sub-graph (egonet) of neighboring nodes [1]
Choose features that can highlight anomalous nodes
1 Ni degree of node2 Ei number of edges in egonet3 Wi total weight of egonet4 λi principal eigen vector of weighted adjacency matrix of
egonet
Data is transformed into a point in a multi-dimensional space
Chawla and Chandola Anomaly Detection
Introduction Data Mining Methods Density-based anomaly Commute Time Approach Addressing Scalability Anomalies in Complex Data Evaluating Anomaly Detection Methods Applications Problem solutionsPCA and Subspace Method Subspace Method Algorithm Subspace Analysis Results Discussion Typical Characteristics of Anomaly Limitation of Volume Entropy Based versus Volume Based Fraud Detection Epidemeology Anomaly Detection in Climate and Weather Anomalies in Climate Validation of Anomalies
Identifying Anomalies
Traditional anomaly detection (lof) Can be slow but can identify any type of anomalous structure
Faster method to identify specific types of anomalousstructures
Identify relevant feature pairs and power law relationship
Eg Egonet Density Power Law Ni vs Ei - detect nearcliques and stars
Ei prop Nαi 1 le α le 2
Anomaly score for node i wrt a pair of features (y = Cxθ)
Si =max(yi Cx
θi )
min(yi Cxθi )lowast log (|yi minus Cxθi |+ 1)
Chawla and Chandola Anomaly Detection
Introduction Data Mining Methods Density-based anomaly Commute Time Approach Addressing Scalability Anomalies in Complex Data Evaluating Anomaly Detection Methods Applications Problem solutionsPCA and Subspace Method Subspace Method Algorithm Subspace Analysis Results Discussion Typical Characteristics of Anomaly Limitation of Volume Entropy Based versus Volume Based Fraud Detection Epidemeology Anomaly Detection in Climate and Weather Anomalies in Climate Validation of Anomalies
Exploiting Graph Structure - Bipartite Graphs
Represent data as a bipartite graph Healthcare Data (Beneficiaries vs Providers) Insider trading (Traders vs Stocks)
Objective Identify anomalous links
Given a query node a isin V1 find the ldquorelevancerdquoof all other nodes in V1 to a
RelevanceScore(a b) prop Number of times aldquorandom walkrdquo from a reaches b
Use the relevance scores to compute thenormality scores for a node t isin V2
Find set St = a|〈a t〉 isin E Compute |St| times |St| similarity matrix using
relevance vectors for a isin St Normality Score = mean of non-diagonal entries
of similarity matrix
V1 E V2a1
a2
a3
an
t1
t2
t3
tn
Chawla and Chandola Anomaly Detection
Introduction Data Mining Methods Density-based anomaly Commute Time Approach Addressing Scalability Anomalies in Complex Data Evaluating Anomaly Detection Methods Applications Problem solutionsPCA and Subspace Method Subspace Method Algorithm Subspace Analysis Results Discussion Typical Characteristics of Anomaly Limitation of Volume Entropy Based versus Volume Based Fraud Detection Epidemeology Anomaly Detection in Climate and Weather Anomalies in Climate Validation of Anomalies
Detecting Disease Outbreaks
Domain Question Early detection of disease
outbreaks Anthrax attack
Data Emergency department visits Grocery data (Example [14]) Clinical visits Weatherclimate data
Challenges Weak signals in the data
ED cases involving cough rArrFlu or SARS
Integration of multiple signals(lag analysis)
Account for spatial and temporalcorrelations
Chawla and Chandola Anomaly Detection
Introduction Data Mining Methods Density-based anomaly Commute Time Approach Addressing Scalability Anomalies in Complex Data Evaluating Anomaly Detection Methods Applications Problem solutionsPCA and Subspace Method Subspace Method Algorithm Subspace Analysis Results Discussion Typical Characteristics of Anomaly Limitation of Volume Entropy Based versus Volume Based Fraud Detection Epidemeology Anomaly Detection in Climate and Weather Anomalies in Climate Validation of Anomalies
Whatrsquos Significant About Recent Events (WSARE) [33]
1 Learn Bayesian network from historical data Environmental and response variables
2 Sample from the BN (DBbaseline|Current Environment)3 Compute contingency table for rules for DBbaseline andDBcurrent
Rules are single assignment rules (Xi = Y ji ) or conjunctions4 Find p-value for rules using χ2-test
Null Hypothesis Rows and columns of tables for DBbaselineand DBcurrent are independent
5 Find rule with largest p-value Repeat Step 2
Chawla and Chandola Anomaly Detection
Introduction Data Mining Methods Density-based anomaly Commute Time Approach Addressing Scalability Anomalies in Complex Data Evaluating Anomaly Detection Methods Applications Problem solutionsPCA and Subspace Method Subspace Method Algorithm Subspace Analysis Results Discussion Typical Characteristics of Anomaly Limitation of Volume Entropy Based versus Volume Based Fraud Detection Epidemeology Anomaly Detection in Climate and Weather Anomalies in Climate Validation of Anomalies
Incorporating Spatial and Temporal Relationships
WSARE does not explicitly model the spatial and temporalrelationships
What happened yesterday What happened in the adjoining neighborhood (yesterday)
Bayesian Network Spatio-Temporal (BNST) modelingframework [17]
Add nodes for temporal and spatial dependencies Need more data to train
Chawla and Chandola Anomaly Detection
Introduction Data Mining Methods Density-based anomaly Commute Time Approach Addressing Scalability Anomalies in Complex Data Evaluating Anomaly Detection Methods Applications Problem solutionsPCA and Subspace Method Subspace Method Algorithm Subspace Analysis Results Discussion Typical Characteristics of Anomaly Limitation of Volume Entropy Based versus Volume Based Fraud Detection Epidemeology Anomaly Detection in Climate and Weather Anomalies in Climate Validation of Anomalies
Anomaly Detection in Climate and Weather
Science Questions Identify natural and anthropogenic disasters Identify long time scale events - droughts atmospheric rivers
cold fronts etc
Data Ground observations Remote sensing data (satellites
air-borne) Climate model simulation outputs Multiple variables spatio-temporal (often has height dimension
as well)
Challenges Model spatio-temporal relationships across multiple variables Explain the cause of anomalies Massive data sizes
Climate and weather extreme events are well defined
Key challenge is to find significant events and explain the cause
Chawla and Chandola Anomaly Detection
Introduction Data Mining Methods Density-based anomaly Commute Time Approach Addressing Scalability Anomalies in Complex Data Evaluating Anomaly Detection Methods Applications Problem solutionsPCA and Subspace Method Subspace Method Algorithm Subspace Analysis Results Discussion Typical Characteristics of Anomaly Limitation of Volume Entropy Based versus Volume Based Fraud Detection Epidemeology Anomaly Detection in Climate and Weather Anomalies in Climate Validation of Anomalies
Anomalies are Widely Used in Climate
Most analysis done on ldquoanomalyrdquo time series
Difference from a ldquobase periodrdquo (Toosimplistic)
Brings spatial smoothness (eg a mountaintop and nearby valley can have very differenttemperatures) Removes seasonality
Understand climate and weatherphenomenon
Southern Oscillation Index (SOI) Difference between Sea Level Pressure
(SLP) anomalies for Tahiti and DarwinAustralia
Figure Global AverageTemperature Anomaly(1975 - 2007) Srcwwwmetofficegovuk
Chawla and Chandola Anomaly Detection
Introduction Data Mining Methods Density-based anomaly Commute Time Approach Addressing Scalability Anomalies in Complex Data Evaluating Anomaly Detection Methods Applications Problem solutionsPCA and Subspace Method Subspace Method Algorithm Subspace Analysis Results Discussion Typical Characteristics of Anomaly Limitation of Volume Entropy Based versus Volume Based Fraud Detection Epidemeology Anomaly Detection in Climate and Weather Anomalies in Climate Validation of Anomalies
Constructing Anomalies from Raw Data
Anomaly time series for a given location i
vprimei = vi minus bi
where bi is the base (reference)
How to choose bi Mean of all data for location i Monthly mean values (account for seasonality) Monthly z-score values Median (more robust) Using a shorter ldquoreference periodrdquo
30 year moving window
Different methods show statistically significant differences[19] What is the right strategy Weighted mean of different strategies (Pick weights using
Monte Carlo sampling)
Chawla and Chandola Anomaly Detection
Introduction Data Mining Methods Density-based anomaly Commute Time Approach Addressing Scalability Anomalies in Complex Data Evaluating Anomaly Detection Methods Applications Problem solutionsPCA and Subspace Method Subspace Method Algorithm Subspace Analysis Results Discussion Typical Characteristics of Anomaly Limitation of Volume Entropy Based versus Volume Based Fraud Detection Epidemeology Anomaly Detection in Climate and Weather Anomalies in Climate Validation of Anomalies
Anomaly Detection for Identifying Droughts
Science question Identify significant drought patterns usinghistorical observation data or future simulation data or both
Find persistent spatiotemporal anomalies in precipitation data
A two step approach
1 Find precipitationanomalies usingthresholds
2 Find large connectedcomponents across spaceand time
Matlab - bwlabelbwlabeln
Followup Science questionExplain cause
(drought190120061avi)
Figure Video courtsey Dr ArindamBanerjee
Chawla and Chandola Anomaly Detection
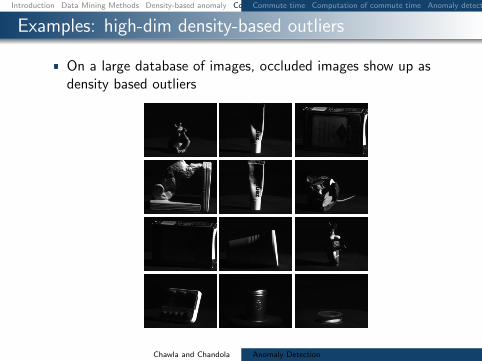
Introduction Data Mining Methods Density-based anomaly Commute Time Approach Addressing Scalability Anomalies in Complex Data Evaluating Anomaly Detection Methods Applications Problem solutionsCommute time Computation of commute time Anomaly detection using commute time (CDOF) Fast estimation of commute time Scalability for Density-based method PINN Algorithm (ICDM 2010) PINN Guarantee Examples high-dim distance-based outliers Examples high-dim density-based outliers Examples local density-based outliers
Examples high-dim density-based outliers
On a large database of images occluded images show up asdensity based outliers
Chawla and Chandola Anomaly Detection
Introduction Data Mining Methods Density-based anomaly Commute Time Approach Addressing Scalability Anomalies in Complex Data Evaluating Anomaly Detection Methods Applications Problem solutionsCommute time Computation of commute time Anomaly detection using commute time (CDOF) Fast estimation of commute time Scalability for Density-based method PINN Algorithm (ICDM 2010) PINN Guarantee Examples high-dim distance-based outliers Examples high-dim density-based outliers Examples local density-based outliers
Examples local density-based outliers
Examples of images ranked by LOF
Chawla and Chandola Anomaly Detection
Introduction Data Mining Methods Density-based anomaly Commute Time Approach Addressing Scalability Anomalies in Complex Data Evaluating Anomaly Detection Methods Applications Problem solutions
Addressing Scalability
Chawla and Chandola Anomaly Detection
Introduction Data Mining Methods Density-based anomaly Commute Time Approach Addressing Scalability Anomalies in Complex Data Evaluating Anomaly Detection Methods Applications Problem solutions
Using GPUs for Anomaly Detection
Well suited for data parallel algorithms Using CUDA - Compute Unified Device
Architecture (Nvidia)
Need to re-engineer existing algorithms Utilization of device memory Minimize CPUhArrGPU transfer of data Keep threads homogeneous
Most model based algorithms arenaturally setup for the testing phase
Model building needs careful redesign
What about unsupervised algorithms
Kernel
Host
Grid
Device
Block(00)
Block(01)
Block(02)
Block(10)
Block(11)
Block(12)
Thread Block
Thread(00)
Thread(01)
Thread(02)
Thread(03)
Thread(10)
Thread(11)
Thread(12)
Thread(13)
Thread(20)
Thread(21)
Thread(22)
Thread(23)
Host Host Memory
SM 2
SM 1
SM 0
Registers Registers Registers
SP 0 SP 1 SP 7
Shared Memory
Global Memory
Texture Memory
Constant Memory
Device
Chawla and Chandola Anomaly Detection
Introduction Data Mining Methods Density-based anomaly Commute Time Approach Addressing Scalability Anomalies in Complex Data Evaluating Anomaly Detection Methods Applications Problem solutions
Implementing DB(kN) on GPUs
Return top N data instances whose distances tok-th nearest neighbor are largest (SerialDB(kN) is O(n2))
Involves computing pairwise distances
Load block i and block j to shared memory Data layout in memory should be optimized
Each thread computes distance between a pairof instances
Can utilize this time to load next chunk of datafrom host to device memory
Writes results to corresponding output block
Sorting can be done efficiently in CUDA [29]
d
n
T
n
n
Chawla and Chandola Anomaly Detection
Introduction Data Mining Methods Density-based anomaly Commute Time Approach Addressing Scalability Anomalies in Complex Data Evaluating Anomaly Detection Methods Applications Problem solutionsCategorical Data Discrete Sequences and Time Series Contextual Anomalies Collective Anomalies
Moving Beyond Multi-dimensional Record Data
Categorical (Mixed)
Fraud Detection
Cyber Networks
Time Series
Sensor Networks
Healthcare
Discrete Sequences
Genomic
System Calls
Spatial
GIS
Image analysis
Spatio-temporal
Remote sensing
Climate
Graphs
Social networks
Epidemiology
Chawla and Chandola Anomaly Detection
Introduction Data Mining Methods Density-based anomaly Commute Time Approach Addressing Scalability Anomalies in Complex Data Evaluating Anomaly Detection Methods Applications Problem solutionsCategorical Data Discrete Sequences and Time Series Contextual Anomalies Collective Anomalies
Handling Categorical Data
Each attribute can belong to one of many categories
No ordering between categories
Mixed data (categorical and continuous attributes)
cap-shape cap-surface middot middot middot habitat type
convex smooth urban poisonousconvex smooth grasses ediblebell smooth meadows edibleconvex scaly urban poisonousconvex smooth grasses ediblemiddot middot middot
Table Mushroom Data Set [2]
Chawla and Chandola Anomaly Detection
Introduction Data Mining Methods Density-based anomaly Commute Time Approach Addressing Scalability Anomalies in Complex Data Evaluating Anomaly Detection Methods Applications Problem solutionsCategorical Data Discrete Sequences and Time Series Contextual Anomalies Collective Anomalies
Approaches to Identify Categorical Anomalies
Using Association Analysis [24]
Binarize data
Learn rules (X rArr Y ) Choose high confidence
rules (P (Y |X))
For test record Z = 〈XY 〉find rules of the formP (Y |X)
Y is not observed whenX is observed
Using Bayesian Networks [33]
Learn Bayesian networkstructure and parameters
Compute P (Z) for test datarecord Z
Flag anomaly if P (Z) lt δ
Using Similarity Metrics [10]
Use a similarity measure (S(X1 X2))
Apply distancedensityclustering based method (eg lof)
Chawla and Chandola Anomaly Detection
Introduction Data Mining Methods Density-based anomaly Commute Time Approach Addressing Scalability Anomalies in Complex Data Evaluating Anomaly Detection Methods Applications Problem solutionsCategorical Data Discrete Sequences and Time Series Contextual Anomalies Collective Anomalies
Conditional Probability Test [18]
Identify unusual combinations of attribute values
r(at bt) =P (at bt)
P (at)P (bt)
A capB = φ Assumption If r(at bt) is low and is observed in test record t
then t is anomalous For a test record t
For each mutually exclusive pair of attribute sets ABcompute r(at bt)
Score t based on all r-values Assign minimum r-value as score Take product of all r-values
Need to compare exponential pairs of subsets Only consider subsets upto size k Ignore subsets with frequency less than a threshold α Avoid comparing independent subsets of attributes
micro(AB) ge βmicroChawla and Chandola Anomaly Detection
Introduction Data Mining Methods Density-based anomaly Commute Time Approach Addressing Scalability Anomalies in Complex Data Evaluating Anomaly Detection Methods Applications Problem solutionsCategorical Data Discrete Sequences and Time Series Contextual Anomalies Collective Anomalies
Estimating Probabilities for CPT [18]
Maximum LikelihoodEstimation
P (at bt)
P (at)P (bt)=C(at bt)
Ntimes N
C(at)times N
C(bt)
C(at) Number of traininginstances with A = at
N Total number of traininginstances
Laplace Smoothing
E(p) =C(p) + 1
N + 2
r(at bt) =E(at bt)
E(at)times E(bt)
Speedup Tricks
Replace rare attributevalues with genericattribute (reduce arity)
Use efficient datastructure to querying forcounts(AD Trees [26])
ADTrees work fasterfor low arity attributes
Chawla and Chandola Anomaly Detection
Introduction Data Mining Methods Density-based anomaly Commute Time Approach Addressing Scalability Anomalies in Complex Data Evaluating Anomaly Detection Methods Applications Problem solutionsCategorical Data Discrete Sequences and Time Series Contextual Anomalies Collective Anomalies
Finding Anomalies in Discrete Sequences
Many problem formulations
1 Anomalous symbols in asequence
2 Anomalous subsequence in asequence
3 Anomalous sequence in adatabase of sequences
See [11] for a comparativeevaluation [9] for a survey
login pwdmail ssh mail web logoutlogin pwdmail web web web web logoutlogin pwdmail ssh mail web web logoutlogin pwdwebmail ssh webmail logoutloginpwd loginpwd loginpwd logout
Chawla and Chandola Anomaly Detection
Introduction Data Mining Methods Density-based anomaly Commute Time Approach Addressing Scalability Anomalies in Complex Data Evaluating Anomaly Detection Methods Applications Problem solutionsCategorical Data Discrete Sequences and Time Series Contextual Anomalies Collective Anomalies
Treating Sequences as Points
Utilize a distancesimilarity measure Plug into a distancedensityclustering based method
Simplest Hamming Distance
h(Ai Bi) = 1 Ai 6= Bi= 0 Ai = Bi
H(AB) =nsumi=1
h(Ai Bi)
Issues Unequal lengths misalignment Normalized Length of Longest Common Subsequence
D(AB) = 1minus |LCS(AB)|radic|A||B|
Standard Dynamic Programming method is slow Faster versions available (Hunt Szymnaski method [7])
Weaknesses Cannot localize anomalies within a sequence Weak anomaly signals might get lost
Chawla and Chandola Anomaly Detection
Introduction Data Mining Methods Density-based anomaly Commute Time Approach Addressing Scalability Anomalies in Complex Data Evaluating Anomaly Detection Methods Applications Problem solutionsCategorical Data Discrete Sequences and Time Series Contextual Anomalies Collective Anomalies
Using Sliding Windows
Slide a window of size k
Extract all windows from a sequence (nminus k + 1)
Training (Creating a normal dictionary) Store all uniquewindows in all normal sequences and their counts
Testing For each window find the frequency in normal dictionary Anomaly score is inverse of the aggregate frequencies for all
windows (normalized by length)
Many variants exist For each window find the hamming distance to the closest
window in the normal dictionary [16]
Issues Penalizes low frequency windows in the normal dictionary Rewards high frequency windows that might not be relevant Can construct anomalous sequences that will escape detection
Chawla and Chandola Anomaly Detection
Introduction Data Mining Methods Density-based anomaly Commute Time Approach Addressing Scalability Anomalies in Complex Data Evaluating Anomaly Detection Methods Applications Problem solutionsCategorical Data Discrete Sequences and Time Series Contextual Anomalies Collective Anomalies
Using Probabilistic Models
Probability of occurrence of sequence S
P (S) =nprodi=1
P (Si|S1 Siminus1)
Short memory property of sequences
P (Si|S1 Siminus1) = P (Si|Siminusk Siminus1)
Conditional probability estimates for a symbol Si
P (Si|Siminusk Siminus1) =f(Si|Siminusk Si)f(Si|Siminusk Siminus1)
f is estimated from the normal dictionary
Anomaly score for a test sequence is inverse of the normalizedprobability of occurrence
Issues What if the suffix occurs very infrequently in thenormal data (or not at all)
Replace with the longest suffix that occurs sufficient number oftimes [32] - Probabilistic Suffix Trees
Significantly reduces the size of the modelChawla and Chandola Anomaly Detection
Introduction Data Mining Methods Density-based anomaly Commute Time Approach Addressing Scalability Anomalies in Complex Data Evaluating Anomaly Detection Methods Applications Problem solutionsCategorical Data Discrete Sequences and Time Series Contextual Anomalies Collective Anomalies
Finding Contextual Anomalies
Sometimes contextual information isavailable about data
Not used directly as a feature Are well understood no anomalies in
the context Can reduce false positives and yield
interesting anomalies
Example adapted from [30]
Clearest Outlier
Conditional Anomaly
Maximum Daily Temperature
Number
ofFever
Cases
Contextual anomalies - Anomalous with respect to a context Context is defined using environmental variables
Spatial (Latitude Longitude) Graph context (Edges Weights) Temporal location Domain specific (Demographic other)
How to incorporate context Reduce to traditional anomaly detection (subset on context) Explicitly model contextual information (time series spatial)
Chawla and Chandola Anomaly Detection
Introduction Data Mining Methods Density-based anomaly Commute Time Approach Addressing Scalability Anomalies in Complex Data Evaluating Anomaly Detection Methods Applications Problem solutionsCategorical Data Discrete Sequences and Time Series Contextual Anomalies Collective Anomalies
Conditional Anomaly Detection
Data instance d rArru1 u2 udU v1 v2 vdV
dU environmentalattributes
dV indicator attributes u1
u2
U1
U2
U3
v1
v2
V1V2
V3
p(V1|U3) = 02
p(V2|U3) = 02
p(V3|U3) = 06
Algorithm [30]
1 Learn a Gaussian Mixture Model (GMM)U = U1 U2 UnU
each with dimensionality dU2 Learn a set of Gaussians U = V1 V2 VnV
each withdimensionality dV
3 Learn a probabilistic mapping function p(Vj |Ui)4 Score a test instance d = [uv]
S =
nUsumi=1
p(u|Ui)nVsumj=1
p(v|Vj)p(Vj |Ui)
Chawla and Chandola Anomaly Detection
Introduction Data Mining Methods Density-based anomaly Commute Time Approach Addressing Scalability Anomalies in Complex Data Evaluating Anomaly Detection Methods Applications Problem solutionsCategorical Data Discrete Sequences and Time Series Contextual Anomalies Collective Anomalies
Finding Collective Anomalies
Find a collection of data points
Each point by itself is normal
The collection as a whole isanomalous
Relevant when data has inherentstructure and
When domain definition ofanomalies cannot be described aspoint anomalies
A Simple Solution
1 Break data intogroups
2 Compute features foreach group
3 Apply traditionalanomaly detection
Examples
1 Time series
2 Image
3 Spatial clusters ofgalaxies
Chawla and Chandola Anomaly Detection
Introduction Data Mining Methods Density-based anomaly Commute Time Approach Addressing Scalability Anomalies in Complex Data Evaluating Anomaly Detection Methods Applications Problem solutionsCategorical Data Discrete Sequences and Time Series Contextual Anomalies Collective Anomalies
Using Latent Dirichlet Allocation for Group Anomalies
Find anomalous groups in data [34]
Example Spatial clusters of galaxies topics red green emissive words continuous features
Flexible Genre Model (FGM)
For each group
1 Draw a genre 1 2 T 3 ym simM(π)2 Draw topic distribution forym SK 3 θm sim Dir(αym)
3 Draw K topicsβmk sim P (βmk|ηk)k=12K
4 For each point in group
1 Draw topic membershipzmn simM(θn)
2 Generate pointxmn isin P (xmn|βmzmn)
α
zmn
xmn
N
θm
T
π
ηK
ym
β
MK
Model Parameters
M(π) -Multinomial
Genre - Dir(αt)
Topic generatorsP (|ηk)- GIW
Point generatorsP (xmn|βnk) -MultivariateGaussian
Chawla and Chandola Anomaly Detection
Introduction Data Mining Methods Density-based anomaly Commute Time Approach Addressing Scalability Anomalies in Complex Data Evaluating Anomaly Detection Methods Applications Problem solutionsCategorical Data Discrete Sequences and Time Series Contextual Anomalies Collective Anomalies
Inference and Testing for FGM
Inference and Learning Parameters
Approximate inference of latentvariables (Gibbs Sampling)
Use samples to learn parameters(Single step Monte Carlo EM)
Topic 1
Topic 2
Topic 3
Anomaly Detection
Infer the topic distribution θm
Compute negative log likelihood wrt αt
Rationale An anomalous group will be unlikely to begenerated from any genre
Geometric interpretation Mapping each group into a Tdimensional space and finding anomalies
Chawla and Chandola Anomaly Detection
Introduction Data Mining Methods Density-based anomaly Commute Time Approach Addressing Scalability Anomalies in Complex Data Evaluating Anomaly Detection Methods Applications Problem solutions
Evaluating Anomaly Detection Methods - Labels
Labeled validation data set exists Confusion matrix Traditional evaluation metrics
Class imbalance
ROC Curve
Validation set does not exist Use domain expertise to find TP
and FP FN is harder to estimate
Pseudo false negativeestimation techniques [25]
Predicteda n
Actuala TP FNn FP TN
Acc =TP + TNsum
Rec (R) =TP
TP + FN
Prec (P ) =TP
TP + FP
F =2 lowastR lowast PR+ P
Chawla and Chandola Anomaly Detection
Introduction Data Mining Methods Density-based anomaly Commute Time Approach Addressing Scalability Anomalies in Complex Data Evaluating Anomaly Detection Methods Applications Problem solutions
Evaluating Anomaly Detection Methods - Scores
Convert to binary output Use threshold δ on score (Scale
issues [21]) Take top x as anomalies
ROC curve by varying x or δ
Quality of output Does the output ldquosuggestrdquo x or δ Which output is better
Chawla and Chandola Anomaly Detection
Introduction Data Mining Methods Density-based anomaly Commute Time Approach Addressing Scalability Anomalies in Complex Data Evaluating Anomaly Detection Methods Applications Problem solutions
Unifying Scores
Different methods assign scores in differentranges
kNN-based scores [0 1] Lof scores [1 6] ABOD scores [0 80000]
Anomalies have lower scores
Direct scaling to [0 1] might lose distinctionbetween normal and anomalies
Desired scaling Stretch interesting rangesand shrink irrelevant ones
Generalized Procedure for Normalizing Outlier Scores [21] Regularity rArr S(o) ge 0forallo S(o) asymp 0 if o is normal andS(o) 0 if o is anomalous
Normality S is regular and S(o) isin [0 1]forallo
Chawla and Chandola Anomaly Detection
Introduction Data Mining Methods Density-based anomaly Commute Time Approach Addressing Scalability Anomalies in Complex Data Evaluating Anomaly Detection Methods Applications Problem solutions
Regularization and Normalization of Scores
Regularization
1 R(o) = max0 S(o)minus baseS2 R(o) = Smax minus S(o)
3 R(o) = minus log SmaxS(o)
Normalization
1 N(o) = S(o)Smax
2 N(o) = max(
0 erf(S(o)minusmicroSσS radic2
))(Gaussian Scaling)
Suited for high dimensional data
3 N(o) = max(
0cdfγS (o)minusmicroγ
1minusmicroγ
)(Gamma Scaling)
Where cdfγS (o) = P (k S(o) θ) P is the regularized Gamma function Suited for low dimensional data
Chawla and Chandola Anomaly Detection
Introduction Data Mining Methods Density-based anomaly Commute Time Approach Addressing Scalability Anomalies in Complex Data Evaluating Anomaly Detection Methods Applications Problem solutions
Generating Labeled Data for Validation
Generating Both Normal and Anomalous Data
Use generative models for normal and anomalous behavior
Several generators available Multivariate continuous data [27] Multivariate categorical data [5] Discrete sequences using HMM [12]
Drawbacks Might not capture the domain characteristics
Injecting Anomalies - Random Perturbation[30]
Given data point z = xy x and y arepartitions of feature space
Take a random sample D of the entire data set
Let zprime = xprimeyprime isin D such that distancebetween y and yprime is maximum
Replace x with xprime and add z back to data setx
yz
zprime
Injected anomaly
Chawla and Chandola Anomaly Detection
Introduction Data Mining Methods Density-based anomaly Commute Time Approach Addressing Scalability Anomalies in Complex Data Evaluating Anomaly Detection Methods Applications Problem solutionsWhat is Network Anomaly Detection Motivation How Much Serious
Applications Overview
How to set up an anomaly detection solution for agiven application domain
Available data Define anomalies define normal behavior Identify requirements and constraints (online
real-time limited resources) What domain knowledge available
Feature identification Defining normal and anomalous behavior Tuning parameters
Available ground truth (training validation)
Chawla and Chandola Anomaly Detection
Introduction Data Mining Methods Density-based anomaly Commute Time Approach Addressing Scalability Anomalies in Complex Data Evaluating Anomaly Detection Methods Applications Problem solutionsWhat is Network Anomaly Detection Motivation How Much Serious
What is Network Anomaly Detection
Anomaly Detection or Intrusion Detection
Traditional Intrusion Detection Systems (IDS) finding attackscorresponding to predefined pattern data set known as signaturestherefore system is absolutely vulnerable against zero-day attacks
Network Anomaly Detection Systems (NADS) to detectzero-day attacks without any pre-identified signature besides profilenormal behavior of the network and address suspected incidents
Network Anomaly Detection finding unusual and largechanges in the network traffic
Examples intentional attacks (eg Distributed Denial ofService - DDoS) or unusual network traffic (eg flash crowds)
Chawla and Chandola Anomaly Detection
Introduction Data Mining Methods Density-based anomaly Commute Time Approach Addressing Scalability Anomalies in Complex Data Evaluating Anomaly Detection Methods Applications Problem solutionsWhat is Network Anomaly Detection Motivation How Much Serious
Motivation How Much Serious
According to Symantec report released in early 2011 morethan 286 million new threats have been detected in 2010which is a huge number
1656227
2704836
1000000
1500000
2000000
2500000
3000000
20547 18827 69107 113025 140690
624267
1656227
2704836
0
500000
1000000
1500000
2000000
2500000
3000000
2002 2003 2004 2005 2006 2007 2008 July2009-June2010
Chawla and Chandola Anomaly Detection
Introduction Data Mining Methods Density-based anomaly Commute Time Approach Addressing Scalability Anomalies in Complex Data Evaluating Anomaly Detection Methods Applications Problem solutionsNetwork Topology Network Anomalies Detection Problem Network Anomalies Detection Problem Why care about OD Flows
Network Topology
A Typical network
1 y
Router
2
3
41t
x2t
x1t
x3t
x4t
Origin-Destination (OD) flow is the traffic that enters at anorigin node and exits at a destination node of a backbonenetwork x1t x1t
Link measurement is the traffic enters at an node during aninterval y1t
Relationship between link traffic and OD flow traffic iscaptured by the routing matrix A
Chawla and Chandola Anomaly Detection
Introduction Data Mining Methods Density-based anomaly Commute Time Approach Addressing Scalability Anomalies in Complex Data Evaluating Anomaly Detection Methods Applications Problem solutionsNetwork Topology Network Anomalies Detection Problem Network Anomalies Detection Problem Why care about OD Flows
Network Anomalies Detection Problem
Chawla and Chandola Anomaly Detection
Introduction Data Mining Methods Density-based anomaly Commute Time Approach Addressing Scalability Anomalies in Complex Data Evaluating Anomaly Detection Methods Applications Problem solutionsNetwork Topology Network Anomalies Detection Problem Network Anomalies Detection Problem Why care about OD Flows
Network Anomalies Detection Problem
Chawla and Chandola Anomaly Detection
Introduction Data Mining Methods Density-based anomaly Commute Time Approach Addressing Scalability Anomalies in Complex Data Evaluating Anomaly Detection Methods Applications Problem solutionsNetwork Topology Network Anomalies Detection Problem Network Anomalies Detection Problem Why care about OD Flows
Why care about OD Flows
Volume anomaly typically arises on an OD flow (trafficarriving at one node and destined for another node)
If we only monitor traffic on network links volume arisingfrom an OD flow may not be noticeable Thus naiveapproach wont work if OD flow info is not available
Figure source [22]
Chawla and Chandola Anomaly Detection
Introduction Data Mining Methods Density-based anomaly Commute Time Approach Addressing Scalability Anomalies in Complex Data Evaluating Anomaly Detection Methods Applications Problem solutionsPCA and Subspace Method Subspace Method Algorithm Subspace Analysis Results Discussion Typical Characteristics of Anomaly Limitation of Volume Entropy Based versus Volume Based Fraud Detection Epidemeology Anomaly Detection in Climate and Weather Anomalies in Climate Validation of Anomalies
PCA and Subspace Method
Chawla and Chandola Anomaly Detection
Introduction Data Mining Methods Density-based anomaly Commute Time Approach Addressing Scalability Anomalies in Complex Data Evaluating Anomaly Detection Methods Applications Problem solutionsPCA and Subspace Method Subspace Method Algorithm Subspace Analysis Results Discussion Typical Characteristics of Anomaly Limitation of Volume Entropy Based versus Volume Based Fraud Detection Epidemeology Anomaly Detection in Climate and Weather Anomalies in Climate Validation of Anomalies
Subspace Method Algorithm
Step1- Determine the PCs based on eigenvaluedecomposition of the covariance matrix of the dataset
Step2- Choose first top k principle components with thehighest eigenvalues as matrix P
Step3-normal traffic subspace called Z
Z = PP TZ = CZ
Step4-abnormal traffic subspace called Z
Z = (I minus PP T )Z = CZ
Step5-If the norm of a vector is large then it is an rdquoanomalyrdquo
Chawla and Chandola Anomaly Detection
Introduction Data Mining Methods Density-based anomaly Commute Time Approach Addressing Scalability Anomalies in Complex Data Evaluating Anomaly Detection Methods Applications Problem solutionsPCA and Subspace Method Subspace Method Algorithm Subspace Analysis Results Discussion Typical Characteristics of Anomaly Limitation of Volume Entropy Based versus Volume Based Fraud Detection Epidemeology Anomaly Detection in Climate and Weather Anomalies in Climate Validation of Anomalies
Subspace Analysis Results
Note that during anomaly normal component does not changethat much while residual component changes quite a lot
Thus anomalies can be detected by setting some threshold
Figure source [22]
Chawla and Chandola Anomaly Detection
Introduction Data Mining Methods Density-based anomaly Commute Time Approach Addressing Scalability Anomalies in Complex Data Evaluating Anomaly Detection Methods Applications Problem solutionsPCA and Subspace Method Subspace Method Algorithm Subspace Analysis Results Discussion Typical Characteristics of Anomaly Limitation of Volume Entropy Based versus Volume Based Fraud Detection Epidemeology Anomaly Detection in Climate and Weather Anomalies in Climate Validation of Anomalies
Discussion Typical Characteristics of Anomaly
Most Anomalies induce a change in distributionalaspects of packet header fields (called features)
Most important features include 5-tuple Source ampdestination IP addresses Source and destination portnumbers and IP protocol
raquo DOS attack ndash multiple source IP address concentrated on asingle destination IP address
raquo Network scan ndash dispersed distribution of destination addresses
raquo Most wormsviruses also induce some change in distribution ofcertain features
raquo However these changes can be very subtle and mining them islike searching for needles in a haystack
Unlike many previous approach this paper aims todetect events which disturb the distribution of trafficfeatures rather than traffic volume
Chawla and Chandola Anomaly Detection
Introduction Data Mining Methods Density-based anomaly Commute Time Approach Addressing Scalability Anomalies in Complex Data Evaluating Anomaly Detection Methods Applications Problem solutionsPCA and Subspace Method Subspace Method Algorithm Subspace Analysis Results Discussion Typical Characteristics of Anomaly Limitation of Volume Entropy Based versus Volume Based Fraud Detection Epidemeology Anomaly Detection in Climate and Weather Anomalies in Climate Validation of Anomalies
Limitation of Volume
Figure source [22]
Port scan anomaly (traffic feature changes however traffic volume
remains more or less the same)
We can use entropy tocapture the variationsin the traffic feature
bullTakes value 0 when distribution is maximally concentratedbullTakes value log2N when distribution is maximally dispersed
But stands out in
feature entropy
which also reveals
its structure
Port scan
dwarfed
in volume
metricshellip
Chawla and Chandola Anomaly Detection
Introduction Data Mining Methods Density-based anomaly Commute Time Approach Addressing Scalability Anomalies in Complex Data Evaluating Anomaly Detection Methods Applications Problem solutionsPCA and Subspace Method Subspace Method Algorithm Subspace Analysis Results Discussion Typical Characteristics of Anomaly Limitation of Volume Entropy Based versus Volume Based Fraud Detection Epidemeology Anomaly Detection in Climate and Weather Anomalies in Climate Validation of Anomalies
Entropy Based versus Volume Based
DoSDDoS Attacks- a spike in traffic data toward adominant destination IP
Scan anomaly-a spike in traffic data from a dominant sourceIP
Flash Crowd anomaly- again a spike in traffic data to adominant destination IP
Worm anomaly-a Spike in traffic with a dominant port
Chawla and Chandola Anomaly Detection
Introduction Data Mining Methods Density-based anomaly Commute Time Approach Addressing Scalability Anomalies in Complex Data Evaluating Anomaly Detection Methods Applications Problem solutionsPCA and Subspace Method Subspace Method Algorithm Subspace Analysis Results Discussion Typical Characteristics of Anomaly Limitation of Volume Entropy Based versus Volume Based Fraud Detection Epidemeology Anomaly Detection in Climate and Weather Anomalies in Climate Validation of Anomalies
Fraud Detection
Domain Question Identifyfraudulent activities or players fromobserved transaction data
Data Transactions between different
players in the system Meta information about the
individuals An underlying graph structure
Challenges Track and model human behavior Anomalies caused by adaptive
human adversaries Massive data sizes
Insurance (autohealtha)
ClaimantProvider Payer
Telecommunications Customer
Provider
Credit Cards Customer
Supplier Bank
Web Advertising User Advertiser
Publisher
ahttpwwwcheatingculturecompast-cases-of-medicare-fraud
Chawla and Chandola Anomaly Detection
Introduction Data Mining Methods Density-based anomaly Commute Time Approach Addressing Scalability Anomalies in Complex Data Evaluating Anomaly Detection Methods Applications Problem solutionsPCA and Subspace Method Subspace Method Algorithm Subspace Analysis Results Discussion Typical Characteristics of Anomaly Limitation of Volume Entropy Based versus Volume Based Fraud Detection Epidemeology Anomaly Detection in Climate and Weather Anomalies in Climate Validation of Anomalies
A Generic Fraud Detection Method
Activity Monitoring [13]1 Build profiles for individuals (customers users etc) based on
historic data User X makes n calls on an average in January
2 Compare current behavior with historical profile for significantdeviations
Clustering based [4]1 Cluster historical profiles of customers2 Identify small clusters or outlying profiles as anomalies
Strengths Anomaly detection is fast (good for real time) Results are easy to explain
Weaknesses Need to create and maintain a large number of profiles Not dynamic Adequate historical data might not be available Too many false positives
Chawla and Chandola Anomaly Detection
Introduction Data Mining Methods Density-based anomaly Commute Time Approach Addressing Scalability Anomalies in Complex Data Evaluating Anomaly Detection Methods Applications Problem solutionsPCA and Subspace Method Subspace Method Algorithm Subspace Analysis Results Discussion Typical Characteristics of Anomaly Limitation of Volume Entropy Based versus Volume Based Fraud Detection Epidemeology Anomaly Detection in Climate and Weather Anomalies in Climate Validation of Anomalies
Exploiting Graph Structure - Weighted Graphs
Represent data as a weighted graph Communication networks (phone email SMS) Provider referral networks
Objective Identify anomalous nodes
For each node extract several features based on the propertiesof the induced sub-graph (egonet) of neighboring nodes [1]
Choose features that can highlight anomalous nodes
1 Ni degree of node2 Ei number of edges in egonet3 Wi total weight of egonet4 λi principal eigen vector of weighted adjacency matrix of
egonet
Data is transformed into a point in a multi-dimensional space
Chawla and Chandola Anomaly Detection
Introduction Data Mining Methods Density-based anomaly Commute Time Approach Addressing Scalability Anomalies in Complex Data Evaluating Anomaly Detection Methods Applications Problem solutionsPCA and Subspace Method Subspace Method Algorithm Subspace Analysis Results Discussion Typical Characteristics of Anomaly Limitation of Volume Entropy Based versus Volume Based Fraud Detection Epidemeology Anomaly Detection in Climate and Weather Anomalies in Climate Validation of Anomalies
Identifying Anomalies
Traditional anomaly detection (lof) Can be slow but can identify any type of anomalous structure
Faster method to identify specific types of anomalousstructures
Identify relevant feature pairs and power law relationship
Eg Egonet Density Power Law Ni vs Ei - detect nearcliques and stars
Ei prop Nαi 1 le α le 2
Anomaly score for node i wrt a pair of features (y = Cxθ)
Si =max(yi Cx
θi )
min(yi Cxθi )lowast log (|yi minus Cxθi |+ 1)
Chawla and Chandola Anomaly Detection
Introduction Data Mining Methods Density-based anomaly Commute Time Approach Addressing Scalability Anomalies in Complex Data Evaluating Anomaly Detection Methods Applications Problem solutionsPCA and Subspace Method Subspace Method Algorithm Subspace Analysis Results Discussion Typical Characteristics of Anomaly Limitation of Volume Entropy Based versus Volume Based Fraud Detection Epidemeology Anomaly Detection in Climate and Weather Anomalies in Climate Validation of Anomalies
Exploiting Graph Structure - Bipartite Graphs
Represent data as a bipartite graph Healthcare Data (Beneficiaries vs Providers) Insider trading (Traders vs Stocks)
Objective Identify anomalous links
Given a query node a isin V1 find the ldquorelevancerdquoof all other nodes in V1 to a
RelevanceScore(a b) prop Number of times aldquorandom walkrdquo from a reaches b
Use the relevance scores to compute thenormality scores for a node t isin V2
Find set St = a|〈a t〉 isin E Compute |St| times |St| similarity matrix using
relevance vectors for a isin St Normality Score = mean of non-diagonal entries
of similarity matrix
V1 E V2a1
a2
a3
an
t1
t2
t3
tn
Chawla and Chandola Anomaly Detection
Introduction Data Mining Methods Density-based anomaly Commute Time Approach Addressing Scalability Anomalies in Complex Data Evaluating Anomaly Detection Methods Applications Problem solutionsPCA and Subspace Method Subspace Method Algorithm Subspace Analysis Results Discussion Typical Characteristics of Anomaly Limitation of Volume Entropy Based versus Volume Based Fraud Detection Epidemeology Anomaly Detection in Climate and Weather Anomalies in Climate Validation of Anomalies
Detecting Disease Outbreaks
Domain Question Early detection of disease
outbreaks Anthrax attack
Data Emergency department visits Grocery data (Example [14]) Clinical visits Weatherclimate data
Challenges Weak signals in the data
ED cases involving cough rArrFlu or SARS
Integration of multiple signals(lag analysis)
Account for spatial and temporalcorrelations
Chawla and Chandola Anomaly Detection
Introduction Data Mining Methods Density-based anomaly Commute Time Approach Addressing Scalability Anomalies in Complex Data Evaluating Anomaly Detection Methods Applications Problem solutionsPCA and Subspace Method Subspace Method Algorithm Subspace Analysis Results Discussion Typical Characteristics of Anomaly Limitation of Volume Entropy Based versus Volume Based Fraud Detection Epidemeology Anomaly Detection in Climate and Weather Anomalies in Climate Validation of Anomalies
Whatrsquos Significant About Recent Events (WSARE) [33]
1 Learn Bayesian network from historical data Environmental and response variables
2 Sample from the BN (DBbaseline|Current Environment)3 Compute contingency table for rules for DBbaseline andDBcurrent
Rules are single assignment rules (Xi = Y ji ) or conjunctions4 Find p-value for rules using χ2-test
Null Hypothesis Rows and columns of tables for DBbaselineand DBcurrent are independent
5 Find rule with largest p-value Repeat Step 2
Chawla and Chandola Anomaly Detection
Introduction Data Mining Methods Density-based anomaly Commute Time Approach Addressing Scalability Anomalies in Complex Data Evaluating Anomaly Detection Methods Applications Problem solutionsPCA and Subspace Method Subspace Method Algorithm Subspace Analysis Results Discussion Typical Characteristics of Anomaly Limitation of Volume Entropy Based versus Volume Based Fraud Detection Epidemeology Anomaly Detection in Climate and Weather Anomalies in Climate Validation of Anomalies
Incorporating Spatial and Temporal Relationships
WSARE does not explicitly model the spatial and temporalrelationships
What happened yesterday What happened in the adjoining neighborhood (yesterday)
Bayesian Network Spatio-Temporal (BNST) modelingframework [17]
Add nodes for temporal and spatial dependencies Need more data to train
Chawla and Chandola Anomaly Detection
Introduction Data Mining Methods Density-based anomaly Commute Time Approach Addressing Scalability Anomalies in Complex Data Evaluating Anomaly Detection Methods Applications Problem solutionsPCA and Subspace Method Subspace Method Algorithm Subspace Analysis Results Discussion Typical Characteristics of Anomaly Limitation of Volume Entropy Based versus Volume Based Fraud Detection Epidemeology Anomaly Detection in Climate and Weather Anomalies in Climate Validation of Anomalies
Anomaly Detection in Climate and Weather
Science Questions Identify natural and anthropogenic disasters Identify long time scale events - droughts atmospheric rivers
cold fronts etc
Data Ground observations Remote sensing data (satellites
air-borne) Climate model simulation outputs Multiple variables spatio-temporal (often has height dimension
as well)
Challenges Model spatio-temporal relationships across multiple variables Explain the cause of anomalies Massive data sizes
Climate and weather extreme events are well defined
Key challenge is to find significant events and explain the cause
Chawla and Chandola Anomaly Detection
Introduction Data Mining Methods Density-based anomaly Commute Time Approach Addressing Scalability Anomalies in Complex Data Evaluating Anomaly Detection Methods Applications Problem solutionsPCA and Subspace Method Subspace Method Algorithm Subspace Analysis Results Discussion Typical Characteristics of Anomaly Limitation of Volume Entropy Based versus Volume Based Fraud Detection Epidemeology Anomaly Detection in Climate and Weather Anomalies in Climate Validation of Anomalies
Anomalies are Widely Used in Climate
Most analysis done on ldquoanomalyrdquo time series
Difference from a ldquobase periodrdquo (Toosimplistic)
Brings spatial smoothness (eg a mountaintop and nearby valley can have very differenttemperatures) Removes seasonality
Understand climate and weatherphenomenon
Southern Oscillation Index (SOI) Difference between Sea Level Pressure
(SLP) anomalies for Tahiti and DarwinAustralia
Figure Global AverageTemperature Anomaly(1975 - 2007) Srcwwwmetofficegovuk
Chawla and Chandola Anomaly Detection
Introduction Data Mining Methods Density-based anomaly Commute Time Approach Addressing Scalability Anomalies in Complex Data Evaluating Anomaly Detection Methods Applications Problem solutionsPCA and Subspace Method Subspace Method Algorithm Subspace Analysis Results Discussion Typical Characteristics of Anomaly Limitation of Volume Entropy Based versus Volume Based Fraud Detection Epidemeology Anomaly Detection in Climate and Weather Anomalies in Climate Validation of Anomalies
Constructing Anomalies from Raw Data
Anomaly time series for a given location i
vprimei = vi minus bi
where bi is the base (reference)
How to choose bi Mean of all data for location i Monthly mean values (account for seasonality) Monthly z-score values Median (more robust) Using a shorter ldquoreference periodrdquo
30 year moving window
Different methods show statistically significant differences[19] What is the right strategy Weighted mean of different strategies (Pick weights using
Monte Carlo sampling)
Chawla and Chandola Anomaly Detection
Introduction Data Mining Methods Density-based anomaly Commute Time Approach Addressing Scalability Anomalies in Complex Data Evaluating Anomaly Detection Methods Applications Problem solutionsPCA and Subspace Method Subspace Method Algorithm Subspace Analysis Results Discussion Typical Characteristics of Anomaly Limitation of Volume Entropy Based versus Volume Based Fraud Detection Epidemeology Anomaly Detection in Climate and Weather Anomalies in Climate Validation of Anomalies
Anomaly Detection for Identifying Droughts
Science question Identify significant drought patterns usinghistorical observation data or future simulation data or both
Find persistent spatiotemporal anomalies in precipitation data
A two step approach
1 Find precipitationanomalies usingthresholds
2 Find large connectedcomponents across spaceand time
Matlab - bwlabelbwlabeln
Followup Science questionExplain cause
(drought190120061avi)
Figure Video courtsey Dr ArindamBanerjee
Chawla and Chandola Anomaly Detection
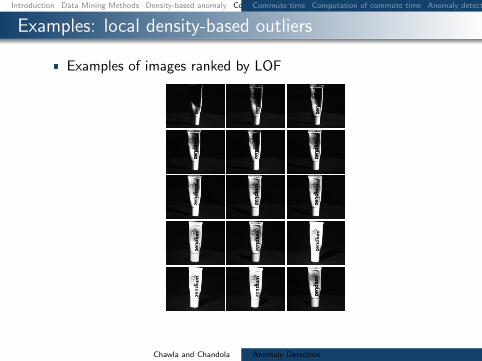
Introduction Data Mining Methods Density-based anomaly Commute Time Approach Addressing Scalability Anomalies in Complex Data Evaluating Anomaly Detection Methods Applications Problem solutionsCommute time Computation of commute time Anomaly detection using commute time (CDOF) Fast estimation of commute time Scalability for Density-based method PINN Algorithm (ICDM 2010) PINN Guarantee Examples high-dim distance-based outliers Examples high-dim density-based outliers Examples local density-based outliers
Examples local density-based outliers
Examples of images ranked by LOF
Chawla and Chandola Anomaly Detection
Introduction Data Mining Methods Density-based anomaly Commute Time Approach Addressing Scalability Anomalies in Complex Data Evaluating Anomaly Detection Methods Applications Problem solutions
Addressing Scalability
Chawla and Chandola Anomaly Detection
Introduction Data Mining Methods Density-based anomaly Commute Time Approach Addressing Scalability Anomalies in Complex Data Evaluating Anomaly Detection Methods Applications Problem solutions
Using GPUs for Anomaly Detection
Well suited for data parallel algorithms Using CUDA - Compute Unified Device
Architecture (Nvidia)
Need to re-engineer existing algorithms Utilization of device memory Minimize CPUhArrGPU transfer of data Keep threads homogeneous
Most model based algorithms arenaturally setup for the testing phase
Model building needs careful redesign
What about unsupervised algorithms
Kernel
Host
Grid
Device
Block(00)
Block(01)
Block(02)
Block(10)
Block(11)
Block(12)
Thread Block
Thread(00)
Thread(01)
Thread(02)
Thread(03)
Thread(10)
Thread(11)
Thread(12)
Thread(13)
Thread(20)
Thread(21)
Thread(22)
Thread(23)
Host Host Memory
SM 2
SM 1
SM 0
Registers Registers Registers
SP 0 SP 1 SP 7
Shared Memory
Global Memory
Texture Memory
Constant Memory
Device
Chawla and Chandola Anomaly Detection
Introduction Data Mining Methods Density-based anomaly Commute Time Approach Addressing Scalability Anomalies in Complex Data Evaluating Anomaly Detection Methods Applications Problem solutions
Implementing DB(kN) on GPUs
Return top N data instances whose distances tok-th nearest neighbor are largest (SerialDB(kN) is O(n2))
Involves computing pairwise distances
Load block i and block j to shared memory Data layout in memory should be optimized
Each thread computes distance between a pairof instances
Can utilize this time to load next chunk of datafrom host to device memory
Writes results to corresponding output block
Sorting can be done efficiently in CUDA [29]
d
n
T
n
n
Chawla and Chandola Anomaly Detection
Introduction Data Mining Methods Density-based anomaly Commute Time Approach Addressing Scalability Anomalies in Complex Data Evaluating Anomaly Detection Methods Applications Problem solutionsCategorical Data Discrete Sequences and Time Series Contextual Anomalies Collective Anomalies
Moving Beyond Multi-dimensional Record Data
Categorical (Mixed)
Fraud Detection
Cyber Networks
Time Series
Sensor Networks
Healthcare
Discrete Sequences
Genomic
System Calls
Spatial
GIS
Image analysis
Spatio-temporal
Remote sensing
Climate
Graphs
Social networks
Epidemiology
Chawla and Chandola Anomaly Detection
Introduction Data Mining Methods Density-based anomaly Commute Time Approach Addressing Scalability Anomalies in Complex Data Evaluating Anomaly Detection Methods Applications Problem solutionsCategorical Data Discrete Sequences and Time Series Contextual Anomalies Collective Anomalies
Handling Categorical Data
Each attribute can belong to one of many categories
No ordering between categories
Mixed data (categorical and continuous attributes)
cap-shape cap-surface middot middot middot habitat type
convex smooth urban poisonousconvex smooth grasses ediblebell smooth meadows edibleconvex scaly urban poisonousconvex smooth grasses ediblemiddot middot middot
Table Mushroom Data Set [2]
Chawla and Chandola Anomaly Detection
Introduction Data Mining Methods Density-based anomaly Commute Time Approach Addressing Scalability Anomalies in Complex Data Evaluating Anomaly Detection Methods Applications Problem solutionsCategorical Data Discrete Sequences and Time Series Contextual Anomalies Collective Anomalies
Approaches to Identify Categorical Anomalies
Using Association Analysis [24]
Binarize data
Learn rules (X rArr Y ) Choose high confidence
rules (P (Y |X))
For test record Z = 〈XY 〉find rules of the formP (Y |X)
Y is not observed whenX is observed
Using Bayesian Networks [33]
Learn Bayesian networkstructure and parameters
Compute P (Z) for test datarecord Z
Flag anomaly if P (Z) lt δ
Using Similarity Metrics [10]
Use a similarity measure (S(X1 X2))
Apply distancedensityclustering based method (eg lof)
Chawla and Chandola Anomaly Detection
Introduction Data Mining Methods Density-based anomaly Commute Time Approach Addressing Scalability Anomalies in Complex Data Evaluating Anomaly Detection Methods Applications Problem solutionsCategorical Data Discrete Sequences and Time Series Contextual Anomalies Collective Anomalies
Conditional Probability Test [18]
Identify unusual combinations of attribute values
r(at bt) =P (at bt)
P (at)P (bt)
A capB = φ Assumption If r(at bt) is low and is observed in test record t
then t is anomalous For a test record t
For each mutually exclusive pair of attribute sets ABcompute r(at bt)
Score t based on all r-values Assign minimum r-value as score Take product of all r-values
Need to compare exponential pairs of subsets Only consider subsets upto size k Ignore subsets with frequency less than a threshold α Avoid comparing independent subsets of attributes
micro(AB) ge βmicroChawla and Chandola Anomaly Detection
Introduction Data Mining Methods Density-based anomaly Commute Time Approach Addressing Scalability Anomalies in Complex Data Evaluating Anomaly Detection Methods Applications Problem solutionsCategorical Data Discrete Sequences and Time Series Contextual Anomalies Collective Anomalies
Estimating Probabilities for CPT [18]
Maximum LikelihoodEstimation
P (at bt)
P (at)P (bt)=C(at bt)
Ntimes N
C(at)times N
C(bt)
C(at) Number of traininginstances with A = at
N Total number of traininginstances
Laplace Smoothing
E(p) =C(p) + 1
N + 2
r(at bt) =E(at bt)
E(at)times E(bt)
Speedup Tricks
Replace rare attributevalues with genericattribute (reduce arity)
Use efficient datastructure to querying forcounts(AD Trees [26])
ADTrees work fasterfor low arity attributes
Chawla and Chandola Anomaly Detection
Introduction Data Mining Methods Density-based anomaly Commute Time Approach Addressing Scalability Anomalies in Complex Data Evaluating Anomaly Detection Methods Applications Problem solutionsCategorical Data Discrete Sequences and Time Series Contextual Anomalies Collective Anomalies
Finding Anomalies in Discrete Sequences
Many problem formulations
1 Anomalous symbols in asequence
2 Anomalous subsequence in asequence
3 Anomalous sequence in adatabase of sequences
See [11] for a comparativeevaluation [9] for a survey
login pwdmail ssh mail web logoutlogin pwdmail web web web web logoutlogin pwdmail ssh mail web web logoutlogin pwdwebmail ssh webmail logoutloginpwd loginpwd loginpwd logout
Chawla and Chandola Anomaly Detection
Introduction Data Mining Methods Density-based anomaly Commute Time Approach Addressing Scalability Anomalies in Complex Data Evaluating Anomaly Detection Methods Applications Problem solutionsCategorical Data Discrete Sequences and Time Series Contextual Anomalies Collective Anomalies
Treating Sequences as Points
Utilize a distancesimilarity measure Plug into a distancedensityclustering based method
Simplest Hamming Distance
h(Ai Bi) = 1 Ai 6= Bi= 0 Ai = Bi
H(AB) =nsumi=1
h(Ai Bi)
Issues Unequal lengths misalignment Normalized Length of Longest Common Subsequence
D(AB) = 1minus |LCS(AB)|radic|A||B|
Standard Dynamic Programming method is slow Faster versions available (Hunt Szymnaski method [7])
Weaknesses Cannot localize anomalies within a sequence Weak anomaly signals might get lost
Chawla and Chandola Anomaly Detection
Introduction Data Mining Methods Density-based anomaly Commute Time Approach Addressing Scalability Anomalies in Complex Data Evaluating Anomaly Detection Methods Applications Problem solutionsCategorical Data Discrete Sequences and Time Series Contextual Anomalies Collective Anomalies
Using Sliding Windows
Slide a window of size k
Extract all windows from a sequence (nminus k + 1)
Training (Creating a normal dictionary) Store all uniquewindows in all normal sequences and their counts
Testing For each window find the frequency in normal dictionary Anomaly score is inverse of the aggregate frequencies for all
windows (normalized by length)
Many variants exist For each window find the hamming distance to the closest
window in the normal dictionary [16]
Issues Penalizes low frequency windows in the normal dictionary Rewards high frequency windows that might not be relevant Can construct anomalous sequences that will escape detection
Chawla and Chandola Anomaly Detection
Introduction Data Mining Methods Density-based anomaly Commute Time Approach Addressing Scalability Anomalies in Complex Data Evaluating Anomaly Detection Methods Applications Problem solutionsCategorical Data Discrete Sequences and Time Series Contextual Anomalies Collective Anomalies
Using Probabilistic Models
Probability of occurrence of sequence S
P (S) =nprodi=1
P (Si|S1 Siminus1)
Short memory property of sequences
P (Si|S1 Siminus1) = P (Si|Siminusk Siminus1)
Conditional probability estimates for a symbol Si
P (Si|Siminusk Siminus1) =f(Si|Siminusk Si)f(Si|Siminusk Siminus1)
f is estimated from the normal dictionary
Anomaly score for a test sequence is inverse of the normalizedprobability of occurrence
Issues What if the suffix occurs very infrequently in thenormal data (or not at all)
Replace with the longest suffix that occurs sufficient number oftimes [32] - Probabilistic Suffix Trees
Significantly reduces the size of the modelChawla and Chandola Anomaly Detection
Introduction Data Mining Methods Density-based anomaly Commute Time Approach Addressing Scalability Anomalies in Complex Data Evaluating Anomaly Detection Methods Applications Problem solutionsCategorical Data Discrete Sequences and Time Series Contextual Anomalies Collective Anomalies
Finding Contextual Anomalies
Sometimes contextual information isavailable about data
Not used directly as a feature Are well understood no anomalies in
the context Can reduce false positives and yield
interesting anomalies
Example adapted from [30]
Clearest Outlier
Conditional Anomaly
Maximum Daily Temperature
Number
ofFever
Cases
Contextual anomalies - Anomalous with respect to a context Context is defined using environmental variables
Spatial (Latitude Longitude) Graph context (Edges Weights) Temporal location Domain specific (Demographic other)
How to incorporate context Reduce to traditional anomaly detection (subset on context) Explicitly model contextual information (time series spatial)
Chawla and Chandola Anomaly Detection
Introduction Data Mining Methods Density-based anomaly Commute Time Approach Addressing Scalability Anomalies in Complex Data Evaluating Anomaly Detection Methods Applications Problem solutionsCategorical Data Discrete Sequences and Time Series Contextual Anomalies Collective Anomalies
Conditional Anomaly Detection
Data instance d rArru1 u2 udU v1 v2 vdV
dU environmentalattributes
dV indicator attributes u1
u2
U1
U2
U3
v1
v2
V1V2
V3
p(V1|U3) = 02
p(V2|U3) = 02
p(V3|U3) = 06
Algorithm [30]
1 Learn a Gaussian Mixture Model (GMM)U = U1 U2 UnU
each with dimensionality dU2 Learn a set of Gaussians U = V1 V2 VnV
each withdimensionality dV
3 Learn a probabilistic mapping function p(Vj |Ui)4 Score a test instance d = [uv]
S =
nUsumi=1
p(u|Ui)nVsumj=1
p(v|Vj)p(Vj |Ui)
Chawla and Chandola Anomaly Detection
Introduction Data Mining Methods Density-based anomaly Commute Time Approach Addressing Scalability Anomalies in Complex Data Evaluating Anomaly Detection Methods Applications Problem solutionsCategorical Data Discrete Sequences and Time Series Contextual Anomalies Collective Anomalies
Finding Collective Anomalies
Find a collection of data points
Each point by itself is normal
The collection as a whole isanomalous
Relevant when data has inherentstructure and
When domain definition ofanomalies cannot be described aspoint anomalies
A Simple Solution
1 Break data intogroups
2 Compute features foreach group
3 Apply traditionalanomaly detection
Examples
1 Time series
2 Image
3 Spatial clusters ofgalaxies
Chawla and Chandola Anomaly Detection
Introduction Data Mining Methods Density-based anomaly Commute Time Approach Addressing Scalability Anomalies in Complex Data Evaluating Anomaly Detection Methods Applications Problem solutionsCategorical Data Discrete Sequences and Time Series Contextual Anomalies Collective Anomalies
Using Latent Dirichlet Allocation for Group Anomalies
Find anomalous groups in data [34]
Example Spatial clusters of galaxies topics red green emissive words continuous features
Flexible Genre Model (FGM)
For each group
1 Draw a genre 1 2 T 3 ym simM(π)2 Draw topic distribution forym SK 3 θm sim Dir(αym)
3 Draw K topicsβmk sim P (βmk|ηk)k=12K
4 For each point in group
1 Draw topic membershipzmn simM(θn)
2 Generate pointxmn isin P (xmn|βmzmn)
α
zmn
xmn
N
θm
T
π
ηK
ym
β
MK
Model Parameters
M(π) -Multinomial
Genre - Dir(αt)
Topic generatorsP (|ηk)- GIW
Point generatorsP (xmn|βnk) -MultivariateGaussian
Chawla and Chandola Anomaly Detection
Introduction Data Mining Methods Density-based anomaly Commute Time Approach Addressing Scalability Anomalies in Complex Data Evaluating Anomaly Detection Methods Applications Problem solutionsCategorical Data Discrete Sequences and Time Series Contextual Anomalies Collective Anomalies
Inference and Testing for FGM
Inference and Learning Parameters
Approximate inference of latentvariables (Gibbs Sampling)
Use samples to learn parameters(Single step Monte Carlo EM)
Topic 1
Topic 2
Topic 3
Anomaly Detection
Infer the topic distribution θm
Compute negative log likelihood wrt αt
Rationale An anomalous group will be unlikely to begenerated from any genre
Geometric interpretation Mapping each group into a Tdimensional space and finding anomalies
Chawla and Chandola Anomaly Detection
Introduction Data Mining Methods Density-based anomaly Commute Time Approach Addressing Scalability Anomalies in Complex Data Evaluating Anomaly Detection Methods Applications Problem solutions
Evaluating Anomaly Detection Methods - Labels
Labeled validation data set exists Confusion matrix Traditional evaluation metrics
Class imbalance
ROC Curve
Validation set does not exist Use domain expertise to find TP
and FP FN is harder to estimate
Pseudo false negativeestimation techniques [25]
Predicteda n
Actuala TP FNn FP TN
Acc =TP + TNsum
Rec (R) =TP
TP + FN
Prec (P ) =TP
TP + FP
F =2 lowastR lowast PR+ P
Chawla and Chandola Anomaly Detection
Introduction Data Mining Methods Density-based anomaly Commute Time Approach Addressing Scalability Anomalies in Complex Data Evaluating Anomaly Detection Methods Applications Problem solutions
Evaluating Anomaly Detection Methods - Scores
Convert to binary output Use threshold δ on score (Scale
issues [21]) Take top x as anomalies
ROC curve by varying x or δ
Quality of output Does the output ldquosuggestrdquo x or δ Which output is better
Chawla and Chandola Anomaly Detection
Introduction Data Mining Methods Density-based anomaly Commute Time Approach Addressing Scalability Anomalies in Complex Data Evaluating Anomaly Detection Methods Applications Problem solutions
Unifying Scores
Different methods assign scores in differentranges
kNN-based scores [0 1] Lof scores [1 6] ABOD scores [0 80000]
Anomalies have lower scores
Direct scaling to [0 1] might lose distinctionbetween normal and anomalies
Desired scaling Stretch interesting rangesand shrink irrelevant ones
Generalized Procedure for Normalizing Outlier Scores [21] Regularity rArr S(o) ge 0forallo S(o) asymp 0 if o is normal andS(o) 0 if o is anomalous
Normality S is regular and S(o) isin [0 1]forallo
Chawla and Chandola Anomaly Detection
Introduction Data Mining Methods Density-based anomaly Commute Time Approach Addressing Scalability Anomalies in Complex Data Evaluating Anomaly Detection Methods Applications Problem solutions
Regularization and Normalization of Scores
Regularization
1 R(o) = max0 S(o)minus baseS2 R(o) = Smax minus S(o)
3 R(o) = minus log SmaxS(o)
Normalization
1 N(o) = S(o)Smax
2 N(o) = max(
0 erf(S(o)minusmicroSσS radic2
))(Gaussian Scaling)
Suited for high dimensional data
3 N(o) = max(
0cdfγS (o)minusmicroγ
1minusmicroγ
)(Gamma Scaling)
Where cdfγS (o) = P (k S(o) θ) P is the regularized Gamma function Suited for low dimensional data
Chawla and Chandola Anomaly Detection
Introduction Data Mining Methods Density-based anomaly Commute Time Approach Addressing Scalability Anomalies in Complex Data Evaluating Anomaly Detection Methods Applications Problem solutions
Generating Labeled Data for Validation
Generating Both Normal and Anomalous Data
Use generative models for normal and anomalous behavior
Several generators available Multivariate continuous data [27] Multivariate categorical data [5] Discrete sequences using HMM [12]
Drawbacks Might not capture the domain characteristics
Injecting Anomalies - Random Perturbation[30]
Given data point z = xy x and y arepartitions of feature space
Take a random sample D of the entire data set
Let zprime = xprimeyprime isin D such that distancebetween y and yprime is maximum
Replace x with xprime and add z back to data setx
yz
zprime
Injected anomaly
Chawla and Chandola Anomaly Detection
Introduction Data Mining Methods Density-based anomaly Commute Time Approach Addressing Scalability Anomalies in Complex Data Evaluating Anomaly Detection Methods Applications Problem solutionsWhat is Network Anomaly Detection Motivation How Much Serious
Applications Overview
How to set up an anomaly detection solution for agiven application domain
Available data Define anomalies define normal behavior Identify requirements and constraints (online
real-time limited resources) What domain knowledge available
Feature identification Defining normal and anomalous behavior Tuning parameters
Available ground truth (training validation)
Chawla and Chandola Anomaly Detection
Introduction Data Mining Methods Density-based anomaly Commute Time Approach Addressing Scalability Anomalies in Complex Data Evaluating Anomaly Detection Methods Applications Problem solutionsWhat is Network Anomaly Detection Motivation How Much Serious
What is Network Anomaly Detection
Anomaly Detection or Intrusion Detection
Traditional Intrusion Detection Systems (IDS) finding attackscorresponding to predefined pattern data set known as signaturestherefore system is absolutely vulnerable against zero-day attacks
Network Anomaly Detection Systems (NADS) to detectzero-day attacks without any pre-identified signature besides profilenormal behavior of the network and address suspected incidents
Network Anomaly Detection finding unusual and largechanges in the network traffic
Examples intentional attacks (eg Distributed Denial ofService - DDoS) or unusual network traffic (eg flash crowds)
Chawla and Chandola Anomaly Detection
Introduction Data Mining Methods Density-based anomaly Commute Time Approach Addressing Scalability Anomalies in Complex Data Evaluating Anomaly Detection Methods Applications Problem solutionsWhat is Network Anomaly Detection Motivation How Much Serious
Motivation How Much Serious
According to Symantec report released in early 2011 morethan 286 million new threats have been detected in 2010which is a huge number
1656227
2704836
1000000
1500000
2000000
2500000
3000000
20547 18827 69107 113025 140690
624267
1656227
2704836
0
500000
1000000
1500000
2000000
2500000
3000000
2002 2003 2004 2005 2006 2007 2008 July2009-June2010
Chawla and Chandola Anomaly Detection
Introduction Data Mining Methods Density-based anomaly Commute Time Approach Addressing Scalability Anomalies in Complex Data Evaluating Anomaly Detection Methods Applications Problem solutionsNetwork Topology Network Anomalies Detection Problem Network Anomalies Detection Problem Why care about OD Flows
Network Topology
A Typical network
1 y
Router
2
3
41t
x2t
x1t
x3t
x4t
Origin-Destination (OD) flow is the traffic that enters at anorigin node and exits at a destination node of a backbonenetwork x1t x1t
Link measurement is the traffic enters at an node during aninterval y1t
Relationship between link traffic and OD flow traffic iscaptured by the routing matrix A
Chawla and Chandola Anomaly Detection
Introduction Data Mining Methods Density-based anomaly Commute Time Approach Addressing Scalability Anomalies in Complex Data Evaluating Anomaly Detection Methods Applications Problem solutionsNetwork Topology Network Anomalies Detection Problem Network Anomalies Detection Problem Why care about OD Flows
Network Anomalies Detection Problem
Chawla and Chandola Anomaly Detection
Introduction Data Mining Methods Density-based anomaly Commute Time Approach Addressing Scalability Anomalies in Complex Data Evaluating Anomaly Detection Methods Applications Problem solutionsNetwork Topology Network Anomalies Detection Problem Network Anomalies Detection Problem Why care about OD Flows
Network Anomalies Detection Problem
Chawla and Chandola Anomaly Detection
Introduction Data Mining Methods Density-based anomaly Commute Time Approach Addressing Scalability Anomalies in Complex Data Evaluating Anomaly Detection Methods Applications Problem solutionsNetwork Topology Network Anomalies Detection Problem Network Anomalies Detection Problem Why care about OD Flows
Why care about OD Flows
Volume anomaly typically arises on an OD flow (trafficarriving at one node and destined for another node)
If we only monitor traffic on network links volume arisingfrom an OD flow may not be noticeable Thus naiveapproach wont work if OD flow info is not available
Figure source [22]
Chawla and Chandola Anomaly Detection
Introduction Data Mining Methods Density-based anomaly Commute Time Approach Addressing Scalability Anomalies in Complex Data Evaluating Anomaly Detection Methods Applications Problem solutionsPCA and Subspace Method Subspace Method Algorithm Subspace Analysis Results Discussion Typical Characteristics of Anomaly Limitation of Volume Entropy Based versus Volume Based Fraud Detection Epidemeology Anomaly Detection in Climate and Weather Anomalies in Climate Validation of Anomalies
PCA and Subspace Method
Chawla and Chandola Anomaly Detection
Introduction Data Mining Methods Density-based anomaly Commute Time Approach Addressing Scalability Anomalies in Complex Data Evaluating Anomaly Detection Methods Applications Problem solutionsPCA and Subspace Method Subspace Method Algorithm Subspace Analysis Results Discussion Typical Characteristics of Anomaly Limitation of Volume Entropy Based versus Volume Based Fraud Detection Epidemeology Anomaly Detection in Climate and Weather Anomalies in Climate Validation of Anomalies
Subspace Method Algorithm
Step1- Determine the PCs based on eigenvaluedecomposition of the covariance matrix of the dataset
Step2- Choose first top k principle components with thehighest eigenvalues as matrix P
Step3-normal traffic subspace called Z
Z = PP TZ = CZ
Step4-abnormal traffic subspace called Z
Z = (I minus PP T )Z = CZ
Step5-If the norm of a vector is large then it is an rdquoanomalyrdquo
Chawla and Chandola Anomaly Detection
Introduction Data Mining Methods Density-based anomaly Commute Time Approach Addressing Scalability Anomalies in Complex Data Evaluating Anomaly Detection Methods Applications Problem solutionsPCA and Subspace Method Subspace Method Algorithm Subspace Analysis Results Discussion Typical Characteristics of Anomaly Limitation of Volume Entropy Based versus Volume Based Fraud Detection Epidemeology Anomaly Detection in Climate and Weather Anomalies in Climate Validation of Anomalies
Subspace Analysis Results
Note that during anomaly normal component does not changethat much while residual component changes quite a lot
Thus anomalies can be detected by setting some threshold
Figure source [22]
Chawla and Chandola Anomaly Detection
Introduction Data Mining Methods Density-based anomaly Commute Time Approach Addressing Scalability Anomalies in Complex Data Evaluating Anomaly Detection Methods Applications Problem solutionsPCA and Subspace Method Subspace Method Algorithm Subspace Analysis Results Discussion Typical Characteristics of Anomaly Limitation of Volume Entropy Based versus Volume Based Fraud Detection Epidemeology Anomaly Detection in Climate and Weather Anomalies in Climate Validation of Anomalies
Discussion Typical Characteristics of Anomaly
Most Anomalies induce a change in distributionalaspects of packet header fields (called features)
Most important features include 5-tuple Source ampdestination IP addresses Source and destination portnumbers and IP protocol
raquo DOS attack ndash multiple source IP address concentrated on asingle destination IP address
raquo Network scan ndash dispersed distribution of destination addresses
raquo Most wormsviruses also induce some change in distribution ofcertain features
raquo However these changes can be very subtle and mining them islike searching for needles in a haystack
Unlike many previous approach this paper aims todetect events which disturb the distribution of trafficfeatures rather than traffic volume
Chawla and Chandola Anomaly Detection
Introduction Data Mining Methods Density-based anomaly Commute Time Approach Addressing Scalability Anomalies in Complex Data Evaluating Anomaly Detection Methods Applications Problem solutionsPCA and Subspace Method Subspace Method Algorithm Subspace Analysis Results Discussion Typical Characteristics of Anomaly Limitation of Volume Entropy Based versus Volume Based Fraud Detection Epidemeology Anomaly Detection in Climate and Weather Anomalies in Climate Validation of Anomalies
Limitation of Volume
Figure source [22]
Port scan anomaly (traffic feature changes however traffic volume
remains more or less the same)
We can use entropy tocapture the variationsin the traffic feature
bullTakes value 0 when distribution is maximally concentratedbullTakes value log2N when distribution is maximally dispersed
But stands out in
feature entropy
which also reveals
its structure
Port scan
dwarfed
in volume
metricshellip
Chawla and Chandola Anomaly Detection
Introduction Data Mining Methods Density-based anomaly Commute Time Approach Addressing Scalability Anomalies in Complex Data Evaluating Anomaly Detection Methods Applications Problem solutionsPCA and Subspace Method Subspace Method Algorithm Subspace Analysis Results Discussion Typical Characteristics of Anomaly Limitation of Volume Entropy Based versus Volume Based Fraud Detection Epidemeology Anomaly Detection in Climate and Weather Anomalies in Climate Validation of Anomalies
Entropy Based versus Volume Based
DoSDDoS Attacks- a spike in traffic data toward adominant destination IP
Scan anomaly-a spike in traffic data from a dominant sourceIP
Flash Crowd anomaly- again a spike in traffic data to adominant destination IP
Worm anomaly-a Spike in traffic with a dominant port
Chawla and Chandola Anomaly Detection
Introduction Data Mining Methods Density-based anomaly Commute Time Approach Addressing Scalability Anomalies in Complex Data Evaluating Anomaly Detection Methods Applications Problem solutionsPCA and Subspace Method Subspace Method Algorithm Subspace Analysis Results Discussion Typical Characteristics of Anomaly Limitation of Volume Entropy Based versus Volume Based Fraud Detection Epidemeology Anomaly Detection in Climate and Weather Anomalies in Climate Validation of Anomalies
Fraud Detection
Domain Question Identifyfraudulent activities or players fromobserved transaction data
Data Transactions between different
players in the system Meta information about the
individuals An underlying graph structure
Challenges Track and model human behavior Anomalies caused by adaptive
human adversaries Massive data sizes
Insurance (autohealtha)
ClaimantProvider Payer
Telecommunications Customer
Provider
Credit Cards Customer
Supplier Bank
Web Advertising User Advertiser
Publisher
ahttpwwwcheatingculturecompast-cases-of-medicare-fraud
Chawla and Chandola Anomaly Detection
Introduction Data Mining Methods Density-based anomaly Commute Time Approach Addressing Scalability Anomalies in Complex Data Evaluating Anomaly Detection Methods Applications Problem solutionsPCA and Subspace Method Subspace Method Algorithm Subspace Analysis Results Discussion Typical Characteristics of Anomaly Limitation of Volume Entropy Based versus Volume Based Fraud Detection Epidemeology Anomaly Detection in Climate and Weather Anomalies in Climate Validation of Anomalies
A Generic Fraud Detection Method
Activity Monitoring [13]1 Build profiles for individuals (customers users etc) based on
historic data User X makes n calls on an average in January
2 Compare current behavior with historical profile for significantdeviations
Clustering based [4]1 Cluster historical profiles of customers2 Identify small clusters or outlying profiles as anomalies
Strengths Anomaly detection is fast (good for real time) Results are easy to explain
Weaknesses Need to create and maintain a large number of profiles Not dynamic Adequate historical data might not be available Too many false positives
Chawla and Chandola Anomaly Detection
Introduction Data Mining Methods Density-based anomaly Commute Time Approach Addressing Scalability Anomalies in Complex Data Evaluating Anomaly Detection Methods Applications Problem solutionsPCA and Subspace Method Subspace Method Algorithm Subspace Analysis Results Discussion Typical Characteristics of Anomaly Limitation of Volume Entropy Based versus Volume Based Fraud Detection Epidemeology Anomaly Detection in Climate and Weather Anomalies in Climate Validation of Anomalies
Exploiting Graph Structure - Weighted Graphs
Represent data as a weighted graph Communication networks (phone email SMS) Provider referral networks
Objective Identify anomalous nodes
For each node extract several features based on the propertiesof the induced sub-graph (egonet) of neighboring nodes [1]
Choose features that can highlight anomalous nodes
1 Ni degree of node2 Ei number of edges in egonet3 Wi total weight of egonet4 λi principal eigen vector of weighted adjacency matrix of
egonet
Data is transformed into a point in a multi-dimensional space
Chawla and Chandola Anomaly Detection
Introduction Data Mining Methods Density-based anomaly Commute Time Approach Addressing Scalability Anomalies in Complex Data Evaluating Anomaly Detection Methods Applications Problem solutionsPCA and Subspace Method Subspace Method Algorithm Subspace Analysis Results Discussion Typical Characteristics of Anomaly Limitation of Volume Entropy Based versus Volume Based Fraud Detection Epidemeology Anomaly Detection in Climate and Weather Anomalies in Climate Validation of Anomalies
Identifying Anomalies
Traditional anomaly detection (lof) Can be slow but can identify any type of anomalous structure
Faster method to identify specific types of anomalousstructures
Identify relevant feature pairs and power law relationship
Eg Egonet Density Power Law Ni vs Ei - detect nearcliques and stars
Ei prop Nαi 1 le α le 2
Anomaly score for node i wrt a pair of features (y = Cxθ)
Si =max(yi Cx
θi )
min(yi Cxθi )lowast log (|yi minus Cxθi |+ 1)
Chawla and Chandola Anomaly Detection
Introduction Data Mining Methods Density-based anomaly Commute Time Approach Addressing Scalability Anomalies in Complex Data Evaluating Anomaly Detection Methods Applications Problem solutionsPCA and Subspace Method Subspace Method Algorithm Subspace Analysis Results Discussion Typical Characteristics of Anomaly Limitation of Volume Entropy Based versus Volume Based Fraud Detection Epidemeology Anomaly Detection in Climate and Weather Anomalies in Climate Validation of Anomalies
Exploiting Graph Structure - Bipartite Graphs
Represent data as a bipartite graph Healthcare Data (Beneficiaries vs Providers) Insider trading (Traders vs Stocks)
Objective Identify anomalous links
Given a query node a isin V1 find the ldquorelevancerdquoof all other nodes in V1 to a
RelevanceScore(a b) prop Number of times aldquorandom walkrdquo from a reaches b
Use the relevance scores to compute thenormality scores for a node t isin V2
Find set St = a|〈a t〉 isin E Compute |St| times |St| similarity matrix using
relevance vectors for a isin St Normality Score = mean of non-diagonal entries
of similarity matrix
V1 E V2a1
a2
a3
an
t1
t2
t3
tn
Chawla and Chandola Anomaly Detection
Introduction Data Mining Methods Density-based anomaly Commute Time Approach Addressing Scalability Anomalies in Complex Data Evaluating Anomaly Detection Methods Applications Problem solutionsPCA and Subspace Method Subspace Method Algorithm Subspace Analysis Results Discussion Typical Characteristics of Anomaly Limitation of Volume Entropy Based versus Volume Based Fraud Detection Epidemeology Anomaly Detection in Climate and Weather Anomalies in Climate Validation of Anomalies
Detecting Disease Outbreaks
Domain Question Early detection of disease
outbreaks Anthrax attack
Data Emergency department visits Grocery data (Example [14]) Clinical visits Weatherclimate data
Challenges Weak signals in the data
ED cases involving cough rArrFlu or SARS
Integration of multiple signals(lag analysis)
Account for spatial and temporalcorrelations
Chawla and Chandola Anomaly Detection
Introduction Data Mining Methods Density-based anomaly Commute Time Approach Addressing Scalability Anomalies in Complex Data Evaluating Anomaly Detection Methods Applications Problem solutionsPCA and Subspace Method Subspace Method Algorithm Subspace Analysis Results Discussion Typical Characteristics of Anomaly Limitation of Volume Entropy Based versus Volume Based Fraud Detection Epidemeology Anomaly Detection in Climate and Weather Anomalies in Climate Validation of Anomalies
Whatrsquos Significant About Recent Events (WSARE) [33]
1 Learn Bayesian network from historical data Environmental and response variables
2 Sample from the BN (DBbaseline|Current Environment)3 Compute contingency table for rules for DBbaseline andDBcurrent
Rules are single assignment rules (Xi = Y ji ) or conjunctions4 Find p-value for rules using χ2-test
Null Hypothesis Rows and columns of tables for DBbaselineand DBcurrent are independent
5 Find rule with largest p-value Repeat Step 2
Chawla and Chandola Anomaly Detection
Introduction Data Mining Methods Density-based anomaly Commute Time Approach Addressing Scalability Anomalies in Complex Data Evaluating Anomaly Detection Methods Applications Problem solutionsPCA and Subspace Method Subspace Method Algorithm Subspace Analysis Results Discussion Typical Characteristics of Anomaly Limitation of Volume Entropy Based versus Volume Based Fraud Detection Epidemeology Anomaly Detection in Climate and Weather Anomalies in Climate Validation of Anomalies
Incorporating Spatial and Temporal Relationships
WSARE does not explicitly model the spatial and temporalrelationships
What happened yesterday What happened in the adjoining neighborhood (yesterday)
Bayesian Network Spatio-Temporal (BNST) modelingframework [17]
Add nodes for temporal and spatial dependencies Need more data to train
Chawla and Chandola Anomaly Detection
Introduction Data Mining Methods Density-based anomaly Commute Time Approach Addressing Scalability Anomalies in Complex Data Evaluating Anomaly Detection Methods Applications Problem solutionsPCA and Subspace Method Subspace Method Algorithm Subspace Analysis Results Discussion Typical Characteristics of Anomaly Limitation of Volume Entropy Based versus Volume Based Fraud Detection Epidemeology Anomaly Detection in Climate and Weather Anomalies in Climate Validation of Anomalies
Anomaly Detection in Climate and Weather
Science Questions Identify natural and anthropogenic disasters Identify long time scale events - droughts atmospheric rivers
cold fronts etc
Data Ground observations Remote sensing data (satellites
air-borne) Climate model simulation outputs Multiple variables spatio-temporal (often has height dimension
as well)
Challenges Model spatio-temporal relationships across multiple variables Explain the cause of anomalies Massive data sizes
Climate and weather extreme events are well defined
Key challenge is to find significant events and explain the cause
Chawla and Chandola Anomaly Detection
Introduction Data Mining Methods Density-based anomaly Commute Time Approach Addressing Scalability Anomalies in Complex Data Evaluating Anomaly Detection Methods Applications Problem solutionsPCA and Subspace Method Subspace Method Algorithm Subspace Analysis Results Discussion Typical Characteristics of Anomaly Limitation of Volume Entropy Based versus Volume Based Fraud Detection Epidemeology Anomaly Detection in Climate and Weather Anomalies in Climate Validation of Anomalies
Anomalies are Widely Used in Climate
Most analysis done on ldquoanomalyrdquo time series
Difference from a ldquobase periodrdquo (Toosimplistic)
Brings spatial smoothness (eg a mountaintop and nearby valley can have very differenttemperatures) Removes seasonality
Understand climate and weatherphenomenon
Southern Oscillation Index (SOI) Difference between Sea Level Pressure
(SLP) anomalies for Tahiti and DarwinAustralia
Figure Global AverageTemperature Anomaly(1975 - 2007) Srcwwwmetofficegovuk
Chawla and Chandola Anomaly Detection
Introduction Data Mining Methods Density-based anomaly Commute Time Approach Addressing Scalability Anomalies in Complex Data Evaluating Anomaly Detection Methods Applications Problem solutionsPCA and Subspace Method Subspace Method Algorithm Subspace Analysis Results Discussion Typical Characteristics of Anomaly Limitation of Volume Entropy Based versus Volume Based Fraud Detection Epidemeology Anomaly Detection in Climate and Weather Anomalies in Climate Validation of Anomalies
Constructing Anomalies from Raw Data
Anomaly time series for a given location i
vprimei = vi minus bi
where bi is the base (reference)
How to choose bi Mean of all data for location i Monthly mean values (account for seasonality) Monthly z-score values Median (more robust) Using a shorter ldquoreference periodrdquo
30 year moving window
Different methods show statistically significant differences[19] What is the right strategy Weighted mean of different strategies (Pick weights using
Monte Carlo sampling)
Chawla and Chandola Anomaly Detection
Introduction Data Mining Methods Density-based anomaly Commute Time Approach Addressing Scalability Anomalies in Complex Data Evaluating Anomaly Detection Methods Applications Problem solutionsPCA and Subspace Method Subspace Method Algorithm Subspace Analysis Results Discussion Typical Characteristics of Anomaly Limitation of Volume Entropy Based versus Volume Based Fraud Detection Epidemeology Anomaly Detection in Climate and Weather Anomalies in Climate Validation of Anomalies
Anomaly Detection for Identifying Droughts
Science question Identify significant drought patterns usinghistorical observation data or future simulation data or both
Find persistent spatiotemporal anomalies in precipitation data
A two step approach
1 Find precipitationanomalies usingthresholds
2 Find large connectedcomponents across spaceand time
Matlab - bwlabelbwlabeln
Followup Science questionExplain cause
(drought190120061avi)
Figure Video courtsey Dr ArindamBanerjee
Chawla and Chandola Anomaly Detection

Introduction Data Mining Methods Density-based anomaly Commute Time Approach Addressing Scalability Anomalies in Complex Data Evaluating Anomaly Detection Methods Applications Problem solutions
Addressing Scalability
Chawla and Chandola Anomaly Detection
Introduction Data Mining Methods Density-based anomaly Commute Time Approach Addressing Scalability Anomalies in Complex Data Evaluating Anomaly Detection Methods Applications Problem solutions
Using GPUs for Anomaly Detection
Well suited for data parallel algorithms Using CUDA - Compute Unified Device
Architecture (Nvidia)
Need to re-engineer existing algorithms Utilization of device memory Minimize CPUhArrGPU transfer of data Keep threads homogeneous
Most model based algorithms arenaturally setup for the testing phase
Model building needs careful redesign
What about unsupervised algorithms
Kernel
Host
Grid
Device
Block(00)
Block(01)
Block(02)
Block(10)
Block(11)
Block(12)
Thread Block
Thread(00)
Thread(01)
Thread(02)
Thread(03)
Thread(10)
Thread(11)
Thread(12)
Thread(13)
Thread(20)
Thread(21)
Thread(22)
Thread(23)
Host Host Memory
SM 2
SM 1
SM 0
Registers Registers Registers
SP 0 SP 1 SP 7
Shared Memory
Global Memory
Texture Memory
Constant Memory
Device
Chawla and Chandola Anomaly Detection
Introduction Data Mining Methods Density-based anomaly Commute Time Approach Addressing Scalability Anomalies in Complex Data Evaluating Anomaly Detection Methods Applications Problem solutions
Implementing DB(kN) on GPUs
Return top N data instances whose distances tok-th nearest neighbor are largest (SerialDB(kN) is O(n2))
Involves computing pairwise distances
Load block i and block j to shared memory Data layout in memory should be optimized
Each thread computes distance between a pairof instances
Can utilize this time to load next chunk of datafrom host to device memory
Writes results to corresponding output block
Sorting can be done efficiently in CUDA [29]
d
n
T
n
n
Chawla and Chandola Anomaly Detection
Introduction Data Mining Methods Density-based anomaly Commute Time Approach Addressing Scalability Anomalies in Complex Data Evaluating Anomaly Detection Methods Applications Problem solutionsCategorical Data Discrete Sequences and Time Series Contextual Anomalies Collective Anomalies
Moving Beyond Multi-dimensional Record Data
Categorical (Mixed)
Fraud Detection
Cyber Networks
Time Series
Sensor Networks
Healthcare
Discrete Sequences
Genomic
System Calls
Spatial
GIS
Image analysis
Spatio-temporal
Remote sensing
Climate
Graphs
Social networks
Epidemiology
Chawla and Chandola Anomaly Detection
Introduction Data Mining Methods Density-based anomaly Commute Time Approach Addressing Scalability Anomalies in Complex Data Evaluating Anomaly Detection Methods Applications Problem solutionsCategorical Data Discrete Sequences and Time Series Contextual Anomalies Collective Anomalies
Handling Categorical Data
Each attribute can belong to one of many categories
No ordering between categories
Mixed data (categorical and continuous attributes)
cap-shape cap-surface middot middot middot habitat type
convex smooth urban poisonousconvex smooth grasses ediblebell smooth meadows edibleconvex scaly urban poisonousconvex smooth grasses ediblemiddot middot middot
Table Mushroom Data Set [2]
Chawla and Chandola Anomaly Detection
Introduction Data Mining Methods Density-based anomaly Commute Time Approach Addressing Scalability Anomalies in Complex Data Evaluating Anomaly Detection Methods Applications Problem solutionsCategorical Data Discrete Sequences and Time Series Contextual Anomalies Collective Anomalies
Approaches to Identify Categorical Anomalies
Using Association Analysis [24]
Binarize data
Learn rules (X rArr Y ) Choose high confidence
rules (P (Y |X))
For test record Z = 〈XY 〉find rules of the formP (Y |X)
Y is not observed whenX is observed
Using Bayesian Networks [33]
Learn Bayesian networkstructure and parameters
Compute P (Z) for test datarecord Z
Flag anomaly if P (Z) lt δ
Using Similarity Metrics [10]
Use a similarity measure (S(X1 X2))
Apply distancedensityclustering based method (eg lof)
Chawla and Chandola Anomaly Detection
Introduction Data Mining Methods Density-based anomaly Commute Time Approach Addressing Scalability Anomalies in Complex Data Evaluating Anomaly Detection Methods Applications Problem solutionsCategorical Data Discrete Sequences and Time Series Contextual Anomalies Collective Anomalies
Conditional Probability Test [18]
Identify unusual combinations of attribute values
r(at bt) =P (at bt)
P (at)P (bt)
A capB = φ Assumption If r(at bt) is low and is observed in test record t
then t is anomalous For a test record t
For each mutually exclusive pair of attribute sets ABcompute r(at bt)
Score t based on all r-values Assign minimum r-value as score Take product of all r-values
Need to compare exponential pairs of subsets Only consider subsets upto size k Ignore subsets with frequency less than a threshold α Avoid comparing independent subsets of attributes
micro(AB) ge βmicroChawla and Chandola Anomaly Detection
Introduction Data Mining Methods Density-based anomaly Commute Time Approach Addressing Scalability Anomalies in Complex Data Evaluating Anomaly Detection Methods Applications Problem solutionsCategorical Data Discrete Sequences and Time Series Contextual Anomalies Collective Anomalies
Estimating Probabilities for CPT [18]
Maximum LikelihoodEstimation
P (at bt)
P (at)P (bt)=C(at bt)
Ntimes N
C(at)times N
C(bt)
C(at) Number of traininginstances with A = at
N Total number of traininginstances
Laplace Smoothing
E(p) =C(p) + 1
N + 2
r(at bt) =E(at bt)
E(at)times E(bt)
Speedup Tricks
Replace rare attributevalues with genericattribute (reduce arity)
Use efficient datastructure to querying forcounts(AD Trees [26])
ADTrees work fasterfor low arity attributes
Chawla and Chandola Anomaly Detection
Introduction Data Mining Methods Density-based anomaly Commute Time Approach Addressing Scalability Anomalies in Complex Data Evaluating Anomaly Detection Methods Applications Problem solutionsCategorical Data Discrete Sequences and Time Series Contextual Anomalies Collective Anomalies
Finding Anomalies in Discrete Sequences
Many problem formulations
1 Anomalous symbols in asequence
2 Anomalous subsequence in asequence
3 Anomalous sequence in adatabase of sequences
See [11] for a comparativeevaluation [9] for a survey
login pwdmail ssh mail web logoutlogin pwdmail web web web web logoutlogin pwdmail ssh mail web web logoutlogin pwdwebmail ssh webmail logoutloginpwd loginpwd loginpwd logout
Chawla and Chandola Anomaly Detection
Introduction Data Mining Methods Density-based anomaly Commute Time Approach Addressing Scalability Anomalies in Complex Data Evaluating Anomaly Detection Methods Applications Problem solutionsCategorical Data Discrete Sequences and Time Series Contextual Anomalies Collective Anomalies
Treating Sequences as Points
Utilize a distancesimilarity measure Plug into a distancedensityclustering based method
Simplest Hamming Distance
h(Ai Bi) = 1 Ai 6= Bi= 0 Ai = Bi
H(AB) =nsumi=1
h(Ai Bi)
Issues Unequal lengths misalignment Normalized Length of Longest Common Subsequence
D(AB) = 1minus |LCS(AB)|radic|A||B|
Standard Dynamic Programming method is slow Faster versions available (Hunt Szymnaski method [7])
Weaknesses Cannot localize anomalies within a sequence Weak anomaly signals might get lost
Chawla and Chandola Anomaly Detection
Introduction Data Mining Methods Density-based anomaly Commute Time Approach Addressing Scalability Anomalies in Complex Data Evaluating Anomaly Detection Methods Applications Problem solutionsCategorical Data Discrete Sequences and Time Series Contextual Anomalies Collective Anomalies
Using Sliding Windows
Slide a window of size k
Extract all windows from a sequence (nminus k + 1)
Training (Creating a normal dictionary) Store all uniquewindows in all normal sequences and their counts
Testing For each window find the frequency in normal dictionary Anomaly score is inverse of the aggregate frequencies for all
windows (normalized by length)
Many variants exist For each window find the hamming distance to the closest
window in the normal dictionary [16]
Issues Penalizes low frequency windows in the normal dictionary Rewards high frequency windows that might not be relevant Can construct anomalous sequences that will escape detection
Chawla and Chandola Anomaly Detection
Introduction Data Mining Methods Density-based anomaly Commute Time Approach Addressing Scalability Anomalies in Complex Data Evaluating Anomaly Detection Methods Applications Problem solutionsCategorical Data Discrete Sequences and Time Series Contextual Anomalies Collective Anomalies
Using Probabilistic Models
Probability of occurrence of sequence S
P (S) =nprodi=1
P (Si|S1 Siminus1)
Short memory property of sequences
P (Si|S1 Siminus1) = P (Si|Siminusk Siminus1)
Conditional probability estimates for a symbol Si
P (Si|Siminusk Siminus1) =f(Si|Siminusk Si)f(Si|Siminusk Siminus1)
f is estimated from the normal dictionary
Anomaly score for a test sequence is inverse of the normalizedprobability of occurrence
Issues What if the suffix occurs very infrequently in thenormal data (or not at all)
Replace with the longest suffix that occurs sufficient number oftimes [32] - Probabilistic Suffix Trees
Significantly reduces the size of the modelChawla and Chandola Anomaly Detection
Introduction Data Mining Methods Density-based anomaly Commute Time Approach Addressing Scalability Anomalies in Complex Data Evaluating Anomaly Detection Methods Applications Problem solutionsCategorical Data Discrete Sequences and Time Series Contextual Anomalies Collective Anomalies
Finding Contextual Anomalies
Sometimes contextual information isavailable about data
Not used directly as a feature Are well understood no anomalies in
the context Can reduce false positives and yield
interesting anomalies
Example adapted from [30]
Clearest Outlier
Conditional Anomaly
Maximum Daily Temperature
Number
ofFever
Cases
Contextual anomalies - Anomalous with respect to a context Context is defined using environmental variables
Spatial (Latitude Longitude) Graph context (Edges Weights) Temporal location Domain specific (Demographic other)
How to incorporate context Reduce to traditional anomaly detection (subset on context) Explicitly model contextual information (time series spatial)
Chawla and Chandola Anomaly Detection
Introduction Data Mining Methods Density-based anomaly Commute Time Approach Addressing Scalability Anomalies in Complex Data Evaluating Anomaly Detection Methods Applications Problem solutionsCategorical Data Discrete Sequences and Time Series Contextual Anomalies Collective Anomalies
Conditional Anomaly Detection
Data instance d rArru1 u2 udU v1 v2 vdV
dU environmentalattributes
dV indicator attributes u1
u2
U1
U2
U3
v1
v2
V1V2
V3
p(V1|U3) = 02
p(V2|U3) = 02
p(V3|U3) = 06
Algorithm [30]
1 Learn a Gaussian Mixture Model (GMM)U = U1 U2 UnU
each with dimensionality dU2 Learn a set of Gaussians U = V1 V2 VnV
each withdimensionality dV
3 Learn a probabilistic mapping function p(Vj |Ui)4 Score a test instance d = [uv]
S =
nUsumi=1
p(u|Ui)nVsumj=1
p(v|Vj)p(Vj |Ui)
Chawla and Chandola Anomaly Detection
Introduction Data Mining Methods Density-based anomaly Commute Time Approach Addressing Scalability Anomalies in Complex Data Evaluating Anomaly Detection Methods Applications Problem solutionsCategorical Data Discrete Sequences and Time Series Contextual Anomalies Collective Anomalies
Finding Collective Anomalies
Find a collection of data points
Each point by itself is normal
The collection as a whole isanomalous
Relevant when data has inherentstructure and
When domain definition ofanomalies cannot be described aspoint anomalies
A Simple Solution
1 Break data intogroups
2 Compute features foreach group
3 Apply traditionalanomaly detection
Examples
1 Time series
2 Image
3 Spatial clusters ofgalaxies
Chawla and Chandola Anomaly Detection
Introduction Data Mining Methods Density-based anomaly Commute Time Approach Addressing Scalability Anomalies in Complex Data Evaluating Anomaly Detection Methods Applications Problem solutionsCategorical Data Discrete Sequences and Time Series Contextual Anomalies Collective Anomalies
Using Latent Dirichlet Allocation for Group Anomalies
Find anomalous groups in data [34]
Example Spatial clusters of galaxies topics red green emissive words continuous features
Flexible Genre Model (FGM)
For each group
1 Draw a genre 1 2 T 3 ym simM(π)2 Draw topic distribution forym SK 3 θm sim Dir(αym)
3 Draw K topicsβmk sim P (βmk|ηk)k=12K
4 For each point in group
1 Draw topic membershipzmn simM(θn)
2 Generate pointxmn isin P (xmn|βmzmn)
α
zmn
xmn
N
θm
T
π
ηK
ym
β
MK
Model Parameters
M(π) -Multinomial
Genre - Dir(αt)
Topic generatorsP (|ηk)- GIW
Point generatorsP (xmn|βnk) -MultivariateGaussian
Chawla and Chandola Anomaly Detection
Introduction Data Mining Methods Density-based anomaly Commute Time Approach Addressing Scalability Anomalies in Complex Data Evaluating Anomaly Detection Methods Applications Problem solutionsCategorical Data Discrete Sequences and Time Series Contextual Anomalies Collective Anomalies
Inference and Testing for FGM
Inference and Learning Parameters
Approximate inference of latentvariables (Gibbs Sampling)
Use samples to learn parameters(Single step Monte Carlo EM)
Topic 1
Topic 2
Topic 3
Anomaly Detection
Infer the topic distribution θm
Compute negative log likelihood wrt αt
Rationale An anomalous group will be unlikely to begenerated from any genre
Geometric interpretation Mapping each group into a Tdimensional space and finding anomalies
Chawla and Chandola Anomaly Detection
Introduction Data Mining Methods Density-based anomaly Commute Time Approach Addressing Scalability Anomalies in Complex Data Evaluating Anomaly Detection Methods Applications Problem solutions
Evaluating Anomaly Detection Methods - Labels
Labeled validation data set exists Confusion matrix Traditional evaluation metrics
Class imbalance
ROC Curve
Validation set does not exist Use domain expertise to find TP
and FP FN is harder to estimate
Pseudo false negativeestimation techniques [25]
Predicteda n
Actuala TP FNn FP TN
Acc =TP + TNsum
Rec (R) =TP
TP + FN
Prec (P ) =TP
TP + FP
F =2 lowastR lowast PR+ P
Chawla and Chandola Anomaly Detection
Introduction Data Mining Methods Density-based anomaly Commute Time Approach Addressing Scalability Anomalies in Complex Data Evaluating Anomaly Detection Methods Applications Problem solutions
Evaluating Anomaly Detection Methods - Scores
Convert to binary output Use threshold δ on score (Scale
issues [21]) Take top x as anomalies
ROC curve by varying x or δ
Quality of output Does the output ldquosuggestrdquo x or δ Which output is better
Chawla and Chandola Anomaly Detection
Introduction Data Mining Methods Density-based anomaly Commute Time Approach Addressing Scalability Anomalies in Complex Data Evaluating Anomaly Detection Methods Applications Problem solutions
Unifying Scores
Different methods assign scores in differentranges
kNN-based scores [0 1] Lof scores [1 6] ABOD scores [0 80000]
Anomalies have lower scores
Direct scaling to [0 1] might lose distinctionbetween normal and anomalies
Desired scaling Stretch interesting rangesand shrink irrelevant ones
Generalized Procedure for Normalizing Outlier Scores [21] Regularity rArr S(o) ge 0forallo S(o) asymp 0 if o is normal andS(o) 0 if o is anomalous
Normality S is regular and S(o) isin [0 1]forallo
Chawla and Chandola Anomaly Detection
Introduction Data Mining Methods Density-based anomaly Commute Time Approach Addressing Scalability Anomalies in Complex Data Evaluating Anomaly Detection Methods Applications Problem solutions
Regularization and Normalization of Scores
Regularization
1 R(o) = max0 S(o)minus baseS2 R(o) = Smax minus S(o)
3 R(o) = minus log SmaxS(o)
Normalization
1 N(o) = S(o)Smax
2 N(o) = max(
0 erf(S(o)minusmicroSσS radic2
))(Gaussian Scaling)
Suited for high dimensional data
3 N(o) = max(
0cdfγS (o)minusmicroγ
1minusmicroγ
)(Gamma Scaling)
Where cdfγS (o) = P (k S(o) θ) P is the regularized Gamma function Suited for low dimensional data
Chawla and Chandola Anomaly Detection
Introduction Data Mining Methods Density-based anomaly Commute Time Approach Addressing Scalability Anomalies in Complex Data Evaluating Anomaly Detection Methods Applications Problem solutions
Generating Labeled Data for Validation
Generating Both Normal and Anomalous Data
Use generative models for normal and anomalous behavior
Several generators available Multivariate continuous data [27] Multivariate categorical data [5] Discrete sequences using HMM [12]
Drawbacks Might not capture the domain characteristics
Injecting Anomalies - Random Perturbation[30]
Given data point z = xy x and y arepartitions of feature space
Take a random sample D of the entire data set
Let zprime = xprimeyprime isin D such that distancebetween y and yprime is maximum
Replace x with xprime and add z back to data setx
yz
zprime
Injected anomaly
Chawla and Chandola Anomaly Detection
Introduction Data Mining Methods Density-based anomaly Commute Time Approach Addressing Scalability Anomalies in Complex Data Evaluating Anomaly Detection Methods Applications Problem solutionsWhat is Network Anomaly Detection Motivation How Much Serious
Applications Overview
How to set up an anomaly detection solution for agiven application domain
Available data Define anomalies define normal behavior Identify requirements and constraints (online
real-time limited resources) What domain knowledge available
Feature identification Defining normal and anomalous behavior Tuning parameters
Available ground truth (training validation)
Chawla and Chandola Anomaly Detection
Introduction Data Mining Methods Density-based anomaly Commute Time Approach Addressing Scalability Anomalies in Complex Data Evaluating Anomaly Detection Methods Applications Problem solutionsWhat is Network Anomaly Detection Motivation How Much Serious
What is Network Anomaly Detection
Anomaly Detection or Intrusion Detection
Traditional Intrusion Detection Systems (IDS) finding attackscorresponding to predefined pattern data set known as signaturestherefore system is absolutely vulnerable against zero-day attacks
Network Anomaly Detection Systems (NADS) to detectzero-day attacks without any pre-identified signature besides profilenormal behavior of the network and address suspected incidents
Network Anomaly Detection finding unusual and largechanges in the network traffic
Examples intentional attacks (eg Distributed Denial ofService - DDoS) or unusual network traffic (eg flash crowds)
Chawla and Chandola Anomaly Detection
Introduction Data Mining Methods Density-based anomaly Commute Time Approach Addressing Scalability Anomalies in Complex Data Evaluating Anomaly Detection Methods Applications Problem solutionsWhat is Network Anomaly Detection Motivation How Much Serious
Motivation How Much Serious
According to Symantec report released in early 2011 morethan 286 million new threats have been detected in 2010which is a huge number
1656227
2704836
1000000
1500000
2000000
2500000
3000000
20547 18827 69107 113025 140690
624267
1656227
2704836
0
500000
1000000
1500000
2000000
2500000
3000000
2002 2003 2004 2005 2006 2007 2008 July2009-June2010
Chawla and Chandola Anomaly Detection
Introduction Data Mining Methods Density-based anomaly Commute Time Approach Addressing Scalability Anomalies in Complex Data Evaluating Anomaly Detection Methods Applications Problem solutionsNetwork Topology Network Anomalies Detection Problem Network Anomalies Detection Problem Why care about OD Flows
Network Topology
A Typical network
1 y
Router
2
3
41t
x2t
x1t
x3t
x4t
Origin-Destination (OD) flow is the traffic that enters at anorigin node and exits at a destination node of a backbonenetwork x1t x1t
Link measurement is the traffic enters at an node during aninterval y1t
Relationship between link traffic and OD flow traffic iscaptured by the routing matrix A
Chawla and Chandola Anomaly Detection
Introduction Data Mining Methods Density-based anomaly Commute Time Approach Addressing Scalability Anomalies in Complex Data Evaluating Anomaly Detection Methods Applications Problem solutionsNetwork Topology Network Anomalies Detection Problem Network Anomalies Detection Problem Why care about OD Flows
Network Anomalies Detection Problem
Chawla and Chandola Anomaly Detection
Introduction Data Mining Methods Density-based anomaly Commute Time Approach Addressing Scalability Anomalies in Complex Data Evaluating Anomaly Detection Methods Applications Problem solutionsNetwork Topology Network Anomalies Detection Problem Network Anomalies Detection Problem Why care about OD Flows
Network Anomalies Detection Problem
Chawla and Chandola Anomaly Detection
Introduction Data Mining Methods Density-based anomaly Commute Time Approach Addressing Scalability Anomalies in Complex Data Evaluating Anomaly Detection Methods Applications Problem solutionsNetwork Topology Network Anomalies Detection Problem Network Anomalies Detection Problem Why care about OD Flows
Why care about OD Flows
Volume anomaly typically arises on an OD flow (trafficarriving at one node and destined for another node)
If we only monitor traffic on network links volume arisingfrom an OD flow may not be noticeable Thus naiveapproach wont work if OD flow info is not available
Figure source [22]
Chawla and Chandola Anomaly Detection
Introduction Data Mining Methods Density-based anomaly Commute Time Approach Addressing Scalability Anomalies in Complex Data Evaluating Anomaly Detection Methods Applications Problem solutionsPCA and Subspace Method Subspace Method Algorithm Subspace Analysis Results Discussion Typical Characteristics of Anomaly Limitation of Volume Entropy Based versus Volume Based Fraud Detection Epidemeology Anomaly Detection in Climate and Weather Anomalies in Climate Validation of Anomalies
PCA and Subspace Method
Chawla and Chandola Anomaly Detection
Introduction Data Mining Methods Density-based anomaly Commute Time Approach Addressing Scalability Anomalies in Complex Data Evaluating Anomaly Detection Methods Applications Problem solutionsPCA and Subspace Method Subspace Method Algorithm Subspace Analysis Results Discussion Typical Characteristics of Anomaly Limitation of Volume Entropy Based versus Volume Based Fraud Detection Epidemeology Anomaly Detection in Climate and Weather Anomalies in Climate Validation of Anomalies
Subspace Method Algorithm
Step1- Determine the PCs based on eigenvaluedecomposition of the covariance matrix of the dataset
Step2- Choose first top k principle components with thehighest eigenvalues as matrix P
Step3-normal traffic subspace called Z
Z = PP TZ = CZ
Step4-abnormal traffic subspace called Z
Z = (I minus PP T )Z = CZ
Step5-If the norm of a vector is large then it is an rdquoanomalyrdquo
Chawla and Chandola Anomaly Detection
Introduction Data Mining Methods Density-based anomaly Commute Time Approach Addressing Scalability Anomalies in Complex Data Evaluating Anomaly Detection Methods Applications Problem solutionsPCA and Subspace Method Subspace Method Algorithm Subspace Analysis Results Discussion Typical Characteristics of Anomaly Limitation of Volume Entropy Based versus Volume Based Fraud Detection Epidemeology Anomaly Detection in Climate and Weather Anomalies in Climate Validation of Anomalies
Subspace Analysis Results
Note that during anomaly normal component does not changethat much while residual component changes quite a lot
Thus anomalies can be detected by setting some threshold
Figure source [22]
Chawla and Chandola Anomaly Detection
Introduction Data Mining Methods Density-based anomaly Commute Time Approach Addressing Scalability Anomalies in Complex Data Evaluating Anomaly Detection Methods Applications Problem solutionsPCA and Subspace Method Subspace Method Algorithm Subspace Analysis Results Discussion Typical Characteristics of Anomaly Limitation of Volume Entropy Based versus Volume Based Fraud Detection Epidemeology Anomaly Detection in Climate and Weather Anomalies in Climate Validation of Anomalies
Discussion Typical Characteristics of Anomaly
Most Anomalies induce a change in distributionalaspects of packet header fields (called features)
Most important features include 5-tuple Source ampdestination IP addresses Source and destination portnumbers and IP protocol
raquo DOS attack ndash multiple source IP address concentrated on asingle destination IP address
raquo Network scan ndash dispersed distribution of destination addresses
raquo Most wormsviruses also induce some change in distribution ofcertain features
raquo However these changes can be very subtle and mining them islike searching for needles in a haystack
Unlike many previous approach this paper aims todetect events which disturb the distribution of trafficfeatures rather than traffic volume
Chawla and Chandola Anomaly Detection
Introduction Data Mining Methods Density-based anomaly Commute Time Approach Addressing Scalability Anomalies in Complex Data Evaluating Anomaly Detection Methods Applications Problem solutionsPCA and Subspace Method Subspace Method Algorithm Subspace Analysis Results Discussion Typical Characteristics of Anomaly Limitation of Volume Entropy Based versus Volume Based Fraud Detection Epidemeology Anomaly Detection in Climate and Weather Anomalies in Climate Validation of Anomalies
Limitation of Volume
Figure source [22]
Port scan anomaly (traffic feature changes however traffic volume
remains more or less the same)
We can use entropy tocapture the variationsin the traffic feature
bullTakes value 0 when distribution is maximally concentratedbullTakes value log2N when distribution is maximally dispersed
But stands out in
feature entropy
which also reveals
its structure
Port scan
dwarfed
in volume
metricshellip
Chawla and Chandola Anomaly Detection
Introduction Data Mining Methods Density-based anomaly Commute Time Approach Addressing Scalability Anomalies in Complex Data Evaluating Anomaly Detection Methods Applications Problem solutionsPCA and Subspace Method Subspace Method Algorithm Subspace Analysis Results Discussion Typical Characteristics of Anomaly Limitation of Volume Entropy Based versus Volume Based Fraud Detection Epidemeology Anomaly Detection in Climate and Weather Anomalies in Climate Validation of Anomalies
Entropy Based versus Volume Based
DoSDDoS Attacks- a spike in traffic data toward adominant destination IP
Scan anomaly-a spike in traffic data from a dominant sourceIP
Flash Crowd anomaly- again a spike in traffic data to adominant destination IP
Worm anomaly-a Spike in traffic with a dominant port
Chawla and Chandola Anomaly Detection
Introduction Data Mining Methods Density-based anomaly Commute Time Approach Addressing Scalability Anomalies in Complex Data Evaluating Anomaly Detection Methods Applications Problem solutionsPCA and Subspace Method Subspace Method Algorithm Subspace Analysis Results Discussion Typical Characteristics of Anomaly Limitation of Volume Entropy Based versus Volume Based Fraud Detection Epidemeology Anomaly Detection in Climate and Weather Anomalies in Climate Validation of Anomalies
Fraud Detection
Domain Question Identifyfraudulent activities or players fromobserved transaction data
Data Transactions between different
players in the system Meta information about the
individuals An underlying graph structure
Challenges Track and model human behavior Anomalies caused by adaptive
human adversaries Massive data sizes
Insurance (autohealtha)
ClaimantProvider Payer
Telecommunications Customer
Provider
Credit Cards Customer
Supplier Bank
Web Advertising User Advertiser
Publisher
ahttpwwwcheatingculturecompast-cases-of-medicare-fraud
Chawla and Chandola Anomaly Detection
Introduction Data Mining Methods Density-based anomaly Commute Time Approach Addressing Scalability Anomalies in Complex Data Evaluating Anomaly Detection Methods Applications Problem solutionsPCA and Subspace Method Subspace Method Algorithm Subspace Analysis Results Discussion Typical Characteristics of Anomaly Limitation of Volume Entropy Based versus Volume Based Fraud Detection Epidemeology Anomaly Detection in Climate and Weather Anomalies in Climate Validation of Anomalies
A Generic Fraud Detection Method
Activity Monitoring [13]1 Build profiles for individuals (customers users etc) based on
historic data User X makes n calls on an average in January
2 Compare current behavior with historical profile for significantdeviations
Clustering based [4]1 Cluster historical profiles of customers2 Identify small clusters or outlying profiles as anomalies
Strengths Anomaly detection is fast (good for real time) Results are easy to explain
Weaknesses Need to create and maintain a large number of profiles Not dynamic Adequate historical data might not be available Too many false positives
Chawla and Chandola Anomaly Detection
Introduction Data Mining Methods Density-based anomaly Commute Time Approach Addressing Scalability Anomalies in Complex Data Evaluating Anomaly Detection Methods Applications Problem solutionsPCA and Subspace Method Subspace Method Algorithm Subspace Analysis Results Discussion Typical Characteristics of Anomaly Limitation of Volume Entropy Based versus Volume Based Fraud Detection Epidemeology Anomaly Detection in Climate and Weather Anomalies in Climate Validation of Anomalies
Exploiting Graph Structure - Weighted Graphs
Represent data as a weighted graph Communication networks (phone email SMS) Provider referral networks
Objective Identify anomalous nodes
For each node extract several features based on the propertiesof the induced sub-graph (egonet) of neighboring nodes [1]
Choose features that can highlight anomalous nodes
1 Ni degree of node2 Ei number of edges in egonet3 Wi total weight of egonet4 λi principal eigen vector of weighted adjacency matrix of
egonet
Data is transformed into a point in a multi-dimensional space
Chawla and Chandola Anomaly Detection
Introduction Data Mining Methods Density-based anomaly Commute Time Approach Addressing Scalability Anomalies in Complex Data Evaluating Anomaly Detection Methods Applications Problem solutionsPCA and Subspace Method Subspace Method Algorithm Subspace Analysis Results Discussion Typical Characteristics of Anomaly Limitation of Volume Entropy Based versus Volume Based Fraud Detection Epidemeology Anomaly Detection in Climate and Weather Anomalies in Climate Validation of Anomalies
Identifying Anomalies
Traditional anomaly detection (lof) Can be slow but can identify any type of anomalous structure
Faster method to identify specific types of anomalousstructures
Identify relevant feature pairs and power law relationship
Eg Egonet Density Power Law Ni vs Ei - detect nearcliques and stars
Ei prop Nαi 1 le α le 2
Anomaly score for node i wrt a pair of features (y = Cxθ)
Si =max(yi Cx
θi )
min(yi Cxθi )lowast log (|yi minus Cxθi |+ 1)
Chawla and Chandola Anomaly Detection
Introduction Data Mining Methods Density-based anomaly Commute Time Approach Addressing Scalability Anomalies in Complex Data Evaluating Anomaly Detection Methods Applications Problem solutionsPCA and Subspace Method Subspace Method Algorithm Subspace Analysis Results Discussion Typical Characteristics of Anomaly Limitation of Volume Entropy Based versus Volume Based Fraud Detection Epidemeology Anomaly Detection in Climate and Weather Anomalies in Climate Validation of Anomalies
Exploiting Graph Structure - Bipartite Graphs
Represent data as a bipartite graph Healthcare Data (Beneficiaries vs Providers) Insider trading (Traders vs Stocks)
Objective Identify anomalous links
Given a query node a isin V1 find the ldquorelevancerdquoof all other nodes in V1 to a
RelevanceScore(a b) prop Number of times aldquorandom walkrdquo from a reaches b
Use the relevance scores to compute thenormality scores for a node t isin V2
Find set St = a|〈a t〉 isin E Compute |St| times |St| similarity matrix using
relevance vectors for a isin St Normality Score = mean of non-diagonal entries
of similarity matrix
V1 E V2a1
a2
a3
an
t1
t2
t3
tn
Chawla and Chandola Anomaly Detection
Introduction Data Mining Methods Density-based anomaly Commute Time Approach Addressing Scalability Anomalies in Complex Data Evaluating Anomaly Detection Methods Applications Problem solutionsPCA and Subspace Method Subspace Method Algorithm Subspace Analysis Results Discussion Typical Characteristics of Anomaly Limitation of Volume Entropy Based versus Volume Based Fraud Detection Epidemeology Anomaly Detection in Climate and Weather Anomalies in Climate Validation of Anomalies
Detecting Disease Outbreaks
Domain Question Early detection of disease
outbreaks Anthrax attack
Data Emergency department visits Grocery data (Example [14]) Clinical visits Weatherclimate data
Challenges Weak signals in the data
ED cases involving cough rArrFlu or SARS
Integration of multiple signals(lag analysis)
Account for spatial and temporalcorrelations
Chawla and Chandola Anomaly Detection
Introduction Data Mining Methods Density-based anomaly Commute Time Approach Addressing Scalability Anomalies in Complex Data Evaluating Anomaly Detection Methods Applications Problem solutionsPCA and Subspace Method Subspace Method Algorithm Subspace Analysis Results Discussion Typical Characteristics of Anomaly Limitation of Volume Entropy Based versus Volume Based Fraud Detection Epidemeology Anomaly Detection in Climate and Weather Anomalies in Climate Validation of Anomalies
Whatrsquos Significant About Recent Events (WSARE) [33]
1 Learn Bayesian network from historical data Environmental and response variables
2 Sample from the BN (DBbaseline|Current Environment)3 Compute contingency table for rules for DBbaseline andDBcurrent
Rules are single assignment rules (Xi = Y ji ) or conjunctions4 Find p-value for rules using χ2-test
Null Hypothesis Rows and columns of tables for DBbaselineand DBcurrent are independent
5 Find rule with largest p-value Repeat Step 2
Chawla and Chandola Anomaly Detection
Introduction Data Mining Methods Density-based anomaly Commute Time Approach Addressing Scalability Anomalies in Complex Data Evaluating Anomaly Detection Methods Applications Problem solutionsPCA and Subspace Method Subspace Method Algorithm Subspace Analysis Results Discussion Typical Characteristics of Anomaly Limitation of Volume Entropy Based versus Volume Based Fraud Detection Epidemeology Anomaly Detection in Climate and Weather Anomalies in Climate Validation of Anomalies
Incorporating Spatial and Temporal Relationships
WSARE does not explicitly model the spatial and temporalrelationships
What happened yesterday What happened in the adjoining neighborhood (yesterday)
Bayesian Network Spatio-Temporal (BNST) modelingframework [17]
Add nodes for temporal and spatial dependencies Need more data to train
Chawla and Chandola Anomaly Detection
Introduction Data Mining Methods Density-based anomaly Commute Time Approach Addressing Scalability Anomalies in Complex Data Evaluating Anomaly Detection Methods Applications Problem solutionsPCA and Subspace Method Subspace Method Algorithm Subspace Analysis Results Discussion Typical Characteristics of Anomaly Limitation of Volume Entropy Based versus Volume Based Fraud Detection Epidemeology Anomaly Detection in Climate and Weather Anomalies in Climate Validation of Anomalies
Anomaly Detection in Climate and Weather
Science Questions Identify natural and anthropogenic disasters Identify long time scale events - droughts atmospheric rivers
cold fronts etc
Data Ground observations Remote sensing data (satellites
air-borne) Climate model simulation outputs Multiple variables spatio-temporal (often has height dimension
as well)
Challenges Model spatio-temporal relationships across multiple variables Explain the cause of anomalies Massive data sizes
Climate and weather extreme events are well defined
Key challenge is to find significant events and explain the cause
Chawla and Chandola Anomaly Detection
Introduction Data Mining Methods Density-based anomaly Commute Time Approach Addressing Scalability Anomalies in Complex Data Evaluating Anomaly Detection Methods Applications Problem solutionsPCA and Subspace Method Subspace Method Algorithm Subspace Analysis Results Discussion Typical Characteristics of Anomaly Limitation of Volume Entropy Based versus Volume Based Fraud Detection Epidemeology Anomaly Detection in Climate and Weather Anomalies in Climate Validation of Anomalies
Anomalies are Widely Used in Climate
Most analysis done on ldquoanomalyrdquo time series
Difference from a ldquobase periodrdquo (Toosimplistic)
Brings spatial smoothness (eg a mountaintop and nearby valley can have very differenttemperatures) Removes seasonality
Understand climate and weatherphenomenon
Southern Oscillation Index (SOI) Difference between Sea Level Pressure
(SLP) anomalies for Tahiti and DarwinAustralia
Figure Global AverageTemperature Anomaly(1975 - 2007) Srcwwwmetofficegovuk
Chawla and Chandola Anomaly Detection
Introduction Data Mining Methods Density-based anomaly Commute Time Approach Addressing Scalability Anomalies in Complex Data Evaluating Anomaly Detection Methods Applications Problem solutionsPCA and Subspace Method Subspace Method Algorithm Subspace Analysis Results Discussion Typical Characteristics of Anomaly Limitation of Volume Entropy Based versus Volume Based Fraud Detection Epidemeology Anomaly Detection in Climate and Weather Anomalies in Climate Validation of Anomalies
Constructing Anomalies from Raw Data
Anomaly time series for a given location i
vprimei = vi minus bi
where bi is the base (reference)
How to choose bi Mean of all data for location i Monthly mean values (account for seasonality) Monthly z-score values Median (more robust) Using a shorter ldquoreference periodrdquo
30 year moving window
Different methods show statistically significant differences[19] What is the right strategy Weighted mean of different strategies (Pick weights using
Monte Carlo sampling)
Chawla and Chandola Anomaly Detection
Introduction Data Mining Methods Density-based anomaly Commute Time Approach Addressing Scalability Anomalies in Complex Data Evaluating Anomaly Detection Methods Applications Problem solutionsPCA and Subspace Method Subspace Method Algorithm Subspace Analysis Results Discussion Typical Characteristics of Anomaly Limitation of Volume Entropy Based versus Volume Based Fraud Detection Epidemeology Anomaly Detection in Climate and Weather Anomalies in Climate Validation of Anomalies
Anomaly Detection for Identifying Droughts
Science question Identify significant drought patterns usinghistorical observation data or future simulation data or both
Find persistent spatiotemporal anomalies in precipitation data
A two step approach
1 Find precipitationanomalies usingthresholds
2 Find large connectedcomponents across spaceand time
Matlab - bwlabelbwlabeln
Followup Science questionExplain cause
(drought190120061avi)
Figure Video courtsey Dr ArindamBanerjee
Chawla and Chandola Anomaly Detection
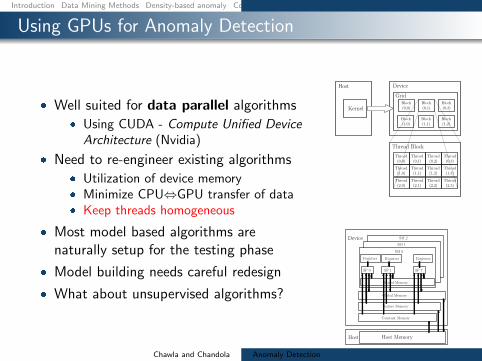
Introduction Data Mining Methods Density-based anomaly Commute Time Approach Addressing Scalability Anomalies in Complex Data Evaluating Anomaly Detection Methods Applications Problem solutions
Using GPUs for Anomaly Detection
Well suited for data parallel algorithms Using CUDA - Compute Unified Device
Architecture (Nvidia)
Need to re-engineer existing algorithms Utilization of device memory Minimize CPUhArrGPU transfer of data Keep threads homogeneous
Most model based algorithms arenaturally setup for the testing phase
Model building needs careful redesign
What about unsupervised algorithms
Kernel
Host
Grid
Device
Block(00)
Block(01)
Block(02)
Block(10)
Block(11)
Block(12)
Thread Block
Thread(00)
Thread(01)
Thread(02)
Thread(03)
Thread(10)
Thread(11)
Thread(12)
Thread(13)
Thread(20)
Thread(21)
Thread(22)
Thread(23)
Host Host Memory
SM 2
SM 1
SM 0
Registers Registers Registers
SP 0 SP 1 SP 7
Shared Memory
Global Memory
Texture Memory
Constant Memory
Device
Chawla and Chandola Anomaly Detection
Introduction Data Mining Methods Density-based anomaly Commute Time Approach Addressing Scalability Anomalies in Complex Data Evaluating Anomaly Detection Methods Applications Problem solutions
Implementing DB(kN) on GPUs
Return top N data instances whose distances tok-th nearest neighbor are largest (SerialDB(kN) is O(n2))
Involves computing pairwise distances
Load block i and block j to shared memory Data layout in memory should be optimized
Each thread computes distance between a pairof instances
Can utilize this time to load next chunk of datafrom host to device memory
Writes results to corresponding output block
Sorting can be done efficiently in CUDA [29]
d
n
T
n
n
Chawla and Chandola Anomaly Detection
Introduction Data Mining Methods Density-based anomaly Commute Time Approach Addressing Scalability Anomalies in Complex Data Evaluating Anomaly Detection Methods Applications Problem solutionsCategorical Data Discrete Sequences and Time Series Contextual Anomalies Collective Anomalies
Moving Beyond Multi-dimensional Record Data
Categorical (Mixed)
Fraud Detection
Cyber Networks
Time Series
Sensor Networks
Healthcare
Discrete Sequences
Genomic
System Calls
Spatial
GIS
Image analysis
Spatio-temporal
Remote sensing
Climate
Graphs
Social networks
Epidemiology
Chawla and Chandola Anomaly Detection
Introduction Data Mining Methods Density-based anomaly Commute Time Approach Addressing Scalability Anomalies in Complex Data Evaluating Anomaly Detection Methods Applications Problem solutionsCategorical Data Discrete Sequences and Time Series Contextual Anomalies Collective Anomalies
Handling Categorical Data
Each attribute can belong to one of many categories
No ordering between categories
Mixed data (categorical and continuous attributes)
cap-shape cap-surface middot middot middot habitat type
convex smooth urban poisonousconvex smooth grasses ediblebell smooth meadows edibleconvex scaly urban poisonousconvex smooth grasses ediblemiddot middot middot
Table Mushroom Data Set [2]
Chawla and Chandola Anomaly Detection
Introduction Data Mining Methods Density-based anomaly Commute Time Approach Addressing Scalability Anomalies in Complex Data Evaluating Anomaly Detection Methods Applications Problem solutionsCategorical Data Discrete Sequences and Time Series Contextual Anomalies Collective Anomalies
Approaches to Identify Categorical Anomalies
Using Association Analysis [24]
Binarize data
Learn rules (X rArr Y ) Choose high confidence
rules (P (Y |X))
For test record Z = 〈XY 〉find rules of the formP (Y |X)
Y is not observed whenX is observed
Using Bayesian Networks [33]
Learn Bayesian networkstructure and parameters
Compute P (Z) for test datarecord Z
Flag anomaly if P (Z) lt δ
Using Similarity Metrics [10]
Use a similarity measure (S(X1 X2))
Apply distancedensityclustering based method (eg lof)
Chawla and Chandola Anomaly Detection
Introduction Data Mining Methods Density-based anomaly Commute Time Approach Addressing Scalability Anomalies in Complex Data Evaluating Anomaly Detection Methods Applications Problem solutionsCategorical Data Discrete Sequences and Time Series Contextual Anomalies Collective Anomalies
Conditional Probability Test [18]
Identify unusual combinations of attribute values
r(at bt) =P (at bt)
P (at)P (bt)
A capB = φ Assumption If r(at bt) is low and is observed in test record t
then t is anomalous For a test record t
For each mutually exclusive pair of attribute sets ABcompute r(at bt)
Score t based on all r-values Assign minimum r-value as score Take product of all r-values
Need to compare exponential pairs of subsets Only consider subsets upto size k Ignore subsets with frequency less than a threshold α Avoid comparing independent subsets of attributes
micro(AB) ge βmicroChawla and Chandola Anomaly Detection
Introduction Data Mining Methods Density-based anomaly Commute Time Approach Addressing Scalability Anomalies in Complex Data Evaluating Anomaly Detection Methods Applications Problem solutionsCategorical Data Discrete Sequences and Time Series Contextual Anomalies Collective Anomalies
Estimating Probabilities for CPT [18]
Maximum LikelihoodEstimation
P (at bt)
P (at)P (bt)=C(at bt)
Ntimes N
C(at)times N
C(bt)
C(at) Number of traininginstances with A = at
N Total number of traininginstances
Laplace Smoothing
E(p) =C(p) + 1
N + 2
r(at bt) =E(at bt)
E(at)times E(bt)
Speedup Tricks
Replace rare attributevalues with genericattribute (reduce arity)
Use efficient datastructure to querying forcounts(AD Trees [26])
ADTrees work fasterfor low arity attributes
Chawla and Chandola Anomaly Detection
Introduction Data Mining Methods Density-based anomaly Commute Time Approach Addressing Scalability Anomalies in Complex Data Evaluating Anomaly Detection Methods Applications Problem solutionsCategorical Data Discrete Sequences and Time Series Contextual Anomalies Collective Anomalies
Finding Anomalies in Discrete Sequences
Many problem formulations
1 Anomalous symbols in asequence
2 Anomalous subsequence in asequence
3 Anomalous sequence in adatabase of sequences
See [11] for a comparativeevaluation [9] for a survey
login pwdmail ssh mail web logoutlogin pwdmail web web web web logoutlogin pwdmail ssh mail web web logoutlogin pwdwebmail ssh webmail logoutloginpwd loginpwd loginpwd logout
Chawla and Chandola Anomaly Detection
Introduction Data Mining Methods Density-based anomaly Commute Time Approach Addressing Scalability Anomalies in Complex Data Evaluating Anomaly Detection Methods Applications Problem solutionsCategorical Data Discrete Sequences and Time Series Contextual Anomalies Collective Anomalies
Treating Sequences as Points
Utilize a distancesimilarity measure Plug into a distancedensityclustering based method
Simplest Hamming Distance
h(Ai Bi) = 1 Ai 6= Bi= 0 Ai = Bi
H(AB) =nsumi=1
h(Ai Bi)
Issues Unequal lengths misalignment Normalized Length of Longest Common Subsequence
D(AB) = 1minus |LCS(AB)|radic|A||B|
Standard Dynamic Programming method is slow Faster versions available (Hunt Szymnaski method [7])
Weaknesses Cannot localize anomalies within a sequence Weak anomaly signals might get lost
Chawla and Chandola Anomaly Detection
Introduction Data Mining Methods Density-based anomaly Commute Time Approach Addressing Scalability Anomalies in Complex Data Evaluating Anomaly Detection Methods Applications Problem solutionsCategorical Data Discrete Sequences and Time Series Contextual Anomalies Collective Anomalies
Using Sliding Windows
Slide a window of size k
Extract all windows from a sequence (nminus k + 1)
Training (Creating a normal dictionary) Store all uniquewindows in all normal sequences and their counts
Testing For each window find the frequency in normal dictionary Anomaly score is inverse of the aggregate frequencies for all
windows (normalized by length)
Many variants exist For each window find the hamming distance to the closest
window in the normal dictionary [16]
Issues Penalizes low frequency windows in the normal dictionary Rewards high frequency windows that might not be relevant Can construct anomalous sequences that will escape detection
Chawla and Chandola Anomaly Detection
Introduction Data Mining Methods Density-based anomaly Commute Time Approach Addressing Scalability Anomalies in Complex Data Evaluating Anomaly Detection Methods Applications Problem solutionsCategorical Data Discrete Sequences and Time Series Contextual Anomalies Collective Anomalies
Using Probabilistic Models
Probability of occurrence of sequence S
P (S) =nprodi=1
P (Si|S1 Siminus1)
Short memory property of sequences
P (Si|S1 Siminus1) = P (Si|Siminusk Siminus1)
Conditional probability estimates for a symbol Si
P (Si|Siminusk Siminus1) =f(Si|Siminusk Si)f(Si|Siminusk Siminus1)
f is estimated from the normal dictionary
Anomaly score for a test sequence is inverse of the normalizedprobability of occurrence
Issues What if the suffix occurs very infrequently in thenormal data (or not at all)
Replace with the longest suffix that occurs sufficient number oftimes [32] - Probabilistic Suffix Trees
Significantly reduces the size of the modelChawla and Chandola Anomaly Detection
Introduction Data Mining Methods Density-based anomaly Commute Time Approach Addressing Scalability Anomalies in Complex Data Evaluating Anomaly Detection Methods Applications Problem solutionsCategorical Data Discrete Sequences and Time Series Contextual Anomalies Collective Anomalies
Finding Contextual Anomalies
Sometimes contextual information isavailable about data
Not used directly as a feature Are well understood no anomalies in
the context Can reduce false positives and yield
interesting anomalies
Example adapted from [30]
Clearest Outlier
Conditional Anomaly
Maximum Daily Temperature
Number
ofFever
Cases
Contextual anomalies - Anomalous with respect to a context Context is defined using environmental variables
Spatial (Latitude Longitude) Graph context (Edges Weights) Temporal location Domain specific (Demographic other)
How to incorporate context Reduce to traditional anomaly detection (subset on context) Explicitly model contextual information (time series spatial)
Chawla and Chandola Anomaly Detection
Introduction Data Mining Methods Density-based anomaly Commute Time Approach Addressing Scalability Anomalies in Complex Data Evaluating Anomaly Detection Methods Applications Problem solutionsCategorical Data Discrete Sequences and Time Series Contextual Anomalies Collective Anomalies
Conditional Anomaly Detection
Data instance d rArru1 u2 udU v1 v2 vdV
dU environmentalattributes
dV indicator attributes u1
u2
U1
U2
U3
v1
v2
V1V2
V3
p(V1|U3) = 02
p(V2|U3) = 02
p(V3|U3) = 06
Algorithm [30]
1 Learn a Gaussian Mixture Model (GMM)U = U1 U2 UnU
each with dimensionality dU2 Learn a set of Gaussians U = V1 V2 VnV
each withdimensionality dV
3 Learn a probabilistic mapping function p(Vj |Ui)4 Score a test instance d = [uv]
S =
nUsumi=1
p(u|Ui)nVsumj=1
p(v|Vj)p(Vj |Ui)
Chawla and Chandola Anomaly Detection
Introduction Data Mining Methods Density-based anomaly Commute Time Approach Addressing Scalability Anomalies in Complex Data Evaluating Anomaly Detection Methods Applications Problem solutionsCategorical Data Discrete Sequences and Time Series Contextual Anomalies Collective Anomalies
Finding Collective Anomalies
Find a collection of data points
Each point by itself is normal
The collection as a whole isanomalous
Relevant when data has inherentstructure and
When domain definition ofanomalies cannot be described aspoint anomalies
A Simple Solution
1 Break data intogroups
2 Compute features foreach group
3 Apply traditionalanomaly detection
Examples
1 Time series
2 Image
3 Spatial clusters ofgalaxies
Chawla and Chandola Anomaly Detection
Introduction Data Mining Methods Density-based anomaly Commute Time Approach Addressing Scalability Anomalies in Complex Data Evaluating Anomaly Detection Methods Applications Problem solutionsCategorical Data Discrete Sequences and Time Series Contextual Anomalies Collective Anomalies
Using Latent Dirichlet Allocation for Group Anomalies
Find anomalous groups in data [34]
Example Spatial clusters of galaxies topics red green emissive words continuous features
Flexible Genre Model (FGM)
For each group
1 Draw a genre 1 2 T 3 ym simM(π)2 Draw topic distribution forym SK 3 θm sim Dir(αym)
3 Draw K topicsβmk sim P (βmk|ηk)k=12K
4 For each point in group
1 Draw topic membershipzmn simM(θn)
2 Generate pointxmn isin P (xmn|βmzmn)
α
zmn
xmn
N
θm
T
π
ηK
ym
β
MK
Model Parameters
M(π) -Multinomial
Genre - Dir(αt)
Topic generatorsP (|ηk)- GIW
Point generatorsP (xmn|βnk) -MultivariateGaussian
Chawla and Chandola Anomaly Detection
Introduction Data Mining Methods Density-based anomaly Commute Time Approach Addressing Scalability Anomalies in Complex Data Evaluating Anomaly Detection Methods Applications Problem solutionsCategorical Data Discrete Sequences and Time Series Contextual Anomalies Collective Anomalies
Inference and Testing for FGM
Inference and Learning Parameters
Approximate inference of latentvariables (Gibbs Sampling)
Use samples to learn parameters(Single step Monte Carlo EM)
Topic 1
Topic 2
Topic 3
Anomaly Detection
Infer the topic distribution θm
Compute negative log likelihood wrt αt
Rationale An anomalous group will be unlikely to begenerated from any genre
Geometric interpretation Mapping each group into a Tdimensional space and finding anomalies
Chawla and Chandola Anomaly Detection
Introduction Data Mining Methods Density-based anomaly Commute Time Approach Addressing Scalability Anomalies in Complex Data Evaluating Anomaly Detection Methods Applications Problem solutions
Evaluating Anomaly Detection Methods - Labels
Labeled validation data set exists Confusion matrix Traditional evaluation metrics
Class imbalance
ROC Curve
Validation set does not exist Use domain expertise to find TP
and FP FN is harder to estimate
Pseudo false negativeestimation techniques [25]
Predicteda n
Actuala TP FNn FP TN
Acc =TP + TNsum
Rec (R) =TP
TP + FN
Prec (P ) =TP
TP + FP
F =2 lowastR lowast PR+ P
Chawla and Chandola Anomaly Detection
Introduction Data Mining Methods Density-based anomaly Commute Time Approach Addressing Scalability Anomalies in Complex Data Evaluating Anomaly Detection Methods Applications Problem solutions
Evaluating Anomaly Detection Methods - Scores
Convert to binary output Use threshold δ on score (Scale
issues [21]) Take top x as anomalies
ROC curve by varying x or δ
Quality of output Does the output ldquosuggestrdquo x or δ Which output is better
Chawla and Chandola Anomaly Detection
Introduction Data Mining Methods Density-based anomaly Commute Time Approach Addressing Scalability Anomalies in Complex Data Evaluating Anomaly Detection Methods Applications Problem solutions
Unifying Scores
Different methods assign scores in differentranges
kNN-based scores [0 1] Lof scores [1 6] ABOD scores [0 80000]
Anomalies have lower scores
Direct scaling to [0 1] might lose distinctionbetween normal and anomalies
Desired scaling Stretch interesting rangesand shrink irrelevant ones
Generalized Procedure for Normalizing Outlier Scores [21] Regularity rArr S(o) ge 0forallo S(o) asymp 0 if o is normal andS(o) 0 if o is anomalous
Normality S is regular and S(o) isin [0 1]forallo
Chawla and Chandola Anomaly Detection
Introduction Data Mining Methods Density-based anomaly Commute Time Approach Addressing Scalability Anomalies in Complex Data Evaluating Anomaly Detection Methods Applications Problem solutions
Regularization and Normalization of Scores
Regularization
1 R(o) = max0 S(o)minus baseS2 R(o) = Smax minus S(o)
3 R(o) = minus log SmaxS(o)
Normalization
1 N(o) = S(o)Smax
2 N(o) = max(
0 erf(S(o)minusmicroSσS radic2
))(Gaussian Scaling)
Suited for high dimensional data
3 N(o) = max(
0cdfγS (o)minusmicroγ
1minusmicroγ
)(Gamma Scaling)
Where cdfγS (o) = P (k S(o) θ) P is the regularized Gamma function Suited for low dimensional data
Chawla and Chandola Anomaly Detection
Introduction Data Mining Methods Density-based anomaly Commute Time Approach Addressing Scalability Anomalies in Complex Data Evaluating Anomaly Detection Methods Applications Problem solutions
Generating Labeled Data for Validation
Generating Both Normal and Anomalous Data
Use generative models for normal and anomalous behavior
Several generators available Multivariate continuous data [27] Multivariate categorical data [5] Discrete sequences using HMM [12]
Drawbacks Might not capture the domain characteristics
Injecting Anomalies - Random Perturbation[30]
Given data point z = xy x and y arepartitions of feature space
Take a random sample D of the entire data set
Let zprime = xprimeyprime isin D such that distancebetween y and yprime is maximum
Replace x with xprime and add z back to data setx
yz
zprime
Injected anomaly
Chawla and Chandola Anomaly Detection
Introduction Data Mining Methods Density-based anomaly Commute Time Approach Addressing Scalability Anomalies in Complex Data Evaluating Anomaly Detection Methods Applications Problem solutionsWhat is Network Anomaly Detection Motivation How Much Serious
Applications Overview
How to set up an anomaly detection solution for agiven application domain
Available data Define anomalies define normal behavior Identify requirements and constraints (online
real-time limited resources) What domain knowledge available
Feature identification Defining normal and anomalous behavior Tuning parameters
Available ground truth (training validation)
Chawla and Chandola Anomaly Detection
Introduction Data Mining Methods Density-based anomaly Commute Time Approach Addressing Scalability Anomalies in Complex Data Evaluating Anomaly Detection Methods Applications Problem solutionsWhat is Network Anomaly Detection Motivation How Much Serious
What is Network Anomaly Detection
Anomaly Detection or Intrusion Detection
Traditional Intrusion Detection Systems (IDS) finding attackscorresponding to predefined pattern data set known as signaturestherefore system is absolutely vulnerable against zero-day attacks
Network Anomaly Detection Systems (NADS) to detectzero-day attacks without any pre-identified signature besides profilenormal behavior of the network and address suspected incidents
Network Anomaly Detection finding unusual and largechanges in the network traffic
Examples intentional attacks (eg Distributed Denial ofService - DDoS) or unusual network traffic (eg flash crowds)
Chawla and Chandola Anomaly Detection
Introduction Data Mining Methods Density-based anomaly Commute Time Approach Addressing Scalability Anomalies in Complex Data Evaluating Anomaly Detection Methods Applications Problem solutionsWhat is Network Anomaly Detection Motivation How Much Serious
Motivation How Much Serious
According to Symantec report released in early 2011 morethan 286 million new threats have been detected in 2010which is a huge number
1656227
2704836
1000000
1500000
2000000
2500000
3000000
20547 18827 69107 113025 140690
624267
1656227
2704836
0
500000
1000000
1500000
2000000
2500000
3000000
2002 2003 2004 2005 2006 2007 2008 July2009-June2010
Chawla and Chandola Anomaly Detection
Introduction Data Mining Methods Density-based anomaly Commute Time Approach Addressing Scalability Anomalies in Complex Data Evaluating Anomaly Detection Methods Applications Problem solutionsNetwork Topology Network Anomalies Detection Problem Network Anomalies Detection Problem Why care about OD Flows
Network Topology
A Typical network
1 y
Router
2
3
41t
x2t
x1t
x3t
x4t
Origin-Destination (OD) flow is the traffic that enters at anorigin node and exits at a destination node of a backbonenetwork x1t x1t
Link measurement is the traffic enters at an node during aninterval y1t
Relationship between link traffic and OD flow traffic iscaptured by the routing matrix A
Chawla and Chandola Anomaly Detection
Introduction Data Mining Methods Density-based anomaly Commute Time Approach Addressing Scalability Anomalies in Complex Data Evaluating Anomaly Detection Methods Applications Problem solutionsNetwork Topology Network Anomalies Detection Problem Network Anomalies Detection Problem Why care about OD Flows
Network Anomalies Detection Problem
Chawla and Chandola Anomaly Detection
Introduction Data Mining Methods Density-based anomaly Commute Time Approach Addressing Scalability Anomalies in Complex Data Evaluating Anomaly Detection Methods Applications Problem solutionsNetwork Topology Network Anomalies Detection Problem Network Anomalies Detection Problem Why care about OD Flows
Network Anomalies Detection Problem
Chawla and Chandola Anomaly Detection
Introduction Data Mining Methods Density-based anomaly Commute Time Approach Addressing Scalability Anomalies in Complex Data Evaluating Anomaly Detection Methods Applications Problem solutionsNetwork Topology Network Anomalies Detection Problem Network Anomalies Detection Problem Why care about OD Flows
Why care about OD Flows
Volume anomaly typically arises on an OD flow (trafficarriving at one node and destined for another node)
If we only monitor traffic on network links volume arisingfrom an OD flow may not be noticeable Thus naiveapproach wont work if OD flow info is not available
Figure source [22]
Chawla and Chandola Anomaly Detection
Introduction Data Mining Methods Density-based anomaly Commute Time Approach Addressing Scalability Anomalies in Complex Data Evaluating Anomaly Detection Methods Applications Problem solutionsPCA and Subspace Method Subspace Method Algorithm Subspace Analysis Results Discussion Typical Characteristics of Anomaly Limitation of Volume Entropy Based versus Volume Based Fraud Detection Epidemeology Anomaly Detection in Climate and Weather Anomalies in Climate Validation of Anomalies
PCA and Subspace Method
Chawla and Chandola Anomaly Detection
Introduction Data Mining Methods Density-based anomaly Commute Time Approach Addressing Scalability Anomalies in Complex Data Evaluating Anomaly Detection Methods Applications Problem solutionsPCA and Subspace Method Subspace Method Algorithm Subspace Analysis Results Discussion Typical Characteristics of Anomaly Limitation of Volume Entropy Based versus Volume Based Fraud Detection Epidemeology Anomaly Detection in Climate and Weather Anomalies in Climate Validation of Anomalies
Subspace Method Algorithm
Step1- Determine the PCs based on eigenvaluedecomposition of the covariance matrix of the dataset
Step2- Choose first top k principle components with thehighest eigenvalues as matrix P
Step3-normal traffic subspace called Z
Z = PP TZ = CZ
Step4-abnormal traffic subspace called Z
Z = (I minus PP T )Z = CZ
Step5-If the norm of a vector is large then it is an rdquoanomalyrdquo
Chawla and Chandola Anomaly Detection
Introduction Data Mining Methods Density-based anomaly Commute Time Approach Addressing Scalability Anomalies in Complex Data Evaluating Anomaly Detection Methods Applications Problem solutionsPCA and Subspace Method Subspace Method Algorithm Subspace Analysis Results Discussion Typical Characteristics of Anomaly Limitation of Volume Entropy Based versus Volume Based Fraud Detection Epidemeology Anomaly Detection in Climate and Weather Anomalies in Climate Validation of Anomalies
Subspace Analysis Results
Note that during anomaly normal component does not changethat much while residual component changes quite a lot
Thus anomalies can be detected by setting some threshold
Figure source [22]
Chawla and Chandola Anomaly Detection
Introduction Data Mining Methods Density-based anomaly Commute Time Approach Addressing Scalability Anomalies in Complex Data Evaluating Anomaly Detection Methods Applications Problem solutionsPCA and Subspace Method Subspace Method Algorithm Subspace Analysis Results Discussion Typical Characteristics of Anomaly Limitation of Volume Entropy Based versus Volume Based Fraud Detection Epidemeology Anomaly Detection in Climate and Weather Anomalies in Climate Validation of Anomalies
Discussion Typical Characteristics of Anomaly
Most Anomalies induce a change in distributionalaspects of packet header fields (called features)
Most important features include 5-tuple Source ampdestination IP addresses Source and destination portnumbers and IP protocol
raquo DOS attack ndash multiple source IP address concentrated on asingle destination IP address
raquo Network scan ndash dispersed distribution of destination addresses
raquo Most wormsviruses also induce some change in distribution ofcertain features
raquo However these changes can be very subtle and mining them islike searching for needles in a haystack
Unlike many previous approach this paper aims todetect events which disturb the distribution of trafficfeatures rather than traffic volume
Chawla and Chandola Anomaly Detection
Introduction Data Mining Methods Density-based anomaly Commute Time Approach Addressing Scalability Anomalies in Complex Data Evaluating Anomaly Detection Methods Applications Problem solutionsPCA and Subspace Method Subspace Method Algorithm Subspace Analysis Results Discussion Typical Characteristics of Anomaly Limitation of Volume Entropy Based versus Volume Based Fraud Detection Epidemeology Anomaly Detection in Climate and Weather Anomalies in Climate Validation of Anomalies
Limitation of Volume
Figure source [22]
Port scan anomaly (traffic feature changes however traffic volume
remains more or less the same)
We can use entropy tocapture the variationsin the traffic feature
bullTakes value 0 when distribution is maximally concentratedbullTakes value log2N when distribution is maximally dispersed
But stands out in
feature entropy
which also reveals
its structure
Port scan
dwarfed
in volume
metricshellip
Chawla and Chandola Anomaly Detection
Introduction Data Mining Methods Density-based anomaly Commute Time Approach Addressing Scalability Anomalies in Complex Data Evaluating Anomaly Detection Methods Applications Problem solutionsPCA and Subspace Method Subspace Method Algorithm Subspace Analysis Results Discussion Typical Characteristics of Anomaly Limitation of Volume Entropy Based versus Volume Based Fraud Detection Epidemeology Anomaly Detection in Climate and Weather Anomalies in Climate Validation of Anomalies
Entropy Based versus Volume Based
DoSDDoS Attacks- a spike in traffic data toward adominant destination IP
Scan anomaly-a spike in traffic data from a dominant sourceIP
Flash Crowd anomaly- again a spike in traffic data to adominant destination IP
Worm anomaly-a Spike in traffic with a dominant port
Chawla and Chandola Anomaly Detection
Introduction Data Mining Methods Density-based anomaly Commute Time Approach Addressing Scalability Anomalies in Complex Data Evaluating Anomaly Detection Methods Applications Problem solutionsPCA and Subspace Method Subspace Method Algorithm Subspace Analysis Results Discussion Typical Characteristics of Anomaly Limitation of Volume Entropy Based versus Volume Based Fraud Detection Epidemeology Anomaly Detection in Climate and Weather Anomalies in Climate Validation of Anomalies
Fraud Detection
Domain Question Identifyfraudulent activities or players fromobserved transaction data
Data Transactions between different
players in the system Meta information about the
individuals An underlying graph structure
Challenges Track and model human behavior Anomalies caused by adaptive
human adversaries Massive data sizes
Insurance (autohealtha)
ClaimantProvider Payer
Telecommunications Customer
Provider
Credit Cards Customer
Supplier Bank
Web Advertising User Advertiser
Publisher
ahttpwwwcheatingculturecompast-cases-of-medicare-fraud
Chawla and Chandola Anomaly Detection
Introduction Data Mining Methods Density-based anomaly Commute Time Approach Addressing Scalability Anomalies in Complex Data Evaluating Anomaly Detection Methods Applications Problem solutionsPCA and Subspace Method Subspace Method Algorithm Subspace Analysis Results Discussion Typical Characteristics of Anomaly Limitation of Volume Entropy Based versus Volume Based Fraud Detection Epidemeology Anomaly Detection in Climate and Weather Anomalies in Climate Validation of Anomalies
A Generic Fraud Detection Method
Activity Monitoring [13]1 Build profiles for individuals (customers users etc) based on
historic data User X makes n calls on an average in January
2 Compare current behavior with historical profile for significantdeviations
Clustering based [4]1 Cluster historical profiles of customers2 Identify small clusters or outlying profiles as anomalies
Strengths Anomaly detection is fast (good for real time) Results are easy to explain
Weaknesses Need to create and maintain a large number of profiles Not dynamic Adequate historical data might not be available Too many false positives
Chawla and Chandola Anomaly Detection
Introduction Data Mining Methods Density-based anomaly Commute Time Approach Addressing Scalability Anomalies in Complex Data Evaluating Anomaly Detection Methods Applications Problem solutionsPCA and Subspace Method Subspace Method Algorithm Subspace Analysis Results Discussion Typical Characteristics of Anomaly Limitation of Volume Entropy Based versus Volume Based Fraud Detection Epidemeology Anomaly Detection in Climate and Weather Anomalies in Climate Validation of Anomalies
Exploiting Graph Structure - Weighted Graphs
Represent data as a weighted graph Communication networks (phone email SMS) Provider referral networks
Objective Identify anomalous nodes
For each node extract several features based on the propertiesof the induced sub-graph (egonet) of neighboring nodes [1]
Choose features that can highlight anomalous nodes
1 Ni degree of node2 Ei number of edges in egonet3 Wi total weight of egonet4 λi principal eigen vector of weighted adjacency matrix of
egonet
Data is transformed into a point in a multi-dimensional space
Chawla and Chandola Anomaly Detection
Introduction Data Mining Methods Density-based anomaly Commute Time Approach Addressing Scalability Anomalies in Complex Data Evaluating Anomaly Detection Methods Applications Problem solutionsPCA and Subspace Method Subspace Method Algorithm Subspace Analysis Results Discussion Typical Characteristics of Anomaly Limitation of Volume Entropy Based versus Volume Based Fraud Detection Epidemeology Anomaly Detection in Climate and Weather Anomalies in Climate Validation of Anomalies
Identifying Anomalies
Traditional anomaly detection (lof) Can be slow but can identify any type of anomalous structure
Faster method to identify specific types of anomalousstructures
Identify relevant feature pairs and power law relationship
Eg Egonet Density Power Law Ni vs Ei - detect nearcliques and stars
Ei prop Nαi 1 le α le 2
Anomaly score for node i wrt a pair of features (y = Cxθ)
Si =max(yi Cx
θi )
min(yi Cxθi )lowast log (|yi minus Cxθi |+ 1)
Chawla and Chandola Anomaly Detection
Introduction Data Mining Methods Density-based anomaly Commute Time Approach Addressing Scalability Anomalies in Complex Data Evaluating Anomaly Detection Methods Applications Problem solutionsPCA and Subspace Method Subspace Method Algorithm Subspace Analysis Results Discussion Typical Characteristics of Anomaly Limitation of Volume Entropy Based versus Volume Based Fraud Detection Epidemeology Anomaly Detection in Climate and Weather Anomalies in Climate Validation of Anomalies
Exploiting Graph Structure - Bipartite Graphs
Represent data as a bipartite graph Healthcare Data (Beneficiaries vs Providers) Insider trading (Traders vs Stocks)
Objective Identify anomalous links
Given a query node a isin V1 find the ldquorelevancerdquoof all other nodes in V1 to a
RelevanceScore(a b) prop Number of times aldquorandom walkrdquo from a reaches b
Use the relevance scores to compute thenormality scores for a node t isin V2
Find set St = a|〈a t〉 isin E Compute |St| times |St| similarity matrix using
relevance vectors for a isin St Normality Score = mean of non-diagonal entries
of similarity matrix
V1 E V2a1
a2
a3
an
t1
t2
t3
tn
Chawla and Chandola Anomaly Detection
Introduction Data Mining Methods Density-based anomaly Commute Time Approach Addressing Scalability Anomalies in Complex Data Evaluating Anomaly Detection Methods Applications Problem solutionsPCA and Subspace Method Subspace Method Algorithm Subspace Analysis Results Discussion Typical Characteristics of Anomaly Limitation of Volume Entropy Based versus Volume Based Fraud Detection Epidemeology Anomaly Detection in Climate and Weather Anomalies in Climate Validation of Anomalies
Detecting Disease Outbreaks
Domain Question Early detection of disease
outbreaks Anthrax attack
Data Emergency department visits Grocery data (Example [14]) Clinical visits Weatherclimate data
Challenges Weak signals in the data
ED cases involving cough rArrFlu or SARS
Integration of multiple signals(lag analysis)
Account for spatial and temporalcorrelations
Chawla and Chandola Anomaly Detection
Introduction Data Mining Methods Density-based anomaly Commute Time Approach Addressing Scalability Anomalies in Complex Data Evaluating Anomaly Detection Methods Applications Problem solutionsPCA and Subspace Method Subspace Method Algorithm Subspace Analysis Results Discussion Typical Characteristics of Anomaly Limitation of Volume Entropy Based versus Volume Based Fraud Detection Epidemeology Anomaly Detection in Climate and Weather Anomalies in Climate Validation of Anomalies
Whatrsquos Significant About Recent Events (WSARE) [33]
1 Learn Bayesian network from historical data Environmental and response variables
2 Sample from the BN (DBbaseline|Current Environment)3 Compute contingency table for rules for DBbaseline andDBcurrent
Rules are single assignment rules (Xi = Y ji ) or conjunctions4 Find p-value for rules using χ2-test
Null Hypothesis Rows and columns of tables for DBbaselineand DBcurrent are independent
5 Find rule with largest p-value Repeat Step 2
Chawla and Chandola Anomaly Detection
Introduction Data Mining Methods Density-based anomaly Commute Time Approach Addressing Scalability Anomalies in Complex Data Evaluating Anomaly Detection Methods Applications Problem solutionsPCA and Subspace Method Subspace Method Algorithm Subspace Analysis Results Discussion Typical Characteristics of Anomaly Limitation of Volume Entropy Based versus Volume Based Fraud Detection Epidemeology Anomaly Detection in Climate and Weather Anomalies in Climate Validation of Anomalies
Incorporating Spatial and Temporal Relationships
WSARE does not explicitly model the spatial and temporalrelationships
What happened yesterday What happened in the adjoining neighborhood (yesterday)
Bayesian Network Spatio-Temporal (BNST) modelingframework [17]
Add nodes for temporal and spatial dependencies Need more data to train
Chawla and Chandola Anomaly Detection
Introduction Data Mining Methods Density-based anomaly Commute Time Approach Addressing Scalability Anomalies in Complex Data Evaluating Anomaly Detection Methods Applications Problem solutionsPCA and Subspace Method Subspace Method Algorithm Subspace Analysis Results Discussion Typical Characteristics of Anomaly Limitation of Volume Entropy Based versus Volume Based Fraud Detection Epidemeology Anomaly Detection in Climate and Weather Anomalies in Climate Validation of Anomalies
Anomaly Detection in Climate and Weather
Science Questions Identify natural and anthropogenic disasters Identify long time scale events - droughts atmospheric rivers
cold fronts etc
Data Ground observations Remote sensing data (satellites
air-borne) Climate model simulation outputs Multiple variables spatio-temporal (often has height dimension
as well)
Challenges Model spatio-temporal relationships across multiple variables Explain the cause of anomalies Massive data sizes
Climate and weather extreme events are well defined
Key challenge is to find significant events and explain the cause
Chawla and Chandola Anomaly Detection
Introduction Data Mining Methods Density-based anomaly Commute Time Approach Addressing Scalability Anomalies in Complex Data Evaluating Anomaly Detection Methods Applications Problem solutionsPCA and Subspace Method Subspace Method Algorithm Subspace Analysis Results Discussion Typical Characteristics of Anomaly Limitation of Volume Entropy Based versus Volume Based Fraud Detection Epidemeology Anomaly Detection in Climate and Weather Anomalies in Climate Validation of Anomalies
Anomalies are Widely Used in Climate
Most analysis done on ldquoanomalyrdquo time series
Difference from a ldquobase periodrdquo (Toosimplistic)
Brings spatial smoothness (eg a mountaintop and nearby valley can have very differenttemperatures) Removes seasonality
Understand climate and weatherphenomenon
Southern Oscillation Index (SOI) Difference between Sea Level Pressure
(SLP) anomalies for Tahiti and DarwinAustralia
Figure Global AverageTemperature Anomaly(1975 - 2007) Srcwwwmetofficegovuk
Chawla and Chandola Anomaly Detection
Introduction Data Mining Methods Density-based anomaly Commute Time Approach Addressing Scalability Anomalies in Complex Data Evaluating Anomaly Detection Methods Applications Problem solutionsPCA and Subspace Method Subspace Method Algorithm Subspace Analysis Results Discussion Typical Characteristics of Anomaly Limitation of Volume Entropy Based versus Volume Based Fraud Detection Epidemeology Anomaly Detection in Climate and Weather Anomalies in Climate Validation of Anomalies
Constructing Anomalies from Raw Data
Anomaly time series for a given location i
vprimei = vi minus bi
where bi is the base (reference)
How to choose bi Mean of all data for location i Monthly mean values (account for seasonality) Monthly z-score values Median (more robust) Using a shorter ldquoreference periodrdquo
30 year moving window
Different methods show statistically significant differences[19] What is the right strategy Weighted mean of different strategies (Pick weights using
Monte Carlo sampling)
Chawla and Chandola Anomaly Detection
Introduction Data Mining Methods Density-based anomaly Commute Time Approach Addressing Scalability Anomalies in Complex Data Evaluating Anomaly Detection Methods Applications Problem solutionsPCA and Subspace Method Subspace Method Algorithm Subspace Analysis Results Discussion Typical Characteristics of Anomaly Limitation of Volume Entropy Based versus Volume Based Fraud Detection Epidemeology Anomaly Detection in Climate and Weather Anomalies in Climate Validation of Anomalies
Anomaly Detection for Identifying Droughts
Science question Identify significant drought patterns usinghistorical observation data or future simulation data or both
Find persistent spatiotemporal anomalies in precipitation data
A two step approach
1 Find precipitationanomalies usingthresholds
2 Find large connectedcomponents across spaceand time
Matlab - bwlabelbwlabeln
Followup Science questionExplain cause
(drought190120061avi)
Figure Video courtsey Dr ArindamBanerjee
Chawla and Chandola Anomaly Detection
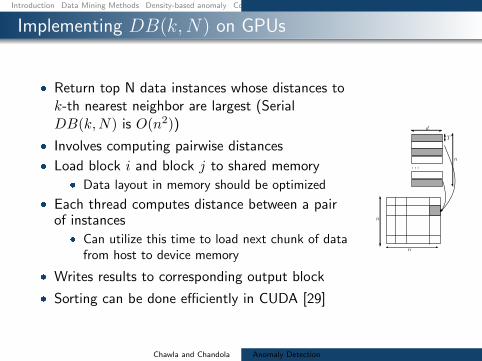
Introduction Data Mining Methods Density-based anomaly Commute Time Approach Addressing Scalability Anomalies in Complex Data Evaluating Anomaly Detection Methods Applications Problem solutions
Implementing DB(kN) on GPUs
Return top N data instances whose distances tok-th nearest neighbor are largest (SerialDB(kN) is O(n2))
Involves computing pairwise distances
Load block i and block j to shared memory Data layout in memory should be optimized
Each thread computes distance between a pairof instances
Can utilize this time to load next chunk of datafrom host to device memory
Writes results to corresponding output block
Sorting can be done efficiently in CUDA [29]
d
n
T
n
n
Chawla and Chandola Anomaly Detection
Introduction Data Mining Methods Density-based anomaly Commute Time Approach Addressing Scalability Anomalies in Complex Data Evaluating Anomaly Detection Methods Applications Problem solutionsCategorical Data Discrete Sequences and Time Series Contextual Anomalies Collective Anomalies
Moving Beyond Multi-dimensional Record Data
Categorical (Mixed)
Fraud Detection
Cyber Networks
Time Series
Sensor Networks
Healthcare
Discrete Sequences
Genomic
System Calls
Spatial
GIS
Image analysis
Spatio-temporal
Remote sensing
Climate
Graphs
Social networks
Epidemiology
Chawla and Chandola Anomaly Detection
Introduction Data Mining Methods Density-based anomaly Commute Time Approach Addressing Scalability Anomalies in Complex Data Evaluating Anomaly Detection Methods Applications Problem solutionsCategorical Data Discrete Sequences and Time Series Contextual Anomalies Collective Anomalies
Handling Categorical Data
Each attribute can belong to one of many categories
No ordering between categories
Mixed data (categorical and continuous attributes)
cap-shape cap-surface middot middot middot habitat type
convex smooth urban poisonousconvex smooth grasses ediblebell smooth meadows edibleconvex scaly urban poisonousconvex smooth grasses ediblemiddot middot middot
Table Mushroom Data Set [2]
Chawla and Chandola Anomaly Detection
Introduction Data Mining Methods Density-based anomaly Commute Time Approach Addressing Scalability Anomalies in Complex Data Evaluating Anomaly Detection Methods Applications Problem solutionsCategorical Data Discrete Sequences and Time Series Contextual Anomalies Collective Anomalies
Approaches to Identify Categorical Anomalies
Using Association Analysis [24]
Binarize data
Learn rules (X rArr Y ) Choose high confidence
rules (P (Y |X))
For test record Z = 〈XY 〉find rules of the formP (Y |X)
Y is not observed whenX is observed
Using Bayesian Networks [33]
Learn Bayesian networkstructure and parameters
Compute P (Z) for test datarecord Z
Flag anomaly if P (Z) lt δ
Using Similarity Metrics [10]
Use a similarity measure (S(X1 X2))
Apply distancedensityclustering based method (eg lof)
Chawla and Chandola Anomaly Detection
Introduction Data Mining Methods Density-based anomaly Commute Time Approach Addressing Scalability Anomalies in Complex Data Evaluating Anomaly Detection Methods Applications Problem solutionsCategorical Data Discrete Sequences and Time Series Contextual Anomalies Collective Anomalies
Conditional Probability Test [18]
Identify unusual combinations of attribute values
r(at bt) =P (at bt)
P (at)P (bt)
A capB = φ Assumption If r(at bt) is low and is observed in test record t
then t is anomalous For a test record t
For each mutually exclusive pair of attribute sets ABcompute r(at bt)
Score t based on all r-values Assign minimum r-value as score Take product of all r-values
Need to compare exponential pairs of subsets Only consider subsets upto size k Ignore subsets with frequency less than a threshold α Avoid comparing independent subsets of attributes
micro(AB) ge βmicroChawla and Chandola Anomaly Detection
Introduction Data Mining Methods Density-based anomaly Commute Time Approach Addressing Scalability Anomalies in Complex Data Evaluating Anomaly Detection Methods Applications Problem solutionsCategorical Data Discrete Sequences and Time Series Contextual Anomalies Collective Anomalies
Estimating Probabilities for CPT [18]
Maximum LikelihoodEstimation
P (at bt)
P (at)P (bt)=C(at bt)
Ntimes N
C(at)times N
C(bt)
C(at) Number of traininginstances with A = at
N Total number of traininginstances
Laplace Smoothing
E(p) =C(p) + 1
N + 2
r(at bt) =E(at bt)
E(at)times E(bt)
Speedup Tricks
Replace rare attributevalues with genericattribute (reduce arity)
Use efficient datastructure to querying forcounts(AD Trees [26])
ADTrees work fasterfor low arity attributes
Chawla and Chandola Anomaly Detection
Introduction Data Mining Methods Density-based anomaly Commute Time Approach Addressing Scalability Anomalies in Complex Data Evaluating Anomaly Detection Methods Applications Problem solutionsCategorical Data Discrete Sequences and Time Series Contextual Anomalies Collective Anomalies
Finding Anomalies in Discrete Sequences
Many problem formulations
1 Anomalous symbols in asequence
2 Anomalous subsequence in asequence
3 Anomalous sequence in adatabase of sequences
See [11] for a comparativeevaluation [9] for a survey
login pwdmail ssh mail web logoutlogin pwdmail web web web web logoutlogin pwdmail ssh mail web web logoutlogin pwdwebmail ssh webmail logoutloginpwd loginpwd loginpwd logout
Chawla and Chandola Anomaly Detection
Introduction Data Mining Methods Density-based anomaly Commute Time Approach Addressing Scalability Anomalies in Complex Data Evaluating Anomaly Detection Methods Applications Problem solutionsCategorical Data Discrete Sequences and Time Series Contextual Anomalies Collective Anomalies
Treating Sequences as Points
Utilize a distancesimilarity measure Plug into a distancedensityclustering based method
Simplest Hamming Distance
h(Ai Bi) = 1 Ai 6= Bi= 0 Ai = Bi
H(AB) =nsumi=1
h(Ai Bi)
Issues Unequal lengths misalignment Normalized Length of Longest Common Subsequence
D(AB) = 1minus |LCS(AB)|radic|A||B|
Standard Dynamic Programming method is slow Faster versions available (Hunt Szymnaski method [7])
Weaknesses Cannot localize anomalies within a sequence Weak anomaly signals might get lost
Chawla and Chandola Anomaly Detection
Introduction Data Mining Methods Density-based anomaly Commute Time Approach Addressing Scalability Anomalies in Complex Data Evaluating Anomaly Detection Methods Applications Problem solutionsCategorical Data Discrete Sequences and Time Series Contextual Anomalies Collective Anomalies
Using Sliding Windows
Slide a window of size k
Extract all windows from a sequence (nminus k + 1)
Training (Creating a normal dictionary) Store all uniquewindows in all normal sequences and their counts
Testing For each window find the frequency in normal dictionary Anomaly score is inverse of the aggregate frequencies for all
windows (normalized by length)
Many variants exist For each window find the hamming distance to the closest
window in the normal dictionary [16]
Issues Penalizes low frequency windows in the normal dictionary Rewards high frequency windows that might not be relevant Can construct anomalous sequences that will escape detection
Chawla and Chandola Anomaly Detection
Introduction Data Mining Methods Density-based anomaly Commute Time Approach Addressing Scalability Anomalies in Complex Data Evaluating Anomaly Detection Methods Applications Problem solutionsCategorical Data Discrete Sequences and Time Series Contextual Anomalies Collective Anomalies
Using Probabilistic Models
Probability of occurrence of sequence S
P (S) =nprodi=1
P (Si|S1 Siminus1)
Short memory property of sequences
P (Si|S1 Siminus1) = P (Si|Siminusk Siminus1)
Conditional probability estimates for a symbol Si
P (Si|Siminusk Siminus1) =f(Si|Siminusk Si)f(Si|Siminusk Siminus1)
f is estimated from the normal dictionary
Anomaly score for a test sequence is inverse of the normalizedprobability of occurrence
Issues What if the suffix occurs very infrequently in thenormal data (or not at all)
Replace with the longest suffix that occurs sufficient number oftimes [32] - Probabilistic Suffix Trees
Significantly reduces the size of the modelChawla and Chandola Anomaly Detection
Introduction Data Mining Methods Density-based anomaly Commute Time Approach Addressing Scalability Anomalies in Complex Data Evaluating Anomaly Detection Methods Applications Problem solutionsCategorical Data Discrete Sequences and Time Series Contextual Anomalies Collective Anomalies
Finding Contextual Anomalies
Sometimes contextual information isavailable about data
Not used directly as a feature Are well understood no anomalies in
the context Can reduce false positives and yield
interesting anomalies
Example adapted from [30]
Clearest Outlier
Conditional Anomaly
Maximum Daily Temperature
Number
ofFever
Cases
Contextual anomalies - Anomalous with respect to a context Context is defined using environmental variables
Spatial (Latitude Longitude) Graph context (Edges Weights) Temporal location Domain specific (Demographic other)
How to incorporate context Reduce to traditional anomaly detection (subset on context) Explicitly model contextual information (time series spatial)
Chawla and Chandola Anomaly Detection
Introduction Data Mining Methods Density-based anomaly Commute Time Approach Addressing Scalability Anomalies in Complex Data Evaluating Anomaly Detection Methods Applications Problem solutionsCategorical Data Discrete Sequences and Time Series Contextual Anomalies Collective Anomalies
Conditional Anomaly Detection
Data instance d rArru1 u2 udU v1 v2 vdV
dU environmentalattributes
dV indicator attributes u1
u2
U1
U2
U3
v1
v2
V1V2
V3
p(V1|U3) = 02
p(V2|U3) = 02
p(V3|U3) = 06
Algorithm [30]
1 Learn a Gaussian Mixture Model (GMM)U = U1 U2 UnU
each with dimensionality dU2 Learn a set of Gaussians U = V1 V2 VnV
each withdimensionality dV
3 Learn a probabilistic mapping function p(Vj |Ui)4 Score a test instance d = [uv]
S =
nUsumi=1
p(u|Ui)nVsumj=1
p(v|Vj)p(Vj |Ui)
Chawla and Chandola Anomaly Detection
Introduction Data Mining Methods Density-based anomaly Commute Time Approach Addressing Scalability Anomalies in Complex Data Evaluating Anomaly Detection Methods Applications Problem solutionsCategorical Data Discrete Sequences and Time Series Contextual Anomalies Collective Anomalies
Finding Collective Anomalies
Find a collection of data points
Each point by itself is normal
The collection as a whole isanomalous
Relevant when data has inherentstructure and
When domain definition ofanomalies cannot be described aspoint anomalies
A Simple Solution
1 Break data intogroups
2 Compute features foreach group
3 Apply traditionalanomaly detection
Examples
1 Time series
2 Image
3 Spatial clusters ofgalaxies
Chawla and Chandola Anomaly Detection
Introduction Data Mining Methods Density-based anomaly Commute Time Approach Addressing Scalability Anomalies in Complex Data Evaluating Anomaly Detection Methods Applications Problem solutionsCategorical Data Discrete Sequences and Time Series Contextual Anomalies Collective Anomalies
Using Latent Dirichlet Allocation for Group Anomalies
Find anomalous groups in data [34]
Example Spatial clusters of galaxies topics red green emissive words continuous features
Flexible Genre Model (FGM)
For each group
1 Draw a genre 1 2 T 3 ym simM(π)2 Draw topic distribution forym SK 3 θm sim Dir(αym)
3 Draw K topicsβmk sim P (βmk|ηk)k=12K
4 For each point in group
1 Draw topic membershipzmn simM(θn)
2 Generate pointxmn isin P (xmn|βmzmn)
α
zmn
xmn
N
θm
T
π
ηK
ym
β
MK
Model Parameters
M(π) -Multinomial
Genre - Dir(αt)
Topic generatorsP (|ηk)- GIW
Point generatorsP (xmn|βnk) -MultivariateGaussian
Chawla and Chandola Anomaly Detection
Introduction Data Mining Methods Density-based anomaly Commute Time Approach Addressing Scalability Anomalies in Complex Data Evaluating Anomaly Detection Methods Applications Problem solutionsCategorical Data Discrete Sequences and Time Series Contextual Anomalies Collective Anomalies
Inference and Testing for FGM
Inference and Learning Parameters
Approximate inference of latentvariables (Gibbs Sampling)
Use samples to learn parameters(Single step Monte Carlo EM)
Topic 1
Topic 2
Topic 3
Anomaly Detection
Infer the topic distribution θm
Compute negative log likelihood wrt αt
Rationale An anomalous group will be unlikely to begenerated from any genre
Geometric interpretation Mapping each group into a Tdimensional space and finding anomalies
Chawla and Chandola Anomaly Detection
Introduction Data Mining Methods Density-based anomaly Commute Time Approach Addressing Scalability Anomalies in Complex Data Evaluating Anomaly Detection Methods Applications Problem solutions
Evaluating Anomaly Detection Methods - Labels
Labeled validation data set exists Confusion matrix Traditional evaluation metrics
Class imbalance
ROC Curve
Validation set does not exist Use domain expertise to find TP
and FP FN is harder to estimate
Pseudo false negativeestimation techniques [25]
Predicteda n
Actuala TP FNn FP TN
Acc =TP + TNsum
Rec (R) =TP
TP + FN
Prec (P ) =TP
TP + FP
F =2 lowastR lowast PR+ P
Chawla and Chandola Anomaly Detection
Introduction Data Mining Methods Density-based anomaly Commute Time Approach Addressing Scalability Anomalies in Complex Data Evaluating Anomaly Detection Methods Applications Problem solutions
Evaluating Anomaly Detection Methods - Scores
Convert to binary output Use threshold δ on score (Scale
issues [21]) Take top x as anomalies
ROC curve by varying x or δ
Quality of output Does the output ldquosuggestrdquo x or δ Which output is better
Chawla and Chandola Anomaly Detection
Introduction Data Mining Methods Density-based anomaly Commute Time Approach Addressing Scalability Anomalies in Complex Data Evaluating Anomaly Detection Methods Applications Problem solutions
Unifying Scores
Different methods assign scores in differentranges
kNN-based scores [0 1] Lof scores [1 6] ABOD scores [0 80000]
Anomalies have lower scores
Direct scaling to [0 1] might lose distinctionbetween normal and anomalies
Desired scaling Stretch interesting rangesand shrink irrelevant ones
Generalized Procedure for Normalizing Outlier Scores [21] Regularity rArr S(o) ge 0forallo S(o) asymp 0 if o is normal andS(o) 0 if o is anomalous
Normality S is regular and S(o) isin [0 1]forallo
Chawla and Chandola Anomaly Detection
Introduction Data Mining Methods Density-based anomaly Commute Time Approach Addressing Scalability Anomalies in Complex Data Evaluating Anomaly Detection Methods Applications Problem solutions
Regularization and Normalization of Scores
Regularization
1 R(o) = max0 S(o)minus baseS2 R(o) = Smax minus S(o)
3 R(o) = minus log SmaxS(o)
Normalization
1 N(o) = S(o)Smax
2 N(o) = max(
0 erf(S(o)minusmicroSσS radic2
))(Gaussian Scaling)
Suited for high dimensional data
3 N(o) = max(
0cdfγS (o)minusmicroγ
1minusmicroγ
)(Gamma Scaling)
Where cdfγS (o) = P (k S(o) θ) P is the regularized Gamma function Suited for low dimensional data
Chawla and Chandola Anomaly Detection
Introduction Data Mining Methods Density-based anomaly Commute Time Approach Addressing Scalability Anomalies in Complex Data Evaluating Anomaly Detection Methods Applications Problem solutions
Generating Labeled Data for Validation
Generating Both Normal and Anomalous Data
Use generative models for normal and anomalous behavior
Several generators available Multivariate continuous data [27] Multivariate categorical data [5] Discrete sequences using HMM [12]
Drawbacks Might not capture the domain characteristics
Injecting Anomalies - Random Perturbation[30]
Given data point z = xy x and y arepartitions of feature space
Take a random sample D of the entire data set
Let zprime = xprimeyprime isin D such that distancebetween y and yprime is maximum
Replace x with xprime and add z back to data setx
yz
zprime
Injected anomaly
Chawla and Chandola Anomaly Detection
Introduction Data Mining Methods Density-based anomaly Commute Time Approach Addressing Scalability Anomalies in Complex Data Evaluating Anomaly Detection Methods Applications Problem solutionsWhat is Network Anomaly Detection Motivation How Much Serious
Applications Overview
How to set up an anomaly detection solution for agiven application domain
Available data Define anomalies define normal behavior Identify requirements and constraints (online
real-time limited resources) What domain knowledge available
Feature identification Defining normal and anomalous behavior Tuning parameters
Available ground truth (training validation)
Chawla and Chandola Anomaly Detection
Introduction Data Mining Methods Density-based anomaly Commute Time Approach Addressing Scalability Anomalies in Complex Data Evaluating Anomaly Detection Methods Applications Problem solutionsWhat is Network Anomaly Detection Motivation How Much Serious
What is Network Anomaly Detection
Anomaly Detection or Intrusion Detection
Traditional Intrusion Detection Systems (IDS) finding attackscorresponding to predefined pattern data set known as signaturestherefore system is absolutely vulnerable against zero-day attacks
Network Anomaly Detection Systems (NADS) to detectzero-day attacks without any pre-identified signature besides profilenormal behavior of the network and address suspected incidents
Network Anomaly Detection finding unusual and largechanges in the network traffic
Examples intentional attacks (eg Distributed Denial ofService - DDoS) or unusual network traffic (eg flash crowds)
Chawla and Chandola Anomaly Detection
Introduction Data Mining Methods Density-based anomaly Commute Time Approach Addressing Scalability Anomalies in Complex Data Evaluating Anomaly Detection Methods Applications Problem solutionsWhat is Network Anomaly Detection Motivation How Much Serious
Motivation How Much Serious
According to Symantec report released in early 2011 morethan 286 million new threats have been detected in 2010which is a huge number
1656227
2704836
1000000
1500000
2000000
2500000
3000000
20547 18827 69107 113025 140690
624267
1656227
2704836
0
500000
1000000
1500000
2000000
2500000
3000000
2002 2003 2004 2005 2006 2007 2008 July2009-June2010
Chawla and Chandola Anomaly Detection
Introduction Data Mining Methods Density-based anomaly Commute Time Approach Addressing Scalability Anomalies in Complex Data Evaluating Anomaly Detection Methods Applications Problem solutionsNetwork Topology Network Anomalies Detection Problem Network Anomalies Detection Problem Why care about OD Flows
Network Topology
A Typical network
1 y
Router
2
3
41t
x2t
x1t
x3t
x4t
Origin-Destination (OD) flow is the traffic that enters at anorigin node and exits at a destination node of a backbonenetwork x1t x1t
Link measurement is the traffic enters at an node during aninterval y1t
Relationship between link traffic and OD flow traffic iscaptured by the routing matrix A
Chawla and Chandola Anomaly Detection
Introduction Data Mining Methods Density-based anomaly Commute Time Approach Addressing Scalability Anomalies in Complex Data Evaluating Anomaly Detection Methods Applications Problem solutionsNetwork Topology Network Anomalies Detection Problem Network Anomalies Detection Problem Why care about OD Flows
Network Anomalies Detection Problem
Chawla and Chandola Anomaly Detection
Introduction Data Mining Methods Density-based anomaly Commute Time Approach Addressing Scalability Anomalies in Complex Data Evaluating Anomaly Detection Methods Applications Problem solutionsNetwork Topology Network Anomalies Detection Problem Network Anomalies Detection Problem Why care about OD Flows
Network Anomalies Detection Problem
Chawla and Chandola Anomaly Detection
Introduction Data Mining Methods Density-based anomaly Commute Time Approach Addressing Scalability Anomalies in Complex Data Evaluating Anomaly Detection Methods Applications Problem solutionsNetwork Topology Network Anomalies Detection Problem Network Anomalies Detection Problem Why care about OD Flows
Why care about OD Flows
Volume anomaly typically arises on an OD flow (trafficarriving at one node and destined for another node)
If we only monitor traffic on network links volume arisingfrom an OD flow may not be noticeable Thus naiveapproach wont work if OD flow info is not available
Figure source [22]
Chawla and Chandola Anomaly Detection
Introduction Data Mining Methods Density-based anomaly Commute Time Approach Addressing Scalability Anomalies in Complex Data Evaluating Anomaly Detection Methods Applications Problem solutionsPCA and Subspace Method Subspace Method Algorithm Subspace Analysis Results Discussion Typical Characteristics of Anomaly Limitation of Volume Entropy Based versus Volume Based Fraud Detection Epidemeology Anomaly Detection in Climate and Weather Anomalies in Climate Validation of Anomalies
PCA and Subspace Method
Chawla and Chandola Anomaly Detection
Introduction Data Mining Methods Density-based anomaly Commute Time Approach Addressing Scalability Anomalies in Complex Data Evaluating Anomaly Detection Methods Applications Problem solutionsPCA and Subspace Method Subspace Method Algorithm Subspace Analysis Results Discussion Typical Characteristics of Anomaly Limitation of Volume Entropy Based versus Volume Based Fraud Detection Epidemeology Anomaly Detection in Climate and Weather Anomalies in Climate Validation of Anomalies
Subspace Method Algorithm
Step1- Determine the PCs based on eigenvaluedecomposition of the covariance matrix of the dataset
Step2- Choose first top k principle components with thehighest eigenvalues as matrix P
Step3-normal traffic subspace called Z
Z = PP TZ = CZ
Step4-abnormal traffic subspace called Z
Z = (I minus PP T )Z = CZ
Step5-If the norm of a vector is large then it is an rdquoanomalyrdquo
Chawla and Chandola Anomaly Detection
Introduction Data Mining Methods Density-based anomaly Commute Time Approach Addressing Scalability Anomalies in Complex Data Evaluating Anomaly Detection Methods Applications Problem solutionsPCA and Subspace Method Subspace Method Algorithm Subspace Analysis Results Discussion Typical Characteristics of Anomaly Limitation of Volume Entropy Based versus Volume Based Fraud Detection Epidemeology Anomaly Detection in Climate and Weather Anomalies in Climate Validation of Anomalies
Subspace Analysis Results
Note that during anomaly normal component does not changethat much while residual component changes quite a lot
Thus anomalies can be detected by setting some threshold
Figure source [22]
Chawla and Chandola Anomaly Detection
Introduction Data Mining Methods Density-based anomaly Commute Time Approach Addressing Scalability Anomalies in Complex Data Evaluating Anomaly Detection Methods Applications Problem solutionsPCA and Subspace Method Subspace Method Algorithm Subspace Analysis Results Discussion Typical Characteristics of Anomaly Limitation of Volume Entropy Based versus Volume Based Fraud Detection Epidemeology Anomaly Detection in Climate and Weather Anomalies in Climate Validation of Anomalies
Discussion Typical Characteristics of Anomaly
Most Anomalies induce a change in distributionalaspects of packet header fields (called features)
Most important features include 5-tuple Source ampdestination IP addresses Source and destination portnumbers and IP protocol
raquo DOS attack ndash multiple source IP address concentrated on asingle destination IP address
raquo Network scan ndash dispersed distribution of destination addresses
raquo Most wormsviruses also induce some change in distribution ofcertain features
raquo However these changes can be very subtle and mining them islike searching for needles in a haystack
Unlike many previous approach this paper aims todetect events which disturb the distribution of trafficfeatures rather than traffic volume
Chawla and Chandola Anomaly Detection
Introduction Data Mining Methods Density-based anomaly Commute Time Approach Addressing Scalability Anomalies in Complex Data Evaluating Anomaly Detection Methods Applications Problem solutionsPCA and Subspace Method Subspace Method Algorithm Subspace Analysis Results Discussion Typical Characteristics of Anomaly Limitation of Volume Entropy Based versus Volume Based Fraud Detection Epidemeology Anomaly Detection in Climate and Weather Anomalies in Climate Validation of Anomalies
Limitation of Volume
Figure source [22]
Port scan anomaly (traffic feature changes however traffic volume
remains more or less the same)
We can use entropy tocapture the variationsin the traffic feature
bullTakes value 0 when distribution is maximally concentratedbullTakes value log2N when distribution is maximally dispersed
But stands out in
feature entropy
which also reveals
its structure
Port scan
dwarfed
in volume
metricshellip
Chawla and Chandola Anomaly Detection
Introduction Data Mining Methods Density-based anomaly Commute Time Approach Addressing Scalability Anomalies in Complex Data Evaluating Anomaly Detection Methods Applications Problem solutionsPCA and Subspace Method Subspace Method Algorithm Subspace Analysis Results Discussion Typical Characteristics of Anomaly Limitation of Volume Entropy Based versus Volume Based Fraud Detection Epidemeology Anomaly Detection in Climate and Weather Anomalies in Climate Validation of Anomalies
Entropy Based versus Volume Based
DoSDDoS Attacks- a spike in traffic data toward adominant destination IP
Scan anomaly-a spike in traffic data from a dominant sourceIP
Flash Crowd anomaly- again a spike in traffic data to adominant destination IP
Worm anomaly-a Spike in traffic with a dominant port
Chawla and Chandola Anomaly Detection
Introduction Data Mining Methods Density-based anomaly Commute Time Approach Addressing Scalability Anomalies in Complex Data Evaluating Anomaly Detection Methods Applications Problem solutionsPCA and Subspace Method Subspace Method Algorithm Subspace Analysis Results Discussion Typical Characteristics of Anomaly Limitation of Volume Entropy Based versus Volume Based Fraud Detection Epidemeology Anomaly Detection in Climate and Weather Anomalies in Climate Validation of Anomalies
Fraud Detection
Domain Question Identifyfraudulent activities or players fromobserved transaction data
Data Transactions between different
players in the system Meta information about the
individuals An underlying graph structure
Challenges Track and model human behavior Anomalies caused by adaptive
human adversaries Massive data sizes
Insurance (autohealtha)
ClaimantProvider Payer
Telecommunications Customer
Provider
Credit Cards Customer
Supplier Bank
Web Advertising User Advertiser
Publisher
ahttpwwwcheatingculturecompast-cases-of-medicare-fraud
Chawla and Chandola Anomaly Detection
Introduction Data Mining Methods Density-based anomaly Commute Time Approach Addressing Scalability Anomalies in Complex Data Evaluating Anomaly Detection Methods Applications Problem solutionsPCA and Subspace Method Subspace Method Algorithm Subspace Analysis Results Discussion Typical Characteristics of Anomaly Limitation of Volume Entropy Based versus Volume Based Fraud Detection Epidemeology Anomaly Detection in Climate and Weather Anomalies in Climate Validation of Anomalies
A Generic Fraud Detection Method
Activity Monitoring [13]1 Build profiles for individuals (customers users etc) based on
historic data User X makes n calls on an average in January
2 Compare current behavior with historical profile for significantdeviations
Clustering based [4]1 Cluster historical profiles of customers2 Identify small clusters or outlying profiles as anomalies
Strengths Anomaly detection is fast (good for real time) Results are easy to explain
Weaknesses Need to create and maintain a large number of profiles Not dynamic Adequate historical data might not be available Too many false positives
Chawla and Chandola Anomaly Detection
Introduction Data Mining Methods Density-based anomaly Commute Time Approach Addressing Scalability Anomalies in Complex Data Evaluating Anomaly Detection Methods Applications Problem solutionsPCA and Subspace Method Subspace Method Algorithm Subspace Analysis Results Discussion Typical Characteristics of Anomaly Limitation of Volume Entropy Based versus Volume Based Fraud Detection Epidemeology Anomaly Detection in Climate and Weather Anomalies in Climate Validation of Anomalies
Exploiting Graph Structure - Weighted Graphs
Represent data as a weighted graph Communication networks (phone email SMS) Provider referral networks
Objective Identify anomalous nodes
For each node extract several features based on the propertiesof the induced sub-graph (egonet) of neighboring nodes [1]
Choose features that can highlight anomalous nodes
1 Ni degree of node2 Ei number of edges in egonet3 Wi total weight of egonet4 λi principal eigen vector of weighted adjacency matrix of
egonet
Data is transformed into a point in a multi-dimensional space
Chawla and Chandola Anomaly Detection
Introduction Data Mining Methods Density-based anomaly Commute Time Approach Addressing Scalability Anomalies in Complex Data Evaluating Anomaly Detection Methods Applications Problem solutionsPCA and Subspace Method Subspace Method Algorithm Subspace Analysis Results Discussion Typical Characteristics of Anomaly Limitation of Volume Entropy Based versus Volume Based Fraud Detection Epidemeology Anomaly Detection in Climate and Weather Anomalies in Climate Validation of Anomalies
Identifying Anomalies
Traditional anomaly detection (lof) Can be slow but can identify any type of anomalous structure
Faster method to identify specific types of anomalousstructures
Identify relevant feature pairs and power law relationship
Eg Egonet Density Power Law Ni vs Ei - detect nearcliques and stars
Ei prop Nαi 1 le α le 2
Anomaly score for node i wrt a pair of features (y = Cxθ)
Si =max(yi Cx
θi )
min(yi Cxθi )lowast log (|yi minus Cxθi |+ 1)
Chawla and Chandola Anomaly Detection
Introduction Data Mining Methods Density-based anomaly Commute Time Approach Addressing Scalability Anomalies in Complex Data Evaluating Anomaly Detection Methods Applications Problem solutionsPCA and Subspace Method Subspace Method Algorithm Subspace Analysis Results Discussion Typical Characteristics of Anomaly Limitation of Volume Entropy Based versus Volume Based Fraud Detection Epidemeology Anomaly Detection in Climate and Weather Anomalies in Climate Validation of Anomalies
Exploiting Graph Structure - Bipartite Graphs
Represent data as a bipartite graph Healthcare Data (Beneficiaries vs Providers) Insider trading (Traders vs Stocks)
Objective Identify anomalous links
Given a query node a isin V1 find the ldquorelevancerdquoof all other nodes in V1 to a
RelevanceScore(a b) prop Number of times aldquorandom walkrdquo from a reaches b
Use the relevance scores to compute thenormality scores for a node t isin V2
Find set St = a|〈a t〉 isin E Compute |St| times |St| similarity matrix using
relevance vectors for a isin St Normality Score = mean of non-diagonal entries
of similarity matrix
V1 E V2a1
a2
a3
an
t1
t2
t3
tn
Chawla and Chandola Anomaly Detection
Introduction Data Mining Methods Density-based anomaly Commute Time Approach Addressing Scalability Anomalies in Complex Data Evaluating Anomaly Detection Methods Applications Problem solutionsPCA and Subspace Method Subspace Method Algorithm Subspace Analysis Results Discussion Typical Characteristics of Anomaly Limitation of Volume Entropy Based versus Volume Based Fraud Detection Epidemeology Anomaly Detection in Climate and Weather Anomalies in Climate Validation of Anomalies
Detecting Disease Outbreaks
Domain Question Early detection of disease
outbreaks Anthrax attack
Data Emergency department visits Grocery data (Example [14]) Clinical visits Weatherclimate data
Challenges Weak signals in the data
ED cases involving cough rArrFlu or SARS
Integration of multiple signals(lag analysis)
Account for spatial and temporalcorrelations
Chawla and Chandola Anomaly Detection
Introduction Data Mining Methods Density-based anomaly Commute Time Approach Addressing Scalability Anomalies in Complex Data Evaluating Anomaly Detection Methods Applications Problem solutionsPCA and Subspace Method Subspace Method Algorithm Subspace Analysis Results Discussion Typical Characteristics of Anomaly Limitation of Volume Entropy Based versus Volume Based Fraud Detection Epidemeology Anomaly Detection in Climate and Weather Anomalies in Climate Validation of Anomalies
Whatrsquos Significant About Recent Events (WSARE) [33]
1 Learn Bayesian network from historical data Environmental and response variables
2 Sample from the BN (DBbaseline|Current Environment)3 Compute contingency table for rules for DBbaseline andDBcurrent
Rules are single assignment rules (Xi = Y ji ) or conjunctions4 Find p-value for rules using χ2-test
Null Hypothesis Rows and columns of tables for DBbaselineand DBcurrent are independent
5 Find rule with largest p-value Repeat Step 2
Chawla and Chandola Anomaly Detection
Introduction Data Mining Methods Density-based anomaly Commute Time Approach Addressing Scalability Anomalies in Complex Data Evaluating Anomaly Detection Methods Applications Problem solutionsPCA and Subspace Method Subspace Method Algorithm Subspace Analysis Results Discussion Typical Characteristics of Anomaly Limitation of Volume Entropy Based versus Volume Based Fraud Detection Epidemeology Anomaly Detection in Climate and Weather Anomalies in Climate Validation of Anomalies
Incorporating Spatial and Temporal Relationships
WSARE does not explicitly model the spatial and temporalrelationships
What happened yesterday What happened in the adjoining neighborhood (yesterday)
Bayesian Network Spatio-Temporal (BNST) modelingframework [17]
Add nodes for temporal and spatial dependencies Need more data to train
Chawla and Chandola Anomaly Detection
Introduction Data Mining Methods Density-based anomaly Commute Time Approach Addressing Scalability Anomalies in Complex Data Evaluating Anomaly Detection Methods Applications Problem solutionsPCA and Subspace Method Subspace Method Algorithm Subspace Analysis Results Discussion Typical Characteristics of Anomaly Limitation of Volume Entropy Based versus Volume Based Fraud Detection Epidemeology Anomaly Detection in Climate and Weather Anomalies in Climate Validation of Anomalies
Anomaly Detection in Climate and Weather
Science Questions Identify natural and anthropogenic disasters Identify long time scale events - droughts atmospheric rivers
cold fronts etc
Data Ground observations Remote sensing data (satellites
air-borne) Climate model simulation outputs Multiple variables spatio-temporal (often has height dimension
as well)
Challenges Model spatio-temporal relationships across multiple variables Explain the cause of anomalies Massive data sizes
Climate and weather extreme events are well defined
Key challenge is to find significant events and explain the cause
Chawla and Chandola Anomaly Detection
Introduction Data Mining Methods Density-based anomaly Commute Time Approach Addressing Scalability Anomalies in Complex Data Evaluating Anomaly Detection Methods Applications Problem solutionsPCA and Subspace Method Subspace Method Algorithm Subspace Analysis Results Discussion Typical Characteristics of Anomaly Limitation of Volume Entropy Based versus Volume Based Fraud Detection Epidemeology Anomaly Detection in Climate and Weather Anomalies in Climate Validation of Anomalies
Anomalies are Widely Used in Climate
Most analysis done on ldquoanomalyrdquo time series
Difference from a ldquobase periodrdquo (Toosimplistic)
Brings spatial smoothness (eg a mountaintop and nearby valley can have very differenttemperatures) Removes seasonality
Understand climate and weatherphenomenon
Southern Oscillation Index (SOI) Difference between Sea Level Pressure
(SLP) anomalies for Tahiti and DarwinAustralia
Figure Global AverageTemperature Anomaly(1975 - 2007) Srcwwwmetofficegovuk
Chawla and Chandola Anomaly Detection
Introduction Data Mining Methods Density-based anomaly Commute Time Approach Addressing Scalability Anomalies in Complex Data Evaluating Anomaly Detection Methods Applications Problem solutionsPCA and Subspace Method Subspace Method Algorithm Subspace Analysis Results Discussion Typical Characteristics of Anomaly Limitation of Volume Entropy Based versus Volume Based Fraud Detection Epidemeology Anomaly Detection in Climate and Weather Anomalies in Climate Validation of Anomalies
Constructing Anomalies from Raw Data
Anomaly time series for a given location i
vprimei = vi minus bi
where bi is the base (reference)
How to choose bi Mean of all data for location i Monthly mean values (account for seasonality) Monthly z-score values Median (more robust) Using a shorter ldquoreference periodrdquo
30 year moving window
Different methods show statistically significant differences[19] What is the right strategy Weighted mean of different strategies (Pick weights using
Monte Carlo sampling)
Chawla and Chandola Anomaly Detection
Introduction Data Mining Methods Density-based anomaly Commute Time Approach Addressing Scalability Anomalies in Complex Data Evaluating Anomaly Detection Methods Applications Problem solutionsPCA and Subspace Method Subspace Method Algorithm Subspace Analysis Results Discussion Typical Characteristics of Anomaly Limitation of Volume Entropy Based versus Volume Based Fraud Detection Epidemeology Anomaly Detection in Climate and Weather Anomalies in Climate Validation of Anomalies
Anomaly Detection for Identifying Droughts
Science question Identify significant drought patterns usinghistorical observation data or future simulation data or both
Find persistent spatiotemporal anomalies in precipitation data
A two step approach
1 Find precipitationanomalies usingthresholds
2 Find large connectedcomponents across spaceand time
Matlab - bwlabelbwlabeln
Followup Science questionExplain cause
(drought190120061avi)
Figure Video courtsey Dr ArindamBanerjee
Chawla and Chandola Anomaly Detection
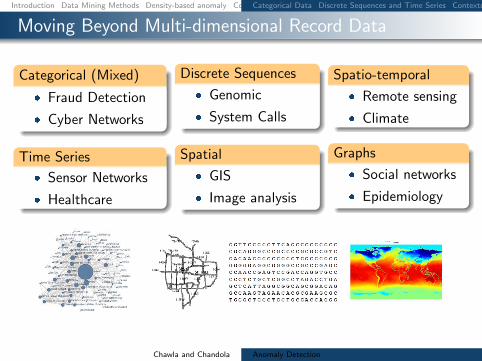
Introduction Data Mining Methods Density-based anomaly Commute Time Approach Addressing Scalability Anomalies in Complex Data Evaluating Anomaly Detection Methods Applications Problem solutionsCategorical Data Discrete Sequences and Time Series Contextual Anomalies Collective Anomalies
Moving Beyond Multi-dimensional Record Data
Categorical (Mixed)
Fraud Detection
Cyber Networks
Time Series
Sensor Networks
Healthcare
Discrete Sequences
Genomic
System Calls
Spatial
GIS
Image analysis
Spatio-temporal
Remote sensing
Climate
Graphs
Social networks
Epidemiology
Chawla and Chandola Anomaly Detection
Introduction Data Mining Methods Density-based anomaly Commute Time Approach Addressing Scalability Anomalies in Complex Data Evaluating Anomaly Detection Methods Applications Problem solutionsCategorical Data Discrete Sequences and Time Series Contextual Anomalies Collective Anomalies
Handling Categorical Data
Each attribute can belong to one of many categories
No ordering between categories
Mixed data (categorical and continuous attributes)
cap-shape cap-surface middot middot middot habitat type
convex smooth urban poisonousconvex smooth grasses ediblebell smooth meadows edibleconvex scaly urban poisonousconvex smooth grasses ediblemiddot middot middot
Table Mushroom Data Set [2]
Chawla and Chandola Anomaly Detection
Introduction Data Mining Methods Density-based anomaly Commute Time Approach Addressing Scalability Anomalies in Complex Data Evaluating Anomaly Detection Methods Applications Problem solutionsCategorical Data Discrete Sequences and Time Series Contextual Anomalies Collective Anomalies
Approaches to Identify Categorical Anomalies
Using Association Analysis [24]
Binarize data
Learn rules (X rArr Y ) Choose high confidence
rules (P (Y |X))
For test record Z = 〈XY 〉find rules of the formP (Y |X)
Y is not observed whenX is observed
Using Bayesian Networks [33]
Learn Bayesian networkstructure and parameters
Compute P (Z) for test datarecord Z
Flag anomaly if P (Z) lt δ
Using Similarity Metrics [10]
Use a similarity measure (S(X1 X2))
Apply distancedensityclustering based method (eg lof)
Chawla and Chandola Anomaly Detection
Introduction Data Mining Methods Density-based anomaly Commute Time Approach Addressing Scalability Anomalies in Complex Data Evaluating Anomaly Detection Methods Applications Problem solutionsCategorical Data Discrete Sequences and Time Series Contextual Anomalies Collective Anomalies
Conditional Probability Test [18]
Identify unusual combinations of attribute values
r(at bt) =P (at bt)
P (at)P (bt)
A capB = φ Assumption If r(at bt) is low and is observed in test record t
then t is anomalous For a test record t
For each mutually exclusive pair of attribute sets ABcompute r(at bt)
Score t based on all r-values Assign minimum r-value as score Take product of all r-values
Need to compare exponential pairs of subsets Only consider subsets upto size k Ignore subsets with frequency less than a threshold α Avoid comparing independent subsets of attributes
micro(AB) ge βmicroChawla and Chandola Anomaly Detection
Introduction Data Mining Methods Density-based anomaly Commute Time Approach Addressing Scalability Anomalies in Complex Data Evaluating Anomaly Detection Methods Applications Problem solutionsCategorical Data Discrete Sequences and Time Series Contextual Anomalies Collective Anomalies
Estimating Probabilities for CPT [18]
Maximum LikelihoodEstimation
P (at bt)
P (at)P (bt)=C(at bt)
Ntimes N
C(at)times N
C(bt)
C(at) Number of traininginstances with A = at
N Total number of traininginstances
Laplace Smoothing
E(p) =C(p) + 1
N + 2
r(at bt) =E(at bt)
E(at)times E(bt)
Speedup Tricks
Replace rare attributevalues with genericattribute (reduce arity)
Use efficient datastructure to querying forcounts(AD Trees [26])
ADTrees work fasterfor low arity attributes
Chawla and Chandola Anomaly Detection
Introduction Data Mining Methods Density-based anomaly Commute Time Approach Addressing Scalability Anomalies in Complex Data Evaluating Anomaly Detection Methods Applications Problem solutionsCategorical Data Discrete Sequences and Time Series Contextual Anomalies Collective Anomalies
Finding Anomalies in Discrete Sequences
Many problem formulations
1 Anomalous symbols in asequence
2 Anomalous subsequence in asequence
3 Anomalous sequence in adatabase of sequences
See [11] for a comparativeevaluation [9] for a survey
login pwdmail ssh mail web logoutlogin pwdmail web web web web logoutlogin pwdmail ssh mail web web logoutlogin pwdwebmail ssh webmail logoutloginpwd loginpwd loginpwd logout
Chawla and Chandola Anomaly Detection
Introduction Data Mining Methods Density-based anomaly Commute Time Approach Addressing Scalability Anomalies in Complex Data Evaluating Anomaly Detection Methods Applications Problem solutionsCategorical Data Discrete Sequences and Time Series Contextual Anomalies Collective Anomalies
Treating Sequences as Points
Utilize a distancesimilarity measure Plug into a distancedensityclustering based method
Simplest Hamming Distance
h(Ai Bi) = 1 Ai 6= Bi= 0 Ai = Bi
H(AB) =nsumi=1
h(Ai Bi)
Issues Unequal lengths misalignment Normalized Length of Longest Common Subsequence
D(AB) = 1minus |LCS(AB)|radic|A||B|
Standard Dynamic Programming method is slow Faster versions available (Hunt Szymnaski method [7])
Weaknesses Cannot localize anomalies within a sequence Weak anomaly signals might get lost
Chawla and Chandola Anomaly Detection
Introduction Data Mining Methods Density-based anomaly Commute Time Approach Addressing Scalability Anomalies in Complex Data Evaluating Anomaly Detection Methods Applications Problem solutionsCategorical Data Discrete Sequences and Time Series Contextual Anomalies Collective Anomalies
Using Sliding Windows
Slide a window of size k
Extract all windows from a sequence (nminus k + 1)
Training (Creating a normal dictionary) Store all uniquewindows in all normal sequences and their counts
Testing For each window find the frequency in normal dictionary Anomaly score is inverse of the aggregate frequencies for all
windows (normalized by length)
Many variants exist For each window find the hamming distance to the closest
window in the normal dictionary [16]
Issues Penalizes low frequency windows in the normal dictionary Rewards high frequency windows that might not be relevant Can construct anomalous sequences that will escape detection
Chawla and Chandola Anomaly Detection
Introduction Data Mining Methods Density-based anomaly Commute Time Approach Addressing Scalability Anomalies in Complex Data Evaluating Anomaly Detection Methods Applications Problem solutionsCategorical Data Discrete Sequences and Time Series Contextual Anomalies Collective Anomalies
Using Probabilistic Models
Probability of occurrence of sequence S
P (S) =nprodi=1
P (Si|S1 Siminus1)
Short memory property of sequences
P (Si|S1 Siminus1) = P (Si|Siminusk Siminus1)
Conditional probability estimates for a symbol Si
P (Si|Siminusk Siminus1) =f(Si|Siminusk Si)f(Si|Siminusk Siminus1)
f is estimated from the normal dictionary
Anomaly score for a test sequence is inverse of the normalizedprobability of occurrence
Issues What if the suffix occurs very infrequently in thenormal data (or not at all)
Replace with the longest suffix that occurs sufficient number oftimes [32] - Probabilistic Suffix Trees
Significantly reduces the size of the modelChawla and Chandola Anomaly Detection
Introduction Data Mining Methods Density-based anomaly Commute Time Approach Addressing Scalability Anomalies in Complex Data Evaluating Anomaly Detection Methods Applications Problem solutionsCategorical Data Discrete Sequences and Time Series Contextual Anomalies Collective Anomalies
Finding Contextual Anomalies
Sometimes contextual information isavailable about data
Not used directly as a feature Are well understood no anomalies in
the context Can reduce false positives and yield
interesting anomalies
Example adapted from [30]
Clearest Outlier
Conditional Anomaly
Maximum Daily Temperature
Number
ofFever
Cases
Contextual anomalies - Anomalous with respect to a context Context is defined using environmental variables
Spatial (Latitude Longitude) Graph context (Edges Weights) Temporal location Domain specific (Demographic other)
How to incorporate context Reduce to traditional anomaly detection (subset on context) Explicitly model contextual information (time series spatial)
Chawla and Chandola Anomaly Detection
Introduction Data Mining Methods Density-based anomaly Commute Time Approach Addressing Scalability Anomalies in Complex Data Evaluating Anomaly Detection Methods Applications Problem solutionsCategorical Data Discrete Sequences and Time Series Contextual Anomalies Collective Anomalies
Conditional Anomaly Detection
Data instance d rArru1 u2 udU v1 v2 vdV
dU environmentalattributes
dV indicator attributes u1
u2
U1
U2
U3
v1
v2
V1V2
V3
p(V1|U3) = 02
p(V2|U3) = 02
p(V3|U3) = 06
Algorithm [30]
1 Learn a Gaussian Mixture Model (GMM)U = U1 U2 UnU
each with dimensionality dU2 Learn a set of Gaussians U = V1 V2 VnV
each withdimensionality dV
3 Learn a probabilistic mapping function p(Vj |Ui)4 Score a test instance d = [uv]
S =
nUsumi=1
p(u|Ui)nVsumj=1
p(v|Vj)p(Vj |Ui)
Chawla and Chandola Anomaly Detection
Introduction Data Mining Methods Density-based anomaly Commute Time Approach Addressing Scalability Anomalies in Complex Data Evaluating Anomaly Detection Methods Applications Problem solutionsCategorical Data Discrete Sequences and Time Series Contextual Anomalies Collective Anomalies
Finding Collective Anomalies
Find a collection of data points
Each point by itself is normal
The collection as a whole isanomalous
Relevant when data has inherentstructure and
When domain definition ofanomalies cannot be described aspoint anomalies
A Simple Solution
1 Break data intogroups
2 Compute features foreach group
3 Apply traditionalanomaly detection
Examples
1 Time series
2 Image
3 Spatial clusters ofgalaxies
Chawla and Chandola Anomaly Detection
Introduction Data Mining Methods Density-based anomaly Commute Time Approach Addressing Scalability Anomalies in Complex Data Evaluating Anomaly Detection Methods Applications Problem solutionsCategorical Data Discrete Sequences and Time Series Contextual Anomalies Collective Anomalies
Using Latent Dirichlet Allocation for Group Anomalies
Find anomalous groups in data [34]
Example Spatial clusters of galaxies topics red green emissive words continuous features
Flexible Genre Model (FGM)
For each group
1 Draw a genre 1 2 T 3 ym simM(π)2 Draw topic distribution forym SK 3 θm sim Dir(αym)
3 Draw K topicsβmk sim P (βmk|ηk)k=12K
4 For each point in group
1 Draw topic membershipzmn simM(θn)
2 Generate pointxmn isin P (xmn|βmzmn)
α
zmn
xmn
N
θm
T
π
ηK
ym
β
MK
Model Parameters
M(π) -Multinomial
Genre - Dir(αt)
Topic generatorsP (|ηk)- GIW
Point generatorsP (xmn|βnk) -MultivariateGaussian
Chawla and Chandola Anomaly Detection
Introduction Data Mining Methods Density-based anomaly Commute Time Approach Addressing Scalability Anomalies in Complex Data Evaluating Anomaly Detection Methods Applications Problem solutionsCategorical Data Discrete Sequences and Time Series Contextual Anomalies Collective Anomalies
Inference and Testing for FGM
Inference and Learning Parameters
Approximate inference of latentvariables (Gibbs Sampling)
Use samples to learn parameters(Single step Monte Carlo EM)
Topic 1
Topic 2
Topic 3
Anomaly Detection
Infer the topic distribution θm
Compute negative log likelihood wrt αt
Rationale An anomalous group will be unlikely to begenerated from any genre
Geometric interpretation Mapping each group into a Tdimensional space and finding anomalies
Chawla and Chandola Anomaly Detection
Introduction Data Mining Methods Density-based anomaly Commute Time Approach Addressing Scalability Anomalies in Complex Data Evaluating Anomaly Detection Methods Applications Problem solutions
Evaluating Anomaly Detection Methods - Labels
Labeled validation data set exists Confusion matrix Traditional evaluation metrics
Class imbalance
ROC Curve
Validation set does not exist Use domain expertise to find TP
and FP FN is harder to estimate
Pseudo false negativeestimation techniques [25]
Predicteda n
Actuala TP FNn FP TN
Acc =TP + TNsum
Rec (R) =TP
TP + FN
Prec (P ) =TP
TP + FP
F =2 lowastR lowast PR+ P
Chawla and Chandola Anomaly Detection
Introduction Data Mining Methods Density-based anomaly Commute Time Approach Addressing Scalability Anomalies in Complex Data Evaluating Anomaly Detection Methods Applications Problem solutions
Evaluating Anomaly Detection Methods - Scores
Convert to binary output Use threshold δ on score (Scale
issues [21]) Take top x as anomalies
ROC curve by varying x or δ
Quality of output Does the output ldquosuggestrdquo x or δ Which output is better
Chawla and Chandola Anomaly Detection
Introduction Data Mining Methods Density-based anomaly Commute Time Approach Addressing Scalability Anomalies in Complex Data Evaluating Anomaly Detection Methods Applications Problem solutions
Unifying Scores
Different methods assign scores in differentranges
kNN-based scores [0 1] Lof scores [1 6] ABOD scores [0 80000]
Anomalies have lower scores
Direct scaling to [0 1] might lose distinctionbetween normal and anomalies
Desired scaling Stretch interesting rangesand shrink irrelevant ones
Generalized Procedure for Normalizing Outlier Scores [21] Regularity rArr S(o) ge 0forallo S(o) asymp 0 if o is normal andS(o) 0 if o is anomalous
Normality S is regular and S(o) isin [0 1]forallo
Chawla and Chandola Anomaly Detection
Introduction Data Mining Methods Density-based anomaly Commute Time Approach Addressing Scalability Anomalies in Complex Data Evaluating Anomaly Detection Methods Applications Problem solutions
Regularization and Normalization of Scores
Regularization
1 R(o) = max0 S(o)minus baseS2 R(o) = Smax minus S(o)
3 R(o) = minus log SmaxS(o)
Normalization
1 N(o) = S(o)Smax
2 N(o) = max(
0 erf(S(o)minusmicroSσS radic2
))(Gaussian Scaling)
Suited for high dimensional data
3 N(o) = max(
0cdfγS (o)minusmicroγ
1minusmicroγ
)(Gamma Scaling)
Where cdfγS (o) = P (k S(o) θ) P is the regularized Gamma function Suited for low dimensional data
Chawla and Chandola Anomaly Detection
Introduction Data Mining Methods Density-based anomaly Commute Time Approach Addressing Scalability Anomalies in Complex Data Evaluating Anomaly Detection Methods Applications Problem solutions
Generating Labeled Data for Validation
Generating Both Normal and Anomalous Data
Use generative models for normal and anomalous behavior
Several generators available Multivariate continuous data [27] Multivariate categorical data [5] Discrete sequences using HMM [12]
Drawbacks Might not capture the domain characteristics
Injecting Anomalies - Random Perturbation[30]
Given data point z = xy x and y arepartitions of feature space
Take a random sample D of the entire data set
Let zprime = xprimeyprime isin D such that distancebetween y and yprime is maximum
Replace x with xprime and add z back to data setx
yz
zprime
Injected anomaly
Chawla and Chandola Anomaly Detection
Introduction Data Mining Methods Density-based anomaly Commute Time Approach Addressing Scalability Anomalies in Complex Data Evaluating Anomaly Detection Methods Applications Problem solutionsWhat is Network Anomaly Detection Motivation How Much Serious
Applications Overview
How to set up an anomaly detection solution for agiven application domain
Available data Define anomalies define normal behavior Identify requirements and constraints (online
real-time limited resources) What domain knowledge available
Feature identification Defining normal and anomalous behavior Tuning parameters
Available ground truth (training validation)
Chawla and Chandola Anomaly Detection
Introduction Data Mining Methods Density-based anomaly Commute Time Approach Addressing Scalability Anomalies in Complex Data Evaluating Anomaly Detection Methods Applications Problem solutionsWhat is Network Anomaly Detection Motivation How Much Serious
What is Network Anomaly Detection
Anomaly Detection or Intrusion Detection
Traditional Intrusion Detection Systems (IDS) finding attackscorresponding to predefined pattern data set known as signaturestherefore system is absolutely vulnerable against zero-day attacks
Network Anomaly Detection Systems (NADS) to detectzero-day attacks without any pre-identified signature besides profilenormal behavior of the network and address suspected incidents
Network Anomaly Detection finding unusual and largechanges in the network traffic
Examples intentional attacks (eg Distributed Denial ofService - DDoS) or unusual network traffic (eg flash crowds)
Chawla and Chandola Anomaly Detection
Introduction Data Mining Methods Density-based anomaly Commute Time Approach Addressing Scalability Anomalies in Complex Data Evaluating Anomaly Detection Methods Applications Problem solutionsWhat is Network Anomaly Detection Motivation How Much Serious
Motivation How Much Serious
According to Symantec report released in early 2011 morethan 286 million new threats have been detected in 2010which is a huge number
1656227
2704836
1000000
1500000
2000000
2500000
3000000
20547 18827 69107 113025 140690
624267
1656227
2704836
0
500000
1000000
1500000
2000000
2500000
3000000
2002 2003 2004 2005 2006 2007 2008 July2009-June2010
Chawla and Chandola Anomaly Detection
Introduction Data Mining Methods Density-based anomaly Commute Time Approach Addressing Scalability Anomalies in Complex Data Evaluating Anomaly Detection Methods Applications Problem solutionsNetwork Topology Network Anomalies Detection Problem Network Anomalies Detection Problem Why care about OD Flows
Network Topology
A Typical network
1 y
Router
2
3
41t
x2t
x1t
x3t
x4t
Origin-Destination (OD) flow is the traffic that enters at anorigin node and exits at a destination node of a backbonenetwork x1t x1t
Link measurement is the traffic enters at an node during aninterval y1t
Relationship between link traffic and OD flow traffic iscaptured by the routing matrix A
Chawla and Chandola Anomaly Detection
Introduction Data Mining Methods Density-based anomaly Commute Time Approach Addressing Scalability Anomalies in Complex Data Evaluating Anomaly Detection Methods Applications Problem solutionsNetwork Topology Network Anomalies Detection Problem Network Anomalies Detection Problem Why care about OD Flows
Network Anomalies Detection Problem
Chawla and Chandola Anomaly Detection
Introduction Data Mining Methods Density-based anomaly Commute Time Approach Addressing Scalability Anomalies in Complex Data Evaluating Anomaly Detection Methods Applications Problem solutionsNetwork Topology Network Anomalies Detection Problem Network Anomalies Detection Problem Why care about OD Flows
Network Anomalies Detection Problem
Chawla and Chandola Anomaly Detection
Introduction Data Mining Methods Density-based anomaly Commute Time Approach Addressing Scalability Anomalies in Complex Data Evaluating Anomaly Detection Methods Applications Problem solutionsNetwork Topology Network Anomalies Detection Problem Network Anomalies Detection Problem Why care about OD Flows
Why care about OD Flows
Volume anomaly typically arises on an OD flow (trafficarriving at one node and destined for another node)
If we only monitor traffic on network links volume arisingfrom an OD flow may not be noticeable Thus naiveapproach wont work if OD flow info is not available
Figure source [22]
Chawla and Chandola Anomaly Detection
Introduction Data Mining Methods Density-based anomaly Commute Time Approach Addressing Scalability Anomalies in Complex Data Evaluating Anomaly Detection Methods Applications Problem solutionsPCA and Subspace Method Subspace Method Algorithm Subspace Analysis Results Discussion Typical Characteristics of Anomaly Limitation of Volume Entropy Based versus Volume Based Fraud Detection Epidemeology Anomaly Detection in Climate and Weather Anomalies in Climate Validation of Anomalies
PCA and Subspace Method
Chawla and Chandola Anomaly Detection
Introduction Data Mining Methods Density-based anomaly Commute Time Approach Addressing Scalability Anomalies in Complex Data Evaluating Anomaly Detection Methods Applications Problem solutionsPCA and Subspace Method Subspace Method Algorithm Subspace Analysis Results Discussion Typical Characteristics of Anomaly Limitation of Volume Entropy Based versus Volume Based Fraud Detection Epidemeology Anomaly Detection in Climate and Weather Anomalies in Climate Validation of Anomalies
Subspace Method Algorithm
Step1- Determine the PCs based on eigenvaluedecomposition of the covariance matrix of the dataset
Step2- Choose first top k principle components with thehighest eigenvalues as matrix P
Step3-normal traffic subspace called Z
Z = PP TZ = CZ
Step4-abnormal traffic subspace called Z
Z = (I minus PP T )Z = CZ
Step5-If the norm of a vector is large then it is an rdquoanomalyrdquo
Chawla and Chandola Anomaly Detection
Introduction Data Mining Methods Density-based anomaly Commute Time Approach Addressing Scalability Anomalies in Complex Data Evaluating Anomaly Detection Methods Applications Problem solutionsPCA and Subspace Method Subspace Method Algorithm Subspace Analysis Results Discussion Typical Characteristics of Anomaly Limitation of Volume Entropy Based versus Volume Based Fraud Detection Epidemeology Anomaly Detection in Climate and Weather Anomalies in Climate Validation of Anomalies
Subspace Analysis Results
Note that during anomaly normal component does not changethat much while residual component changes quite a lot
Thus anomalies can be detected by setting some threshold
Figure source [22]
Chawla and Chandola Anomaly Detection
Introduction Data Mining Methods Density-based anomaly Commute Time Approach Addressing Scalability Anomalies in Complex Data Evaluating Anomaly Detection Methods Applications Problem solutionsPCA and Subspace Method Subspace Method Algorithm Subspace Analysis Results Discussion Typical Characteristics of Anomaly Limitation of Volume Entropy Based versus Volume Based Fraud Detection Epidemeology Anomaly Detection in Climate and Weather Anomalies in Climate Validation of Anomalies
Discussion Typical Characteristics of Anomaly
Most Anomalies induce a change in distributionalaspects of packet header fields (called features)
Most important features include 5-tuple Source ampdestination IP addresses Source and destination portnumbers and IP protocol
raquo DOS attack ndash multiple source IP address concentrated on asingle destination IP address
raquo Network scan ndash dispersed distribution of destination addresses
raquo Most wormsviruses also induce some change in distribution ofcertain features
raquo However these changes can be very subtle and mining them islike searching for needles in a haystack
Unlike many previous approach this paper aims todetect events which disturb the distribution of trafficfeatures rather than traffic volume
Chawla and Chandola Anomaly Detection
Introduction Data Mining Methods Density-based anomaly Commute Time Approach Addressing Scalability Anomalies in Complex Data Evaluating Anomaly Detection Methods Applications Problem solutionsPCA and Subspace Method Subspace Method Algorithm Subspace Analysis Results Discussion Typical Characteristics of Anomaly Limitation of Volume Entropy Based versus Volume Based Fraud Detection Epidemeology Anomaly Detection in Climate and Weather Anomalies in Climate Validation of Anomalies
Limitation of Volume
Figure source [22]
Port scan anomaly (traffic feature changes however traffic volume
remains more or less the same)
We can use entropy tocapture the variationsin the traffic feature
bullTakes value 0 when distribution is maximally concentratedbullTakes value log2N when distribution is maximally dispersed
But stands out in
feature entropy
which also reveals
its structure
Port scan
dwarfed
in volume
metricshellip
Chawla and Chandola Anomaly Detection
Introduction Data Mining Methods Density-based anomaly Commute Time Approach Addressing Scalability Anomalies in Complex Data Evaluating Anomaly Detection Methods Applications Problem solutionsPCA and Subspace Method Subspace Method Algorithm Subspace Analysis Results Discussion Typical Characteristics of Anomaly Limitation of Volume Entropy Based versus Volume Based Fraud Detection Epidemeology Anomaly Detection in Climate and Weather Anomalies in Climate Validation of Anomalies
Entropy Based versus Volume Based
DoSDDoS Attacks- a spike in traffic data toward adominant destination IP
Scan anomaly-a spike in traffic data from a dominant sourceIP
Flash Crowd anomaly- again a spike in traffic data to adominant destination IP
Worm anomaly-a Spike in traffic with a dominant port
Chawla and Chandola Anomaly Detection
Introduction Data Mining Methods Density-based anomaly Commute Time Approach Addressing Scalability Anomalies in Complex Data Evaluating Anomaly Detection Methods Applications Problem solutionsPCA and Subspace Method Subspace Method Algorithm Subspace Analysis Results Discussion Typical Characteristics of Anomaly Limitation of Volume Entropy Based versus Volume Based Fraud Detection Epidemeology Anomaly Detection in Climate and Weather Anomalies in Climate Validation of Anomalies
Fraud Detection
Domain Question Identifyfraudulent activities or players fromobserved transaction data
Data Transactions between different
players in the system Meta information about the
individuals An underlying graph structure
Challenges Track and model human behavior Anomalies caused by adaptive
human adversaries Massive data sizes
Insurance (autohealtha)
ClaimantProvider Payer
Telecommunications Customer
Provider
Credit Cards Customer
Supplier Bank
Web Advertising User Advertiser
Publisher
ahttpwwwcheatingculturecompast-cases-of-medicare-fraud
Chawla and Chandola Anomaly Detection
Introduction Data Mining Methods Density-based anomaly Commute Time Approach Addressing Scalability Anomalies in Complex Data Evaluating Anomaly Detection Methods Applications Problem solutionsPCA and Subspace Method Subspace Method Algorithm Subspace Analysis Results Discussion Typical Characteristics of Anomaly Limitation of Volume Entropy Based versus Volume Based Fraud Detection Epidemeology Anomaly Detection in Climate and Weather Anomalies in Climate Validation of Anomalies
A Generic Fraud Detection Method
Activity Monitoring [13]1 Build profiles for individuals (customers users etc) based on
historic data User X makes n calls on an average in January
2 Compare current behavior with historical profile for significantdeviations
Clustering based [4]1 Cluster historical profiles of customers2 Identify small clusters or outlying profiles as anomalies
Strengths Anomaly detection is fast (good for real time) Results are easy to explain
Weaknesses Need to create and maintain a large number of profiles Not dynamic Adequate historical data might not be available Too many false positives
Chawla and Chandola Anomaly Detection
Introduction Data Mining Methods Density-based anomaly Commute Time Approach Addressing Scalability Anomalies in Complex Data Evaluating Anomaly Detection Methods Applications Problem solutionsPCA and Subspace Method Subspace Method Algorithm Subspace Analysis Results Discussion Typical Characteristics of Anomaly Limitation of Volume Entropy Based versus Volume Based Fraud Detection Epidemeology Anomaly Detection in Climate and Weather Anomalies in Climate Validation of Anomalies
Exploiting Graph Structure - Weighted Graphs
Represent data as a weighted graph Communication networks (phone email SMS) Provider referral networks
Objective Identify anomalous nodes
For each node extract several features based on the propertiesof the induced sub-graph (egonet) of neighboring nodes [1]
Choose features that can highlight anomalous nodes
1 Ni degree of node2 Ei number of edges in egonet3 Wi total weight of egonet4 λi principal eigen vector of weighted adjacency matrix of
egonet
Data is transformed into a point in a multi-dimensional space
Chawla and Chandola Anomaly Detection
Introduction Data Mining Methods Density-based anomaly Commute Time Approach Addressing Scalability Anomalies in Complex Data Evaluating Anomaly Detection Methods Applications Problem solutionsPCA and Subspace Method Subspace Method Algorithm Subspace Analysis Results Discussion Typical Characteristics of Anomaly Limitation of Volume Entropy Based versus Volume Based Fraud Detection Epidemeology Anomaly Detection in Climate and Weather Anomalies in Climate Validation of Anomalies
Identifying Anomalies
Traditional anomaly detection (lof) Can be slow but can identify any type of anomalous structure
Faster method to identify specific types of anomalousstructures
Identify relevant feature pairs and power law relationship
Eg Egonet Density Power Law Ni vs Ei - detect nearcliques and stars
Ei prop Nαi 1 le α le 2
Anomaly score for node i wrt a pair of features (y = Cxθ)
Si =max(yi Cx
θi )
min(yi Cxθi )lowast log (|yi minus Cxθi |+ 1)
Chawla and Chandola Anomaly Detection
Introduction Data Mining Methods Density-based anomaly Commute Time Approach Addressing Scalability Anomalies in Complex Data Evaluating Anomaly Detection Methods Applications Problem solutionsPCA and Subspace Method Subspace Method Algorithm Subspace Analysis Results Discussion Typical Characteristics of Anomaly Limitation of Volume Entropy Based versus Volume Based Fraud Detection Epidemeology Anomaly Detection in Climate and Weather Anomalies in Climate Validation of Anomalies
Exploiting Graph Structure - Bipartite Graphs
Represent data as a bipartite graph Healthcare Data (Beneficiaries vs Providers) Insider trading (Traders vs Stocks)
Objective Identify anomalous links
Given a query node a isin V1 find the ldquorelevancerdquoof all other nodes in V1 to a
RelevanceScore(a b) prop Number of times aldquorandom walkrdquo from a reaches b
Use the relevance scores to compute thenormality scores for a node t isin V2
Find set St = a|〈a t〉 isin E Compute |St| times |St| similarity matrix using
relevance vectors for a isin St Normality Score = mean of non-diagonal entries
of similarity matrix
V1 E V2a1
a2
a3
an
t1
t2
t3
tn
Chawla and Chandola Anomaly Detection
Introduction Data Mining Methods Density-based anomaly Commute Time Approach Addressing Scalability Anomalies in Complex Data Evaluating Anomaly Detection Methods Applications Problem solutionsPCA and Subspace Method Subspace Method Algorithm Subspace Analysis Results Discussion Typical Characteristics of Anomaly Limitation of Volume Entropy Based versus Volume Based Fraud Detection Epidemeology Anomaly Detection in Climate and Weather Anomalies in Climate Validation of Anomalies
Detecting Disease Outbreaks
Domain Question Early detection of disease
outbreaks Anthrax attack
Data Emergency department visits Grocery data (Example [14]) Clinical visits Weatherclimate data
Challenges Weak signals in the data
ED cases involving cough rArrFlu or SARS
Integration of multiple signals(lag analysis)
Account for spatial and temporalcorrelations
Chawla and Chandola Anomaly Detection
Introduction Data Mining Methods Density-based anomaly Commute Time Approach Addressing Scalability Anomalies in Complex Data Evaluating Anomaly Detection Methods Applications Problem solutionsPCA and Subspace Method Subspace Method Algorithm Subspace Analysis Results Discussion Typical Characteristics of Anomaly Limitation of Volume Entropy Based versus Volume Based Fraud Detection Epidemeology Anomaly Detection in Climate and Weather Anomalies in Climate Validation of Anomalies
Whatrsquos Significant About Recent Events (WSARE) [33]
1 Learn Bayesian network from historical data Environmental and response variables
2 Sample from the BN (DBbaseline|Current Environment)3 Compute contingency table for rules for DBbaseline andDBcurrent
Rules are single assignment rules (Xi = Y ji ) or conjunctions4 Find p-value for rules using χ2-test
Null Hypothesis Rows and columns of tables for DBbaselineand DBcurrent are independent
5 Find rule with largest p-value Repeat Step 2
Chawla and Chandola Anomaly Detection
Introduction Data Mining Methods Density-based anomaly Commute Time Approach Addressing Scalability Anomalies in Complex Data Evaluating Anomaly Detection Methods Applications Problem solutionsPCA and Subspace Method Subspace Method Algorithm Subspace Analysis Results Discussion Typical Characteristics of Anomaly Limitation of Volume Entropy Based versus Volume Based Fraud Detection Epidemeology Anomaly Detection in Climate and Weather Anomalies in Climate Validation of Anomalies
Incorporating Spatial and Temporal Relationships
WSARE does not explicitly model the spatial and temporalrelationships
What happened yesterday What happened in the adjoining neighborhood (yesterday)
Bayesian Network Spatio-Temporal (BNST) modelingframework [17]
Add nodes for temporal and spatial dependencies Need more data to train
Chawla and Chandola Anomaly Detection
Introduction Data Mining Methods Density-based anomaly Commute Time Approach Addressing Scalability Anomalies in Complex Data Evaluating Anomaly Detection Methods Applications Problem solutionsPCA and Subspace Method Subspace Method Algorithm Subspace Analysis Results Discussion Typical Characteristics of Anomaly Limitation of Volume Entropy Based versus Volume Based Fraud Detection Epidemeology Anomaly Detection in Climate and Weather Anomalies in Climate Validation of Anomalies
Anomaly Detection in Climate and Weather
Science Questions Identify natural and anthropogenic disasters Identify long time scale events - droughts atmospheric rivers
cold fronts etc
Data Ground observations Remote sensing data (satellites
air-borne) Climate model simulation outputs Multiple variables spatio-temporal (often has height dimension
as well)
Challenges Model spatio-temporal relationships across multiple variables Explain the cause of anomalies Massive data sizes
Climate and weather extreme events are well defined
Key challenge is to find significant events and explain the cause
Chawla and Chandola Anomaly Detection
Introduction Data Mining Methods Density-based anomaly Commute Time Approach Addressing Scalability Anomalies in Complex Data Evaluating Anomaly Detection Methods Applications Problem solutionsPCA and Subspace Method Subspace Method Algorithm Subspace Analysis Results Discussion Typical Characteristics of Anomaly Limitation of Volume Entropy Based versus Volume Based Fraud Detection Epidemeology Anomaly Detection in Climate and Weather Anomalies in Climate Validation of Anomalies
Anomalies are Widely Used in Climate
Most analysis done on ldquoanomalyrdquo time series
Difference from a ldquobase periodrdquo (Toosimplistic)
Brings spatial smoothness (eg a mountaintop and nearby valley can have very differenttemperatures) Removes seasonality
Understand climate and weatherphenomenon
Southern Oscillation Index (SOI) Difference between Sea Level Pressure
(SLP) anomalies for Tahiti and DarwinAustralia
Figure Global AverageTemperature Anomaly(1975 - 2007) Srcwwwmetofficegovuk
Chawla and Chandola Anomaly Detection
Introduction Data Mining Methods Density-based anomaly Commute Time Approach Addressing Scalability Anomalies in Complex Data Evaluating Anomaly Detection Methods Applications Problem solutionsPCA and Subspace Method Subspace Method Algorithm Subspace Analysis Results Discussion Typical Characteristics of Anomaly Limitation of Volume Entropy Based versus Volume Based Fraud Detection Epidemeology Anomaly Detection in Climate and Weather Anomalies in Climate Validation of Anomalies
Constructing Anomalies from Raw Data
Anomaly time series for a given location i
vprimei = vi minus bi
where bi is the base (reference)
How to choose bi Mean of all data for location i Monthly mean values (account for seasonality) Monthly z-score values Median (more robust) Using a shorter ldquoreference periodrdquo
30 year moving window
Different methods show statistically significant differences[19] What is the right strategy Weighted mean of different strategies (Pick weights using
Monte Carlo sampling)
Chawla and Chandola Anomaly Detection
Introduction Data Mining Methods Density-based anomaly Commute Time Approach Addressing Scalability Anomalies in Complex Data Evaluating Anomaly Detection Methods Applications Problem solutionsPCA and Subspace Method Subspace Method Algorithm Subspace Analysis Results Discussion Typical Characteristics of Anomaly Limitation of Volume Entropy Based versus Volume Based Fraud Detection Epidemeology Anomaly Detection in Climate and Weather Anomalies in Climate Validation of Anomalies
Anomaly Detection for Identifying Droughts
Science question Identify significant drought patterns usinghistorical observation data or future simulation data or both
Find persistent spatiotemporal anomalies in precipitation data
A two step approach
1 Find precipitationanomalies usingthresholds
2 Find large connectedcomponents across spaceand time
Matlab - bwlabelbwlabeln
Followup Science questionExplain cause
(drought190120061avi)
Figure Video courtsey Dr ArindamBanerjee
Chawla and Chandola Anomaly Detection
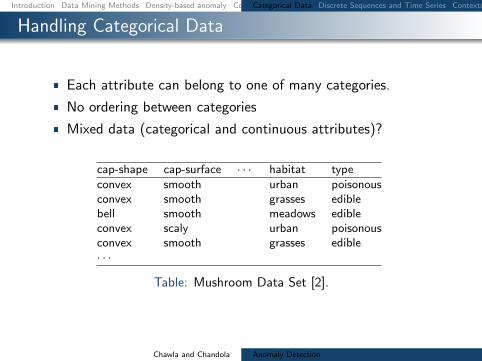
Introduction Data Mining Methods Density-based anomaly Commute Time Approach Addressing Scalability Anomalies in Complex Data Evaluating Anomaly Detection Methods Applications Problem solutionsCategorical Data Discrete Sequences and Time Series Contextual Anomalies Collective Anomalies
Handling Categorical Data
Each attribute can belong to one of many categories
No ordering between categories
Mixed data (categorical and continuous attributes)
cap-shape cap-surface middot middot middot habitat type
convex smooth urban poisonousconvex smooth grasses ediblebell smooth meadows edibleconvex scaly urban poisonousconvex smooth grasses ediblemiddot middot middot
Table Mushroom Data Set [2]
Chawla and Chandola Anomaly Detection
Introduction Data Mining Methods Density-based anomaly Commute Time Approach Addressing Scalability Anomalies in Complex Data Evaluating Anomaly Detection Methods Applications Problem solutionsCategorical Data Discrete Sequences and Time Series Contextual Anomalies Collective Anomalies
Approaches to Identify Categorical Anomalies
Using Association Analysis [24]
Binarize data
Learn rules (X rArr Y ) Choose high confidence
rules (P (Y |X))
For test record Z = 〈XY 〉find rules of the formP (Y |X)
Y is not observed whenX is observed
Using Bayesian Networks [33]
Learn Bayesian networkstructure and parameters
Compute P (Z) for test datarecord Z
Flag anomaly if P (Z) lt δ
Using Similarity Metrics [10]
Use a similarity measure (S(X1 X2))
Apply distancedensityclustering based method (eg lof)
Chawla and Chandola Anomaly Detection
Introduction Data Mining Methods Density-based anomaly Commute Time Approach Addressing Scalability Anomalies in Complex Data Evaluating Anomaly Detection Methods Applications Problem solutionsCategorical Data Discrete Sequences and Time Series Contextual Anomalies Collective Anomalies
Conditional Probability Test [18]
Identify unusual combinations of attribute values
r(at bt) =P (at bt)
P (at)P (bt)
A capB = φ Assumption If r(at bt) is low and is observed in test record t
then t is anomalous For a test record t
For each mutually exclusive pair of attribute sets ABcompute r(at bt)
Score t based on all r-values Assign minimum r-value as score Take product of all r-values
Need to compare exponential pairs of subsets Only consider subsets upto size k Ignore subsets with frequency less than a threshold α Avoid comparing independent subsets of attributes
micro(AB) ge βmicroChawla and Chandola Anomaly Detection
Introduction Data Mining Methods Density-based anomaly Commute Time Approach Addressing Scalability Anomalies in Complex Data Evaluating Anomaly Detection Methods Applications Problem solutionsCategorical Data Discrete Sequences and Time Series Contextual Anomalies Collective Anomalies
Estimating Probabilities for CPT [18]
Maximum LikelihoodEstimation
P (at bt)
P (at)P (bt)=C(at bt)
Ntimes N
C(at)times N
C(bt)
C(at) Number of traininginstances with A = at
N Total number of traininginstances
Laplace Smoothing
E(p) =C(p) + 1
N + 2
r(at bt) =E(at bt)
E(at)times E(bt)
Speedup Tricks
Replace rare attributevalues with genericattribute (reduce arity)
Use efficient datastructure to querying forcounts(AD Trees [26])
ADTrees work fasterfor low arity attributes
Chawla and Chandola Anomaly Detection
Introduction Data Mining Methods Density-based anomaly Commute Time Approach Addressing Scalability Anomalies in Complex Data Evaluating Anomaly Detection Methods Applications Problem solutionsCategorical Data Discrete Sequences and Time Series Contextual Anomalies Collective Anomalies
Finding Anomalies in Discrete Sequences
Many problem formulations
1 Anomalous symbols in asequence
2 Anomalous subsequence in asequence
3 Anomalous sequence in adatabase of sequences
See [11] for a comparativeevaluation [9] for a survey
login pwdmail ssh mail web logoutlogin pwdmail web web web web logoutlogin pwdmail ssh mail web web logoutlogin pwdwebmail ssh webmail logoutloginpwd loginpwd loginpwd logout
Chawla and Chandola Anomaly Detection
Introduction Data Mining Methods Density-based anomaly Commute Time Approach Addressing Scalability Anomalies in Complex Data Evaluating Anomaly Detection Methods Applications Problem solutionsCategorical Data Discrete Sequences and Time Series Contextual Anomalies Collective Anomalies
Treating Sequences as Points
Utilize a distancesimilarity measure Plug into a distancedensityclustering based method
Simplest Hamming Distance
h(Ai Bi) = 1 Ai 6= Bi= 0 Ai = Bi
H(AB) =nsumi=1
h(Ai Bi)
Issues Unequal lengths misalignment Normalized Length of Longest Common Subsequence
D(AB) = 1minus |LCS(AB)|radic|A||B|
Standard Dynamic Programming method is slow Faster versions available (Hunt Szymnaski method [7])
Weaknesses Cannot localize anomalies within a sequence Weak anomaly signals might get lost
Chawla and Chandola Anomaly Detection
Introduction Data Mining Methods Density-based anomaly Commute Time Approach Addressing Scalability Anomalies in Complex Data Evaluating Anomaly Detection Methods Applications Problem solutionsCategorical Data Discrete Sequences and Time Series Contextual Anomalies Collective Anomalies
Using Sliding Windows
Slide a window of size k
Extract all windows from a sequence (nminus k + 1)
Training (Creating a normal dictionary) Store all uniquewindows in all normal sequences and their counts
Testing For each window find the frequency in normal dictionary Anomaly score is inverse of the aggregate frequencies for all
windows (normalized by length)
Many variants exist For each window find the hamming distance to the closest
window in the normal dictionary [16]
Issues Penalizes low frequency windows in the normal dictionary Rewards high frequency windows that might not be relevant Can construct anomalous sequences that will escape detection
Chawla and Chandola Anomaly Detection
Introduction Data Mining Methods Density-based anomaly Commute Time Approach Addressing Scalability Anomalies in Complex Data Evaluating Anomaly Detection Methods Applications Problem solutionsCategorical Data Discrete Sequences and Time Series Contextual Anomalies Collective Anomalies
Using Probabilistic Models
Probability of occurrence of sequence S
P (S) =nprodi=1
P (Si|S1 Siminus1)
Short memory property of sequences
P (Si|S1 Siminus1) = P (Si|Siminusk Siminus1)
Conditional probability estimates for a symbol Si
P (Si|Siminusk Siminus1) =f(Si|Siminusk Si)f(Si|Siminusk Siminus1)
f is estimated from the normal dictionary
Anomaly score for a test sequence is inverse of the normalizedprobability of occurrence
Issues What if the suffix occurs very infrequently in thenormal data (or not at all)
Replace with the longest suffix that occurs sufficient number oftimes [32] - Probabilistic Suffix Trees
Significantly reduces the size of the modelChawla and Chandola Anomaly Detection
Introduction Data Mining Methods Density-based anomaly Commute Time Approach Addressing Scalability Anomalies in Complex Data Evaluating Anomaly Detection Methods Applications Problem solutionsCategorical Data Discrete Sequences and Time Series Contextual Anomalies Collective Anomalies
Finding Contextual Anomalies
Sometimes contextual information isavailable about data
Not used directly as a feature Are well understood no anomalies in
the context Can reduce false positives and yield
interesting anomalies
Example adapted from [30]
Clearest Outlier
Conditional Anomaly
Maximum Daily Temperature
Number
ofFever
Cases
Contextual anomalies - Anomalous with respect to a context Context is defined using environmental variables
Spatial (Latitude Longitude) Graph context (Edges Weights) Temporal location Domain specific (Demographic other)
How to incorporate context Reduce to traditional anomaly detection (subset on context) Explicitly model contextual information (time series spatial)
Chawla and Chandola Anomaly Detection
Introduction Data Mining Methods Density-based anomaly Commute Time Approach Addressing Scalability Anomalies in Complex Data Evaluating Anomaly Detection Methods Applications Problem solutionsCategorical Data Discrete Sequences and Time Series Contextual Anomalies Collective Anomalies
Conditional Anomaly Detection
Data instance d rArru1 u2 udU v1 v2 vdV
dU environmentalattributes
dV indicator attributes u1
u2
U1
U2
U3
v1
v2
V1V2
V3
p(V1|U3) = 02
p(V2|U3) = 02
p(V3|U3) = 06
Algorithm [30]
1 Learn a Gaussian Mixture Model (GMM)U = U1 U2 UnU
each with dimensionality dU2 Learn a set of Gaussians U = V1 V2 VnV
each withdimensionality dV
3 Learn a probabilistic mapping function p(Vj |Ui)4 Score a test instance d = [uv]
S =
nUsumi=1
p(u|Ui)nVsumj=1
p(v|Vj)p(Vj |Ui)
Chawla and Chandola Anomaly Detection
Introduction Data Mining Methods Density-based anomaly Commute Time Approach Addressing Scalability Anomalies in Complex Data Evaluating Anomaly Detection Methods Applications Problem solutionsCategorical Data Discrete Sequences and Time Series Contextual Anomalies Collective Anomalies
Finding Collective Anomalies
Find a collection of data points
Each point by itself is normal
The collection as a whole isanomalous
Relevant when data has inherentstructure and
When domain definition ofanomalies cannot be described aspoint anomalies
A Simple Solution
1 Break data intogroups
2 Compute features foreach group
3 Apply traditionalanomaly detection
Examples
1 Time series
2 Image
3 Spatial clusters ofgalaxies
Chawla and Chandola Anomaly Detection
Introduction Data Mining Methods Density-based anomaly Commute Time Approach Addressing Scalability Anomalies in Complex Data Evaluating Anomaly Detection Methods Applications Problem solutionsCategorical Data Discrete Sequences and Time Series Contextual Anomalies Collective Anomalies
Using Latent Dirichlet Allocation for Group Anomalies
Find anomalous groups in data [34]
Example Spatial clusters of galaxies topics red green emissive words continuous features
Flexible Genre Model (FGM)
For each group
1 Draw a genre 1 2 T 3 ym simM(π)2 Draw topic distribution forym SK 3 θm sim Dir(αym)
3 Draw K topicsβmk sim P (βmk|ηk)k=12K
4 For each point in group
1 Draw topic membershipzmn simM(θn)
2 Generate pointxmn isin P (xmn|βmzmn)
α
zmn
xmn
N
θm
T
π
ηK
ym
β
MK
Model Parameters
M(π) -Multinomial
Genre - Dir(αt)
Topic generatorsP (|ηk)- GIW
Point generatorsP (xmn|βnk) -MultivariateGaussian
Chawla and Chandola Anomaly Detection
Introduction Data Mining Methods Density-based anomaly Commute Time Approach Addressing Scalability Anomalies in Complex Data Evaluating Anomaly Detection Methods Applications Problem solutionsCategorical Data Discrete Sequences and Time Series Contextual Anomalies Collective Anomalies
Inference and Testing for FGM
Inference and Learning Parameters
Approximate inference of latentvariables (Gibbs Sampling)
Use samples to learn parameters(Single step Monte Carlo EM)
Topic 1
Topic 2
Topic 3
Anomaly Detection
Infer the topic distribution θm
Compute negative log likelihood wrt αt
Rationale An anomalous group will be unlikely to begenerated from any genre
Geometric interpretation Mapping each group into a Tdimensional space and finding anomalies
Chawla and Chandola Anomaly Detection
Introduction Data Mining Methods Density-based anomaly Commute Time Approach Addressing Scalability Anomalies in Complex Data Evaluating Anomaly Detection Methods Applications Problem solutions
Evaluating Anomaly Detection Methods - Labels
Labeled validation data set exists Confusion matrix Traditional evaluation metrics
Class imbalance
ROC Curve
Validation set does not exist Use domain expertise to find TP
and FP FN is harder to estimate
Pseudo false negativeestimation techniques [25]
Predicteda n
Actuala TP FNn FP TN
Acc =TP + TNsum
Rec (R) =TP
TP + FN
Prec (P ) =TP
TP + FP
F =2 lowastR lowast PR+ P
Chawla and Chandola Anomaly Detection
Introduction Data Mining Methods Density-based anomaly Commute Time Approach Addressing Scalability Anomalies in Complex Data Evaluating Anomaly Detection Methods Applications Problem solutions
Evaluating Anomaly Detection Methods - Scores
Convert to binary output Use threshold δ on score (Scale
issues [21]) Take top x as anomalies
ROC curve by varying x or δ
Quality of output Does the output ldquosuggestrdquo x or δ Which output is better
Chawla and Chandola Anomaly Detection
Introduction Data Mining Methods Density-based anomaly Commute Time Approach Addressing Scalability Anomalies in Complex Data Evaluating Anomaly Detection Methods Applications Problem solutions
Unifying Scores
Different methods assign scores in differentranges
kNN-based scores [0 1] Lof scores [1 6] ABOD scores [0 80000]
Anomalies have lower scores
Direct scaling to [0 1] might lose distinctionbetween normal and anomalies
Desired scaling Stretch interesting rangesand shrink irrelevant ones
Generalized Procedure for Normalizing Outlier Scores [21] Regularity rArr S(o) ge 0forallo S(o) asymp 0 if o is normal andS(o) 0 if o is anomalous
Normality S is regular and S(o) isin [0 1]forallo
Chawla and Chandola Anomaly Detection
Introduction Data Mining Methods Density-based anomaly Commute Time Approach Addressing Scalability Anomalies in Complex Data Evaluating Anomaly Detection Methods Applications Problem solutions
Regularization and Normalization of Scores
Regularization
1 R(o) = max0 S(o)minus baseS2 R(o) = Smax minus S(o)
3 R(o) = minus log SmaxS(o)
Normalization
1 N(o) = S(o)Smax
2 N(o) = max(
0 erf(S(o)minusmicroSσS radic2
))(Gaussian Scaling)
Suited for high dimensional data
3 N(o) = max(
0cdfγS (o)minusmicroγ
1minusmicroγ
)(Gamma Scaling)
Where cdfγS (o) = P (k S(o) θ) P is the regularized Gamma function Suited for low dimensional data
Chawla and Chandola Anomaly Detection
Introduction Data Mining Methods Density-based anomaly Commute Time Approach Addressing Scalability Anomalies in Complex Data Evaluating Anomaly Detection Methods Applications Problem solutions
Generating Labeled Data for Validation
Generating Both Normal and Anomalous Data
Use generative models for normal and anomalous behavior
Several generators available Multivariate continuous data [27] Multivariate categorical data [5] Discrete sequences using HMM [12]
Drawbacks Might not capture the domain characteristics
Injecting Anomalies - Random Perturbation[30]
Given data point z = xy x and y arepartitions of feature space
Take a random sample D of the entire data set
Let zprime = xprimeyprime isin D such that distancebetween y and yprime is maximum
Replace x with xprime and add z back to data setx
yz
zprime
Injected anomaly
Chawla and Chandola Anomaly Detection
Introduction Data Mining Methods Density-based anomaly Commute Time Approach Addressing Scalability Anomalies in Complex Data Evaluating Anomaly Detection Methods Applications Problem solutionsWhat is Network Anomaly Detection Motivation How Much Serious
Applications Overview
How to set up an anomaly detection solution for agiven application domain
Available data Define anomalies define normal behavior Identify requirements and constraints (online
real-time limited resources) What domain knowledge available
Feature identification Defining normal and anomalous behavior Tuning parameters
Available ground truth (training validation)
Chawla and Chandola Anomaly Detection
Introduction Data Mining Methods Density-based anomaly Commute Time Approach Addressing Scalability Anomalies in Complex Data Evaluating Anomaly Detection Methods Applications Problem solutionsWhat is Network Anomaly Detection Motivation How Much Serious
What is Network Anomaly Detection
Anomaly Detection or Intrusion Detection
Traditional Intrusion Detection Systems (IDS) finding attackscorresponding to predefined pattern data set known as signaturestherefore system is absolutely vulnerable against zero-day attacks
Network Anomaly Detection Systems (NADS) to detectzero-day attacks without any pre-identified signature besides profilenormal behavior of the network and address suspected incidents
Network Anomaly Detection finding unusual and largechanges in the network traffic
Examples intentional attacks (eg Distributed Denial ofService - DDoS) or unusual network traffic (eg flash crowds)
Chawla and Chandola Anomaly Detection
Introduction Data Mining Methods Density-based anomaly Commute Time Approach Addressing Scalability Anomalies in Complex Data Evaluating Anomaly Detection Methods Applications Problem solutionsWhat is Network Anomaly Detection Motivation How Much Serious
Motivation How Much Serious
According to Symantec report released in early 2011 morethan 286 million new threats have been detected in 2010which is a huge number
1656227
2704836
1000000
1500000
2000000
2500000
3000000
20547 18827 69107 113025 140690
624267
1656227
2704836
0
500000
1000000
1500000
2000000
2500000
3000000
2002 2003 2004 2005 2006 2007 2008 July2009-June2010
Chawla and Chandola Anomaly Detection
Introduction Data Mining Methods Density-based anomaly Commute Time Approach Addressing Scalability Anomalies in Complex Data Evaluating Anomaly Detection Methods Applications Problem solutionsNetwork Topology Network Anomalies Detection Problem Network Anomalies Detection Problem Why care about OD Flows
Network Topology
A Typical network
1 y
Router
2
3
41t
x2t
x1t
x3t
x4t
Origin-Destination (OD) flow is the traffic that enters at anorigin node and exits at a destination node of a backbonenetwork x1t x1t
Link measurement is the traffic enters at an node during aninterval y1t
Relationship between link traffic and OD flow traffic iscaptured by the routing matrix A
Chawla and Chandola Anomaly Detection
Introduction Data Mining Methods Density-based anomaly Commute Time Approach Addressing Scalability Anomalies in Complex Data Evaluating Anomaly Detection Methods Applications Problem solutionsNetwork Topology Network Anomalies Detection Problem Network Anomalies Detection Problem Why care about OD Flows
Network Anomalies Detection Problem
Chawla and Chandola Anomaly Detection
Introduction Data Mining Methods Density-based anomaly Commute Time Approach Addressing Scalability Anomalies in Complex Data Evaluating Anomaly Detection Methods Applications Problem solutionsNetwork Topology Network Anomalies Detection Problem Network Anomalies Detection Problem Why care about OD Flows
Network Anomalies Detection Problem
Chawla and Chandola Anomaly Detection
Introduction Data Mining Methods Density-based anomaly Commute Time Approach Addressing Scalability Anomalies in Complex Data Evaluating Anomaly Detection Methods Applications Problem solutionsNetwork Topology Network Anomalies Detection Problem Network Anomalies Detection Problem Why care about OD Flows
Why care about OD Flows
Volume anomaly typically arises on an OD flow (trafficarriving at one node and destined for another node)
If we only monitor traffic on network links volume arisingfrom an OD flow may not be noticeable Thus naiveapproach wont work if OD flow info is not available
Figure source [22]
Chawla and Chandola Anomaly Detection
Introduction Data Mining Methods Density-based anomaly Commute Time Approach Addressing Scalability Anomalies in Complex Data Evaluating Anomaly Detection Methods Applications Problem solutionsPCA and Subspace Method Subspace Method Algorithm Subspace Analysis Results Discussion Typical Characteristics of Anomaly Limitation of Volume Entropy Based versus Volume Based Fraud Detection Epidemeology Anomaly Detection in Climate and Weather Anomalies in Climate Validation of Anomalies
PCA and Subspace Method
Chawla and Chandola Anomaly Detection
Introduction Data Mining Methods Density-based anomaly Commute Time Approach Addressing Scalability Anomalies in Complex Data Evaluating Anomaly Detection Methods Applications Problem solutionsPCA and Subspace Method Subspace Method Algorithm Subspace Analysis Results Discussion Typical Characteristics of Anomaly Limitation of Volume Entropy Based versus Volume Based Fraud Detection Epidemeology Anomaly Detection in Climate and Weather Anomalies in Climate Validation of Anomalies
Subspace Method Algorithm
Step1- Determine the PCs based on eigenvaluedecomposition of the covariance matrix of the dataset
Step2- Choose first top k principle components with thehighest eigenvalues as matrix P
Step3-normal traffic subspace called Z
Z = PP TZ = CZ
Step4-abnormal traffic subspace called Z
Z = (I minus PP T )Z = CZ
Step5-If the norm of a vector is large then it is an rdquoanomalyrdquo
Chawla and Chandola Anomaly Detection
Introduction Data Mining Methods Density-based anomaly Commute Time Approach Addressing Scalability Anomalies in Complex Data Evaluating Anomaly Detection Methods Applications Problem solutionsPCA and Subspace Method Subspace Method Algorithm Subspace Analysis Results Discussion Typical Characteristics of Anomaly Limitation of Volume Entropy Based versus Volume Based Fraud Detection Epidemeology Anomaly Detection in Climate and Weather Anomalies in Climate Validation of Anomalies
Subspace Analysis Results
Note that during anomaly normal component does not changethat much while residual component changes quite a lot
Thus anomalies can be detected by setting some threshold
Figure source [22]
Chawla and Chandola Anomaly Detection
Introduction Data Mining Methods Density-based anomaly Commute Time Approach Addressing Scalability Anomalies in Complex Data Evaluating Anomaly Detection Methods Applications Problem solutionsPCA and Subspace Method Subspace Method Algorithm Subspace Analysis Results Discussion Typical Characteristics of Anomaly Limitation of Volume Entropy Based versus Volume Based Fraud Detection Epidemeology Anomaly Detection in Climate and Weather Anomalies in Climate Validation of Anomalies
Discussion Typical Characteristics of Anomaly
Most Anomalies induce a change in distributionalaspects of packet header fields (called features)
Most important features include 5-tuple Source ampdestination IP addresses Source and destination portnumbers and IP protocol
raquo DOS attack ndash multiple source IP address concentrated on asingle destination IP address
raquo Network scan ndash dispersed distribution of destination addresses
raquo Most wormsviruses also induce some change in distribution ofcertain features
raquo However these changes can be very subtle and mining them islike searching for needles in a haystack
Unlike many previous approach this paper aims todetect events which disturb the distribution of trafficfeatures rather than traffic volume
Chawla and Chandola Anomaly Detection
Introduction Data Mining Methods Density-based anomaly Commute Time Approach Addressing Scalability Anomalies in Complex Data Evaluating Anomaly Detection Methods Applications Problem solutionsPCA and Subspace Method Subspace Method Algorithm Subspace Analysis Results Discussion Typical Characteristics of Anomaly Limitation of Volume Entropy Based versus Volume Based Fraud Detection Epidemeology Anomaly Detection in Climate and Weather Anomalies in Climate Validation of Anomalies
Limitation of Volume
Figure source [22]
Port scan anomaly (traffic feature changes however traffic volume
remains more or less the same)
We can use entropy tocapture the variationsin the traffic feature
bullTakes value 0 when distribution is maximally concentratedbullTakes value log2N when distribution is maximally dispersed
But stands out in
feature entropy
which also reveals
its structure
Port scan
dwarfed
in volume
metricshellip
Chawla and Chandola Anomaly Detection
Introduction Data Mining Methods Density-based anomaly Commute Time Approach Addressing Scalability Anomalies in Complex Data Evaluating Anomaly Detection Methods Applications Problem solutionsPCA and Subspace Method Subspace Method Algorithm Subspace Analysis Results Discussion Typical Characteristics of Anomaly Limitation of Volume Entropy Based versus Volume Based Fraud Detection Epidemeology Anomaly Detection in Climate and Weather Anomalies in Climate Validation of Anomalies
Entropy Based versus Volume Based
DoSDDoS Attacks- a spike in traffic data toward adominant destination IP
Scan anomaly-a spike in traffic data from a dominant sourceIP
Flash Crowd anomaly- again a spike in traffic data to adominant destination IP
Worm anomaly-a Spike in traffic with a dominant port
Chawla and Chandola Anomaly Detection
Introduction Data Mining Methods Density-based anomaly Commute Time Approach Addressing Scalability Anomalies in Complex Data Evaluating Anomaly Detection Methods Applications Problem solutionsPCA and Subspace Method Subspace Method Algorithm Subspace Analysis Results Discussion Typical Characteristics of Anomaly Limitation of Volume Entropy Based versus Volume Based Fraud Detection Epidemeology Anomaly Detection in Climate and Weather Anomalies in Climate Validation of Anomalies
Fraud Detection
Domain Question Identifyfraudulent activities or players fromobserved transaction data
Data Transactions between different
players in the system Meta information about the
individuals An underlying graph structure
Challenges Track and model human behavior Anomalies caused by adaptive
human adversaries Massive data sizes
Insurance (autohealtha)
ClaimantProvider Payer
Telecommunications Customer
Provider
Credit Cards Customer
Supplier Bank
Web Advertising User Advertiser
Publisher
ahttpwwwcheatingculturecompast-cases-of-medicare-fraud
Chawla and Chandola Anomaly Detection
Introduction Data Mining Methods Density-based anomaly Commute Time Approach Addressing Scalability Anomalies in Complex Data Evaluating Anomaly Detection Methods Applications Problem solutionsPCA and Subspace Method Subspace Method Algorithm Subspace Analysis Results Discussion Typical Characteristics of Anomaly Limitation of Volume Entropy Based versus Volume Based Fraud Detection Epidemeology Anomaly Detection in Climate and Weather Anomalies in Climate Validation of Anomalies
A Generic Fraud Detection Method
Activity Monitoring [13]1 Build profiles for individuals (customers users etc) based on
historic data User X makes n calls on an average in January
2 Compare current behavior with historical profile for significantdeviations
Clustering based [4]1 Cluster historical profiles of customers2 Identify small clusters or outlying profiles as anomalies
Strengths Anomaly detection is fast (good for real time) Results are easy to explain
Weaknesses Need to create and maintain a large number of profiles Not dynamic Adequate historical data might not be available Too many false positives
Chawla and Chandola Anomaly Detection
Introduction Data Mining Methods Density-based anomaly Commute Time Approach Addressing Scalability Anomalies in Complex Data Evaluating Anomaly Detection Methods Applications Problem solutionsPCA and Subspace Method Subspace Method Algorithm Subspace Analysis Results Discussion Typical Characteristics of Anomaly Limitation of Volume Entropy Based versus Volume Based Fraud Detection Epidemeology Anomaly Detection in Climate and Weather Anomalies in Climate Validation of Anomalies
Exploiting Graph Structure - Weighted Graphs
Represent data as a weighted graph Communication networks (phone email SMS) Provider referral networks
Objective Identify anomalous nodes
For each node extract several features based on the propertiesof the induced sub-graph (egonet) of neighboring nodes [1]
Choose features that can highlight anomalous nodes
1 Ni degree of node2 Ei number of edges in egonet3 Wi total weight of egonet4 λi principal eigen vector of weighted adjacency matrix of
egonet
Data is transformed into a point in a multi-dimensional space
Chawla and Chandola Anomaly Detection
Introduction Data Mining Methods Density-based anomaly Commute Time Approach Addressing Scalability Anomalies in Complex Data Evaluating Anomaly Detection Methods Applications Problem solutionsPCA and Subspace Method Subspace Method Algorithm Subspace Analysis Results Discussion Typical Characteristics of Anomaly Limitation of Volume Entropy Based versus Volume Based Fraud Detection Epidemeology Anomaly Detection in Climate and Weather Anomalies in Climate Validation of Anomalies
Identifying Anomalies
Traditional anomaly detection (lof) Can be slow but can identify any type of anomalous structure
Faster method to identify specific types of anomalousstructures
Identify relevant feature pairs and power law relationship
Eg Egonet Density Power Law Ni vs Ei - detect nearcliques and stars
Ei prop Nαi 1 le α le 2
Anomaly score for node i wrt a pair of features (y = Cxθ)
Si =max(yi Cx
θi )
min(yi Cxθi )lowast log (|yi minus Cxθi |+ 1)
Chawla and Chandola Anomaly Detection
Introduction Data Mining Methods Density-based anomaly Commute Time Approach Addressing Scalability Anomalies in Complex Data Evaluating Anomaly Detection Methods Applications Problem solutionsPCA and Subspace Method Subspace Method Algorithm Subspace Analysis Results Discussion Typical Characteristics of Anomaly Limitation of Volume Entropy Based versus Volume Based Fraud Detection Epidemeology Anomaly Detection in Climate and Weather Anomalies in Climate Validation of Anomalies
Exploiting Graph Structure - Bipartite Graphs
Represent data as a bipartite graph Healthcare Data (Beneficiaries vs Providers) Insider trading (Traders vs Stocks)
Objective Identify anomalous links
Given a query node a isin V1 find the ldquorelevancerdquoof all other nodes in V1 to a
RelevanceScore(a b) prop Number of times aldquorandom walkrdquo from a reaches b
Use the relevance scores to compute thenormality scores for a node t isin V2
Find set St = a|〈a t〉 isin E Compute |St| times |St| similarity matrix using
relevance vectors for a isin St Normality Score = mean of non-diagonal entries
of similarity matrix
V1 E V2a1
a2
a3
an
t1
t2
t3
tn
Chawla and Chandola Anomaly Detection
Introduction Data Mining Methods Density-based anomaly Commute Time Approach Addressing Scalability Anomalies in Complex Data Evaluating Anomaly Detection Methods Applications Problem solutionsPCA and Subspace Method Subspace Method Algorithm Subspace Analysis Results Discussion Typical Characteristics of Anomaly Limitation of Volume Entropy Based versus Volume Based Fraud Detection Epidemeology Anomaly Detection in Climate and Weather Anomalies in Climate Validation of Anomalies
Detecting Disease Outbreaks
Domain Question Early detection of disease
outbreaks Anthrax attack
Data Emergency department visits Grocery data (Example [14]) Clinical visits Weatherclimate data
Challenges Weak signals in the data
ED cases involving cough rArrFlu or SARS
Integration of multiple signals(lag analysis)
Account for spatial and temporalcorrelations
Chawla and Chandola Anomaly Detection
Introduction Data Mining Methods Density-based anomaly Commute Time Approach Addressing Scalability Anomalies in Complex Data Evaluating Anomaly Detection Methods Applications Problem solutionsPCA and Subspace Method Subspace Method Algorithm Subspace Analysis Results Discussion Typical Characteristics of Anomaly Limitation of Volume Entropy Based versus Volume Based Fraud Detection Epidemeology Anomaly Detection in Climate and Weather Anomalies in Climate Validation of Anomalies
Whatrsquos Significant About Recent Events (WSARE) [33]
1 Learn Bayesian network from historical data Environmental and response variables
2 Sample from the BN (DBbaseline|Current Environment)3 Compute contingency table for rules for DBbaseline andDBcurrent
Rules are single assignment rules (Xi = Y ji ) or conjunctions4 Find p-value for rules using χ2-test
Null Hypothesis Rows and columns of tables for DBbaselineand DBcurrent are independent
5 Find rule with largest p-value Repeat Step 2
Chawla and Chandola Anomaly Detection
Introduction Data Mining Methods Density-based anomaly Commute Time Approach Addressing Scalability Anomalies in Complex Data Evaluating Anomaly Detection Methods Applications Problem solutionsPCA and Subspace Method Subspace Method Algorithm Subspace Analysis Results Discussion Typical Characteristics of Anomaly Limitation of Volume Entropy Based versus Volume Based Fraud Detection Epidemeology Anomaly Detection in Climate and Weather Anomalies in Climate Validation of Anomalies
Incorporating Spatial and Temporal Relationships
WSARE does not explicitly model the spatial and temporalrelationships
What happened yesterday What happened in the adjoining neighborhood (yesterday)
Bayesian Network Spatio-Temporal (BNST) modelingframework [17]
Add nodes for temporal and spatial dependencies Need more data to train
Chawla and Chandola Anomaly Detection
Introduction Data Mining Methods Density-based anomaly Commute Time Approach Addressing Scalability Anomalies in Complex Data Evaluating Anomaly Detection Methods Applications Problem solutionsPCA and Subspace Method Subspace Method Algorithm Subspace Analysis Results Discussion Typical Characteristics of Anomaly Limitation of Volume Entropy Based versus Volume Based Fraud Detection Epidemeology Anomaly Detection in Climate and Weather Anomalies in Climate Validation of Anomalies
Anomaly Detection in Climate and Weather
Science Questions Identify natural and anthropogenic disasters Identify long time scale events - droughts atmospheric rivers
cold fronts etc
Data Ground observations Remote sensing data (satellites
air-borne) Climate model simulation outputs Multiple variables spatio-temporal (often has height dimension
as well)
Challenges Model spatio-temporal relationships across multiple variables Explain the cause of anomalies Massive data sizes
Climate and weather extreme events are well defined
Key challenge is to find significant events and explain the cause
Chawla and Chandola Anomaly Detection
Introduction Data Mining Methods Density-based anomaly Commute Time Approach Addressing Scalability Anomalies in Complex Data Evaluating Anomaly Detection Methods Applications Problem solutionsPCA and Subspace Method Subspace Method Algorithm Subspace Analysis Results Discussion Typical Characteristics of Anomaly Limitation of Volume Entropy Based versus Volume Based Fraud Detection Epidemeology Anomaly Detection in Climate and Weather Anomalies in Climate Validation of Anomalies
Anomalies are Widely Used in Climate
Most analysis done on ldquoanomalyrdquo time series
Difference from a ldquobase periodrdquo (Toosimplistic)
Brings spatial smoothness (eg a mountaintop and nearby valley can have very differenttemperatures) Removes seasonality
Understand climate and weatherphenomenon
Southern Oscillation Index (SOI) Difference between Sea Level Pressure
(SLP) anomalies for Tahiti and DarwinAustralia
Figure Global AverageTemperature Anomaly(1975 - 2007) Srcwwwmetofficegovuk
Chawla and Chandola Anomaly Detection
Introduction Data Mining Methods Density-based anomaly Commute Time Approach Addressing Scalability Anomalies in Complex Data Evaluating Anomaly Detection Methods Applications Problem solutionsPCA and Subspace Method Subspace Method Algorithm Subspace Analysis Results Discussion Typical Characteristics of Anomaly Limitation of Volume Entropy Based versus Volume Based Fraud Detection Epidemeology Anomaly Detection in Climate and Weather Anomalies in Climate Validation of Anomalies
Constructing Anomalies from Raw Data
Anomaly time series for a given location i
vprimei = vi minus bi
where bi is the base (reference)
How to choose bi Mean of all data for location i Monthly mean values (account for seasonality) Monthly z-score values Median (more robust) Using a shorter ldquoreference periodrdquo
30 year moving window
Different methods show statistically significant differences[19] What is the right strategy Weighted mean of different strategies (Pick weights using
Monte Carlo sampling)
Chawla and Chandola Anomaly Detection
Introduction Data Mining Methods Density-based anomaly Commute Time Approach Addressing Scalability Anomalies in Complex Data Evaluating Anomaly Detection Methods Applications Problem solutionsPCA and Subspace Method Subspace Method Algorithm Subspace Analysis Results Discussion Typical Characteristics of Anomaly Limitation of Volume Entropy Based versus Volume Based Fraud Detection Epidemeology Anomaly Detection in Climate and Weather Anomalies in Climate Validation of Anomalies
Anomaly Detection for Identifying Droughts
Science question Identify significant drought patterns usinghistorical observation data or future simulation data or both
Find persistent spatiotemporal anomalies in precipitation data
A two step approach
1 Find precipitationanomalies usingthresholds
2 Find large connectedcomponents across spaceand time
Matlab - bwlabelbwlabeln
Followup Science questionExplain cause
(drought190120061avi)
Figure Video courtsey Dr ArindamBanerjee
Chawla and Chandola Anomaly Detection
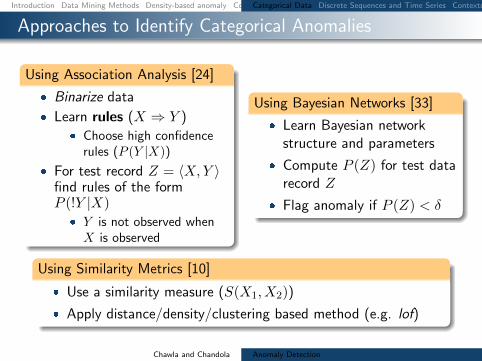
Introduction Data Mining Methods Density-based anomaly Commute Time Approach Addressing Scalability Anomalies in Complex Data Evaluating Anomaly Detection Methods Applications Problem solutionsCategorical Data Discrete Sequences and Time Series Contextual Anomalies Collective Anomalies
Approaches to Identify Categorical Anomalies
Using Association Analysis [24]
Binarize data
Learn rules (X rArr Y ) Choose high confidence
rules (P (Y |X))
For test record Z = 〈XY 〉find rules of the formP (Y |X)
Y is not observed whenX is observed
Using Bayesian Networks [33]
Learn Bayesian networkstructure and parameters
Compute P (Z) for test datarecord Z
Flag anomaly if P (Z) lt δ
Using Similarity Metrics [10]
Use a similarity measure (S(X1 X2))
Apply distancedensityclustering based method (eg lof)
Chawla and Chandola Anomaly Detection
Introduction Data Mining Methods Density-based anomaly Commute Time Approach Addressing Scalability Anomalies in Complex Data Evaluating Anomaly Detection Methods Applications Problem solutionsCategorical Data Discrete Sequences and Time Series Contextual Anomalies Collective Anomalies
Conditional Probability Test [18]
Identify unusual combinations of attribute values
r(at bt) =P (at bt)
P (at)P (bt)
A capB = φ Assumption If r(at bt) is low and is observed in test record t
then t is anomalous For a test record t
For each mutually exclusive pair of attribute sets ABcompute r(at bt)
Score t based on all r-values Assign minimum r-value as score Take product of all r-values
Need to compare exponential pairs of subsets Only consider subsets upto size k Ignore subsets with frequency less than a threshold α Avoid comparing independent subsets of attributes
micro(AB) ge βmicroChawla and Chandola Anomaly Detection
Introduction Data Mining Methods Density-based anomaly Commute Time Approach Addressing Scalability Anomalies in Complex Data Evaluating Anomaly Detection Methods Applications Problem solutionsCategorical Data Discrete Sequences and Time Series Contextual Anomalies Collective Anomalies
Estimating Probabilities for CPT [18]
Maximum LikelihoodEstimation
P (at bt)
P (at)P (bt)=C(at bt)
Ntimes N
C(at)times N
C(bt)
C(at) Number of traininginstances with A = at
N Total number of traininginstances
Laplace Smoothing
E(p) =C(p) + 1
N + 2
r(at bt) =E(at bt)
E(at)times E(bt)
Speedup Tricks
Replace rare attributevalues with genericattribute (reduce arity)
Use efficient datastructure to querying forcounts(AD Trees [26])
ADTrees work fasterfor low arity attributes
Chawla and Chandola Anomaly Detection
Introduction Data Mining Methods Density-based anomaly Commute Time Approach Addressing Scalability Anomalies in Complex Data Evaluating Anomaly Detection Methods Applications Problem solutionsCategorical Data Discrete Sequences and Time Series Contextual Anomalies Collective Anomalies
Finding Anomalies in Discrete Sequences
Many problem formulations
1 Anomalous symbols in asequence
2 Anomalous subsequence in asequence
3 Anomalous sequence in adatabase of sequences
See [11] for a comparativeevaluation [9] for a survey
login pwdmail ssh mail web logoutlogin pwdmail web web web web logoutlogin pwdmail ssh mail web web logoutlogin pwdwebmail ssh webmail logoutloginpwd loginpwd loginpwd logout
Chawla and Chandola Anomaly Detection
Introduction Data Mining Methods Density-based anomaly Commute Time Approach Addressing Scalability Anomalies in Complex Data Evaluating Anomaly Detection Methods Applications Problem solutionsCategorical Data Discrete Sequences and Time Series Contextual Anomalies Collective Anomalies
Treating Sequences as Points
Utilize a distancesimilarity measure Plug into a distancedensityclustering based method
Simplest Hamming Distance
h(Ai Bi) = 1 Ai 6= Bi= 0 Ai = Bi
H(AB) =nsumi=1
h(Ai Bi)
Issues Unequal lengths misalignment Normalized Length of Longest Common Subsequence
D(AB) = 1minus |LCS(AB)|radic|A||B|
Standard Dynamic Programming method is slow Faster versions available (Hunt Szymnaski method [7])
Weaknesses Cannot localize anomalies within a sequence Weak anomaly signals might get lost
Chawla and Chandola Anomaly Detection
Introduction Data Mining Methods Density-based anomaly Commute Time Approach Addressing Scalability Anomalies in Complex Data Evaluating Anomaly Detection Methods Applications Problem solutionsCategorical Data Discrete Sequences and Time Series Contextual Anomalies Collective Anomalies
Using Sliding Windows
Slide a window of size k
Extract all windows from a sequence (nminus k + 1)
Training (Creating a normal dictionary) Store all uniquewindows in all normal sequences and their counts
Testing For each window find the frequency in normal dictionary Anomaly score is inverse of the aggregate frequencies for all
windows (normalized by length)
Many variants exist For each window find the hamming distance to the closest
window in the normal dictionary [16]
Issues Penalizes low frequency windows in the normal dictionary Rewards high frequency windows that might not be relevant Can construct anomalous sequences that will escape detection
Chawla and Chandola Anomaly Detection
Introduction Data Mining Methods Density-based anomaly Commute Time Approach Addressing Scalability Anomalies in Complex Data Evaluating Anomaly Detection Methods Applications Problem solutionsCategorical Data Discrete Sequences and Time Series Contextual Anomalies Collective Anomalies
Using Probabilistic Models
Probability of occurrence of sequence S
P (S) =nprodi=1
P (Si|S1 Siminus1)
Short memory property of sequences
P (Si|S1 Siminus1) = P (Si|Siminusk Siminus1)
Conditional probability estimates for a symbol Si
P (Si|Siminusk Siminus1) =f(Si|Siminusk Si)f(Si|Siminusk Siminus1)
f is estimated from the normal dictionary
Anomaly score for a test sequence is inverse of the normalizedprobability of occurrence
Issues What if the suffix occurs very infrequently in thenormal data (or not at all)
Replace with the longest suffix that occurs sufficient number oftimes [32] - Probabilistic Suffix Trees
Significantly reduces the size of the modelChawla and Chandola Anomaly Detection
Introduction Data Mining Methods Density-based anomaly Commute Time Approach Addressing Scalability Anomalies in Complex Data Evaluating Anomaly Detection Methods Applications Problem solutionsCategorical Data Discrete Sequences and Time Series Contextual Anomalies Collective Anomalies
Finding Contextual Anomalies
Sometimes contextual information isavailable about data
Not used directly as a feature Are well understood no anomalies in
the context Can reduce false positives and yield
interesting anomalies
Example adapted from [30]
Clearest Outlier
Conditional Anomaly
Maximum Daily Temperature
Number
ofFever
Cases
Contextual anomalies - Anomalous with respect to a context Context is defined using environmental variables
Spatial (Latitude Longitude) Graph context (Edges Weights) Temporal location Domain specific (Demographic other)
How to incorporate context Reduce to traditional anomaly detection (subset on context) Explicitly model contextual information (time series spatial)
Chawla and Chandola Anomaly Detection
Introduction Data Mining Methods Density-based anomaly Commute Time Approach Addressing Scalability Anomalies in Complex Data Evaluating Anomaly Detection Methods Applications Problem solutionsCategorical Data Discrete Sequences and Time Series Contextual Anomalies Collective Anomalies
Conditional Anomaly Detection
Data instance d rArru1 u2 udU v1 v2 vdV
dU environmentalattributes
dV indicator attributes u1
u2
U1
U2
U3
v1
v2
V1V2
V3
p(V1|U3) = 02
p(V2|U3) = 02
p(V3|U3) = 06
Algorithm [30]
1 Learn a Gaussian Mixture Model (GMM)U = U1 U2 UnU
each with dimensionality dU2 Learn a set of Gaussians U = V1 V2 VnV
each withdimensionality dV
3 Learn a probabilistic mapping function p(Vj |Ui)4 Score a test instance d = [uv]
S =
nUsumi=1
p(u|Ui)nVsumj=1
p(v|Vj)p(Vj |Ui)
Chawla and Chandola Anomaly Detection
Introduction Data Mining Methods Density-based anomaly Commute Time Approach Addressing Scalability Anomalies in Complex Data Evaluating Anomaly Detection Methods Applications Problem solutionsCategorical Data Discrete Sequences and Time Series Contextual Anomalies Collective Anomalies
Finding Collective Anomalies
Find a collection of data points
Each point by itself is normal
The collection as a whole isanomalous
Relevant when data has inherentstructure and
When domain definition ofanomalies cannot be described aspoint anomalies
A Simple Solution
1 Break data intogroups
2 Compute features foreach group
3 Apply traditionalanomaly detection
Examples
1 Time series
2 Image
3 Spatial clusters ofgalaxies
Chawla and Chandola Anomaly Detection
Introduction Data Mining Methods Density-based anomaly Commute Time Approach Addressing Scalability Anomalies in Complex Data Evaluating Anomaly Detection Methods Applications Problem solutionsCategorical Data Discrete Sequences and Time Series Contextual Anomalies Collective Anomalies
Using Latent Dirichlet Allocation for Group Anomalies
Find anomalous groups in data [34]
Example Spatial clusters of galaxies topics red green emissive words continuous features
Flexible Genre Model (FGM)
For each group
1 Draw a genre 1 2 T 3 ym simM(π)2 Draw topic distribution forym SK 3 θm sim Dir(αym)
3 Draw K topicsβmk sim P (βmk|ηk)k=12K
4 For each point in group
1 Draw topic membershipzmn simM(θn)
2 Generate pointxmn isin P (xmn|βmzmn)
α
zmn
xmn
N
θm
T
π
ηK
ym
β
MK
Model Parameters
M(π) -Multinomial
Genre - Dir(αt)
Topic generatorsP (|ηk)- GIW
Point generatorsP (xmn|βnk) -MultivariateGaussian
Chawla and Chandola Anomaly Detection
Introduction Data Mining Methods Density-based anomaly Commute Time Approach Addressing Scalability Anomalies in Complex Data Evaluating Anomaly Detection Methods Applications Problem solutionsCategorical Data Discrete Sequences and Time Series Contextual Anomalies Collective Anomalies
Inference and Testing for FGM
Inference and Learning Parameters
Approximate inference of latentvariables (Gibbs Sampling)
Use samples to learn parameters(Single step Monte Carlo EM)
Topic 1
Topic 2
Topic 3
Anomaly Detection
Infer the topic distribution θm
Compute negative log likelihood wrt αt
Rationale An anomalous group will be unlikely to begenerated from any genre
Geometric interpretation Mapping each group into a Tdimensional space and finding anomalies
Chawla and Chandola Anomaly Detection
Introduction Data Mining Methods Density-based anomaly Commute Time Approach Addressing Scalability Anomalies in Complex Data Evaluating Anomaly Detection Methods Applications Problem solutions
Evaluating Anomaly Detection Methods - Labels
Labeled validation data set exists Confusion matrix Traditional evaluation metrics
Class imbalance
ROC Curve
Validation set does not exist Use domain expertise to find TP
and FP FN is harder to estimate
Pseudo false negativeestimation techniques [25]
Predicteda n
Actuala TP FNn FP TN
Acc =TP + TNsum
Rec (R) =TP
TP + FN
Prec (P ) =TP
TP + FP
F =2 lowastR lowast PR+ P
Chawla and Chandola Anomaly Detection
Introduction Data Mining Methods Density-based anomaly Commute Time Approach Addressing Scalability Anomalies in Complex Data Evaluating Anomaly Detection Methods Applications Problem solutions
Evaluating Anomaly Detection Methods - Scores
Convert to binary output Use threshold δ on score (Scale
issues [21]) Take top x as anomalies
ROC curve by varying x or δ
Quality of output Does the output ldquosuggestrdquo x or δ Which output is better
Chawla and Chandola Anomaly Detection
Introduction Data Mining Methods Density-based anomaly Commute Time Approach Addressing Scalability Anomalies in Complex Data Evaluating Anomaly Detection Methods Applications Problem solutions
Unifying Scores
Different methods assign scores in differentranges
kNN-based scores [0 1] Lof scores [1 6] ABOD scores [0 80000]
Anomalies have lower scores
Direct scaling to [0 1] might lose distinctionbetween normal and anomalies
Desired scaling Stretch interesting rangesand shrink irrelevant ones
Generalized Procedure for Normalizing Outlier Scores [21] Regularity rArr S(o) ge 0forallo S(o) asymp 0 if o is normal andS(o) 0 if o is anomalous
Normality S is regular and S(o) isin [0 1]forallo
Chawla and Chandola Anomaly Detection
Introduction Data Mining Methods Density-based anomaly Commute Time Approach Addressing Scalability Anomalies in Complex Data Evaluating Anomaly Detection Methods Applications Problem solutions
Regularization and Normalization of Scores
Regularization
1 R(o) = max0 S(o)minus baseS2 R(o) = Smax minus S(o)
3 R(o) = minus log SmaxS(o)
Normalization
1 N(o) = S(o)Smax
2 N(o) = max(
0 erf(S(o)minusmicroSσS radic2
))(Gaussian Scaling)
Suited for high dimensional data
3 N(o) = max(
0cdfγS (o)minusmicroγ
1minusmicroγ
)(Gamma Scaling)
Where cdfγS (o) = P (k S(o) θ) P is the regularized Gamma function Suited for low dimensional data
Chawla and Chandola Anomaly Detection
Introduction Data Mining Methods Density-based anomaly Commute Time Approach Addressing Scalability Anomalies in Complex Data Evaluating Anomaly Detection Methods Applications Problem solutions
Generating Labeled Data for Validation
Generating Both Normal and Anomalous Data
Use generative models for normal and anomalous behavior
Several generators available Multivariate continuous data [27] Multivariate categorical data [5] Discrete sequences using HMM [12]
Drawbacks Might not capture the domain characteristics
Injecting Anomalies - Random Perturbation[30]
Given data point z = xy x and y arepartitions of feature space
Take a random sample D of the entire data set
Let zprime = xprimeyprime isin D such that distancebetween y and yprime is maximum
Replace x with xprime and add z back to data setx
yz
zprime
Injected anomaly
Chawla and Chandola Anomaly Detection
Introduction Data Mining Methods Density-based anomaly Commute Time Approach Addressing Scalability Anomalies in Complex Data Evaluating Anomaly Detection Methods Applications Problem solutionsWhat is Network Anomaly Detection Motivation How Much Serious
Applications Overview
How to set up an anomaly detection solution for agiven application domain
Available data Define anomalies define normal behavior Identify requirements and constraints (online
real-time limited resources) What domain knowledge available
Feature identification Defining normal and anomalous behavior Tuning parameters
Available ground truth (training validation)
Chawla and Chandola Anomaly Detection
Introduction Data Mining Methods Density-based anomaly Commute Time Approach Addressing Scalability Anomalies in Complex Data Evaluating Anomaly Detection Methods Applications Problem solutionsWhat is Network Anomaly Detection Motivation How Much Serious
What is Network Anomaly Detection
Anomaly Detection or Intrusion Detection
Traditional Intrusion Detection Systems (IDS) finding attackscorresponding to predefined pattern data set known as signaturestherefore system is absolutely vulnerable against zero-day attacks
Network Anomaly Detection Systems (NADS) to detectzero-day attacks without any pre-identified signature besides profilenormal behavior of the network and address suspected incidents
Network Anomaly Detection finding unusual and largechanges in the network traffic
Examples intentional attacks (eg Distributed Denial ofService - DDoS) or unusual network traffic (eg flash crowds)
Chawla and Chandola Anomaly Detection
Introduction Data Mining Methods Density-based anomaly Commute Time Approach Addressing Scalability Anomalies in Complex Data Evaluating Anomaly Detection Methods Applications Problem solutionsWhat is Network Anomaly Detection Motivation How Much Serious
Motivation How Much Serious
According to Symantec report released in early 2011 morethan 286 million new threats have been detected in 2010which is a huge number
1656227
2704836
1000000
1500000
2000000
2500000
3000000
20547 18827 69107 113025 140690
624267
1656227
2704836
0
500000
1000000
1500000
2000000
2500000
3000000
2002 2003 2004 2005 2006 2007 2008 July2009-June2010
Chawla and Chandola Anomaly Detection
Introduction Data Mining Methods Density-based anomaly Commute Time Approach Addressing Scalability Anomalies in Complex Data Evaluating Anomaly Detection Methods Applications Problem solutionsNetwork Topology Network Anomalies Detection Problem Network Anomalies Detection Problem Why care about OD Flows
Network Topology
A Typical network
1 y
Router
2
3
41t
x2t
x1t
x3t
x4t
Origin-Destination (OD) flow is the traffic that enters at anorigin node and exits at a destination node of a backbonenetwork x1t x1t
Link measurement is the traffic enters at an node during aninterval y1t
Relationship between link traffic and OD flow traffic iscaptured by the routing matrix A
Chawla and Chandola Anomaly Detection
Introduction Data Mining Methods Density-based anomaly Commute Time Approach Addressing Scalability Anomalies in Complex Data Evaluating Anomaly Detection Methods Applications Problem solutionsNetwork Topology Network Anomalies Detection Problem Network Anomalies Detection Problem Why care about OD Flows
Network Anomalies Detection Problem
Chawla and Chandola Anomaly Detection
Introduction Data Mining Methods Density-based anomaly Commute Time Approach Addressing Scalability Anomalies in Complex Data Evaluating Anomaly Detection Methods Applications Problem solutionsNetwork Topology Network Anomalies Detection Problem Network Anomalies Detection Problem Why care about OD Flows
Network Anomalies Detection Problem
Chawla and Chandola Anomaly Detection
Introduction Data Mining Methods Density-based anomaly Commute Time Approach Addressing Scalability Anomalies in Complex Data Evaluating Anomaly Detection Methods Applications Problem solutionsNetwork Topology Network Anomalies Detection Problem Network Anomalies Detection Problem Why care about OD Flows
Why care about OD Flows
Volume anomaly typically arises on an OD flow (trafficarriving at one node and destined for another node)
If we only monitor traffic on network links volume arisingfrom an OD flow may not be noticeable Thus naiveapproach wont work if OD flow info is not available
Figure source [22]
Chawla and Chandola Anomaly Detection
Introduction Data Mining Methods Density-based anomaly Commute Time Approach Addressing Scalability Anomalies in Complex Data Evaluating Anomaly Detection Methods Applications Problem solutionsPCA and Subspace Method Subspace Method Algorithm Subspace Analysis Results Discussion Typical Characteristics of Anomaly Limitation of Volume Entropy Based versus Volume Based Fraud Detection Epidemeology Anomaly Detection in Climate and Weather Anomalies in Climate Validation of Anomalies
PCA and Subspace Method
Chawla and Chandola Anomaly Detection
Introduction Data Mining Methods Density-based anomaly Commute Time Approach Addressing Scalability Anomalies in Complex Data Evaluating Anomaly Detection Methods Applications Problem solutionsPCA and Subspace Method Subspace Method Algorithm Subspace Analysis Results Discussion Typical Characteristics of Anomaly Limitation of Volume Entropy Based versus Volume Based Fraud Detection Epidemeology Anomaly Detection in Climate and Weather Anomalies in Climate Validation of Anomalies
Subspace Method Algorithm
Step1- Determine the PCs based on eigenvaluedecomposition of the covariance matrix of the dataset
Step2- Choose first top k principle components with thehighest eigenvalues as matrix P
Step3-normal traffic subspace called Z
Z = PP TZ = CZ
Step4-abnormal traffic subspace called Z
Z = (I minus PP T )Z = CZ
Step5-If the norm of a vector is large then it is an rdquoanomalyrdquo
Chawla and Chandola Anomaly Detection
Introduction Data Mining Methods Density-based anomaly Commute Time Approach Addressing Scalability Anomalies in Complex Data Evaluating Anomaly Detection Methods Applications Problem solutionsPCA and Subspace Method Subspace Method Algorithm Subspace Analysis Results Discussion Typical Characteristics of Anomaly Limitation of Volume Entropy Based versus Volume Based Fraud Detection Epidemeology Anomaly Detection in Climate and Weather Anomalies in Climate Validation of Anomalies
Subspace Analysis Results
Note that during anomaly normal component does not changethat much while residual component changes quite a lot
Thus anomalies can be detected by setting some threshold
Figure source [22]
Chawla and Chandola Anomaly Detection
Introduction Data Mining Methods Density-based anomaly Commute Time Approach Addressing Scalability Anomalies in Complex Data Evaluating Anomaly Detection Methods Applications Problem solutionsPCA and Subspace Method Subspace Method Algorithm Subspace Analysis Results Discussion Typical Characteristics of Anomaly Limitation of Volume Entropy Based versus Volume Based Fraud Detection Epidemeology Anomaly Detection in Climate and Weather Anomalies in Climate Validation of Anomalies
Discussion Typical Characteristics of Anomaly
Most Anomalies induce a change in distributionalaspects of packet header fields (called features)
Most important features include 5-tuple Source ampdestination IP addresses Source and destination portnumbers and IP protocol
raquo DOS attack ndash multiple source IP address concentrated on asingle destination IP address
raquo Network scan ndash dispersed distribution of destination addresses
raquo Most wormsviruses also induce some change in distribution ofcertain features
raquo However these changes can be very subtle and mining them islike searching for needles in a haystack
Unlike many previous approach this paper aims todetect events which disturb the distribution of trafficfeatures rather than traffic volume
Chawla and Chandola Anomaly Detection
Introduction Data Mining Methods Density-based anomaly Commute Time Approach Addressing Scalability Anomalies in Complex Data Evaluating Anomaly Detection Methods Applications Problem solutionsPCA and Subspace Method Subspace Method Algorithm Subspace Analysis Results Discussion Typical Characteristics of Anomaly Limitation of Volume Entropy Based versus Volume Based Fraud Detection Epidemeology Anomaly Detection in Climate and Weather Anomalies in Climate Validation of Anomalies
Limitation of Volume
Figure source [22]
Port scan anomaly (traffic feature changes however traffic volume
remains more or less the same)
We can use entropy tocapture the variationsin the traffic feature
bullTakes value 0 when distribution is maximally concentratedbullTakes value log2N when distribution is maximally dispersed
But stands out in
feature entropy
which also reveals
its structure
Port scan
dwarfed
in volume
metricshellip
Chawla and Chandola Anomaly Detection
Introduction Data Mining Methods Density-based anomaly Commute Time Approach Addressing Scalability Anomalies in Complex Data Evaluating Anomaly Detection Methods Applications Problem solutionsPCA and Subspace Method Subspace Method Algorithm Subspace Analysis Results Discussion Typical Characteristics of Anomaly Limitation of Volume Entropy Based versus Volume Based Fraud Detection Epidemeology Anomaly Detection in Climate and Weather Anomalies in Climate Validation of Anomalies
Entropy Based versus Volume Based
DoSDDoS Attacks- a spike in traffic data toward adominant destination IP
Scan anomaly-a spike in traffic data from a dominant sourceIP
Flash Crowd anomaly- again a spike in traffic data to adominant destination IP
Worm anomaly-a Spike in traffic with a dominant port
Chawla and Chandola Anomaly Detection
Introduction Data Mining Methods Density-based anomaly Commute Time Approach Addressing Scalability Anomalies in Complex Data Evaluating Anomaly Detection Methods Applications Problem solutionsPCA and Subspace Method Subspace Method Algorithm Subspace Analysis Results Discussion Typical Characteristics of Anomaly Limitation of Volume Entropy Based versus Volume Based Fraud Detection Epidemeology Anomaly Detection in Climate and Weather Anomalies in Climate Validation of Anomalies
Fraud Detection
Domain Question Identifyfraudulent activities or players fromobserved transaction data
Data Transactions between different
players in the system Meta information about the
individuals An underlying graph structure
Challenges Track and model human behavior Anomalies caused by adaptive
human adversaries Massive data sizes
Insurance (autohealtha)
ClaimantProvider Payer
Telecommunications Customer
Provider
Credit Cards Customer
Supplier Bank
Web Advertising User Advertiser
Publisher
ahttpwwwcheatingculturecompast-cases-of-medicare-fraud
Chawla and Chandola Anomaly Detection
Introduction Data Mining Methods Density-based anomaly Commute Time Approach Addressing Scalability Anomalies in Complex Data Evaluating Anomaly Detection Methods Applications Problem solutionsPCA and Subspace Method Subspace Method Algorithm Subspace Analysis Results Discussion Typical Characteristics of Anomaly Limitation of Volume Entropy Based versus Volume Based Fraud Detection Epidemeology Anomaly Detection in Climate and Weather Anomalies in Climate Validation of Anomalies
A Generic Fraud Detection Method
Activity Monitoring [13]1 Build profiles for individuals (customers users etc) based on
historic data User X makes n calls on an average in January
2 Compare current behavior with historical profile for significantdeviations
Clustering based [4]1 Cluster historical profiles of customers2 Identify small clusters or outlying profiles as anomalies
Strengths Anomaly detection is fast (good for real time) Results are easy to explain
Weaknesses Need to create and maintain a large number of profiles Not dynamic Adequate historical data might not be available Too many false positives
Chawla and Chandola Anomaly Detection
Introduction Data Mining Methods Density-based anomaly Commute Time Approach Addressing Scalability Anomalies in Complex Data Evaluating Anomaly Detection Methods Applications Problem solutionsPCA and Subspace Method Subspace Method Algorithm Subspace Analysis Results Discussion Typical Characteristics of Anomaly Limitation of Volume Entropy Based versus Volume Based Fraud Detection Epidemeology Anomaly Detection in Climate and Weather Anomalies in Climate Validation of Anomalies
Exploiting Graph Structure - Weighted Graphs
Represent data as a weighted graph Communication networks (phone email SMS) Provider referral networks
Objective Identify anomalous nodes
For each node extract several features based on the propertiesof the induced sub-graph (egonet) of neighboring nodes [1]
Choose features that can highlight anomalous nodes
1 Ni degree of node2 Ei number of edges in egonet3 Wi total weight of egonet4 λi principal eigen vector of weighted adjacency matrix of
egonet
Data is transformed into a point in a multi-dimensional space
Chawla and Chandola Anomaly Detection
Introduction Data Mining Methods Density-based anomaly Commute Time Approach Addressing Scalability Anomalies in Complex Data Evaluating Anomaly Detection Methods Applications Problem solutionsPCA and Subspace Method Subspace Method Algorithm Subspace Analysis Results Discussion Typical Characteristics of Anomaly Limitation of Volume Entropy Based versus Volume Based Fraud Detection Epidemeology Anomaly Detection in Climate and Weather Anomalies in Climate Validation of Anomalies
Identifying Anomalies
Traditional anomaly detection (lof) Can be slow but can identify any type of anomalous structure
Faster method to identify specific types of anomalousstructures
Identify relevant feature pairs and power law relationship
Eg Egonet Density Power Law Ni vs Ei - detect nearcliques and stars
Ei prop Nαi 1 le α le 2
Anomaly score for node i wrt a pair of features (y = Cxθ)
Si =max(yi Cx
θi )
min(yi Cxθi )lowast log (|yi minus Cxθi |+ 1)
Chawla and Chandola Anomaly Detection
Introduction Data Mining Methods Density-based anomaly Commute Time Approach Addressing Scalability Anomalies in Complex Data Evaluating Anomaly Detection Methods Applications Problem solutionsPCA and Subspace Method Subspace Method Algorithm Subspace Analysis Results Discussion Typical Characteristics of Anomaly Limitation of Volume Entropy Based versus Volume Based Fraud Detection Epidemeology Anomaly Detection in Climate and Weather Anomalies in Climate Validation of Anomalies
Exploiting Graph Structure - Bipartite Graphs
Represent data as a bipartite graph Healthcare Data (Beneficiaries vs Providers) Insider trading (Traders vs Stocks)
Objective Identify anomalous links
Given a query node a isin V1 find the ldquorelevancerdquoof all other nodes in V1 to a
RelevanceScore(a b) prop Number of times aldquorandom walkrdquo from a reaches b
Use the relevance scores to compute thenormality scores for a node t isin V2
Find set St = a|〈a t〉 isin E Compute |St| times |St| similarity matrix using
relevance vectors for a isin St Normality Score = mean of non-diagonal entries
of similarity matrix
V1 E V2a1
a2
a3
an
t1
t2
t3
tn
Chawla and Chandola Anomaly Detection
Introduction Data Mining Methods Density-based anomaly Commute Time Approach Addressing Scalability Anomalies in Complex Data Evaluating Anomaly Detection Methods Applications Problem solutionsPCA and Subspace Method Subspace Method Algorithm Subspace Analysis Results Discussion Typical Characteristics of Anomaly Limitation of Volume Entropy Based versus Volume Based Fraud Detection Epidemeology Anomaly Detection in Climate and Weather Anomalies in Climate Validation of Anomalies
Detecting Disease Outbreaks
Domain Question Early detection of disease
outbreaks Anthrax attack
Data Emergency department visits Grocery data (Example [14]) Clinical visits Weatherclimate data
Challenges Weak signals in the data
ED cases involving cough rArrFlu or SARS
Integration of multiple signals(lag analysis)
Account for spatial and temporalcorrelations
Chawla and Chandola Anomaly Detection
Introduction Data Mining Methods Density-based anomaly Commute Time Approach Addressing Scalability Anomalies in Complex Data Evaluating Anomaly Detection Methods Applications Problem solutionsPCA and Subspace Method Subspace Method Algorithm Subspace Analysis Results Discussion Typical Characteristics of Anomaly Limitation of Volume Entropy Based versus Volume Based Fraud Detection Epidemeology Anomaly Detection in Climate and Weather Anomalies in Climate Validation of Anomalies
Whatrsquos Significant About Recent Events (WSARE) [33]
1 Learn Bayesian network from historical data Environmental and response variables
2 Sample from the BN (DBbaseline|Current Environment)3 Compute contingency table for rules for DBbaseline andDBcurrent
Rules are single assignment rules (Xi = Y ji ) or conjunctions4 Find p-value for rules using χ2-test
Null Hypothesis Rows and columns of tables for DBbaselineand DBcurrent are independent
5 Find rule with largest p-value Repeat Step 2
Chawla and Chandola Anomaly Detection
Introduction Data Mining Methods Density-based anomaly Commute Time Approach Addressing Scalability Anomalies in Complex Data Evaluating Anomaly Detection Methods Applications Problem solutionsPCA and Subspace Method Subspace Method Algorithm Subspace Analysis Results Discussion Typical Characteristics of Anomaly Limitation of Volume Entropy Based versus Volume Based Fraud Detection Epidemeology Anomaly Detection in Climate and Weather Anomalies in Climate Validation of Anomalies
Incorporating Spatial and Temporal Relationships
WSARE does not explicitly model the spatial and temporalrelationships
What happened yesterday What happened in the adjoining neighborhood (yesterday)
Bayesian Network Spatio-Temporal (BNST) modelingframework [17]
Add nodes for temporal and spatial dependencies Need more data to train
Chawla and Chandola Anomaly Detection
Introduction Data Mining Methods Density-based anomaly Commute Time Approach Addressing Scalability Anomalies in Complex Data Evaluating Anomaly Detection Methods Applications Problem solutionsPCA and Subspace Method Subspace Method Algorithm Subspace Analysis Results Discussion Typical Characteristics of Anomaly Limitation of Volume Entropy Based versus Volume Based Fraud Detection Epidemeology Anomaly Detection in Climate and Weather Anomalies in Climate Validation of Anomalies
Anomaly Detection in Climate and Weather
Science Questions Identify natural and anthropogenic disasters Identify long time scale events - droughts atmospheric rivers
cold fronts etc
Data Ground observations Remote sensing data (satellites
air-borne) Climate model simulation outputs Multiple variables spatio-temporal (often has height dimension
as well)
Challenges Model spatio-temporal relationships across multiple variables Explain the cause of anomalies Massive data sizes
Climate and weather extreme events are well defined
Key challenge is to find significant events and explain the cause
Chawla and Chandola Anomaly Detection
Introduction Data Mining Methods Density-based anomaly Commute Time Approach Addressing Scalability Anomalies in Complex Data Evaluating Anomaly Detection Methods Applications Problem solutionsPCA and Subspace Method Subspace Method Algorithm Subspace Analysis Results Discussion Typical Characteristics of Anomaly Limitation of Volume Entropy Based versus Volume Based Fraud Detection Epidemeology Anomaly Detection in Climate and Weather Anomalies in Climate Validation of Anomalies
Anomalies are Widely Used in Climate
Most analysis done on ldquoanomalyrdquo time series
Difference from a ldquobase periodrdquo (Toosimplistic)
Brings spatial smoothness (eg a mountaintop and nearby valley can have very differenttemperatures) Removes seasonality
Understand climate and weatherphenomenon
Southern Oscillation Index (SOI) Difference between Sea Level Pressure
(SLP) anomalies for Tahiti and DarwinAustralia
Figure Global AverageTemperature Anomaly(1975 - 2007) Srcwwwmetofficegovuk
Chawla and Chandola Anomaly Detection
Introduction Data Mining Methods Density-based anomaly Commute Time Approach Addressing Scalability Anomalies in Complex Data Evaluating Anomaly Detection Methods Applications Problem solutionsPCA and Subspace Method Subspace Method Algorithm Subspace Analysis Results Discussion Typical Characteristics of Anomaly Limitation of Volume Entropy Based versus Volume Based Fraud Detection Epidemeology Anomaly Detection in Climate and Weather Anomalies in Climate Validation of Anomalies
Constructing Anomalies from Raw Data
Anomaly time series for a given location i
vprimei = vi minus bi
where bi is the base (reference)
How to choose bi Mean of all data for location i Monthly mean values (account for seasonality) Monthly z-score values Median (more robust) Using a shorter ldquoreference periodrdquo
30 year moving window
Different methods show statistically significant differences[19] What is the right strategy Weighted mean of different strategies (Pick weights using
Monte Carlo sampling)
Chawla and Chandola Anomaly Detection
Introduction Data Mining Methods Density-based anomaly Commute Time Approach Addressing Scalability Anomalies in Complex Data Evaluating Anomaly Detection Methods Applications Problem solutionsPCA and Subspace Method Subspace Method Algorithm Subspace Analysis Results Discussion Typical Characteristics of Anomaly Limitation of Volume Entropy Based versus Volume Based Fraud Detection Epidemeology Anomaly Detection in Climate and Weather Anomalies in Climate Validation of Anomalies
Anomaly Detection for Identifying Droughts
Science question Identify significant drought patterns usinghistorical observation data or future simulation data or both
Find persistent spatiotemporal anomalies in precipitation data
A two step approach
1 Find precipitationanomalies usingthresholds
2 Find large connectedcomponents across spaceand time
Matlab - bwlabelbwlabeln
Followup Science questionExplain cause
(drought190120061avi)
Figure Video courtsey Dr ArindamBanerjee
Chawla and Chandola Anomaly Detection
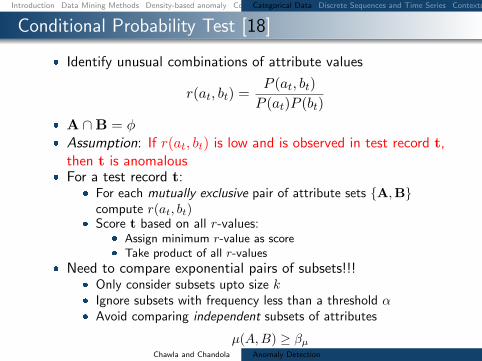
Introduction Data Mining Methods Density-based anomaly Commute Time Approach Addressing Scalability Anomalies in Complex Data Evaluating Anomaly Detection Methods Applications Problem solutionsCategorical Data Discrete Sequences and Time Series Contextual Anomalies Collective Anomalies
Conditional Probability Test [18]
Identify unusual combinations of attribute values
r(at bt) =P (at bt)
P (at)P (bt)
A capB = φ Assumption If r(at bt) is low and is observed in test record t
then t is anomalous For a test record t
For each mutually exclusive pair of attribute sets ABcompute r(at bt)
Score t based on all r-values Assign minimum r-value as score Take product of all r-values
Need to compare exponential pairs of subsets Only consider subsets upto size k Ignore subsets with frequency less than a threshold α Avoid comparing independent subsets of attributes
micro(AB) ge βmicroChawla and Chandola Anomaly Detection
Introduction Data Mining Methods Density-based anomaly Commute Time Approach Addressing Scalability Anomalies in Complex Data Evaluating Anomaly Detection Methods Applications Problem solutionsCategorical Data Discrete Sequences and Time Series Contextual Anomalies Collective Anomalies
Estimating Probabilities for CPT [18]
Maximum LikelihoodEstimation
P (at bt)
P (at)P (bt)=C(at bt)
Ntimes N
C(at)times N
C(bt)
C(at) Number of traininginstances with A = at
N Total number of traininginstances
Laplace Smoothing
E(p) =C(p) + 1
N + 2
r(at bt) =E(at bt)
E(at)times E(bt)
Speedup Tricks
Replace rare attributevalues with genericattribute (reduce arity)
Use efficient datastructure to querying forcounts(AD Trees [26])
ADTrees work fasterfor low arity attributes
Chawla and Chandola Anomaly Detection
Introduction Data Mining Methods Density-based anomaly Commute Time Approach Addressing Scalability Anomalies in Complex Data Evaluating Anomaly Detection Methods Applications Problem solutionsCategorical Data Discrete Sequences and Time Series Contextual Anomalies Collective Anomalies
Finding Anomalies in Discrete Sequences
Many problem formulations
1 Anomalous symbols in asequence
2 Anomalous subsequence in asequence
3 Anomalous sequence in adatabase of sequences
See [11] for a comparativeevaluation [9] for a survey
login pwdmail ssh mail web logoutlogin pwdmail web web web web logoutlogin pwdmail ssh mail web web logoutlogin pwdwebmail ssh webmail logoutloginpwd loginpwd loginpwd logout
Chawla and Chandola Anomaly Detection
Introduction Data Mining Methods Density-based anomaly Commute Time Approach Addressing Scalability Anomalies in Complex Data Evaluating Anomaly Detection Methods Applications Problem solutionsCategorical Data Discrete Sequences and Time Series Contextual Anomalies Collective Anomalies
Treating Sequences as Points
Utilize a distancesimilarity measure Plug into a distancedensityclustering based method
Simplest Hamming Distance
h(Ai Bi) = 1 Ai 6= Bi= 0 Ai = Bi
H(AB) =nsumi=1
h(Ai Bi)
Issues Unequal lengths misalignment Normalized Length of Longest Common Subsequence
D(AB) = 1minus |LCS(AB)|radic|A||B|
Standard Dynamic Programming method is slow Faster versions available (Hunt Szymnaski method [7])
Weaknesses Cannot localize anomalies within a sequence Weak anomaly signals might get lost
Chawla and Chandola Anomaly Detection
Introduction Data Mining Methods Density-based anomaly Commute Time Approach Addressing Scalability Anomalies in Complex Data Evaluating Anomaly Detection Methods Applications Problem solutionsCategorical Data Discrete Sequences and Time Series Contextual Anomalies Collective Anomalies
Using Sliding Windows
Slide a window of size k
Extract all windows from a sequence (nminus k + 1)
Training (Creating a normal dictionary) Store all uniquewindows in all normal sequences and their counts
Testing For each window find the frequency in normal dictionary Anomaly score is inverse of the aggregate frequencies for all
windows (normalized by length)
Many variants exist For each window find the hamming distance to the closest
window in the normal dictionary [16]
Issues Penalizes low frequency windows in the normal dictionary Rewards high frequency windows that might not be relevant Can construct anomalous sequences that will escape detection
Chawla and Chandola Anomaly Detection
Introduction Data Mining Methods Density-based anomaly Commute Time Approach Addressing Scalability Anomalies in Complex Data Evaluating Anomaly Detection Methods Applications Problem solutionsCategorical Data Discrete Sequences and Time Series Contextual Anomalies Collective Anomalies
Using Probabilistic Models
Probability of occurrence of sequence S
P (S) =nprodi=1
P (Si|S1 Siminus1)
Short memory property of sequences
P (Si|S1 Siminus1) = P (Si|Siminusk Siminus1)
Conditional probability estimates for a symbol Si
P (Si|Siminusk Siminus1) =f(Si|Siminusk Si)f(Si|Siminusk Siminus1)
f is estimated from the normal dictionary
Anomaly score for a test sequence is inverse of the normalizedprobability of occurrence
Issues What if the suffix occurs very infrequently in thenormal data (or not at all)
Replace with the longest suffix that occurs sufficient number oftimes [32] - Probabilistic Suffix Trees
Significantly reduces the size of the modelChawla and Chandola Anomaly Detection
Introduction Data Mining Methods Density-based anomaly Commute Time Approach Addressing Scalability Anomalies in Complex Data Evaluating Anomaly Detection Methods Applications Problem solutionsCategorical Data Discrete Sequences and Time Series Contextual Anomalies Collective Anomalies
Finding Contextual Anomalies
Sometimes contextual information isavailable about data
Not used directly as a feature Are well understood no anomalies in
the context Can reduce false positives and yield
interesting anomalies
Example adapted from [30]
Clearest Outlier
Conditional Anomaly
Maximum Daily Temperature
Number
ofFever
Cases
Contextual anomalies - Anomalous with respect to a context Context is defined using environmental variables
Spatial (Latitude Longitude) Graph context (Edges Weights) Temporal location Domain specific (Demographic other)
How to incorporate context Reduce to traditional anomaly detection (subset on context) Explicitly model contextual information (time series spatial)
Chawla and Chandola Anomaly Detection
Introduction Data Mining Methods Density-based anomaly Commute Time Approach Addressing Scalability Anomalies in Complex Data Evaluating Anomaly Detection Methods Applications Problem solutionsCategorical Data Discrete Sequences and Time Series Contextual Anomalies Collective Anomalies
Conditional Anomaly Detection
Data instance d rArru1 u2 udU v1 v2 vdV
dU environmentalattributes
dV indicator attributes u1
u2
U1
U2
U3
v1
v2
V1V2
V3
p(V1|U3) = 02
p(V2|U3) = 02
p(V3|U3) = 06
Algorithm [30]
1 Learn a Gaussian Mixture Model (GMM)U = U1 U2 UnU
each with dimensionality dU2 Learn a set of Gaussians U = V1 V2 VnV
each withdimensionality dV
3 Learn a probabilistic mapping function p(Vj |Ui)4 Score a test instance d = [uv]
S =
nUsumi=1
p(u|Ui)nVsumj=1
p(v|Vj)p(Vj |Ui)
Chawla and Chandola Anomaly Detection
Introduction Data Mining Methods Density-based anomaly Commute Time Approach Addressing Scalability Anomalies in Complex Data Evaluating Anomaly Detection Methods Applications Problem solutionsCategorical Data Discrete Sequences and Time Series Contextual Anomalies Collective Anomalies
Finding Collective Anomalies
Find a collection of data points
Each point by itself is normal
The collection as a whole isanomalous
Relevant when data has inherentstructure and
When domain definition ofanomalies cannot be described aspoint anomalies
A Simple Solution
1 Break data intogroups
2 Compute features foreach group
3 Apply traditionalanomaly detection
Examples
1 Time series
2 Image
3 Spatial clusters ofgalaxies
Chawla and Chandola Anomaly Detection
Introduction Data Mining Methods Density-based anomaly Commute Time Approach Addressing Scalability Anomalies in Complex Data Evaluating Anomaly Detection Methods Applications Problem solutionsCategorical Data Discrete Sequences and Time Series Contextual Anomalies Collective Anomalies
Using Latent Dirichlet Allocation for Group Anomalies
Find anomalous groups in data [34]
Example Spatial clusters of galaxies topics red green emissive words continuous features
Flexible Genre Model (FGM)
For each group
1 Draw a genre 1 2 T 3 ym simM(π)2 Draw topic distribution forym SK 3 θm sim Dir(αym)
3 Draw K topicsβmk sim P (βmk|ηk)k=12K
4 For each point in group
1 Draw topic membershipzmn simM(θn)
2 Generate pointxmn isin P (xmn|βmzmn)
α
zmn
xmn
N
θm
T
π
ηK
ym
β
MK
Model Parameters
M(π) -Multinomial
Genre - Dir(αt)
Topic generatorsP (|ηk)- GIW
Point generatorsP (xmn|βnk) -MultivariateGaussian
Chawla and Chandola Anomaly Detection
Introduction Data Mining Methods Density-based anomaly Commute Time Approach Addressing Scalability Anomalies in Complex Data Evaluating Anomaly Detection Methods Applications Problem solutionsCategorical Data Discrete Sequences and Time Series Contextual Anomalies Collective Anomalies
Inference and Testing for FGM
Inference and Learning Parameters
Approximate inference of latentvariables (Gibbs Sampling)
Use samples to learn parameters(Single step Monte Carlo EM)
Topic 1
Topic 2
Topic 3
Anomaly Detection
Infer the topic distribution θm
Compute negative log likelihood wrt αt
Rationale An anomalous group will be unlikely to begenerated from any genre
Geometric interpretation Mapping each group into a Tdimensional space and finding anomalies
Chawla and Chandola Anomaly Detection
Introduction Data Mining Methods Density-based anomaly Commute Time Approach Addressing Scalability Anomalies in Complex Data Evaluating Anomaly Detection Methods Applications Problem solutions
Evaluating Anomaly Detection Methods - Labels
Labeled validation data set exists Confusion matrix Traditional evaluation metrics
Class imbalance
ROC Curve
Validation set does not exist Use domain expertise to find TP
and FP FN is harder to estimate
Pseudo false negativeestimation techniques [25]
Predicteda n
Actuala TP FNn FP TN
Acc =TP + TNsum
Rec (R) =TP
TP + FN
Prec (P ) =TP
TP + FP
F =2 lowastR lowast PR+ P
Chawla and Chandola Anomaly Detection
Introduction Data Mining Methods Density-based anomaly Commute Time Approach Addressing Scalability Anomalies in Complex Data Evaluating Anomaly Detection Methods Applications Problem solutions
Evaluating Anomaly Detection Methods - Scores
Convert to binary output Use threshold δ on score (Scale
issues [21]) Take top x as anomalies
ROC curve by varying x or δ
Quality of output Does the output ldquosuggestrdquo x or δ Which output is better
Chawla and Chandola Anomaly Detection
Introduction Data Mining Methods Density-based anomaly Commute Time Approach Addressing Scalability Anomalies in Complex Data Evaluating Anomaly Detection Methods Applications Problem solutions
Unifying Scores
Different methods assign scores in differentranges
kNN-based scores [0 1] Lof scores [1 6] ABOD scores [0 80000]
Anomalies have lower scores
Direct scaling to [0 1] might lose distinctionbetween normal and anomalies
Desired scaling Stretch interesting rangesand shrink irrelevant ones
Generalized Procedure for Normalizing Outlier Scores [21] Regularity rArr S(o) ge 0forallo S(o) asymp 0 if o is normal andS(o) 0 if o is anomalous
Normality S is regular and S(o) isin [0 1]forallo
Chawla and Chandola Anomaly Detection
Introduction Data Mining Methods Density-based anomaly Commute Time Approach Addressing Scalability Anomalies in Complex Data Evaluating Anomaly Detection Methods Applications Problem solutions
Regularization and Normalization of Scores
Regularization
1 R(o) = max0 S(o)minus baseS2 R(o) = Smax minus S(o)
3 R(o) = minus log SmaxS(o)
Normalization
1 N(o) = S(o)Smax
2 N(o) = max(
0 erf(S(o)minusmicroSσS radic2
))(Gaussian Scaling)
Suited for high dimensional data
3 N(o) = max(
0cdfγS (o)minusmicroγ
1minusmicroγ
)(Gamma Scaling)
Where cdfγS (o) = P (k S(o) θ) P is the regularized Gamma function Suited for low dimensional data
Chawla and Chandola Anomaly Detection
Introduction Data Mining Methods Density-based anomaly Commute Time Approach Addressing Scalability Anomalies in Complex Data Evaluating Anomaly Detection Methods Applications Problem solutions
Generating Labeled Data for Validation
Generating Both Normal and Anomalous Data
Use generative models for normal and anomalous behavior
Several generators available Multivariate continuous data [27] Multivariate categorical data [5] Discrete sequences using HMM [12]
Drawbacks Might not capture the domain characteristics
Injecting Anomalies - Random Perturbation[30]
Given data point z = xy x and y arepartitions of feature space
Take a random sample D of the entire data set
Let zprime = xprimeyprime isin D such that distancebetween y and yprime is maximum
Replace x with xprime and add z back to data setx
yz
zprime
Injected anomaly
Chawla and Chandola Anomaly Detection
Introduction Data Mining Methods Density-based anomaly Commute Time Approach Addressing Scalability Anomalies in Complex Data Evaluating Anomaly Detection Methods Applications Problem solutionsWhat is Network Anomaly Detection Motivation How Much Serious
Applications Overview
How to set up an anomaly detection solution for agiven application domain
Available data Define anomalies define normal behavior Identify requirements and constraints (online
real-time limited resources) What domain knowledge available
Feature identification Defining normal and anomalous behavior Tuning parameters
Available ground truth (training validation)
Chawla and Chandola Anomaly Detection
Introduction Data Mining Methods Density-based anomaly Commute Time Approach Addressing Scalability Anomalies in Complex Data Evaluating Anomaly Detection Methods Applications Problem solutionsWhat is Network Anomaly Detection Motivation How Much Serious
What is Network Anomaly Detection
Anomaly Detection or Intrusion Detection
Traditional Intrusion Detection Systems (IDS) finding attackscorresponding to predefined pattern data set known as signaturestherefore system is absolutely vulnerable against zero-day attacks
Network Anomaly Detection Systems (NADS) to detectzero-day attacks without any pre-identified signature besides profilenormal behavior of the network and address suspected incidents
Network Anomaly Detection finding unusual and largechanges in the network traffic
Examples intentional attacks (eg Distributed Denial ofService - DDoS) or unusual network traffic (eg flash crowds)
Chawla and Chandola Anomaly Detection
Introduction Data Mining Methods Density-based anomaly Commute Time Approach Addressing Scalability Anomalies in Complex Data Evaluating Anomaly Detection Methods Applications Problem solutionsWhat is Network Anomaly Detection Motivation How Much Serious
Motivation How Much Serious
According to Symantec report released in early 2011 morethan 286 million new threats have been detected in 2010which is a huge number
1656227
2704836
1000000
1500000
2000000
2500000
3000000
20547 18827 69107 113025 140690
624267
1656227
2704836
0
500000
1000000
1500000
2000000
2500000
3000000
2002 2003 2004 2005 2006 2007 2008 July2009-June2010
Chawla and Chandola Anomaly Detection
Introduction Data Mining Methods Density-based anomaly Commute Time Approach Addressing Scalability Anomalies in Complex Data Evaluating Anomaly Detection Methods Applications Problem solutionsNetwork Topology Network Anomalies Detection Problem Network Anomalies Detection Problem Why care about OD Flows
Network Topology
A Typical network
1 y
Router
2
3
41t
x2t
x1t
x3t
x4t
Origin-Destination (OD) flow is the traffic that enters at anorigin node and exits at a destination node of a backbonenetwork x1t x1t
Link measurement is the traffic enters at an node during aninterval y1t
Relationship between link traffic and OD flow traffic iscaptured by the routing matrix A
Chawla and Chandola Anomaly Detection
Introduction Data Mining Methods Density-based anomaly Commute Time Approach Addressing Scalability Anomalies in Complex Data Evaluating Anomaly Detection Methods Applications Problem solutionsNetwork Topology Network Anomalies Detection Problem Network Anomalies Detection Problem Why care about OD Flows
Network Anomalies Detection Problem
Chawla and Chandola Anomaly Detection
Introduction Data Mining Methods Density-based anomaly Commute Time Approach Addressing Scalability Anomalies in Complex Data Evaluating Anomaly Detection Methods Applications Problem solutionsNetwork Topology Network Anomalies Detection Problem Network Anomalies Detection Problem Why care about OD Flows
Network Anomalies Detection Problem
Chawla and Chandola Anomaly Detection
Introduction Data Mining Methods Density-based anomaly Commute Time Approach Addressing Scalability Anomalies in Complex Data Evaluating Anomaly Detection Methods Applications Problem solutionsNetwork Topology Network Anomalies Detection Problem Network Anomalies Detection Problem Why care about OD Flows
Why care about OD Flows
Volume anomaly typically arises on an OD flow (trafficarriving at one node and destined for another node)
If we only monitor traffic on network links volume arisingfrom an OD flow may not be noticeable Thus naiveapproach wont work if OD flow info is not available
Figure source [22]
Chawla and Chandola Anomaly Detection
Introduction Data Mining Methods Density-based anomaly Commute Time Approach Addressing Scalability Anomalies in Complex Data Evaluating Anomaly Detection Methods Applications Problem solutionsPCA and Subspace Method Subspace Method Algorithm Subspace Analysis Results Discussion Typical Characteristics of Anomaly Limitation of Volume Entropy Based versus Volume Based Fraud Detection Epidemeology Anomaly Detection in Climate and Weather Anomalies in Climate Validation of Anomalies
PCA and Subspace Method
Chawla and Chandola Anomaly Detection
Introduction Data Mining Methods Density-based anomaly Commute Time Approach Addressing Scalability Anomalies in Complex Data Evaluating Anomaly Detection Methods Applications Problem solutionsPCA and Subspace Method Subspace Method Algorithm Subspace Analysis Results Discussion Typical Characteristics of Anomaly Limitation of Volume Entropy Based versus Volume Based Fraud Detection Epidemeology Anomaly Detection in Climate and Weather Anomalies in Climate Validation of Anomalies
Subspace Method Algorithm
Step1- Determine the PCs based on eigenvaluedecomposition of the covariance matrix of the dataset
Step2- Choose first top k principle components with thehighest eigenvalues as matrix P
Step3-normal traffic subspace called Z
Z = PP TZ = CZ
Step4-abnormal traffic subspace called Z
Z = (I minus PP T )Z = CZ
Step5-If the norm of a vector is large then it is an rdquoanomalyrdquo
Chawla and Chandola Anomaly Detection
Introduction Data Mining Methods Density-based anomaly Commute Time Approach Addressing Scalability Anomalies in Complex Data Evaluating Anomaly Detection Methods Applications Problem solutionsPCA and Subspace Method Subspace Method Algorithm Subspace Analysis Results Discussion Typical Characteristics of Anomaly Limitation of Volume Entropy Based versus Volume Based Fraud Detection Epidemeology Anomaly Detection in Climate and Weather Anomalies in Climate Validation of Anomalies
Subspace Analysis Results
Note that during anomaly normal component does not changethat much while residual component changes quite a lot
Thus anomalies can be detected by setting some threshold
Figure source [22]
Chawla and Chandola Anomaly Detection
Introduction Data Mining Methods Density-based anomaly Commute Time Approach Addressing Scalability Anomalies in Complex Data Evaluating Anomaly Detection Methods Applications Problem solutionsPCA and Subspace Method Subspace Method Algorithm Subspace Analysis Results Discussion Typical Characteristics of Anomaly Limitation of Volume Entropy Based versus Volume Based Fraud Detection Epidemeology Anomaly Detection in Climate and Weather Anomalies in Climate Validation of Anomalies
Discussion Typical Characteristics of Anomaly
Most Anomalies induce a change in distributionalaspects of packet header fields (called features)
Most important features include 5-tuple Source ampdestination IP addresses Source and destination portnumbers and IP protocol
raquo DOS attack ndash multiple source IP address concentrated on asingle destination IP address
raquo Network scan ndash dispersed distribution of destination addresses
raquo Most wormsviruses also induce some change in distribution ofcertain features
raquo However these changes can be very subtle and mining them islike searching for needles in a haystack
Unlike many previous approach this paper aims todetect events which disturb the distribution of trafficfeatures rather than traffic volume
Chawla and Chandola Anomaly Detection
Introduction Data Mining Methods Density-based anomaly Commute Time Approach Addressing Scalability Anomalies in Complex Data Evaluating Anomaly Detection Methods Applications Problem solutionsPCA and Subspace Method Subspace Method Algorithm Subspace Analysis Results Discussion Typical Characteristics of Anomaly Limitation of Volume Entropy Based versus Volume Based Fraud Detection Epidemeology Anomaly Detection in Climate and Weather Anomalies in Climate Validation of Anomalies
Limitation of Volume
Figure source [22]
Port scan anomaly (traffic feature changes however traffic volume
remains more or less the same)
We can use entropy tocapture the variationsin the traffic feature
bullTakes value 0 when distribution is maximally concentratedbullTakes value log2N when distribution is maximally dispersed
But stands out in
feature entropy
which also reveals
its structure
Port scan
dwarfed
in volume
metricshellip
Chawla and Chandola Anomaly Detection
Introduction Data Mining Methods Density-based anomaly Commute Time Approach Addressing Scalability Anomalies in Complex Data Evaluating Anomaly Detection Methods Applications Problem solutionsPCA and Subspace Method Subspace Method Algorithm Subspace Analysis Results Discussion Typical Characteristics of Anomaly Limitation of Volume Entropy Based versus Volume Based Fraud Detection Epidemeology Anomaly Detection in Climate and Weather Anomalies in Climate Validation of Anomalies
Entropy Based versus Volume Based
DoSDDoS Attacks- a spike in traffic data toward adominant destination IP
Scan anomaly-a spike in traffic data from a dominant sourceIP
Flash Crowd anomaly- again a spike in traffic data to adominant destination IP
Worm anomaly-a Spike in traffic with a dominant port
Chawla and Chandola Anomaly Detection
Introduction Data Mining Methods Density-based anomaly Commute Time Approach Addressing Scalability Anomalies in Complex Data Evaluating Anomaly Detection Methods Applications Problem solutionsPCA and Subspace Method Subspace Method Algorithm Subspace Analysis Results Discussion Typical Characteristics of Anomaly Limitation of Volume Entropy Based versus Volume Based Fraud Detection Epidemeology Anomaly Detection in Climate and Weather Anomalies in Climate Validation of Anomalies
Fraud Detection
Domain Question Identifyfraudulent activities or players fromobserved transaction data
Data Transactions between different
players in the system Meta information about the
individuals An underlying graph structure
Challenges Track and model human behavior Anomalies caused by adaptive
human adversaries Massive data sizes
Insurance (autohealtha)
ClaimantProvider Payer
Telecommunications Customer
Provider
Credit Cards Customer
Supplier Bank
Web Advertising User Advertiser
Publisher
ahttpwwwcheatingculturecompast-cases-of-medicare-fraud
Chawla and Chandola Anomaly Detection
Introduction Data Mining Methods Density-based anomaly Commute Time Approach Addressing Scalability Anomalies in Complex Data Evaluating Anomaly Detection Methods Applications Problem solutionsPCA and Subspace Method Subspace Method Algorithm Subspace Analysis Results Discussion Typical Characteristics of Anomaly Limitation of Volume Entropy Based versus Volume Based Fraud Detection Epidemeology Anomaly Detection in Climate and Weather Anomalies in Climate Validation of Anomalies
A Generic Fraud Detection Method
Activity Monitoring [13]1 Build profiles for individuals (customers users etc) based on
historic data User X makes n calls on an average in January
2 Compare current behavior with historical profile for significantdeviations
Clustering based [4]1 Cluster historical profiles of customers2 Identify small clusters or outlying profiles as anomalies
Strengths Anomaly detection is fast (good for real time) Results are easy to explain
Weaknesses Need to create and maintain a large number of profiles Not dynamic Adequate historical data might not be available Too many false positives
Chawla and Chandola Anomaly Detection
Introduction Data Mining Methods Density-based anomaly Commute Time Approach Addressing Scalability Anomalies in Complex Data Evaluating Anomaly Detection Methods Applications Problem solutionsPCA and Subspace Method Subspace Method Algorithm Subspace Analysis Results Discussion Typical Characteristics of Anomaly Limitation of Volume Entropy Based versus Volume Based Fraud Detection Epidemeology Anomaly Detection in Climate and Weather Anomalies in Climate Validation of Anomalies
Exploiting Graph Structure - Weighted Graphs
Represent data as a weighted graph Communication networks (phone email SMS) Provider referral networks
Objective Identify anomalous nodes
For each node extract several features based on the propertiesof the induced sub-graph (egonet) of neighboring nodes [1]
Choose features that can highlight anomalous nodes
1 Ni degree of node2 Ei number of edges in egonet3 Wi total weight of egonet4 λi principal eigen vector of weighted adjacency matrix of
egonet
Data is transformed into a point in a multi-dimensional space
Chawla and Chandola Anomaly Detection
Introduction Data Mining Methods Density-based anomaly Commute Time Approach Addressing Scalability Anomalies in Complex Data Evaluating Anomaly Detection Methods Applications Problem solutionsPCA and Subspace Method Subspace Method Algorithm Subspace Analysis Results Discussion Typical Characteristics of Anomaly Limitation of Volume Entropy Based versus Volume Based Fraud Detection Epidemeology Anomaly Detection in Climate and Weather Anomalies in Climate Validation of Anomalies
Identifying Anomalies
Traditional anomaly detection (lof) Can be slow but can identify any type of anomalous structure
Faster method to identify specific types of anomalousstructures
Identify relevant feature pairs and power law relationship
Eg Egonet Density Power Law Ni vs Ei - detect nearcliques and stars
Ei prop Nαi 1 le α le 2
Anomaly score for node i wrt a pair of features (y = Cxθ)
Si =max(yi Cx
θi )
min(yi Cxθi )lowast log (|yi minus Cxθi |+ 1)
Chawla and Chandola Anomaly Detection
Introduction Data Mining Methods Density-based anomaly Commute Time Approach Addressing Scalability Anomalies in Complex Data Evaluating Anomaly Detection Methods Applications Problem solutionsPCA and Subspace Method Subspace Method Algorithm Subspace Analysis Results Discussion Typical Characteristics of Anomaly Limitation of Volume Entropy Based versus Volume Based Fraud Detection Epidemeology Anomaly Detection in Climate and Weather Anomalies in Climate Validation of Anomalies
Exploiting Graph Structure - Bipartite Graphs
Represent data as a bipartite graph Healthcare Data (Beneficiaries vs Providers) Insider trading (Traders vs Stocks)
Objective Identify anomalous links
Given a query node a isin V1 find the ldquorelevancerdquoof all other nodes in V1 to a
RelevanceScore(a b) prop Number of times aldquorandom walkrdquo from a reaches b
Use the relevance scores to compute thenormality scores for a node t isin V2
Find set St = a|〈a t〉 isin E Compute |St| times |St| similarity matrix using
relevance vectors for a isin St Normality Score = mean of non-diagonal entries
of similarity matrix
V1 E V2a1
a2
a3
an
t1
t2
t3
tn
Chawla and Chandola Anomaly Detection
Introduction Data Mining Methods Density-based anomaly Commute Time Approach Addressing Scalability Anomalies in Complex Data Evaluating Anomaly Detection Methods Applications Problem solutionsPCA and Subspace Method Subspace Method Algorithm Subspace Analysis Results Discussion Typical Characteristics of Anomaly Limitation of Volume Entropy Based versus Volume Based Fraud Detection Epidemeology Anomaly Detection in Climate and Weather Anomalies in Climate Validation of Anomalies
Detecting Disease Outbreaks
Domain Question Early detection of disease
outbreaks Anthrax attack
Data Emergency department visits Grocery data (Example [14]) Clinical visits Weatherclimate data
Challenges Weak signals in the data
ED cases involving cough rArrFlu or SARS
Integration of multiple signals(lag analysis)
Account for spatial and temporalcorrelations
Chawla and Chandola Anomaly Detection
Introduction Data Mining Methods Density-based anomaly Commute Time Approach Addressing Scalability Anomalies in Complex Data Evaluating Anomaly Detection Methods Applications Problem solutionsPCA and Subspace Method Subspace Method Algorithm Subspace Analysis Results Discussion Typical Characteristics of Anomaly Limitation of Volume Entropy Based versus Volume Based Fraud Detection Epidemeology Anomaly Detection in Climate and Weather Anomalies in Climate Validation of Anomalies
Whatrsquos Significant About Recent Events (WSARE) [33]
1 Learn Bayesian network from historical data Environmental and response variables
2 Sample from the BN (DBbaseline|Current Environment)3 Compute contingency table for rules for DBbaseline andDBcurrent
Rules are single assignment rules (Xi = Y ji ) or conjunctions4 Find p-value for rules using χ2-test
Null Hypothesis Rows and columns of tables for DBbaselineand DBcurrent are independent
5 Find rule with largest p-value Repeat Step 2
Chawla and Chandola Anomaly Detection
Introduction Data Mining Methods Density-based anomaly Commute Time Approach Addressing Scalability Anomalies in Complex Data Evaluating Anomaly Detection Methods Applications Problem solutionsPCA and Subspace Method Subspace Method Algorithm Subspace Analysis Results Discussion Typical Characteristics of Anomaly Limitation of Volume Entropy Based versus Volume Based Fraud Detection Epidemeology Anomaly Detection in Climate and Weather Anomalies in Climate Validation of Anomalies
Incorporating Spatial and Temporal Relationships
WSARE does not explicitly model the spatial and temporalrelationships
What happened yesterday What happened in the adjoining neighborhood (yesterday)
Bayesian Network Spatio-Temporal (BNST) modelingframework [17]
Add nodes for temporal and spatial dependencies Need more data to train
Chawla and Chandola Anomaly Detection
Introduction Data Mining Methods Density-based anomaly Commute Time Approach Addressing Scalability Anomalies in Complex Data Evaluating Anomaly Detection Methods Applications Problem solutionsPCA and Subspace Method Subspace Method Algorithm Subspace Analysis Results Discussion Typical Characteristics of Anomaly Limitation of Volume Entropy Based versus Volume Based Fraud Detection Epidemeology Anomaly Detection in Climate and Weather Anomalies in Climate Validation of Anomalies
Anomaly Detection in Climate and Weather
Science Questions Identify natural and anthropogenic disasters Identify long time scale events - droughts atmospheric rivers
cold fronts etc
Data Ground observations Remote sensing data (satellites
air-borne) Climate model simulation outputs Multiple variables spatio-temporal (often has height dimension
as well)
Challenges Model spatio-temporal relationships across multiple variables Explain the cause of anomalies Massive data sizes
Climate and weather extreme events are well defined
Key challenge is to find significant events and explain the cause
Chawla and Chandola Anomaly Detection
Introduction Data Mining Methods Density-based anomaly Commute Time Approach Addressing Scalability Anomalies in Complex Data Evaluating Anomaly Detection Methods Applications Problem solutionsPCA and Subspace Method Subspace Method Algorithm Subspace Analysis Results Discussion Typical Characteristics of Anomaly Limitation of Volume Entropy Based versus Volume Based Fraud Detection Epidemeology Anomaly Detection in Climate and Weather Anomalies in Climate Validation of Anomalies
Anomalies are Widely Used in Climate
Most analysis done on ldquoanomalyrdquo time series
Difference from a ldquobase periodrdquo (Toosimplistic)
Brings spatial smoothness (eg a mountaintop and nearby valley can have very differenttemperatures) Removes seasonality
Understand climate and weatherphenomenon
Southern Oscillation Index (SOI) Difference between Sea Level Pressure
(SLP) anomalies for Tahiti and DarwinAustralia
Figure Global AverageTemperature Anomaly(1975 - 2007) Srcwwwmetofficegovuk
Chawla and Chandola Anomaly Detection
Introduction Data Mining Methods Density-based anomaly Commute Time Approach Addressing Scalability Anomalies in Complex Data Evaluating Anomaly Detection Methods Applications Problem solutionsPCA and Subspace Method Subspace Method Algorithm Subspace Analysis Results Discussion Typical Characteristics of Anomaly Limitation of Volume Entropy Based versus Volume Based Fraud Detection Epidemeology Anomaly Detection in Climate and Weather Anomalies in Climate Validation of Anomalies
Constructing Anomalies from Raw Data
Anomaly time series for a given location i
vprimei = vi minus bi
where bi is the base (reference)
How to choose bi Mean of all data for location i Monthly mean values (account for seasonality) Monthly z-score values Median (more robust) Using a shorter ldquoreference periodrdquo
30 year moving window
Different methods show statistically significant differences[19] What is the right strategy Weighted mean of different strategies (Pick weights using
Monte Carlo sampling)
Chawla and Chandola Anomaly Detection
Introduction Data Mining Methods Density-based anomaly Commute Time Approach Addressing Scalability Anomalies in Complex Data Evaluating Anomaly Detection Methods Applications Problem solutionsPCA and Subspace Method Subspace Method Algorithm Subspace Analysis Results Discussion Typical Characteristics of Anomaly Limitation of Volume Entropy Based versus Volume Based Fraud Detection Epidemeology Anomaly Detection in Climate and Weather Anomalies in Climate Validation of Anomalies
Anomaly Detection for Identifying Droughts
Science question Identify significant drought patterns usinghistorical observation data or future simulation data or both
Find persistent spatiotemporal anomalies in precipitation data
A two step approach
1 Find precipitationanomalies usingthresholds
2 Find large connectedcomponents across spaceand time
Matlab - bwlabelbwlabeln
Followup Science questionExplain cause
(drought190120061avi)
Figure Video courtsey Dr ArindamBanerjee
Chawla and Chandola Anomaly Detection
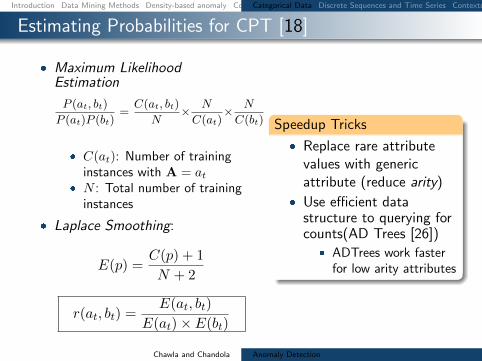
Introduction Data Mining Methods Density-based anomaly Commute Time Approach Addressing Scalability Anomalies in Complex Data Evaluating Anomaly Detection Methods Applications Problem solutionsCategorical Data Discrete Sequences and Time Series Contextual Anomalies Collective Anomalies
Finding Anomalies in Discrete Sequences
Many problem formulations
1 Anomalous symbols in asequence
2 Anomalous subsequence in asequence
3 Anomalous sequence in adatabase of sequences
See [11] for a comparativeevaluation [9] for a survey
login pwdmail ssh mail web logoutlogin pwdmail web web web web logoutlogin pwdmail ssh mail web web logoutlogin pwdwebmail ssh webmail logoutloginpwd loginpwd loginpwd logout
Chawla and Chandola Anomaly Detection
Introduction Data Mining Methods Density-based anomaly Commute Time Approach Addressing Scalability Anomalies in Complex Data Evaluating Anomaly Detection Methods Applications Problem solutionsCategorical Data Discrete Sequences and Time Series Contextual Anomalies Collective Anomalies
Treating Sequences as Points
Utilize a distancesimilarity measure Plug into a distancedensityclustering based method
Simplest Hamming Distance
h(Ai Bi) = 1 Ai 6= Bi= 0 Ai = Bi
H(AB) =nsumi=1
h(Ai Bi)
Issues Unequal lengths misalignment Normalized Length of Longest Common Subsequence
D(AB) = 1minus |LCS(AB)|radic|A||B|
Standard Dynamic Programming method is slow Faster versions available (Hunt Szymnaski method [7])
Weaknesses Cannot localize anomalies within a sequence Weak anomaly signals might get lost
Chawla and Chandola Anomaly Detection
Introduction Data Mining Methods Density-based anomaly Commute Time Approach Addressing Scalability Anomalies in Complex Data Evaluating Anomaly Detection Methods Applications Problem solutionsCategorical Data Discrete Sequences and Time Series Contextual Anomalies Collective Anomalies
Using Sliding Windows
Slide a window of size k
Extract all windows from a sequence (nminus k + 1)
Training (Creating a normal dictionary) Store all uniquewindows in all normal sequences and their counts
Testing For each window find the frequency in normal dictionary Anomaly score is inverse of the aggregate frequencies for all
windows (normalized by length)
Many variants exist For each window find the hamming distance to the closest
window in the normal dictionary [16]
Issues Penalizes low frequency windows in the normal dictionary Rewards high frequency windows that might not be relevant Can construct anomalous sequences that will escape detection
Chawla and Chandola Anomaly Detection
Introduction Data Mining Methods Density-based anomaly Commute Time Approach Addressing Scalability Anomalies in Complex Data Evaluating Anomaly Detection Methods Applications Problem solutionsCategorical Data Discrete Sequences and Time Series Contextual Anomalies Collective Anomalies
Using Probabilistic Models
Probability of occurrence of sequence S
P (S) =nprodi=1
P (Si|S1 Siminus1)
Short memory property of sequences
P (Si|S1 Siminus1) = P (Si|Siminusk Siminus1)
Conditional probability estimates for a symbol Si
P (Si|Siminusk Siminus1) =f(Si|Siminusk Si)f(Si|Siminusk Siminus1)
f is estimated from the normal dictionary
Anomaly score for a test sequence is inverse of the normalizedprobability of occurrence
Issues What if the suffix occurs very infrequently in thenormal data (or not at all)
Replace with the longest suffix that occurs sufficient number oftimes [32] - Probabilistic Suffix Trees
Significantly reduces the size of the modelChawla and Chandola Anomaly Detection
Introduction Data Mining Methods Density-based anomaly Commute Time Approach Addressing Scalability Anomalies in Complex Data Evaluating Anomaly Detection Methods Applications Problem solutionsCategorical Data Discrete Sequences and Time Series Contextual Anomalies Collective Anomalies
Finding Contextual Anomalies
Sometimes contextual information isavailable about data
Not used directly as a feature Are well understood no anomalies in
the context Can reduce false positives and yield
interesting anomalies
Example adapted from [30]
Clearest Outlier
Conditional Anomaly
Maximum Daily Temperature
Number
ofFever
Cases
Contextual anomalies - Anomalous with respect to a context Context is defined using environmental variables
Spatial (Latitude Longitude) Graph context (Edges Weights) Temporal location Domain specific (Demographic other)
How to incorporate context Reduce to traditional anomaly detection (subset on context) Explicitly model contextual information (time series spatial)
Chawla and Chandola Anomaly Detection
Introduction Data Mining Methods Density-based anomaly Commute Time Approach Addressing Scalability Anomalies in Complex Data Evaluating Anomaly Detection Methods Applications Problem solutionsCategorical Data Discrete Sequences and Time Series Contextual Anomalies Collective Anomalies
Conditional Anomaly Detection
Data instance d rArru1 u2 udU v1 v2 vdV
dU environmentalattributes
dV indicator attributes u1
u2
U1
U2
U3
v1
v2
V1V2
V3
p(V1|U3) = 02
p(V2|U3) = 02
p(V3|U3) = 06
Algorithm [30]
1 Learn a Gaussian Mixture Model (GMM)U = U1 U2 UnU
each with dimensionality dU2 Learn a set of Gaussians U = V1 V2 VnV
each withdimensionality dV
3 Learn a probabilistic mapping function p(Vj |Ui)4 Score a test instance d = [uv]
S =
nUsumi=1
p(u|Ui)nVsumj=1
p(v|Vj)p(Vj |Ui)
Chawla and Chandola Anomaly Detection
Introduction Data Mining Methods Density-based anomaly Commute Time Approach Addressing Scalability Anomalies in Complex Data Evaluating Anomaly Detection Methods Applications Problem solutionsCategorical Data Discrete Sequences and Time Series Contextual Anomalies Collective Anomalies
Finding Collective Anomalies
Find a collection of data points
Each point by itself is normal
The collection as a whole isanomalous
Relevant when data has inherentstructure and
When domain definition ofanomalies cannot be described aspoint anomalies
A Simple Solution
1 Break data intogroups
2 Compute features foreach group
3 Apply traditionalanomaly detection
Examples
1 Time series
2 Image
3 Spatial clusters ofgalaxies
Chawla and Chandola Anomaly Detection
Introduction Data Mining Methods Density-based anomaly Commute Time Approach Addressing Scalability Anomalies in Complex Data Evaluating Anomaly Detection Methods Applications Problem solutionsCategorical Data Discrete Sequences and Time Series Contextual Anomalies Collective Anomalies
Using Latent Dirichlet Allocation for Group Anomalies
Find anomalous groups in data [34]
Example Spatial clusters of galaxies topics red green emissive words continuous features
Flexible Genre Model (FGM)
For each group
1 Draw a genre 1 2 T 3 ym simM(π)2 Draw topic distribution forym SK 3 θm sim Dir(αym)
3 Draw K topicsβmk sim P (βmk|ηk)k=12K
4 For each point in group
1 Draw topic membershipzmn simM(θn)
2 Generate pointxmn isin P (xmn|βmzmn)
α
zmn
xmn
N
θm
T
π
ηK
ym
β
MK
Model Parameters
M(π) -Multinomial
Genre - Dir(αt)
Topic generatorsP (|ηk)- GIW
Point generatorsP (xmn|βnk) -MultivariateGaussian
Chawla and Chandola Anomaly Detection
Introduction Data Mining Methods Density-based anomaly Commute Time Approach Addressing Scalability Anomalies in Complex Data Evaluating Anomaly Detection Methods Applications Problem solutionsCategorical Data Discrete Sequences and Time Series Contextual Anomalies Collective Anomalies
Inference and Testing for FGM
Inference and Learning Parameters
Approximate inference of latentvariables (Gibbs Sampling)
Use samples to learn parameters(Single step Monte Carlo EM)
Topic 1
Topic 2
Topic 3
Anomaly Detection
Infer the topic distribution θm
Compute negative log likelihood wrt αt
Rationale An anomalous group will be unlikely to begenerated from any genre
Geometric interpretation Mapping each group into a Tdimensional space and finding anomalies
Chawla and Chandola Anomaly Detection
Introduction Data Mining Methods Density-based anomaly Commute Time Approach Addressing Scalability Anomalies in Complex Data Evaluating Anomaly Detection Methods Applications Problem solutions
Evaluating Anomaly Detection Methods - Labels
Labeled validation data set exists Confusion matrix Traditional evaluation metrics
Class imbalance
ROC Curve
Validation set does not exist Use domain expertise to find TP
and FP FN is harder to estimate
Pseudo false negativeestimation techniques [25]
Predicteda n
Actuala TP FNn FP TN
Acc =TP + TNsum
Rec (R) =TP
TP + FN
Prec (P ) =TP
TP + FP
F =2 lowastR lowast PR+ P
Chawla and Chandola Anomaly Detection
Introduction Data Mining Methods Density-based anomaly Commute Time Approach Addressing Scalability Anomalies in Complex Data Evaluating Anomaly Detection Methods Applications Problem solutions
Evaluating Anomaly Detection Methods - Scores
Convert to binary output Use threshold δ on score (Scale
issues [21]) Take top x as anomalies
ROC curve by varying x or δ
Quality of output Does the output ldquosuggestrdquo x or δ Which output is better
Chawla and Chandola Anomaly Detection
Introduction Data Mining Methods Density-based anomaly Commute Time Approach Addressing Scalability Anomalies in Complex Data Evaluating Anomaly Detection Methods Applications Problem solutions
Unifying Scores
Different methods assign scores in differentranges
kNN-based scores [0 1] Lof scores [1 6] ABOD scores [0 80000]
Anomalies have lower scores
Direct scaling to [0 1] might lose distinctionbetween normal and anomalies
Desired scaling Stretch interesting rangesand shrink irrelevant ones
Generalized Procedure for Normalizing Outlier Scores [21] Regularity rArr S(o) ge 0forallo S(o) asymp 0 if o is normal andS(o) 0 if o is anomalous
Normality S is regular and S(o) isin [0 1]forallo
Chawla and Chandola Anomaly Detection
Introduction Data Mining Methods Density-based anomaly Commute Time Approach Addressing Scalability Anomalies in Complex Data Evaluating Anomaly Detection Methods Applications Problem solutions
Regularization and Normalization of Scores
Regularization
1 R(o) = max0 S(o)minus baseS2 R(o) = Smax minus S(o)
3 R(o) = minus log SmaxS(o)
Normalization
1 N(o) = S(o)Smax
2 N(o) = max(
0 erf(S(o)minusmicroSσS radic2
))(Gaussian Scaling)
Suited for high dimensional data
3 N(o) = max(
0cdfγS (o)minusmicroγ
1minusmicroγ
)(Gamma Scaling)
Where cdfγS (o) = P (k S(o) θ) P is the regularized Gamma function Suited for low dimensional data
Chawla and Chandola Anomaly Detection
Introduction Data Mining Methods Density-based anomaly Commute Time Approach Addressing Scalability Anomalies in Complex Data Evaluating Anomaly Detection Methods Applications Problem solutions
Generating Labeled Data for Validation
Generating Both Normal and Anomalous Data
Use generative models for normal and anomalous behavior
Several generators available Multivariate continuous data [27] Multivariate categorical data [5] Discrete sequences using HMM [12]
Drawbacks Might not capture the domain characteristics
Injecting Anomalies - Random Perturbation[30]
Given data point z = xy x and y arepartitions of feature space
Take a random sample D of the entire data set
Let zprime = xprimeyprime isin D such that distancebetween y and yprime is maximum
Replace x with xprime and add z back to data setx
yz
zprime
Injected anomaly
Chawla and Chandola Anomaly Detection
Introduction Data Mining Methods Density-based anomaly Commute Time Approach Addressing Scalability Anomalies in Complex Data Evaluating Anomaly Detection Methods Applications Problem solutionsWhat is Network Anomaly Detection Motivation How Much Serious
Applications Overview
How to set up an anomaly detection solution for agiven application domain
Available data Define anomalies define normal behavior Identify requirements and constraints (online
real-time limited resources) What domain knowledge available
Feature identification Defining normal and anomalous behavior Tuning parameters
Available ground truth (training validation)
Chawla and Chandola Anomaly Detection
Introduction Data Mining Methods Density-based anomaly Commute Time Approach Addressing Scalability Anomalies in Complex Data Evaluating Anomaly Detection Methods Applications Problem solutionsWhat is Network Anomaly Detection Motivation How Much Serious
What is Network Anomaly Detection
Anomaly Detection or Intrusion Detection
Traditional Intrusion Detection Systems (IDS) finding attackscorresponding to predefined pattern data set known as signaturestherefore system is absolutely vulnerable against zero-day attacks
Network Anomaly Detection Systems (NADS) to detectzero-day attacks without any pre-identified signature besides profilenormal behavior of the network and address suspected incidents
Network Anomaly Detection finding unusual and largechanges in the network traffic
Examples intentional attacks (eg Distributed Denial ofService - DDoS) or unusual network traffic (eg flash crowds)
Chawla and Chandola Anomaly Detection
Introduction Data Mining Methods Density-based anomaly Commute Time Approach Addressing Scalability Anomalies in Complex Data Evaluating Anomaly Detection Methods Applications Problem solutionsWhat is Network Anomaly Detection Motivation How Much Serious
Motivation How Much Serious
According to Symantec report released in early 2011 morethan 286 million new threats have been detected in 2010which is a huge number
1656227
2704836
1000000
1500000
2000000
2500000
3000000
20547 18827 69107 113025 140690
624267
1656227
2704836
0
500000
1000000
1500000
2000000
2500000
3000000
2002 2003 2004 2005 2006 2007 2008 July2009-June2010
Chawla and Chandola Anomaly Detection
Introduction Data Mining Methods Density-based anomaly Commute Time Approach Addressing Scalability Anomalies in Complex Data Evaluating Anomaly Detection Methods Applications Problem solutionsNetwork Topology Network Anomalies Detection Problem Network Anomalies Detection Problem Why care about OD Flows
Network Topology
A Typical network
1 y
Router
2
3
41t
x2t
x1t
x3t
x4t
Origin-Destination (OD) flow is the traffic that enters at anorigin node and exits at a destination node of a backbonenetwork x1t x1t
Link measurement is the traffic enters at an node during aninterval y1t
Relationship between link traffic and OD flow traffic iscaptured by the routing matrix A
Chawla and Chandola Anomaly Detection
Introduction Data Mining Methods Density-based anomaly Commute Time Approach Addressing Scalability Anomalies in Complex Data Evaluating Anomaly Detection Methods Applications Problem solutionsNetwork Topology Network Anomalies Detection Problem Network Anomalies Detection Problem Why care about OD Flows
Network Anomalies Detection Problem
Chawla and Chandola Anomaly Detection
Introduction Data Mining Methods Density-based anomaly Commute Time Approach Addressing Scalability Anomalies in Complex Data Evaluating Anomaly Detection Methods Applications Problem solutionsNetwork Topology Network Anomalies Detection Problem Network Anomalies Detection Problem Why care about OD Flows
Network Anomalies Detection Problem
Chawla and Chandola Anomaly Detection
Introduction Data Mining Methods Density-based anomaly Commute Time Approach Addressing Scalability Anomalies in Complex Data Evaluating Anomaly Detection Methods Applications Problem solutionsNetwork Topology Network Anomalies Detection Problem Network Anomalies Detection Problem Why care about OD Flows
Why care about OD Flows
Volume anomaly typically arises on an OD flow (trafficarriving at one node and destined for another node)
If we only monitor traffic on network links volume arisingfrom an OD flow may not be noticeable Thus naiveapproach wont work if OD flow info is not available
Figure source [22]
Chawla and Chandola Anomaly Detection
Introduction Data Mining Methods Density-based anomaly Commute Time Approach Addressing Scalability Anomalies in Complex Data Evaluating Anomaly Detection Methods Applications Problem solutionsPCA and Subspace Method Subspace Method Algorithm Subspace Analysis Results Discussion Typical Characteristics of Anomaly Limitation of Volume Entropy Based versus Volume Based Fraud Detection Epidemeology Anomaly Detection in Climate and Weather Anomalies in Climate Validation of Anomalies
PCA and Subspace Method
Chawla and Chandola Anomaly Detection
Introduction Data Mining Methods Density-based anomaly Commute Time Approach Addressing Scalability Anomalies in Complex Data Evaluating Anomaly Detection Methods Applications Problem solutionsPCA and Subspace Method Subspace Method Algorithm Subspace Analysis Results Discussion Typical Characteristics of Anomaly Limitation of Volume Entropy Based versus Volume Based Fraud Detection Epidemeology Anomaly Detection in Climate and Weather Anomalies in Climate Validation of Anomalies
Subspace Method Algorithm
Step1- Determine the PCs based on eigenvaluedecomposition of the covariance matrix of the dataset
Step2- Choose first top k principle components with thehighest eigenvalues as matrix P
Step3-normal traffic subspace called Z
Z = PP TZ = CZ
Step4-abnormal traffic subspace called Z
Z = (I minus PP T )Z = CZ
Step5-If the norm of a vector is large then it is an rdquoanomalyrdquo
Chawla and Chandola Anomaly Detection
Introduction Data Mining Methods Density-based anomaly Commute Time Approach Addressing Scalability Anomalies in Complex Data Evaluating Anomaly Detection Methods Applications Problem solutionsPCA and Subspace Method Subspace Method Algorithm Subspace Analysis Results Discussion Typical Characteristics of Anomaly Limitation of Volume Entropy Based versus Volume Based Fraud Detection Epidemeology Anomaly Detection in Climate and Weather Anomalies in Climate Validation of Anomalies
Subspace Analysis Results
Note that during anomaly normal component does not changethat much while residual component changes quite a lot
Thus anomalies can be detected by setting some threshold
Figure source [22]
Chawla and Chandola Anomaly Detection
Introduction Data Mining Methods Density-based anomaly Commute Time Approach Addressing Scalability Anomalies in Complex Data Evaluating Anomaly Detection Methods Applications Problem solutionsPCA and Subspace Method Subspace Method Algorithm Subspace Analysis Results Discussion Typical Characteristics of Anomaly Limitation of Volume Entropy Based versus Volume Based Fraud Detection Epidemeology Anomaly Detection in Climate and Weather Anomalies in Climate Validation of Anomalies
Discussion Typical Characteristics of Anomaly
Most Anomalies induce a change in distributionalaspects of packet header fields (called features)
Most important features include 5-tuple Source ampdestination IP addresses Source and destination portnumbers and IP protocol
raquo DOS attack ndash multiple source IP address concentrated on asingle destination IP address
raquo Network scan ndash dispersed distribution of destination addresses
raquo Most wormsviruses also induce some change in distribution ofcertain features
raquo However these changes can be very subtle and mining them islike searching for needles in a haystack
Unlike many previous approach this paper aims todetect events which disturb the distribution of trafficfeatures rather than traffic volume
Chawla and Chandola Anomaly Detection
Introduction Data Mining Methods Density-based anomaly Commute Time Approach Addressing Scalability Anomalies in Complex Data Evaluating Anomaly Detection Methods Applications Problem solutionsPCA and Subspace Method Subspace Method Algorithm Subspace Analysis Results Discussion Typical Characteristics of Anomaly Limitation of Volume Entropy Based versus Volume Based Fraud Detection Epidemeology Anomaly Detection in Climate and Weather Anomalies in Climate Validation of Anomalies
Limitation of Volume
Figure source [22]
Port scan anomaly (traffic feature changes however traffic volume
remains more or less the same)
We can use entropy tocapture the variationsin the traffic feature
bullTakes value 0 when distribution is maximally concentratedbullTakes value log2N when distribution is maximally dispersed
But stands out in
feature entropy
which also reveals
its structure
Port scan
dwarfed
in volume
metricshellip
Chawla and Chandola Anomaly Detection
Introduction Data Mining Methods Density-based anomaly Commute Time Approach Addressing Scalability Anomalies in Complex Data Evaluating Anomaly Detection Methods Applications Problem solutionsPCA and Subspace Method Subspace Method Algorithm Subspace Analysis Results Discussion Typical Characteristics of Anomaly Limitation of Volume Entropy Based versus Volume Based Fraud Detection Epidemeology Anomaly Detection in Climate and Weather Anomalies in Climate Validation of Anomalies
Entropy Based versus Volume Based
DoSDDoS Attacks- a spike in traffic data toward adominant destination IP
Scan anomaly-a spike in traffic data from a dominant sourceIP
Flash Crowd anomaly- again a spike in traffic data to adominant destination IP
Worm anomaly-a Spike in traffic with a dominant port
Chawla and Chandola Anomaly Detection
Introduction Data Mining Methods Density-based anomaly Commute Time Approach Addressing Scalability Anomalies in Complex Data Evaluating Anomaly Detection Methods Applications Problem solutionsPCA and Subspace Method Subspace Method Algorithm Subspace Analysis Results Discussion Typical Characteristics of Anomaly Limitation of Volume Entropy Based versus Volume Based Fraud Detection Epidemeology Anomaly Detection in Climate and Weather Anomalies in Climate Validation of Anomalies
Fraud Detection
Domain Question Identifyfraudulent activities or players fromobserved transaction data
Data Transactions between different
players in the system Meta information about the
individuals An underlying graph structure
Challenges Track and model human behavior Anomalies caused by adaptive
human adversaries Massive data sizes
Insurance (autohealtha)
ClaimantProvider Payer
Telecommunications Customer
Provider
Credit Cards Customer
Supplier Bank
Web Advertising User Advertiser
Publisher
ahttpwwwcheatingculturecompast-cases-of-medicare-fraud
Chawla and Chandola Anomaly Detection
Introduction Data Mining Methods Density-based anomaly Commute Time Approach Addressing Scalability Anomalies in Complex Data Evaluating Anomaly Detection Methods Applications Problem solutionsPCA and Subspace Method Subspace Method Algorithm Subspace Analysis Results Discussion Typical Characteristics of Anomaly Limitation of Volume Entropy Based versus Volume Based Fraud Detection Epidemeology Anomaly Detection in Climate and Weather Anomalies in Climate Validation of Anomalies
A Generic Fraud Detection Method
Activity Monitoring [13]1 Build profiles for individuals (customers users etc) based on
historic data User X makes n calls on an average in January
2 Compare current behavior with historical profile for significantdeviations
Clustering based [4]1 Cluster historical profiles of customers2 Identify small clusters or outlying profiles as anomalies
Strengths Anomaly detection is fast (good for real time) Results are easy to explain
Weaknesses Need to create and maintain a large number of profiles Not dynamic Adequate historical data might not be available Too many false positives
Chawla and Chandola Anomaly Detection
Introduction Data Mining Methods Density-based anomaly Commute Time Approach Addressing Scalability Anomalies in Complex Data Evaluating Anomaly Detection Methods Applications Problem solutionsPCA and Subspace Method Subspace Method Algorithm Subspace Analysis Results Discussion Typical Characteristics of Anomaly Limitation of Volume Entropy Based versus Volume Based Fraud Detection Epidemeology Anomaly Detection in Climate and Weather Anomalies in Climate Validation of Anomalies
Exploiting Graph Structure - Weighted Graphs
Represent data as a weighted graph Communication networks (phone email SMS) Provider referral networks
Objective Identify anomalous nodes
For each node extract several features based on the propertiesof the induced sub-graph (egonet) of neighboring nodes [1]
Choose features that can highlight anomalous nodes
1 Ni degree of node2 Ei number of edges in egonet3 Wi total weight of egonet4 λi principal eigen vector of weighted adjacency matrix of
egonet
Data is transformed into a point in a multi-dimensional space
Chawla and Chandola Anomaly Detection
Introduction Data Mining Methods Density-based anomaly Commute Time Approach Addressing Scalability Anomalies in Complex Data Evaluating Anomaly Detection Methods Applications Problem solutionsPCA and Subspace Method Subspace Method Algorithm Subspace Analysis Results Discussion Typical Characteristics of Anomaly Limitation of Volume Entropy Based versus Volume Based Fraud Detection Epidemeology Anomaly Detection in Climate and Weather Anomalies in Climate Validation of Anomalies
Identifying Anomalies
Traditional anomaly detection (lof) Can be slow but can identify any type of anomalous structure
Faster method to identify specific types of anomalousstructures
Identify relevant feature pairs and power law relationship
Eg Egonet Density Power Law Ni vs Ei - detect nearcliques and stars
Ei prop Nαi 1 le α le 2
Anomaly score for node i wrt a pair of features (y = Cxθ)
Si =max(yi Cx
θi )
min(yi Cxθi )lowast log (|yi minus Cxθi |+ 1)
Chawla and Chandola Anomaly Detection
Introduction Data Mining Methods Density-based anomaly Commute Time Approach Addressing Scalability Anomalies in Complex Data Evaluating Anomaly Detection Methods Applications Problem solutionsPCA and Subspace Method Subspace Method Algorithm Subspace Analysis Results Discussion Typical Characteristics of Anomaly Limitation of Volume Entropy Based versus Volume Based Fraud Detection Epidemeology Anomaly Detection in Climate and Weather Anomalies in Climate Validation of Anomalies
Exploiting Graph Structure - Bipartite Graphs
Represent data as a bipartite graph Healthcare Data (Beneficiaries vs Providers) Insider trading (Traders vs Stocks)
Objective Identify anomalous links
Given a query node a isin V1 find the ldquorelevancerdquoof all other nodes in V1 to a
RelevanceScore(a b) prop Number of times aldquorandom walkrdquo from a reaches b
Use the relevance scores to compute thenormality scores for a node t isin V2
Find set St = a|〈a t〉 isin E Compute |St| times |St| similarity matrix using
relevance vectors for a isin St Normality Score = mean of non-diagonal entries
of similarity matrix
V1 E V2a1
a2
a3
an
t1
t2
t3
tn
Chawla and Chandola Anomaly Detection
Introduction Data Mining Methods Density-based anomaly Commute Time Approach Addressing Scalability Anomalies in Complex Data Evaluating Anomaly Detection Methods Applications Problem solutionsPCA and Subspace Method Subspace Method Algorithm Subspace Analysis Results Discussion Typical Characteristics of Anomaly Limitation of Volume Entropy Based versus Volume Based Fraud Detection Epidemeology Anomaly Detection in Climate and Weather Anomalies in Climate Validation of Anomalies
Detecting Disease Outbreaks
Domain Question Early detection of disease
outbreaks Anthrax attack
Data Emergency department visits Grocery data (Example [14]) Clinical visits Weatherclimate data
Challenges Weak signals in the data
ED cases involving cough rArrFlu or SARS
Integration of multiple signals(lag analysis)
Account for spatial and temporalcorrelations
Chawla and Chandola Anomaly Detection
Introduction Data Mining Methods Density-based anomaly Commute Time Approach Addressing Scalability Anomalies in Complex Data Evaluating Anomaly Detection Methods Applications Problem solutionsPCA and Subspace Method Subspace Method Algorithm Subspace Analysis Results Discussion Typical Characteristics of Anomaly Limitation of Volume Entropy Based versus Volume Based Fraud Detection Epidemeology Anomaly Detection in Climate and Weather Anomalies in Climate Validation of Anomalies
Whatrsquos Significant About Recent Events (WSARE) [33]
1 Learn Bayesian network from historical data Environmental and response variables
2 Sample from the BN (DBbaseline|Current Environment)3 Compute contingency table for rules for DBbaseline andDBcurrent
Rules are single assignment rules (Xi = Y ji ) or conjunctions4 Find p-value for rules using χ2-test
Null Hypothesis Rows and columns of tables for DBbaselineand DBcurrent are independent
5 Find rule with largest p-value Repeat Step 2
Chawla and Chandola Anomaly Detection
Introduction Data Mining Methods Density-based anomaly Commute Time Approach Addressing Scalability Anomalies in Complex Data Evaluating Anomaly Detection Methods Applications Problem solutionsPCA and Subspace Method Subspace Method Algorithm Subspace Analysis Results Discussion Typical Characteristics of Anomaly Limitation of Volume Entropy Based versus Volume Based Fraud Detection Epidemeology Anomaly Detection in Climate and Weather Anomalies in Climate Validation of Anomalies
Incorporating Spatial and Temporal Relationships
WSARE does not explicitly model the spatial and temporalrelationships
What happened yesterday What happened in the adjoining neighborhood (yesterday)
Bayesian Network Spatio-Temporal (BNST) modelingframework [17]
Add nodes for temporal and spatial dependencies Need more data to train
Chawla and Chandola Anomaly Detection
Introduction Data Mining Methods Density-based anomaly Commute Time Approach Addressing Scalability Anomalies in Complex Data Evaluating Anomaly Detection Methods Applications Problem solutionsPCA and Subspace Method Subspace Method Algorithm Subspace Analysis Results Discussion Typical Characteristics of Anomaly Limitation of Volume Entropy Based versus Volume Based Fraud Detection Epidemeology Anomaly Detection in Climate and Weather Anomalies in Climate Validation of Anomalies
Anomaly Detection in Climate and Weather
Science Questions Identify natural and anthropogenic disasters Identify long time scale events - droughts atmospheric rivers
cold fronts etc
Data Ground observations Remote sensing data (satellites
air-borne) Climate model simulation outputs Multiple variables spatio-temporal (often has height dimension
as well)
Challenges Model spatio-temporal relationships across multiple variables Explain the cause of anomalies Massive data sizes
Climate and weather extreme events are well defined
Key challenge is to find significant events and explain the cause
Chawla and Chandola Anomaly Detection
Introduction Data Mining Methods Density-based anomaly Commute Time Approach Addressing Scalability Anomalies in Complex Data Evaluating Anomaly Detection Methods Applications Problem solutionsPCA and Subspace Method Subspace Method Algorithm Subspace Analysis Results Discussion Typical Characteristics of Anomaly Limitation of Volume Entropy Based versus Volume Based Fraud Detection Epidemeology Anomaly Detection in Climate and Weather Anomalies in Climate Validation of Anomalies
Anomalies are Widely Used in Climate
Most analysis done on ldquoanomalyrdquo time series
Difference from a ldquobase periodrdquo (Toosimplistic)
Brings spatial smoothness (eg a mountaintop and nearby valley can have very differenttemperatures) Removes seasonality
Understand climate and weatherphenomenon
Southern Oscillation Index (SOI) Difference between Sea Level Pressure
(SLP) anomalies for Tahiti and DarwinAustralia
Figure Global AverageTemperature Anomaly(1975 - 2007) Srcwwwmetofficegovuk
Chawla and Chandola Anomaly Detection
Introduction Data Mining Methods Density-based anomaly Commute Time Approach Addressing Scalability Anomalies in Complex Data Evaluating Anomaly Detection Methods Applications Problem solutionsPCA and Subspace Method Subspace Method Algorithm Subspace Analysis Results Discussion Typical Characteristics of Anomaly Limitation of Volume Entropy Based versus Volume Based Fraud Detection Epidemeology Anomaly Detection in Climate and Weather Anomalies in Climate Validation of Anomalies
Constructing Anomalies from Raw Data
Anomaly time series for a given location i
vprimei = vi minus bi
where bi is the base (reference)
How to choose bi Mean of all data for location i Monthly mean values (account for seasonality) Monthly z-score values Median (more robust) Using a shorter ldquoreference periodrdquo
30 year moving window
Different methods show statistically significant differences[19] What is the right strategy Weighted mean of different strategies (Pick weights using
Monte Carlo sampling)
Chawla and Chandola Anomaly Detection
Introduction Data Mining Methods Density-based anomaly Commute Time Approach Addressing Scalability Anomalies in Complex Data Evaluating Anomaly Detection Methods Applications Problem solutionsPCA and Subspace Method Subspace Method Algorithm Subspace Analysis Results Discussion Typical Characteristics of Anomaly Limitation of Volume Entropy Based versus Volume Based Fraud Detection Epidemeology Anomaly Detection in Climate and Weather Anomalies in Climate Validation of Anomalies
Anomaly Detection for Identifying Droughts
Science question Identify significant drought patterns usinghistorical observation data or future simulation data or both
Find persistent spatiotemporal anomalies in precipitation data
A two step approach
1 Find precipitationanomalies usingthresholds
2 Find large connectedcomponents across spaceand time
Matlab - bwlabelbwlabeln
Followup Science questionExplain cause
(drought190120061avi)
Figure Video courtsey Dr ArindamBanerjee
Chawla and Chandola Anomaly Detection
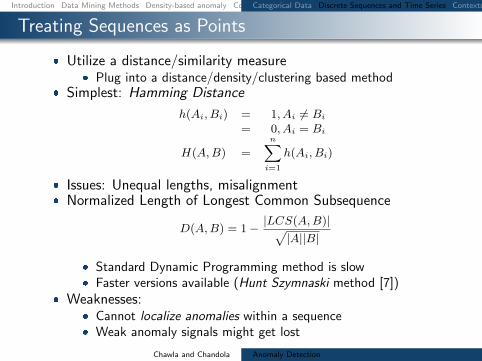
Introduction Data Mining Methods Density-based anomaly Commute Time Approach Addressing Scalability Anomalies in Complex Data Evaluating Anomaly Detection Methods Applications Problem solutionsCategorical Data Discrete Sequences and Time Series Contextual Anomalies Collective Anomalies
Treating Sequences as Points
Utilize a distancesimilarity measure Plug into a distancedensityclustering based method
Simplest Hamming Distance
h(Ai Bi) = 1 Ai 6= Bi= 0 Ai = Bi
H(AB) =nsumi=1
h(Ai Bi)
Issues Unequal lengths misalignment Normalized Length of Longest Common Subsequence
D(AB) = 1minus |LCS(AB)|radic|A||B|
Standard Dynamic Programming method is slow Faster versions available (Hunt Szymnaski method [7])
Weaknesses Cannot localize anomalies within a sequence Weak anomaly signals might get lost
Chawla and Chandola Anomaly Detection
Introduction Data Mining Methods Density-based anomaly Commute Time Approach Addressing Scalability Anomalies in Complex Data Evaluating Anomaly Detection Methods Applications Problem solutionsCategorical Data Discrete Sequences and Time Series Contextual Anomalies Collective Anomalies
Using Sliding Windows
Slide a window of size k
Extract all windows from a sequence (nminus k + 1)
Training (Creating a normal dictionary) Store all uniquewindows in all normal sequences and their counts
Testing For each window find the frequency in normal dictionary Anomaly score is inverse of the aggregate frequencies for all
windows (normalized by length)
Many variants exist For each window find the hamming distance to the closest
window in the normal dictionary [16]
Issues Penalizes low frequency windows in the normal dictionary Rewards high frequency windows that might not be relevant Can construct anomalous sequences that will escape detection
Chawla and Chandola Anomaly Detection
Introduction Data Mining Methods Density-based anomaly Commute Time Approach Addressing Scalability Anomalies in Complex Data Evaluating Anomaly Detection Methods Applications Problem solutionsCategorical Data Discrete Sequences and Time Series Contextual Anomalies Collective Anomalies
Using Probabilistic Models
Probability of occurrence of sequence S
P (S) =nprodi=1
P (Si|S1 Siminus1)
Short memory property of sequences
P (Si|S1 Siminus1) = P (Si|Siminusk Siminus1)
Conditional probability estimates for a symbol Si
P (Si|Siminusk Siminus1) =f(Si|Siminusk Si)f(Si|Siminusk Siminus1)
f is estimated from the normal dictionary
Anomaly score for a test sequence is inverse of the normalizedprobability of occurrence
Issues What if the suffix occurs very infrequently in thenormal data (or not at all)
Replace with the longest suffix that occurs sufficient number oftimes [32] - Probabilistic Suffix Trees
Significantly reduces the size of the modelChawla and Chandola Anomaly Detection
Introduction Data Mining Methods Density-based anomaly Commute Time Approach Addressing Scalability Anomalies in Complex Data Evaluating Anomaly Detection Methods Applications Problem solutionsCategorical Data Discrete Sequences and Time Series Contextual Anomalies Collective Anomalies
Finding Contextual Anomalies
Sometimes contextual information isavailable about data
Not used directly as a feature Are well understood no anomalies in
the context Can reduce false positives and yield
interesting anomalies
Example adapted from [30]
Clearest Outlier
Conditional Anomaly
Maximum Daily Temperature
Number
ofFever
Cases
Contextual anomalies - Anomalous with respect to a context Context is defined using environmental variables
Spatial (Latitude Longitude) Graph context (Edges Weights) Temporal location Domain specific (Demographic other)
How to incorporate context Reduce to traditional anomaly detection (subset on context) Explicitly model contextual information (time series spatial)
Chawla and Chandola Anomaly Detection
Introduction Data Mining Methods Density-based anomaly Commute Time Approach Addressing Scalability Anomalies in Complex Data Evaluating Anomaly Detection Methods Applications Problem solutionsCategorical Data Discrete Sequences and Time Series Contextual Anomalies Collective Anomalies
Conditional Anomaly Detection
Data instance d rArru1 u2 udU v1 v2 vdV
dU environmentalattributes
dV indicator attributes u1
u2
U1
U2
U3
v1
v2
V1V2
V3
p(V1|U3) = 02
p(V2|U3) = 02
p(V3|U3) = 06
Algorithm [30]
1 Learn a Gaussian Mixture Model (GMM)U = U1 U2 UnU
each with dimensionality dU2 Learn a set of Gaussians U = V1 V2 VnV
each withdimensionality dV
3 Learn a probabilistic mapping function p(Vj |Ui)4 Score a test instance d = [uv]
S =
nUsumi=1
p(u|Ui)nVsumj=1
p(v|Vj)p(Vj |Ui)
Chawla and Chandola Anomaly Detection
Introduction Data Mining Methods Density-based anomaly Commute Time Approach Addressing Scalability Anomalies in Complex Data Evaluating Anomaly Detection Methods Applications Problem solutionsCategorical Data Discrete Sequences and Time Series Contextual Anomalies Collective Anomalies
Finding Collective Anomalies
Find a collection of data points
Each point by itself is normal
The collection as a whole isanomalous
Relevant when data has inherentstructure and
When domain definition ofanomalies cannot be described aspoint anomalies
A Simple Solution
1 Break data intogroups
2 Compute features foreach group
3 Apply traditionalanomaly detection
Examples
1 Time series
2 Image
3 Spatial clusters ofgalaxies
Chawla and Chandola Anomaly Detection
Introduction Data Mining Methods Density-based anomaly Commute Time Approach Addressing Scalability Anomalies in Complex Data Evaluating Anomaly Detection Methods Applications Problem solutionsCategorical Data Discrete Sequences and Time Series Contextual Anomalies Collective Anomalies
Using Latent Dirichlet Allocation for Group Anomalies
Find anomalous groups in data [34]
Example Spatial clusters of galaxies topics red green emissive words continuous features
Flexible Genre Model (FGM)
For each group
1 Draw a genre 1 2 T 3 ym simM(π)2 Draw topic distribution forym SK 3 θm sim Dir(αym)
3 Draw K topicsβmk sim P (βmk|ηk)k=12K
4 For each point in group
1 Draw topic membershipzmn simM(θn)
2 Generate pointxmn isin P (xmn|βmzmn)
α
zmn
xmn
N
θm
T
π
ηK
ym
β
MK
Model Parameters
M(π) -Multinomial
Genre - Dir(αt)
Topic generatorsP (|ηk)- GIW
Point generatorsP (xmn|βnk) -MultivariateGaussian
Chawla and Chandola Anomaly Detection
Introduction Data Mining Methods Density-based anomaly Commute Time Approach Addressing Scalability Anomalies in Complex Data Evaluating Anomaly Detection Methods Applications Problem solutionsCategorical Data Discrete Sequences and Time Series Contextual Anomalies Collective Anomalies
Inference and Testing for FGM
Inference and Learning Parameters
Approximate inference of latentvariables (Gibbs Sampling)
Use samples to learn parameters(Single step Monte Carlo EM)
Topic 1
Topic 2
Topic 3
Anomaly Detection
Infer the topic distribution θm
Compute negative log likelihood wrt αt
Rationale An anomalous group will be unlikely to begenerated from any genre
Geometric interpretation Mapping each group into a Tdimensional space and finding anomalies
Chawla and Chandola Anomaly Detection
Introduction Data Mining Methods Density-based anomaly Commute Time Approach Addressing Scalability Anomalies in Complex Data Evaluating Anomaly Detection Methods Applications Problem solutions
Evaluating Anomaly Detection Methods - Labels
Labeled validation data set exists Confusion matrix Traditional evaluation metrics
Class imbalance
ROC Curve
Validation set does not exist Use domain expertise to find TP
and FP FN is harder to estimate
Pseudo false negativeestimation techniques [25]
Predicteda n
Actuala TP FNn FP TN
Acc =TP + TNsum
Rec (R) =TP
TP + FN
Prec (P ) =TP
TP + FP
F =2 lowastR lowast PR+ P
Chawla and Chandola Anomaly Detection
Introduction Data Mining Methods Density-based anomaly Commute Time Approach Addressing Scalability Anomalies in Complex Data Evaluating Anomaly Detection Methods Applications Problem solutions
Evaluating Anomaly Detection Methods - Scores
Convert to binary output Use threshold δ on score (Scale
issues [21]) Take top x as anomalies
ROC curve by varying x or δ
Quality of output Does the output ldquosuggestrdquo x or δ Which output is better
Chawla and Chandola Anomaly Detection
Introduction Data Mining Methods Density-based anomaly Commute Time Approach Addressing Scalability Anomalies in Complex Data Evaluating Anomaly Detection Methods Applications Problem solutions
Unifying Scores
Different methods assign scores in differentranges
kNN-based scores [0 1] Lof scores [1 6] ABOD scores [0 80000]
Anomalies have lower scores
Direct scaling to [0 1] might lose distinctionbetween normal and anomalies
Desired scaling Stretch interesting rangesand shrink irrelevant ones
Generalized Procedure for Normalizing Outlier Scores [21] Regularity rArr S(o) ge 0forallo S(o) asymp 0 if o is normal andS(o) 0 if o is anomalous
Normality S is regular and S(o) isin [0 1]forallo
Chawla and Chandola Anomaly Detection
Introduction Data Mining Methods Density-based anomaly Commute Time Approach Addressing Scalability Anomalies in Complex Data Evaluating Anomaly Detection Methods Applications Problem solutions
Regularization and Normalization of Scores
Regularization
1 R(o) = max0 S(o)minus baseS2 R(o) = Smax minus S(o)
3 R(o) = minus log SmaxS(o)
Normalization
1 N(o) = S(o)Smax
2 N(o) = max(
0 erf(S(o)minusmicroSσS radic2
))(Gaussian Scaling)
Suited for high dimensional data
3 N(o) = max(
0cdfγS (o)minusmicroγ
1minusmicroγ
)(Gamma Scaling)
Where cdfγS (o) = P (k S(o) θ) P is the regularized Gamma function Suited for low dimensional data
Chawla and Chandola Anomaly Detection
Introduction Data Mining Methods Density-based anomaly Commute Time Approach Addressing Scalability Anomalies in Complex Data Evaluating Anomaly Detection Methods Applications Problem solutions
Generating Labeled Data for Validation
Generating Both Normal and Anomalous Data
Use generative models for normal and anomalous behavior
Several generators available Multivariate continuous data [27] Multivariate categorical data [5] Discrete sequences using HMM [12]
Drawbacks Might not capture the domain characteristics
Injecting Anomalies - Random Perturbation[30]
Given data point z = xy x and y arepartitions of feature space
Take a random sample D of the entire data set
Let zprime = xprimeyprime isin D such that distancebetween y and yprime is maximum
Replace x with xprime and add z back to data setx
yz
zprime
Injected anomaly
Chawla and Chandola Anomaly Detection
Introduction Data Mining Methods Density-based anomaly Commute Time Approach Addressing Scalability Anomalies in Complex Data Evaluating Anomaly Detection Methods Applications Problem solutionsWhat is Network Anomaly Detection Motivation How Much Serious
Applications Overview
How to set up an anomaly detection solution for agiven application domain
Available data Define anomalies define normal behavior Identify requirements and constraints (online
real-time limited resources) What domain knowledge available
Feature identification Defining normal and anomalous behavior Tuning parameters
Available ground truth (training validation)
Chawla and Chandola Anomaly Detection
Introduction Data Mining Methods Density-based anomaly Commute Time Approach Addressing Scalability Anomalies in Complex Data Evaluating Anomaly Detection Methods Applications Problem solutionsWhat is Network Anomaly Detection Motivation How Much Serious
What is Network Anomaly Detection
Anomaly Detection or Intrusion Detection
Traditional Intrusion Detection Systems (IDS) finding attackscorresponding to predefined pattern data set known as signaturestherefore system is absolutely vulnerable against zero-day attacks
Network Anomaly Detection Systems (NADS) to detectzero-day attacks without any pre-identified signature besides profilenormal behavior of the network and address suspected incidents
Network Anomaly Detection finding unusual and largechanges in the network traffic
Examples intentional attacks (eg Distributed Denial ofService - DDoS) or unusual network traffic (eg flash crowds)
Chawla and Chandola Anomaly Detection
Introduction Data Mining Methods Density-based anomaly Commute Time Approach Addressing Scalability Anomalies in Complex Data Evaluating Anomaly Detection Methods Applications Problem solutionsWhat is Network Anomaly Detection Motivation How Much Serious
Motivation How Much Serious
According to Symantec report released in early 2011 morethan 286 million new threats have been detected in 2010which is a huge number
1656227
2704836
1000000
1500000
2000000
2500000
3000000
20547 18827 69107 113025 140690
624267
1656227
2704836
0
500000
1000000
1500000
2000000
2500000
3000000
2002 2003 2004 2005 2006 2007 2008 July2009-June2010
Chawla and Chandola Anomaly Detection
Introduction Data Mining Methods Density-based anomaly Commute Time Approach Addressing Scalability Anomalies in Complex Data Evaluating Anomaly Detection Methods Applications Problem solutionsNetwork Topology Network Anomalies Detection Problem Network Anomalies Detection Problem Why care about OD Flows
Network Topology
A Typical network
1 y
Router
2
3
41t
x2t
x1t
x3t
x4t
Origin-Destination (OD) flow is the traffic that enters at anorigin node and exits at a destination node of a backbonenetwork x1t x1t
Link measurement is the traffic enters at an node during aninterval y1t
Relationship between link traffic and OD flow traffic iscaptured by the routing matrix A
Chawla and Chandola Anomaly Detection
Introduction Data Mining Methods Density-based anomaly Commute Time Approach Addressing Scalability Anomalies in Complex Data Evaluating Anomaly Detection Methods Applications Problem solutionsNetwork Topology Network Anomalies Detection Problem Network Anomalies Detection Problem Why care about OD Flows
Network Anomalies Detection Problem
Chawla and Chandola Anomaly Detection
Introduction Data Mining Methods Density-based anomaly Commute Time Approach Addressing Scalability Anomalies in Complex Data Evaluating Anomaly Detection Methods Applications Problem solutionsNetwork Topology Network Anomalies Detection Problem Network Anomalies Detection Problem Why care about OD Flows
Network Anomalies Detection Problem
Chawla and Chandola Anomaly Detection
Introduction Data Mining Methods Density-based anomaly Commute Time Approach Addressing Scalability Anomalies in Complex Data Evaluating Anomaly Detection Methods Applications Problem solutionsNetwork Topology Network Anomalies Detection Problem Network Anomalies Detection Problem Why care about OD Flows
Why care about OD Flows
Volume anomaly typically arises on an OD flow (trafficarriving at one node and destined for another node)
If we only monitor traffic on network links volume arisingfrom an OD flow may not be noticeable Thus naiveapproach wont work if OD flow info is not available
Figure source [22]
Chawla and Chandola Anomaly Detection
Introduction Data Mining Methods Density-based anomaly Commute Time Approach Addressing Scalability Anomalies in Complex Data Evaluating Anomaly Detection Methods Applications Problem solutionsPCA and Subspace Method Subspace Method Algorithm Subspace Analysis Results Discussion Typical Characteristics of Anomaly Limitation of Volume Entropy Based versus Volume Based Fraud Detection Epidemeology Anomaly Detection in Climate and Weather Anomalies in Climate Validation of Anomalies
PCA and Subspace Method
Chawla and Chandola Anomaly Detection
Introduction Data Mining Methods Density-based anomaly Commute Time Approach Addressing Scalability Anomalies in Complex Data Evaluating Anomaly Detection Methods Applications Problem solutionsPCA and Subspace Method Subspace Method Algorithm Subspace Analysis Results Discussion Typical Characteristics of Anomaly Limitation of Volume Entropy Based versus Volume Based Fraud Detection Epidemeology Anomaly Detection in Climate and Weather Anomalies in Climate Validation of Anomalies
Subspace Method Algorithm
Step1- Determine the PCs based on eigenvaluedecomposition of the covariance matrix of the dataset
Step2- Choose first top k principle components with thehighest eigenvalues as matrix P
Step3-normal traffic subspace called Z
Z = PP TZ = CZ
Step4-abnormal traffic subspace called Z
Z = (I minus PP T )Z = CZ
Step5-If the norm of a vector is large then it is an rdquoanomalyrdquo
Chawla and Chandola Anomaly Detection
Introduction Data Mining Methods Density-based anomaly Commute Time Approach Addressing Scalability Anomalies in Complex Data Evaluating Anomaly Detection Methods Applications Problem solutionsPCA and Subspace Method Subspace Method Algorithm Subspace Analysis Results Discussion Typical Characteristics of Anomaly Limitation of Volume Entropy Based versus Volume Based Fraud Detection Epidemeology Anomaly Detection in Climate and Weather Anomalies in Climate Validation of Anomalies
Subspace Analysis Results
Note that during anomaly normal component does not changethat much while residual component changes quite a lot
Thus anomalies can be detected by setting some threshold
Figure source [22]
Chawla and Chandola Anomaly Detection
Introduction Data Mining Methods Density-based anomaly Commute Time Approach Addressing Scalability Anomalies in Complex Data Evaluating Anomaly Detection Methods Applications Problem solutionsPCA and Subspace Method Subspace Method Algorithm Subspace Analysis Results Discussion Typical Characteristics of Anomaly Limitation of Volume Entropy Based versus Volume Based Fraud Detection Epidemeology Anomaly Detection in Climate and Weather Anomalies in Climate Validation of Anomalies
Discussion Typical Characteristics of Anomaly
Most Anomalies induce a change in distributionalaspects of packet header fields (called features)
Most important features include 5-tuple Source ampdestination IP addresses Source and destination portnumbers and IP protocol
raquo DOS attack ndash multiple source IP address concentrated on asingle destination IP address
raquo Network scan ndash dispersed distribution of destination addresses
raquo Most wormsviruses also induce some change in distribution ofcertain features
raquo However these changes can be very subtle and mining them islike searching for needles in a haystack
Unlike many previous approach this paper aims todetect events which disturb the distribution of trafficfeatures rather than traffic volume
Chawla and Chandola Anomaly Detection
Introduction Data Mining Methods Density-based anomaly Commute Time Approach Addressing Scalability Anomalies in Complex Data Evaluating Anomaly Detection Methods Applications Problem solutionsPCA and Subspace Method Subspace Method Algorithm Subspace Analysis Results Discussion Typical Characteristics of Anomaly Limitation of Volume Entropy Based versus Volume Based Fraud Detection Epidemeology Anomaly Detection in Climate and Weather Anomalies in Climate Validation of Anomalies
Limitation of Volume
Figure source [22]
Port scan anomaly (traffic feature changes however traffic volume
remains more or less the same)
We can use entropy tocapture the variationsin the traffic feature
bullTakes value 0 when distribution is maximally concentratedbullTakes value log2N when distribution is maximally dispersed
But stands out in
feature entropy
which also reveals
its structure
Port scan
dwarfed
in volume
metricshellip
Chawla and Chandola Anomaly Detection
Introduction Data Mining Methods Density-based anomaly Commute Time Approach Addressing Scalability Anomalies in Complex Data Evaluating Anomaly Detection Methods Applications Problem solutionsPCA and Subspace Method Subspace Method Algorithm Subspace Analysis Results Discussion Typical Characteristics of Anomaly Limitation of Volume Entropy Based versus Volume Based Fraud Detection Epidemeology Anomaly Detection in Climate and Weather Anomalies in Climate Validation of Anomalies
Entropy Based versus Volume Based
DoSDDoS Attacks- a spike in traffic data toward adominant destination IP
Scan anomaly-a spike in traffic data from a dominant sourceIP
Flash Crowd anomaly- again a spike in traffic data to adominant destination IP
Worm anomaly-a Spike in traffic with a dominant port
Chawla and Chandola Anomaly Detection
Introduction Data Mining Methods Density-based anomaly Commute Time Approach Addressing Scalability Anomalies in Complex Data Evaluating Anomaly Detection Methods Applications Problem solutionsPCA and Subspace Method Subspace Method Algorithm Subspace Analysis Results Discussion Typical Characteristics of Anomaly Limitation of Volume Entropy Based versus Volume Based Fraud Detection Epidemeology Anomaly Detection in Climate and Weather Anomalies in Climate Validation of Anomalies
Fraud Detection
Domain Question Identifyfraudulent activities or players fromobserved transaction data
Data Transactions between different
players in the system Meta information about the
individuals An underlying graph structure
Challenges Track and model human behavior Anomalies caused by adaptive
human adversaries Massive data sizes
Insurance (autohealtha)
ClaimantProvider Payer
Telecommunications Customer
Provider
Credit Cards Customer
Supplier Bank
Web Advertising User Advertiser
Publisher
ahttpwwwcheatingculturecompast-cases-of-medicare-fraud
Chawla and Chandola Anomaly Detection
Introduction Data Mining Methods Density-based anomaly Commute Time Approach Addressing Scalability Anomalies in Complex Data Evaluating Anomaly Detection Methods Applications Problem solutionsPCA and Subspace Method Subspace Method Algorithm Subspace Analysis Results Discussion Typical Characteristics of Anomaly Limitation of Volume Entropy Based versus Volume Based Fraud Detection Epidemeology Anomaly Detection in Climate and Weather Anomalies in Climate Validation of Anomalies
A Generic Fraud Detection Method
Activity Monitoring [13]1 Build profiles for individuals (customers users etc) based on
historic data User X makes n calls on an average in January
2 Compare current behavior with historical profile for significantdeviations
Clustering based [4]1 Cluster historical profiles of customers2 Identify small clusters or outlying profiles as anomalies
Strengths Anomaly detection is fast (good for real time) Results are easy to explain
Weaknesses Need to create and maintain a large number of profiles Not dynamic Adequate historical data might not be available Too many false positives
Chawla and Chandola Anomaly Detection
Introduction Data Mining Methods Density-based anomaly Commute Time Approach Addressing Scalability Anomalies in Complex Data Evaluating Anomaly Detection Methods Applications Problem solutionsPCA and Subspace Method Subspace Method Algorithm Subspace Analysis Results Discussion Typical Characteristics of Anomaly Limitation of Volume Entropy Based versus Volume Based Fraud Detection Epidemeology Anomaly Detection in Climate and Weather Anomalies in Climate Validation of Anomalies
Exploiting Graph Structure - Weighted Graphs
Represent data as a weighted graph Communication networks (phone email SMS) Provider referral networks
Objective Identify anomalous nodes
For each node extract several features based on the propertiesof the induced sub-graph (egonet) of neighboring nodes [1]
Choose features that can highlight anomalous nodes
1 Ni degree of node2 Ei number of edges in egonet3 Wi total weight of egonet4 λi principal eigen vector of weighted adjacency matrix of
egonet
Data is transformed into a point in a multi-dimensional space
Chawla and Chandola Anomaly Detection
Introduction Data Mining Methods Density-based anomaly Commute Time Approach Addressing Scalability Anomalies in Complex Data Evaluating Anomaly Detection Methods Applications Problem solutionsPCA and Subspace Method Subspace Method Algorithm Subspace Analysis Results Discussion Typical Characteristics of Anomaly Limitation of Volume Entropy Based versus Volume Based Fraud Detection Epidemeology Anomaly Detection in Climate and Weather Anomalies in Climate Validation of Anomalies
Identifying Anomalies
Traditional anomaly detection (lof) Can be slow but can identify any type of anomalous structure
Faster method to identify specific types of anomalousstructures
Identify relevant feature pairs and power law relationship
Eg Egonet Density Power Law Ni vs Ei - detect nearcliques and stars
Ei prop Nαi 1 le α le 2
Anomaly score for node i wrt a pair of features (y = Cxθ)
Si =max(yi Cx
θi )
min(yi Cxθi )lowast log (|yi minus Cxθi |+ 1)
Chawla and Chandola Anomaly Detection
Introduction Data Mining Methods Density-based anomaly Commute Time Approach Addressing Scalability Anomalies in Complex Data Evaluating Anomaly Detection Methods Applications Problem solutionsPCA and Subspace Method Subspace Method Algorithm Subspace Analysis Results Discussion Typical Characteristics of Anomaly Limitation of Volume Entropy Based versus Volume Based Fraud Detection Epidemeology Anomaly Detection in Climate and Weather Anomalies in Climate Validation of Anomalies
Exploiting Graph Structure - Bipartite Graphs
Represent data as a bipartite graph Healthcare Data (Beneficiaries vs Providers) Insider trading (Traders vs Stocks)
Objective Identify anomalous links
Given a query node a isin V1 find the ldquorelevancerdquoof all other nodes in V1 to a
RelevanceScore(a b) prop Number of times aldquorandom walkrdquo from a reaches b
Use the relevance scores to compute thenormality scores for a node t isin V2
Find set St = a|〈a t〉 isin E Compute |St| times |St| similarity matrix using
relevance vectors for a isin St Normality Score = mean of non-diagonal entries
of similarity matrix
V1 E V2a1
a2
a3
an
t1
t2
t3
tn
Chawla and Chandola Anomaly Detection
Introduction Data Mining Methods Density-based anomaly Commute Time Approach Addressing Scalability Anomalies in Complex Data Evaluating Anomaly Detection Methods Applications Problem solutionsPCA and Subspace Method Subspace Method Algorithm Subspace Analysis Results Discussion Typical Characteristics of Anomaly Limitation of Volume Entropy Based versus Volume Based Fraud Detection Epidemeology Anomaly Detection in Climate and Weather Anomalies in Climate Validation of Anomalies
Detecting Disease Outbreaks
Domain Question Early detection of disease
outbreaks Anthrax attack
Data Emergency department visits Grocery data (Example [14]) Clinical visits Weatherclimate data
Challenges Weak signals in the data
ED cases involving cough rArrFlu or SARS
Integration of multiple signals(lag analysis)
Account for spatial and temporalcorrelations
Chawla and Chandola Anomaly Detection
Introduction Data Mining Methods Density-based anomaly Commute Time Approach Addressing Scalability Anomalies in Complex Data Evaluating Anomaly Detection Methods Applications Problem solutionsPCA and Subspace Method Subspace Method Algorithm Subspace Analysis Results Discussion Typical Characteristics of Anomaly Limitation of Volume Entropy Based versus Volume Based Fraud Detection Epidemeology Anomaly Detection in Climate and Weather Anomalies in Climate Validation of Anomalies
Whatrsquos Significant About Recent Events (WSARE) [33]
1 Learn Bayesian network from historical data Environmental and response variables
2 Sample from the BN (DBbaseline|Current Environment)3 Compute contingency table for rules for DBbaseline andDBcurrent
Rules are single assignment rules (Xi = Y ji ) or conjunctions4 Find p-value for rules using χ2-test
Null Hypothesis Rows and columns of tables for DBbaselineand DBcurrent are independent
5 Find rule with largest p-value Repeat Step 2
Chawla and Chandola Anomaly Detection
Introduction Data Mining Methods Density-based anomaly Commute Time Approach Addressing Scalability Anomalies in Complex Data Evaluating Anomaly Detection Methods Applications Problem solutionsPCA and Subspace Method Subspace Method Algorithm Subspace Analysis Results Discussion Typical Characteristics of Anomaly Limitation of Volume Entropy Based versus Volume Based Fraud Detection Epidemeology Anomaly Detection in Climate and Weather Anomalies in Climate Validation of Anomalies
Incorporating Spatial and Temporal Relationships
WSARE does not explicitly model the spatial and temporalrelationships
What happened yesterday What happened in the adjoining neighborhood (yesterday)
Bayesian Network Spatio-Temporal (BNST) modelingframework [17]
Add nodes for temporal and spatial dependencies Need more data to train
Chawla and Chandola Anomaly Detection
Introduction Data Mining Methods Density-based anomaly Commute Time Approach Addressing Scalability Anomalies in Complex Data Evaluating Anomaly Detection Methods Applications Problem solutionsPCA and Subspace Method Subspace Method Algorithm Subspace Analysis Results Discussion Typical Characteristics of Anomaly Limitation of Volume Entropy Based versus Volume Based Fraud Detection Epidemeology Anomaly Detection in Climate and Weather Anomalies in Climate Validation of Anomalies
Anomaly Detection in Climate and Weather
Science Questions Identify natural and anthropogenic disasters Identify long time scale events - droughts atmospheric rivers
cold fronts etc
Data Ground observations Remote sensing data (satellites
air-borne) Climate model simulation outputs Multiple variables spatio-temporal (often has height dimension
as well)
Challenges Model spatio-temporal relationships across multiple variables Explain the cause of anomalies Massive data sizes
Climate and weather extreme events are well defined
Key challenge is to find significant events and explain the cause
Chawla and Chandola Anomaly Detection
Introduction Data Mining Methods Density-based anomaly Commute Time Approach Addressing Scalability Anomalies in Complex Data Evaluating Anomaly Detection Methods Applications Problem solutionsPCA and Subspace Method Subspace Method Algorithm Subspace Analysis Results Discussion Typical Characteristics of Anomaly Limitation of Volume Entropy Based versus Volume Based Fraud Detection Epidemeology Anomaly Detection in Climate and Weather Anomalies in Climate Validation of Anomalies
Anomalies are Widely Used in Climate
Most analysis done on ldquoanomalyrdquo time series
Difference from a ldquobase periodrdquo (Toosimplistic)
Brings spatial smoothness (eg a mountaintop and nearby valley can have very differenttemperatures) Removes seasonality
Understand climate and weatherphenomenon
Southern Oscillation Index (SOI) Difference between Sea Level Pressure
(SLP) anomalies for Tahiti and DarwinAustralia
Figure Global AverageTemperature Anomaly(1975 - 2007) Srcwwwmetofficegovuk
Chawla and Chandola Anomaly Detection
Introduction Data Mining Methods Density-based anomaly Commute Time Approach Addressing Scalability Anomalies in Complex Data Evaluating Anomaly Detection Methods Applications Problem solutionsPCA and Subspace Method Subspace Method Algorithm Subspace Analysis Results Discussion Typical Characteristics of Anomaly Limitation of Volume Entropy Based versus Volume Based Fraud Detection Epidemeology Anomaly Detection in Climate and Weather Anomalies in Climate Validation of Anomalies
Constructing Anomalies from Raw Data
Anomaly time series for a given location i
vprimei = vi minus bi
where bi is the base (reference)
How to choose bi Mean of all data for location i Monthly mean values (account for seasonality) Monthly z-score values Median (more robust) Using a shorter ldquoreference periodrdquo
30 year moving window
Different methods show statistically significant differences[19] What is the right strategy Weighted mean of different strategies (Pick weights using
Monte Carlo sampling)
Chawla and Chandola Anomaly Detection
Introduction Data Mining Methods Density-based anomaly Commute Time Approach Addressing Scalability Anomalies in Complex Data Evaluating Anomaly Detection Methods Applications Problem solutionsPCA and Subspace Method Subspace Method Algorithm Subspace Analysis Results Discussion Typical Characteristics of Anomaly Limitation of Volume Entropy Based versus Volume Based Fraud Detection Epidemeology Anomaly Detection in Climate and Weather Anomalies in Climate Validation of Anomalies
Anomaly Detection for Identifying Droughts
Science question Identify significant drought patterns usinghistorical observation data or future simulation data or both
Find persistent spatiotemporal anomalies in precipitation data
A two step approach
1 Find precipitationanomalies usingthresholds
2 Find large connectedcomponents across spaceand time
Matlab - bwlabelbwlabeln
Followup Science questionExplain cause
(drought190120061avi)
Figure Video courtsey Dr ArindamBanerjee
Chawla and Chandola Anomaly Detection
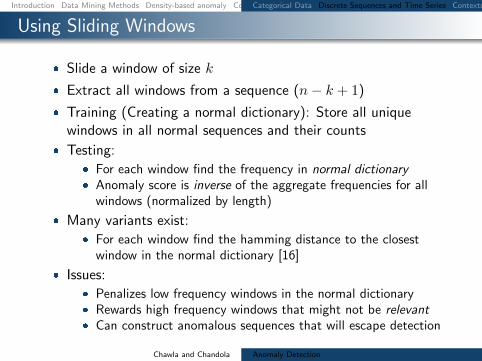
Introduction Data Mining Methods Density-based anomaly Commute Time Approach Addressing Scalability Anomalies in Complex Data Evaluating Anomaly Detection Methods Applications Problem solutionsCategorical Data Discrete Sequences and Time Series Contextual Anomalies Collective Anomalies
Using Sliding Windows
Slide a window of size k
Extract all windows from a sequence (nminus k + 1)
Training (Creating a normal dictionary) Store all uniquewindows in all normal sequences and their counts
Testing For each window find the frequency in normal dictionary Anomaly score is inverse of the aggregate frequencies for all
windows (normalized by length)
Many variants exist For each window find the hamming distance to the closest
window in the normal dictionary [16]
Issues Penalizes low frequency windows in the normal dictionary Rewards high frequency windows that might not be relevant Can construct anomalous sequences that will escape detection
Chawla and Chandola Anomaly Detection
Introduction Data Mining Methods Density-based anomaly Commute Time Approach Addressing Scalability Anomalies in Complex Data Evaluating Anomaly Detection Methods Applications Problem solutionsCategorical Data Discrete Sequences and Time Series Contextual Anomalies Collective Anomalies
Using Probabilistic Models
Probability of occurrence of sequence S
P (S) =nprodi=1
P (Si|S1 Siminus1)
Short memory property of sequences
P (Si|S1 Siminus1) = P (Si|Siminusk Siminus1)
Conditional probability estimates for a symbol Si
P (Si|Siminusk Siminus1) =f(Si|Siminusk Si)f(Si|Siminusk Siminus1)
f is estimated from the normal dictionary
Anomaly score for a test sequence is inverse of the normalizedprobability of occurrence
Issues What if the suffix occurs very infrequently in thenormal data (or not at all)
Replace with the longest suffix that occurs sufficient number oftimes [32] - Probabilistic Suffix Trees
Significantly reduces the size of the modelChawla and Chandola Anomaly Detection
Introduction Data Mining Methods Density-based anomaly Commute Time Approach Addressing Scalability Anomalies in Complex Data Evaluating Anomaly Detection Methods Applications Problem solutionsCategorical Data Discrete Sequences and Time Series Contextual Anomalies Collective Anomalies
Finding Contextual Anomalies
Sometimes contextual information isavailable about data
Not used directly as a feature Are well understood no anomalies in
the context Can reduce false positives and yield
interesting anomalies
Example adapted from [30]
Clearest Outlier
Conditional Anomaly
Maximum Daily Temperature
Number
ofFever
Cases
Contextual anomalies - Anomalous with respect to a context Context is defined using environmental variables
Spatial (Latitude Longitude) Graph context (Edges Weights) Temporal location Domain specific (Demographic other)
How to incorporate context Reduce to traditional anomaly detection (subset on context) Explicitly model contextual information (time series spatial)
Chawla and Chandola Anomaly Detection
Introduction Data Mining Methods Density-based anomaly Commute Time Approach Addressing Scalability Anomalies in Complex Data Evaluating Anomaly Detection Methods Applications Problem solutionsCategorical Data Discrete Sequences and Time Series Contextual Anomalies Collective Anomalies
Conditional Anomaly Detection
Data instance d rArru1 u2 udU v1 v2 vdV
dU environmentalattributes
dV indicator attributes u1
u2
U1
U2
U3
v1
v2
V1V2
V3
p(V1|U3) = 02
p(V2|U3) = 02
p(V3|U3) = 06
Algorithm [30]
1 Learn a Gaussian Mixture Model (GMM)U = U1 U2 UnU
each with dimensionality dU2 Learn a set of Gaussians U = V1 V2 VnV
each withdimensionality dV
3 Learn a probabilistic mapping function p(Vj |Ui)4 Score a test instance d = [uv]
S =
nUsumi=1
p(u|Ui)nVsumj=1
p(v|Vj)p(Vj |Ui)
Chawla and Chandola Anomaly Detection
Introduction Data Mining Methods Density-based anomaly Commute Time Approach Addressing Scalability Anomalies in Complex Data Evaluating Anomaly Detection Methods Applications Problem solutionsCategorical Data Discrete Sequences and Time Series Contextual Anomalies Collective Anomalies
Finding Collective Anomalies
Find a collection of data points
Each point by itself is normal
The collection as a whole isanomalous
Relevant when data has inherentstructure and
When domain definition ofanomalies cannot be described aspoint anomalies
A Simple Solution
1 Break data intogroups
2 Compute features foreach group
3 Apply traditionalanomaly detection
Examples
1 Time series
2 Image
3 Spatial clusters ofgalaxies
Chawla and Chandola Anomaly Detection
Introduction Data Mining Methods Density-based anomaly Commute Time Approach Addressing Scalability Anomalies in Complex Data Evaluating Anomaly Detection Methods Applications Problem solutionsCategorical Data Discrete Sequences and Time Series Contextual Anomalies Collective Anomalies
Using Latent Dirichlet Allocation for Group Anomalies
Find anomalous groups in data [34]
Example Spatial clusters of galaxies topics red green emissive words continuous features
Flexible Genre Model (FGM)
For each group
1 Draw a genre 1 2 T 3 ym simM(π)2 Draw topic distribution forym SK 3 θm sim Dir(αym)
3 Draw K topicsβmk sim P (βmk|ηk)k=12K
4 For each point in group
1 Draw topic membershipzmn simM(θn)
2 Generate pointxmn isin P (xmn|βmzmn)
α
zmn
xmn
N
θm
T
π
ηK
ym
β
MK
Model Parameters
M(π) -Multinomial
Genre - Dir(αt)
Topic generatorsP (|ηk)- GIW
Point generatorsP (xmn|βnk) -MultivariateGaussian
Chawla and Chandola Anomaly Detection
Introduction Data Mining Methods Density-based anomaly Commute Time Approach Addressing Scalability Anomalies in Complex Data Evaluating Anomaly Detection Methods Applications Problem solutionsCategorical Data Discrete Sequences and Time Series Contextual Anomalies Collective Anomalies
Inference and Testing for FGM
Inference and Learning Parameters
Approximate inference of latentvariables (Gibbs Sampling)
Use samples to learn parameters(Single step Monte Carlo EM)
Topic 1
Topic 2
Topic 3
Anomaly Detection
Infer the topic distribution θm
Compute negative log likelihood wrt αt
Rationale An anomalous group will be unlikely to begenerated from any genre
Geometric interpretation Mapping each group into a Tdimensional space and finding anomalies
Chawla and Chandola Anomaly Detection
Introduction Data Mining Methods Density-based anomaly Commute Time Approach Addressing Scalability Anomalies in Complex Data Evaluating Anomaly Detection Methods Applications Problem solutions
Evaluating Anomaly Detection Methods - Labels
Labeled validation data set exists Confusion matrix Traditional evaluation metrics
Class imbalance
ROC Curve
Validation set does not exist Use domain expertise to find TP
and FP FN is harder to estimate
Pseudo false negativeestimation techniques [25]
Predicteda n
Actuala TP FNn FP TN
Acc =TP + TNsum
Rec (R) =TP
TP + FN
Prec (P ) =TP
TP + FP
F =2 lowastR lowast PR+ P
Chawla and Chandola Anomaly Detection
Introduction Data Mining Methods Density-based anomaly Commute Time Approach Addressing Scalability Anomalies in Complex Data Evaluating Anomaly Detection Methods Applications Problem solutions
Evaluating Anomaly Detection Methods - Scores
Convert to binary output Use threshold δ on score (Scale
issues [21]) Take top x as anomalies
ROC curve by varying x or δ
Quality of output Does the output ldquosuggestrdquo x or δ Which output is better
Chawla and Chandola Anomaly Detection
Introduction Data Mining Methods Density-based anomaly Commute Time Approach Addressing Scalability Anomalies in Complex Data Evaluating Anomaly Detection Methods Applications Problem solutions
Unifying Scores
Different methods assign scores in differentranges
kNN-based scores [0 1] Lof scores [1 6] ABOD scores [0 80000]
Anomalies have lower scores
Direct scaling to [0 1] might lose distinctionbetween normal and anomalies
Desired scaling Stretch interesting rangesand shrink irrelevant ones
Generalized Procedure for Normalizing Outlier Scores [21] Regularity rArr S(o) ge 0forallo S(o) asymp 0 if o is normal andS(o) 0 if o is anomalous
Normality S is regular and S(o) isin [0 1]forallo
Chawla and Chandola Anomaly Detection
Introduction Data Mining Methods Density-based anomaly Commute Time Approach Addressing Scalability Anomalies in Complex Data Evaluating Anomaly Detection Methods Applications Problem solutions
Regularization and Normalization of Scores
Regularization
1 R(o) = max0 S(o)minus baseS2 R(o) = Smax minus S(o)
3 R(o) = minus log SmaxS(o)
Normalization
1 N(o) = S(o)Smax
2 N(o) = max(
0 erf(S(o)minusmicroSσS radic2
))(Gaussian Scaling)
Suited for high dimensional data
3 N(o) = max(
0cdfγS (o)minusmicroγ
1minusmicroγ
)(Gamma Scaling)
Where cdfγS (o) = P (k S(o) θ) P is the regularized Gamma function Suited for low dimensional data
Chawla and Chandola Anomaly Detection
Introduction Data Mining Methods Density-based anomaly Commute Time Approach Addressing Scalability Anomalies in Complex Data Evaluating Anomaly Detection Methods Applications Problem solutions
Generating Labeled Data for Validation
Generating Both Normal and Anomalous Data
Use generative models for normal and anomalous behavior
Several generators available Multivariate continuous data [27] Multivariate categorical data [5] Discrete sequences using HMM [12]
Drawbacks Might not capture the domain characteristics
Injecting Anomalies - Random Perturbation[30]
Given data point z = xy x and y arepartitions of feature space
Take a random sample D of the entire data set
Let zprime = xprimeyprime isin D such that distancebetween y and yprime is maximum
Replace x with xprime and add z back to data setx
yz
zprime
Injected anomaly
Chawla and Chandola Anomaly Detection
Introduction Data Mining Methods Density-based anomaly Commute Time Approach Addressing Scalability Anomalies in Complex Data Evaluating Anomaly Detection Methods Applications Problem solutionsWhat is Network Anomaly Detection Motivation How Much Serious
Applications Overview
How to set up an anomaly detection solution for agiven application domain
Available data Define anomalies define normal behavior Identify requirements and constraints (online
real-time limited resources) What domain knowledge available
Feature identification Defining normal and anomalous behavior Tuning parameters
Available ground truth (training validation)
Chawla and Chandola Anomaly Detection
Introduction Data Mining Methods Density-based anomaly Commute Time Approach Addressing Scalability Anomalies in Complex Data Evaluating Anomaly Detection Methods Applications Problem solutionsWhat is Network Anomaly Detection Motivation How Much Serious
What is Network Anomaly Detection
Anomaly Detection or Intrusion Detection
Traditional Intrusion Detection Systems (IDS) finding attackscorresponding to predefined pattern data set known as signaturestherefore system is absolutely vulnerable against zero-day attacks
Network Anomaly Detection Systems (NADS) to detectzero-day attacks without any pre-identified signature besides profilenormal behavior of the network and address suspected incidents
Network Anomaly Detection finding unusual and largechanges in the network traffic
Examples intentional attacks (eg Distributed Denial ofService - DDoS) or unusual network traffic (eg flash crowds)
Chawla and Chandola Anomaly Detection
Introduction Data Mining Methods Density-based anomaly Commute Time Approach Addressing Scalability Anomalies in Complex Data Evaluating Anomaly Detection Methods Applications Problem solutionsWhat is Network Anomaly Detection Motivation How Much Serious
Motivation How Much Serious
According to Symantec report released in early 2011 morethan 286 million new threats have been detected in 2010which is a huge number
1656227
2704836
1000000
1500000
2000000
2500000
3000000
20547 18827 69107 113025 140690
624267
1656227
2704836
0
500000
1000000
1500000
2000000
2500000
3000000
2002 2003 2004 2005 2006 2007 2008 July2009-June2010
Chawla and Chandola Anomaly Detection
Introduction Data Mining Methods Density-based anomaly Commute Time Approach Addressing Scalability Anomalies in Complex Data Evaluating Anomaly Detection Methods Applications Problem solutionsNetwork Topology Network Anomalies Detection Problem Network Anomalies Detection Problem Why care about OD Flows
Network Topology
A Typical network
1 y
Router
2
3
41t
x2t
x1t
x3t
x4t
Origin-Destination (OD) flow is the traffic that enters at anorigin node and exits at a destination node of a backbonenetwork x1t x1t
Link measurement is the traffic enters at an node during aninterval y1t
Relationship between link traffic and OD flow traffic iscaptured by the routing matrix A
Chawla and Chandola Anomaly Detection
Introduction Data Mining Methods Density-based anomaly Commute Time Approach Addressing Scalability Anomalies in Complex Data Evaluating Anomaly Detection Methods Applications Problem solutionsNetwork Topology Network Anomalies Detection Problem Network Anomalies Detection Problem Why care about OD Flows
Network Anomalies Detection Problem
Chawla and Chandola Anomaly Detection
Introduction Data Mining Methods Density-based anomaly Commute Time Approach Addressing Scalability Anomalies in Complex Data Evaluating Anomaly Detection Methods Applications Problem solutionsNetwork Topology Network Anomalies Detection Problem Network Anomalies Detection Problem Why care about OD Flows
Network Anomalies Detection Problem
Chawla and Chandola Anomaly Detection
Introduction Data Mining Methods Density-based anomaly Commute Time Approach Addressing Scalability Anomalies in Complex Data Evaluating Anomaly Detection Methods Applications Problem solutionsNetwork Topology Network Anomalies Detection Problem Network Anomalies Detection Problem Why care about OD Flows
Why care about OD Flows
Volume anomaly typically arises on an OD flow (trafficarriving at one node and destined for another node)
If we only monitor traffic on network links volume arisingfrom an OD flow may not be noticeable Thus naiveapproach wont work if OD flow info is not available
Figure source [22]
Chawla and Chandola Anomaly Detection
Introduction Data Mining Methods Density-based anomaly Commute Time Approach Addressing Scalability Anomalies in Complex Data Evaluating Anomaly Detection Methods Applications Problem solutionsPCA and Subspace Method Subspace Method Algorithm Subspace Analysis Results Discussion Typical Characteristics of Anomaly Limitation of Volume Entropy Based versus Volume Based Fraud Detection Epidemeology Anomaly Detection in Climate and Weather Anomalies in Climate Validation of Anomalies
PCA and Subspace Method
Chawla and Chandola Anomaly Detection
Introduction Data Mining Methods Density-based anomaly Commute Time Approach Addressing Scalability Anomalies in Complex Data Evaluating Anomaly Detection Methods Applications Problem solutionsPCA and Subspace Method Subspace Method Algorithm Subspace Analysis Results Discussion Typical Characteristics of Anomaly Limitation of Volume Entropy Based versus Volume Based Fraud Detection Epidemeology Anomaly Detection in Climate and Weather Anomalies in Climate Validation of Anomalies
Subspace Method Algorithm
Step1- Determine the PCs based on eigenvaluedecomposition of the covariance matrix of the dataset
Step2- Choose first top k principle components with thehighest eigenvalues as matrix P
Step3-normal traffic subspace called Z
Z = PP TZ = CZ
Step4-abnormal traffic subspace called Z
Z = (I minus PP T )Z = CZ
Step5-If the norm of a vector is large then it is an rdquoanomalyrdquo
Chawla and Chandola Anomaly Detection
Introduction Data Mining Methods Density-based anomaly Commute Time Approach Addressing Scalability Anomalies in Complex Data Evaluating Anomaly Detection Methods Applications Problem solutionsPCA and Subspace Method Subspace Method Algorithm Subspace Analysis Results Discussion Typical Characteristics of Anomaly Limitation of Volume Entropy Based versus Volume Based Fraud Detection Epidemeology Anomaly Detection in Climate and Weather Anomalies in Climate Validation of Anomalies
Subspace Analysis Results
Note that during anomaly normal component does not changethat much while residual component changes quite a lot
Thus anomalies can be detected by setting some threshold
Figure source [22]
Chawla and Chandola Anomaly Detection
Introduction Data Mining Methods Density-based anomaly Commute Time Approach Addressing Scalability Anomalies in Complex Data Evaluating Anomaly Detection Methods Applications Problem solutionsPCA and Subspace Method Subspace Method Algorithm Subspace Analysis Results Discussion Typical Characteristics of Anomaly Limitation of Volume Entropy Based versus Volume Based Fraud Detection Epidemeology Anomaly Detection in Climate and Weather Anomalies in Climate Validation of Anomalies
Discussion Typical Characteristics of Anomaly
Most Anomalies induce a change in distributionalaspects of packet header fields (called features)
Most important features include 5-tuple Source ampdestination IP addresses Source and destination portnumbers and IP protocol
raquo DOS attack ndash multiple source IP address concentrated on asingle destination IP address
raquo Network scan ndash dispersed distribution of destination addresses
raquo Most wormsviruses also induce some change in distribution ofcertain features
raquo However these changes can be very subtle and mining them islike searching for needles in a haystack
Unlike many previous approach this paper aims todetect events which disturb the distribution of trafficfeatures rather than traffic volume
Chawla and Chandola Anomaly Detection
Introduction Data Mining Methods Density-based anomaly Commute Time Approach Addressing Scalability Anomalies in Complex Data Evaluating Anomaly Detection Methods Applications Problem solutionsPCA and Subspace Method Subspace Method Algorithm Subspace Analysis Results Discussion Typical Characteristics of Anomaly Limitation of Volume Entropy Based versus Volume Based Fraud Detection Epidemeology Anomaly Detection in Climate and Weather Anomalies in Climate Validation of Anomalies
Limitation of Volume
Figure source [22]
Port scan anomaly (traffic feature changes however traffic volume
remains more or less the same)
We can use entropy tocapture the variationsin the traffic feature
bullTakes value 0 when distribution is maximally concentratedbullTakes value log2N when distribution is maximally dispersed
But stands out in
feature entropy
which also reveals
its structure
Port scan
dwarfed
in volume
metricshellip
Chawla and Chandola Anomaly Detection
Introduction Data Mining Methods Density-based anomaly Commute Time Approach Addressing Scalability Anomalies in Complex Data Evaluating Anomaly Detection Methods Applications Problem solutionsPCA and Subspace Method Subspace Method Algorithm Subspace Analysis Results Discussion Typical Characteristics of Anomaly Limitation of Volume Entropy Based versus Volume Based Fraud Detection Epidemeology Anomaly Detection in Climate and Weather Anomalies in Climate Validation of Anomalies
Entropy Based versus Volume Based
DoSDDoS Attacks- a spike in traffic data toward adominant destination IP
Scan anomaly-a spike in traffic data from a dominant sourceIP
Flash Crowd anomaly- again a spike in traffic data to adominant destination IP
Worm anomaly-a Spike in traffic with a dominant port
Chawla and Chandola Anomaly Detection
Introduction Data Mining Methods Density-based anomaly Commute Time Approach Addressing Scalability Anomalies in Complex Data Evaluating Anomaly Detection Methods Applications Problem solutionsPCA and Subspace Method Subspace Method Algorithm Subspace Analysis Results Discussion Typical Characteristics of Anomaly Limitation of Volume Entropy Based versus Volume Based Fraud Detection Epidemeology Anomaly Detection in Climate and Weather Anomalies in Climate Validation of Anomalies
Fraud Detection
Domain Question Identifyfraudulent activities or players fromobserved transaction data
Data Transactions between different
players in the system Meta information about the
individuals An underlying graph structure
Challenges Track and model human behavior Anomalies caused by adaptive
human adversaries Massive data sizes
Insurance (autohealtha)
ClaimantProvider Payer
Telecommunications Customer
Provider
Credit Cards Customer
Supplier Bank
Web Advertising User Advertiser
Publisher
ahttpwwwcheatingculturecompast-cases-of-medicare-fraud
Chawla and Chandola Anomaly Detection
Introduction Data Mining Methods Density-based anomaly Commute Time Approach Addressing Scalability Anomalies in Complex Data Evaluating Anomaly Detection Methods Applications Problem solutionsPCA and Subspace Method Subspace Method Algorithm Subspace Analysis Results Discussion Typical Characteristics of Anomaly Limitation of Volume Entropy Based versus Volume Based Fraud Detection Epidemeology Anomaly Detection in Climate and Weather Anomalies in Climate Validation of Anomalies
A Generic Fraud Detection Method
Activity Monitoring [13]1 Build profiles for individuals (customers users etc) based on
historic data User X makes n calls on an average in January
2 Compare current behavior with historical profile for significantdeviations
Clustering based [4]1 Cluster historical profiles of customers2 Identify small clusters or outlying profiles as anomalies
Strengths Anomaly detection is fast (good for real time) Results are easy to explain
Weaknesses Need to create and maintain a large number of profiles Not dynamic Adequate historical data might not be available Too many false positives
Chawla and Chandola Anomaly Detection
Introduction Data Mining Methods Density-based anomaly Commute Time Approach Addressing Scalability Anomalies in Complex Data Evaluating Anomaly Detection Methods Applications Problem solutionsPCA and Subspace Method Subspace Method Algorithm Subspace Analysis Results Discussion Typical Characteristics of Anomaly Limitation of Volume Entropy Based versus Volume Based Fraud Detection Epidemeology Anomaly Detection in Climate and Weather Anomalies in Climate Validation of Anomalies
Exploiting Graph Structure - Weighted Graphs
Represent data as a weighted graph Communication networks (phone email SMS) Provider referral networks
Objective Identify anomalous nodes
For each node extract several features based on the propertiesof the induced sub-graph (egonet) of neighboring nodes [1]
Choose features that can highlight anomalous nodes
1 Ni degree of node2 Ei number of edges in egonet3 Wi total weight of egonet4 λi principal eigen vector of weighted adjacency matrix of
egonet
Data is transformed into a point in a multi-dimensional space
Chawla and Chandola Anomaly Detection
Introduction Data Mining Methods Density-based anomaly Commute Time Approach Addressing Scalability Anomalies in Complex Data Evaluating Anomaly Detection Methods Applications Problem solutionsPCA and Subspace Method Subspace Method Algorithm Subspace Analysis Results Discussion Typical Characteristics of Anomaly Limitation of Volume Entropy Based versus Volume Based Fraud Detection Epidemeology Anomaly Detection in Climate and Weather Anomalies in Climate Validation of Anomalies
Identifying Anomalies
Traditional anomaly detection (lof) Can be slow but can identify any type of anomalous structure
Faster method to identify specific types of anomalousstructures
Identify relevant feature pairs and power law relationship
Eg Egonet Density Power Law Ni vs Ei - detect nearcliques and stars
Ei prop Nαi 1 le α le 2
Anomaly score for node i wrt a pair of features (y = Cxθ)
Si =max(yi Cx
θi )
min(yi Cxθi )lowast log (|yi minus Cxθi |+ 1)
Chawla and Chandola Anomaly Detection
Introduction Data Mining Methods Density-based anomaly Commute Time Approach Addressing Scalability Anomalies in Complex Data Evaluating Anomaly Detection Methods Applications Problem solutionsPCA and Subspace Method Subspace Method Algorithm Subspace Analysis Results Discussion Typical Characteristics of Anomaly Limitation of Volume Entropy Based versus Volume Based Fraud Detection Epidemeology Anomaly Detection in Climate and Weather Anomalies in Climate Validation of Anomalies
Exploiting Graph Structure - Bipartite Graphs
Represent data as a bipartite graph Healthcare Data (Beneficiaries vs Providers) Insider trading (Traders vs Stocks)
Objective Identify anomalous links
Given a query node a isin V1 find the ldquorelevancerdquoof all other nodes in V1 to a
RelevanceScore(a b) prop Number of times aldquorandom walkrdquo from a reaches b
Use the relevance scores to compute thenormality scores for a node t isin V2
Find set St = a|〈a t〉 isin E Compute |St| times |St| similarity matrix using
relevance vectors for a isin St Normality Score = mean of non-diagonal entries
of similarity matrix
V1 E V2a1
a2
a3
an
t1
t2
t3
tn
Chawla and Chandola Anomaly Detection
Introduction Data Mining Methods Density-based anomaly Commute Time Approach Addressing Scalability Anomalies in Complex Data Evaluating Anomaly Detection Methods Applications Problem solutionsPCA and Subspace Method Subspace Method Algorithm Subspace Analysis Results Discussion Typical Characteristics of Anomaly Limitation of Volume Entropy Based versus Volume Based Fraud Detection Epidemeology Anomaly Detection in Climate and Weather Anomalies in Climate Validation of Anomalies
Detecting Disease Outbreaks
Domain Question Early detection of disease
outbreaks Anthrax attack
Data Emergency department visits Grocery data (Example [14]) Clinical visits Weatherclimate data
Challenges Weak signals in the data
ED cases involving cough rArrFlu or SARS
Integration of multiple signals(lag analysis)
Account for spatial and temporalcorrelations
Chawla and Chandola Anomaly Detection
Introduction Data Mining Methods Density-based anomaly Commute Time Approach Addressing Scalability Anomalies in Complex Data Evaluating Anomaly Detection Methods Applications Problem solutionsPCA and Subspace Method Subspace Method Algorithm Subspace Analysis Results Discussion Typical Characteristics of Anomaly Limitation of Volume Entropy Based versus Volume Based Fraud Detection Epidemeology Anomaly Detection in Climate and Weather Anomalies in Climate Validation of Anomalies
Whatrsquos Significant About Recent Events (WSARE) [33]
1 Learn Bayesian network from historical data Environmental and response variables
2 Sample from the BN (DBbaseline|Current Environment)3 Compute contingency table for rules for DBbaseline andDBcurrent
Rules are single assignment rules (Xi = Y ji ) or conjunctions4 Find p-value for rules using χ2-test
Null Hypothesis Rows and columns of tables for DBbaselineand DBcurrent are independent
5 Find rule with largest p-value Repeat Step 2
Chawla and Chandola Anomaly Detection
Introduction Data Mining Methods Density-based anomaly Commute Time Approach Addressing Scalability Anomalies in Complex Data Evaluating Anomaly Detection Methods Applications Problem solutionsPCA and Subspace Method Subspace Method Algorithm Subspace Analysis Results Discussion Typical Characteristics of Anomaly Limitation of Volume Entropy Based versus Volume Based Fraud Detection Epidemeology Anomaly Detection in Climate and Weather Anomalies in Climate Validation of Anomalies
Incorporating Spatial and Temporal Relationships
WSARE does not explicitly model the spatial and temporalrelationships
What happened yesterday What happened in the adjoining neighborhood (yesterday)
Bayesian Network Spatio-Temporal (BNST) modelingframework [17]
Add nodes for temporal and spatial dependencies Need more data to train
Chawla and Chandola Anomaly Detection
Introduction Data Mining Methods Density-based anomaly Commute Time Approach Addressing Scalability Anomalies in Complex Data Evaluating Anomaly Detection Methods Applications Problem solutionsPCA and Subspace Method Subspace Method Algorithm Subspace Analysis Results Discussion Typical Characteristics of Anomaly Limitation of Volume Entropy Based versus Volume Based Fraud Detection Epidemeology Anomaly Detection in Climate and Weather Anomalies in Climate Validation of Anomalies
Anomaly Detection in Climate and Weather
Science Questions Identify natural and anthropogenic disasters Identify long time scale events - droughts atmospheric rivers
cold fronts etc
Data Ground observations Remote sensing data (satellites
air-borne) Climate model simulation outputs Multiple variables spatio-temporal (often has height dimension
as well)
Challenges Model spatio-temporal relationships across multiple variables Explain the cause of anomalies Massive data sizes
Climate and weather extreme events are well defined
Key challenge is to find significant events and explain the cause
Chawla and Chandola Anomaly Detection
Introduction Data Mining Methods Density-based anomaly Commute Time Approach Addressing Scalability Anomalies in Complex Data Evaluating Anomaly Detection Methods Applications Problem solutionsPCA and Subspace Method Subspace Method Algorithm Subspace Analysis Results Discussion Typical Characteristics of Anomaly Limitation of Volume Entropy Based versus Volume Based Fraud Detection Epidemeology Anomaly Detection in Climate and Weather Anomalies in Climate Validation of Anomalies
Anomalies are Widely Used in Climate
Most analysis done on ldquoanomalyrdquo time series
Difference from a ldquobase periodrdquo (Toosimplistic)
Brings spatial smoothness (eg a mountaintop and nearby valley can have very differenttemperatures) Removes seasonality
Understand climate and weatherphenomenon
Southern Oscillation Index (SOI) Difference between Sea Level Pressure
(SLP) anomalies for Tahiti and DarwinAustralia
Figure Global AverageTemperature Anomaly(1975 - 2007) Srcwwwmetofficegovuk
Chawla and Chandola Anomaly Detection
Introduction Data Mining Methods Density-based anomaly Commute Time Approach Addressing Scalability Anomalies in Complex Data Evaluating Anomaly Detection Methods Applications Problem solutionsPCA and Subspace Method Subspace Method Algorithm Subspace Analysis Results Discussion Typical Characteristics of Anomaly Limitation of Volume Entropy Based versus Volume Based Fraud Detection Epidemeology Anomaly Detection in Climate and Weather Anomalies in Climate Validation of Anomalies
Constructing Anomalies from Raw Data
Anomaly time series for a given location i
vprimei = vi minus bi
where bi is the base (reference)
How to choose bi Mean of all data for location i Monthly mean values (account for seasonality) Monthly z-score values Median (more robust) Using a shorter ldquoreference periodrdquo
30 year moving window
Different methods show statistically significant differences[19] What is the right strategy Weighted mean of different strategies (Pick weights using
Monte Carlo sampling)
Chawla and Chandola Anomaly Detection
Introduction Data Mining Methods Density-based anomaly Commute Time Approach Addressing Scalability Anomalies in Complex Data Evaluating Anomaly Detection Methods Applications Problem solutionsPCA and Subspace Method Subspace Method Algorithm Subspace Analysis Results Discussion Typical Characteristics of Anomaly Limitation of Volume Entropy Based versus Volume Based Fraud Detection Epidemeology Anomaly Detection in Climate and Weather Anomalies in Climate Validation of Anomalies
Anomaly Detection for Identifying Droughts
Science question Identify significant drought patterns usinghistorical observation data or future simulation data or both
Find persistent spatiotemporal anomalies in precipitation data
A two step approach
1 Find precipitationanomalies usingthresholds
2 Find large connectedcomponents across spaceand time
Matlab - bwlabelbwlabeln
Followup Science questionExplain cause
(drought190120061avi)
Figure Video courtsey Dr ArindamBanerjee
Chawla and Chandola Anomaly Detection
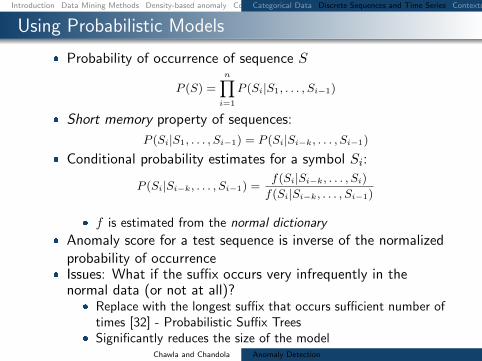
Introduction Data Mining Methods Density-based anomaly Commute Time Approach Addressing Scalability Anomalies in Complex Data Evaluating Anomaly Detection Methods Applications Problem solutionsCategorical Data Discrete Sequences and Time Series Contextual Anomalies Collective Anomalies
Using Probabilistic Models
Probability of occurrence of sequence S
P (S) =nprodi=1
P (Si|S1 Siminus1)
Short memory property of sequences
P (Si|S1 Siminus1) = P (Si|Siminusk Siminus1)
Conditional probability estimates for a symbol Si
P (Si|Siminusk Siminus1) =f(Si|Siminusk Si)f(Si|Siminusk Siminus1)
f is estimated from the normal dictionary
Anomaly score for a test sequence is inverse of the normalizedprobability of occurrence
Issues What if the suffix occurs very infrequently in thenormal data (or not at all)
Replace with the longest suffix that occurs sufficient number oftimes [32] - Probabilistic Suffix Trees
Significantly reduces the size of the modelChawla and Chandola Anomaly Detection
Introduction Data Mining Methods Density-based anomaly Commute Time Approach Addressing Scalability Anomalies in Complex Data Evaluating Anomaly Detection Methods Applications Problem solutionsCategorical Data Discrete Sequences and Time Series Contextual Anomalies Collective Anomalies
Finding Contextual Anomalies
Sometimes contextual information isavailable about data
Not used directly as a feature Are well understood no anomalies in
the context Can reduce false positives and yield
interesting anomalies
Example adapted from [30]
Clearest Outlier
Conditional Anomaly
Maximum Daily Temperature
Number
ofFever
Cases
Contextual anomalies - Anomalous with respect to a context Context is defined using environmental variables
Spatial (Latitude Longitude) Graph context (Edges Weights) Temporal location Domain specific (Demographic other)
How to incorporate context Reduce to traditional anomaly detection (subset on context) Explicitly model contextual information (time series spatial)
Chawla and Chandola Anomaly Detection
Introduction Data Mining Methods Density-based anomaly Commute Time Approach Addressing Scalability Anomalies in Complex Data Evaluating Anomaly Detection Methods Applications Problem solutionsCategorical Data Discrete Sequences and Time Series Contextual Anomalies Collective Anomalies
Conditional Anomaly Detection
Data instance d rArru1 u2 udU v1 v2 vdV
dU environmentalattributes
dV indicator attributes u1
u2
U1
U2
U3
v1
v2
V1V2
V3
p(V1|U3) = 02
p(V2|U3) = 02
p(V3|U3) = 06
Algorithm [30]
1 Learn a Gaussian Mixture Model (GMM)U = U1 U2 UnU
each with dimensionality dU2 Learn a set of Gaussians U = V1 V2 VnV
each withdimensionality dV
3 Learn a probabilistic mapping function p(Vj |Ui)4 Score a test instance d = [uv]
S =
nUsumi=1
p(u|Ui)nVsumj=1
p(v|Vj)p(Vj |Ui)
Chawla and Chandola Anomaly Detection
Introduction Data Mining Methods Density-based anomaly Commute Time Approach Addressing Scalability Anomalies in Complex Data Evaluating Anomaly Detection Methods Applications Problem solutionsCategorical Data Discrete Sequences and Time Series Contextual Anomalies Collective Anomalies
Finding Collective Anomalies
Find a collection of data points
Each point by itself is normal
The collection as a whole isanomalous
Relevant when data has inherentstructure and
When domain definition ofanomalies cannot be described aspoint anomalies
A Simple Solution
1 Break data intogroups
2 Compute features foreach group
3 Apply traditionalanomaly detection
Examples
1 Time series
2 Image
3 Spatial clusters ofgalaxies
Chawla and Chandola Anomaly Detection
Introduction Data Mining Methods Density-based anomaly Commute Time Approach Addressing Scalability Anomalies in Complex Data Evaluating Anomaly Detection Methods Applications Problem solutionsCategorical Data Discrete Sequences and Time Series Contextual Anomalies Collective Anomalies
Using Latent Dirichlet Allocation for Group Anomalies
Find anomalous groups in data [34]
Example Spatial clusters of galaxies topics red green emissive words continuous features
Flexible Genre Model (FGM)
For each group
1 Draw a genre 1 2 T 3 ym simM(π)2 Draw topic distribution forym SK 3 θm sim Dir(αym)
3 Draw K topicsβmk sim P (βmk|ηk)k=12K
4 For each point in group
1 Draw topic membershipzmn simM(θn)
2 Generate pointxmn isin P (xmn|βmzmn)
α
zmn
xmn
N
θm
T
π
ηK
ym
β
MK
Model Parameters
M(π) -Multinomial
Genre - Dir(αt)
Topic generatorsP (|ηk)- GIW
Point generatorsP (xmn|βnk) -MultivariateGaussian
Chawla and Chandola Anomaly Detection
Introduction Data Mining Methods Density-based anomaly Commute Time Approach Addressing Scalability Anomalies in Complex Data Evaluating Anomaly Detection Methods Applications Problem solutionsCategorical Data Discrete Sequences and Time Series Contextual Anomalies Collective Anomalies
Inference and Testing for FGM
Inference and Learning Parameters
Approximate inference of latentvariables (Gibbs Sampling)
Use samples to learn parameters(Single step Monte Carlo EM)
Topic 1
Topic 2
Topic 3
Anomaly Detection
Infer the topic distribution θm
Compute negative log likelihood wrt αt
Rationale An anomalous group will be unlikely to begenerated from any genre
Geometric interpretation Mapping each group into a Tdimensional space and finding anomalies
Chawla and Chandola Anomaly Detection
Introduction Data Mining Methods Density-based anomaly Commute Time Approach Addressing Scalability Anomalies in Complex Data Evaluating Anomaly Detection Methods Applications Problem solutions
Evaluating Anomaly Detection Methods - Labels
Labeled validation data set exists Confusion matrix Traditional evaluation metrics
Class imbalance
ROC Curve
Validation set does not exist Use domain expertise to find TP
and FP FN is harder to estimate
Pseudo false negativeestimation techniques [25]
Predicteda n
Actuala TP FNn FP TN
Acc =TP + TNsum
Rec (R) =TP
TP + FN
Prec (P ) =TP
TP + FP
F =2 lowastR lowast PR+ P
Chawla and Chandola Anomaly Detection
Introduction Data Mining Methods Density-based anomaly Commute Time Approach Addressing Scalability Anomalies in Complex Data Evaluating Anomaly Detection Methods Applications Problem solutions
Evaluating Anomaly Detection Methods - Scores
Convert to binary output Use threshold δ on score (Scale
issues [21]) Take top x as anomalies
ROC curve by varying x or δ
Quality of output Does the output ldquosuggestrdquo x or δ Which output is better
Chawla and Chandola Anomaly Detection
Introduction Data Mining Methods Density-based anomaly Commute Time Approach Addressing Scalability Anomalies in Complex Data Evaluating Anomaly Detection Methods Applications Problem solutions
Unifying Scores
Different methods assign scores in differentranges
kNN-based scores [0 1] Lof scores [1 6] ABOD scores [0 80000]
Anomalies have lower scores
Direct scaling to [0 1] might lose distinctionbetween normal and anomalies
Desired scaling Stretch interesting rangesand shrink irrelevant ones
Generalized Procedure for Normalizing Outlier Scores [21] Regularity rArr S(o) ge 0forallo S(o) asymp 0 if o is normal andS(o) 0 if o is anomalous
Normality S is regular and S(o) isin [0 1]forallo
Chawla and Chandola Anomaly Detection
Introduction Data Mining Methods Density-based anomaly Commute Time Approach Addressing Scalability Anomalies in Complex Data Evaluating Anomaly Detection Methods Applications Problem solutions
Regularization and Normalization of Scores
Regularization
1 R(o) = max0 S(o)minus baseS2 R(o) = Smax minus S(o)
3 R(o) = minus log SmaxS(o)
Normalization
1 N(o) = S(o)Smax
2 N(o) = max(
0 erf(S(o)minusmicroSσS radic2
))(Gaussian Scaling)
Suited for high dimensional data
3 N(o) = max(
0cdfγS (o)minusmicroγ
1minusmicroγ
)(Gamma Scaling)
Where cdfγS (o) = P (k S(o) θ) P is the regularized Gamma function Suited for low dimensional data
Chawla and Chandola Anomaly Detection
Introduction Data Mining Methods Density-based anomaly Commute Time Approach Addressing Scalability Anomalies in Complex Data Evaluating Anomaly Detection Methods Applications Problem solutions
Generating Labeled Data for Validation
Generating Both Normal and Anomalous Data
Use generative models for normal and anomalous behavior
Several generators available Multivariate continuous data [27] Multivariate categorical data [5] Discrete sequences using HMM [12]
Drawbacks Might not capture the domain characteristics
Injecting Anomalies - Random Perturbation[30]
Given data point z = xy x and y arepartitions of feature space
Take a random sample D of the entire data set
Let zprime = xprimeyprime isin D such that distancebetween y and yprime is maximum
Replace x with xprime and add z back to data setx
yz
zprime
Injected anomaly
Chawla and Chandola Anomaly Detection
Introduction Data Mining Methods Density-based anomaly Commute Time Approach Addressing Scalability Anomalies in Complex Data Evaluating Anomaly Detection Methods Applications Problem solutionsWhat is Network Anomaly Detection Motivation How Much Serious
Applications Overview
How to set up an anomaly detection solution for agiven application domain
Available data Define anomalies define normal behavior Identify requirements and constraints (online
real-time limited resources) What domain knowledge available
Feature identification Defining normal and anomalous behavior Tuning parameters
Available ground truth (training validation)
Chawla and Chandola Anomaly Detection
Introduction Data Mining Methods Density-based anomaly Commute Time Approach Addressing Scalability Anomalies in Complex Data Evaluating Anomaly Detection Methods Applications Problem solutionsWhat is Network Anomaly Detection Motivation How Much Serious
What is Network Anomaly Detection
Anomaly Detection or Intrusion Detection
Traditional Intrusion Detection Systems (IDS) finding attackscorresponding to predefined pattern data set known as signaturestherefore system is absolutely vulnerable against zero-day attacks
Network Anomaly Detection Systems (NADS) to detectzero-day attacks without any pre-identified signature besides profilenormal behavior of the network and address suspected incidents
Network Anomaly Detection finding unusual and largechanges in the network traffic
Examples intentional attacks (eg Distributed Denial ofService - DDoS) or unusual network traffic (eg flash crowds)
Chawla and Chandola Anomaly Detection
Introduction Data Mining Methods Density-based anomaly Commute Time Approach Addressing Scalability Anomalies in Complex Data Evaluating Anomaly Detection Methods Applications Problem solutionsWhat is Network Anomaly Detection Motivation How Much Serious
Motivation How Much Serious
According to Symantec report released in early 2011 morethan 286 million new threats have been detected in 2010which is a huge number
1656227
2704836
1000000
1500000
2000000
2500000
3000000
20547 18827 69107 113025 140690
624267
1656227
2704836
0
500000
1000000
1500000
2000000
2500000
3000000
2002 2003 2004 2005 2006 2007 2008 July2009-June2010
Chawla and Chandola Anomaly Detection
Introduction Data Mining Methods Density-based anomaly Commute Time Approach Addressing Scalability Anomalies in Complex Data Evaluating Anomaly Detection Methods Applications Problem solutionsNetwork Topology Network Anomalies Detection Problem Network Anomalies Detection Problem Why care about OD Flows
Network Topology
A Typical network
1 y
Router
2
3
41t
x2t
x1t
x3t
x4t
Origin-Destination (OD) flow is the traffic that enters at anorigin node and exits at a destination node of a backbonenetwork x1t x1t
Link measurement is the traffic enters at an node during aninterval y1t
Relationship between link traffic and OD flow traffic iscaptured by the routing matrix A
Chawla and Chandola Anomaly Detection
Introduction Data Mining Methods Density-based anomaly Commute Time Approach Addressing Scalability Anomalies in Complex Data Evaluating Anomaly Detection Methods Applications Problem solutionsNetwork Topology Network Anomalies Detection Problem Network Anomalies Detection Problem Why care about OD Flows
Network Anomalies Detection Problem
Chawla and Chandola Anomaly Detection
Introduction Data Mining Methods Density-based anomaly Commute Time Approach Addressing Scalability Anomalies in Complex Data Evaluating Anomaly Detection Methods Applications Problem solutionsNetwork Topology Network Anomalies Detection Problem Network Anomalies Detection Problem Why care about OD Flows
Network Anomalies Detection Problem
Chawla and Chandola Anomaly Detection
Introduction Data Mining Methods Density-based anomaly Commute Time Approach Addressing Scalability Anomalies in Complex Data Evaluating Anomaly Detection Methods Applications Problem solutionsNetwork Topology Network Anomalies Detection Problem Network Anomalies Detection Problem Why care about OD Flows
Why care about OD Flows
Volume anomaly typically arises on an OD flow (trafficarriving at one node and destined for another node)
If we only monitor traffic on network links volume arisingfrom an OD flow may not be noticeable Thus naiveapproach wont work if OD flow info is not available
Figure source [22]
Chawla and Chandola Anomaly Detection
Introduction Data Mining Methods Density-based anomaly Commute Time Approach Addressing Scalability Anomalies in Complex Data Evaluating Anomaly Detection Methods Applications Problem solutionsPCA and Subspace Method Subspace Method Algorithm Subspace Analysis Results Discussion Typical Characteristics of Anomaly Limitation of Volume Entropy Based versus Volume Based Fraud Detection Epidemeology Anomaly Detection in Climate and Weather Anomalies in Climate Validation of Anomalies
PCA and Subspace Method
Chawla and Chandola Anomaly Detection
Introduction Data Mining Methods Density-based anomaly Commute Time Approach Addressing Scalability Anomalies in Complex Data Evaluating Anomaly Detection Methods Applications Problem solutionsPCA and Subspace Method Subspace Method Algorithm Subspace Analysis Results Discussion Typical Characteristics of Anomaly Limitation of Volume Entropy Based versus Volume Based Fraud Detection Epidemeology Anomaly Detection in Climate and Weather Anomalies in Climate Validation of Anomalies
Subspace Method Algorithm
Step1- Determine the PCs based on eigenvaluedecomposition of the covariance matrix of the dataset
Step2- Choose first top k principle components with thehighest eigenvalues as matrix P
Step3-normal traffic subspace called Z
Z = PP TZ = CZ
Step4-abnormal traffic subspace called Z
Z = (I minus PP T )Z = CZ
Step5-If the norm of a vector is large then it is an rdquoanomalyrdquo
Chawla and Chandola Anomaly Detection
Introduction Data Mining Methods Density-based anomaly Commute Time Approach Addressing Scalability Anomalies in Complex Data Evaluating Anomaly Detection Methods Applications Problem solutionsPCA and Subspace Method Subspace Method Algorithm Subspace Analysis Results Discussion Typical Characteristics of Anomaly Limitation of Volume Entropy Based versus Volume Based Fraud Detection Epidemeology Anomaly Detection in Climate and Weather Anomalies in Climate Validation of Anomalies
Subspace Analysis Results
Note that during anomaly normal component does not changethat much while residual component changes quite a lot
Thus anomalies can be detected by setting some threshold
Figure source [22]
Chawla and Chandola Anomaly Detection
Introduction Data Mining Methods Density-based anomaly Commute Time Approach Addressing Scalability Anomalies in Complex Data Evaluating Anomaly Detection Methods Applications Problem solutionsPCA and Subspace Method Subspace Method Algorithm Subspace Analysis Results Discussion Typical Characteristics of Anomaly Limitation of Volume Entropy Based versus Volume Based Fraud Detection Epidemeology Anomaly Detection in Climate and Weather Anomalies in Climate Validation of Anomalies
Discussion Typical Characteristics of Anomaly
Most Anomalies induce a change in distributionalaspects of packet header fields (called features)
Most important features include 5-tuple Source ampdestination IP addresses Source and destination portnumbers and IP protocol
raquo DOS attack ndash multiple source IP address concentrated on asingle destination IP address
raquo Network scan ndash dispersed distribution of destination addresses
raquo Most wormsviruses also induce some change in distribution ofcertain features
raquo However these changes can be very subtle and mining them islike searching for needles in a haystack
Unlike many previous approach this paper aims todetect events which disturb the distribution of trafficfeatures rather than traffic volume
Chawla and Chandola Anomaly Detection
Introduction Data Mining Methods Density-based anomaly Commute Time Approach Addressing Scalability Anomalies in Complex Data Evaluating Anomaly Detection Methods Applications Problem solutionsPCA and Subspace Method Subspace Method Algorithm Subspace Analysis Results Discussion Typical Characteristics of Anomaly Limitation of Volume Entropy Based versus Volume Based Fraud Detection Epidemeology Anomaly Detection in Climate and Weather Anomalies in Climate Validation of Anomalies
Limitation of Volume
Figure source [22]
Port scan anomaly (traffic feature changes however traffic volume
remains more or less the same)
We can use entropy tocapture the variationsin the traffic feature
bullTakes value 0 when distribution is maximally concentratedbullTakes value log2N when distribution is maximally dispersed
But stands out in
feature entropy
which also reveals
its structure
Port scan
dwarfed
in volume
metricshellip
Chawla and Chandola Anomaly Detection
Introduction Data Mining Methods Density-based anomaly Commute Time Approach Addressing Scalability Anomalies in Complex Data Evaluating Anomaly Detection Methods Applications Problem solutionsPCA and Subspace Method Subspace Method Algorithm Subspace Analysis Results Discussion Typical Characteristics of Anomaly Limitation of Volume Entropy Based versus Volume Based Fraud Detection Epidemeology Anomaly Detection in Climate and Weather Anomalies in Climate Validation of Anomalies
Entropy Based versus Volume Based
DoSDDoS Attacks- a spike in traffic data toward adominant destination IP
Scan anomaly-a spike in traffic data from a dominant sourceIP
Flash Crowd anomaly- again a spike in traffic data to adominant destination IP
Worm anomaly-a Spike in traffic with a dominant port
Chawla and Chandola Anomaly Detection
Introduction Data Mining Methods Density-based anomaly Commute Time Approach Addressing Scalability Anomalies in Complex Data Evaluating Anomaly Detection Methods Applications Problem solutionsPCA and Subspace Method Subspace Method Algorithm Subspace Analysis Results Discussion Typical Characteristics of Anomaly Limitation of Volume Entropy Based versus Volume Based Fraud Detection Epidemeology Anomaly Detection in Climate and Weather Anomalies in Climate Validation of Anomalies
Fraud Detection
Domain Question Identifyfraudulent activities or players fromobserved transaction data
Data Transactions between different
players in the system Meta information about the
individuals An underlying graph structure
Challenges Track and model human behavior Anomalies caused by adaptive
human adversaries Massive data sizes
Insurance (autohealtha)
ClaimantProvider Payer
Telecommunications Customer
Provider
Credit Cards Customer
Supplier Bank
Web Advertising User Advertiser
Publisher
ahttpwwwcheatingculturecompast-cases-of-medicare-fraud
Chawla and Chandola Anomaly Detection
Introduction Data Mining Methods Density-based anomaly Commute Time Approach Addressing Scalability Anomalies in Complex Data Evaluating Anomaly Detection Methods Applications Problem solutionsPCA and Subspace Method Subspace Method Algorithm Subspace Analysis Results Discussion Typical Characteristics of Anomaly Limitation of Volume Entropy Based versus Volume Based Fraud Detection Epidemeology Anomaly Detection in Climate and Weather Anomalies in Climate Validation of Anomalies
A Generic Fraud Detection Method
Activity Monitoring [13]1 Build profiles for individuals (customers users etc) based on
historic data User X makes n calls on an average in January
2 Compare current behavior with historical profile for significantdeviations
Clustering based [4]1 Cluster historical profiles of customers2 Identify small clusters or outlying profiles as anomalies
Strengths Anomaly detection is fast (good for real time) Results are easy to explain
Weaknesses Need to create and maintain a large number of profiles Not dynamic Adequate historical data might not be available Too many false positives
Chawla and Chandola Anomaly Detection
Introduction Data Mining Methods Density-based anomaly Commute Time Approach Addressing Scalability Anomalies in Complex Data Evaluating Anomaly Detection Methods Applications Problem solutionsPCA and Subspace Method Subspace Method Algorithm Subspace Analysis Results Discussion Typical Characteristics of Anomaly Limitation of Volume Entropy Based versus Volume Based Fraud Detection Epidemeology Anomaly Detection in Climate and Weather Anomalies in Climate Validation of Anomalies
Exploiting Graph Structure - Weighted Graphs
Represent data as a weighted graph Communication networks (phone email SMS) Provider referral networks
Objective Identify anomalous nodes
For each node extract several features based on the propertiesof the induced sub-graph (egonet) of neighboring nodes [1]
Choose features that can highlight anomalous nodes
1 Ni degree of node2 Ei number of edges in egonet3 Wi total weight of egonet4 λi principal eigen vector of weighted adjacency matrix of
egonet
Data is transformed into a point in a multi-dimensional space
Chawla and Chandola Anomaly Detection
Introduction Data Mining Methods Density-based anomaly Commute Time Approach Addressing Scalability Anomalies in Complex Data Evaluating Anomaly Detection Methods Applications Problem solutionsPCA and Subspace Method Subspace Method Algorithm Subspace Analysis Results Discussion Typical Characteristics of Anomaly Limitation of Volume Entropy Based versus Volume Based Fraud Detection Epidemeology Anomaly Detection in Climate and Weather Anomalies in Climate Validation of Anomalies
Identifying Anomalies
Traditional anomaly detection (lof) Can be slow but can identify any type of anomalous structure
Faster method to identify specific types of anomalousstructures
Identify relevant feature pairs and power law relationship
Eg Egonet Density Power Law Ni vs Ei - detect nearcliques and stars
Ei prop Nαi 1 le α le 2
Anomaly score for node i wrt a pair of features (y = Cxθ)
Si =max(yi Cx
θi )
min(yi Cxθi )lowast log (|yi minus Cxθi |+ 1)
Chawla and Chandola Anomaly Detection
Introduction Data Mining Methods Density-based anomaly Commute Time Approach Addressing Scalability Anomalies in Complex Data Evaluating Anomaly Detection Methods Applications Problem solutionsPCA and Subspace Method Subspace Method Algorithm Subspace Analysis Results Discussion Typical Characteristics of Anomaly Limitation of Volume Entropy Based versus Volume Based Fraud Detection Epidemeology Anomaly Detection in Climate and Weather Anomalies in Climate Validation of Anomalies
Exploiting Graph Structure - Bipartite Graphs
Represent data as a bipartite graph Healthcare Data (Beneficiaries vs Providers) Insider trading (Traders vs Stocks)
Objective Identify anomalous links
Given a query node a isin V1 find the ldquorelevancerdquoof all other nodes in V1 to a
RelevanceScore(a b) prop Number of times aldquorandom walkrdquo from a reaches b
Use the relevance scores to compute thenormality scores for a node t isin V2
Find set St = a|〈a t〉 isin E Compute |St| times |St| similarity matrix using
relevance vectors for a isin St Normality Score = mean of non-diagonal entries
of similarity matrix
V1 E V2a1
a2
a3
an
t1
t2
t3
tn
Chawla and Chandola Anomaly Detection
Introduction Data Mining Methods Density-based anomaly Commute Time Approach Addressing Scalability Anomalies in Complex Data Evaluating Anomaly Detection Methods Applications Problem solutionsPCA and Subspace Method Subspace Method Algorithm Subspace Analysis Results Discussion Typical Characteristics of Anomaly Limitation of Volume Entropy Based versus Volume Based Fraud Detection Epidemeology Anomaly Detection in Climate and Weather Anomalies in Climate Validation of Anomalies
Detecting Disease Outbreaks
Domain Question Early detection of disease
outbreaks Anthrax attack
Data Emergency department visits Grocery data (Example [14]) Clinical visits Weatherclimate data
Challenges Weak signals in the data
ED cases involving cough rArrFlu or SARS
Integration of multiple signals(lag analysis)
Account for spatial and temporalcorrelations
Chawla and Chandola Anomaly Detection
Introduction Data Mining Methods Density-based anomaly Commute Time Approach Addressing Scalability Anomalies in Complex Data Evaluating Anomaly Detection Methods Applications Problem solutionsPCA and Subspace Method Subspace Method Algorithm Subspace Analysis Results Discussion Typical Characteristics of Anomaly Limitation of Volume Entropy Based versus Volume Based Fraud Detection Epidemeology Anomaly Detection in Climate and Weather Anomalies in Climate Validation of Anomalies
Whatrsquos Significant About Recent Events (WSARE) [33]
1 Learn Bayesian network from historical data Environmental and response variables
2 Sample from the BN (DBbaseline|Current Environment)3 Compute contingency table for rules for DBbaseline andDBcurrent
Rules are single assignment rules (Xi = Y ji ) or conjunctions4 Find p-value for rules using χ2-test
Null Hypothesis Rows and columns of tables for DBbaselineand DBcurrent are independent
5 Find rule with largest p-value Repeat Step 2
Chawla and Chandola Anomaly Detection
Introduction Data Mining Methods Density-based anomaly Commute Time Approach Addressing Scalability Anomalies in Complex Data Evaluating Anomaly Detection Methods Applications Problem solutionsPCA and Subspace Method Subspace Method Algorithm Subspace Analysis Results Discussion Typical Characteristics of Anomaly Limitation of Volume Entropy Based versus Volume Based Fraud Detection Epidemeology Anomaly Detection in Climate and Weather Anomalies in Climate Validation of Anomalies
Incorporating Spatial and Temporal Relationships
WSARE does not explicitly model the spatial and temporalrelationships
What happened yesterday What happened in the adjoining neighborhood (yesterday)
Bayesian Network Spatio-Temporal (BNST) modelingframework [17]
Add nodes for temporal and spatial dependencies Need more data to train
Chawla and Chandola Anomaly Detection
Introduction Data Mining Methods Density-based anomaly Commute Time Approach Addressing Scalability Anomalies in Complex Data Evaluating Anomaly Detection Methods Applications Problem solutionsPCA and Subspace Method Subspace Method Algorithm Subspace Analysis Results Discussion Typical Characteristics of Anomaly Limitation of Volume Entropy Based versus Volume Based Fraud Detection Epidemeology Anomaly Detection in Climate and Weather Anomalies in Climate Validation of Anomalies
Anomaly Detection in Climate and Weather
Science Questions Identify natural and anthropogenic disasters Identify long time scale events - droughts atmospheric rivers
cold fronts etc
Data Ground observations Remote sensing data (satellites
air-borne) Climate model simulation outputs Multiple variables spatio-temporal (often has height dimension
as well)
Challenges Model spatio-temporal relationships across multiple variables Explain the cause of anomalies Massive data sizes
Climate and weather extreme events are well defined
Key challenge is to find significant events and explain the cause
Chawla and Chandola Anomaly Detection
Introduction Data Mining Methods Density-based anomaly Commute Time Approach Addressing Scalability Anomalies in Complex Data Evaluating Anomaly Detection Methods Applications Problem solutionsPCA and Subspace Method Subspace Method Algorithm Subspace Analysis Results Discussion Typical Characteristics of Anomaly Limitation of Volume Entropy Based versus Volume Based Fraud Detection Epidemeology Anomaly Detection in Climate and Weather Anomalies in Climate Validation of Anomalies
Anomalies are Widely Used in Climate
Most analysis done on ldquoanomalyrdquo time series
Difference from a ldquobase periodrdquo (Toosimplistic)
Brings spatial smoothness (eg a mountaintop and nearby valley can have very differenttemperatures) Removes seasonality
Understand climate and weatherphenomenon
Southern Oscillation Index (SOI) Difference between Sea Level Pressure
(SLP) anomalies for Tahiti and DarwinAustralia
Figure Global AverageTemperature Anomaly(1975 - 2007) Srcwwwmetofficegovuk
Chawla and Chandola Anomaly Detection
Introduction Data Mining Methods Density-based anomaly Commute Time Approach Addressing Scalability Anomalies in Complex Data Evaluating Anomaly Detection Methods Applications Problem solutionsPCA and Subspace Method Subspace Method Algorithm Subspace Analysis Results Discussion Typical Characteristics of Anomaly Limitation of Volume Entropy Based versus Volume Based Fraud Detection Epidemeology Anomaly Detection in Climate and Weather Anomalies in Climate Validation of Anomalies
Constructing Anomalies from Raw Data
Anomaly time series for a given location i
vprimei = vi minus bi
where bi is the base (reference)
How to choose bi Mean of all data for location i Monthly mean values (account for seasonality) Monthly z-score values Median (more robust) Using a shorter ldquoreference periodrdquo
30 year moving window
Different methods show statistically significant differences[19] What is the right strategy Weighted mean of different strategies (Pick weights using
Monte Carlo sampling)
Chawla and Chandola Anomaly Detection
Introduction Data Mining Methods Density-based anomaly Commute Time Approach Addressing Scalability Anomalies in Complex Data Evaluating Anomaly Detection Methods Applications Problem solutionsPCA and Subspace Method Subspace Method Algorithm Subspace Analysis Results Discussion Typical Characteristics of Anomaly Limitation of Volume Entropy Based versus Volume Based Fraud Detection Epidemeology Anomaly Detection in Climate and Weather Anomalies in Climate Validation of Anomalies
Anomaly Detection for Identifying Droughts
Science question Identify significant drought patterns usinghistorical observation data or future simulation data or both
Find persistent spatiotemporal anomalies in precipitation data
A two step approach
1 Find precipitationanomalies usingthresholds
2 Find large connectedcomponents across spaceand time
Matlab - bwlabelbwlabeln
Followup Science questionExplain cause
(drought190120061avi)
Figure Video courtsey Dr ArindamBanerjee
Chawla and Chandola Anomaly Detection
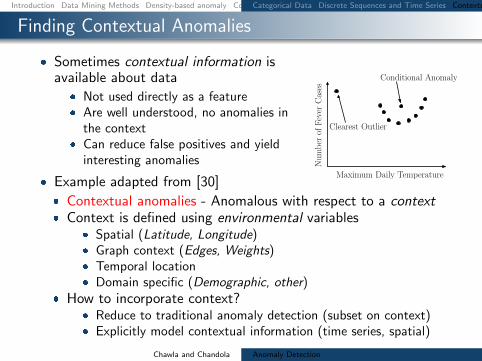
Introduction Data Mining Methods Density-based anomaly Commute Time Approach Addressing Scalability Anomalies in Complex Data Evaluating Anomaly Detection Methods Applications Problem solutionsCategorical Data Discrete Sequences and Time Series Contextual Anomalies Collective Anomalies
Finding Contextual Anomalies
Sometimes contextual information isavailable about data
Not used directly as a feature Are well understood no anomalies in
the context Can reduce false positives and yield
interesting anomalies
Example adapted from [30]
Clearest Outlier
Conditional Anomaly
Maximum Daily Temperature
Number
ofFever
Cases
Contextual anomalies - Anomalous with respect to a context Context is defined using environmental variables
Spatial (Latitude Longitude) Graph context (Edges Weights) Temporal location Domain specific (Demographic other)
How to incorporate context Reduce to traditional anomaly detection (subset on context) Explicitly model contextual information (time series spatial)
Chawla and Chandola Anomaly Detection
Introduction Data Mining Methods Density-based anomaly Commute Time Approach Addressing Scalability Anomalies in Complex Data Evaluating Anomaly Detection Methods Applications Problem solutionsCategorical Data Discrete Sequences and Time Series Contextual Anomalies Collective Anomalies
Conditional Anomaly Detection
Data instance d rArru1 u2 udU v1 v2 vdV
dU environmentalattributes
dV indicator attributes u1
u2
U1
U2
U3
v1
v2
V1V2
V3
p(V1|U3) = 02
p(V2|U3) = 02
p(V3|U3) = 06
Algorithm [30]
1 Learn a Gaussian Mixture Model (GMM)U = U1 U2 UnU
each with dimensionality dU2 Learn a set of Gaussians U = V1 V2 VnV
each withdimensionality dV
3 Learn a probabilistic mapping function p(Vj |Ui)4 Score a test instance d = [uv]
S =
nUsumi=1
p(u|Ui)nVsumj=1
p(v|Vj)p(Vj |Ui)
Chawla and Chandola Anomaly Detection
Introduction Data Mining Methods Density-based anomaly Commute Time Approach Addressing Scalability Anomalies in Complex Data Evaluating Anomaly Detection Methods Applications Problem solutionsCategorical Data Discrete Sequences and Time Series Contextual Anomalies Collective Anomalies
Finding Collective Anomalies
Find a collection of data points
Each point by itself is normal
The collection as a whole isanomalous
Relevant when data has inherentstructure and
When domain definition ofanomalies cannot be described aspoint anomalies
A Simple Solution
1 Break data intogroups
2 Compute features foreach group
3 Apply traditionalanomaly detection
Examples
1 Time series
2 Image
3 Spatial clusters ofgalaxies
Chawla and Chandola Anomaly Detection
Introduction Data Mining Methods Density-based anomaly Commute Time Approach Addressing Scalability Anomalies in Complex Data Evaluating Anomaly Detection Methods Applications Problem solutionsCategorical Data Discrete Sequences and Time Series Contextual Anomalies Collective Anomalies
Using Latent Dirichlet Allocation for Group Anomalies
Find anomalous groups in data [34]
Example Spatial clusters of galaxies topics red green emissive words continuous features
Flexible Genre Model (FGM)
For each group
1 Draw a genre 1 2 T 3 ym simM(π)2 Draw topic distribution forym SK 3 θm sim Dir(αym)
3 Draw K topicsβmk sim P (βmk|ηk)k=12K
4 For each point in group
1 Draw topic membershipzmn simM(θn)
2 Generate pointxmn isin P (xmn|βmzmn)
α
zmn
xmn
N
θm
T
π
ηK
ym
β
MK
Model Parameters
M(π) -Multinomial
Genre - Dir(αt)
Topic generatorsP (|ηk)- GIW
Point generatorsP (xmn|βnk) -MultivariateGaussian
Chawla and Chandola Anomaly Detection
Introduction Data Mining Methods Density-based anomaly Commute Time Approach Addressing Scalability Anomalies in Complex Data Evaluating Anomaly Detection Methods Applications Problem solutionsCategorical Data Discrete Sequences and Time Series Contextual Anomalies Collective Anomalies
Inference and Testing for FGM
Inference and Learning Parameters
Approximate inference of latentvariables (Gibbs Sampling)
Use samples to learn parameters(Single step Monte Carlo EM)
Topic 1
Topic 2
Topic 3
Anomaly Detection
Infer the topic distribution θm
Compute negative log likelihood wrt αt
Rationale An anomalous group will be unlikely to begenerated from any genre
Geometric interpretation Mapping each group into a Tdimensional space and finding anomalies
Chawla and Chandola Anomaly Detection
Introduction Data Mining Methods Density-based anomaly Commute Time Approach Addressing Scalability Anomalies in Complex Data Evaluating Anomaly Detection Methods Applications Problem solutions
Evaluating Anomaly Detection Methods - Labels
Labeled validation data set exists Confusion matrix Traditional evaluation metrics
Class imbalance
ROC Curve
Validation set does not exist Use domain expertise to find TP
and FP FN is harder to estimate
Pseudo false negativeestimation techniques [25]
Predicteda n
Actuala TP FNn FP TN
Acc =TP + TNsum
Rec (R) =TP
TP + FN
Prec (P ) =TP
TP + FP
F =2 lowastR lowast PR+ P
Chawla and Chandola Anomaly Detection
Introduction Data Mining Methods Density-based anomaly Commute Time Approach Addressing Scalability Anomalies in Complex Data Evaluating Anomaly Detection Methods Applications Problem solutions
Evaluating Anomaly Detection Methods - Scores
Convert to binary output Use threshold δ on score (Scale
issues [21]) Take top x as anomalies
ROC curve by varying x or δ
Quality of output Does the output ldquosuggestrdquo x or δ Which output is better
Chawla and Chandola Anomaly Detection
Introduction Data Mining Methods Density-based anomaly Commute Time Approach Addressing Scalability Anomalies in Complex Data Evaluating Anomaly Detection Methods Applications Problem solutions
Unifying Scores
Different methods assign scores in differentranges
kNN-based scores [0 1] Lof scores [1 6] ABOD scores [0 80000]
Anomalies have lower scores
Direct scaling to [0 1] might lose distinctionbetween normal and anomalies
Desired scaling Stretch interesting rangesand shrink irrelevant ones
Generalized Procedure for Normalizing Outlier Scores [21] Regularity rArr S(o) ge 0forallo S(o) asymp 0 if o is normal andS(o) 0 if o is anomalous
Normality S is regular and S(o) isin [0 1]forallo
Chawla and Chandola Anomaly Detection
Introduction Data Mining Methods Density-based anomaly Commute Time Approach Addressing Scalability Anomalies in Complex Data Evaluating Anomaly Detection Methods Applications Problem solutions
Regularization and Normalization of Scores
Regularization
1 R(o) = max0 S(o)minus baseS2 R(o) = Smax minus S(o)
3 R(o) = minus log SmaxS(o)
Normalization
1 N(o) = S(o)Smax
2 N(o) = max(
0 erf(S(o)minusmicroSσS radic2
))(Gaussian Scaling)
Suited for high dimensional data
3 N(o) = max(
0cdfγS (o)minusmicroγ
1minusmicroγ
)(Gamma Scaling)
Where cdfγS (o) = P (k S(o) θ) P is the regularized Gamma function Suited for low dimensional data
Chawla and Chandola Anomaly Detection
Introduction Data Mining Methods Density-based anomaly Commute Time Approach Addressing Scalability Anomalies in Complex Data Evaluating Anomaly Detection Methods Applications Problem solutions
Generating Labeled Data for Validation
Generating Both Normal and Anomalous Data
Use generative models for normal and anomalous behavior
Several generators available Multivariate continuous data [27] Multivariate categorical data [5] Discrete sequences using HMM [12]
Drawbacks Might not capture the domain characteristics
Injecting Anomalies - Random Perturbation[30]
Given data point z = xy x and y arepartitions of feature space
Take a random sample D of the entire data set
Let zprime = xprimeyprime isin D such that distancebetween y and yprime is maximum
Replace x with xprime and add z back to data setx
yz
zprime
Injected anomaly
Chawla and Chandola Anomaly Detection
Introduction Data Mining Methods Density-based anomaly Commute Time Approach Addressing Scalability Anomalies in Complex Data Evaluating Anomaly Detection Methods Applications Problem solutionsWhat is Network Anomaly Detection Motivation How Much Serious
Applications Overview
How to set up an anomaly detection solution for agiven application domain
Available data Define anomalies define normal behavior Identify requirements and constraints (online
real-time limited resources) What domain knowledge available
Feature identification Defining normal and anomalous behavior Tuning parameters
Available ground truth (training validation)
Chawla and Chandola Anomaly Detection
Introduction Data Mining Methods Density-based anomaly Commute Time Approach Addressing Scalability Anomalies in Complex Data Evaluating Anomaly Detection Methods Applications Problem solutionsWhat is Network Anomaly Detection Motivation How Much Serious
What is Network Anomaly Detection
Anomaly Detection or Intrusion Detection
Traditional Intrusion Detection Systems (IDS) finding attackscorresponding to predefined pattern data set known as signaturestherefore system is absolutely vulnerable against zero-day attacks
Network Anomaly Detection Systems (NADS) to detectzero-day attacks without any pre-identified signature besides profilenormal behavior of the network and address suspected incidents
Network Anomaly Detection finding unusual and largechanges in the network traffic
Examples intentional attacks (eg Distributed Denial ofService - DDoS) or unusual network traffic (eg flash crowds)
Chawla and Chandola Anomaly Detection
Introduction Data Mining Methods Density-based anomaly Commute Time Approach Addressing Scalability Anomalies in Complex Data Evaluating Anomaly Detection Methods Applications Problem solutionsWhat is Network Anomaly Detection Motivation How Much Serious
Motivation How Much Serious
According to Symantec report released in early 2011 morethan 286 million new threats have been detected in 2010which is a huge number
1656227
2704836
1000000
1500000
2000000
2500000
3000000
20547 18827 69107 113025 140690
624267
1656227
2704836
0
500000
1000000
1500000
2000000
2500000
3000000
2002 2003 2004 2005 2006 2007 2008 July2009-June2010
Chawla and Chandola Anomaly Detection
Introduction Data Mining Methods Density-based anomaly Commute Time Approach Addressing Scalability Anomalies in Complex Data Evaluating Anomaly Detection Methods Applications Problem solutionsNetwork Topology Network Anomalies Detection Problem Network Anomalies Detection Problem Why care about OD Flows
Network Topology
A Typical network
1 y
Router
2
3
41t
x2t
x1t
x3t
x4t
Origin-Destination (OD) flow is the traffic that enters at anorigin node and exits at a destination node of a backbonenetwork x1t x1t
Link measurement is the traffic enters at an node during aninterval y1t
Relationship between link traffic and OD flow traffic iscaptured by the routing matrix A
Chawla and Chandola Anomaly Detection
Introduction Data Mining Methods Density-based anomaly Commute Time Approach Addressing Scalability Anomalies in Complex Data Evaluating Anomaly Detection Methods Applications Problem solutionsNetwork Topology Network Anomalies Detection Problem Network Anomalies Detection Problem Why care about OD Flows
Network Anomalies Detection Problem
Chawla and Chandola Anomaly Detection
Introduction Data Mining Methods Density-based anomaly Commute Time Approach Addressing Scalability Anomalies in Complex Data Evaluating Anomaly Detection Methods Applications Problem solutionsNetwork Topology Network Anomalies Detection Problem Network Anomalies Detection Problem Why care about OD Flows
Network Anomalies Detection Problem
Chawla and Chandola Anomaly Detection
Introduction Data Mining Methods Density-based anomaly Commute Time Approach Addressing Scalability Anomalies in Complex Data Evaluating Anomaly Detection Methods Applications Problem solutionsNetwork Topology Network Anomalies Detection Problem Network Anomalies Detection Problem Why care about OD Flows
Why care about OD Flows
Volume anomaly typically arises on an OD flow (trafficarriving at one node and destined for another node)
If we only monitor traffic on network links volume arisingfrom an OD flow may not be noticeable Thus naiveapproach wont work if OD flow info is not available
Figure source [22]
Chawla and Chandola Anomaly Detection
Introduction Data Mining Methods Density-based anomaly Commute Time Approach Addressing Scalability Anomalies in Complex Data Evaluating Anomaly Detection Methods Applications Problem solutionsPCA and Subspace Method Subspace Method Algorithm Subspace Analysis Results Discussion Typical Characteristics of Anomaly Limitation of Volume Entropy Based versus Volume Based Fraud Detection Epidemeology Anomaly Detection in Climate and Weather Anomalies in Climate Validation of Anomalies
PCA and Subspace Method
Chawla and Chandola Anomaly Detection
Introduction Data Mining Methods Density-based anomaly Commute Time Approach Addressing Scalability Anomalies in Complex Data Evaluating Anomaly Detection Methods Applications Problem solutionsPCA and Subspace Method Subspace Method Algorithm Subspace Analysis Results Discussion Typical Characteristics of Anomaly Limitation of Volume Entropy Based versus Volume Based Fraud Detection Epidemeology Anomaly Detection in Climate and Weather Anomalies in Climate Validation of Anomalies
Subspace Method Algorithm
Step1- Determine the PCs based on eigenvaluedecomposition of the covariance matrix of the dataset
Step2- Choose first top k principle components with thehighest eigenvalues as matrix P
Step3-normal traffic subspace called Z
Z = PP TZ = CZ
Step4-abnormal traffic subspace called Z
Z = (I minus PP T )Z = CZ
Step5-If the norm of a vector is large then it is an rdquoanomalyrdquo
Chawla and Chandola Anomaly Detection
Introduction Data Mining Methods Density-based anomaly Commute Time Approach Addressing Scalability Anomalies in Complex Data Evaluating Anomaly Detection Methods Applications Problem solutionsPCA and Subspace Method Subspace Method Algorithm Subspace Analysis Results Discussion Typical Characteristics of Anomaly Limitation of Volume Entropy Based versus Volume Based Fraud Detection Epidemeology Anomaly Detection in Climate and Weather Anomalies in Climate Validation of Anomalies
Subspace Analysis Results
Note that during anomaly normal component does not changethat much while residual component changes quite a lot
Thus anomalies can be detected by setting some threshold
Figure source [22]
Chawla and Chandola Anomaly Detection
Introduction Data Mining Methods Density-based anomaly Commute Time Approach Addressing Scalability Anomalies in Complex Data Evaluating Anomaly Detection Methods Applications Problem solutionsPCA and Subspace Method Subspace Method Algorithm Subspace Analysis Results Discussion Typical Characteristics of Anomaly Limitation of Volume Entropy Based versus Volume Based Fraud Detection Epidemeology Anomaly Detection in Climate and Weather Anomalies in Climate Validation of Anomalies
Discussion Typical Characteristics of Anomaly
Most Anomalies induce a change in distributionalaspects of packet header fields (called features)
Most important features include 5-tuple Source ampdestination IP addresses Source and destination portnumbers and IP protocol
raquo DOS attack ndash multiple source IP address concentrated on asingle destination IP address
raquo Network scan ndash dispersed distribution of destination addresses
raquo Most wormsviruses also induce some change in distribution ofcertain features
raquo However these changes can be very subtle and mining them islike searching for needles in a haystack
Unlike many previous approach this paper aims todetect events which disturb the distribution of trafficfeatures rather than traffic volume
Chawla and Chandola Anomaly Detection
Introduction Data Mining Methods Density-based anomaly Commute Time Approach Addressing Scalability Anomalies in Complex Data Evaluating Anomaly Detection Methods Applications Problem solutionsPCA and Subspace Method Subspace Method Algorithm Subspace Analysis Results Discussion Typical Characteristics of Anomaly Limitation of Volume Entropy Based versus Volume Based Fraud Detection Epidemeology Anomaly Detection in Climate and Weather Anomalies in Climate Validation of Anomalies
Limitation of Volume
Figure source [22]
Port scan anomaly (traffic feature changes however traffic volume
remains more or less the same)
We can use entropy tocapture the variationsin the traffic feature
bullTakes value 0 when distribution is maximally concentratedbullTakes value log2N when distribution is maximally dispersed
But stands out in
feature entropy
which also reveals
its structure
Port scan
dwarfed
in volume
metricshellip
Chawla and Chandola Anomaly Detection
Introduction Data Mining Methods Density-based anomaly Commute Time Approach Addressing Scalability Anomalies in Complex Data Evaluating Anomaly Detection Methods Applications Problem solutionsPCA and Subspace Method Subspace Method Algorithm Subspace Analysis Results Discussion Typical Characteristics of Anomaly Limitation of Volume Entropy Based versus Volume Based Fraud Detection Epidemeology Anomaly Detection in Climate and Weather Anomalies in Climate Validation of Anomalies
Entropy Based versus Volume Based
DoSDDoS Attacks- a spike in traffic data toward adominant destination IP
Scan anomaly-a spike in traffic data from a dominant sourceIP
Flash Crowd anomaly- again a spike in traffic data to adominant destination IP
Worm anomaly-a Spike in traffic with a dominant port
Chawla and Chandola Anomaly Detection
Introduction Data Mining Methods Density-based anomaly Commute Time Approach Addressing Scalability Anomalies in Complex Data Evaluating Anomaly Detection Methods Applications Problem solutionsPCA and Subspace Method Subspace Method Algorithm Subspace Analysis Results Discussion Typical Characteristics of Anomaly Limitation of Volume Entropy Based versus Volume Based Fraud Detection Epidemeology Anomaly Detection in Climate and Weather Anomalies in Climate Validation of Anomalies
Fraud Detection
Domain Question Identifyfraudulent activities or players fromobserved transaction data
Data Transactions between different
players in the system Meta information about the
individuals An underlying graph structure
Challenges Track and model human behavior Anomalies caused by adaptive
human adversaries Massive data sizes
Insurance (autohealtha)
ClaimantProvider Payer
Telecommunications Customer
Provider
Credit Cards Customer
Supplier Bank
Web Advertising User Advertiser
Publisher
ahttpwwwcheatingculturecompast-cases-of-medicare-fraud
Chawla and Chandola Anomaly Detection
Introduction Data Mining Methods Density-based anomaly Commute Time Approach Addressing Scalability Anomalies in Complex Data Evaluating Anomaly Detection Methods Applications Problem solutionsPCA and Subspace Method Subspace Method Algorithm Subspace Analysis Results Discussion Typical Characteristics of Anomaly Limitation of Volume Entropy Based versus Volume Based Fraud Detection Epidemeology Anomaly Detection in Climate and Weather Anomalies in Climate Validation of Anomalies
A Generic Fraud Detection Method
Activity Monitoring [13]1 Build profiles for individuals (customers users etc) based on
historic data User X makes n calls on an average in January
2 Compare current behavior with historical profile for significantdeviations
Clustering based [4]1 Cluster historical profiles of customers2 Identify small clusters or outlying profiles as anomalies
Strengths Anomaly detection is fast (good for real time) Results are easy to explain
Weaknesses Need to create and maintain a large number of profiles Not dynamic Adequate historical data might not be available Too many false positives
Chawla and Chandola Anomaly Detection
Introduction Data Mining Methods Density-based anomaly Commute Time Approach Addressing Scalability Anomalies in Complex Data Evaluating Anomaly Detection Methods Applications Problem solutionsPCA and Subspace Method Subspace Method Algorithm Subspace Analysis Results Discussion Typical Characteristics of Anomaly Limitation of Volume Entropy Based versus Volume Based Fraud Detection Epidemeology Anomaly Detection in Climate and Weather Anomalies in Climate Validation of Anomalies
Exploiting Graph Structure - Weighted Graphs
Represent data as a weighted graph Communication networks (phone email SMS) Provider referral networks
Objective Identify anomalous nodes
For each node extract several features based on the propertiesof the induced sub-graph (egonet) of neighboring nodes [1]
Choose features that can highlight anomalous nodes
1 Ni degree of node2 Ei number of edges in egonet3 Wi total weight of egonet4 λi principal eigen vector of weighted adjacency matrix of
egonet
Data is transformed into a point in a multi-dimensional space
Chawla and Chandola Anomaly Detection
Introduction Data Mining Methods Density-based anomaly Commute Time Approach Addressing Scalability Anomalies in Complex Data Evaluating Anomaly Detection Methods Applications Problem solutionsPCA and Subspace Method Subspace Method Algorithm Subspace Analysis Results Discussion Typical Characteristics of Anomaly Limitation of Volume Entropy Based versus Volume Based Fraud Detection Epidemeology Anomaly Detection in Climate and Weather Anomalies in Climate Validation of Anomalies
Identifying Anomalies
Traditional anomaly detection (lof) Can be slow but can identify any type of anomalous structure
Faster method to identify specific types of anomalousstructures
Identify relevant feature pairs and power law relationship
Eg Egonet Density Power Law Ni vs Ei - detect nearcliques and stars
Ei prop Nαi 1 le α le 2
Anomaly score for node i wrt a pair of features (y = Cxθ)
Si =max(yi Cx
θi )
min(yi Cxθi )lowast log (|yi minus Cxθi |+ 1)
Chawla and Chandola Anomaly Detection
Introduction Data Mining Methods Density-based anomaly Commute Time Approach Addressing Scalability Anomalies in Complex Data Evaluating Anomaly Detection Methods Applications Problem solutionsPCA and Subspace Method Subspace Method Algorithm Subspace Analysis Results Discussion Typical Characteristics of Anomaly Limitation of Volume Entropy Based versus Volume Based Fraud Detection Epidemeology Anomaly Detection in Climate and Weather Anomalies in Climate Validation of Anomalies
Exploiting Graph Structure - Bipartite Graphs
Represent data as a bipartite graph Healthcare Data (Beneficiaries vs Providers) Insider trading (Traders vs Stocks)
Objective Identify anomalous links
Given a query node a isin V1 find the ldquorelevancerdquoof all other nodes in V1 to a
RelevanceScore(a b) prop Number of times aldquorandom walkrdquo from a reaches b
Use the relevance scores to compute thenormality scores for a node t isin V2
Find set St = a|〈a t〉 isin E Compute |St| times |St| similarity matrix using
relevance vectors for a isin St Normality Score = mean of non-diagonal entries
of similarity matrix
V1 E V2a1
a2
a3
an
t1
t2
t3
tn
Chawla and Chandola Anomaly Detection
Introduction Data Mining Methods Density-based anomaly Commute Time Approach Addressing Scalability Anomalies in Complex Data Evaluating Anomaly Detection Methods Applications Problem solutionsPCA and Subspace Method Subspace Method Algorithm Subspace Analysis Results Discussion Typical Characteristics of Anomaly Limitation of Volume Entropy Based versus Volume Based Fraud Detection Epidemeology Anomaly Detection in Climate and Weather Anomalies in Climate Validation of Anomalies
Detecting Disease Outbreaks
Domain Question Early detection of disease
outbreaks Anthrax attack
Data Emergency department visits Grocery data (Example [14]) Clinical visits Weatherclimate data
Challenges Weak signals in the data
ED cases involving cough rArrFlu or SARS
Integration of multiple signals(lag analysis)
Account for spatial and temporalcorrelations
Chawla and Chandola Anomaly Detection
Introduction Data Mining Methods Density-based anomaly Commute Time Approach Addressing Scalability Anomalies in Complex Data Evaluating Anomaly Detection Methods Applications Problem solutionsPCA and Subspace Method Subspace Method Algorithm Subspace Analysis Results Discussion Typical Characteristics of Anomaly Limitation of Volume Entropy Based versus Volume Based Fraud Detection Epidemeology Anomaly Detection in Climate and Weather Anomalies in Climate Validation of Anomalies
Whatrsquos Significant About Recent Events (WSARE) [33]
1 Learn Bayesian network from historical data Environmental and response variables
2 Sample from the BN (DBbaseline|Current Environment)3 Compute contingency table for rules for DBbaseline andDBcurrent
Rules are single assignment rules (Xi = Y ji ) or conjunctions4 Find p-value for rules using χ2-test
Null Hypothesis Rows and columns of tables for DBbaselineand DBcurrent are independent
5 Find rule with largest p-value Repeat Step 2
Chawla and Chandola Anomaly Detection
Introduction Data Mining Methods Density-based anomaly Commute Time Approach Addressing Scalability Anomalies in Complex Data Evaluating Anomaly Detection Methods Applications Problem solutionsPCA and Subspace Method Subspace Method Algorithm Subspace Analysis Results Discussion Typical Characteristics of Anomaly Limitation of Volume Entropy Based versus Volume Based Fraud Detection Epidemeology Anomaly Detection in Climate and Weather Anomalies in Climate Validation of Anomalies
Incorporating Spatial and Temporal Relationships
WSARE does not explicitly model the spatial and temporalrelationships
What happened yesterday What happened in the adjoining neighborhood (yesterday)
Bayesian Network Spatio-Temporal (BNST) modelingframework [17]
Add nodes for temporal and spatial dependencies Need more data to train
Chawla and Chandola Anomaly Detection
Introduction Data Mining Methods Density-based anomaly Commute Time Approach Addressing Scalability Anomalies in Complex Data Evaluating Anomaly Detection Methods Applications Problem solutionsPCA and Subspace Method Subspace Method Algorithm Subspace Analysis Results Discussion Typical Characteristics of Anomaly Limitation of Volume Entropy Based versus Volume Based Fraud Detection Epidemeology Anomaly Detection in Climate and Weather Anomalies in Climate Validation of Anomalies
Anomaly Detection in Climate and Weather
Science Questions Identify natural and anthropogenic disasters Identify long time scale events - droughts atmospheric rivers
cold fronts etc
Data Ground observations Remote sensing data (satellites
air-borne) Climate model simulation outputs Multiple variables spatio-temporal (often has height dimension
as well)
Challenges Model spatio-temporal relationships across multiple variables Explain the cause of anomalies Massive data sizes
Climate and weather extreme events are well defined
Key challenge is to find significant events and explain the cause
Chawla and Chandola Anomaly Detection
Introduction Data Mining Methods Density-based anomaly Commute Time Approach Addressing Scalability Anomalies in Complex Data Evaluating Anomaly Detection Methods Applications Problem solutionsPCA and Subspace Method Subspace Method Algorithm Subspace Analysis Results Discussion Typical Characteristics of Anomaly Limitation of Volume Entropy Based versus Volume Based Fraud Detection Epidemeology Anomaly Detection in Climate and Weather Anomalies in Climate Validation of Anomalies
Anomalies are Widely Used in Climate
Most analysis done on ldquoanomalyrdquo time series
Difference from a ldquobase periodrdquo (Toosimplistic)
Brings spatial smoothness (eg a mountaintop and nearby valley can have very differenttemperatures) Removes seasonality
Understand climate and weatherphenomenon
Southern Oscillation Index (SOI) Difference between Sea Level Pressure
(SLP) anomalies for Tahiti and DarwinAustralia
Figure Global AverageTemperature Anomaly(1975 - 2007) Srcwwwmetofficegovuk
Chawla and Chandola Anomaly Detection
Introduction Data Mining Methods Density-based anomaly Commute Time Approach Addressing Scalability Anomalies in Complex Data Evaluating Anomaly Detection Methods Applications Problem solutionsPCA and Subspace Method Subspace Method Algorithm Subspace Analysis Results Discussion Typical Characteristics of Anomaly Limitation of Volume Entropy Based versus Volume Based Fraud Detection Epidemeology Anomaly Detection in Climate and Weather Anomalies in Climate Validation of Anomalies
Constructing Anomalies from Raw Data
Anomaly time series for a given location i
vprimei = vi minus bi
where bi is the base (reference)
How to choose bi Mean of all data for location i Monthly mean values (account for seasonality) Monthly z-score values Median (more robust) Using a shorter ldquoreference periodrdquo
30 year moving window
Different methods show statistically significant differences[19] What is the right strategy Weighted mean of different strategies (Pick weights using
Monte Carlo sampling)
Chawla and Chandola Anomaly Detection
Introduction Data Mining Methods Density-based anomaly Commute Time Approach Addressing Scalability Anomalies in Complex Data Evaluating Anomaly Detection Methods Applications Problem solutionsPCA and Subspace Method Subspace Method Algorithm Subspace Analysis Results Discussion Typical Characteristics of Anomaly Limitation of Volume Entropy Based versus Volume Based Fraud Detection Epidemeology Anomaly Detection in Climate and Weather Anomalies in Climate Validation of Anomalies
Anomaly Detection for Identifying Droughts
Science question Identify significant drought patterns usinghistorical observation data or future simulation data or both
Find persistent spatiotemporal anomalies in precipitation data
A two step approach
1 Find precipitationanomalies usingthresholds
2 Find large connectedcomponents across spaceand time
Matlab - bwlabelbwlabeln
Followup Science questionExplain cause
(drought190120061avi)
Figure Video courtsey Dr ArindamBanerjee
Chawla and Chandola Anomaly Detection
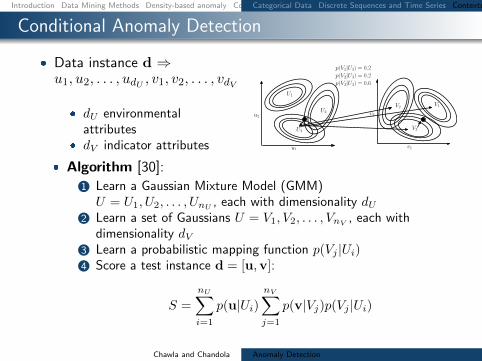
Introduction Data Mining Methods Density-based anomaly Commute Time Approach Addressing Scalability Anomalies in Complex Data Evaluating Anomaly Detection Methods Applications Problem solutionsCategorical Data Discrete Sequences and Time Series Contextual Anomalies Collective Anomalies
Finding Collective Anomalies
Find a collection of data points
Each point by itself is normal
The collection as a whole isanomalous
Relevant when data has inherentstructure and
When domain definition ofanomalies cannot be described aspoint anomalies
A Simple Solution
1 Break data intogroups
2 Compute features foreach group
3 Apply traditionalanomaly detection
Examples
1 Time series
2 Image
3 Spatial clusters ofgalaxies
Chawla and Chandola Anomaly Detection
Introduction Data Mining Methods Density-based anomaly Commute Time Approach Addressing Scalability Anomalies in Complex Data Evaluating Anomaly Detection Methods Applications Problem solutionsCategorical Data Discrete Sequences and Time Series Contextual Anomalies Collective Anomalies
Using Latent Dirichlet Allocation for Group Anomalies
Find anomalous groups in data [34]
Example Spatial clusters of galaxies topics red green emissive words continuous features
Flexible Genre Model (FGM)
For each group
1 Draw a genre 1 2 T 3 ym simM(π)2 Draw topic distribution forym SK 3 θm sim Dir(αym)
3 Draw K topicsβmk sim P (βmk|ηk)k=12K
4 For each point in group
1 Draw topic membershipzmn simM(θn)
2 Generate pointxmn isin P (xmn|βmzmn)
α
zmn
xmn
N
θm
T
π
ηK
ym
β
MK
Model Parameters
M(π) -Multinomial
Genre - Dir(αt)
Topic generatorsP (|ηk)- GIW
Point generatorsP (xmn|βnk) -MultivariateGaussian
Chawla and Chandola Anomaly Detection
Introduction Data Mining Methods Density-based anomaly Commute Time Approach Addressing Scalability Anomalies in Complex Data Evaluating Anomaly Detection Methods Applications Problem solutionsCategorical Data Discrete Sequences and Time Series Contextual Anomalies Collective Anomalies
Inference and Testing for FGM
Inference and Learning Parameters
Approximate inference of latentvariables (Gibbs Sampling)
Use samples to learn parameters(Single step Monte Carlo EM)
Topic 1
Topic 2
Topic 3
Anomaly Detection
Infer the topic distribution θm
Compute negative log likelihood wrt αt
Rationale An anomalous group will be unlikely to begenerated from any genre
Geometric interpretation Mapping each group into a Tdimensional space and finding anomalies
Chawla and Chandola Anomaly Detection
Introduction Data Mining Methods Density-based anomaly Commute Time Approach Addressing Scalability Anomalies in Complex Data Evaluating Anomaly Detection Methods Applications Problem solutions
Evaluating Anomaly Detection Methods - Labels
Labeled validation data set exists Confusion matrix Traditional evaluation metrics
Class imbalance
ROC Curve
Validation set does not exist Use domain expertise to find TP
and FP FN is harder to estimate
Pseudo false negativeestimation techniques [25]
Predicteda n
Actuala TP FNn FP TN
Acc =TP + TNsum
Rec (R) =TP
TP + FN
Prec (P ) =TP
TP + FP
F =2 lowastR lowast PR+ P
Chawla and Chandola Anomaly Detection
Introduction Data Mining Methods Density-based anomaly Commute Time Approach Addressing Scalability Anomalies in Complex Data Evaluating Anomaly Detection Methods Applications Problem solutions
Evaluating Anomaly Detection Methods - Scores
Convert to binary output Use threshold δ on score (Scale
issues [21]) Take top x as anomalies
ROC curve by varying x or δ
Quality of output Does the output ldquosuggestrdquo x or δ Which output is better
Chawla and Chandola Anomaly Detection
Introduction Data Mining Methods Density-based anomaly Commute Time Approach Addressing Scalability Anomalies in Complex Data Evaluating Anomaly Detection Methods Applications Problem solutions
Unifying Scores
Different methods assign scores in differentranges
kNN-based scores [0 1] Lof scores [1 6] ABOD scores [0 80000]
Anomalies have lower scores
Direct scaling to [0 1] might lose distinctionbetween normal and anomalies
Desired scaling Stretch interesting rangesand shrink irrelevant ones
Generalized Procedure for Normalizing Outlier Scores [21] Regularity rArr S(o) ge 0forallo S(o) asymp 0 if o is normal andS(o) 0 if o is anomalous
Normality S is regular and S(o) isin [0 1]forallo
Chawla and Chandola Anomaly Detection
Introduction Data Mining Methods Density-based anomaly Commute Time Approach Addressing Scalability Anomalies in Complex Data Evaluating Anomaly Detection Methods Applications Problem solutions
Regularization and Normalization of Scores
Regularization
1 R(o) = max0 S(o)minus baseS2 R(o) = Smax minus S(o)
3 R(o) = minus log SmaxS(o)
Normalization
1 N(o) = S(o)Smax
2 N(o) = max(
0 erf(S(o)minusmicroSσS radic2
))(Gaussian Scaling)
Suited for high dimensional data
3 N(o) = max(
0cdfγS (o)minusmicroγ
1minusmicroγ
)(Gamma Scaling)
Where cdfγS (o) = P (k S(o) θ) P is the regularized Gamma function Suited for low dimensional data
Chawla and Chandola Anomaly Detection
Introduction Data Mining Methods Density-based anomaly Commute Time Approach Addressing Scalability Anomalies in Complex Data Evaluating Anomaly Detection Methods Applications Problem solutions
Generating Labeled Data for Validation
Generating Both Normal and Anomalous Data
Use generative models for normal and anomalous behavior
Several generators available Multivariate continuous data [27] Multivariate categorical data [5] Discrete sequences using HMM [12]
Drawbacks Might not capture the domain characteristics
Injecting Anomalies - Random Perturbation[30]
Given data point z = xy x and y arepartitions of feature space
Take a random sample D of the entire data set
Let zprime = xprimeyprime isin D such that distancebetween y and yprime is maximum
Replace x with xprime and add z back to data setx
yz
zprime
Injected anomaly
Chawla and Chandola Anomaly Detection
Introduction Data Mining Methods Density-based anomaly Commute Time Approach Addressing Scalability Anomalies in Complex Data Evaluating Anomaly Detection Methods Applications Problem solutionsWhat is Network Anomaly Detection Motivation How Much Serious
Applications Overview
How to set up an anomaly detection solution for agiven application domain
Available data Define anomalies define normal behavior Identify requirements and constraints (online
real-time limited resources) What domain knowledge available
Feature identification Defining normal and anomalous behavior Tuning parameters
Available ground truth (training validation)
Chawla and Chandola Anomaly Detection
Introduction Data Mining Methods Density-based anomaly Commute Time Approach Addressing Scalability Anomalies in Complex Data Evaluating Anomaly Detection Methods Applications Problem solutionsWhat is Network Anomaly Detection Motivation How Much Serious
What is Network Anomaly Detection
Anomaly Detection or Intrusion Detection
Traditional Intrusion Detection Systems (IDS) finding attackscorresponding to predefined pattern data set known as signaturestherefore system is absolutely vulnerable against zero-day attacks
Network Anomaly Detection Systems (NADS) to detectzero-day attacks without any pre-identified signature besides profilenormal behavior of the network and address suspected incidents
Network Anomaly Detection finding unusual and largechanges in the network traffic
Examples intentional attacks (eg Distributed Denial ofService - DDoS) or unusual network traffic (eg flash crowds)
Chawla and Chandola Anomaly Detection
Introduction Data Mining Methods Density-based anomaly Commute Time Approach Addressing Scalability Anomalies in Complex Data Evaluating Anomaly Detection Methods Applications Problem solutionsWhat is Network Anomaly Detection Motivation How Much Serious
Motivation How Much Serious
According to Symantec report released in early 2011 morethan 286 million new threats have been detected in 2010which is a huge number
1656227
2704836
1000000
1500000
2000000
2500000
3000000
20547 18827 69107 113025 140690
624267
1656227
2704836
0
500000
1000000
1500000
2000000
2500000
3000000
2002 2003 2004 2005 2006 2007 2008 July2009-June2010
Chawla and Chandola Anomaly Detection
Introduction Data Mining Methods Density-based anomaly Commute Time Approach Addressing Scalability Anomalies in Complex Data Evaluating Anomaly Detection Methods Applications Problem solutionsNetwork Topology Network Anomalies Detection Problem Network Anomalies Detection Problem Why care about OD Flows
Network Topology
A Typical network
1 y
Router
2
3
41t
x2t
x1t
x3t
x4t
Origin-Destination (OD) flow is the traffic that enters at anorigin node and exits at a destination node of a backbonenetwork x1t x1t
Link measurement is the traffic enters at an node during aninterval y1t
Relationship between link traffic and OD flow traffic iscaptured by the routing matrix A
Chawla and Chandola Anomaly Detection
Introduction Data Mining Methods Density-based anomaly Commute Time Approach Addressing Scalability Anomalies in Complex Data Evaluating Anomaly Detection Methods Applications Problem solutionsNetwork Topology Network Anomalies Detection Problem Network Anomalies Detection Problem Why care about OD Flows
Network Anomalies Detection Problem
Chawla and Chandola Anomaly Detection
Introduction Data Mining Methods Density-based anomaly Commute Time Approach Addressing Scalability Anomalies in Complex Data Evaluating Anomaly Detection Methods Applications Problem solutionsNetwork Topology Network Anomalies Detection Problem Network Anomalies Detection Problem Why care about OD Flows
Network Anomalies Detection Problem
Chawla and Chandola Anomaly Detection
Introduction Data Mining Methods Density-based anomaly Commute Time Approach Addressing Scalability Anomalies in Complex Data Evaluating Anomaly Detection Methods Applications Problem solutionsNetwork Topology Network Anomalies Detection Problem Network Anomalies Detection Problem Why care about OD Flows
Why care about OD Flows
Volume anomaly typically arises on an OD flow (trafficarriving at one node and destined for another node)
If we only monitor traffic on network links volume arisingfrom an OD flow may not be noticeable Thus naiveapproach wont work if OD flow info is not available
Figure source [22]
Chawla and Chandola Anomaly Detection
Introduction Data Mining Methods Density-based anomaly Commute Time Approach Addressing Scalability Anomalies in Complex Data Evaluating Anomaly Detection Methods Applications Problem solutionsPCA and Subspace Method Subspace Method Algorithm Subspace Analysis Results Discussion Typical Characteristics of Anomaly Limitation of Volume Entropy Based versus Volume Based Fraud Detection Epidemeology Anomaly Detection in Climate and Weather Anomalies in Climate Validation of Anomalies
PCA and Subspace Method
Chawla and Chandola Anomaly Detection
Introduction Data Mining Methods Density-based anomaly Commute Time Approach Addressing Scalability Anomalies in Complex Data Evaluating Anomaly Detection Methods Applications Problem solutionsPCA and Subspace Method Subspace Method Algorithm Subspace Analysis Results Discussion Typical Characteristics of Anomaly Limitation of Volume Entropy Based versus Volume Based Fraud Detection Epidemeology Anomaly Detection in Climate and Weather Anomalies in Climate Validation of Anomalies
Subspace Method Algorithm
Step1- Determine the PCs based on eigenvaluedecomposition of the covariance matrix of the dataset
Step2- Choose first top k principle components with thehighest eigenvalues as matrix P
Step3-normal traffic subspace called Z
Z = PP TZ = CZ
Step4-abnormal traffic subspace called Z
Z = (I minus PP T )Z = CZ
Step5-If the norm of a vector is large then it is an rdquoanomalyrdquo
Chawla and Chandola Anomaly Detection
Introduction Data Mining Methods Density-based anomaly Commute Time Approach Addressing Scalability Anomalies in Complex Data Evaluating Anomaly Detection Methods Applications Problem solutionsPCA and Subspace Method Subspace Method Algorithm Subspace Analysis Results Discussion Typical Characteristics of Anomaly Limitation of Volume Entropy Based versus Volume Based Fraud Detection Epidemeology Anomaly Detection in Climate and Weather Anomalies in Climate Validation of Anomalies
Subspace Analysis Results
Note that during anomaly normal component does not changethat much while residual component changes quite a lot
Thus anomalies can be detected by setting some threshold
Figure source [22]
Chawla and Chandola Anomaly Detection
Introduction Data Mining Methods Density-based anomaly Commute Time Approach Addressing Scalability Anomalies in Complex Data Evaluating Anomaly Detection Methods Applications Problem solutionsPCA and Subspace Method Subspace Method Algorithm Subspace Analysis Results Discussion Typical Characteristics of Anomaly Limitation of Volume Entropy Based versus Volume Based Fraud Detection Epidemeology Anomaly Detection in Climate and Weather Anomalies in Climate Validation of Anomalies
Discussion Typical Characteristics of Anomaly
Most Anomalies induce a change in distributionalaspects of packet header fields (called features)
Most important features include 5-tuple Source ampdestination IP addresses Source and destination portnumbers and IP protocol
raquo DOS attack ndash multiple source IP address concentrated on asingle destination IP address
raquo Network scan ndash dispersed distribution of destination addresses
raquo Most wormsviruses also induce some change in distribution ofcertain features
raquo However these changes can be very subtle and mining them islike searching for needles in a haystack
Unlike many previous approach this paper aims todetect events which disturb the distribution of trafficfeatures rather than traffic volume
Chawla and Chandola Anomaly Detection
Introduction Data Mining Methods Density-based anomaly Commute Time Approach Addressing Scalability Anomalies in Complex Data Evaluating Anomaly Detection Methods Applications Problem solutionsPCA and Subspace Method Subspace Method Algorithm Subspace Analysis Results Discussion Typical Characteristics of Anomaly Limitation of Volume Entropy Based versus Volume Based Fraud Detection Epidemeology Anomaly Detection in Climate and Weather Anomalies in Climate Validation of Anomalies
Limitation of Volume
Figure source [22]
Port scan anomaly (traffic feature changes however traffic volume
remains more or less the same)
We can use entropy tocapture the variationsin the traffic feature
bullTakes value 0 when distribution is maximally concentratedbullTakes value log2N when distribution is maximally dispersed
But stands out in
feature entropy
which also reveals
its structure
Port scan
dwarfed
in volume
metricshellip
Chawla and Chandola Anomaly Detection
Introduction Data Mining Methods Density-based anomaly Commute Time Approach Addressing Scalability Anomalies in Complex Data Evaluating Anomaly Detection Methods Applications Problem solutionsPCA and Subspace Method Subspace Method Algorithm Subspace Analysis Results Discussion Typical Characteristics of Anomaly Limitation of Volume Entropy Based versus Volume Based Fraud Detection Epidemeology Anomaly Detection in Climate and Weather Anomalies in Climate Validation of Anomalies
Entropy Based versus Volume Based
DoSDDoS Attacks- a spike in traffic data toward adominant destination IP
Scan anomaly-a spike in traffic data from a dominant sourceIP
Flash Crowd anomaly- again a spike in traffic data to adominant destination IP
Worm anomaly-a Spike in traffic with a dominant port
Chawla and Chandola Anomaly Detection
Introduction Data Mining Methods Density-based anomaly Commute Time Approach Addressing Scalability Anomalies in Complex Data Evaluating Anomaly Detection Methods Applications Problem solutionsPCA and Subspace Method Subspace Method Algorithm Subspace Analysis Results Discussion Typical Characteristics of Anomaly Limitation of Volume Entropy Based versus Volume Based Fraud Detection Epidemeology Anomaly Detection in Climate and Weather Anomalies in Climate Validation of Anomalies
Fraud Detection
Domain Question Identifyfraudulent activities or players fromobserved transaction data
Data Transactions between different
players in the system Meta information about the
individuals An underlying graph structure
Challenges Track and model human behavior Anomalies caused by adaptive
human adversaries Massive data sizes
Insurance (autohealtha)
ClaimantProvider Payer
Telecommunications Customer
Provider
Credit Cards Customer
Supplier Bank
Web Advertising User Advertiser
Publisher
ahttpwwwcheatingculturecompast-cases-of-medicare-fraud
Chawla and Chandola Anomaly Detection
Introduction Data Mining Methods Density-based anomaly Commute Time Approach Addressing Scalability Anomalies in Complex Data Evaluating Anomaly Detection Methods Applications Problem solutionsPCA and Subspace Method Subspace Method Algorithm Subspace Analysis Results Discussion Typical Characteristics of Anomaly Limitation of Volume Entropy Based versus Volume Based Fraud Detection Epidemeology Anomaly Detection in Climate and Weather Anomalies in Climate Validation of Anomalies
A Generic Fraud Detection Method
Activity Monitoring [13]1 Build profiles for individuals (customers users etc) based on
historic data User X makes n calls on an average in January
2 Compare current behavior with historical profile for significantdeviations
Clustering based [4]1 Cluster historical profiles of customers2 Identify small clusters or outlying profiles as anomalies
Strengths Anomaly detection is fast (good for real time) Results are easy to explain
Weaknesses Need to create and maintain a large number of profiles Not dynamic Adequate historical data might not be available Too many false positives
Chawla and Chandola Anomaly Detection
Introduction Data Mining Methods Density-based anomaly Commute Time Approach Addressing Scalability Anomalies in Complex Data Evaluating Anomaly Detection Methods Applications Problem solutionsPCA and Subspace Method Subspace Method Algorithm Subspace Analysis Results Discussion Typical Characteristics of Anomaly Limitation of Volume Entropy Based versus Volume Based Fraud Detection Epidemeology Anomaly Detection in Climate and Weather Anomalies in Climate Validation of Anomalies
Exploiting Graph Structure - Weighted Graphs
Represent data as a weighted graph Communication networks (phone email SMS) Provider referral networks
Objective Identify anomalous nodes
For each node extract several features based on the propertiesof the induced sub-graph (egonet) of neighboring nodes [1]
Choose features that can highlight anomalous nodes
1 Ni degree of node2 Ei number of edges in egonet3 Wi total weight of egonet4 λi principal eigen vector of weighted adjacency matrix of
egonet
Data is transformed into a point in a multi-dimensional space
Chawla and Chandola Anomaly Detection
Introduction Data Mining Methods Density-based anomaly Commute Time Approach Addressing Scalability Anomalies in Complex Data Evaluating Anomaly Detection Methods Applications Problem solutionsPCA and Subspace Method Subspace Method Algorithm Subspace Analysis Results Discussion Typical Characteristics of Anomaly Limitation of Volume Entropy Based versus Volume Based Fraud Detection Epidemeology Anomaly Detection in Climate and Weather Anomalies in Climate Validation of Anomalies
Identifying Anomalies
Traditional anomaly detection (lof) Can be slow but can identify any type of anomalous structure
Faster method to identify specific types of anomalousstructures
Identify relevant feature pairs and power law relationship
Eg Egonet Density Power Law Ni vs Ei - detect nearcliques and stars
Ei prop Nαi 1 le α le 2
Anomaly score for node i wrt a pair of features (y = Cxθ)
Si =max(yi Cx
θi )
min(yi Cxθi )lowast log (|yi minus Cxθi |+ 1)
Chawla and Chandola Anomaly Detection
Introduction Data Mining Methods Density-based anomaly Commute Time Approach Addressing Scalability Anomalies in Complex Data Evaluating Anomaly Detection Methods Applications Problem solutionsPCA and Subspace Method Subspace Method Algorithm Subspace Analysis Results Discussion Typical Characteristics of Anomaly Limitation of Volume Entropy Based versus Volume Based Fraud Detection Epidemeology Anomaly Detection in Climate and Weather Anomalies in Climate Validation of Anomalies
Exploiting Graph Structure - Bipartite Graphs
Represent data as a bipartite graph Healthcare Data (Beneficiaries vs Providers) Insider trading (Traders vs Stocks)
Objective Identify anomalous links
Given a query node a isin V1 find the ldquorelevancerdquoof all other nodes in V1 to a
RelevanceScore(a b) prop Number of times aldquorandom walkrdquo from a reaches b
Use the relevance scores to compute thenormality scores for a node t isin V2
Find set St = a|〈a t〉 isin E Compute |St| times |St| similarity matrix using
relevance vectors for a isin St Normality Score = mean of non-diagonal entries
of similarity matrix
V1 E V2a1
a2
a3
an
t1
t2
t3
tn
Chawla and Chandola Anomaly Detection
Introduction Data Mining Methods Density-based anomaly Commute Time Approach Addressing Scalability Anomalies in Complex Data Evaluating Anomaly Detection Methods Applications Problem solutionsPCA and Subspace Method Subspace Method Algorithm Subspace Analysis Results Discussion Typical Characteristics of Anomaly Limitation of Volume Entropy Based versus Volume Based Fraud Detection Epidemeology Anomaly Detection in Climate and Weather Anomalies in Climate Validation of Anomalies
Detecting Disease Outbreaks
Domain Question Early detection of disease
outbreaks Anthrax attack
Data Emergency department visits Grocery data (Example [14]) Clinical visits Weatherclimate data
Challenges Weak signals in the data
ED cases involving cough rArrFlu or SARS
Integration of multiple signals(lag analysis)
Account for spatial and temporalcorrelations
Chawla and Chandola Anomaly Detection
Introduction Data Mining Methods Density-based anomaly Commute Time Approach Addressing Scalability Anomalies in Complex Data Evaluating Anomaly Detection Methods Applications Problem solutionsPCA and Subspace Method Subspace Method Algorithm Subspace Analysis Results Discussion Typical Characteristics of Anomaly Limitation of Volume Entropy Based versus Volume Based Fraud Detection Epidemeology Anomaly Detection in Climate and Weather Anomalies in Climate Validation of Anomalies
Whatrsquos Significant About Recent Events (WSARE) [33]
1 Learn Bayesian network from historical data Environmental and response variables
2 Sample from the BN (DBbaseline|Current Environment)3 Compute contingency table for rules for DBbaseline andDBcurrent
Rules are single assignment rules (Xi = Y ji ) or conjunctions4 Find p-value for rules using χ2-test
Null Hypothesis Rows and columns of tables for DBbaselineand DBcurrent are independent
5 Find rule with largest p-value Repeat Step 2
Chawla and Chandola Anomaly Detection
Introduction Data Mining Methods Density-based anomaly Commute Time Approach Addressing Scalability Anomalies in Complex Data Evaluating Anomaly Detection Methods Applications Problem solutionsPCA and Subspace Method Subspace Method Algorithm Subspace Analysis Results Discussion Typical Characteristics of Anomaly Limitation of Volume Entropy Based versus Volume Based Fraud Detection Epidemeology Anomaly Detection in Climate and Weather Anomalies in Climate Validation of Anomalies
Incorporating Spatial and Temporal Relationships
WSARE does not explicitly model the spatial and temporalrelationships
What happened yesterday What happened in the adjoining neighborhood (yesterday)
Bayesian Network Spatio-Temporal (BNST) modelingframework [17]
Add nodes for temporal and spatial dependencies Need more data to train
Chawla and Chandola Anomaly Detection
Introduction Data Mining Methods Density-based anomaly Commute Time Approach Addressing Scalability Anomalies in Complex Data Evaluating Anomaly Detection Methods Applications Problem solutionsPCA and Subspace Method Subspace Method Algorithm Subspace Analysis Results Discussion Typical Characteristics of Anomaly Limitation of Volume Entropy Based versus Volume Based Fraud Detection Epidemeology Anomaly Detection in Climate and Weather Anomalies in Climate Validation of Anomalies
Anomaly Detection in Climate and Weather
Science Questions Identify natural and anthropogenic disasters Identify long time scale events - droughts atmospheric rivers
cold fronts etc
Data Ground observations Remote sensing data (satellites
air-borne) Climate model simulation outputs Multiple variables spatio-temporal (often has height dimension
as well)
Challenges Model spatio-temporal relationships across multiple variables Explain the cause of anomalies Massive data sizes
Climate and weather extreme events are well defined
Key challenge is to find significant events and explain the cause
Chawla and Chandola Anomaly Detection
Introduction Data Mining Methods Density-based anomaly Commute Time Approach Addressing Scalability Anomalies in Complex Data Evaluating Anomaly Detection Methods Applications Problem solutionsPCA and Subspace Method Subspace Method Algorithm Subspace Analysis Results Discussion Typical Characteristics of Anomaly Limitation of Volume Entropy Based versus Volume Based Fraud Detection Epidemeology Anomaly Detection in Climate and Weather Anomalies in Climate Validation of Anomalies
Anomalies are Widely Used in Climate
Most analysis done on ldquoanomalyrdquo time series
Difference from a ldquobase periodrdquo (Toosimplistic)
Brings spatial smoothness (eg a mountaintop and nearby valley can have very differenttemperatures) Removes seasonality
Understand climate and weatherphenomenon
Southern Oscillation Index (SOI) Difference between Sea Level Pressure
(SLP) anomalies for Tahiti and DarwinAustralia
Figure Global AverageTemperature Anomaly(1975 - 2007) Srcwwwmetofficegovuk
Chawla and Chandola Anomaly Detection
Introduction Data Mining Methods Density-based anomaly Commute Time Approach Addressing Scalability Anomalies in Complex Data Evaluating Anomaly Detection Methods Applications Problem solutionsPCA and Subspace Method Subspace Method Algorithm Subspace Analysis Results Discussion Typical Characteristics of Anomaly Limitation of Volume Entropy Based versus Volume Based Fraud Detection Epidemeology Anomaly Detection in Climate and Weather Anomalies in Climate Validation of Anomalies
Constructing Anomalies from Raw Data
Anomaly time series for a given location i
vprimei = vi minus bi
where bi is the base (reference)
How to choose bi Mean of all data for location i Monthly mean values (account for seasonality) Monthly z-score values Median (more robust) Using a shorter ldquoreference periodrdquo
30 year moving window
Different methods show statistically significant differences[19] What is the right strategy Weighted mean of different strategies (Pick weights using
Monte Carlo sampling)
Chawla and Chandola Anomaly Detection
Introduction Data Mining Methods Density-based anomaly Commute Time Approach Addressing Scalability Anomalies in Complex Data Evaluating Anomaly Detection Methods Applications Problem solutionsPCA and Subspace Method Subspace Method Algorithm Subspace Analysis Results Discussion Typical Characteristics of Anomaly Limitation of Volume Entropy Based versus Volume Based Fraud Detection Epidemeology Anomaly Detection in Climate and Weather Anomalies in Climate Validation of Anomalies
Anomaly Detection for Identifying Droughts
Science question Identify significant drought patterns usinghistorical observation data or future simulation data or both
Find persistent spatiotemporal anomalies in precipitation data
A two step approach
1 Find precipitationanomalies usingthresholds
2 Find large connectedcomponents across spaceand time
Matlab - bwlabelbwlabeln
Followup Science questionExplain cause
(drought190120061avi)
Figure Video courtsey Dr ArindamBanerjee
Chawla and Chandola Anomaly Detection
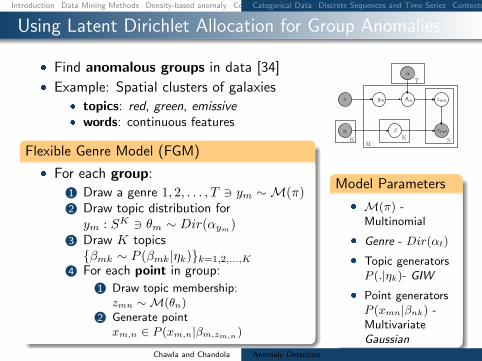
Introduction Data Mining Methods Density-based anomaly Commute Time Approach Addressing Scalability Anomalies in Complex Data Evaluating Anomaly Detection Methods Applications Problem solutionsCategorical Data Discrete Sequences and Time Series Contextual Anomalies Collective Anomalies
Using Latent Dirichlet Allocation for Group Anomalies
Find anomalous groups in data [34]
Example Spatial clusters of galaxies topics red green emissive words continuous features
Flexible Genre Model (FGM)
For each group
1 Draw a genre 1 2 T 3 ym simM(π)2 Draw topic distribution forym SK 3 θm sim Dir(αym)
3 Draw K topicsβmk sim P (βmk|ηk)k=12K
4 For each point in group
1 Draw topic membershipzmn simM(θn)
2 Generate pointxmn isin P (xmn|βmzmn)
α
zmn
xmn
N
θm
T
π
ηK
ym
β
MK
Model Parameters
M(π) -Multinomial
Genre - Dir(αt)
Topic generatorsP (|ηk)- GIW
Point generatorsP (xmn|βnk) -MultivariateGaussian
Chawla and Chandola Anomaly Detection
Introduction Data Mining Methods Density-based anomaly Commute Time Approach Addressing Scalability Anomalies in Complex Data Evaluating Anomaly Detection Methods Applications Problem solutionsCategorical Data Discrete Sequences and Time Series Contextual Anomalies Collective Anomalies
Inference and Testing for FGM
Inference and Learning Parameters
Approximate inference of latentvariables (Gibbs Sampling)
Use samples to learn parameters(Single step Monte Carlo EM)
Topic 1
Topic 2
Topic 3
Anomaly Detection
Infer the topic distribution θm
Compute negative log likelihood wrt αt
Rationale An anomalous group will be unlikely to begenerated from any genre
Geometric interpretation Mapping each group into a Tdimensional space and finding anomalies
Chawla and Chandola Anomaly Detection
Introduction Data Mining Methods Density-based anomaly Commute Time Approach Addressing Scalability Anomalies in Complex Data Evaluating Anomaly Detection Methods Applications Problem solutions
Evaluating Anomaly Detection Methods - Labels
Labeled validation data set exists Confusion matrix Traditional evaluation metrics
Class imbalance
ROC Curve
Validation set does not exist Use domain expertise to find TP
and FP FN is harder to estimate
Pseudo false negativeestimation techniques [25]
Predicteda n
Actuala TP FNn FP TN
Acc =TP + TNsum
Rec (R) =TP
TP + FN
Prec (P ) =TP
TP + FP
F =2 lowastR lowast PR+ P
Chawla and Chandola Anomaly Detection
Introduction Data Mining Methods Density-based anomaly Commute Time Approach Addressing Scalability Anomalies in Complex Data Evaluating Anomaly Detection Methods Applications Problem solutions
Evaluating Anomaly Detection Methods - Scores
Convert to binary output Use threshold δ on score (Scale
issues [21]) Take top x as anomalies
ROC curve by varying x or δ
Quality of output Does the output ldquosuggestrdquo x or δ Which output is better
Chawla and Chandola Anomaly Detection
Introduction Data Mining Methods Density-based anomaly Commute Time Approach Addressing Scalability Anomalies in Complex Data Evaluating Anomaly Detection Methods Applications Problem solutions
Unifying Scores
Different methods assign scores in differentranges
kNN-based scores [0 1] Lof scores [1 6] ABOD scores [0 80000]
Anomalies have lower scores
Direct scaling to [0 1] might lose distinctionbetween normal and anomalies
Desired scaling Stretch interesting rangesand shrink irrelevant ones
Generalized Procedure for Normalizing Outlier Scores [21] Regularity rArr S(o) ge 0forallo S(o) asymp 0 if o is normal andS(o) 0 if o is anomalous
Normality S is regular and S(o) isin [0 1]forallo
Chawla and Chandola Anomaly Detection
Introduction Data Mining Methods Density-based anomaly Commute Time Approach Addressing Scalability Anomalies in Complex Data Evaluating Anomaly Detection Methods Applications Problem solutions
Regularization and Normalization of Scores
Regularization
1 R(o) = max0 S(o)minus baseS2 R(o) = Smax minus S(o)
3 R(o) = minus log SmaxS(o)
Normalization
1 N(o) = S(o)Smax
2 N(o) = max(
0 erf(S(o)minusmicroSσS radic2
))(Gaussian Scaling)
Suited for high dimensional data
3 N(o) = max(
0cdfγS (o)minusmicroγ
1minusmicroγ
)(Gamma Scaling)
Where cdfγS (o) = P (k S(o) θ) P is the regularized Gamma function Suited for low dimensional data
Chawla and Chandola Anomaly Detection
Introduction Data Mining Methods Density-based anomaly Commute Time Approach Addressing Scalability Anomalies in Complex Data Evaluating Anomaly Detection Methods Applications Problem solutions
Generating Labeled Data for Validation
Generating Both Normal and Anomalous Data
Use generative models for normal and anomalous behavior
Several generators available Multivariate continuous data [27] Multivariate categorical data [5] Discrete sequences using HMM [12]
Drawbacks Might not capture the domain characteristics
Injecting Anomalies - Random Perturbation[30]
Given data point z = xy x and y arepartitions of feature space
Take a random sample D of the entire data set
Let zprime = xprimeyprime isin D such that distancebetween y and yprime is maximum
Replace x with xprime and add z back to data setx
yz
zprime
Injected anomaly
Chawla and Chandola Anomaly Detection
Introduction Data Mining Methods Density-based anomaly Commute Time Approach Addressing Scalability Anomalies in Complex Data Evaluating Anomaly Detection Methods Applications Problem solutionsWhat is Network Anomaly Detection Motivation How Much Serious
Applications Overview
How to set up an anomaly detection solution for agiven application domain
Available data Define anomalies define normal behavior Identify requirements and constraints (online
real-time limited resources) What domain knowledge available
Feature identification Defining normal and anomalous behavior Tuning parameters
Available ground truth (training validation)
Chawla and Chandola Anomaly Detection
Introduction Data Mining Methods Density-based anomaly Commute Time Approach Addressing Scalability Anomalies in Complex Data Evaluating Anomaly Detection Methods Applications Problem solutionsWhat is Network Anomaly Detection Motivation How Much Serious
What is Network Anomaly Detection
Anomaly Detection or Intrusion Detection
Traditional Intrusion Detection Systems (IDS) finding attackscorresponding to predefined pattern data set known as signaturestherefore system is absolutely vulnerable against zero-day attacks
Network Anomaly Detection Systems (NADS) to detectzero-day attacks without any pre-identified signature besides profilenormal behavior of the network and address suspected incidents
Network Anomaly Detection finding unusual and largechanges in the network traffic
Examples intentional attacks (eg Distributed Denial ofService - DDoS) or unusual network traffic (eg flash crowds)
Chawla and Chandola Anomaly Detection
Introduction Data Mining Methods Density-based anomaly Commute Time Approach Addressing Scalability Anomalies in Complex Data Evaluating Anomaly Detection Methods Applications Problem solutionsWhat is Network Anomaly Detection Motivation How Much Serious
Motivation How Much Serious
According to Symantec report released in early 2011 morethan 286 million new threats have been detected in 2010which is a huge number
1656227
2704836
1000000
1500000
2000000
2500000
3000000
20547 18827 69107 113025 140690
624267
1656227
2704836
0
500000
1000000
1500000
2000000
2500000
3000000
2002 2003 2004 2005 2006 2007 2008 July2009-June2010
Chawla and Chandola Anomaly Detection
Introduction Data Mining Methods Density-based anomaly Commute Time Approach Addressing Scalability Anomalies in Complex Data Evaluating Anomaly Detection Methods Applications Problem solutionsNetwork Topology Network Anomalies Detection Problem Network Anomalies Detection Problem Why care about OD Flows
Network Topology
A Typical network
1 y
Router
2
3
41t
x2t
x1t
x3t
x4t
Origin-Destination (OD) flow is the traffic that enters at anorigin node and exits at a destination node of a backbonenetwork x1t x1t
Link measurement is the traffic enters at an node during aninterval y1t
Relationship between link traffic and OD flow traffic iscaptured by the routing matrix A
Chawla and Chandola Anomaly Detection
Introduction Data Mining Methods Density-based anomaly Commute Time Approach Addressing Scalability Anomalies in Complex Data Evaluating Anomaly Detection Methods Applications Problem solutionsNetwork Topology Network Anomalies Detection Problem Network Anomalies Detection Problem Why care about OD Flows
Network Anomalies Detection Problem
Chawla and Chandola Anomaly Detection
Introduction Data Mining Methods Density-based anomaly Commute Time Approach Addressing Scalability Anomalies in Complex Data Evaluating Anomaly Detection Methods Applications Problem solutionsNetwork Topology Network Anomalies Detection Problem Network Anomalies Detection Problem Why care about OD Flows
Network Anomalies Detection Problem
Chawla and Chandola Anomaly Detection
Introduction Data Mining Methods Density-based anomaly Commute Time Approach Addressing Scalability Anomalies in Complex Data Evaluating Anomaly Detection Methods Applications Problem solutionsNetwork Topology Network Anomalies Detection Problem Network Anomalies Detection Problem Why care about OD Flows
Why care about OD Flows
Volume anomaly typically arises on an OD flow (trafficarriving at one node and destined for another node)
If we only monitor traffic on network links volume arisingfrom an OD flow may not be noticeable Thus naiveapproach wont work if OD flow info is not available
Figure source [22]
Chawla and Chandola Anomaly Detection
Introduction Data Mining Methods Density-based anomaly Commute Time Approach Addressing Scalability Anomalies in Complex Data Evaluating Anomaly Detection Methods Applications Problem solutionsPCA and Subspace Method Subspace Method Algorithm Subspace Analysis Results Discussion Typical Characteristics of Anomaly Limitation of Volume Entropy Based versus Volume Based Fraud Detection Epidemeology Anomaly Detection in Climate and Weather Anomalies in Climate Validation of Anomalies
PCA and Subspace Method
Chawla and Chandola Anomaly Detection
Introduction Data Mining Methods Density-based anomaly Commute Time Approach Addressing Scalability Anomalies in Complex Data Evaluating Anomaly Detection Methods Applications Problem solutionsPCA and Subspace Method Subspace Method Algorithm Subspace Analysis Results Discussion Typical Characteristics of Anomaly Limitation of Volume Entropy Based versus Volume Based Fraud Detection Epidemeology Anomaly Detection in Climate and Weather Anomalies in Climate Validation of Anomalies
Subspace Method Algorithm
Step1- Determine the PCs based on eigenvaluedecomposition of the covariance matrix of the dataset
Step2- Choose first top k principle components with thehighest eigenvalues as matrix P
Step3-normal traffic subspace called Z
Z = PP TZ = CZ
Step4-abnormal traffic subspace called Z
Z = (I minus PP T )Z = CZ
Step5-If the norm of a vector is large then it is an rdquoanomalyrdquo
Chawla and Chandola Anomaly Detection
Introduction Data Mining Methods Density-based anomaly Commute Time Approach Addressing Scalability Anomalies in Complex Data Evaluating Anomaly Detection Methods Applications Problem solutionsPCA and Subspace Method Subspace Method Algorithm Subspace Analysis Results Discussion Typical Characteristics of Anomaly Limitation of Volume Entropy Based versus Volume Based Fraud Detection Epidemeology Anomaly Detection in Climate and Weather Anomalies in Climate Validation of Anomalies
Subspace Analysis Results
Note that during anomaly normal component does not changethat much while residual component changes quite a lot
Thus anomalies can be detected by setting some threshold
Figure source [22]
Chawla and Chandola Anomaly Detection
Introduction Data Mining Methods Density-based anomaly Commute Time Approach Addressing Scalability Anomalies in Complex Data Evaluating Anomaly Detection Methods Applications Problem solutionsPCA and Subspace Method Subspace Method Algorithm Subspace Analysis Results Discussion Typical Characteristics of Anomaly Limitation of Volume Entropy Based versus Volume Based Fraud Detection Epidemeology Anomaly Detection in Climate and Weather Anomalies in Climate Validation of Anomalies
Discussion Typical Characteristics of Anomaly
Most Anomalies induce a change in distributionalaspects of packet header fields (called features)
Most important features include 5-tuple Source ampdestination IP addresses Source and destination portnumbers and IP protocol
raquo DOS attack ndash multiple source IP address concentrated on asingle destination IP address
raquo Network scan ndash dispersed distribution of destination addresses
raquo Most wormsviruses also induce some change in distribution ofcertain features
raquo However these changes can be very subtle and mining them islike searching for needles in a haystack
Unlike many previous approach this paper aims todetect events which disturb the distribution of trafficfeatures rather than traffic volume
Chawla and Chandola Anomaly Detection
Introduction Data Mining Methods Density-based anomaly Commute Time Approach Addressing Scalability Anomalies in Complex Data Evaluating Anomaly Detection Methods Applications Problem solutionsPCA and Subspace Method Subspace Method Algorithm Subspace Analysis Results Discussion Typical Characteristics of Anomaly Limitation of Volume Entropy Based versus Volume Based Fraud Detection Epidemeology Anomaly Detection in Climate and Weather Anomalies in Climate Validation of Anomalies
Limitation of Volume
Figure source [22]
Port scan anomaly (traffic feature changes however traffic volume
remains more or less the same)
We can use entropy tocapture the variationsin the traffic feature
bullTakes value 0 when distribution is maximally concentratedbullTakes value log2N when distribution is maximally dispersed
But stands out in
feature entropy
which also reveals
its structure
Port scan
dwarfed
in volume
metricshellip
Chawla and Chandola Anomaly Detection
Introduction Data Mining Methods Density-based anomaly Commute Time Approach Addressing Scalability Anomalies in Complex Data Evaluating Anomaly Detection Methods Applications Problem solutionsPCA and Subspace Method Subspace Method Algorithm Subspace Analysis Results Discussion Typical Characteristics of Anomaly Limitation of Volume Entropy Based versus Volume Based Fraud Detection Epidemeology Anomaly Detection in Climate and Weather Anomalies in Climate Validation of Anomalies
Entropy Based versus Volume Based
DoSDDoS Attacks- a spike in traffic data toward adominant destination IP
Scan anomaly-a spike in traffic data from a dominant sourceIP
Flash Crowd anomaly- again a spike in traffic data to adominant destination IP
Worm anomaly-a Spike in traffic with a dominant port
Chawla and Chandola Anomaly Detection
Introduction Data Mining Methods Density-based anomaly Commute Time Approach Addressing Scalability Anomalies in Complex Data Evaluating Anomaly Detection Methods Applications Problem solutionsPCA and Subspace Method Subspace Method Algorithm Subspace Analysis Results Discussion Typical Characteristics of Anomaly Limitation of Volume Entropy Based versus Volume Based Fraud Detection Epidemeology Anomaly Detection in Climate and Weather Anomalies in Climate Validation of Anomalies
Fraud Detection
Domain Question Identifyfraudulent activities or players fromobserved transaction data
Data Transactions between different
players in the system Meta information about the
individuals An underlying graph structure
Challenges Track and model human behavior Anomalies caused by adaptive
human adversaries Massive data sizes
Insurance (autohealtha)
ClaimantProvider Payer
Telecommunications Customer
Provider
Credit Cards Customer
Supplier Bank
Web Advertising User Advertiser
Publisher
ahttpwwwcheatingculturecompast-cases-of-medicare-fraud
Chawla and Chandola Anomaly Detection
Introduction Data Mining Methods Density-based anomaly Commute Time Approach Addressing Scalability Anomalies in Complex Data Evaluating Anomaly Detection Methods Applications Problem solutionsPCA and Subspace Method Subspace Method Algorithm Subspace Analysis Results Discussion Typical Characteristics of Anomaly Limitation of Volume Entropy Based versus Volume Based Fraud Detection Epidemeology Anomaly Detection in Climate and Weather Anomalies in Climate Validation of Anomalies
A Generic Fraud Detection Method
Activity Monitoring [13]1 Build profiles for individuals (customers users etc) based on
historic data User X makes n calls on an average in January
2 Compare current behavior with historical profile for significantdeviations
Clustering based [4]1 Cluster historical profiles of customers2 Identify small clusters or outlying profiles as anomalies
Strengths Anomaly detection is fast (good for real time) Results are easy to explain
Weaknesses Need to create and maintain a large number of profiles Not dynamic Adequate historical data might not be available Too many false positives
Chawla and Chandola Anomaly Detection
Introduction Data Mining Methods Density-based anomaly Commute Time Approach Addressing Scalability Anomalies in Complex Data Evaluating Anomaly Detection Methods Applications Problem solutionsPCA and Subspace Method Subspace Method Algorithm Subspace Analysis Results Discussion Typical Characteristics of Anomaly Limitation of Volume Entropy Based versus Volume Based Fraud Detection Epidemeology Anomaly Detection in Climate and Weather Anomalies in Climate Validation of Anomalies
Exploiting Graph Structure - Weighted Graphs
Represent data as a weighted graph Communication networks (phone email SMS) Provider referral networks
Objective Identify anomalous nodes
For each node extract several features based on the propertiesof the induced sub-graph (egonet) of neighboring nodes [1]
Choose features that can highlight anomalous nodes
1 Ni degree of node2 Ei number of edges in egonet3 Wi total weight of egonet4 λi principal eigen vector of weighted adjacency matrix of
egonet
Data is transformed into a point in a multi-dimensional space
Chawla and Chandola Anomaly Detection
Introduction Data Mining Methods Density-based anomaly Commute Time Approach Addressing Scalability Anomalies in Complex Data Evaluating Anomaly Detection Methods Applications Problem solutionsPCA and Subspace Method Subspace Method Algorithm Subspace Analysis Results Discussion Typical Characteristics of Anomaly Limitation of Volume Entropy Based versus Volume Based Fraud Detection Epidemeology Anomaly Detection in Climate and Weather Anomalies in Climate Validation of Anomalies
Identifying Anomalies
Traditional anomaly detection (lof) Can be slow but can identify any type of anomalous structure
Faster method to identify specific types of anomalousstructures
Identify relevant feature pairs and power law relationship
Eg Egonet Density Power Law Ni vs Ei - detect nearcliques and stars
Ei prop Nαi 1 le α le 2
Anomaly score for node i wrt a pair of features (y = Cxθ)
Si =max(yi Cx
θi )
min(yi Cxθi )lowast log (|yi minus Cxθi |+ 1)
Chawla and Chandola Anomaly Detection
Introduction Data Mining Methods Density-based anomaly Commute Time Approach Addressing Scalability Anomalies in Complex Data Evaluating Anomaly Detection Methods Applications Problem solutionsPCA and Subspace Method Subspace Method Algorithm Subspace Analysis Results Discussion Typical Characteristics of Anomaly Limitation of Volume Entropy Based versus Volume Based Fraud Detection Epidemeology Anomaly Detection in Climate and Weather Anomalies in Climate Validation of Anomalies
Exploiting Graph Structure - Bipartite Graphs
Represent data as a bipartite graph Healthcare Data (Beneficiaries vs Providers) Insider trading (Traders vs Stocks)
Objective Identify anomalous links
Given a query node a isin V1 find the ldquorelevancerdquoof all other nodes in V1 to a
RelevanceScore(a b) prop Number of times aldquorandom walkrdquo from a reaches b
Use the relevance scores to compute thenormality scores for a node t isin V2
Find set St = a|〈a t〉 isin E Compute |St| times |St| similarity matrix using
relevance vectors for a isin St Normality Score = mean of non-diagonal entries
of similarity matrix
V1 E V2a1
a2
a3
an
t1
t2
t3
tn
Chawla and Chandola Anomaly Detection
Introduction Data Mining Methods Density-based anomaly Commute Time Approach Addressing Scalability Anomalies in Complex Data Evaluating Anomaly Detection Methods Applications Problem solutionsPCA and Subspace Method Subspace Method Algorithm Subspace Analysis Results Discussion Typical Characteristics of Anomaly Limitation of Volume Entropy Based versus Volume Based Fraud Detection Epidemeology Anomaly Detection in Climate and Weather Anomalies in Climate Validation of Anomalies
Detecting Disease Outbreaks
Domain Question Early detection of disease
outbreaks Anthrax attack
Data Emergency department visits Grocery data (Example [14]) Clinical visits Weatherclimate data
Challenges Weak signals in the data
ED cases involving cough rArrFlu or SARS
Integration of multiple signals(lag analysis)
Account for spatial and temporalcorrelations
Chawla and Chandola Anomaly Detection
Introduction Data Mining Methods Density-based anomaly Commute Time Approach Addressing Scalability Anomalies in Complex Data Evaluating Anomaly Detection Methods Applications Problem solutionsPCA and Subspace Method Subspace Method Algorithm Subspace Analysis Results Discussion Typical Characteristics of Anomaly Limitation of Volume Entropy Based versus Volume Based Fraud Detection Epidemeology Anomaly Detection in Climate and Weather Anomalies in Climate Validation of Anomalies
Whatrsquos Significant About Recent Events (WSARE) [33]
1 Learn Bayesian network from historical data Environmental and response variables
2 Sample from the BN (DBbaseline|Current Environment)3 Compute contingency table for rules for DBbaseline andDBcurrent
Rules are single assignment rules (Xi = Y ji ) or conjunctions4 Find p-value for rules using χ2-test
Null Hypothesis Rows and columns of tables for DBbaselineand DBcurrent are independent
5 Find rule with largest p-value Repeat Step 2
Chawla and Chandola Anomaly Detection
Introduction Data Mining Methods Density-based anomaly Commute Time Approach Addressing Scalability Anomalies in Complex Data Evaluating Anomaly Detection Methods Applications Problem solutionsPCA and Subspace Method Subspace Method Algorithm Subspace Analysis Results Discussion Typical Characteristics of Anomaly Limitation of Volume Entropy Based versus Volume Based Fraud Detection Epidemeology Anomaly Detection in Climate and Weather Anomalies in Climate Validation of Anomalies
Incorporating Spatial and Temporal Relationships
WSARE does not explicitly model the spatial and temporalrelationships
What happened yesterday What happened in the adjoining neighborhood (yesterday)
Bayesian Network Spatio-Temporal (BNST) modelingframework [17]
Add nodes for temporal and spatial dependencies Need more data to train
Chawla and Chandola Anomaly Detection
Introduction Data Mining Methods Density-based anomaly Commute Time Approach Addressing Scalability Anomalies in Complex Data Evaluating Anomaly Detection Methods Applications Problem solutionsPCA and Subspace Method Subspace Method Algorithm Subspace Analysis Results Discussion Typical Characteristics of Anomaly Limitation of Volume Entropy Based versus Volume Based Fraud Detection Epidemeology Anomaly Detection in Climate and Weather Anomalies in Climate Validation of Anomalies
Anomaly Detection in Climate and Weather
Science Questions Identify natural and anthropogenic disasters Identify long time scale events - droughts atmospheric rivers
cold fronts etc
Data Ground observations Remote sensing data (satellites
air-borne) Climate model simulation outputs Multiple variables spatio-temporal (often has height dimension
as well)
Challenges Model spatio-temporal relationships across multiple variables Explain the cause of anomalies Massive data sizes
Climate and weather extreme events are well defined
Key challenge is to find significant events and explain the cause
Chawla and Chandola Anomaly Detection
Introduction Data Mining Methods Density-based anomaly Commute Time Approach Addressing Scalability Anomalies in Complex Data Evaluating Anomaly Detection Methods Applications Problem solutionsPCA and Subspace Method Subspace Method Algorithm Subspace Analysis Results Discussion Typical Characteristics of Anomaly Limitation of Volume Entropy Based versus Volume Based Fraud Detection Epidemeology Anomaly Detection in Climate and Weather Anomalies in Climate Validation of Anomalies
Anomalies are Widely Used in Climate
Most analysis done on ldquoanomalyrdquo time series
Difference from a ldquobase periodrdquo (Toosimplistic)
Brings spatial smoothness (eg a mountaintop and nearby valley can have very differenttemperatures) Removes seasonality
Understand climate and weatherphenomenon
Southern Oscillation Index (SOI) Difference between Sea Level Pressure
(SLP) anomalies for Tahiti and DarwinAustralia
Figure Global AverageTemperature Anomaly(1975 - 2007) Srcwwwmetofficegovuk
Chawla and Chandola Anomaly Detection
Introduction Data Mining Methods Density-based anomaly Commute Time Approach Addressing Scalability Anomalies in Complex Data Evaluating Anomaly Detection Methods Applications Problem solutionsPCA and Subspace Method Subspace Method Algorithm Subspace Analysis Results Discussion Typical Characteristics of Anomaly Limitation of Volume Entropy Based versus Volume Based Fraud Detection Epidemeology Anomaly Detection in Climate and Weather Anomalies in Climate Validation of Anomalies
Constructing Anomalies from Raw Data
Anomaly time series for a given location i
vprimei = vi minus bi
where bi is the base (reference)
How to choose bi Mean of all data for location i Monthly mean values (account for seasonality) Monthly z-score values Median (more robust) Using a shorter ldquoreference periodrdquo
30 year moving window
Different methods show statistically significant differences[19] What is the right strategy Weighted mean of different strategies (Pick weights using
Monte Carlo sampling)
Chawla and Chandola Anomaly Detection
Introduction Data Mining Methods Density-based anomaly Commute Time Approach Addressing Scalability Anomalies in Complex Data Evaluating Anomaly Detection Methods Applications Problem solutionsPCA and Subspace Method Subspace Method Algorithm Subspace Analysis Results Discussion Typical Characteristics of Anomaly Limitation of Volume Entropy Based versus Volume Based Fraud Detection Epidemeology Anomaly Detection in Climate and Weather Anomalies in Climate Validation of Anomalies
Anomaly Detection for Identifying Droughts
Science question Identify significant drought patterns usinghistorical observation data or future simulation data or both
Find persistent spatiotemporal anomalies in precipitation data
A two step approach
1 Find precipitationanomalies usingthresholds
2 Find large connectedcomponents across spaceand time
Matlab - bwlabelbwlabeln
Followup Science questionExplain cause
(drought190120061avi)
Figure Video courtsey Dr ArindamBanerjee
Chawla and Chandola Anomaly Detection
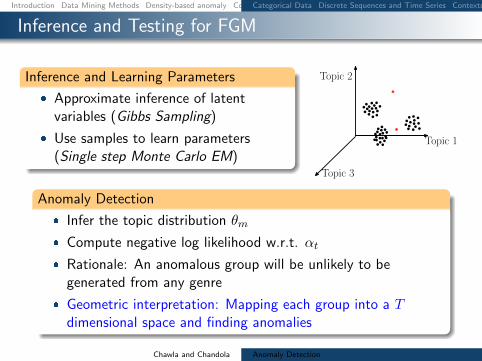
Introduction Data Mining Methods Density-based anomaly Commute Time Approach Addressing Scalability Anomalies in Complex Data Evaluating Anomaly Detection Methods Applications Problem solutionsCategorical Data Discrete Sequences and Time Series Contextual Anomalies Collective Anomalies
Inference and Testing for FGM
Inference and Learning Parameters
Approximate inference of latentvariables (Gibbs Sampling)
Use samples to learn parameters(Single step Monte Carlo EM)
Topic 1
Topic 2
Topic 3
Anomaly Detection
Infer the topic distribution θm
Compute negative log likelihood wrt αt
Rationale An anomalous group will be unlikely to begenerated from any genre
Geometric interpretation Mapping each group into a Tdimensional space and finding anomalies
Chawla and Chandola Anomaly Detection
Introduction Data Mining Methods Density-based anomaly Commute Time Approach Addressing Scalability Anomalies in Complex Data Evaluating Anomaly Detection Methods Applications Problem solutions
Evaluating Anomaly Detection Methods - Labels
Labeled validation data set exists Confusion matrix Traditional evaluation metrics
Class imbalance
ROC Curve
Validation set does not exist Use domain expertise to find TP
and FP FN is harder to estimate
Pseudo false negativeestimation techniques [25]
Predicteda n
Actuala TP FNn FP TN
Acc =TP + TNsum
Rec (R) =TP
TP + FN
Prec (P ) =TP
TP + FP
F =2 lowastR lowast PR+ P
Chawla and Chandola Anomaly Detection
Introduction Data Mining Methods Density-based anomaly Commute Time Approach Addressing Scalability Anomalies in Complex Data Evaluating Anomaly Detection Methods Applications Problem solutions
Evaluating Anomaly Detection Methods - Scores
Convert to binary output Use threshold δ on score (Scale
issues [21]) Take top x as anomalies
ROC curve by varying x or δ
Quality of output Does the output ldquosuggestrdquo x or δ Which output is better
Chawla and Chandola Anomaly Detection
Introduction Data Mining Methods Density-based anomaly Commute Time Approach Addressing Scalability Anomalies in Complex Data Evaluating Anomaly Detection Methods Applications Problem solutions
Unifying Scores
Different methods assign scores in differentranges
kNN-based scores [0 1] Lof scores [1 6] ABOD scores [0 80000]
Anomalies have lower scores
Direct scaling to [0 1] might lose distinctionbetween normal and anomalies
Desired scaling Stretch interesting rangesand shrink irrelevant ones
Generalized Procedure for Normalizing Outlier Scores [21] Regularity rArr S(o) ge 0forallo S(o) asymp 0 if o is normal andS(o) 0 if o is anomalous
Normality S is regular and S(o) isin [0 1]forallo
Chawla and Chandola Anomaly Detection
Introduction Data Mining Methods Density-based anomaly Commute Time Approach Addressing Scalability Anomalies in Complex Data Evaluating Anomaly Detection Methods Applications Problem solutions
Regularization and Normalization of Scores
Regularization
1 R(o) = max0 S(o)minus baseS2 R(o) = Smax minus S(o)
3 R(o) = minus log SmaxS(o)
Normalization
1 N(o) = S(o)Smax
2 N(o) = max(
0 erf(S(o)minusmicroSσS radic2
))(Gaussian Scaling)
Suited for high dimensional data
3 N(o) = max(
0cdfγS (o)minusmicroγ
1minusmicroγ
)(Gamma Scaling)
Where cdfγS (o) = P (k S(o) θ) P is the regularized Gamma function Suited for low dimensional data
Chawla and Chandola Anomaly Detection
Introduction Data Mining Methods Density-based anomaly Commute Time Approach Addressing Scalability Anomalies in Complex Data Evaluating Anomaly Detection Methods Applications Problem solutions
Generating Labeled Data for Validation
Generating Both Normal and Anomalous Data
Use generative models for normal and anomalous behavior
Several generators available Multivariate continuous data [27] Multivariate categorical data [5] Discrete sequences using HMM [12]
Drawbacks Might not capture the domain characteristics
Injecting Anomalies - Random Perturbation[30]
Given data point z = xy x and y arepartitions of feature space
Take a random sample D of the entire data set
Let zprime = xprimeyprime isin D such that distancebetween y and yprime is maximum
Replace x with xprime and add z back to data setx
yz
zprime
Injected anomaly
Chawla and Chandola Anomaly Detection
Introduction Data Mining Methods Density-based anomaly Commute Time Approach Addressing Scalability Anomalies in Complex Data Evaluating Anomaly Detection Methods Applications Problem solutionsWhat is Network Anomaly Detection Motivation How Much Serious
Applications Overview
How to set up an anomaly detection solution for agiven application domain
Available data Define anomalies define normal behavior Identify requirements and constraints (online
real-time limited resources) What domain knowledge available
Feature identification Defining normal and anomalous behavior Tuning parameters
Available ground truth (training validation)
Chawla and Chandola Anomaly Detection
Introduction Data Mining Methods Density-based anomaly Commute Time Approach Addressing Scalability Anomalies in Complex Data Evaluating Anomaly Detection Methods Applications Problem solutionsWhat is Network Anomaly Detection Motivation How Much Serious
What is Network Anomaly Detection
Anomaly Detection or Intrusion Detection
Traditional Intrusion Detection Systems (IDS) finding attackscorresponding to predefined pattern data set known as signaturestherefore system is absolutely vulnerable against zero-day attacks
Network Anomaly Detection Systems (NADS) to detectzero-day attacks without any pre-identified signature besides profilenormal behavior of the network and address suspected incidents
Network Anomaly Detection finding unusual and largechanges in the network traffic
Examples intentional attacks (eg Distributed Denial ofService - DDoS) or unusual network traffic (eg flash crowds)
Chawla and Chandola Anomaly Detection
Introduction Data Mining Methods Density-based anomaly Commute Time Approach Addressing Scalability Anomalies in Complex Data Evaluating Anomaly Detection Methods Applications Problem solutionsWhat is Network Anomaly Detection Motivation How Much Serious
Motivation How Much Serious
According to Symantec report released in early 2011 morethan 286 million new threats have been detected in 2010which is a huge number
1656227
2704836
1000000
1500000
2000000
2500000
3000000
20547 18827 69107 113025 140690
624267
1656227
2704836
0
500000
1000000
1500000
2000000
2500000
3000000
2002 2003 2004 2005 2006 2007 2008 July2009-June2010
Chawla and Chandola Anomaly Detection
Introduction Data Mining Methods Density-based anomaly Commute Time Approach Addressing Scalability Anomalies in Complex Data Evaluating Anomaly Detection Methods Applications Problem solutionsNetwork Topology Network Anomalies Detection Problem Network Anomalies Detection Problem Why care about OD Flows
Network Topology
A Typical network
1 y
Router
2
3
41t
x2t
x1t
x3t
x4t
Origin-Destination (OD) flow is the traffic that enters at anorigin node and exits at a destination node of a backbonenetwork x1t x1t
Link measurement is the traffic enters at an node during aninterval y1t
Relationship between link traffic and OD flow traffic iscaptured by the routing matrix A
Chawla and Chandola Anomaly Detection
Introduction Data Mining Methods Density-based anomaly Commute Time Approach Addressing Scalability Anomalies in Complex Data Evaluating Anomaly Detection Methods Applications Problem solutionsNetwork Topology Network Anomalies Detection Problem Network Anomalies Detection Problem Why care about OD Flows
Network Anomalies Detection Problem
Chawla and Chandola Anomaly Detection
Introduction Data Mining Methods Density-based anomaly Commute Time Approach Addressing Scalability Anomalies in Complex Data Evaluating Anomaly Detection Methods Applications Problem solutionsNetwork Topology Network Anomalies Detection Problem Network Anomalies Detection Problem Why care about OD Flows
Network Anomalies Detection Problem
Chawla and Chandola Anomaly Detection
Introduction Data Mining Methods Density-based anomaly Commute Time Approach Addressing Scalability Anomalies in Complex Data Evaluating Anomaly Detection Methods Applications Problem solutionsNetwork Topology Network Anomalies Detection Problem Network Anomalies Detection Problem Why care about OD Flows
Why care about OD Flows
Volume anomaly typically arises on an OD flow (trafficarriving at one node and destined for another node)
If we only monitor traffic on network links volume arisingfrom an OD flow may not be noticeable Thus naiveapproach wont work if OD flow info is not available
Figure source [22]
Chawla and Chandola Anomaly Detection
Introduction Data Mining Methods Density-based anomaly Commute Time Approach Addressing Scalability Anomalies in Complex Data Evaluating Anomaly Detection Methods Applications Problem solutionsPCA and Subspace Method Subspace Method Algorithm Subspace Analysis Results Discussion Typical Characteristics of Anomaly Limitation of Volume Entropy Based versus Volume Based Fraud Detection Epidemeology Anomaly Detection in Climate and Weather Anomalies in Climate Validation of Anomalies
PCA and Subspace Method
Chawla and Chandola Anomaly Detection
Introduction Data Mining Methods Density-based anomaly Commute Time Approach Addressing Scalability Anomalies in Complex Data Evaluating Anomaly Detection Methods Applications Problem solutionsPCA and Subspace Method Subspace Method Algorithm Subspace Analysis Results Discussion Typical Characteristics of Anomaly Limitation of Volume Entropy Based versus Volume Based Fraud Detection Epidemeology Anomaly Detection in Climate and Weather Anomalies in Climate Validation of Anomalies
Subspace Method Algorithm
Step1- Determine the PCs based on eigenvaluedecomposition of the covariance matrix of the dataset
Step2- Choose first top k principle components with thehighest eigenvalues as matrix P
Step3-normal traffic subspace called Z
Z = PP TZ = CZ
Step4-abnormal traffic subspace called Z
Z = (I minus PP T )Z = CZ
Step5-If the norm of a vector is large then it is an rdquoanomalyrdquo
Chawla and Chandola Anomaly Detection
Introduction Data Mining Methods Density-based anomaly Commute Time Approach Addressing Scalability Anomalies in Complex Data Evaluating Anomaly Detection Methods Applications Problem solutionsPCA and Subspace Method Subspace Method Algorithm Subspace Analysis Results Discussion Typical Characteristics of Anomaly Limitation of Volume Entropy Based versus Volume Based Fraud Detection Epidemeology Anomaly Detection in Climate and Weather Anomalies in Climate Validation of Anomalies
Subspace Analysis Results
Note that during anomaly normal component does not changethat much while residual component changes quite a lot
Thus anomalies can be detected by setting some threshold
Figure source [22]
Chawla and Chandola Anomaly Detection
Introduction Data Mining Methods Density-based anomaly Commute Time Approach Addressing Scalability Anomalies in Complex Data Evaluating Anomaly Detection Methods Applications Problem solutionsPCA and Subspace Method Subspace Method Algorithm Subspace Analysis Results Discussion Typical Characteristics of Anomaly Limitation of Volume Entropy Based versus Volume Based Fraud Detection Epidemeology Anomaly Detection in Climate and Weather Anomalies in Climate Validation of Anomalies
Discussion Typical Characteristics of Anomaly
Most Anomalies induce a change in distributionalaspects of packet header fields (called features)
Most important features include 5-tuple Source ampdestination IP addresses Source and destination portnumbers and IP protocol
raquo DOS attack ndash multiple source IP address concentrated on asingle destination IP address
raquo Network scan ndash dispersed distribution of destination addresses
raquo Most wormsviruses also induce some change in distribution ofcertain features
raquo However these changes can be very subtle and mining them islike searching for needles in a haystack
Unlike many previous approach this paper aims todetect events which disturb the distribution of trafficfeatures rather than traffic volume
Chawla and Chandola Anomaly Detection
Introduction Data Mining Methods Density-based anomaly Commute Time Approach Addressing Scalability Anomalies in Complex Data Evaluating Anomaly Detection Methods Applications Problem solutionsPCA and Subspace Method Subspace Method Algorithm Subspace Analysis Results Discussion Typical Characteristics of Anomaly Limitation of Volume Entropy Based versus Volume Based Fraud Detection Epidemeology Anomaly Detection in Climate and Weather Anomalies in Climate Validation of Anomalies
Limitation of Volume
Figure source [22]
Port scan anomaly (traffic feature changes however traffic volume
remains more or less the same)
We can use entropy tocapture the variationsin the traffic feature
bullTakes value 0 when distribution is maximally concentratedbullTakes value log2N when distribution is maximally dispersed
But stands out in
feature entropy
which also reveals
its structure
Port scan
dwarfed
in volume
metricshellip
Chawla and Chandola Anomaly Detection
Introduction Data Mining Methods Density-based anomaly Commute Time Approach Addressing Scalability Anomalies in Complex Data Evaluating Anomaly Detection Methods Applications Problem solutionsPCA and Subspace Method Subspace Method Algorithm Subspace Analysis Results Discussion Typical Characteristics of Anomaly Limitation of Volume Entropy Based versus Volume Based Fraud Detection Epidemeology Anomaly Detection in Climate and Weather Anomalies in Climate Validation of Anomalies
Entropy Based versus Volume Based
DoSDDoS Attacks- a spike in traffic data toward adominant destination IP
Scan anomaly-a spike in traffic data from a dominant sourceIP
Flash Crowd anomaly- again a spike in traffic data to adominant destination IP
Worm anomaly-a Spike in traffic with a dominant port
Chawla and Chandola Anomaly Detection
Introduction Data Mining Methods Density-based anomaly Commute Time Approach Addressing Scalability Anomalies in Complex Data Evaluating Anomaly Detection Methods Applications Problem solutionsPCA and Subspace Method Subspace Method Algorithm Subspace Analysis Results Discussion Typical Characteristics of Anomaly Limitation of Volume Entropy Based versus Volume Based Fraud Detection Epidemeology Anomaly Detection in Climate and Weather Anomalies in Climate Validation of Anomalies
Fraud Detection
Domain Question Identifyfraudulent activities or players fromobserved transaction data
Data Transactions between different
players in the system Meta information about the
individuals An underlying graph structure
Challenges Track and model human behavior Anomalies caused by adaptive
human adversaries Massive data sizes
Insurance (autohealtha)
ClaimantProvider Payer
Telecommunications Customer
Provider
Credit Cards Customer
Supplier Bank
Web Advertising User Advertiser
Publisher
ahttpwwwcheatingculturecompast-cases-of-medicare-fraud
Chawla and Chandola Anomaly Detection
Introduction Data Mining Methods Density-based anomaly Commute Time Approach Addressing Scalability Anomalies in Complex Data Evaluating Anomaly Detection Methods Applications Problem solutionsPCA and Subspace Method Subspace Method Algorithm Subspace Analysis Results Discussion Typical Characteristics of Anomaly Limitation of Volume Entropy Based versus Volume Based Fraud Detection Epidemeology Anomaly Detection in Climate and Weather Anomalies in Climate Validation of Anomalies
A Generic Fraud Detection Method
Activity Monitoring [13]1 Build profiles for individuals (customers users etc) based on
historic data User X makes n calls on an average in January
2 Compare current behavior with historical profile for significantdeviations
Clustering based [4]1 Cluster historical profiles of customers2 Identify small clusters or outlying profiles as anomalies
Strengths Anomaly detection is fast (good for real time) Results are easy to explain
Weaknesses Need to create and maintain a large number of profiles Not dynamic Adequate historical data might not be available Too many false positives
Chawla and Chandola Anomaly Detection
Introduction Data Mining Methods Density-based anomaly Commute Time Approach Addressing Scalability Anomalies in Complex Data Evaluating Anomaly Detection Methods Applications Problem solutionsPCA and Subspace Method Subspace Method Algorithm Subspace Analysis Results Discussion Typical Characteristics of Anomaly Limitation of Volume Entropy Based versus Volume Based Fraud Detection Epidemeology Anomaly Detection in Climate and Weather Anomalies in Climate Validation of Anomalies
Exploiting Graph Structure - Weighted Graphs
Represent data as a weighted graph Communication networks (phone email SMS) Provider referral networks
Objective Identify anomalous nodes
For each node extract several features based on the propertiesof the induced sub-graph (egonet) of neighboring nodes [1]
Choose features that can highlight anomalous nodes
1 Ni degree of node2 Ei number of edges in egonet3 Wi total weight of egonet4 λi principal eigen vector of weighted adjacency matrix of
egonet
Data is transformed into a point in a multi-dimensional space
Chawla and Chandola Anomaly Detection
Introduction Data Mining Methods Density-based anomaly Commute Time Approach Addressing Scalability Anomalies in Complex Data Evaluating Anomaly Detection Methods Applications Problem solutionsPCA and Subspace Method Subspace Method Algorithm Subspace Analysis Results Discussion Typical Characteristics of Anomaly Limitation of Volume Entropy Based versus Volume Based Fraud Detection Epidemeology Anomaly Detection in Climate and Weather Anomalies in Climate Validation of Anomalies
Identifying Anomalies
Traditional anomaly detection (lof) Can be slow but can identify any type of anomalous structure
Faster method to identify specific types of anomalousstructures
Identify relevant feature pairs and power law relationship
Eg Egonet Density Power Law Ni vs Ei - detect nearcliques and stars
Ei prop Nαi 1 le α le 2
Anomaly score for node i wrt a pair of features (y = Cxθ)
Si =max(yi Cx
θi )
min(yi Cxθi )lowast log (|yi minus Cxθi |+ 1)
Chawla and Chandola Anomaly Detection
Introduction Data Mining Methods Density-based anomaly Commute Time Approach Addressing Scalability Anomalies in Complex Data Evaluating Anomaly Detection Methods Applications Problem solutionsPCA and Subspace Method Subspace Method Algorithm Subspace Analysis Results Discussion Typical Characteristics of Anomaly Limitation of Volume Entropy Based versus Volume Based Fraud Detection Epidemeology Anomaly Detection in Climate and Weather Anomalies in Climate Validation of Anomalies
Exploiting Graph Structure - Bipartite Graphs
Represent data as a bipartite graph Healthcare Data (Beneficiaries vs Providers) Insider trading (Traders vs Stocks)
Objective Identify anomalous links
Given a query node a isin V1 find the ldquorelevancerdquoof all other nodes in V1 to a
RelevanceScore(a b) prop Number of times aldquorandom walkrdquo from a reaches b
Use the relevance scores to compute thenormality scores for a node t isin V2
Find set St = a|〈a t〉 isin E Compute |St| times |St| similarity matrix using
relevance vectors for a isin St Normality Score = mean of non-diagonal entries
of similarity matrix
V1 E V2a1
a2
a3
an
t1
t2
t3
tn
Chawla and Chandola Anomaly Detection
Introduction Data Mining Methods Density-based anomaly Commute Time Approach Addressing Scalability Anomalies in Complex Data Evaluating Anomaly Detection Methods Applications Problem solutionsPCA and Subspace Method Subspace Method Algorithm Subspace Analysis Results Discussion Typical Characteristics of Anomaly Limitation of Volume Entropy Based versus Volume Based Fraud Detection Epidemeology Anomaly Detection in Climate and Weather Anomalies in Climate Validation of Anomalies
Detecting Disease Outbreaks
Domain Question Early detection of disease
outbreaks Anthrax attack
Data Emergency department visits Grocery data (Example [14]) Clinical visits Weatherclimate data
Challenges Weak signals in the data
ED cases involving cough rArrFlu or SARS
Integration of multiple signals(lag analysis)
Account for spatial and temporalcorrelations
Chawla and Chandola Anomaly Detection
Introduction Data Mining Methods Density-based anomaly Commute Time Approach Addressing Scalability Anomalies in Complex Data Evaluating Anomaly Detection Methods Applications Problem solutionsPCA and Subspace Method Subspace Method Algorithm Subspace Analysis Results Discussion Typical Characteristics of Anomaly Limitation of Volume Entropy Based versus Volume Based Fraud Detection Epidemeology Anomaly Detection in Climate and Weather Anomalies in Climate Validation of Anomalies
Whatrsquos Significant About Recent Events (WSARE) [33]
1 Learn Bayesian network from historical data Environmental and response variables
2 Sample from the BN (DBbaseline|Current Environment)3 Compute contingency table for rules for DBbaseline andDBcurrent
Rules are single assignment rules (Xi = Y ji ) or conjunctions4 Find p-value for rules using χ2-test
Null Hypothesis Rows and columns of tables for DBbaselineand DBcurrent are independent
5 Find rule with largest p-value Repeat Step 2
Chawla and Chandola Anomaly Detection
Introduction Data Mining Methods Density-based anomaly Commute Time Approach Addressing Scalability Anomalies in Complex Data Evaluating Anomaly Detection Methods Applications Problem solutionsPCA and Subspace Method Subspace Method Algorithm Subspace Analysis Results Discussion Typical Characteristics of Anomaly Limitation of Volume Entropy Based versus Volume Based Fraud Detection Epidemeology Anomaly Detection in Climate and Weather Anomalies in Climate Validation of Anomalies
Incorporating Spatial and Temporal Relationships
WSARE does not explicitly model the spatial and temporalrelationships
What happened yesterday What happened in the adjoining neighborhood (yesterday)
Bayesian Network Spatio-Temporal (BNST) modelingframework [17]
Add nodes for temporal and spatial dependencies Need more data to train
Chawla and Chandola Anomaly Detection
Introduction Data Mining Methods Density-based anomaly Commute Time Approach Addressing Scalability Anomalies in Complex Data Evaluating Anomaly Detection Methods Applications Problem solutionsPCA and Subspace Method Subspace Method Algorithm Subspace Analysis Results Discussion Typical Characteristics of Anomaly Limitation of Volume Entropy Based versus Volume Based Fraud Detection Epidemeology Anomaly Detection in Climate and Weather Anomalies in Climate Validation of Anomalies
Anomaly Detection in Climate and Weather
Science Questions Identify natural and anthropogenic disasters Identify long time scale events - droughts atmospheric rivers
cold fronts etc
Data Ground observations Remote sensing data (satellites
air-borne) Climate model simulation outputs Multiple variables spatio-temporal (often has height dimension
as well)
Challenges Model spatio-temporal relationships across multiple variables Explain the cause of anomalies Massive data sizes
Climate and weather extreme events are well defined
Key challenge is to find significant events and explain the cause
Chawla and Chandola Anomaly Detection
Introduction Data Mining Methods Density-based anomaly Commute Time Approach Addressing Scalability Anomalies in Complex Data Evaluating Anomaly Detection Methods Applications Problem solutionsPCA and Subspace Method Subspace Method Algorithm Subspace Analysis Results Discussion Typical Characteristics of Anomaly Limitation of Volume Entropy Based versus Volume Based Fraud Detection Epidemeology Anomaly Detection in Climate and Weather Anomalies in Climate Validation of Anomalies
Anomalies are Widely Used in Climate
Most analysis done on ldquoanomalyrdquo time series
Difference from a ldquobase periodrdquo (Toosimplistic)
Brings spatial smoothness (eg a mountaintop and nearby valley can have very differenttemperatures) Removes seasonality
Understand climate and weatherphenomenon
Southern Oscillation Index (SOI) Difference between Sea Level Pressure
(SLP) anomalies for Tahiti and DarwinAustralia
Figure Global AverageTemperature Anomaly(1975 - 2007) Srcwwwmetofficegovuk
Chawla and Chandola Anomaly Detection
Introduction Data Mining Methods Density-based anomaly Commute Time Approach Addressing Scalability Anomalies in Complex Data Evaluating Anomaly Detection Methods Applications Problem solutionsPCA and Subspace Method Subspace Method Algorithm Subspace Analysis Results Discussion Typical Characteristics of Anomaly Limitation of Volume Entropy Based versus Volume Based Fraud Detection Epidemeology Anomaly Detection in Climate and Weather Anomalies in Climate Validation of Anomalies
Constructing Anomalies from Raw Data
Anomaly time series for a given location i
vprimei = vi minus bi
where bi is the base (reference)
How to choose bi Mean of all data for location i Monthly mean values (account for seasonality) Monthly z-score values Median (more robust) Using a shorter ldquoreference periodrdquo
30 year moving window
Different methods show statistically significant differences[19] What is the right strategy Weighted mean of different strategies (Pick weights using
Monte Carlo sampling)
Chawla and Chandola Anomaly Detection
Introduction Data Mining Methods Density-based anomaly Commute Time Approach Addressing Scalability Anomalies in Complex Data Evaluating Anomaly Detection Methods Applications Problem solutionsPCA and Subspace Method Subspace Method Algorithm Subspace Analysis Results Discussion Typical Characteristics of Anomaly Limitation of Volume Entropy Based versus Volume Based Fraud Detection Epidemeology Anomaly Detection in Climate and Weather Anomalies in Climate Validation of Anomalies
Anomaly Detection for Identifying Droughts
Science question Identify significant drought patterns usinghistorical observation data or future simulation data or both
Find persistent spatiotemporal anomalies in precipitation data
A two step approach
1 Find precipitationanomalies usingthresholds
2 Find large connectedcomponents across spaceand time
Matlab - bwlabelbwlabeln
Followup Science questionExplain cause
(drought190120061avi)
Figure Video courtsey Dr ArindamBanerjee
Chawla and Chandola Anomaly Detection
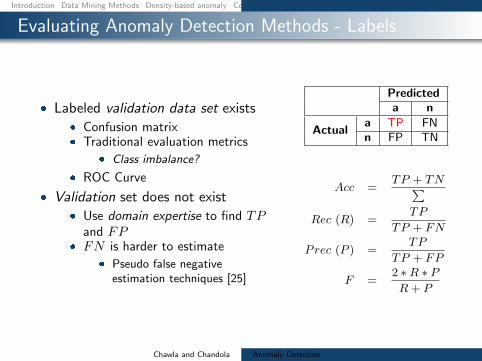
Introduction Data Mining Methods Density-based anomaly Commute Time Approach Addressing Scalability Anomalies in Complex Data Evaluating Anomaly Detection Methods Applications Problem solutions
Evaluating Anomaly Detection Methods - Labels
Labeled validation data set exists Confusion matrix Traditional evaluation metrics
Class imbalance
ROC Curve
Validation set does not exist Use domain expertise to find TP
and FP FN is harder to estimate
Pseudo false negativeestimation techniques [25]
Predicteda n
Actuala TP FNn FP TN
Acc =TP + TNsum
Rec (R) =TP
TP + FN
Prec (P ) =TP
TP + FP
F =2 lowastR lowast PR+ P
Chawla and Chandola Anomaly Detection
Introduction Data Mining Methods Density-based anomaly Commute Time Approach Addressing Scalability Anomalies in Complex Data Evaluating Anomaly Detection Methods Applications Problem solutions
Evaluating Anomaly Detection Methods - Scores
Convert to binary output Use threshold δ on score (Scale
issues [21]) Take top x as anomalies
ROC curve by varying x or δ
Quality of output Does the output ldquosuggestrdquo x or δ Which output is better
Chawla and Chandola Anomaly Detection
Introduction Data Mining Methods Density-based anomaly Commute Time Approach Addressing Scalability Anomalies in Complex Data Evaluating Anomaly Detection Methods Applications Problem solutions
Unifying Scores
Different methods assign scores in differentranges
kNN-based scores [0 1] Lof scores [1 6] ABOD scores [0 80000]
Anomalies have lower scores
Direct scaling to [0 1] might lose distinctionbetween normal and anomalies
Desired scaling Stretch interesting rangesand shrink irrelevant ones
Generalized Procedure for Normalizing Outlier Scores [21] Regularity rArr S(o) ge 0forallo S(o) asymp 0 if o is normal andS(o) 0 if o is anomalous
Normality S is regular and S(o) isin [0 1]forallo
Chawla and Chandola Anomaly Detection
Introduction Data Mining Methods Density-based anomaly Commute Time Approach Addressing Scalability Anomalies in Complex Data Evaluating Anomaly Detection Methods Applications Problem solutions
Regularization and Normalization of Scores
Regularization
1 R(o) = max0 S(o)minus baseS2 R(o) = Smax minus S(o)
3 R(o) = minus log SmaxS(o)
Normalization
1 N(o) = S(o)Smax
2 N(o) = max(
0 erf(S(o)minusmicroSσS radic2
))(Gaussian Scaling)
Suited for high dimensional data
3 N(o) = max(
0cdfγS (o)minusmicroγ
1minusmicroγ
)(Gamma Scaling)
Where cdfγS (o) = P (k S(o) θ) P is the regularized Gamma function Suited for low dimensional data
Chawla and Chandola Anomaly Detection
Introduction Data Mining Methods Density-based anomaly Commute Time Approach Addressing Scalability Anomalies in Complex Data Evaluating Anomaly Detection Methods Applications Problem solutions
Generating Labeled Data for Validation
Generating Both Normal and Anomalous Data
Use generative models for normal and anomalous behavior
Several generators available Multivariate continuous data [27] Multivariate categorical data [5] Discrete sequences using HMM [12]
Drawbacks Might not capture the domain characteristics
Injecting Anomalies - Random Perturbation[30]
Given data point z = xy x and y arepartitions of feature space
Take a random sample D of the entire data set
Let zprime = xprimeyprime isin D such that distancebetween y and yprime is maximum
Replace x with xprime and add z back to data setx
yz
zprime
Injected anomaly
Chawla and Chandola Anomaly Detection
Introduction Data Mining Methods Density-based anomaly Commute Time Approach Addressing Scalability Anomalies in Complex Data Evaluating Anomaly Detection Methods Applications Problem solutionsWhat is Network Anomaly Detection Motivation How Much Serious
Applications Overview
How to set up an anomaly detection solution for agiven application domain
Available data Define anomalies define normal behavior Identify requirements and constraints (online
real-time limited resources) What domain knowledge available
Feature identification Defining normal and anomalous behavior Tuning parameters
Available ground truth (training validation)
Chawla and Chandola Anomaly Detection
Introduction Data Mining Methods Density-based anomaly Commute Time Approach Addressing Scalability Anomalies in Complex Data Evaluating Anomaly Detection Methods Applications Problem solutionsWhat is Network Anomaly Detection Motivation How Much Serious
What is Network Anomaly Detection
Anomaly Detection or Intrusion Detection
Traditional Intrusion Detection Systems (IDS) finding attackscorresponding to predefined pattern data set known as signaturestherefore system is absolutely vulnerable against zero-day attacks
Network Anomaly Detection Systems (NADS) to detectzero-day attacks without any pre-identified signature besides profilenormal behavior of the network and address suspected incidents
Network Anomaly Detection finding unusual and largechanges in the network traffic
Examples intentional attacks (eg Distributed Denial ofService - DDoS) or unusual network traffic (eg flash crowds)
Chawla and Chandola Anomaly Detection
Introduction Data Mining Methods Density-based anomaly Commute Time Approach Addressing Scalability Anomalies in Complex Data Evaluating Anomaly Detection Methods Applications Problem solutionsWhat is Network Anomaly Detection Motivation How Much Serious
Motivation How Much Serious
According to Symantec report released in early 2011 morethan 286 million new threats have been detected in 2010which is a huge number
1656227
2704836
1000000
1500000
2000000
2500000
3000000
20547 18827 69107 113025 140690
624267
1656227
2704836
0
500000
1000000
1500000
2000000
2500000
3000000
2002 2003 2004 2005 2006 2007 2008 July2009-June2010
Chawla and Chandola Anomaly Detection
Introduction Data Mining Methods Density-based anomaly Commute Time Approach Addressing Scalability Anomalies in Complex Data Evaluating Anomaly Detection Methods Applications Problem solutionsNetwork Topology Network Anomalies Detection Problem Network Anomalies Detection Problem Why care about OD Flows
Network Topology
A Typical network
1 y
Router
2
3
41t
x2t
x1t
x3t
x4t
Origin-Destination (OD) flow is the traffic that enters at anorigin node and exits at a destination node of a backbonenetwork x1t x1t
Link measurement is the traffic enters at an node during aninterval y1t
Relationship between link traffic and OD flow traffic iscaptured by the routing matrix A
Chawla and Chandola Anomaly Detection
Introduction Data Mining Methods Density-based anomaly Commute Time Approach Addressing Scalability Anomalies in Complex Data Evaluating Anomaly Detection Methods Applications Problem solutionsNetwork Topology Network Anomalies Detection Problem Network Anomalies Detection Problem Why care about OD Flows
Network Anomalies Detection Problem
Chawla and Chandola Anomaly Detection
Introduction Data Mining Methods Density-based anomaly Commute Time Approach Addressing Scalability Anomalies in Complex Data Evaluating Anomaly Detection Methods Applications Problem solutionsNetwork Topology Network Anomalies Detection Problem Network Anomalies Detection Problem Why care about OD Flows
Network Anomalies Detection Problem
Chawla and Chandola Anomaly Detection
Introduction Data Mining Methods Density-based anomaly Commute Time Approach Addressing Scalability Anomalies in Complex Data Evaluating Anomaly Detection Methods Applications Problem solutionsNetwork Topology Network Anomalies Detection Problem Network Anomalies Detection Problem Why care about OD Flows
Why care about OD Flows
Volume anomaly typically arises on an OD flow (trafficarriving at one node and destined for another node)
If we only monitor traffic on network links volume arisingfrom an OD flow may not be noticeable Thus naiveapproach wont work if OD flow info is not available
Figure source [22]
Chawla and Chandola Anomaly Detection
Introduction Data Mining Methods Density-based anomaly Commute Time Approach Addressing Scalability Anomalies in Complex Data Evaluating Anomaly Detection Methods Applications Problem solutionsPCA and Subspace Method Subspace Method Algorithm Subspace Analysis Results Discussion Typical Characteristics of Anomaly Limitation of Volume Entropy Based versus Volume Based Fraud Detection Epidemeology Anomaly Detection in Climate and Weather Anomalies in Climate Validation of Anomalies
PCA and Subspace Method
Chawla and Chandola Anomaly Detection
Introduction Data Mining Methods Density-based anomaly Commute Time Approach Addressing Scalability Anomalies in Complex Data Evaluating Anomaly Detection Methods Applications Problem solutionsPCA and Subspace Method Subspace Method Algorithm Subspace Analysis Results Discussion Typical Characteristics of Anomaly Limitation of Volume Entropy Based versus Volume Based Fraud Detection Epidemeology Anomaly Detection in Climate and Weather Anomalies in Climate Validation of Anomalies
Subspace Method Algorithm
Step1- Determine the PCs based on eigenvaluedecomposition of the covariance matrix of the dataset
Step2- Choose first top k principle components with thehighest eigenvalues as matrix P
Step3-normal traffic subspace called Z
Z = PP TZ = CZ
Step4-abnormal traffic subspace called Z
Z = (I minus PP T )Z = CZ
Step5-If the norm of a vector is large then it is an rdquoanomalyrdquo
Chawla and Chandola Anomaly Detection
Introduction Data Mining Methods Density-based anomaly Commute Time Approach Addressing Scalability Anomalies in Complex Data Evaluating Anomaly Detection Methods Applications Problem solutionsPCA and Subspace Method Subspace Method Algorithm Subspace Analysis Results Discussion Typical Characteristics of Anomaly Limitation of Volume Entropy Based versus Volume Based Fraud Detection Epidemeology Anomaly Detection in Climate and Weather Anomalies in Climate Validation of Anomalies
Subspace Analysis Results
Note that during anomaly normal component does not changethat much while residual component changes quite a lot
Thus anomalies can be detected by setting some threshold
Figure source [22]
Chawla and Chandola Anomaly Detection
Introduction Data Mining Methods Density-based anomaly Commute Time Approach Addressing Scalability Anomalies in Complex Data Evaluating Anomaly Detection Methods Applications Problem solutionsPCA and Subspace Method Subspace Method Algorithm Subspace Analysis Results Discussion Typical Characteristics of Anomaly Limitation of Volume Entropy Based versus Volume Based Fraud Detection Epidemeology Anomaly Detection in Climate and Weather Anomalies in Climate Validation of Anomalies
Discussion Typical Characteristics of Anomaly
Most Anomalies induce a change in distributionalaspects of packet header fields (called features)
Most important features include 5-tuple Source ampdestination IP addresses Source and destination portnumbers and IP protocol
raquo DOS attack ndash multiple source IP address concentrated on asingle destination IP address
raquo Network scan ndash dispersed distribution of destination addresses
raquo Most wormsviruses also induce some change in distribution ofcertain features
raquo However these changes can be very subtle and mining them islike searching for needles in a haystack
Unlike many previous approach this paper aims todetect events which disturb the distribution of trafficfeatures rather than traffic volume
Chawla and Chandola Anomaly Detection
Introduction Data Mining Methods Density-based anomaly Commute Time Approach Addressing Scalability Anomalies in Complex Data Evaluating Anomaly Detection Methods Applications Problem solutionsPCA and Subspace Method Subspace Method Algorithm Subspace Analysis Results Discussion Typical Characteristics of Anomaly Limitation of Volume Entropy Based versus Volume Based Fraud Detection Epidemeology Anomaly Detection in Climate and Weather Anomalies in Climate Validation of Anomalies
Limitation of Volume
Figure source [22]
Port scan anomaly (traffic feature changes however traffic volume
remains more or less the same)
We can use entropy tocapture the variationsin the traffic feature
bullTakes value 0 when distribution is maximally concentratedbullTakes value log2N when distribution is maximally dispersed
But stands out in
feature entropy
which also reveals
its structure
Port scan
dwarfed
in volume
metricshellip
Chawla and Chandola Anomaly Detection
Introduction Data Mining Methods Density-based anomaly Commute Time Approach Addressing Scalability Anomalies in Complex Data Evaluating Anomaly Detection Methods Applications Problem solutionsPCA and Subspace Method Subspace Method Algorithm Subspace Analysis Results Discussion Typical Characteristics of Anomaly Limitation of Volume Entropy Based versus Volume Based Fraud Detection Epidemeology Anomaly Detection in Climate and Weather Anomalies in Climate Validation of Anomalies
Entropy Based versus Volume Based
DoSDDoS Attacks- a spike in traffic data toward adominant destination IP
Scan anomaly-a spike in traffic data from a dominant sourceIP
Flash Crowd anomaly- again a spike in traffic data to adominant destination IP
Worm anomaly-a Spike in traffic with a dominant port
Chawla and Chandola Anomaly Detection
Introduction Data Mining Methods Density-based anomaly Commute Time Approach Addressing Scalability Anomalies in Complex Data Evaluating Anomaly Detection Methods Applications Problem solutionsPCA and Subspace Method Subspace Method Algorithm Subspace Analysis Results Discussion Typical Characteristics of Anomaly Limitation of Volume Entropy Based versus Volume Based Fraud Detection Epidemeology Anomaly Detection in Climate and Weather Anomalies in Climate Validation of Anomalies
Fraud Detection
Domain Question Identifyfraudulent activities or players fromobserved transaction data
Data Transactions between different
players in the system Meta information about the
individuals An underlying graph structure
Challenges Track and model human behavior Anomalies caused by adaptive
human adversaries Massive data sizes
Insurance (autohealtha)
ClaimantProvider Payer
Telecommunications Customer
Provider
Credit Cards Customer
Supplier Bank
Web Advertising User Advertiser
Publisher
ahttpwwwcheatingculturecompast-cases-of-medicare-fraud
Chawla and Chandola Anomaly Detection
Introduction Data Mining Methods Density-based anomaly Commute Time Approach Addressing Scalability Anomalies in Complex Data Evaluating Anomaly Detection Methods Applications Problem solutionsPCA and Subspace Method Subspace Method Algorithm Subspace Analysis Results Discussion Typical Characteristics of Anomaly Limitation of Volume Entropy Based versus Volume Based Fraud Detection Epidemeology Anomaly Detection in Climate and Weather Anomalies in Climate Validation of Anomalies
A Generic Fraud Detection Method
Activity Monitoring [13]1 Build profiles for individuals (customers users etc) based on
historic data User X makes n calls on an average in January
2 Compare current behavior with historical profile for significantdeviations
Clustering based [4]1 Cluster historical profiles of customers2 Identify small clusters or outlying profiles as anomalies
Strengths Anomaly detection is fast (good for real time) Results are easy to explain
Weaknesses Need to create and maintain a large number of profiles Not dynamic Adequate historical data might not be available Too many false positives
Chawla and Chandola Anomaly Detection
Introduction Data Mining Methods Density-based anomaly Commute Time Approach Addressing Scalability Anomalies in Complex Data Evaluating Anomaly Detection Methods Applications Problem solutionsPCA and Subspace Method Subspace Method Algorithm Subspace Analysis Results Discussion Typical Characteristics of Anomaly Limitation of Volume Entropy Based versus Volume Based Fraud Detection Epidemeology Anomaly Detection in Climate and Weather Anomalies in Climate Validation of Anomalies
Exploiting Graph Structure - Weighted Graphs
Represent data as a weighted graph Communication networks (phone email SMS) Provider referral networks
Objective Identify anomalous nodes
For each node extract several features based on the propertiesof the induced sub-graph (egonet) of neighboring nodes [1]
Choose features that can highlight anomalous nodes
1 Ni degree of node2 Ei number of edges in egonet3 Wi total weight of egonet4 λi principal eigen vector of weighted adjacency matrix of
egonet
Data is transformed into a point in a multi-dimensional space
Chawla and Chandola Anomaly Detection
Introduction Data Mining Methods Density-based anomaly Commute Time Approach Addressing Scalability Anomalies in Complex Data Evaluating Anomaly Detection Methods Applications Problem solutionsPCA and Subspace Method Subspace Method Algorithm Subspace Analysis Results Discussion Typical Characteristics of Anomaly Limitation of Volume Entropy Based versus Volume Based Fraud Detection Epidemeology Anomaly Detection in Climate and Weather Anomalies in Climate Validation of Anomalies
Identifying Anomalies
Traditional anomaly detection (lof) Can be slow but can identify any type of anomalous structure
Faster method to identify specific types of anomalousstructures
Identify relevant feature pairs and power law relationship
Eg Egonet Density Power Law Ni vs Ei - detect nearcliques and stars
Ei prop Nαi 1 le α le 2
Anomaly score for node i wrt a pair of features (y = Cxθ)
Si =max(yi Cx
θi )
min(yi Cxθi )lowast log (|yi minus Cxθi |+ 1)
Chawla and Chandola Anomaly Detection
Introduction Data Mining Methods Density-based anomaly Commute Time Approach Addressing Scalability Anomalies in Complex Data Evaluating Anomaly Detection Methods Applications Problem solutionsPCA and Subspace Method Subspace Method Algorithm Subspace Analysis Results Discussion Typical Characteristics of Anomaly Limitation of Volume Entropy Based versus Volume Based Fraud Detection Epidemeology Anomaly Detection in Climate and Weather Anomalies in Climate Validation of Anomalies
Exploiting Graph Structure - Bipartite Graphs
Represent data as a bipartite graph Healthcare Data (Beneficiaries vs Providers) Insider trading (Traders vs Stocks)
Objective Identify anomalous links
Given a query node a isin V1 find the ldquorelevancerdquoof all other nodes in V1 to a
RelevanceScore(a b) prop Number of times aldquorandom walkrdquo from a reaches b
Use the relevance scores to compute thenormality scores for a node t isin V2
Find set St = a|〈a t〉 isin E Compute |St| times |St| similarity matrix using
relevance vectors for a isin St Normality Score = mean of non-diagonal entries
of similarity matrix
V1 E V2a1
a2
a3
an
t1
t2
t3
tn
Chawla and Chandola Anomaly Detection
Introduction Data Mining Methods Density-based anomaly Commute Time Approach Addressing Scalability Anomalies in Complex Data Evaluating Anomaly Detection Methods Applications Problem solutionsPCA and Subspace Method Subspace Method Algorithm Subspace Analysis Results Discussion Typical Characteristics of Anomaly Limitation of Volume Entropy Based versus Volume Based Fraud Detection Epidemeology Anomaly Detection in Climate and Weather Anomalies in Climate Validation of Anomalies
Detecting Disease Outbreaks
Domain Question Early detection of disease
outbreaks Anthrax attack
Data Emergency department visits Grocery data (Example [14]) Clinical visits Weatherclimate data
Challenges Weak signals in the data
ED cases involving cough rArrFlu or SARS
Integration of multiple signals(lag analysis)
Account for spatial and temporalcorrelations
Chawla and Chandola Anomaly Detection
Introduction Data Mining Methods Density-based anomaly Commute Time Approach Addressing Scalability Anomalies in Complex Data Evaluating Anomaly Detection Methods Applications Problem solutionsPCA and Subspace Method Subspace Method Algorithm Subspace Analysis Results Discussion Typical Characteristics of Anomaly Limitation of Volume Entropy Based versus Volume Based Fraud Detection Epidemeology Anomaly Detection in Climate and Weather Anomalies in Climate Validation of Anomalies
Whatrsquos Significant About Recent Events (WSARE) [33]
1 Learn Bayesian network from historical data Environmental and response variables
2 Sample from the BN (DBbaseline|Current Environment)3 Compute contingency table for rules for DBbaseline andDBcurrent
Rules are single assignment rules (Xi = Y ji ) or conjunctions4 Find p-value for rules using χ2-test
Null Hypothesis Rows and columns of tables for DBbaselineand DBcurrent are independent
5 Find rule with largest p-value Repeat Step 2
Chawla and Chandola Anomaly Detection
Introduction Data Mining Methods Density-based anomaly Commute Time Approach Addressing Scalability Anomalies in Complex Data Evaluating Anomaly Detection Methods Applications Problem solutionsPCA and Subspace Method Subspace Method Algorithm Subspace Analysis Results Discussion Typical Characteristics of Anomaly Limitation of Volume Entropy Based versus Volume Based Fraud Detection Epidemeology Anomaly Detection in Climate and Weather Anomalies in Climate Validation of Anomalies
Incorporating Spatial and Temporal Relationships
WSARE does not explicitly model the spatial and temporalrelationships
What happened yesterday What happened in the adjoining neighborhood (yesterday)
Bayesian Network Spatio-Temporal (BNST) modelingframework [17]
Add nodes for temporal and spatial dependencies Need more data to train
Chawla and Chandola Anomaly Detection
Introduction Data Mining Methods Density-based anomaly Commute Time Approach Addressing Scalability Anomalies in Complex Data Evaluating Anomaly Detection Methods Applications Problem solutionsPCA and Subspace Method Subspace Method Algorithm Subspace Analysis Results Discussion Typical Characteristics of Anomaly Limitation of Volume Entropy Based versus Volume Based Fraud Detection Epidemeology Anomaly Detection in Climate and Weather Anomalies in Climate Validation of Anomalies
Anomaly Detection in Climate and Weather
Science Questions Identify natural and anthropogenic disasters Identify long time scale events - droughts atmospheric rivers
cold fronts etc
Data Ground observations Remote sensing data (satellites
air-borne) Climate model simulation outputs Multiple variables spatio-temporal (often has height dimension
as well)
Challenges Model spatio-temporal relationships across multiple variables Explain the cause of anomalies Massive data sizes
Climate and weather extreme events are well defined
Key challenge is to find significant events and explain the cause
Chawla and Chandola Anomaly Detection
Introduction Data Mining Methods Density-based anomaly Commute Time Approach Addressing Scalability Anomalies in Complex Data Evaluating Anomaly Detection Methods Applications Problem solutionsPCA and Subspace Method Subspace Method Algorithm Subspace Analysis Results Discussion Typical Characteristics of Anomaly Limitation of Volume Entropy Based versus Volume Based Fraud Detection Epidemeology Anomaly Detection in Climate and Weather Anomalies in Climate Validation of Anomalies
Anomalies are Widely Used in Climate
Most analysis done on ldquoanomalyrdquo time series
Difference from a ldquobase periodrdquo (Toosimplistic)
Brings spatial smoothness (eg a mountaintop and nearby valley can have very differenttemperatures) Removes seasonality
Understand climate and weatherphenomenon
Southern Oscillation Index (SOI) Difference between Sea Level Pressure
(SLP) anomalies for Tahiti and DarwinAustralia
Figure Global AverageTemperature Anomaly(1975 - 2007) Srcwwwmetofficegovuk
Chawla and Chandola Anomaly Detection
Introduction Data Mining Methods Density-based anomaly Commute Time Approach Addressing Scalability Anomalies in Complex Data Evaluating Anomaly Detection Methods Applications Problem solutionsPCA and Subspace Method Subspace Method Algorithm Subspace Analysis Results Discussion Typical Characteristics of Anomaly Limitation of Volume Entropy Based versus Volume Based Fraud Detection Epidemeology Anomaly Detection in Climate and Weather Anomalies in Climate Validation of Anomalies
Constructing Anomalies from Raw Data
Anomaly time series for a given location i
vprimei = vi minus bi
where bi is the base (reference)
How to choose bi Mean of all data for location i Monthly mean values (account for seasonality) Monthly z-score values Median (more robust) Using a shorter ldquoreference periodrdquo
30 year moving window
Different methods show statistically significant differences[19] What is the right strategy Weighted mean of different strategies (Pick weights using
Monte Carlo sampling)
Chawla and Chandola Anomaly Detection
Introduction Data Mining Methods Density-based anomaly Commute Time Approach Addressing Scalability Anomalies in Complex Data Evaluating Anomaly Detection Methods Applications Problem solutionsPCA and Subspace Method Subspace Method Algorithm Subspace Analysis Results Discussion Typical Characteristics of Anomaly Limitation of Volume Entropy Based versus Volume Based Fraud Detection Epidemeology Anomaly Detection in Climate and Weather Anomalies in Climate Validation of Anomalies
Anomaly Detection for Identifying Droughts
Science question Identify significant drought patterns usinghistorical observation data or future simulation data or both
Find persistent spatiotemporal anomalies in precipitation data
A two step approach
1 Find precipitationanomalies usingthresholds
2 Find large connectedcomponents across spaceand time
Matlab - bwlabelbwlabeln
Followup Science questionExplain cause
(drought190120061avi)
Figure Video courtsey Dr ArindamBanerjee
Chawla and Chandola Anomaly Detection
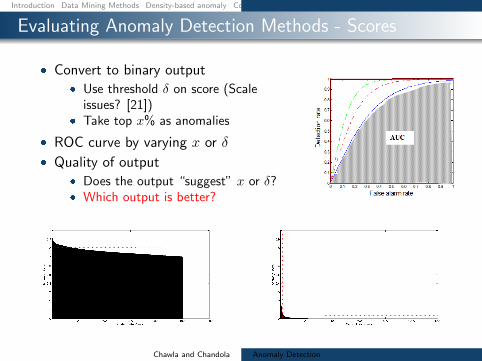
Introduction Data Mining Methods Density-based anomaly Commute Time Approach Addressing Scalability Anomalies in Complex Data Evaluating Anomaly Detection Methods Applications Problem solutions
Evaluating Anomaly Detection Methods - Scores
Convert to binary output Use threshold δ on score (Scale
issues [21]) Take top x as anomalies
ROC curve by varying x or δ
Quality of output Does the output ldquosuggestrdquo x or δ Which output is better
Chawla and Chandola Anomaly Detection
Introduction Data Mining Methods Density-based anomaly Commute Time Approach Addressing Scalability Anomalies in Complex Data Evaluating Anomaly Detection Methods Applications Problem solutions
Unifying Scores
Different methods assign scores in differentranges
kNN-based scores [0 1] Lof scores [1 6] ABOD scores [0 80000]
Anomalies have lower scores
Direct scaling to [0 1] might lose distinctionbetween normal and anomalies
Desired scaling Stretch interesting rangesand shrink irrelevant ones
Generalized Procedure for Normalizing Outlier Scores [21] Regularity rArr S(o) ge 0forallo S(o) asymp 0 if o is normal andS(o) 0 if o is anomalous
Normality S is regular and S(o) isin [0 1]forallo
Chawla and Chandola Anomaly Detection
Introduction Data Mining Methods Density-based anomaly Commute Time Approach Addressing Scalability Anomalies in Complex Data Evaluating Anomaly Detection Methods Applications Problem solutions
Regularization and Normalization of Scores
Regularization
1 R(o) = max0 S(o)minus baseS2 R(o) = Smax minus S(o)
3 R(o) = minus log SmaxS(o)
Normalization
1 N(o) = S(o)Smax
2 N(o) = max(
0 erf(S(o)minusmicroSσS radic2
))(Gaussian Scaling)
Suited for high dimensional data
3 N(o) = max(
0cdfγS (o)minusmicroγ
1minusmicroγ
)(Gamma Scaling)
Where cdfγS (o) = P (k S(o) θ) P is the regularized Gamma function Suited for low dimensional data
Chawla and Chandola Anomaly Detection
Introduction Data Mining Methods Density-based anomaly Commute Time Approach Addressing Scalability Anomalies in Complex Data Evaluating Anomaly Detection Methods Applications Problem solutions
Generating Labeled Data for Validation
Generating Both Normal and Anomalous Data
Use generative models for normal and anomalous behavior
Several generators available Multivariate continuous data [27] Multivariate categorical data [5] Discrete sequences using HMM [12]
Drawbacks Might not capture the domain characteristics
Injecting Anomalies - Random Perturbation[30]
Given data point z = xy x and y arepartitions of feature space
Take a random sample D of the entire data set
Let zprime = xprimeyprime isin D such that distancebetween y and yprime is maximum
Replace x with xprime and add z back to data setx
yz
zprime
Injected anomaly
Chawla and Chandola Anomaly Detection
Introduction Data Mining Methods Density-based anomaly Commute Time Approach Addressing Scalability Anomalies in Complex Data Evaluating Anomaly Detection Methods Applications Problem solutionsWhat is Network Anomaly Detection Motivation How Much Serious
Applications Overview
How to set up an anomaly detection solution for agiven application domain
Available data Define anomalies define normal behavior Identify requirements and constraints (online
real-time limited resources) What domain knowledge available
Feature identification Defining normal and anomalous behavior Tuning parameters
Available ground truth (training validation)
Chawla and Chandola Anomaly Detection
Introduction Data Mining Methods Density-based anomaly Commute Time Approach Addressing Scalability Anomalies in Complex Data Evaluating Anomaly Detection Methods Applications Problem solutionsWhat is Network Anomaly Detection Motivation How Much Serious
What is Network Anomaly Detection
Anomaly Detection or Intrusion Detection
Traditional Intrusion Detection Systems (IDS) finding attackscorresponding to predefined pattern data set known as signaturestherefore system is absolutely vulnerable against zero-day attacks
Network Anomaly Detection Systems (NADS) to detectzero-day attacks without any pre-identified signature besides profilenormal behavior of the network and address suspected incidents
Network Anomaly Detection finding unusual and largechanges in the network traffic
Examples intentional attacks (eg Distributed Denial ofService - DDoS) or unusual network traffic (eg flash crowds)
Chawla and Chandola Anomaly Detection
Introduction Data Mining Methods Density-based anomaly Commute Time Approach Addressing Scalability Anomalies in Complex Data Evaluating Anomaly Detection Methods Applications Problem solutionsWhat is Network Anomaly Detection Motivation How Much Serious
Motivation How Much Serious
According to Symantec report released in early 2011 morethan 286 million new threats have been detected in 2010which is a huge number
1656227
2704836
1000000
1500000
2000000
2500000
3000000
20547 18827 69107 113025 140690
624267
1656227
2704836
0
500000
1000000
1500000
2000000
2500000
3000000
2002 2003 2004 2005 2006 2007 2008 July2009-June2010
Chawla and Chandola Anomaly Detection
Introduction Data Mining Methods Density-based anomaly Commute Time Approach Addressing Scalability Anomalies in Complex Data Evaluating Anomaly Detection Methods Applications Problem solutionsNetwork Topology Network Anomalies Detection Problem Network Anomalies Detection Problem Why care about OD Flows
Network Topology
A Typical network
1 y
Router
2
3
41t
x2t
x1t
x3t
x4t
Origin-Destination (OD) flow is the traffic that enters at anorigin node and exits at a destination node of a backbonenetwork x1t x1t
Link measurement is the traffic enters at an node during aninterval y1t
Relationship between link traffic and OD flow traffic iscaptured by the routing matrix A
Chawla and Chandola Anomaly Detection
Introduction Data Mining Methods Density-based anomaly Commute Time Approach Addressing Scalability Anomalies in Complex Data Evaluating Anomaly Detection Methods Applications Problem solutionsNetwork Topology Network Anomalies Detection Problem Network Anomalies Detection Problem Why care about OD Flows
Network Anomalies Detection Problem
Chawla and Chandola Anomaly Detection
Introduction Data Mining Methods Density-based anomaly Commute Time Approach Addressing Scalability Anomalies in Complex Data Evaluating Anomaly Detection Methods Applications Problem solutionsNetwork Topology Network Anomalies Detection Problem Network Anomalies Detection Problem Why care about OD Flows
Network Anomalies Detection Problem
Chawla and Chandola Anomaly Detection
Introduction Data Mining Methods Density-based anomaly Commute Time Approach Addressing Scalability Anomalies in Complex Data Evaluating Anomaly Detection Methods Applications Problem solutionsNetwork Topology Network Anomalies Detection Problem Network Anomalies Detection Problem Why care about OD Flows
Why care about OD Flows
Volume anomaly typically arises on an OD flow (trafficarriving at one node and destined for another node)
If we only monitor traffic on network links volume arisingfrom an OD flow may not be noticeable Thus naiveapproach wont work if OD flow info is not available
Figure source [22]
Chawla and Chandola Anomaly Detection
Introduction Data Mining Methods Density-based anomaly Commute Time Approach Addressing Scalability Anomalies in Complex Data Evaluating Anomaly Detection Methods Applications Problem solutionsPCA and Subspace Method Subspace Method Algorithm Subspace Analysis Results Discussion Typical Characteristics of Anomaly Limitation of Volume Entropy Based versus Volume Based Fraud Detection Epidemeology Anomaly Detection in Climate and Weather Anomalies in Climate Validation of Anomalies
PCA and Subspace Method
Chawla and Chandola Anomaly Detection
Introduction Data Mining Methods Density-based anomaly Commute Time Approach Addressing Scalability Anomalies in Complex Data Evaluating Anomaly Detection Methods Applications Problem solutionsPCA and Subspace Method Subspace Method Algorithm Subspace Analysis Results Discussion Typical Characteristics of Anomaly Limitation of Volume Entropy Based versus Volume Based Fraud Detection Epidemeology Anomaly Detection in Climate and Weather Anomalies in Climate Validation of Anomalies
Subspace Method Algorithm
Step1- Determine the PCs based on eigenvaluedecomposition of the covariance matrix of the dataset
Step2- Choose first top k principle components with thehighest eigenvalues as matrix P
Step3-normal traffic subspace called Z
Z = PP TZ = CZ
Step4-abnormal traffic subspace called Z
Z = (I minus PP T )Z = CZ
Step5-If the norm of a vector is large then it is an rdquoanomalyrdquo
Chawla and Chandola Anomaly Detection
Introduction Data Mining Methods Density-based anomaly Commute Time Approach Addressing Scalability Anomalies in Complex Data Evaluating Anomaly Detection Methods Applications Problem solutionsPCA and Subspace Method Subspace Method Algorithm Subspace Analysis Results Discussion Typical Characteristics of Anomaly Limitation of Volume Entropy Based versus Volume Based Fraud Detection Epidemeology Anomaly Detection in Climate and Weather Anomalies in Climate Validation of Anomalies
Subspace Analysis Results
Note that during anomaly normal component does not changethat much while residual component changes quite a lot
Thus anomalies can be detected by setting some threshold
Figure source [22]
Chawla and Chandola Anomaly Detection
Introduction Data Mining Methods Density-based anomaly Commute Time Approach Addressing Scalability Anomalies in Complex Data Evaluating Anomaly Detection Methods Applications Problem solutionsPCA and Subspace Method Subspace Method Algorithm Subspace Analysis Results Discussion Typical Characteristics of Anomaly Limitation of Volume Entropy Based versus Volume Based Fraud Detection Epidemeology Anomaly Detection in Climate and Weather Anomalies in Climate Validation of Anomalies
Discussion Typical Characteristics of Anomaly
Most Anomalies induce a change in distributionalaspects of packet header fields (called features)
Most important features include 5-tuple Source ampdestination IP addresses Source and destination portnumbers and IP protocol
raquo DOS attack ndash multiple source IP address concentrated on asingle destination IP address
raquo Network scan ndash dispersed distribution of destination addresses
raquo Most wormsviruses also induce some change in distribution ofcertain features
raquo However these changes can be very subtle and mining them islike searching for needles in a haystack
Unlike many previous approach this paper aims todetect events which disturb the distribution of trafficfeatures rather than traffic volume
Chawla and Chandola Anomaly Detection
Introduction Data Mining Methods Density-based anomaly Commute Time Approach Addressing Scalability Anomalies in Complex Data Evaluating Anomaly Detection Methods Applications Problem solutionsPCA and Subspace Method Subspace Method Algorithm Subspace Analysis Results Discussion Typical Characteristics of Anomaly Limitation of Volume Entropy Based versus Volume Based Fraud Detection Epidemeology Anomaly Detection in Climate and Weather Anomalies in Climate Validation of Anomalies
Limitation of Volume
Figure source [22]
Port scan anomaly (traffic feature changes however traffic volume
remains more or less the same)
We can use entropy tocapture the variationsin the traffic feature
bullTakes value 0 when distribution is maximally concentratedbullTakes value log2N when distribution is maximally dispersed
But stands out in
feature entropy
which also reveals
its structure
Port scan
dwarfed
in volume
metricshellip
Chawla and Chandola Anomaly Detection
Introduction Data Mining Methods Density-based anomaly Commute Time Approach Addressing Scalability Anomalies in Complex Data Evaluating Anomaly Detection Methods Applications Problem solutionsPCA and Subspace Method Subspace Method Algorithm Subspace Analysis Results Discussion Typical Characteristics of Anomaly Limitation of Volume Entropy Based versus Volume Based Fraud Detection Epidemeology Anomaly Detection in Climate and Weather Anomalies in Climate Validation of Anomalies
Entropy Based versus Volume Based
DoSDDoS Attacks- a spike in traffic data toward adominant destination IP
Scan anomaly-a spike in traffic data from a dominant sourceIP
Flash Crowd anomaly- again a spike in traffic data to adominant destination IP
Worm anomaly-a Spike in traffic with a dominant port
Chawla and Chandola Anomaly Detection
Introduction Data Mining Methods Density-based anomaly Commute Time Approach Addressing Scalability Anomalies in Complex Data Evaluating Anomaly Detection Methods Applications Problem solutionsPCA and Subspace Method Subspace Method Algorithm Subspace Analysis Results Discussion Typical Characteristics of Anomaly Limitation of Volume Entropy Based versus Volume Based Fraud Detection Epidemeology Anomaly Detection in Climate and Weather Anomalies in Climate Validation of Anomalies
Fraud Detection
Domain Question Identifyfraudulent activities or players fromobserved transaction data
Data Transactions between different
players in the system Meta information about the
individuals An underlying graph structure
Challenges Track and model human behavior Anomalies caused by adaptive
human adversaries Massive data sizes
Insurance (autohealtha)
ClaimantProvider Payer
Telecommunications Customer
Provider
Credit Cards Customer
Supplier Bank
Web Advertising User Advertiser
Publisher
ahttpwwwcheatingculturecompast-cases-of-medicare-fraud
Chawla and Chandola Anomaly Detection
Introduction Data Mining Methods Density-based anomaly Commute Time Approach Addressing Scalability Anomalies in Complex Data Evaluating Anomaly Detection Methods Applications Problem solutionsPCA and Subspace Method Subspace Method Algorithm Subspace Analysis Results Discussion Typical Characteristics of Anomaly Limitation of Volume Entropy Based versus Volume Based Fraud Detection Epidemeology Anomaly Detection in Climate and Weather Anomalies in Climate Validation of Anomalies
A Generic Fraud Detection Method
Activity Monitoring [13]1 Build profiles for individuals (customers users etc) based on
historic data User X makes n calls on an average in January
2 Compare current behavior with historical profile for significantdeviations
Clustering based [4]1 Cluster historical profiles of customers2 Identify small clusters or outlying profiles as anomalies
Strengths Anomaly detection is fast (good for real time) Results are easy to explain
Weaknesses Need to create and maintain a large number of profiles Not dynamic Adequate historical data might not be available Too many false positives
Chawla and Chandola Anomaly Detection
Introduction Data Mining Methods Density-based anomaly Commute Time Approach Addressing Scalability Anomalies in Complex Data Evaluating Anomaly Detection Methods Applications Problem solutionsPCA and Subspace Method Subspace Method Algorithm Subspace Analysis Results Discussion Typical Characteristics of Anomaly Limitation of Volume Entropy Based versus Volume Based Fraud Detection Epidemeology Anomaly Detection in Climate and Weather Anomalies in Climate Validation of Anomalies
Exploiting Graph Structure - Weighted Graphs
Represent data as a weighted graph Communication networks (phone email SMS) Provider referral networks
Objective Identify anomalous nodes
For each node extract several features based on the propertiesof the induced sub-graph (egonet) of neighboring nodes [1]
Choose features that can highlight anomalous nodes
1 Ni degree of node2 Ei number of edges in egonet3 Wi total weight of egonet4 λi principal eigen vector of weighted adjacency matrix of
egonet
Data is transformed into a point in a multi-dimensional space
Chawla and Chandola Anomaly Detection
Introduction Data Mining Methods Density-based anomaly Commute Time Approach Addressing Scalability Anomalies in Complex Data Evaluating Anomaly Detection Methods Applications Problem solutionsPCA and Subspace Method Subspace Method Algorithm Subspace Analysis Results Discussion Typical Characteristics of Anomaly Limitation of Volume Entropy Based versus Volume Based Fraud Detection Epidemeology Anomaly Detection in Climate and Weather Anomalies in Climate Validation of Anomalies
Identifying Anomalies
Traditional anomaly detection (lof) Can be slow but can identify any type of anomalous structure
Faster method to identify specific types of anomalousstructures
Identify relevant feature pairs and power law relationship
Eg Egonet Density Power Law Ni vs Ei - detect nearcliques and stars
Ei prop Nαi 1 le α le 2
Anomaly score for node i wrt a pair of features (y = Cxθ)
Si =max(yi Cx
θi )
min(yi Cxθi )lowast log (|yi minus Cxθi |+ 1)
Chawla and Chandola Anomaly Detection
Introduction Data Mining Methods Density-based anomaly Commute Time Approach Addressing Scalability Anomalies in Complex Data Evaluating Anomaly Detection Methods Applications Problem solutionsPCA and Subspace Method Subspace Method Algorithm Subspace Analysis Results Discussion Typical Characteristics of Anomaly Limitation of Volume Entropy Based versus Volume Based Fraud Detection Epidemeology Anomaly Detection in Climate and Weather Anomalies in Climate Validation of Anomalies
Exploiting Graph Structure - Bipartite Graphs
Represent data as a bipartite graph Healthcare Data (Beneficiaries vs Providers) Insider trading (Traders vs Stocks)
Objective Identify anomalous links
Given a query node a isin V1 find the ldquorelevancerdquoof all other nodes in V1 to a
RelevanceScore(a b) prop Number of times aldquorandom walkrdquo from a reaches b
Use the relevance scores to compute thenormality scores for a node t isin V2
Find set St = a|〈a t〉 isin E Compute |St| times |St| similarity matrix using
relevance vectors for a isin St Normality Score = mean of non-diagonal entries
of similarity matrix
V1 E V2a1
a2
a3
an
t1
t2
t3
tn
Chawla and Chandola Anomaly Detection
Introduction Data Mining Methods Density-based anomaly Commute Time Approach Addressing Scalability Anomalies in Complex Data Evaluating Anomaly Detection Methods Applications Problem solutionsPCA and Subspace Method Subspace Method Algorithm Subspace Analysis Results Discussion Typical Characteristics of Anomaly Limitation of Volume Entropy Based versus Volume Based Fraud Detection Epidemeology Anomaly Detection in Climate and Weather Anomalies in Climate Validation of Anomalies
Detecting Disease Outbreaks
Domain Question Early detection of disease
outbreaks Anthrax attack
Data Emergency department visits Grocery data (Example [14]) Clinical visits Weatherclimate data
Challenges Weak signals in the data
ED cases involving cough rArrFlu or SARS
Integration of multiple signals(lag analysis)
Account for spatial and temporalcorrelations
Chawla and Chandola Anomaly Detection
Introduction Data Mining Methods Density-based anomaly Commute Time Approach Addressing Scalability Anomalies in Complex Data Evaluating Anomaly Detection Methods Applications Problem solutionsPCA and Subspace Method Subspace Method Algorithm Subspace Analysis Results Discussion Typical Characteristics of Anomaly Limitation of Volume Entropy Based versus Volume Based Fraud Detection Epidemeology Anomaly Detection in Climate and Weather Anomalies in Climate Validation of Anomalies
Whatrsquos Significant About Recent Events (WSARE) [33]
1 Learn Bayesian network from historical data Environmental and response variables
2 Sample from the BN (DBbaseline|Current Environment)3 Compute contingency table for rules for DBbaseline andDBcurrent
Rules are single assignment rules (Xi = Y ji ) or conjunctions4 Find p-value for rules using χ2-test
Null Hypothesis Rows and columns of tables for DBbaselineand DBcurrent are independent
5 Find rule with largest p-value Repeat Step 2
Chawla and Chandola Anomaly Detection
Introduction Data Mining Methods Density-based anomaly Commute Time Approach Addressing Scalability Anomalies in Complex Data Evaluating Anomaly Detection Methods Applications Problem solutionsPCA and Subspace Method Subspace Method Algorithm Subspace Analysis Results Discussion Typical Characteristics of Anomaly Limitation of Volume Entropy Based versus Volume Based Fraud Detection Epidemeology Anomaly Detection in Climate and Weather Anomalies in Climate Validation of Anomalies
Incorporating Spatial and Temporal Relationships
WSARE does not explicitly model the spatial and temporalrelationships
What happened yesterday What happened in the adjoining neighborhood (yesterday)
Bayesian Network Spatio-Temporal (BNST) modelingframework [17]
Add nodes for temporal and spatial dependencies Need more data to train
Chawla and Chandola Anomaly Detection
Introduction Data Mining Methods Density-based anomaly Commute Time Approach Addressing Scalability Anomalies in Complex Data Evaluating Anomaly Detection Methods Applications Problem solutionsPCA and Subspace Method Subspace Method Algorithm Subspace Analysis Results Discussion Typical Characteristics of Anomaly Limitation of Volume Entropy Based versus Volume Based Fraud Detection Epidemeology Anomaly Detection in Climate and Weather Anomalies in Climate Validation of Anomalies
Anomaly Detection in Climate and Weather
Science Questions Identify natural and anthropogenic disasters Identify long time scale events - droughts atmospheric rivers
cold fronts etc
Data Ground observations Remote sensing data (satellites
air-borne) Climate model simulation outputs Multiple variables spatio-temporal (often has height dimension
as well)
Challenges Model spatio-temporal relationships across multiple variables Explain the cause of anomalies Massive data sizes
Climate and weather extreme events are well defined
Key challenge is to find significant events and explain the cause
Chawla and Chandola Anomaly Detection
Introduction Data Mining Methods Density-based anomaly Commute Time Approach Addressing Scalability Anomalies in Complex Data Evaluating Anomaly Detection Methods Applications Problem solutionsPCA and Subspace Method Subspace Method Algorithm Subspace Analysis Results Discussion Typical Characteristics of Anomaly Limitation of Volume Entropy Based versus Volume Based Fraud Detection Epidemeology Anomaly Detection in Climate and Weather Anomalies in Climate Validation of Anomalies
Anomalies are Widely Used in Climate
Most analysis done on ldquoanomalyrdquo time series
Difference from a ldquobase periodrdquo (Toosimplistic)
Brings spatial smoothness (eg a mountaintop and nearby valley can have very differenttemperatures) Removes seasonality
Understand climate and weatherphenomenon
Southern Oscillation Index (SOI) Difference between Sea Level Pressure
(SLP) anomalies for Tahiti and DarwinAustralia
Figure Global AverageTemperature Anomaly(1975 - 2007) Srcwwwmetofficegovuk
Chawla and Chandola Anomaly Detection
Introduction Data Mining Methods Density-based anomaly Commute Time Approach Addressing Scalability Anomalies in Complex Data Evaluating Anomaly Detection Methods Applications Problem solutionsPCA and Subspace Method Subspace Method Algorithm Subspace Analysis Results Discussion Typical Characteristics of Anomaly Limitation of Volume Entropy Based versus Volume Based Fraud Detection Epidemeology Anomaly Detection in Climate and Weather Anomalies in Climate Validation of Anomalies
Constructing Anomalies from Raw Data
Anomaly time series for a given location i
vprimei = vi minus bi
where bi is the base (reference)
How to choose bi Mean of all data for location i Monthly mean values (account for seasonality) Monthly z-score values Median (more robust) Using a shorter ldquoreference periodrdquo
30 year moving window
Different methods show statistically significant differences[19] What is the right strategy Weighted mean of different strategies (Pick weights using
Monte Carlo sampling)
Chawla and Chandola Anomaly Detection
Introduction Data Mining Methods Density-based anomaly Commute Time Approach Addressing Scalability Anomalies in Complex Data Evaluating Anomaly Detection Methods Applications Problem solutionsPCA and Subspace Method Subspace Method Algorithm Subspace Analysis Results Discussion Typical Characteristics of Anomaly Limitation of Volume Entropy Based versus Volume Based Fraud Detection Epidemeology Anomaly Detection in Climate and Weather Anomalies in Climate Validation of Anomalies
Anomaly Detection for Identifying Droughts
Science question Identify significant drought patterns usinghistorical observation data or future simulation data or both
Find persistent spatiotemporal anomalies in precipitation data
A two step approach
1 Find precipitationanomalies usingthresholds
2 Find large connectedcomponents across spaceand time
Matlab - bwlabelbwlabeln
Followup Science questionExplain cause
(drought190120061avi)
Figure Video courtsey Dr ArindamBanerjee
Chawla and Chandola Anomaly Detection
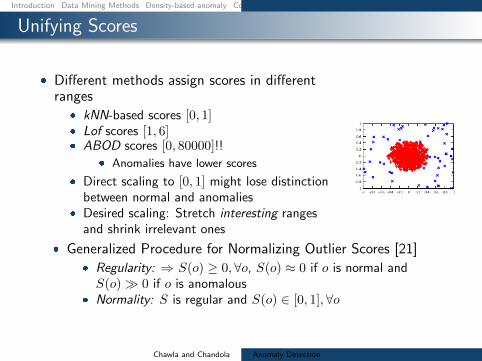
Introduction Data Mining Methods Density-based anomaly Commute Time Approach Addressing Scalability Anomalies in Complex Data Evaluating Anomaly Detection Methods Applications Problem solutions
Unifying Scores
Different methods assign scores in differentranges
kNN-based scores [0 1] Lof scores [1 6] ABOD scores [0 80000]
Anomalies have lower scores
Direct scaling to [0 1] might lose distinctionbetween normal and anomalies
Desired scaling Stretch interesting rangesand shrink irrelevant ones
Generalized Procedure for Normalizing Outlier Scores [21] Regularity rArr S(o) ge 0forallo S(o) asymp 0 if o is normal andS(o) 0 if o is anomalous
Normality S is regular and S(o) isin [0 1]forallo
Chawla and Chandola Anomaly Detection
Introduction Data Mining Methods Density-based anomaly Commute Time Approach Addressing Scalability Anomalies in Complex Data Evaluating Anomaly Detection Methods Applications Problem solutions
Regularization and Normalization of Scores
Regularization
1 R(o) = max0 S(o)minus baseS2 R(o) = Smax minus S(o)
3 R(o) = minus log SmaxS(o)
Normalization
1 N(o) = S(o)Smax
2 N(o) = max(
0 erf(S(o)minusmicroSσS radic2
))(Gaussian Scaling)
Suited for high dimensional data
3 N(o) = max(
0cdfγS (o)minusmicroγ
1minusmicroγ
)(Gamma Scaling)
Where cdfγS (o) = P (k S(o) θ) P is the regularized Gamma function Suited for low dimensional data
Chawla and Chandola Anomaly Detection
Introduction Data Mining Methods Density-based anomaly Commute Time Approach Addressing Scalability Anomalies in Complex Data Evaluating Anomaly Detection Methods Applications Problem solutions
Generating Labeled Data for Validation
Generating Both Normal and Anomalous Data
Use generative models for normal and anomalous behavior
Several generators available Multivariate continuous data [27] Multivariate categorical data [5] Discrete sequences using HMM [12]
Drawbacks Might not capture the domain characteristics
Injecting Anomalies - Random Perturbation[30]
Given data point z = xy x and y arepartitions of feature space
Take a random sample D of the entire data set
Let zprime = xprimeyprime isin D such that distancebetween y and yprime is maximum
Replace x with xprime and add z back to data setx
yz
zprime
Injected anomaly
Chawla and Chandola Anomaly Detection
Introduction Data Mining Methods Density-based anomaly Commute Time Approach Addressing Scalability Anomalies in Complex Data Evaluating Anomaly Detection Methods Applications Problem solutionsWhat is Network Anomaly Detection Motivation How Much Serious
Applications Overview
How to set up an anomaly detection solution for agiven application domain
Available data Define anomalies define normal behavior Identify requirements and constraints (online
real-time limited resources) What domain knowledge available
Feature identification Defining normal and anomalous behavior Tuning parameters
Available ground truth (training validation)
Chawla and Chandola Anomaly Detection
Introduction Data Mining Methods Density-based anomaly Commute Time Approach Addressing Scalability Anomalies in Complex Data Evaluating Anomaly Detection Methods Applications Problem solutionsWhat is Network Anomaly Detection Motivation How Much Serious
What is Network Anomaly Detection
Anomaly Detection or Intrusion Detection
Traditional Intrusion Detection Systems (IDS) finding attackscorresponding to predefined pattern data set known as signaturestherefore system is absolutely vulnerable against zero-day attacks
Network Anomaly Detection Systems (NADS) to detectzero-day attacks without any pre-identified signature besides profilenormal behavior of the network and address suspected incidents
Network Anomaly Detection finding unusual and largechanges in the network traffic
Examples intentional attacks (eg Distributed Denial ofService - DDoS) or unusual network traffic (eg flash crowds)
Chawla and Chandola Anomaly Detection
Introduction Data Mining Methods Density-based anomaly Commute Time Approach Addressing Scalability Anomalies in Complex Data Evaluating Anomaly Detection Methods Applications Problem solutionsWhat is Network Anomaly Detection Motivation How Much Serious
Motivation How Much Serious
According to Symantec report released in early 2011 morethan 286 million new threats have been detected in 2010which is a huge number
1656227
2704836
1000000
1500000
2000000
2500000
3000000
20547 18827 69107 113025 140690
624267
1656227
2704836
0
500000
1000000
1500000
2000000
2500000
3000000
2002 2003 2004 2005 2006 2007 2008 July2009-June2010
Chawla and Chandola Anomaly Detection
Introduction Data Mining Methods Density-based anomaly Commute Time Approach Addressing Scalability Anomalies in Complex Data Evaluating Anomaly Detection Methods Applications Problem solutionsNetwork Topology Network Anomalies Detection Problem Network Anomalies Detection Problem Why care about OD Flows
Network Topology
A Typical network
1 y
Router
2
3
41t
x2t
x1t
x3t
x4t
Origin-Destination (OD) flow is the traffic that enters at anorigin node and exits at a destination node of a backbonenetwork x1t x1t
Link measurement is the traffic enters at an node during aninterval y1t
Relationship between link traffic and OD flow traffic iscaptured by the routing matrix A
Chawla and Chandola Anomaly Detection
Introduction Data Mining Methods Density-based anomaly Commute Time Approach Addressing Scalability Anomalies in Complex Data Evaluating Anomaly Detection Methods Applications Problem solutionsNetwork Topology Network Anomalies Detection Problem Network Anomalies Detection Problem Why care about OD Flows
Network Anomalies Detection Problem
Chawla and Chandola Anomaly Detection
Introduction Data Mining Methods Density-based anomaly Commute Time Approach Addressing Scalability Anomalies in Complex Data Evaluating Anomaly Detection Methods Applications Problem solutionsNetwork Topology Network Anomalies Detection Problem Network Anomalies Detection Problem Why care about OD Flows
Network Anomalies Detection Problem
Chawla and Chandola Anomaly Detection
Introduction Data Mining Methods Density-based anomaly Commute Time Approach Addressing Scalability Anomalies in Complex Data Evaluating Anomaly Detection Methods Applications Problem solutionsNetwork Topology Network Anomalies Detection Problem Network Anomalies Detection Problem Why care about OD Flows
Why care about OD Flows
Volume anomaly typically arises on an OD flow (trafficarriving at one node and destined for another node)
If we only monitor traffic on network links volume arisingfrom an OD flow may not be noticeable Thus naiveapproach wont work if OD flow info is not available
Figure source [22]
Chawla and Chandola Anomaly Detection
Introduction Data Mining Methods Density-based anomaly Commute Time Approach Addressing Scalability Anomalies in Complex Data Evaluating Anomaly Detection Methods Applications Problem solutionsPCA and Subspace Method Subspace Method Algorithm Subspace Analysis Results Discussion Typical Characteristics of Anomaly Limitation of Volume Entropy Based versus Volume Based Fraud Detection Epidemeology Anomaly Detection in Climate and Weather Anomalies in Climate Validation of Anomalies
PCA and Subspace Method
Chawla and Chandola Anomaly Detection
Introduction Data Mining Methods Density-based anomaly Commute Time Approach Addressing Scalability Anomalies in Complex Data Evaluating Anomaly Detection Methods Applications Problem solutionsPCA and Subspace Method Subspace Method Algorithm Subspace Analysis Results Discussion Typical Characteristics of Anomaly Limitation of Volume Entropy Based versus Volume Based Fraud Detection Epidemeology Anomaly Detection in Climate and Weather Anomalies in Climate Validation of Anomalies
Subspace Method Algorithm
Step1- Determine the PCs based on eigenvaluedecomposition of the covariance matrix of the dataset
Step2- Choose first top k principle components with thehighest eigenvalues as matrix P
Step3-normal traffic subspace called Z
Z = PP TZ = CZ
Step4-abnormal traffic subspace called Z
Z = (I minus PP T )Z = CZ
Step5-If the norm of a vector is large then it is an rdquoanomalyrdquo
Chawla and Chandola Anomaly Detection
Introduction Data Mining Methods Density-based anomaly Commute Time Approach Addressing Scalability Anomalies in Complex Data Evaluating Anomaly Detection Methods Applications Problem solutionsPCA and Subspace Method Subspace Method Algorithm Subspace Analysis Results Discussion Typical Characteristics of Anomaly Limitation of Volume Entropy Based versus Volume Based Fraud Detection Epidemeology Anomaly Detection in Climate and Weather Anomalies in Climate Validation of Anomalies
Subspace Analysis Results
Note that during anomaly normal component does not changethat much while residual component changes quite a lot
Thus anomalies can be detected by setting some threshold
Figure source [22]
Chawla and Chandola Anomaly Detection
Introduction Data Mining Methods Density-based anomaly Commute Time Approach Addressing Scalability Anomalies in Complex Data Evaluating Anomaly Detection Methods Applications Problem solutionsPCA and Subspace Method Subspace Method Algorithm Subspace Analysis Results Discussion Typical Characteristics of Anomaly Limitation of Volume Entropy Based versus Volume Based Fraud Detection Epidemeology Anomaly Detection in Climate and Weather Anomalies in Climate Validation of Anomalies
Discussion Typical Characteristics of Anomaly
Most Anomalies induce a change in distributionalaspects of packet header fields (called features)
Most important features include 5-tuple Source ampdestination IP addresses Source and destination portnumbers and IP protocol
raquo DOS attack ndash multiple source IP address concentrated on asingle destination IP address
raquo Network scan ndash dispersed distribution of destination addresses
raquo Most wormsviruses also induce some change in distribution ofcertain features
raquo However these changes can be very subtle and mining them islike searching for needles in a haystack
Unlike many previous approach this paper aims todetect events which disturb the distribution of trafficfeatures rather than traffic volume
Chawla and Chandola Anomaly Detection
Introduction Data Mining Methods Density-based anomaly Commute Time Approach Addressing Scalability Anomalies in Complex Data Evaluating Anomaly Detection Methods Applications Problem solutionsPCA and Subspace Method Subspace Method Algorithm Subspace Analysis Results Discussion Typical Characteristics of Anomaly Limitation of Volume Entropy Based versus Volume Based Fraud Detection Epidemeology Anomaly Detection in Climate and Weather Anomalies in Climate Validation of Anomalies
Limitation of Volume
Figure source [22]
Port scan anomaly (traffic feature changes however traffic volume
remains more or less the same)
We can use entropy tocapture the variationsin the traffic feature
bullTakes value 0 when distribution is maximally concentratedbullTakes value log2N when distribution is maximally dispersed
But stands out in
feature entropy
which also reveals
its structure
Port scan
dwarfed
in volume
metricshellip
Chawla and Chandola Anomaly Detection
Introduction Data Mining Methods Density-based anomaly Commute Time Approach Addressing Scalability Anomalies in Complex Data Evaluating Anomaly Detection Methods Applications Problem solutionsPCA and Subspace Method Subspace Method Algorithm Subspace Analysis Results Discussion Typical Characteristics of Anomaly Limitation of Volume Entropy Based versus Volume Based Fraud Detection Epidemeology Anomaly Detection in Climate and Weather Anomalies in Climate Validation of Anomalies
Entropy Based versus Volume Based
DoSDDoS Attacks- a spike in traffic data toward adominant destination IP
Scan anomaly-a spike in traffic data from a dominant sourceIP
Flash Crowd anomaly- again a spike in traffic data to adominant destination IP
Worm anomaly-a Spike in traffic with a dominant port
Chawla and Chandola Anomaly Detection
Introduction Data Mining Methods Density-based anomaly Commute Time Approach Addressing Scalability Anomalies in Complex Data Evaluating Anomaly Detection Methods Applications Problem solutionsPCA and Subspace Method Subspace Method Algorithm Subspace Analysis Results Discussion Typical Characteristics of Anomaly Limitation of Volume Entropy Based versus Volume Based Fraud Detection Epidemeology Anomaly Detection in Climate and Weather Anomalies in Climate Validation of Anomalies
Fraud Detection
Domain Question Identifyfraudulent activities or players fromobserved transaction data
Data Transactions between different
players in the system Meta information about the
individuals An underlying graph structure
Challenges Track and model human behavior Anomalies caused by adaptive
human adversaries Massive data sizes
Insurance (autohealtha)
ClaimantProvider Payer
Telecommunications Customer
Provider
Credit Cards Customer
Supplier Bank
Web Advertising User Advertiser
Publisher
ahttpwwwcheatingculturecompast-cases-of-medicare-fraud
Chawla and Chandola Anomaly Detection
Introduction Data Mining Methods Density-based anomaly Commute Time Approach Addressing Scalability Anomalies in Complex Data Evaluating Anomaly Detection Methods Applications Problem solutionsPCA and Subspace Method Subspace Method Algorithm Subspace Analysis Results Discussion Typical Characteristics of Anomaly Limitation of Volume Entropy Based versus Volume Based Fraud Detection Epidemeology Anomaly Detection in Climate and Weather Anomalies in Climate Validation of Anomalies
A Generic Fraud Detection Method
Activity Monitoring [13]1 Build profiles for individuals (customers users etc) based on
historic data User X makes n calls on an average in January
2 Compare current behavior with historical profile for significantdeviations
Clustering based [4]1 Cluster historical profiles of customers2 Identify small clusters or outlying profiles as anomalies
Strengths Anomaly detection is fast (good for real time) Results are easy to explain
Weaknesses Need to create and maintain a large number of profiles Not dynamic Adequate historical data might not be available Too many false positives
Chawla and Chandola Anomaly Detection
Introduction Data Mining Methods Density-based anomaly Commute Time Approach Addressing Scalability Anomalies in Complex Data Evaluating Anomaly Detection Methods Applications Problem solutionsPCA and Subspace Method Subspace Method Algorithm Subspace Analysis Results Discussion Typical Characteristics of Anomaly Limitation of Volume Entropy Based versus Volume Based Fraud Detection Epidemeology Anomaly Detection in Climate and Weather Anomalies in Climate Validation of Anomalies
Exploiting Graph Structure - Weighted Graphs
Represent data as a weighted graph Communication networks (phone email SMS) Provider referral networks
Objective Identify anomalous nodes
For each node extract several features based on the propertiesof the induced sub-graph (egonet) of neighboring nodes [1]
Choose features that can highlight anomalous nodes
1 Ni degree of node2 Ei number of edges in egonet3 Wi total weight of egonet4 λi principal eigen vector of weighted adjacency matrix of
egonet
Data is transformed into a point in a multi-dimensional space
Chawla and Chandola Anomaly Detection
Introduction Data Mining Methods Density-based anomaly Commute Time Approach Addressing Scalability Anomalies in Complex Data Evaluating Anomaly Detection Methods Applications Problem solutionsPCA and Subspace Method Subspace Method Algorithm Subspace Analysis Results Discussion Typical Characteristics of Anomaly Limitation of Volume Entropy Based versus Volume Based Fraud Detection Epidemeology Anomaly Detection in Climate and Weather Anomalies in Climate Validation of Anomalies
Identifying Anomalies
Traditional anomaly detection (lof) Can be slow but can identify any type of anomalous structure
Faster method to identify specific types of anomalousstructures
Identify relevant feature pairs and power law relationship
Eg Egonet Density Power Law Ni vs Ei - detect nearcliques and stars
Ei prop Nαi 1 le α le 2
Anomaly score for node i wrt a pair of features (y = Cxθ)
Si =max(yi Cx
θi )
min(yi Cxθi )lowast log (|yi minus Cxθi |+ 1)
Chawla and Chandola Anomaly Detection
Introduction Data Mining Methods Density-based anomaly Commute Time Approach Addressing Scalability Anomalies in Complex Data Evaluating Anomaly Detection Methods Applications Problem solutionsPCA and Subspace Method Subspace Method Algorithm Subspace Analysis Results Discussion Typical Characteristics of Anomaly Limitation of Volume Entropy Based versus Volume Based Fraud Detection Epidemeology Anomaly Detection in Climate and Weather Anomalies in Climate Validation of Anomalies
Exploiting Graph Structure - Bipartite Graphs
Represent data as a bipartite graph Healthcare Data (Beneficiaries vs Providers) Insider trading (Traders vs Stocks)
Objective Identify anomalous links
Given a query node a isin V1 find the ldquorelevancerdquoof all other nodes in V1 to a
RelevanceScore(a b) prop Number of times aldquorandom walkrdquo from a reaches b
Use the relevance scores to compute thenormality scores for a node t isin V2
Find set St = a|〈a t〉 isin E Compute |St| times |St| similarity matrix using
relevance vectors for a isin St Normality Score = mean of non-diagonal entries
of similarity matrix
V1 E V2a1
a2
a3
an
t1
t2
t3
tn
Chawla and Chandola Anomaly Detection
Introduction Data Mining Methods Density-based anomaly Commute Time Approach Addressing Scalability Anomalies in Complex Data Evaluating Anomaly Detection Methods Applications Problem solutionsPCA and Subspace Method Subspace Method Algorithm Subspace Analysis Results Discussion Typical Characteristics of Anomaly Limitation of Volume Entropy Based versus Volume Based Fraud Detection Epidemeology Anomaly Detection in Climate and Weather Anomalies in Climate Validation of Anomalies
Detecting Disease Outbreaks
Domain Question Early detection of disease
outbreaks Anthrax attack
Data Emergency department visits Grocery data (Example [14]) Clinical visits Weatherclimate data
Challenges Weak signals in the data
ED cases involving cough rArrFlu or SARS
Integration of multiple signals(lag analysis)
Account for spatial and temporalcorrelations
Chawla and Chandola Anomaly Detection
Introduction Data Mining Methods Density-based anomaly Commute Time Approach Addressing Scalability Anomalies in Complex Data Evaluating Anomaly Detection Methods Applications Problem solutionsPCA and Subspace Method Subspace Method Algorithm Subspace Analysis Results Discussion Typical Characteristics of Anomaly Limitation of Volume Entropy Based versus Volume Based Fraud Detection Epidemeology Anomaly Detection in Climate and Weather Anomalies in Climate Validation of Anomalies
Whatrsquos Significant About Recent Events (WSARE) [33]
1 Learn Bayesian network from historical data Environmental and response variables
2 Sample from the BN (DBbaseline|Current Environment)3 Compute contingency table for rules for DBbaseline andDBcurrent
Rules are single assignment rules (Xi = Y ji ) or conjunctions4 Find p-value for rules using χ2-test
Null Hypothesis Rows and columns of tables for DBbaselineand DBcurrent are independent
5 Find rule with largest p-value Repeat Step 2
Chawla and Chandola Anomaly Detection
Introduction Data Mining Methods Density-based anomaly Commute Time Approach Addressing Scalability Anomalies in Complex Data Evaluating Anomaly Detection Methods Applications Problem solutionsPCA and Subspace Method Subspace Method Algorithm Subspace Analysis Results Discussion Typical Characteristics of Anomaly Limitation of Volume Entropy Based versus Volume Based Fraud Detection Epidemeology Anomaly Detection in Climate and Weather Anomalies in Climate Validation of Anomalies
Incorporating Spatial and Temporal Relationships
WSARE does not explicitly model the spatial and temporalrelationships
What happened yesterday What happened in the adjoining neighborhood (yesterday)
Bayesian Network Spatio-Temporal (BNST) modelingframework [17]
Add nodes for temporal and spatial dependencies Need more data to train
Chawla and Chandola Anomaly Detection
Introduction Data Mining Methods Density-based anomaly Commute Time Approach Addressing Scalability Anomalies in Complex Data Evaluating Anomaly Detection Methods Applications Problem solutionsPCA and Subspace Method Subspace Method Algorithm Subspace Analysis Results Discussion Typical Characteristics of Anomaly Limitation of Volume Entropy Based versus Volume Based Fraud Detection Epidemeology Anomaly Detection in Climate and Weather Anomalies in Climate Validation of Anomalies
Anomaly Detection in Climate and Weather
Science Questions Identify natural and anthropogenic disasters Identify long time scale events - droughts atmospheric rivers
cold fronts etc
Data Ground observations Remote sensing data (satellites
air-borne) Climate model simulation outputs Multiple variables spatio-temporal (often has height dimension
as well)
Challenges Model spatio-temporal relationships across multiple variables Explain the cause of anomalies Massive data sizes
Climate and weather extreme events are well defined
Key challenge is to find significant events and explain the cause
Chawla and Chandola Anomaly Detection
Introduction Data Mining Methods Density-based anomaly Commute Time Approach Addressing Scalability Anomalies in Complex Data Evaluating Anomaly Detection Methods Applications Problem solutionsPCA and Subspace Method Subspace Method Algorithm Subspace Analysis Results Discussion Typical Characteristics of Anomaly Limitation of Volume Entropy Based versus Volume Based Fraud Detection Epidemeology Anomaly Detection in Climate and Weather Anomalies in Climate Validation of Anomalies
Anomalies are Widely Used in Climate
Most analysis done on ldquoanomalyrdquo time series
Difference from a ldquobase periodrdquo (Toosimplistic)
Brings spatial smoothness (eg a mountaintop and nearby valley can have very differenttemperatures) Removes seasonality
Understand climate and weatherphenomenon
Southern Oscillation Index (SOI) Difference between Sea Level Pressure
(SLP) anomalies for Tahiti and DarwinAustralia
Figure Global AverageTemperature Anomaly(1975 - 2007) Srcwwwmetofficegovuk
Chawla and Chandola Anomaly Detection
Introduction Data Mining Methods Density-based anomaly Commute Time Approach Addressing Scalability Anomalies in Complex Data Evaluating Anomaly Detection Methods Applications Problem solutionsPCA and Subspace Method Subspace Method Algorithm Subspace Analysis Results Discussion Typical Characteristics of Anomaly Limitation of Volume Entropy Based versus Volume Based Fraud Detection Epidemeology Anomaly Detection in Climate and Weather Anomalies in Climate Validation of Anomalies
Constructing Anomalies from Raw Data
Anomaly time series for a given location i
vprimei = vi minus bi
where bi is the base (reference)
How to choose bi Mean of all data for location i Monthly mean values (account for seasonality) Monthly z-score values Median (more robust) Using a shorter ldquoreference periodrdquo
30 year moving window
Different methods show statistically significant differences[19] What is the right strategy Weighted mean of different strategies (Pick weights using
Monte Carlo sampling)
Chawla and Chandola Anomaly Detection
Introduction Data Mining Methods Density-based anomaly Commute Time Approach Addressing Scalability Anomalies in Complex Data Evaluating Anomaly Detection Methods Applications Problem solutionsPCA and Subspace Method Subspace Method Algorithm Subspace Analysis Results Discussion Typical Characteristics of Anomaly Limitation of Volume Entropy Based versus Volume Based Fraud Detection Epidemeology Anomaly Detection in Climate and Weather Anomalies in Climate Validation of Anomalies
Anomaly Detection for Identifying Droughts
Science question Identify significant drought patterns usinghistorical observation data or future simulation data or both
Find persistent spatiotemporal anomalies in precipitation data
A two step approach
1 Find precipitationanomalies usingthresholds
2 Find large connectedcomponents across spaceand time
Matlab - bwlabelbwlabeln
Followup Science questionExplain cause
(drought190120061avi)
Figure Video courtsey Dr ArindamBanerjee
Chawla and Chandola Anomaly Detection
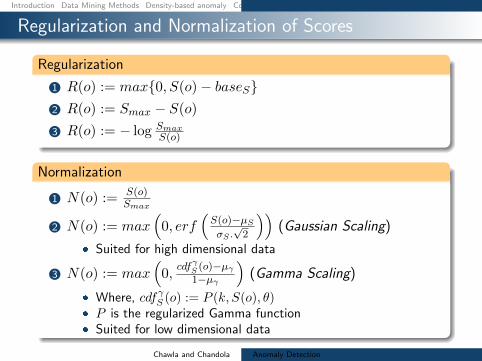
Introduction Data Mining Methods Density-based anomaly Commute Time Approach Addressing Scalability Anomalies in Complex Data Evaluating Anomaly Detection Methods Applications Problem solutions
Regularization and Normalization of Scores
Regularization
1 R(o) = max0 S(o)minus baseS2 R(o) = Smax minus S(o)
3 R(o) = minus log SmaxS(o)
Normalization
1 N(o) = S(o)Smax
2 N(o) = max(
0 erf(S(o)minusmicroSσS radic2
))(Gaussian Scaling)
Suited for high dimensional data
3 N(o) = max(
0cdfγS (o)minusmicroγ
1minusmicroγ
)(Gamma Scaling)
Where cdfγS (o) = P (k S(o) θ) P is the regularized Gamma function Suited for low dimensional data
Chawla and Chandola Anomaly Detection
Introduction Data Mining Methods Density-based anomaly Commute Time Approach Addressing Scalability Anomalies in Complex Data Evaluating Anomaly Detection Methods Applications Problem solutions
Generating Labeled Data for Validation
Generating Both Normal and Anomalous Data
Use generative models for normal and anomalous behavior
Several generators available Multivariate continuous data [27] Multivariate categorical data [5] Discrete sequences using HMM [12]
Drawbacks Might not capture the domain characteristics
Injecting Anomalies - Random Perturbation[30]
Given data point z = xy x and y arepartitions of feature space
Take a random sample D of the entire data set
Let zprime = xprimeyprime isin D such that distancebetween y and yprime is maximum
Replace x with xprime and add z back to data setx
yz
zprime
Injected anomaly
Chawla and Chandola Anomaly Detection
Introduction Data Mining Methods Density-based anomaly Commute Time Approach Addressing Scalability Anomalies in Complex Data Evaluating Anomaly Detection Methods Applications Problem solutionsWhat is Network Anomaly Detection Motivation How Much Serious
Applications Overview
How to set up an anomaly detection solution for agiven application domain
Available data Define anomalies define normal behavior Identify requirements and constraints (online
real-time limited resources) What domain knowledge available
Feature identification Defining normal and anomalous behavior Tuning parameters
Available ground truth (training validation)
Chawla and Chandola Anomaly Detection
Introduction Data Mining Methods Density-based anomaly Commute Time Approach Addressing Scalability Anomalies in Complex Data Evaluating Anomaly Detection Methods Applications Problem solutionsWhat is Network Anomaly Detection Motivation How Much Serious
What is Network Anomaly Detection
Anomaly Detection or Intrusion Detection
Traditional Intrusion Detection Systems (IDS) finding attackscorresponding to predefined pattern data set known as signaturestherefore system is absolutely vulnerable against zero-day attacks
Network Anomaly Detection Systems (NADS) to detectzero-day attacks without any pre-identified signature besides profilenormal behavior of the network and address suspected incidents
Network Anomaly Detection finding unusual and largechanges in the network traffic
Examples intentional attacks (eg Distributed Denial ofService - DDoS) or unusual network traffic (eg flash crowds)
Chawla and Chandola Anomaly Detection
Introduction Data Mining Methods Density-based anomaly Commute Time Approach Addressing Scalability Anomalies in Complex Data Evaluating Anomaly Detection Methods Applications Problem solutionsWhat is Network Anomaly Detection Motivation How Much Serious
Motivation How Much Serious
According to Symantec report released in early 2011 morethan 286 million new threats have been detected in 2010which is a huge number
1656227
2704836
1000000
1500000
2000000
2500000
3000000
20547 18827 69107 113025 140690
624267
1656227
2704836
0
500000
1000000
1500000
2000000
2500000
3000000
2002 2003 2004 2005 2006 2007 2008 July2009-June2010
Chawla and Chandola Anomaly Detection
Introduction Data Mining Methods Density-based anomaly Commute Time Approach Addressing Scalability Anomalies in Complex Data Evaluating Anomaly Detection Methods Applications Problem solutionsNetwork Topology Network Anomalies Detection Problem Network Anomalies Detection Problem Why care about OD Flows
Network Topology
A Typical network
1 y
Router
2
3
41t
x2t
x1t
x3t
x4t
Origin-Destination (OD) flow is the traffic that enters at anorigin node and exits at a destination node of a backbonenetwork x1t x1t
Link measurement is the traffic enters at an node during aninterval y1t
Relationship between link traffic and OD flow traffic iscaptured by the routing matrix A
Chawla and Chandola Anomaly Detection
Introduction Data Mining Methods Density-based anomaly Commute Time Approach Addressing Scalability Anomalies in Complex Data Evaluating Anomaly Detection Methods Applications Problem solutionsNetwork Topology Network Anomalies Detection Problem Network Anomalies Detection Problem Why care about OD Flows
Network Anomalies Detection Problem
Chawla and Chandola Anomaly Detection
Introduction Data Mining Methods Density-based anomaly Commute Time Approach Addressing Scalability Anomalies in Complex Data Evaluating Anomaly Detection Methods Applications Problem solutionsNetwork Topology Network Anomalies Detection Problem Network Anomalies Detection Problem Why care about OD Flows
Network Anomalies Detection Problem
Chawla and Chandola Anomaly Detection
Introduction Data Mining Methods Density-based anomaly Commute Time Approach Addressing Scalability Anomalies in Complex Data Evaluating Anomaly Detection Methods Applications Problem solutionsNetwork Topology Network Anomalies Detection Problem Network Anomalies Detection Problem Why care about OD Flows
Why care about OD Flows
Volume anomaly typically arises on an OD flow (trafficarriving at one node and destined for another node)
If we only monitor traffic on network links volume arisingfrom an OD flow may not be noticeable Thus naiveapproach wont work if OD flow info is not available
Figure source [22]
Chawla and Chandola Anomaly Detection
Introduction Data Mining Methods Density-based anomaly Commute Time Approach Addressing Scalability Anomalies in Complex Data Evaluating Anomaly Detection Methods Applications Problem solutionsPCA and Subspace Method Subspace Method Algorithm Subspace Analysis Results Discussion Typical Characteristics of Anomaly Limitation of Volume Entropy Based versus Volume Based Fraud Detection Epidemeology Anomaly Detection in Climate and Weather Anomalies in Climate Validation of Anomalies
PCA and Subspace Method
Chawla and Chandola Anomaly Detection
Introduction Data Mining Methods Density-based anomaly Commute Time Approach Addressing Scalability Anomalies in Complex Data Evaluating Anomaly Detection Methods Applications Problem solutionsPCA and Subspace Method Subspace Method Algorithm Subspace Analysis Results Discussion Typical Characteristics of Anomaly Limitation of Volume Entropy Based versus Volume Based Fraud Detection Epidemeology Anomaly Detection in Climate and Weather Anomalies in Climate Validation of Anomalies
Subspace Method Algorithm
Step1- Determine the PCs based on eigenvaluedecomposition of the covariance matrix of the dataset
Step2- Choose first top k principle components with thehighest eigenvalues as matrix P
Step3-normal traffic subspace called Z
Z = PP TZ = CZ
Step4-abnormal traffic subspace called Z
Z = (I minus PP T )Z = CZ
Step5-If the norm of a vector is large then it is an rdquoanomalyrdquo
Chawla and Chandola Anomaly Detection
Introduction Data Mining Methods Density-based anomaly Commute Time Approach Addressing Scalability Anomalies in Complex Data Evaluating Anomaly Detection Methods Applications Problem solutionsPCA and Subspace Method Subspace Method Algorithm Subspace Analysis Results Discussion Typical Characteristics of Anomaly Limitation of Volume Entropy Based versus Volume Based Fraud Detection Epidemeology Anomaly Detection in Climate and Weather Anomalies in Climate Validation of Anomalies
Subspace Analysis Results
Note that during anomaly normal component does not changethat much while residual component changes quite a lot
Thus anomalies can be detected by setting some threshold
Figure source [22]
Chawla and Chandola Anomaly Detection
Introduction Data Mining Methods Density-based anomaly Commute Time Approach Addressing Scalability Anomalies in Complex Data Evaluating Anomaly Detection Methods Applications Problem solutionsPCA and Subspace Method Subspace Method Algorithm Subspace Analysis Results Discussion Typical Characteristics of Anomaly Limitation of Volume Entropy Based versus Volume Based Fraud Detection Epidemeology Anomaly Detection in Climate and Weather Anomalies in Climate Validation of Anomalies
Discussion Typical Characteristics of Anomaly
Most Anomalies induce a change in distributionalaspects of packet header fields (called features)
Most important features include 5-tuple Source ampdestination IP addresses Source and destination portnumbers and IP protocol
raquo DOS attack ndash multiple source IP address concentrated on asingle destination IP address
raquo Network scan ndash dispersed distribution of destination addresses
raquo Most wormsviruses also induce some change in distribution ofcertain features
raquo However these changes can be very subtle and mining them islike searching for needles in a haystack
Unlike many previous approach this paper aims todetect events which disturb the distribution of trafficfeatures rather than traffic volume
Chawla and Chandola Anomaly Detection
Introduction Data Mining Methods Density-based anomaly Commute Time Approach Addressing Scalability Anomalies in Complex Data Evaluating Anomaly Detection Methods Applications Problem solutionsPCA and Subspace Method Subspace Method Algorithm Subspace Analysis Results Discussion Typical Characteristics of Anomaly Limitation of Volume Entropy Based versus Volume Based Fraud Detection Epidemeology Anomaly Detection in Climate and Weather Anomalies in Climate Validation of Anomalies
Limitation of Volume
Figure source [22]
Port scan anomaly (traffic feature changes however traffic volume
remains more or less the same)
We can use entropy tocapture the variationsin the traffic feature
bullTakes value 0 when distribution is maximally concentratedbullTakes value log2N when distribution is maximally dispersed
But stands out in
feature entropy
which also reveals
its structure
Port scan
dwarfed
in volume
metricshellip
Chawla and Chandola Anomaly Detection
Introduction Data Mining Methods Density-based anomaly Commute Time Approach Addressing Scalability Anomalies in Complex Data Evaluating Anomaly Detection Methods Applications Problem solutionsPCA and Subspace Method Subspace Method Algorithm Subspace Analysis Results Discussion Typical Characteristics of Anomaly Limitation of Volume Entropy Based versus Volume Based Fraud Detection Epidemeology Anomaly Detection in Climate and Weather Anomalies in Climate Validation of Anomalies
Entropy Based versus Volume Based
DoSDDoS Attacks- a spike in traffic data toward adominant destination IP
Scan anomaly-a spike in traffic data from a dominant sourceIP
Flash Crowd anomaly- again a spike in traffic data to adominant destination IP
Worm anomaly-a Spike in traffic with a dominant port
Chawla and Chandola Anomaly Detection
Introduction Data Mining Methods Density-based anomaly Commute Time Approach Addressing Scalability Anomalies in Complex Data Evaluating Anomaly Detection Methods Applications Problem solutionsPCA and Subspace Method Subspace Method Algorithm Subspace Analysis Results Discussion Typical Characteristics of Anomaly Limitation of Volume Entropy Based versus Volume Based Fraud Detection Epidemeology Anomaly Detection in Climate and Weather Anomalies in Climate Validation of Anomalies
Fraud Detection
Domain Question Identifyfraudulent activities or players fromobserved transaction data
Data Transactions between different
players in the system Meta information about the
individuals An underlying graph structure
Challenges Track and model human behavior Anomalies caused by adaptive
human adversaries Massive data sizes
Insurance (autohealtha)
ClaimantProvider Payer
Telecommunications Customer
Provider
Credit Cards Customer
Supplier Bank
Web Advertising User Advertiser
Publisher
ahttpwwwcheatingculturecompast-cases-of-medicare-fraud
Chawla and Chandola Anomaly Detection
Introduction Data Mining Methods Density-based anomaly Commute Time Approach Addressing Scalability Anomalies in Complex Data Evaluating Anomaly Detection Methods Applications Problem solutionsPCA and Subspace Method Subspace Method Algorithm Subspace Analysis Results Discussion Typical Characteristics of Anomaly Limitation of Volume Entropy Based versus Volume Based Fraud Detection Epidemeology Anomaly Detection in Climate and Weather Anomalies in Climate Validation of Anomalies
A Generic Fraud Detection Method
Activity Monitoring [13]1 Build profiles for individuals (customers users etc) based on
historic data User X makes n calls on an average in January
2 Compare current behavior with historical profile for significantdeviations
Clustering based [4]1 Cluster historical profiles of customers2 Identify small clusters or outlying profiles as anomalies
Strengths Anomaly detection is fast (good for real time) Results are easy to explain
Weaknesses Need to create and maintain a large number of profiles Not dynamic Adequate historical data might not be available Too many false positives
Chawla and Chandola Anomaly Detection
Introduction Data Mining Methods Density-based anomaly Commute Time Approach Addressing Scalability Anomalies in Complex Data Evaluating Anomaly Detection Methods Applications Problem solutionsPCA and Subspace Method Subspace Method Algorithm Subspace Analysis Results Discussion Typical Characteristics of Anomaly Limitation of Volume Entropy Based versus Volume Based Fraud Detection Epidemeology Anomaly Detection in Climate and Weather Anomalies in Climate Validation of Anomalies
Exploiting Graph Structure - Weighted Graphs
Represent data as a weighted graph Communication networks (phone email SMS) Provider referral networks
Objective Identify anomalous nodes
For each node extract several features based on the propertiesof the induced sub-graph (egonet) of neighboring nodes [1]
Choose features that can highlight anomalous nodes
1 Ni degree of node2 Ei number of edges in egonet3 Wi total weight of egonet4 λi principal eigen vector of weighted adjacency matrix of
egonet
Data is transformed into a point in a multi-dimensional space
Chawla and Chandola Anomaly Detection
Introduction Data Mining Methods Density-based anomaly Commute Time Approach Addressing Scalability Anomalies in Complex Data Evaluating Anomaly Detection Methods Applications Problem solutionsPCA and Subspace Method Subspace Method Algorithm Subspace Analysis Results Discussion Typical Characteristics of Anomaly Limitation of Volume Entropy Based versus Volume Based Fraud Detection Epidemeology Anomaly Detection in Climate and Weather Anomalies in Climate Validation of Anomalies
Identifying Anomalies
Traditional anomaly detection (lof) Can be slow but can identify any type of anomalous structure
Faster method to identify specific types of anomalousstructures
Identify relevant feature pairs and power law relationship
Eg Egonet Density Power Law Ni vs Ei - detect nearcliques and stars
Ei prop Nαi 1 le α le 2
Anomaly score for node i wrt a pair of features (y = Cxθ)
Si =max(yi Cx
θi )
min(yi Cxθi )lowast log (|yi minus Cxθi |+ 1)
Chawla and Chandola Anomaly Detection
Introduction Data Mining Methods Density-based anomaly Commute Time Approach Addressing Scalability Anomalies in Complex Data Evaluating Anomaly Detection Methods Applications Problem solutionsPCA and Subspace Method Subspace Method Algorithm Subspace Analysis Results Discussion Typical Characteristics of Anomaly Limitation of Volume Entropy Based versus Volume Based Fraud Detection Epidemeology Anomaly Detection in Climate and Weather Anomalies in Climate Validation of Anomalies
Exploiting Graph Structure - Bipartite Graphs
Represent data as a bipartite graph Healthcare Data (Beneficiaries vs Providers) Insider trading (Traders vs Stocks)
Objective Identify anomalous links
Given a query node a isin V1 find the ldquorelevancerdquoof all other nodes in V1 to a
RelevanceScore(a b) prop Number of times aldquorandom walkrdquo from a reaches b
Use the relevance scores to compute thenormality scores for a node t isin V2
Find set St = a|〈a t〉 isin E Compute |St| times |St| similarity matrix using
relevance vectors for a isin St Normality Score = mean of non-diagonal entries
of similarity matrix
V1 E V2a1
a2
a3
an
t1
t2
t3
tn
Chawla and Chandola Anomaly Detection
Introduction Data Mining Methods Density-based anomaly Commute Time Approach Addressing Scalability Anomalies in Complex Data Evaluating Anomaly Detection Methods Applications Problem solutionsPCA and Subspace Method Subspace Method Algorithm Subspace Analysis Results Discussion Typical Characteristics of Anomaly Limitation of Volume Entropy Based versus Volume Based Fraud Detection Epidemeology Anomaly Detection in Climate and Weather Anomalies in Climate Validation of Anomalies
Detecting Disease Outbreaks
Domain Question Early detection of disease
outbreaks Anthrax attack
Data Emergency department visits Grocery data (Example [14]) Clinical visits Weatherclimate data
Challenges Weak signals in the data
ED cases involving cough rArrFlu or SARS
Integration of multiple signals(lag analysis)
Account for spatial and temporalcorrelations
Chawla and Chandola Anomaly Detection
Introduction Data Mining Methods Density-based anomaly Commute Time Approach Addressing Scalability Anomalies in Complex Data Evaluating Anomaly Detection Methods Applications Problem solutionsPCA and Subspace Method Subspace Method Algorithm Subspace Analysis Results Discussion Typical Characteristics of Anomaly Limitation of Volume Entropy Based versus Volume Based Fraud Detection Epidemeology Anomaly Detection in Climate and Weather Anomalies in Climate Validation of Anomalies
Whatrsquos Significant About Recent Events (WSARE) [33]
1 Learn Bayesian network from historical data Environmental and response variables
2 Sample from the BN (DBbaseline|Current Environment)3 Compute contingency table for rules for DBbaseline andDBcurrent
Rules are single assignment rules (Xi = Y ji ) or conjunctions4 Find p-value for rules using χ2-test
Null Hypothesis Rows and columns of tables for DBbaselineand DBcurrent are independent
5 Find rule with largest p-value Repeat Step 2
Chawla and Chandola Anomaly Detection
Introduction Data Mining Methods Density-based anomaly Commute Time Approach Addressing Scalability Anomalies in Complex Data Evaluating Anomaly Detection Methods Applications Problem solutionsPCA and Subspace Method Subspace Method Algorithm Subspace Analysis Results Discussion Typical Characteristics of Anomaly Limitation of Volume Entropy Based versus Volume Based Fraud Detection Epidemeology Anomaly Detection in Climate and Weather Anomalies in Climate Validation of Anomalies
Incorporating Spatial and Temporal Relationships
WSARE does not explicitly model the spatial and temporalrelationships
What happened yesterday What happened in the adjoining neighborhood (yesterday)
Bayesian Network Spatio-Temporal (BNST) modelingframework [17]
Add nodes for temporal and spatial dependencies Need more data to train
Chawla and Chandola Anomaly Detection
Introduction Data Mining Methods Density-based anomaly Commute Time Approach Addressing Scalability Anomalies in Complex Data Evaluating Anomaly Detection Methods Applications Problem solutionsPCA and Subspace Method Subspace Method Algorithm Subspace Analysis Results Discussion Typical Characteristics of Anomaly Limitation of Volume Entropy Based versus Volume Based Fraud Detection Epidemeology Anomaly Detection in Climate and Weather Anomalies in Climate Validation of Anomalies
Anomaly Detection in Climate and Weather
Science Questions Identify natural and anthropogenic disasters Identify long time scale events - droughts atmospheric rivers
cold fronts etc
Data Ground observations Remote sensing data (satellites
air-borne) Climate model simulation outputs Multiple variables spatio-temporal (often has height dimension
as well)
Challenges Model spatio-temporal relationships across multiple variables Explain the cause of anomalies Massive data sizes
Climate and weather extreme events are well defined
Key challenge is to find significant events and explain the cause
Chawla and Chandola Anomaly Detection
Introduction Data Mining Methods Density-based anomaly Commute Time Approach Addressing Scalability Anomalies in Complex Data Evaluating Anomaly Detection Methods Applications Problem solutionsPCA and Subspace Method Subspace Method Algorithm Subspace Analysis Results Discussion Typical Characteristics of Anomaly Limitation of Volume Entropy Based versus Volume Based Fraud Detection Epidemeology Anomaly Detection in Climate and Weather Anomalies in Climate Validation of Anomalies
Anomalies are Widely Used in Climate
Most analysis done on ldquoanomalyrdquo time series
Difference from a ldquobase periodrdquo (Toosimplistic)
Brings spatial smoothness (eg a mountaintop and nearby valley can have very differenttemperatures) Removes seasonality
Understand climate and weatherphenomenon
Southern Oscillation Index (SOI) Difference between Sea Level Pressure
(SLP) anomalies for Tahiti and DarwinAustralia
Figure Global AverageTemperature Anomaly(1975 - 2007) Srcwwwmetofficegovuk
Chawla and Chandola Anomaly Detection
Introduction Data Mining Methods Density-based anomaly Commute Time Approach Addressing Scalability Anomalies in Complex Data Evaluating Anomaly Detection Methods Applications Problem solutionsPCA and Subspace Method Subspace Method Algorithm Subspace Analysis Results Discussion Typical Characteristics of Anomaly Limitation of Volume Entropy Based versus Volume Based Fraud Detection Epidemeology Anomaly Detection in Climate and Weather Anomalies in Climate Validation of Anomalies
Constructing Anomalies from Raw Data
Anomaly time series for a given location i
vprimei = vi minus bi
where bi is the base (reference)
How to choose bi Mean of all data for location i Monthly mean values (account for seasonality) Monthly z-score values Median (more robust) Using a shorter ldquoreference periodrdquo
30 year moving window
Different methods show statistically significant differences[19] What is the right strategy Weighted mean of different strategies (Pick weights using
Monte Carlo sampling)
Chawla and Chandola Anomaly Detection
Introduction Data Mining Methods Density-based anomaly Commute Time Approach Addressing Scalability Anomalies in Complex Data Evaluating Anomaly Detection Methods Applications Problem solutionsPCA and Subspace Method Subspace Method Algorithm Subspace Analysis Results Discussion Typical Characteristics of Anomaly Limitation of Volume Entropy Based versus Volume Based Fraud Detection Epidemeology Anomaly Detection in Climate and Weather Anomalies in Climate Validation of Anomalies
Anomaly Detection for Identifying Droughts
Science question Identify significant drought patterns usinghistorical observation data or future simulation data or both
Find persistent spatiotemporal anomalies in precipitation data
A two step approach
1 Find precipitationanomalies usingthresholds
2 Find large connectedcomponents across spaceand time
Matlab - bwlabelbwlabeln
Followup Science questionExplain cause
(drought190120061avi)
Figure Video courtsey Dr ArindamBanerjee
Chawla and Chandola Anomaly Detection
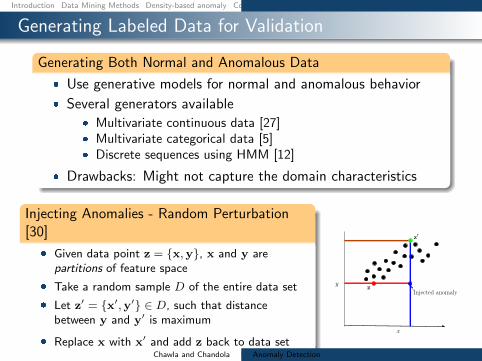
Introduction Data Mining Methods Density-based anomaly Commute Time Approach Addressing Scalability Anomalies in Complex Data Evaluating Anomaly Detection Methods Applications Problem solutions
Generating Labeled Data for Validation
Generating Both Normal and Anomalous Data
Use generative models for normal and anomalous behavior
Several generators available Multivariate continuous data [27] Multivariate categorical data [5] Discrete sequences using HMM [12]
Drawbacks Might not capture the domain characteristics
Injecting Anomalies - Random Perturbation[30]
Given data point z = xy x and y arepartitions of feature space
Take a random sample D of the entire data set
Let zprime = xprimeyprime isin D such that distancebetween y and yprime is maximum
Replace x with xprime and add z back to data setx
yz
zprime
Injected anomaly
Chawla and Chandola Anomaly Detection
Introduction Data Mining Methods Density-based anomaly Commute Time Approach Addressing Scalability Anomalies in Complex Data Evaluating Anomaly Detection Methods Applications Problem solutionsWhat is Network Anomaly Detection Motivation How Much Serious
Applications Overview
How to set up an anomaly detection solution for agiven application domain
Available data Define anomalies define normal behavior Identify requirements and constraints (online
real-time limited resources) What domain knowledge available
Feature identification Defining normal and anomalous behavior Tuning parameters
Available ground truth (training validation)
Chawla and Chandola Anomaly Detection
Introduction Data Mining Methods Density-based anomaly Commute Time Approach Addressing Scalability Anomalies in Complex Data Evaluating Anomaly Detection Methods Applications Problem solutionsWhat is Network Anomaly Detection Motivation How Much Serious
What is Network Anomaly Detection
Anomaly Detection or Intrusion Detection
Traditional Intrusion Detection Systems (IDS) finding attackscorresponding to predefined pattern data set known as signaturestherefore system is absolutely vulnerable against zero-day attacks
Network Anomaly Detection Systems (NADS) to detectzero-day attacks without any pre-identified signature besides profilenormal behavior of the network and address suspected incidents
Network Anomaly Detection finding unusual and largechanges in the network traffic
Examples intentional attacks (eg Distributed Denial ofService - DDoS) or unusual network traffic (eg flash crowds)
Chawla and Chandola Anomaly Detection
Introduction Data Mining Methods Density-based anomaly Commute Time Approach Addressing Scalability Anomalies in Complex Data Evaluating Anomaly Detection Methods Applications Problem solutionsWhat is Network Anomaly Detection Motivation How Much Serious
Motivation How Much Serious
According to Symantec report released in early 2011 morethan 286 million new threats have been detected in 2010which is a huge number
1656227
2704836
1000000
1500000
2000000
2500000
3000000
20547 18827 69107 113025 140690
624267
1656227
2704836
0
500000
1000000
1500000
2000000
2500000
3000000
2002 2003 2004 2005 2006 2007 2008 July2009-June2010
Chawla and Chandola Anomaly Detection
Introduction Data Mining Methods Density-based anomaly Commute Time Approach Addressing Scalability Anomalies in Complex Data Evaluating Anomaly Detection Methods Applications Problem solutionsNetwork Topology Network Anomalies Detection Problem Network Anomalies Detection Problem Why care about OD Flows
Network Topology
A Typical network
1 y
Router
2
3
41t
x2t
x1t
x3t
x4t
Origin-Destination (OD) flow is the traffic that enters at anorigin node and exits at a destination node of a backbonenetwork x1t x1t
Link measurement is the traffic enters at an node during aninterval y1t
Relationship between link traffic and OD flow traffic iscaptured by the routing matrix A
Chawla and Chandola Anomaly Detection
Introduction Data Mining Methods Density-based anomaly Commute Time Approach Addressing Scalability Anomalies in Complex Data Evaluating Anomaly Detection Methods Applications Problem solutionsNetwork Topology Network Anomalies Detection Problem Network Anomalies Detection Problem Why care about OD Flows
Network Anomalies Detection Problem
Chawla and Chandola Anomaly Detection
Introduction Data Mining Methods Density-based anomaly Commute Time Approach Addressing Scalability Anomalies in Complex Data Evaluating Anomaly Detection Methods Applications Problem solutionsNetwork Topology Network Anomalies Detection Problem Network Anomalies Detection Problem Why care about OD Flows
Network Anomalies Detection Problem
Chawla and Chandola Anomaly Detection
Introduction Data Mining Methods Density-based anomaly Commute Time Approach Addressing Scalability Anomalies in Complex Data Evaluating Anomaly Detection Methods Applications Problem solutionsNetwork Topology Network Anomalies Detection Problem Network Anomalies Detection Problem Why care about OD Flows
Why care about OD Flows
Volume anomaly typically arises on an OD flow (trafficarriving at one node and destined for another node)
If we only monitor traffic on network links volume arisingfrom an OD flow may not be noticeable Thus naiveapproach wont work if OD flow info is not available
Figure source [22]
Chawla and Chandola Anomaly Detection
Introduction Data Mining Methods Density-based anomaly Commute Time Approach Addressing Scalability Anomalies in Complex Data Evaluating Anomaly Detection Methods Applications Problem solutionsPCA and Subspace Method Subspace Method Algorithm Subspace Analysis Results Discussion Typical Characteristics of Anomaly Limitation of Volume Entropy Based versus Volume Based Fraud Detection Epidemeology Anomaly Detection in Climate and Weather Anomalies in Climate Validation of Anomalies
PCA and Subspace Method
Chawla and Chandola Anomaly Detection
Introduction Data Mining Methods Density-based anomaly Commute Time Approach Addressing Scalability Anomalies in Complex Data Evaluating Anomaly Detection Methods Applications Problem solutionsPCA and Subspace Method Subspace Method Algorithm Subspace Analysis Results Discussion Typical Characteristics of Anomaly Limitation of Volume Entropy Based versus Volume Based Fraud Detection Epidemeology Anomaly Detection in Climate and Weather Anomalies in Climate Validation of Anomalies
Subspace Method Algorithm
Step1- Determine the PCs based on eigenvaluedecomposition of the covariance matrix of the dataset
Step2- Choose first top k principle components with thehighest eigenvalues as matrix P
Step3-normal traffic subspace called Z
Z = PP TZ = CZ
Step4-abnormal traffic subspace called Z
Z = (I minus PP T )Z = CZ
Step5-If the norm of a vector is large then it is an rdquoanomalyrdquo
Chawla and Chandola Anomaly Detection
Introduction Data Mining Methods Density-based anomaly Commute Time Approach Addressing Scalability Anomalies in Complex Data Evaluating Anomaly Detection Methods Applications Problem solutionsPCA and Subspace Method Subspace Method Algorithm Subspace Analysis Results Discussion Typical Characteristics of Anomaly Limitation of Volume Entropy Based versus Volume Based Fraud Detection Epidemeology Anomaly Detection in Climate and Weather Anomalies in Climate Validation of Anomalies
Subspace Analysis Results
Note that during anomaly normal component does not changethat much while residual component changes quite a lot
Thus anomalies can be detected by setting some threshold
Figure source [22]
Chawla and Chandola Anomaly Detection
Introduction Data Mining Methods Density-based anomaly Commute Time Approach Addressing Scalability Anomalies in Complex Data Evaluating Anomaly Detection Methods Applications Problem solutionsPCA and Subspace Method Subspace Method Algorithm Subspace Analysis Results Discussion Typical Characteristics of Anomaly Limitation of Volume Entropy Based versus Volume Based Fraud Detection Epidemeology Anomaly Detection in Climate and Weather Anomalies in Climate Validation of Anomalies
Discussion Typical Characteristics of Anomaly
Most Anomalies induce a change in distributionalaspects of packet header fields (called features)
Most important features include 5-tuple Source ampdestination IP addresses Source and destination portnumbers and IP protocol
raquo DOS attack ndash multiple source IP address concentrated on asingle destination IP address
raquo Network scan ndash dispersed distribution of destination addresses
raquo Most wormsviruses also induce some change in distribution ofcertain features
raquo However these changes can be very subtle and mining them islike searching for needles in a haystack
Unlike many previous approach this paper aims todetect events which disturb the distribution of trafficfeatures rather than traffic volume
Chawla and Chandola Anomaly Detection
Introduction Data Mining Methods Density-based anomaly Commute Time Approach Addressing Scalability Anomalies in Complex Data Evaluating Anomaly Detection Methods Applications Problem solutionsPCA and Subspace Method Subspace Method Algorithm Subspace Analysis Results Discussion Typical Characteristics of Anomaly Limitation of Volume Entropy Based versus Volume Based Fraud Detection Epidemeology Anomaly Detection in Climate and Weather Anomalies in Climate Validation of Anomalies
Limitation of Volume
Figure source [22]
Port scan anomaly (traffic feature changes however traffic volume
remains more or less the same)
We can use entropy tocapture the variationsin the traffic feature
bullTakes value 0 when distribution is maximally concentratedbullTakes value log2N when distribution is maximally dispersed
But stands out in
feature entropy
which also reveals
its structure
Port scan
dwarfed
in volume
metricshellip
Chawla and Chandola Anomaly Detection
Introduction Data Mining Methods Density-based anomaly Commute Time Approach Addressing Scalability Anomalies in Complex Data Evaluating Anomaly Detection Methods Applications Problem solutionsPCA and Subspace Method Subspace Method Algorithm Subspace Analysis Results Discussion Typical Characteristics of Anomaly Limitation of Volume Entropy Based versus Volume Based Fraud Detection Epidemeology Anomaly Detection in Climate and Weather Anomalies in Climate Validation of Anomalies
Entropy Based versus Volume Based
DoSDDoS Attacks- a spike in traffic data toward adominant destination IP
Scan anomaly-a spike in traffic data from a dominant sourceIP
Flash Crowd anomaly- again a spike in traffic data to adominant destination IP
Worm anomaly-a Spike in traffic with a dominant port
Chawla and Chandola Anomaly Detection
Introduction Data Mining Methods Density-based anomaly Commute Time Approach Addressing Scalability Anomalies in Complex Data Evaluating Anomaly Detection Methods Applications Problem solutionsPCA and Subspace Method Subspace Method Algorithm Subspace Analysis Results Discussion Typical Characteristics of Anomaly Limitation of Volume Entropy Based versus Volume Based Fraud Detection Epidemeology Anomaly Detection in Climate and Weather Anomalies in Climate Validation of Anomalies
Fraud Detection
Domain Question Identifyfraudulent activities or players fromobserved transaction data
Data Transactions between different
players in the system Meta information about the
individuals An underlying graph structure
Challenges Track and model human behavior Anomalies caused by adaptive
human adversaries Massive data sizes
Insurance (autohealtha)
ClaimantProvider Payer
Telecommunications Customer
Provider
Credit Cards Customer
Supplier Bank
Web Advertising User Advertiser
Publisher
ahttpwwwcheatingculturecompast-cases-of-medicare-fraud
Chawla and Chandola Anomaly Detection
Introduction Data Mining Methods Density-based anomaly Commute Time Approach Addressing Scalability Anomalies in Complex Data Evaluating Anomaly Detection Methods Applications Problem solutionsPCA and Subspace Method Subspace Method Algorithm Subspace Analysis Results Discussion Typical Characteristics of Anomaly Limitation of Volume Entropy Based versus Volume Based Fraud Detection Epidemeology Anomaly Detection in Climate and Weather Anomalies in Climate Validation of Anomalies
A Generic Fraud Detection Method
Activity Monitoring [13]1 Build profiles for individuals (customers users etc) based on
historic data User X makes n calls on an average in January
2 Compare current behavior with historical profile for significantdeviations
Clustering based [4]1 Cluster historical profiles of customers2 Identify small clusters or outlying profiles as anomalies
Strengths Anomaly detection is fast (good for real time) Results are easy to explain
Weaknesses Need to create and maintain a large number of profiles Not dynamic Adequate historical data might not be available Too many false positives
Chawla and Chandola Anomaly Detection
Introduction Data Mining Methods Density-based anomaly Commute Time Approach Addressing Scalability Anomalies in Complex Data Evaluating Anomaly Detection Methods Applications Problem solutionsPCA and Subspace Method Subspace Method Algorithm Subspace Analysis Results Discussion Typical Characteristics of Anomaly Limitation of Volume Entropy Based versus Volume Based Fraud Detection Epidemeology Anomaly Detection in Climate and Weather Anomalies in Climate Validation of Anomalies
Exploiting Graph Structure - Weighted Graphs
Represent data as a weighted graph Communication networks (phone email SMS) Provider referral networks
Objective Identify anomalous nodes
For each node extract several features based on the propertiesof the induced sub-graph (egonet) of neighboring nodes [1]
Choose features that can highlight anomalous nodes
1 Ni degree of node2 Ei number of edges in egonet3 Wi total weight of egonet4 λi principal eigen vector of weighted adjacency matrix of
egonet
Data is transformed into a point in a multi-dimensional space
Chawla and Chandola Anomaly Detection
Introduction Data Mining Methods Density-based anomaly Commute Time Approach Addressing Scalability Anomalies in Complex Data Evaluating Anomaly Detection Methods Applications Problem solutionsPCA and Subspace Method Subspace Method Algorithm Subspace Analysis Results Discussion Typical Characteristics of Anomaly Limitation of Volume Entropy Based versus Volume Based Fraud Detection Epidemeology Anomaly Detection in Climate and Weather Anomalies in Climate Validation of Anomalies
Identifying Anomalies
Traditional anomaly detection (lof) Can be slow but can identify any type of anomalous structure
Faster method to identify specific types of anomalousstructures
Identify relevant feature pairs and power law relationship
Eg Egonet Density Power Law Ni vs Ei - detect nearcliques and stars
Ei prop Nαi 1 le α le 2
Anomaly score for node i wrt a pair of features (y = Cxθ)
Si =max(yi Cx
θi )
min(yi Cxθi )lowast log (|yi minus Cxθi |+ 1)
Chawla and Chandola Anomaly Detection
Introduction Data Mining Methods Density-based anomaly Commute Time Approach Addressing Scalability Anomalies in Complex Data Evaluating Anomaly Detection Methods Applications Problem solutionsPCA and Subspace Method Subspace Method Algorithm Subspace Analysis Results Discussion Typical Characteristics of Anomaly Limitation of Volume Entropy Based versus Volume Based Fraud Detection Epidemeology Anomaly Detection in Climate and Weather Anomalies in Climate Validation of Anomalies
Exploiting Graph Structure - Bipartite Graphs
Represent data as a bipartite graph Healthcare Data (Beneficiaries vs Providers) Insider trading (Traders vs Stocks)
Objective Identify anomalous links
Given a query node a isin V1 find the ldquorelevancerdquoof all other nodes in V1 to a
RelevanceScore(a b) prop Number of times aldquorandom walkrdquo from a reaches b
Use the relevance scores to compute thenormality scores for a node t isin V2
Find set St = a|〈a t〉 isin E Compute |St| times |St| similarity matrix using
relevance vectors for a isin St Normality Score = mean of non-diagonal entries
of similarity matrix
V1 E V2a1
a2
a3
an
t1
t2
t3
tn
Chawla and Chandola Anomaly Detection
Introduction Data Mining Methods Density-based anomaly Commute Time Approach Addressing Scalability Anomalies in Complex Data Evaluating Anomaly Detection Methods Applications Problem solutionsPCA and Subspace Method Subspace Method Algorithm Subspace Analysis Results Discussion Typical Characteristics of Anomaly Limitation of Volume Entropy Based versus Volume Based Fraud Detection Epidemeology Anomaly Detection in Climate and Weather Anomalies in Climate Validation of Anomalies
Detecting Disease Outbreaks
Domain Question Early detection of disease
outbreaks Anthrax attack
Data Emergency department visits Grocery data (Example [14]) Clinical visits Weatherclimate data
Challenges Weak signals in the data
ED cases involving cough rArrFlu or SARS
Integration of multiple signals(lag analysis)
Account for spatial and temporalcorrelations
Chawla and Chandola Anomaly Detection
Introduction Data Mining Methods Density-based anomaly Commute Time Approach Addressing Scalability Anomalies in Complex Data Evaluating Anomaly Detection Methods Applications Problem solutionsPCA and Subspace Method Subspace Method Algorithm Subspace Analysis Results Discussion Typical Characteristics of Anomaly Limitation of Volume Entropy Based versus Volume Based Fraud Detection Epidemeology Anomaly Detection in Climate and Weather Anomalies in Climate Validation of Anomalies
Whatrsquos Significant About Recent Events (WSARE) [33]
1 Learn Bayesian network from historical data Environmental and response variables
2 Sample from the BN (DBbaseline|Current Environment)3 Compute contingency table for rules for DBbaseline andDBcurrent
Rules are single assignment rules (Xi = Y ji ) or conjunctions4 Find p-value for rules using χ2-test
Null Hypothesis Rows and columns of tables for DBbaselineand DBcurrent are independent
5 Find rule with largest p-value Repeat Step 2
Chawla and Chandola Anomaly Detection
Introduction Data Mining Methods Density-based anomaly Commute Time Approach Addressing Scalability Anomalies in Complex Data Evaluating Anomaly Detection Methods Applications Problem solutionsPCA and Subspace Method Subspace Method Algorithm Subspace Analysis Results Discussion Typical Characteristics of Anomaly Limitation of Volume Entropy Based versus Volume Based Fraud Detection Epidemeology Anomaly Detection in Climate and Weather Anomalies in Climate Validation of Anomalies
Incorporating Spatial and Temporal Relationships
WSARE does not explicitly model the spatial and temporalrelationships
What happened yesterday What happened in the adjoining neighborhood (yesterday)
Bayesian Network Spatio-Temporal (BNST) modelingframework [17]
Add nodes for temporal and spatial dependencies Need more data to train
Chawla and Chandola Anomaly Detection
Introduction Data Mining Methods Density-based anomaly Commute Time Approach Addressing Scalability Anomalies in Complex Data Evaluating Anomaly Detection Methods Applications Problem solutionsPCA and Subspace Method Subspace Method Algorithm Subspace Analysis Results Discussion Typical Characteristics of Anomaly Limitation of Volume Entropy Based versus Volume Based Fraud Detection Epidemeology Anomaly Detection in Climate and Weather Anomalies in Climate Validation of Anomalies
Anomaly Detection in Climate and Weather
Science Questions Identify natural and anthropogenic disasters Identify long time scale events - droughts atmospheric rivers
cold fronts etc
Data Ground observations Remote sensing data (satellites
air-borne) Climate model simulation outputs Multiple variables spatio-temporal (often has height dimension
as well)
Challenges Model spatio-temporal relationships across multiple variables Explain the cause of anomalies Massive data sizes
Climate and weather extreme events are well defined
Key challenge is to find significant events and explain the cause
Chawla and Chandola Anomaly Detection
Introduction Data Mining Methods Density-based anomaly Commute Time Approach Addressing Scalability Anomalies in Complex Data Evaluating Anomaly Detection Methods Applications Problem solutionsPCA and Subspace Method Subspace Method Algorithm Subspace Analysis Results Discussion Typical Characteristics of Anomaly Limitation of Volume Entropy Based versus Volume Based Fraud Detection Epidemeology Anomaly Detection in Climate and Weather Anomalies in Climate Validation of Anomalies
Anomalies are Widely Used in Climate
Most analysis done on ldquoanomalyrdquo time series
Difference from a ldquobase periodrdquo (Toosimplistic)
Brings spatial smoothness (eg a mountaintop and nearby valley can have very differenttemperatures) Removes seasonality
Understand climate and weatherphenomenon
Southern Oscillation Index (SOI) Difference between Sea Level Pressure
(SLP) anomalies for Tahiti and DarwinAustralia
Figure Global AverageTemperature Anomaly(1975 - 2007) Srcwwwmetofficegovuk
Chawla and Chandola Anomaly Detection
Introduction Data Mining Methods Density-based anomaly Commute Time Approach Addressing Scalability Anomalies in Complex Data Evaluating Anomaly Detection Methods Applications Problem solutionsPCA and Subspace Method Subspace Method Algorithm Subspace Analysis Results Discussion Typical Characteristics of Anomaly Limitation of Volume Entropy Based versus Volume Based Fraud Detection Epidemeology Anomaly Detection in Climate and Weather Anomalies in Climate Validation of Anomalies
Constructing Anomalies from Raw Data
Anomaly time series for a given location i
vprimei = vi minus bi
where bi is the base (reference)
How to choose bi Mean of all data for location i Monthly mean values (account for seasonality) Monthly z-score values Median (more robust) Using a shorter ldquoreference periodrdquo
30 year moving window
Different methods show statistically significant differences[19] What is the right strategy Weighted mean of different strategies (Pick weights using
Monte Carlo sampling)
Chawla and Chandola Anomaly Detection
Introduction Data Mining Methods Density-based anomaly Commute Time Approach Addressing Scalability Anomalies in Complex Data Evaluating Anomaly Detection Methods Applications Problem solutionsPCA and Subspace Method Subspace Method Algorithm Subspace Analysis Results Discussion Typical Characteristics of Anomaly Limitation of Volume Entropy Based versus Volume Based Fraud Detection Epidemeology Anomaly Detection in Climate and Weather Anomalies in Climate Validation of Anomalies
Anomaly Detection for Identifying Droughts
Science question Identify significant drought patterns usinghistorical observation data or future simulation data or both
Find persistent spatiotemporal anomalies in precipitation data
A two step approach
1 Find precipitationanomalies usingthresholds
2 Find large connectedcomponents across spaceand time
Matlab - bwlabelbwlabeln
Followup Science questionExplain cause
(drought190120061avi)
Figure Video courtsey Dr ArindamBanerjee
Chawla and Chandola Anomaly Detection
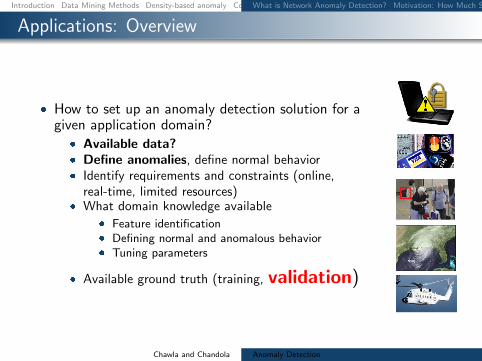
Introduction Data Mining Methods Density-based anomaly Commute Time Approach Addressing Scalability Anomalies in Complex Data Evaluating Anomaly Detection Methods Applications Problem solutionsWhat is Network Anomaly Detection Motivation How Much Serious
What is Network Anomaly Detection
Anomaly Detection or Intrusion Detection
Traditional Intrusion Detection Systems (IDS) finding attackscorresponding to predefined pattern data set known as signaturestherefore system is absolutely vulnerable against zero-day attacks
Network Anomaly Detection Systems (NADS) to detectzero-day attacks without any pre-identified signature besides profilenormal behavior of the network and address suspected incidents
Network Anomaly Detection finding unusual and largechanges in the network traffic
Examples intentional attacks (eg Distributed Denial ofService - DDoS) or unusual network traffic (eg flash crowds)
Chawla and Chandola Anomaly Detection
Introduction Data Mining Methods Density-based anomaly Commute Time Approach Addressing Scalability Anomalies in Complex Data Evaluating Anomaly Detection Methods Applications Problem solutionsWhat is Network Anomaly Detection Motivation How Much Serious
Motivation How Much Serious
According to Symantec report released in early 2011 morethan 286 million new threats have been detected in 2010which is a huge number
1656227
2704836
1000000
1500000
2000000
2500000
3000000
20547 18827 69107 113025 140690
624267
1656227
2704836
0
500000
1000000
1500000
2000000
2500000
3000000
2002 2003 2004 2005 2006 2007 2008 July2009-June2010
Chawla and Chandola Anomaly Detection
Introduction Data Mining Methods Density-based anomaly Commute Time Approach Addressing Scalability Anomalies in Complex Data Evaluating Anomaly Detection Methods Applications Problem solutionsNetwork Topology Network Anomalies Detection Problem Network Anomalies Detection Problem Why care about OD Flows
Network Topology
A Typical network
1 y
Router
2
3
41t
x2t
x1t
x3t
x4t
Origin-Destination (OD) flow is the traffic that enters at anorigin node and exits at a destination node of a backbonenetwork x1t x1t
Link measurement is the traffic enters at an node during aninterval y1t
Relationship between link traffic and OD flow traffic iscaptured by the routing matrix A
Chawla and Chandola Anomaly Detection
Introduction Data Mining Methods Density-based anomaly Commute Time Approach Addressing Scalability Anomalies in Complex Data Evaluating Anomaly Detection Methods Applications Problem solutionsNetwork Topology Network Anomalies Detection Problem Network Anomalies Detection Problem Why care about OD Flows
Network Anomalies Detection Problem
Chawla and Chandola Anomaly Detection
Introduction Data Mining Methods Density-based anomaly Commute Time Approach Addressing Scalability Anomalies in Complex Data Evaluating Anomaly Detection Methods Applications Problem solutionsNetwork Topology Network Anomalies Detection Problem Network Anomalies Detection Problem Why care about OD Flows
Network Anomalies Detection Problem
Chawla and Chandola Anomaly Detection
Introduction Data Mining Methods Density-based anomaly Commute Time Approach Addressing Scalability Anomalies in Complex Data Evaluating Anomaly Detection Methods Applications Problem solutionsNetwork Topology Network Anomalies Detection Problem Network Anomalies Detection Problem Why care about OD Flows
Why care about OD Flows
Volume anomaly typically arises on an OD flow (trafficarriving at one node and destined for another node)
If we only monitor traffic on network links volume arisingfrom an OD flow may not be noticeable Thus naiveapproach wont work if OD flow info is not available
Figure source [22]
Chawla and Chandola Anomaly Detection
Introduction Data Mining Methods Density-based anomaly Commute Time Approach Addressing Scalability Anomalies in Complex Data Evaluating Anomaly Detection Methods Applications Problem solutionsPCA and Subspace Method Subspace Method Algorithm Subspace Analysis Results Discussion Typical Characteristics of Anomaly Limitation of Volume Entropy Based versus Volume Based Fraud Detection Epidemeology Anomaly Detection in Climate and Weather Anomalies in Climate Validation of Anomalies
PCA and Subspace Method
Chawla and Chandola Anomaly Detection
Introduction Data Mining Methods Density-based anomaly Commute Time Approach Addressing Scalability Anomalies in Complex Data Evaluating Anomaly Detection Methods Applications Problem solutionsPCA and Subspace Method Subspace Method Algorithm Subspace Analysis Results Discussion Typical Characteristics of Anomaly Limitation of Volume Entropy Based versus Volume Based Fraud Detection Epidemeology Anomaly Detection in Climate and Weather Anomalies in Climate Validation of Anomalies
Subspace Method Algorithm
Step1- Determine the PCs based on eigenvaluedecomposition of the covariance matrix of the dataset
Step2- Choose first top k principle components with thehighest eigenvalues as matrix P
Step3-normal traffic subspace called Z
Z = PP TZ = CZ
Step4-abnormal traffic subspace called Z
Z = (I minus PP T )Z = CZ
Step5-If the norm of a vector is large then it is an rdquoanomalyrdquo
Chawla and Chandola Anomaly Detection
Introduction Data Mining Methods Density-based anomaly Commute Time Approach Addressing Scalability Anomalies in Complex Data Evaluating Anomaly Detection Methods Applications Problem solutionsPCA and Subspace Method Subspace Method Algorithm Subspace Analysis Results Discussion Typical Characteristics of Anomaly Limitation of Volume Entropy Based versus Volume Based Fraud Detection Epidemeology Anomaly Detection in Climate and Weather Anomalies in Climate Validation of Anomalies
Subspace Analysis Results
Note that during anomaly normal component does not changethat much while residual component changes quite a lot
Thus anomalies can be detected by setting some threshold
Figure source [22]
Chawla and Chandola Anomaly Detection
Introduction Data Mining Methods Density-based anomaly Commute Time Approach Addressing Scalability Anomalies in Complex Data Evaluating Anomaly Detection Methods Applications Problem solutionsPCA and Subspace Method Subspace Method Algorithm Subspace Analysis Results Discussion Typical Characteristics of Anomaly Limitation of Volume Entropy Based versus Volume Based Fraud Detection Epidemeology Anomaly Detection in Climate and Weather Anomalies in Climate Validation of Anomalies
Discussion Typical Characteristics of Anomaly
Most Anomalies induce a change in distributionalaspects of packet header fields (called features)
Most important features include 5-tuple Source ampdestination IP addresses Source and destination portnumbers and IP protocol
raquo DOS attack ndash multiple source IP address concentrated on asingle destination IP address
raquo Network scan ndash dispersed distribution of destination addresses
raquo Most wormsviruses also induce some change in distribution ofcertain features
raquo However these changes can be very subtle and mining them islike searching for needles in a haystack
Unlike many previous approach this paper aims todetect events which disturb the distribution of trafficfeatures rather than traffic volume
Chawla and Chandola Anomaly Detection
Introduction Data Mining Methods Density-based anomaly Commute Time Approach Addressing Scalability Anomalies in Complex Data Evaluating Anomaly Detection Methods Applications Problem solutionsPCA and Subspace Method Subspace Method Algorithm Subspace Analysis Results Discussion Typical Characteristics of Anomaly Limitation of Volume Entropy Based versus Volume Based Fraud Detection Epidemeology Anomaly Detection in Climate and Weather Anomalies in Climate Validation of Anomalies
Limitation of Volume
Figure source [22]
Port scan anomaly (traffic feature changes however traffic volume
remains more or less the same)
We can use entropy tocapture the variationsin the traffic feature
bullTakes value 0 when distribution is maximally concentratedbullTakes value log2N when distribution is maximally dispersed
But stands out in
feature entropy
which also reveals
its structure
Port scan
dwarfed
in volume
metricshellip
Chawla and Chandola Anomaly Detection
Introduction Data Mining Methods Density-based anomaly Commute Time Approach Addressing Scalability Anomalies in Complex Data Evaluating Anomaly Detection Methods Applications Problem solutionsPCA and Subspace Method Subspace Method Algorithm Subspace Analysis Results Discussion Typical Characteristics of Anomaly Limitation of Volume Entropy Based versus Volume Based Fraud Detection Epidemeology Anomaly Detection in Climate and Weather Anomalies in Climate Validation of Anomalies
Entropy Based versus Volume Based
DoSDDoS Attacks- a spike in traffic data toward adominant destination IP
Scan anomaly-a spike in traffic data from a dominant sourceIP
Flash Crowd anomaly- again a spike in traffic data to adominant destination IP
Worm anomaly-a Spike in traffic with a dominant port
Chawla and Chandola Anomaly Detection
Introduction Data Mining Methods Density-based anomaly Commute Time Approach Addressing Scalability Anomalies in Complex Data Evaluating Anomaly Detection Methods Applications Problem solutionsPCA and Subspace Method Subspace Method Algorithm Subspace Analysis Results Discussion Typical Characteristics of Anomaly Limitation of Volume Entropy Based versus Volume Based Fraud Detection Epidemeology Anomaly Detection in Climate and Weather Anomalies in Climate Validation of Anomalies
Fraud Detection
Domain Question Identifyfraudulent activities or players fromobserved transaction data
Data Transactions between different
players in the system Meta information about the
individuals An underlying graph structure
Challenges Track and model human behavior Anomalies caused by adaptive
human adversaries Massive data sizes
Insurance (autohealtha)
ClaimantProvider Payer
Telecommunications Customer
Provider
Credit Cards Customer
Supplier Bank
Web Advertising User Advertiser
Publisher
ahttpwwwcheatingculturecompast-cases-of-medicare-fraud
Chawla and Chandola Anomaly Detection
Introduction Data Mining Methods Density-based anomaly Commute Time Approach Addressing Scalability Anomalies in Complex Data Evaluating Anomaly Detection Methods Applications Problem solutionsPCA and Subspace Method Subspace Method Algorithm Subspace Analysis Results Discussion Typical Characteristics of Anomaly Limitation of Volume Entropy Based versus Volume Based Fraud Detection Epidemeology Anomaly Detection in Climate and Weather Anomalies in Climate Validation of Anomalies
A Generic Fraud Detection Method
Activity Monitoring [13]1 Build profiles for individuals (customers users etc) based on
historic data User X makes n calls on an average in January
2 Compare current behavior with historical profile for significantdeviations
Clustering based [4]1 Cluster historical profiles of customers2 Identify small clusters or outlying profiles as anomalies
Strengths Anomaly detection is fast (good for real time) Results are easy to explain
Weaknesses Need to create and maintain a large number of profiles Not dynamic Adequate historical data might not be available Too many false positives
Chawla and Chandola Anomaly Detection
Introduction Data Mining Methods Density-based anomaly Commute Time Approach Addressing Scalability Anomalies in Complex Data Evaluating Anomaly Detection Methods Applications Problem solutionsPCA and Subspace Method Subspace Method Algorithm Subspace Analysis Results Discussion Typical Characteristics of Anomaly Limitation of Volume Entropy Based versus Volume Based Fraud Detection Epidemeology Anomaly Detection in Climate and Weather Anomalies in Climate Validation of Anomalies
Exploiting Graph Structure - Weighted Graphs
Represent data as a weighted graph Communication networks (phone email SMS) Provider referral networks
Objective Identify anomalous nodes
For each node extract several features based on the propertiesof the induced sub-graph (egonet) of neighboring nodes [1]
Choose features that can highlight anomalous nodes
1 Ni degree of node2 Ei number of edges in egonet3 Wi total weight of egonet4 λi principal eigen vector of weighted adjacency matrix of
egonet
Data is transformed into a point in a multi-dimensional space
Chawla and Chandola Anomaly Detection
Introduction Data Mining Methods Density-based anomaly Commute Time Approach Addressing Scalability Anomalies in Complex Data Evaluating Anomaly Detection Methods Applications Problem solutionsPCA and Subspace Method Subspace Method Algorithm Subspace Analysis Results Discussion Typical Characteristics of Anomaly Limitation of Volume Entropy Based versus Volume Based Fraud Detection Epidemeology Anomaly Detection in Climate and Weather Anomalies in Climate Validation of Anomalies
Identifying Anomalies
Traditional anomaly detection (lof) Can be slow but can identify any type of anomalous structure
Faster method to identify specific types of anomalousstructures
Identify relevant feature pairs and power law relationship
Eg Egonet Density Power Law Ni vs Ei - detect nearcliques and stars
Ei prop Nαi 1 le α le 2
Anomaly score for node i wrt a pair of features (y = Cxθ)
Si =max(yi Cx
θi )
min(yi Cxθi )lowast log (|yi minus Cxθi |+ 1)
Chawla and Chandola Anomaly Detection
Introduction Data Mining Methods Density-based anomaly Commute Time Approach Addressing Scalability Anomalies in Complex Data Evaluating Anomaly Detection Methods Applications Problem solutionsPCA and Subspace Method Subspace Method Algorithm Subspace Analysis Results Discussion Typical Characteristics of Anomaly Limitation of Volume Entropy Based versus Volume Based Fraud Detection Epidemeology Anomaly Detection in Climate and Weather Anomalies in Climate Validation of Anomalies
Exploiting Graph Structure - Bipartite Graphs
Represent data as a bipartite graph Healthcare Data (Beneficiaries vs Providers) Insider trading (Traders vs Stocks)
Objective Identify anomalous links
Given a query node a isin V1 find the ldquorelevancerdquoof all other nodes in V1 to a
RelevanceScore(a b) prop Number of times aldquorandom walkrdquo from a reaches b
Use the relevance scores to compute thenormality scores for a node t isin V2
Find set St = a|〈a t〉 isin E Compute |St| times |St| similarity matrix using
relevance vectors for a isin St Normality Score = mean of non-diagonal entries
of similarity matrix
V1 E V2a1
a2
a3
an
t1
t2
t3
tn
Chawla and Chandola Anomaly Detection
Introduction Data Mining Methods Density-based anomaly Commute Time Approach Addressing Scalability Anomalies in Complex Data Evaluating Anomaly Detection Methods Applications Problem solutionsPCA and Subspace Method Subspace Method Algorithm Subspace Analysis Results Discussion Typical Characteristics of Anomaly Limitation of Volume Entropy Based versus Volume Based Fraud Detection Epidemeology Anomaly Detection in Climate and Weather Anomalies in Climate Validation of Anomalies
Detecting Disease Outbreaks
Domain Question Early detection of disease
outbreaks Anthrax attack
Data Emergency department visits Grocery data (Example [14]) Clinical visits Weatherclimate data
Challenges Weak signals in the data
ED cases involving cough rArrFlu or SARS
Integration of multiple signals(lag analysis)
Account for spatial and temporalcorrelations
Chawla and Chandola Anomaly Detection
Introduction Data Mining Methods Density-based anomaly Commute Time Approach Addressing Scalability Anomalies in Complex Data Evaluating Anomaly Detection Methods Applications Problem solutionsPCA and Subspace Method Subspace Method Algorithm Subspace Analysis Results Discussion Typical Characteristics of Anomaly Limitation of Volume Entropy Based versus Volume Based Fraud Detection Epidemeology Anomaly Detection in Climate and Weather Anomalies in Climate Validation of Anomalies
Whatrsquos Significant About Recent Events (WSARE) [33]
1 Learn Bayesian network from historical data Environmental and response variables
2 Sample from the BN (DBbaseline|Current Environment)3 Compute contingency table for rules for DBbaseline andDBcurrent
Rules are single assignment rules (Xi = Y ji ) or conjunctions4 Find p-value for rules using χ2-test
Null Hypothesis Rows and columns of tables for DBbaselineand DBcurrent are independent
5 Find rule with largest p-value Repeat Step 2
Chawla and Chandola Anomaly Detection
Introduction Data Mining Methods Density-based anomaly Commute Time Approach Addressing Scalability Anomalies in Complex Data Evaluating Anomaly Detection Methods Applications Problem solutionsPCA and Subspace Method Subspace Method Algorithm Subspace Analysis Results Discussion Typical Characteristics of Anomaly Limitation of Volume Entropy Based versus Volume Based Fraud Detection Epidemeology Anomaly Detection in Climate and Weather Anomalies in Climate Validation of Anomalies
Incorporating Spatial and Temporal Relationships
WSARE does not explicitly model the spatial and temporalrelationships
What happened yesterday What happened in the adjoining neighborhood (yesterday)
Bayesian Network Spatio-Temporal (BNST) modelingframework [17]
Add nodes for temporal and spatial dependencies Need more data to train
Chawla and Chandola Anomaly Detection
Introduction Data Mining Methods Density-based anomaly Commute Time Approach Addressing Scalability Anomalies in Complex Data Evaluating Anomaly Detection Methods Applications Problem solutionsPCA and Subspace Method Subspace Method Algorithm Subspace Analysis Results Discussion Typical Characteristics of Anomaly Limitation of Volume Entropy Based versus Volume Based Fraud Detection Epidemeology Anomaly Detection in Climate and Weather Anomalies in Climate Validation of Anomalies
Anomaly Detection in Climate and Weather
Science Questions Identify natural and anthropogenic disasters Identify long time scale events - droughts atmospheric rivers
cold fronts etc
Data Ground observations Remote sensing data (satellites
air-borne) Climate model simulation outputs Multiple variables spatio-temporal (often has height dimension
as well)
Challenges Model spatio-temporal relationships across multiple variables Explain the cause of anomalies Massive data sizes
Climate and weather extreme events are well defined
Key challenge is to find significant events and explain the cause
Chawla and Chandola Anomaly Detection
Introduction Data Mining Methods Density-based anomaly Commute Time Approach Addressing Scalability Anomalies in Complex Data Evaluating Anomaly Detection Methods Applications Problem solutionsPCA and Subspace Method Subspace Method Algorithm Subspace Analysis Results Discussion Typical Characteristics of Anomaly Limitation of Volume Entropy Based versus Volume Based Fraud Detection Epidemeology Anomaly Detection in Climate and Weather Anomalies in Climate Validation of Anomalies
Anomalies are Widely Used in Climate
Most analysis done on ldquoanomalyrdquo time series
Difference from a ldquobase periodrdquo (Toosimplistic)
Brings spatial smoothness (eg a mountaintop and nearby valley can have very differenttemperatures) Removes seasonality
Understand climate and weatherphenomenon
Southern Oscillation Index (SOI) Difference between Sea Level Pressure
(SLP) anomalies for Tahiti and DarwinAustralia
Figure Global AverageTemperature Anomaly(1975 - 2007) Srcwwwmetofficegovuk
Chawla and Chandola Anomaly Detection
Introduction Data Mining Methods Density-based anomaly Commute Time Approach Addressing Scalability Anomalies in Complex Data Evaluating Anomaly Detection Methods Applications Problem solutionsPCA and Subspace Method Subspace Method Algorithm Subspace Analysis Results Discussion Typical Characteristics of Anomaly Limitation of Volume Entropy Based versus Volume Based Fraud Detection Epidemeology Anomaly Detection in Climate and Weather Anomalies in Climate Validation of Anomalies
Constructing Anomalies from Raw Data
Anomaly time series for a given location i
vprimei = vi minus bi
where bi is the base (reference)
How to choose bi Mean of all data for location i Monthly mean values (account for seasonality) Monthly z-score values Median (more robust) Using a shorter ldquoreference periodrdquo
30 year moving window
Different methods show statistically significant differences[19] What is the right strategy Weighted mean of different strategies (Pick weights using
Monte Carlo sampling)
Chawla and Chandola Anomaly Detection
Introduction Data Mining Methods Density-based anomaly Commute Time Approach Addressing Scalability Anomalies in Complex Data Evaluating Anomaly Detection Methods Applications Problem solutionsPCA and Subspace Method Subspace Method Algorithm Subspace Analysis Results Discussion Typical Characteristics of Anomaly Limitation of Volume Entropy Based versus Volume Based Fraud Detection Epidemeology Anomaly Detection in Climate and Weather Anomalies in Climate Validation of Anomalies
Anomaly Detection for Identifying Droughts
Science question Identify significant drought patterns usinghistorical observation data or future simulation data or both
Find persistent spatiotemporal anomalies in precipitation data
A two step approach
1 Find precipitationanomalies usingthresholds
2 Find large connectedcomponents across spaceand time
Matlab - bwlabelbwlabeln
Followup Science questionExplain cause
(drought190120061avi)
Figure Video courtsey Dr ArindamBanerjee
Chawla and Chandola Anomaly Detection
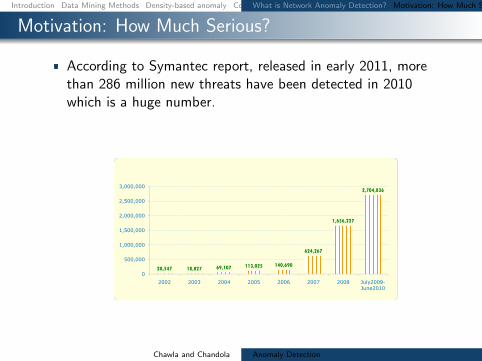
Introduction Data Mining Methods Density-based anomaly Commute Time Approach Addressing Scalability Anomalies in Complex Data Evaluating Anomaly Detection Methods Applications Problem solutionsWhat is Network Anomaly Detection Motivation How Much Serious
Motivation How Much Serious
According to Symantec report released in early 2011 morethan 286 million new threats have been detected in 2010which is a huge number
1656227
2704836
1000000
1500000
2000000
2500000
3000000
20547 18827 69107 113025 140690
624267
1656227
2704836
0
500000
1000000
1500000
2000000
2500000
3000000
2002 2003 2004 2005 2006 2007 2008 July2009-June2010
Chawla and Chandola Anomaly Detection
Introduction Data Mining Methods Density-based anomaly Commute Time Approach Addressing Scalability Anomalies in Complex Data Evaluating Anomaly Detection Methods Applications Problem solutionsNetwork Topology Network Anomalies Detection Problem Network Anomalies Detection Problem Why care about OD Flows
Network Topology
A Typical network
1 y
Router
2
3
41t
x2t
x1t
x3t
x4t
Origin-Destination (OD) flow is the traffic that enters at anorigin node and exits at a destination node of a backbonenetwork x1t x1t
Link measurement is the traffic enters at an node during aninterval y1t
Relationship between link traffic and OD flow traffic iscaptured by the routing matrix A
Chawla and Chandola Anomaly Detection
Introduction Data Mining Methods Density-based anomaly Commute Time Approach Addressing Scalability Anomalies in Complex Data Evaluating Anomaly Detection Methods Applications Problem solutionsNetwork Topology Network Anomalies Detection Problem Network Anomalies Detection Problem Why care about OD Flows
Network Anomalies Detection Problem
Chawla and Chandola Anomaly Detection
Introduction Data Mining Methods Density-based anomaly Commute Time Approach Addressing Scalability Anomalies in Complex Data Evaluating Anomaly Detection Methods Applications Problem solutionsNetwork Topology Network Anomalies Detection Problem Network Anomalies Detection Problem Why care about OD Flows
Network Anomalies Detection Problem
Chawla and Chandola Anomaly Detection
Introduction Data Mining Methods Density-based anomaly Commute Time Approach Addressing Scalability Anomalies in Complex Data Evaluating Anomaly Detection Methods Applications Problem solutionsNetwork Topology Network Anomalies Detection Problem Network Anomalies Detection Problem Why care about OD Flows
Why care about OD Flows
Volume anomaly typically arises on an OD flow (trafficarriving at one node and destined for another node)
If we only monitor traffic on network links volume arisingfrom an OD flow may not be noticeable Thus naiveapproach wont work if OD flow info is not available
Figure source [22]
Chawla and Chandola Anomaly Detection
Introduction Data Mining Methods Density-based anomaly Commute Time Approach Addressing Scalability Anomalies in Complex Data Evaluating Anomaly Detection Methods Applications Problem solutionsPCA and Subspace Method Subspace Method Algorithm Subspace Analysis Results Discussion Typical Characteristics of Anomaly Limitation of Volume Entropy Based versus Volume Based Fraud Detection Epidemeology Anomaly Detection in Climate and Weather Anomalies in Climate Validation of Anomalies
PCA and Subspace Method
Chawla and Chandola Anomaly Detection
Introduction Data Mining Methods Density-based anomaly Commute Time Approach Addressing Scalability Anomalies in Complex Data Evaluating Anomaly Detection Methods Applications Problem solutionsPCA and Subspace Method Subspace Method Algorithm Subspace Analysis Results Discussion Typical Characteristics of Anomaly Limitation of Volume Entropy Based versus Volume Based Fraud Detection Epidemeology Anomaly Detection in Climate and Weather Anomalies in Climate Validation of Anomalies
Subspace Method Algorithm
Step1- Determine the PCs based on eigenvaluedecomposition of the covariance matrix of the dataset
Step2- Choose first top k principle components with thehighest eigenvalues as matrix P
Step3-normal traffic subspace called Z
Z = PP TZ = CZ
Step4-abnormal traffic subspace called Z
Z = (I minus PP T )Z = CZ
Step5-If the norm of a vector is large then it is an rdquoanomalyrdquo
Chawla and Chandola Anomaly Detection
Introduction Data Mining Methods Density-based anomaly Commute Time Approach Addressing Scalability Anomalies in Complex Data Evaluating Anomaly Detection Methods Applications Problem solutionsPCA and Subspace Method Subspace Method Algorithm Subspace Analysis Results Discussion Typical Characteristics of Anomaly Limitation of Volume Entropy Based versus Volume Based Fraud Detection Epidemeology Anomaly Detection in Climate and Weather Anomalies in Climate Validation of Anomalies
Subspace Analysis Results
Note that during anomaly normal component does not changethat much while residual component changes quite a lot
Thus anomalies can be detected by setting some threshold
Figure source [22]
Chawla and Chandola Anomaly Detection
Introduction Data Mining Methods Density-based anomaly Commute Time Approach Addressing Scalability Anomalies in Complex Data Evaluating Anomaly Detection Methods Applications Problem solutionsPCA and Subspace Method Subspace Method Algorithm Subspace Analysis Results Discussion Typical Characteristics of Anomaly Limitation of Volume Entropy Based versus Volume Based Fraud Detection Epidemeology Anomaly Detection in Climate and Weather Anomalies in Climate Validation of Anomalies
Discussion Typical Characteristics of Anomaly
Most Anomalies induce a change in distributionalaspects of packet header fields (called features)
Most important features include 5-tuple Source ampdestination IP addresses Source and destination portnumbers and IP protocol
raquo DOS attack ndash multiple source IP address concentrated on asingle destination IP address
raquo Network scan ndash dispersed distribution of destination addresses
raquo Most wormsviruses also induce some change in distribution ofcertain features
raquo However these changes can be very subtle and mining them islike searching for needles in a haystack
Unlike many previous approach this paper aims todetect events which disturb the distribution of trafficfeatures rather than traffic volume
Chawla and Chandola Anomaly Detection
Introduction Data Mining Methods Density-based anomaly Commute Time Approach Addressing Scalability Anomalies in Complex Data Evaluating Anomaly Detection Methods Applications Problem solutionsPCA and Subspace Method Subspace Method Algorithm Subspace Analysis Results Discussion Typical Characteristics of Anomaly Limitation of Volume Entropy Based versus Volume Based Fraud Detection Epidemeology Anomaly Detection in Climate and Weather Anomalies in Climate Validation of Anomalies
Limitation of Volume
Figure source [22]
Port scan anomaly (traffic feature changes however traffic volume
remains more or less the same)
We can use entropy tocapture the variationsin the traffic feature
bullTakes value 0 when distribution is maximally concentratedbullTakes value log2N when distribution is maximally dispersed
But stands out in
feature entropy
which also reveals
its structure
Port scan
dwarfed
in volume
metricshellip
Chawla and Chandola Anomaly Detection
Introduction Data Mining Methods Density-based anomaly Commute Time Approach Addressing Scalability Anomalies in Complex Data Evaluating Anomaly Detection Methods Applications Problem solutionsPCA and Subspace Method Subspace Method Algorithm Subspace Analysis Results Discussion Typical Characteristics of Anomaly Limitation of Volume Entropy Based versus Volume Based Fraud Detection Epidemeology Anomaly Detection in Climate and Weather Anomalies in Climate Validation of Anomalies
Entropy Based versus Volume Based
DoSDDoS Attacks- a spike in traffic data toward adominant destination IP
Scan anomaly-a spike in traffic data from a dominant sourceIP
Flash Crowd anomaly- again a spike in traffic data to adominant destination IP
Worm anomaly-a Spike in traffic with a dominant port
Chawla and Chandola Anomaly Detection
Introduction Data Mining Methods Density-based anomaly Commute Time Approach Addressing Scalability Anomalies in Complex Data Evaluating Anomaly Detection Methods Applications Problem solutionsPCA and Subspace Method Subspace Method Algorithm Subspace Analysis Results Discussion Typical Characteristics of Anomaly Limitation of Volume Entropy Based versus Volume Based Fraud Detection Epidemeology Anomaly Detection in Climate and Weather Anomalies in Climate Validation of Anomalies
Fraud Detection
Domain Question Identifyfraudulent activities or players fromobserved transaction data
Data Transactions between different
players in the system Meta information about the
individuals An underlying graph structure
Challenges Track and model human behavior Anomalies caused by adaptive
human adversaries Massive data sizes
Insurance (autohealtha)
ClaimantProvider Payer
Telecommunications Customer
Provider
Credit Cards Customer
Supplier Bank
Web Advertising User Advertiser
Publisher
ahttpwwwcheatingculturecompast-cases-of-medicare-fraud
Chawla and Chandola Anomaly Detection
Introduction Data Mining Methods Density-based anomaly Commute Time Approach Addressing Scalability Anomalies in Complex Data Evaluating Anomaly Detection Methods Applications Problem solutionsPCA and Subspace Method Subspace Method Algorithm Subspace Analysis Results Discussion Typical Characteristics of Anomaly Limitation of Volume Entropy Based versus Volume Based Fraud Detection Epidemeology Anomaly Detection in Climate and Weather Anomalies in Climate Validation of Anomalies
A Generic Fraud Detection Method
Activity Monitoring [13]1 Build profiles for individuals (customers users etc) based on
historic data User X makes n calls on an average in January
2 Compare current behavior with historical profile for significantdeviations
Clustering based [4]1 Cluster historical profiles of customers2 Identify small clusters or outlying profiles as anomalies
Strengths Anomaly detection is fast (good for real time) Results are easy to explain
Weaknesses Need to create and maintain a large number of profiles Not dynamic Adequate historical data might not be available Too many false positives
Chawla and Chandola Anomaly Detection
Introduction Data Mining Methods Density-based anomaly Commute Time Approach Addressing Scalability Anomalies in Complex Data Evaluating Anomaly Detection Methods Applications Problem solutionsPCA and Subspace Method Subspace Method Algorithm Subspace Analysis Results Discussion Typical Characteristics of Anomaly Limitation of Volume Entropy Based versus Volume Based Fraud Detection Epidemeology Anomaly Detection in Climate and Weather Anomalies in Climate Validation of Anomalies
Exploiting Graph Structure - Weighted Graphs
Represent data as a weighted graph Communication networks (phone email SMS) Provider referral networks
Objective Identify anomalous nodes
For each node extract several features based on the propertiesof the induced sub-graph (egonet) of neighboring nodes [1]
Choose features that can highlight anomalous nodes
1 Ni degree of node2 Ei number of edges in egonet3 Wi total weight of egonet4 λi principal eigen vector of weighted adjacency matrix of
egonet
Data is transformed into a point in a multi-dimensional space
Chawla and Chandola Anomaly Detection
Introduction Data Mining Methods Density-based anomaly Commute Time Approach Addressing Scalability Anomalies in Complex Data Evaluating Anomaly Detection Methods Applications Problem solutionsPCA and Subspace Method Subspace Method Algorithm Subspace Analysis Results Discussion Typical Characteristics of Anomaly Limitation of Volume Entropy Based versus Volume Based Fraud Detection Epidemeology Anomaly Detection in Climate and Weather Anomalies in Climate Validation of Anomalies
Identifying Anomalies
Traditional anomaly detection (lof) Can be slow but can identify any type of anomalous structure
Faster method to identify specific types of anomalousstructures
Identify relevant feature pairs and power law relationship
Eg Egonet Density Power Law Ni vs Ei - detect nearcliques and stars
Ei prop Nαi 1 le α le 2
Anomaly score for node i wrt a pair of features (y = Cxθ)
Si =max(yi Cx
θi )
min(yi Cxθi )lowast log (|yi minus Cxθi |+ 1)
Chawla and Chandola Anomaly Detection
Introduction Data Mining Methods Density-based anomaly Commute Time Approach Addressing Scalability Anomalies in Complex Data Evaluating Anomaly Detection Methods Applications Problem solutionsPCA and Subspace Method Subspace Method Algorithm Subspace Analysis Results Discussion Typical Characteristics of Anomaly Limitation of Volume Entropy Based versus Volume Based Fraud Detection Epidemeology Anomaly Detection in Climate and Weather Anomalies in Climate Validation of Anomalies
Exploiting Graph Structure - Bipartite Graphs
Represent data as a bipartite graph Healthcare Data (Beneficiaries vs Providers) Insider trading (Traders vs Stocks)
Objective Identify anomalous links
Given a query node a isin V1 find the ldquorelevancerdquoof all other nodes in V1 to a
RelevanceScore(a b) prop Number of times aldquorandom walkrdquo from a reaches b
Use the relevance scores to compute thenormality scores for a node t isin V2
Find set St = a|〈a t〉 isin E Compute |St| times |St| similarity matrix using
relevance vectors for a isin St Normality Score = mean of non-diagonal entries
of similarity matrix
V1 E V2a1
a2
a3
an
t1
t2
t3
tn
Chawla and Chandola Anomaly Detection
Introduction Data Mining Methods Density-based anomaly Commute Time Approach Addressing Scalability Anomalies in Complex Data Evaluating Anomaly Detection Methods Applications Problem solutionsPCA and Subspace Method Subspace Method Algorithm Subspace Analysis Results Discussion Typical Characteristics of Anomaly Limitation of Volume Entropy Based versus Volume Based Fraud Detection Epidemeology Anomaly Detection in Climate and Weather Anomalies in Climate Validation of Anomalies
Detecting Disease Outbreaks
Domain Question Early detection of disease
outbreaks Anthrax attack
Data Emergency department visits Grocery data (Example [14]) Clinical visits Weatherclimate data
Challenges Weak signals in the data
ED cases involving cough rArrFlu or SARS
Integration of multiple signals(lag analysis)
Account for spatial and temporalcorrelations
Chawla and Chandola Anomaly Detection
Introduction Data Mining Methods Density-based anomaly Commute Time Approach Addressing Scalability Anomalies in Complex Data Evaluating Anomaly Detection Methods Applications Problem solutionsPCA and Subspace Method Subspace Method Algorithm Subspace Analysis Results Discussion Typical Characteristics of Anomaly Limitation of Volume Entropy Based versus Volume Based Fraud Detection Epidemeology Anomaly Detection in Climate and Weather Anomalies in Climate Validation of Anomalies
Whatrsquos Significant About Recent Events (WSARE) [33]
1 Learn Bayesian network from historical data Environmental and response variables
2 Sample from the BN (DBbaseline|Current Environment)3 Compute contingency table for rules for DBbaseline andDBcurrent
Rules are single assignment rules (Xi = Y ji ) or conjunctions4 Find p-value for rules using χ2-test
Null Hypothesis Rows and columns of tables for DBbaselineand DBcurrent are independent
5 Find rule with largest p-value Repeat Step 2
Chawla and Chandola Anomaly Detection
Introduction Data Mining Methods Density-based anomaly Commute Time Approach Addressing Scalability Anomalies in Complex Data Evaluating Anomaly Detection Methods Applications Problem solutionsPCA and Subspace Method Subspace Method Algorithm Subspace Analysis Results Discussion Typical Characteristics of Anomaly Limitation of Volume Entropy Based versus Volume Based Fraud Detection Epidemeology Anomaly Detection in Climate and Weather Anomalies in Climate Validation of Anomalies
Incorporating Spatial and Temporal Relationships
WSARE does not explicitly model the spatial and temporalrelationships
What happened yesterday What happened in the adjoining neighborhood (yesterday)
Bayesian Network Spatio-Temporal (BNST) modelingframework [17]
Add nodes for temporal and spatial dependencies Need more data to train
Chawla and Chandola Anomaly Detection
Introduction Data Mining Methods Density-based anomaly Commute Time Approach Addressing Scalability Anomalies in Complex Data Evaluating Anomaly Detection Methods Applications Problem solutionsPCA and Subspace Method Subspace Method Algorithm Subspace Analysis Results Discussion Typical Characteristics of Anomaly Limitation of Volume Entropy Based versus Volume Based Fraud Detection Epidemeology Anomaly Detection in Climate and Weather Anomalies in Climate Validation of Anomalies
Anomaly Detection in Climate and Weather
Science Questions Identify natural and anthropogenic disasters Identify long time scale events - droughts atmospheric rivers
cold fronts etc
Data Ground observations Remote sensing data (satellites
air-borne) Climate model simulation outputs Multiple variables spatio-temporal (often has height dimension
as well)
Challenges Model spatio-temporal relationships across multiple variables Explain the cause of anomalies Massive data sizes
Climate and weather extreme events are well defined
Key challenge is to find significant events and explain the cause
Chawla and Chandola Anomaly Detection
Introduction Data Mining Methods Density-based anomaly Commute Time Approach Addressing Scalability Anomalies in Complex Data Evaluating Anomaly Detection Methods Applications Problem solutionsPCA and Subspace Method Subspace Method Algorithm Subspace Analysis Results Discussion Typical Characteristics of Anomaly Limitation of Volume Entropy Based versus Volume Based Fraud Detection Epidemeology Anomaly Detection in Climate and Weather Anomalies in Climate Validation of Anomalies
Anomalies are Widely Used in Climate
Most analysis done on ldquoanomalyrdquo time series
Difference from a ldquobase periodrdquo (Toosimplistic)
Brings spatial smoothness (eg a mountaintop and nearby valley can have very differenttemperatures) Removes seasonality
Understand climate and weatherphenomenon
Southern Oscillation Index (SOI) Difference between Sea Level Pressure
(SLP) anomalies for Tahiti and DarwinAustralia
Figure Global AverageTemperature Anomaly(1975 - 2007) Srcwwwmetofficegovuk
Chawla and Chandola Anomaly Detection
Introduction Data Mining Methods Density-based anomaly Commute Time Approach Addressing Scalability Anomalies in Complex Data Evaluating Anomaly Detection Methods Applications Problem solutionsPCA and Subspace Method Subspace Method Algorithm Subspace Analysis Results Discussion Typical Characteristics of Anomaly Limitation of Volume Entropy Based versus Volume Based Fraud Detection Epidemeology Anomaly Detection in Climate and Weather Anomalies in Climate Validation of Anomalies
Constructing Anomalies from Raw Data
Anomaly time series for a given location i
vprimei = vi minus bi
where bi is the base (reference)
How to choose bi Mean of all data for location i Monthly mean values (account for seasonality) Monthly z-score values Median (more robust) Using a shorter ldquoreference periodrdquo
30 year moving window
Different methods show statistically significant differences[19] What is the right strategy Weighted mean of different strategies (Pick weights using
Monte Carlo sampling)
Chawla and Chandola Anomaly Detection
Introduction Data Mining Methods Density-based anomaly Commute Time Approach Addressing Scalability Anomalies in Complex Data Evaluating Anomaly Detection Methods Applications Problem solutionsPCA and Subspace Method Subspace Method Algorithm Subspace Analysis Results Discussion Typical Characteristics of Anomaly Limitation of Volume Entropy Based versus Volume Based Fraud Detection Epidemeology Anomaly Detection in Climate and Weather Anomalies in Climate Validation of Anomalies
Anomaly Detection for Identifying Droughts
Science question Identify significant drought patterns usinghistorical observation data or future simulation data or both
Find persistent spatiotemporal anomalies in precipitation data
A two step approach
1 Find precipitationanomalies usingthresholds
2 Find large connectedcomponents across spaceand time
Matlab - bwlabelbwlabeln
Followup Science questionExplain cause
(drought190120061avi)
Figure Video courtsey Dr ArindamBanerjee
Chawla and Chandola Anomaly Detection
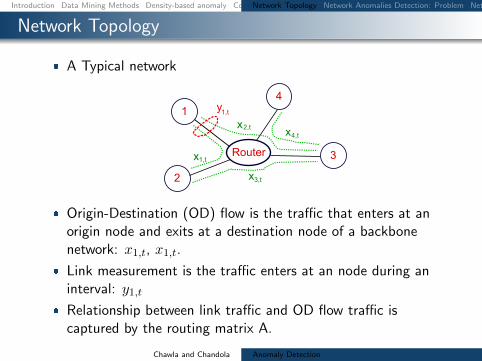
Introduction Data Mining Methods Density-based anomaly Commute Time Approach Addressing Scalability Anomalies in Complex Data Evaluating Anomaly Detection Methods Applications Problem solutionsNetwork Topology Network Anomalies Detection Problem Network Anomalies Detection Problem Why care about OD Flows
Network Topology
A Typical network
1 y
Router
2
3
41t
x2t
x1t
x3t
x4t
Origin-Destination (OD) flow is the traffic that enters at anorigin node and exits at a destination node of a backbonenetwork x1t x1t
Link measurement is the traffic enters at an node during aninterval y1t
Relationship between link traffic and OD flow traffic iscaptured by the routing matrix A
Chawla and Chandola Anomaly Detection
Introduction Data Mining Methods Density-based anomaly Commute Time Approach Addressing Scalability Anomalies in Complex Data Evaluating Anomaly Detection Methods Applications Problem solutionsNetwork Topology Network Anomalies Detection Problem Network Anomalies Detection Problem Why care about OD Flows
Network Anomalies Detection Problem
Chawla and Chandola Anomaly Detection
Introduction Data Mining Methods Density-based anomaly Commute Time Approach Addressing Scalability Anomalies in Complex Data Evaluating Anomaly Detection Methods Applications Problem solutionsNetwork Topology Network Anomalies Detection Problem Network Anomalies Detection Problem Why care about OD Flows
Network Anomalies Detection Problem
Chawla and Chandola Anomaly Detection
Introduction Data Mining Methods Density-based anomaly Commute Time Approach Addressing Scalability Anomalies in Complex Data Evaluating Anomaly Detection Methods Applications Problem solutionsNetwork Topology Network Anomalies Detection Problem Network Anomalies Detection Problem Why care about OD Flows
Why care about OD Flows
Volume anomaly typically arises on an OD flow (trafficarriving at one node and destined for another node)
If we only monitor traffic on network links volume arisingfrom an OD flow may not be noticeable Thus naiveapproach wont work if OD flow info is not available
Figure source [22]
Chawla and Chandola Anomaly Detection
Introduction Data Mining Methods Density-based anomaly Commute Time Approach Addressing Scalability Anomalies in Complex Data Evaluating Anomaly Detection Methods Applications Problem solutionsPCA and Subspace Method Subspace Method Algorithm Subspace Analysis Results Discussion Typical Characteristics of Anomaly Limitation of Volume Entropy Based versus Volume Based Fraud Detection Epidemeology Anomaly Detection in Climate and Weather Anomalies in Climate Validation of Anomalies
PCA and Subspace Method
Chawla and Chandola Anomaly Detection
Introduction Data Mining Methods Density-based anomaly Commute Time Approach Addressing Scalability Anomalies in Complex Data Evaluating Anomaly Detection Methods Applications Problem solutionsPCA and Subspace Method Subspace Method Algorithm Subspace Analysis Results Discussion Typical Characteristics of Anomaly Limitation of Volume Entropy Based versus Volume Based Fraud Detection Epidemeology Anomaly Detection in Climate and Weather Anomalies in Climate Validation of Anomalies
Subspace Method Algorithm
Step1- Determine the PCs based on eigenvaluedecomposition of the covariance matrix of the dataset
Step2- Choose first top k principle components with thehighest eigenvalues as matrix P
Step3-normal traffic subspace called Z
Z = PP TZ = CZ
Step4-abnormal traffic subspace called Z
Z = (I minus PP T )Z = CZ
Step5-If the norm of a vector is large then it is an rdquoanomalyrdquo
Chawla and Chandola Anomaly Detection
Introduction Data Mining Methods Density-based anomaly Commute Time Approach Addressing Scalability Anomalies in Complex Data Evaluating Anomaly Detection Methods Applications Problem solutionsPCA and Subspace Method Subspace Method Algorithm Subspace Analysis Results Discussion Typical Characteristics of Anomaly Limitation of Volume Entropy Based versus Volume Based Fraud Detection Epidemeology Anomaly Detection in Climate and Weather Anomalies in Climate Validation of Anomalies
Subspace Analysis Results
Note that during anomaly normal component does not changethat much while residual component changes quite a lot
Thus anomalies can be detected by setting some threshold
Figure source [22]
Chawla and Chandola Anomaly Detection
Introduction Data Mining Methods Density-based anomaly Commute Time Approach Addressing Scalability Anomalies in Complex Data Evaluating Anomaly Detection Methods Applications Problem solutionsPCA and Subspace Method Subspace Method Algorithm Subspace Analysis Results Discussion Typical Characteristics of Anomaly Limitation of Volume Entropy Based versus Volume Based Fraud Detection Epidemeology Anomaly Detection in Climate and Weather Anomalies in Climate Validation of Anomalies
Discussion Typical Characteristics of Anomaly
Most Anomalies induce a change in distributionalaspects of packet header fields (called features)
Most important features include 5-tuple Source ampdestination IP addresses Source and destination portnumbers and IP protocol
raquo DOS attack ndash multiple source IP address concentrated on asingle destination IP address
raquo Network scan ndash dispersed distribution of destination addresses
raquo Most wormsviruses also induce some change in distribution ofcertain features
raquo However these changes can be very subtle and mining them islike searching for needles in a haystack
Unlike many previous approach this paper aims todetect events which disturb the distribution of trafficfeatures rather than traffic volume
Chawla and Chandola Anomaly Detection
Introduction Data Mining Methods Density-based anomaly Commute Time Approach Addressing Scalability Anomalies in Complex Data Evaluating Anomaly Detection Methods Applications Problem solutionsPCA and Subspace Method Subspace Method Algorithm Subspace Analysis Results Discussion Typical Characteristics of Anomaly Limitation of Volume Entropy Based versus Volume Based Fraud Detection Epidemeology Anomaly Detection in Climate and Weather Anomalies in Climate Validation of Anomalies
Limitation of Volume
Figure source [22]
Port scan anomaly (traffic feature changes however traffic volume
remains more or less the same)
We can use entropy tocapture the variationsin the traffic feature
bullTakes value 0 when distribution is maximally concentratedbullTakes value log2N when distribution is maximally dispersed
But stands out in
feature entropy
which also reveals
its structure
Port scan
dwarfed
in volume
metricshellip
Chawla and Chandola Anomaly Detection
Introduction Data Mining Methods Density-based anomaly Commute Time Approach Addressing Scalability Anomalies in Complex Data Evaluating Anomaly Detection Methods Applications Problem solutionsPCA and Subspace Method Subspace Method Algorithm Subspace Analysis Results Discussion Typical Characteristics of Anomaly Limitation of Volume Entropy Based versus Volume Based Fraud Detection Epidemeology Anomaly Detection in Climate and Weather Anomalies in Climate Validation of Anomalies
Entropy Based versus Volume Based
DoSDDoS Attacks- a spike in traffic data toward adominant destination IP
Scan anomaly-a spike in traffic data from a dominant sourceIP
Flash Crowd anomaly- again a spike in traffic data to adominant destination IP
Worm anomaly-a Spike in traffic with a dominant port
Chawla and Chandola Anomaly Detection
Introduction Data Mining Methods Density-based anomaly Commute Time Approach Addressing Scalability Anomalies in Complex Data Evaluating Anomaly Detection Methods Applications Problem solutionsPCA and Subspace Method Subspace Method Algorithm Subspace Analysis Results Discussion Typical Characteristics of Anomaly Limitation of Volume Entropy Based versus Volume Based Fraud Detection Epidemeology Anomaly Detection in Climate and Weather Anomalies in Climate Validation of Anomalies
Fraud Detection
Domain Question Identifyfraudulent activities or players fromobserved transaction data
Data Transactions between different
players in the system Meta information about the
individuals An underlying graph structure
Challenges Track and model human behavior Anomalies caused by adaptive
human adversaries Massive data sizes
Insurance (autohealtha)
ClaimantProvider Payer
Telecommunications Customer
Provider
Credit Cards Customer
Supplier Bank
Web Advertising User Advertiser
Publisher
ahttpwwwcheatingculturecompast-cases-of-medicare-fraud
Chawla and Chandola Anomaly Detection
Introduction Data Mining Methods Density-based anomaly Commute Time Approach Addressing Scalability Anomalies in Complex Data Evaluating Anomaly Detection Methods Applications Problem solutionsPCA and Subspace Method Subspace Method Algorithm Subspace Analysis Results Discussion Typical Characteristics of Anomaly Limitation of Volume Entropy Based versus Volume Based Fraud Detection Epidemeology Anomaly Detection in Climate and Weather Anomalies in Climate Validation of Anomalies
A Generic Fraud Detection Method
Activity Monitoring [13]1 Build profiles for individuals (customers users etc) based on
historic data User X makes n calls on an average in January
2 Compare current behavior with historical profile for significantdeviations
Clustering based [4]1 Cluster historical profiles of customers2 Identify small clusters or outlying profiles as anomalies
Strengths Anomaly detection is fast (good for real time) Results are easy to explain
Weaknesses Need to create and maintain a large number of profiles Not dynamic Adequate historical data might not be available Too many false positives
Chawla and Chandola Anomaly Detection
Introduction Data Mining Methods Density-based anomaly Commute Time Approach Addressing Scalability Anomalies in Complex Data Evaluating Anomaly Detection Methods Applications Problem solutionsPCA and Subspace Method Subspace Method Algorithm Subspace Analysis Results Discussion Typical Characteristics of Anomaly Limitation of Volume Entropy Based versus Volume Based Fraud Detection Epidemeology Anomaly Detection in Climate and Weather Anomalies in Climate Validation of Anomalies
Exploiting Graph Structure - Weighted Graphs
Represent data as a weighted graph Communication networks (phone email SMS) Provider referral networks
Objective Identify anomalous nodes
For each node extract several features based on the propertiesof the induced sub-graph (egonet) of neighboring nodes [1]
Choose features that can highlight anomalous nodes
1 Ni degree of node2 Ei number of edges in egonet3 Wi total weight of egonet4 λi principal eigen vector of weighted adjacency matrix of
egonet
Data is transformed into a point in a multi-dimensional space
Chawla and Chandola Anomaly Detection
Introduction Data Mining Methods Density-based anomaly Commute Time Approach Addressing Scalability Anomalies in Complex Data Evaluating Anomaly Detection Methods Applications Problem solutionsPCA and Subspace Method Subspace Method Algorithm Subspace Analysis Results Discussion Typical Characteristics of Anomaly Limitation of Volume Entropy Based versus Volume Based Fraud Detection Epidemeology Anomaly Detection in Climate and Weather Anomalies in Climate Validation of Anomalies
Identifying Anomalies
Traditional anomaly detection (lof) Can be slow but can identify any type of anomalous structure
Faster method to identify specific types of anomalousstructures
Identify relevant feature pairs and power law relationship
Eg Egonet Density Power Law Ni vs Ei - detect nearcliques and stars
Ei prop Nαi 1 le α le 2
Anomaly score for node i wrt a pair of features (y = Cxθ)
Si =max(yi Cx
θi )
min(yi Cxθi )lowast log (|yi minus Cxθi |+ 1)
Chawla and Chandola Anomaly Detection
Introduction Data Mining Methods Density-based anomaly Commute Time Approach Addressing Scalability Anomalies in Complex Data Evaluating Anomaly Detection Methods Applications Problem solutionsPCA and Subspace Method Subspace Method Algorithm Subspace Analysis Results Discussion Typical Characteristics of Anomaly Limitation of Volume Entropy Based versus Volume Based Fraud Detection Epidemeology Anomaly Detection in Climate and Weather Anomalies in Climate Validation of Anomalies
Exploiting Graph Structure - Bipartite Graphs
Represent data as a bipartite graph Healthcare Data (Beneficiaries vs Providers) Insider trading (Traders vs Stocks)
Objective Identify anomalous links
Given a query node a isin V1 find the ldquorelevancerdquoof all other nodes in V1 to a
RelevanceScore(a b) prop Number of times aldquorandom walkrdquo from a reaches b
Use the relevance scores to compute thenormality scores for a node t isin V2
Find set St = a|〈a t〉 isin E Compute |St| times |St| similarity matrix using
relevance vectors for a isin St Normality Score = mean of non-diagonal entries
of similarity matrix
V1 E V2a1
a2
a3
an
t1
t2
t3
tn
Chawla and Chandola Anomaly Detection
Introduction Data Mining Methods Density-based anomaly Commute Time Approach Addressing Scalability Anomalies in Complex Data Evaluating Anomaly Detection Methods Applications Problem solutionsPCA and Subspace Method Subspace Method Algorithm Subspace Analysis Results Discussion Typical Characteristics of Anomaly Limitation of Volume Entropy Based versus Volume Based Fraud Detection Epidemeology Anomaly Detection in Climate and Weather Anomalies in Climate Validation of Anomalies
Detecting Disease Outbreaks
Domain Question Early detection of disease
outbreaks Anthrax attack
Data Emergency department visits Grocery data (Example [14]) Clinical visits Weatherclimate data
Challenges Weak signals in the data
ED cases involving cough rArrFlu or SARS
Integration of multiple signals(lag analysis)
Account for spatial and temporalcorrelations
Chawla and Chandola Anomaly Detection
Introduction Data Mining Methods Density-based anomaly Commute Time Approach Addressing Scalability Anomalies in Complex Data Evaluating Anomaly Detection Methods Applications Problem solutionsPCA and Subspace Method Subspace Method Algorithm Subspace Analysis Results Discussion Typical Characteristics of Anomaly Limitation of Volume Entropy Based versus Volume Based Fraud Detection Epidemeology Anomaly Detection in Climate and Weather Anomalies in Climate Validation of Anomalies
Whatrsquos Significant About Recent Events (WSARE) [33]
1 Learn Bayesian network from historical data Environmental and response variables
2 Sample from the BN (DBbaseline|Current Environment)3 Compute contingency table for rules for DBbaseline andDBcurrent
Rules are single assignment rules (Xi = Y ji ) or conjunctions4 Find p-value for rules using χ2-test
Null Hypothesis Rows and columns of tables for DBbaselineand DBcurrent are independent
5 Find rule with largest p-value Repeat Step 2
Chawla and Chandola Anomaly Detection
Introduction Data Mining Methods Density-based anomaly Commute Time Approach Addressing Scalability Anomalies in Complex Data Evaluating Anomaly Detection Methods Applications Problem solutionsPCA and Subspace Method Subspace Method Algorithm Subspace Analysis Results Discussion Typical Characteristics of Anomaly Limitation of Volume Entropy Based versus Volume Based Fraud Detection Epidemeology Anomaly Detection in Climate and Weather Anomalies in Climate Validation of Anomalies
Incorporating Spatial and Temporal Relationships
WSARE does not explicitly model the spatial and temporalrelationships
What happened yesterday What happened in the adjoining neighborhood (yesterday)
Bayesian Network Spatio-Temporal (BNST) modelingframework [17]
Add nodes for temporal and spatial dependencies Need more data to train
Chawla and Chandola Anomaly Detection
Introduction Data Mining Methods Density-based anomaly Commute Time Approach Addressing Scalability Anomalies in Complex Data Evaluating Anomaly Detection Methods Applications Problem solutionsPCA and Subspace Method Subspace Method Algorithm Subspace Analysis Results Discussion Typical Characteristics of Anomaly Limitation of Volume Entropy Based versus Volume Based Fraud Detection Epidemeology Anomaly Detection in Climate and Weather Anomalies in Climate Validation of Anomalies
Anomaly Detection in Climate and Weather
Science Questions Identify natural and anthropogenic disasters Identify long time scale events - droughts atmospheric rivers
cold fronts etc
Data Ground observations Remote sensing data (satellites
air-borne) Climate model simulation outputs Multiple variables spatio-temporal (often has height dimension
as well)
Challenges Model spatio-temporal relationships across multiple variables Explain the cause of anomalies Massive data sizes
Climate and weather extreme events are well defined
Key challenge is to find significant events and explain the cause
Chawla and Chandola Anomaly Detection
Introduction Data Mining Methods Density-based anomaly Commute Time Approach Addressing Scalability Anomalies in Complex Data Evaluating Anomaly Detection Methods Applications Problem solutionsPCA and Subspace Method Subspace Method Algorithm Subspace Analysis Results Discussion Typical Characteristics of Anomaly Limitation of Volume Entropy Based versus Volume Based Fraud Detection Epidemeology Anomaly Detection in Climate and Weather Anomalies in Climate Validation of Anomalies
Anomalies are Widely Used in Climate
Most analysis done on ldquoanomalyrdquo time series
Difference from a ldquobase periodrdquo (Toosimplistic)
Brings spatial smoothness (eg a mountaintop and nearby valley can have very differenttemperatures) Removes seasonality
Understand climate and weatherphenomenon
Southern Oscillation Index (SOI) Difference between Sea Level Pressure
(SLP) anomalies for Tahiti and DarwinAustralia
Figure Global AverageTemperature Anomaly(1975 - 2007) Srcwwwmetofficegovuk
Chawla and Chandola Anomaly Detection
Introduction Data Mining Methods Density-based anomaly Commute Time Approach Addressing Scalability Anomalies in Complex Data Evaluating Anomaly Detection Methods Applications Problem solutionsPCA and Subspace Method Subspace Method Algorithm Subspace Analysis Results Discussion Typical Characteristics of Anomaly Limitation of Volume Entropy Based versus Volume Based Fraud Detection Epidemeology Anomaly Detection in Climate and Weather Anomalies in Climate Validation of Anomalies
Constructing Anomalies from Raw Data
Anomaly time series for a given location i
vprimei = vi minus bi
where bi is the base (reference)
How to choose bi Mean of all data for location i Monthly mean values (account for seasonality) Monthly z-score values Median (more robust) Using a shorter ldquoreference periodrdquo
30 year moving window
Different methods show statistically significant differences[19] What is the right strategy Weighted mean of different strategies (Pick weights using
Monte Carlo sampling)
Chawla and Chandola Anomaly Detection
Introduction Data Mining Methods Density-based anomaly Commute Time Approach Addressing Scalability Anomalies in Complex Data Evaluating Anomaly Detection Methods Applications Problem solutionsPCA and Subspace Method Subspace Method Algorithm Subspace Analysis Results Discussion Typical Characteristics of Anomaly Limitation of Volume Entropy Based versus Volume Based Fraud Detection Epidemeology Anomaly Detection in Climate and Weather Anomalies in Climate Validation of Anomalies
Anomaly Detection for Identifying Droughts
Science question Identify significant drought patterns usinghistorical observation data or future simulation data or both
Find persistent spatiotemporal anomalies in precipitation data
A two step approach
1 Find precipitationanomalies usingthresholds
2 Find large connectedcomponents across spaceand time
Matlab - bwlabelbwlabeln
Followup Science questionExplain cause
(drought190120061avi)
Figure Video courtsey Dr ArindamBanerjee
Chawla and Chandola Anomaly Detection
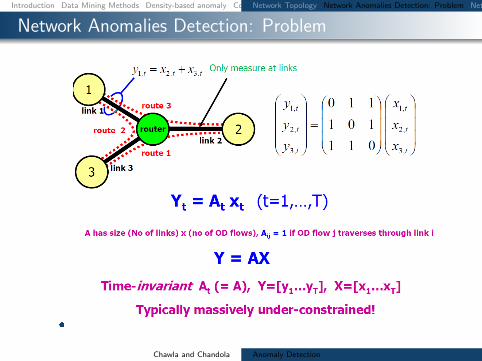
Introduction Data Mining Methods Density-based anomaly Commute Time Approach Addressing Scalability Anomalies in Complex Data Evaluating Anomaly Detection Methods Applications Problem solutionsNetwork Topology Network Anomalies Detection Problem Network Anomalies Detection Problem Why care about OD Flows
Network Anomalies Detection Problem
Chawla and Chandola Anomaly Detection
Introduction Data Mining Methods Density-based anomaly Commute Time Approach Addressing Scalability Anomalies in Complex Data Evaluating Anomaly Detection Methods Applications Problem solutionsNetwork Topology Network Anomalies Detection Problem Network Anomalies Detection Problem Why care about OD Flows
Why care about OD Flows
Volume anomaly typically arises on an OD flow (trafficarriving at one node and destined for another node)
If we only monitor traffic on network links volume arisingfrom an OD flow may not be noticeable Thus naiveapproach wont work if OD flow info is not available
Figure source [22]
Chawla and Chandola Anomaly Detection
Introduction Data Mining Methods Density-based anomaly Commute Time Approach Addressing Scalability Anomalies in Complex Data Evaluating Anomaly Detection Methods Applications Problem solutionsPCA and Subspace Method Subspace Method Algorithm Subspace Analysis Results Discussion Typical Characteristics of Anomaly Limitation of Volume Entropy Based versus Volume Based Fraud Detection Epidemeology Anomaly Detection in Climate and Weather Anomalies in Climate Validation of Anomalies
PCA and Subspace Method
Chawla and Chandola Anomaly Detection
Introduction Data Mining Methods Density-based anomaly Commute Time Approach Addressing Scalability Anomalies in Complex Data Evaluating Anomaly Detection Methods Applications Problem solutionsPCA and Subspace Method Subspace Method Algorithm Subspace Analysis Results Discussion Typical Characteristics of Anomaly Limitation of Volume Entropy Based versus Volume Based Fraud Detection Epidemeology Anomaly Detection in Climate and Weather Anomalies in Climate Validation of Anomalies
Subspace Method Algorithm
Step1- Determine the PCs based on eigenvaluedecomposition of the covariance matrix of the dataset
Step2- Choose first top k principle components with thehighest eigenvalues as matrix P
Step3-normal traffic subspace called Z
Z = PP TZ = CZ
Step4-abnormal traffic subspace called Z
Z = (I minus PP T )Z = CZ
Step5-If the norm of a vector is large then it is an rdquoanomalyrdquo
Chawla and Chandola Anomaly Detection
Introduction Data Mining Methods Density-based anomaly Commute Time Approach Addressing Scalability Anomalies in Complex Data Evaluating Anomaly Detection Methods Applications Problem solutionsPCA and Subspace Method Subspace Method Algorithm Subspace Analysis Results Discussion Typical Characteristics of Anomaly Limitation of Volume Entropy Based versus Volume Based Fraud Detection Epidemeology Anomaly Detection in Climate and Weather Anomalies in Climate Validation of Anomalies
Subspace Analysis Results
Note that during anomaly normal component does not changethat much while residual component changes quite a lot
Thus anomalies can be detected by setting some threshold
Figure source [22]
Chawla and Chandola Anomaly Detection
Introduction Data Mining Methods Density-based anomaly Commute Time Approach Addressing Scalability Anomalies in Complex Data Evaluating Anomaly Detection Methods Applications Problem solutionsPCA and Subspace Method Subspace Method Algorithm Subspace Analysis Results Discussion Typical Characteristics of Anomaly Limitation of Volume Entropy Based versus Volume Based Fraud Detection Epidemeology Anomaly Detection in Climate and Weather Anomalies in Climate Validation of Anomalies
Discussion Typical Characteristics of Anomaly
Most Anomalies induce a change in distributionalaspects of packet header fields (called features)
Most important features include 5-tuple Source ampdestination IP addresses Source and destination portnumbers and IP protocol
raquo DOS attack ndash multiple source IP address concentrated on asingle destination IP address
raquo Network scan ndash dispersed distribution of destination addresses
raquo Most wormsviruses also induce some change in distribution ofcertain features
raquo However these changes can be very subtle and mining them islike searching for needles in a haystack
Unlike many previous approach this paper aims todetect events which disturb the distribution of trafficfeatures rather than traffic volume
Chawla and Chandola Anomaly Detection
Introduction Data Mining Methods Density-based anomaly Commute Time Approach Addressing Scalability Anomalies in Complex Data Evaluating Anomaly Detection Methods Applications Problem solutionsPCA and Subspace Method Subspace Method Algorithm Subspace Analysis Results Discussion Typical Characteristics of Anomaly Limitation of Volume Entropy Based versus Volume Based Fraud Detection Epidemeology Anomaly Detection in Climate and Weather Anomalies in Climate Validation of Anomalies
Limitation of Volume
Figure source [22]
Port scan anomaly (traffic feature changes however traffic volume
remains more or less the same)
We can use entropy tocapture the variationsin the traffic feature
bullTakes value 0 when distribution is maximally concentratedbullTakes value log2N when distribution is maximally dispersed
But stands out in
feature entropy
which also reveals
its structure
Port scan
dwarfed
in volume
metricshellip
Chawla and Chandola Anomaly Detection
Introduction Data Mining Methods Density-based anomaly Commute Time Approach Addressing Scalability Anomalies in Complex Data Evaluating Anomaly Detection Methods Applications Problem solutionsPCA and Subspace Method Subspace Method Algorithm Subspace Analysis Results Discussion Typical Characteristics of Anomaly Limitation of Volume Entropy Based versus Volume Based Fraud Detection Epidemeology Anomaly Detection in Climate and Weather Anomalies in Climate Validation of Anomalies
Entropy Based versus Volume Based
DoSDDoS Attacks- a spike in traffic data toward adominant destination IP
Scan anomaly-a spike in traffic data from a dominant sourceIP
Flash Crowd anomaly- again a spike in traffic data to adominant destination IP
Worm anomaly-a Spike in traffic with a dominant port
Chawla and Chandola Anomaly Detection
Introduction Data Mining Methods Density-based anomaly Commute Time Approach Addressing Scalability Anomalies in Complex Data Evaluating Anomaly Detection Methods Applications Problem solutionsPCA and Subspace Method Subspace Method Algorithm Subspace Analysis Results Discussion Typical Characteristics of Anomaly Limitation of Volume Entropy Based versus Volume Based Fraud Detection Epidemeology Anomaly Detection in Climate and Weather Anomalies in Climate Validation of Anomalies
Fraud Detection
Domain Question Identifyfraudulent activities or players fromobserved transaction data
Data Transactions between different
players in the system Meta information about the
individuals An underlying graph structure
Challenges Track and model human behavior Anomalies caused by adaptive
human adversaries Massive data sizes
Insurance (autohealtha)
ClaimantProvider Payer
Telecommunications Customer
Provider
Credit Cards Customer
Supplier Bank
Web Advertising User Advertiser
Publisher
ahttpwwwcheatingculturecompast-cases-of-medicare-fraud
Chawla and Chandola Anomaly Detection
Introduction Data Mining Methods Density-based anomaly Commute Time Approach Addressing Scalability Anomalies in Complex Data Evaluating Anomaly Detection Methods Applications Problem solutionsPCA and Subspace Method Subspace Method Algorithm Subspace Analysis Results Discussion Typical Characteristics of Anomaly Limitation of Volume Entropy Based versus Volume Based Fraud Detection Epidemeology Anomaly Detection in Climate and Weather Anomalies in Climate Validation of Anomalies
A Generic Fraud Detection Method
Activity Monitoring [13]1 Build profiles for individuals (customers users etc) based on
historic data User X makes n calls on an average in January
2 Compare current behavior with historical profile for significantdeviations
Clustering based [4]1 Cluster historical profiles of customers2 Identify small clusters or outlying profiles as anomalies
Strengths Anomaly detection is fast (good for real time) Results are easy to explain
Weaknesses Need to create and maintain a large number of profiles Not dynamic Adequate historical data might not be available Too many false positives
Chawla and Chandola Anomaly Detection
Introduction Data Mining Methods Density-based anomaly Commute Time Approach Addressing Scalability Anomalies in Complex Data Evaluating Anomaly Detection Methods Applications Problem solutionsPCA and Subspace Method Subspace Method Algorithm Subspace Analysis Results Discussion Typical Characteristics of Anomaly Limitation of Volume Entropy Based versus Volume Based Fraud Detection Epidemeology Anomaly Detection in Climate and Weather Anomalies in Climate Validation of Anomalies
Exploiting Graph Structure - Weighted Graphs
Represent data as a weighted graph Communication networks (phone email SMS) Provider referral networks
Objective Identify anomalous nodes
For each node extract several features based on the propertiesof the induced sub-graph (egonet) of neighboring nodes [1]
Choose features that can highlight anomalous nodes
1 Ni degree of node2 Ei number of edges in egonet3 Wi total weight of egonet4 λi principal eigen vector of weighted adjacency matrix of
egonet
Data is transformed into a point in a multi-dimensional space
Chawla and Chandola Anomaly Detection
Introduction Data Mining Methods Density-based anomaly Commute Time Approach Addressing Scalability Anomalies in Complex Data Evaluating Anomaly Detection Methods Applications Problem solutionsPCA and Subspace Method Subspace Method Algorithm Subspace Analysis Results Discussion Typical Characteristics of Anomaly Limitation of Volume Entropy Based versus Volume Based Fraud Detection Epidemeology Anomaly Detection in Climate and Weather Anomalies in Climate Validation of Anomalies
Identifying Anomalies
Traditional anomaly detection (lof) Can be slow but can identify any type of anomalous structure
Faster method to identify specific types of anomalousstructures
Identify relevant feature pairs and power law relationship
Eg Egonet Density Power Law Ni vs Ei - detect nearcliques and stars
Ei prop Nαi 1 le α le 2
Anomaly score for node i wrt a pair of features (y = Cxθ)
Si =max(yi Cx
θi )
min(yi Cxθi )lowast log (|yi minus Cxθi |+ 1)
Chawla and Chandola Anomaly Detection
Introduction Data Mining Methods Density-based anomaly Commute Time Approach Addressing Scalability Anomalies in Complex Data Evaluating Anomaly Detection Methods Applications Problem solutionsPCA and Subspace Method Subspace Method Algorithm Subspace Analysis Results Discussion Typical Characteristics of Anomaly Limitation of Volume Entropy Based versus Volume Based Fraud Detection Epidemeology Anomaly Detection in Climate and Weather Anomalies in Climate Validation of Anomalies
Exploiting Graph Structure - Bipartite Graphs
Represent data as a bipartite graph Healthcare Data (Beneficiaries vs Providers) Insider trading (Traders vs Stocks)
Objective Identify anomalous links
Given a query node a isin V1 find the ldquorelevancerdquoof all other nodes in V1 to a
RelevanceScore(a b) prop Number of times aldquorandom walkrdquo from a reaches b
Use the relevance scores to compute thenormality scores for a node t isin V2
Find set St = a|〈a t〉 isin E Compute |St| times |St| similarity matrix using
relevance vectors for a isin St Normality Score = mean of non-diagonal entries
of similarity matrix
V1 E V2a1
a2
a3
an
t1
t2
t3
tn
Chawla and Chandola Anomaly Detection
Introduction Data Mining Methods Density-based anomaly Commute Time Approach Addressing Scalability Anomalies in Complex Data Evaluating Anomaly Detection Methods Applications Problem solutionsPCA and Subspace Method Subspace Method Algorithm Subspace Analysis Results Discussion Typical Characteristics of Anomaly Limitation of Volume Entropy Based versus Volume Based Fraud Detection Epidemeology Anomaly Detection in Climate and Weather Anomalies in Climate Validation of Anomalies
Detecting Disease Outbreaks
Domain Question Early detection of disease
outbreaks Anthrax attack
Data Emergency department visits Grocery data (Example [14]) Clinical visits Weatherclimate data
Challenges Weak signals in the data
ED cases involving cough rArrFlu or SARS
Integration of multiple signals(lag analysis)
Account for spatial and temporalcorrelations
Chawla and Chandola Anomaly Detection
Introduction Data Mining Methods Density-based anomaly Commute Time Approach Addressing Scalability Anomalies in Complex Data Evaluating Anomaly Detection Methods Applications Problem solutionsPCA and Subspace Method Subspace Method Algorithm Subspace Analysis Results Discussion Typical Characteristics of Anomaly Limitation of Volume Entropy Based versus Volume Based Fraud Detection Epidemeology Anomaly Detection in Climate and Weather Anomalies in Climate Validation of Anomalies
Whatrsquos Significant About Recent Events (WSARE) [33]
1 Learn Bayesian network from historical data Environmental and response variables
2 Sample from the BN (DBbaseline|Current Environment)3 Compute contingency table for rules for DBbaseline andDBcurrent
Rules are single assignment rules (Xi = Y ji ) or conjunctions4 Find p-value for rules using χ2-test
Null Hypothesis Rows and columns of tables for DBbaselineand DBcurrent are independent
5 Find rule with largest p-value Repeat Step 2
Chawla and Chandola Anomaly Detection
Introduction Data Mining Methods Density-based anomaly Commute Time Approach Addressing Scalability Anomalies in Complex Data Evaluating Anomaly Detection Methods Applications Problem solutionsPCA and Subspace Method Subspace Method Algorithm Subspace Analysis Results Discussion Typical Characteristics of Anomaly Limitation of Volume Entropy Based versus Volume Based Fraud Detection Epidemeology Anomaly Detection in Climate and Weather Anomalies in Climate Validation of Anomalies
Incorporating Spatial and Temporal Relationships
WSARE does not explicitly model the spatial and temporalrelationships
What happened yesterday What happened in the adjoining neighborhood (yesterday)
Bayesian Network Spatio-Temporal (BNST) modelingframework [17]
Add nodes for temporal and spatial dependencies Need more data to train
Chawla and Chandola Anomaly Detection
Introduction Data Mining Methods Density-based anomaly Commute Time Approach Addressing Scalability Anomalies in Complex Data Evaluating Anomaly Detection Methods Applications Problem solutionsPCA and Subspace Method Subspace Method Algorithm Subspace Analysis Results Discussion Typical Characteristics of Anomaly Limitation of Volume Entropy Based versus Volume Based Fraud Detection Epidemeology Anomaly Detection in Climate and Weather Anomalies in Climate Validation of Anomalies
Anomaly Detection in Climate and Weather
Science Questions Identify natural and anthropogenic disasters Identify long time scale events - droughts atmospheric rivers
cold fronts etc
Data Ground observations Remote sensing data (satellites
air-borne) Climate model simulation outputs Multiple variables spatio-temporal (often has height dimension
as well)
Challenges Model spatio-temporal relationships across multiple variables Explain the cause of anomalies Massive data sizes
Climate and weather extreme events are well defined
Key challenge is to find significant events and explain the cause
Chawla and Chandola Anomaly Detection
Introduction Data Mining Methods Density-based anomaly Commute Time Approach Addressing Scalability Anomalies in Complex Data Evaluating Anomaly Detection Methods Applications Problem solutionsPCA and Subspace Method Subspace Method Algorithm Subspace Analysis Results Discussion Typical Characteristics of Anomaly Limitation of Volume Entropy Based versus Volume Based Fraud Detection Epidemeology Anomaly Detection in Climate and Weather Anomalies in Climate Validation of Anomalies
Anomalies are Widely Used in Climate
Most analysis done on ldquoanomalyrdquo time series
Difference from a ldquobase periodrdquo (Toosimplistic)
Brings spatial smoothness (eg a mountaintop and nearby valley can have very differenttemperatures) Removes seasonality
Understand climate and weatherphenomenon
Southern Oscillation Index (SOI) Difference between Sea Level Pressure
(SLP) anomalies for Tahiti and DarwinAustralia
Figure Global AverageTemperature Anomaly(1975 - 2007) Srcwwwmetofficegovuk
Chawla and Chandola Anomaly Detection
Introduction Data Mining Methods Density-based anomaly Commute Time Approach Addressing Scalability Anomalies in Complex Data Evaluating Anomaly Detection Methods Applications Problem solutionsPCA and Subspace Method Subspace Method Algorithm Subspace Analysis Results Discussion Typical Characteristics of Anomaly Limitation of Volume Entropy Based versus Volume Based Fraud Detection Epidemeology Anomaly Detection in Climate and Weather Anomalies in Climate Validation of Anomalies
Constructing Anomalies from Raw Data
Anomaly time series for a given location i
vprimei = vi minus bi
where bi is the base (reference)
How to choose bi Mean of all data for location i Monthly mean values (account for seasonality) Monthly z-score values Median (more robust) Using a shorter ldquoreference periodrdquo
30 year moving window
Different methods show statistically significant differences[19] What is the right strategy Weighted mean of different strategies (Pick weights using
Monte Carlo sampling)
Chawla and Chandola Anomaly Detection
Introduction Data Mining Methods Density-based anomaly Commute Time Approach Addressing Scalability Anomalies in Complex Data Evaluating Anomaly Detection Methods Applications Problem solutionsPCA and Subspace Method Subspace Method Algorithm Subspace Analysis Results Discussion Typical Characteristics of Anomaly Limitation of Volume Entropy Based versus Volume Based Fraud Detection Epidemeology Anomaly Detection in Climate and Weather Anomalies in Climate Validation of Anomalies
Anomaly Detection for Identifying Droughts
Science question Identify significant drought patterns usinghistorical observation data or future simulation data or both
Find persistent spatiotemporal anomalies in precipitation data
A two step approach
1 Find precipitationanomalies usingthresholds
2 Find large connectedcomponents across spaceand time
Matlab - bwlabelbwlabeln
Followup Science questionExplain cause
(drought190120061avi)
Figure Video courtsey Dr ArindamBanerjee
Chawla and Chandola Anomaly Detection
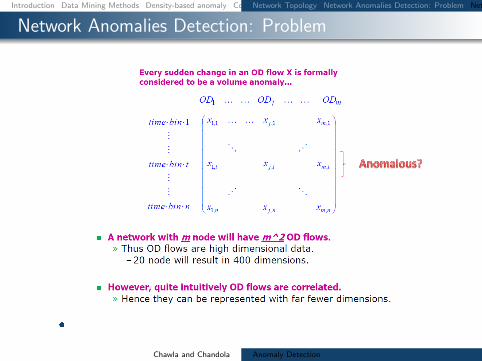
Introduction Data Mining Methods Density-based anomaly Commute Time Approach Addressing Scalability Anomalies in Complex Data Evaluating Anomaly Detection Methods Applications Problem solutionsNetwork Topology Network Anomalies Detection Problem Network Anomalies Detection Problem Why care about OD Flows
Network Anomalies Detection Problem
Chawla and Chandola Anomaly Detection
Introduction Data Mining Methods Density-based anomaly Commute Time Approach Addressing Scalability Anomalies in Complex Data Evaluating Anomaly Detection Methods Applications Problem solutionsNetwork Topology Network Anomalies Detection Problem Network Anomalies Detection Problem Why care about OD Flows
Why care about OD Flows
Volume anomaly typically arises on an OD flow (trafficarriving at one node and destined for another node)
If we only monitor traffic on network links volume arisingfrom an OD flow may not be noticeable Thus naiveapproach wont work if OD flow info is not available
Figure source [22]
Chawla and Chandola Anomaly Detection
Introduction Data Mining Methods Density-based anomaly Commute Time Approach Addressing Scalability Anomalies in Complex Data Evaluating Anomaly Detection Methods Applications Problem solutionsPCA and Subspace Method Subspace Method Algorithm Subspace Analysis Results Discussion Typical Characteristics of Anomaly Limitation of Volume Entropy Based versus Volume Based Fraud Detection Epidemeology Anomaly Detection in Climate and Weather Anomalies in Climate Validation of Anomalies
PCA and Subspace Method
Chawla and Chandola Anomaly Detection
Introduction Data Mining Methods Density-based anomaly Commute Time Approach Addressing Scalability Anomalies in Complex Data Evaluating Anomaly Detection Methods Applications Problem solutionsPCA and Subspace Method Subspace Method Algorithm Subspace Analysis Results Discussion Typical Characteristics of Anomaly Limitation of Volume Entropy Based versus Volume Based Fraud Detection Epidemeology Anomaly Detection in Climate and Weather Anomalies in Climate Validation of Anomalies
Subspace Method Algorithm
Step1- Determine the PCs based on eigenvaluedecomposition of the covariance matrix of the dataset
Step2- Choose first top k principle components with thehighest eigenvalues as matrix P
Step3-normal traffic subspace called Z
Z = PP TZ = CZ
Step4-abnormal traffic subspace called Z
Z = (I minus PP T )Z = CZ
Step5-If the norm of a vector is large then it is an rdquoanomalyrdquo
Chawla and Chandola Anomaly Detection
Introduction Data Mining Methods Density-based anomaly Commute Time Approach Addressing Scalability Anomalies in Complex Data Evaluating Anomaly Detection Methods Applications Problem solutionsPCA and Subspace Method Subspace Method Algorithm Subspace Analysis Results Discussion Typical Characteristics of Anomaly Limitation of Volume Entropy Based versus Volume Based Fraud Detection Epidemeology Anomaly Detection in Climate and Weather Anomalies in Climate Validation of Anomalies
Subspace Analysis Results
Note that during anomaly normal component does not changethat much while residual component changes quite a lot
Thus anomalies can be detected by setting some threshold
Figure source [22]
Chawla and Chandola Anomaly Detection
Introduction Data Mining Methods Density-based anomaly Commute Time Approach Addressing Scalability Anomalies in Complex Data Evaluating Anomaly Detection Methods Applications Problem solutionsPCA and Subspace Method Subspace Method Algorithm Subspace Analysis Results Discussion Typical Characteristics of Anomaly Limitation of Volume Entropy Based versus Volume Based Fraud Detection Epidemeology Anomaly Detection in Climate and Weather Anomalies in Climate Validation of Anomalies
Discussion Typical Characteristics of Anomaly
Most Anomalies induce a change in distributionalaspects of packet header fields (called features)
Most important features include 5-tuple Source ampdestination IP addresses Source and destination portnumbers and IP protocol
raquo DOS attack ndash multiple source IP address concentrated on asingle destination IP address
raquo Network scan ndash dispersed distribution of destination addresses
raquo Most wormsviruses also induce some change in distribution ofcertain features
raquo However these changes can be very subtle and mining them islike searching for needles in a haystack
Unlike many previous approach this paper aims todetect events which disturb the distribution of trafficfeatures rather than traffic volume
Chawla and Chandola Anomaly Detection
Introduction Data Mining Methods Density-based anomaly Commute Time Approach Addressing Scalability Anomalies in Complex Data Evaluating Anomaly Detection Methods Applications Problem solutionsPCA and Subspace Method Subspace Method Algorithm Subspace Analysis Results Discussion Typical Characteristics of Anomaly Limitation of Volume Entropy Based versus Volume Based Fraud Detection Epidemeology Anomaly Detection in Climate and Weather Anomalies in Climate Validation of Anomalies
Limitation of Volume
Figure source [22]
Port scan anomaly (traffic feature changes however traffic volume
remains more or less the same)
We can use entropy tocapture the variationsin the traffic feature
bullTakes value 0 when distribution is maximally concentratedbullTakes value log2N when distribution is maximally dispersed
But stands out in
feature entropy
which also reveals
its structure
Port scan
dwarfed
in volume
metricshellip
Chawla and Chandola Anomaly Detection
Introduction Data Mining Methods Density-based anomaly Commute Time Approach Addressing Scalability Anomalies in Complex Data Evaluating Anomaly Detection Methods Applications Problem solutionsPCA and Subspace Method Subspace Method Algorithm Subspace Analysis Results Discussion Typical Characteristics of Anomaly Limitation of Volume Entropy Based versus Volume Based Fraud Detection Epidemeology Anomaly Detection in Climate and Weather Anomalies in Climate Validation of Anomalies
Entropy Based versus Volume Based
DoSDDoS Attacks- a spike in traffic data toward adominant destination IP
Scan anomaly-a spike in traffic data from a dominant sourceIP
Flash Crowd anomaly- again a spike in traffic data to adominant destination IP
Worm anomaly-a Spike in traffic with a dominant port
Chawla and Chandola Anomaly Detection
Introduction Data Mining Methods Density-based anomaly Commute Time Approach Addressing Scalability Anomalies in Complex Data Evaluating Anomaly Detection Methods Applications Problem solutionsPCA and Subspace Method Subspace Method Algorithm Subspace Analysis Results Discussion Typical Characteristics of Anomaly Limitation of Volume Entropy Based versus Volume Based Fraud Detection Epidemeology Anomaly Detection in Climate and Weather Anomalies in Climate Validation of Anomalies
Fraud Detection
Domain Question Identifyfraudulent activities or players fromobserved transaction data
Data Transactions between different
players in the system Meta information about the
individuals An underlying graph structure
Challenges Track and model human behavior Anomalies caused by adaptive
human adversaries Massive data sizes
Insurance (autohealtha)
ClaimantProvider Payer
Telecommunications Customer
Provider
Credit Cards Customer
Supplier Bank
Web Advertising User Advertiser
Publisher
ahttpwwwcheatingculturecompast-cases-of-medicare-fraud
Chawla and Chandola Anomaly Detection
Introduction Data Mining Methods Density-based anomaly Commute Time Approach Addressing Scalability Anomalies in Complex Data Evaluating Anomaly Detection Methods Applications Problem solutionsPCA and Subspace Method Subspace Method Algorithm Subspace Analysis Results Discussion Typical Characteristics of Anomaly Limitation of Volume Entropy Based versus Volume Based Fraud Detection Epidemeology Anomaly Detection in Climate and Weather Anomalies in Climate Validation of Anomalies
A Generic Fraud Detection Method
Activity Monitoring [13]1 Build profiles for individuals (customers users etc) based on
historic data User X makes n calls on an average in January
2 Compare current behavior with historical profile for significantdeviations
Clustering based [4]1 Cluster historical profiles of customers2 Identify small clusters or outlying profiles as anomalies
Strengths Anomaly detection is fast (good for real time) Results are easy to explain
Weaknesses Need to create and maintain a large number of profiles Not dynamic Adequate historical data might not be available Too many false positives
Chawla and Chandola Anomaly Detection
Introduction Data Mining Methods Density-based anomaly Commute Time Approach Addressing Scalability Anomalies in Complex Data Evaluating Anomaly Detection Methods Applications Problem solutionsPCA and Subspace Method Subspace Method Algorithm Subspace Analysis Results Discussion Typical Characteristics of Anomaly Limitation of Volume Entropy Based versus Volume Based Fraud Detection Epidemeology Anomaly Detection in Climate and Weather Anomalies in Climate Validation of Anomalies
Exploiting Graph Structure - Weighted Graphs
Represent data as a weighted graph Communication networks (phone email SMS) Provider referral networks
Objective Identify anomalous nodes
For each node extract several features based on the propertiesof the induced sub-graph (egonet) of neighboring nodes [1]
Choose features that can highlight anomalous nodes
1 Ni degree of node2 Ei number of edges in egonet3 Wi total weight of egonet4 λi principal eigen vector of weighted adjacency matrix of
egonet
Data is transformed into a point in a multi-dimensional space
Chawla and Chandola Anomaly Detection
Introduction Data Mining Methods Density-based anomaly Commute Time Approach Addressing Scalability Anomalies in Complex Data Evaluating Anomaly Detection Methods Applications Problem solutionsPCA and Subspace Method Subspace Method Algorithm Subspace Analysis Results Discussion Typical Characteristics of Anomaly Limitation of Volume Entropy Based versus Volume Based Fraud Detection Epidemeology Anomaly Detection in Climate and Weather Anomalies in Climate Validation of Anomalies
Identifying Anomalies
Traditional anomaly detection (lof) Can be slow but can identify any type of anomalous structure
Faster method to identify specific types of anomalousstructures
Identify relevant feature pairs and power law relationship
Eg Egonet Density Power Law Ni vs Ei - detect nearcliques and stars
Ei prop Nαi 1 le α le 2
Anomaly score for node i wrt a pair of features (y = Cxθ)
Si =max(yi Cx
θi )
min(yi Cxθi )lowast log (|yi minus Cxθi |+ 1)
Chawla and Chandola Anomaly Detection
Introduction Data Mining Methods Density-based anomaly Commute Time Approach Addressing Scalability Anomalies in Complex Data Evaluating Anomaly Detection Methods Applications Problem solutionsPCA and Subspace Method Subspace Method Algorithm Subspace Analysis Results Discussion Typical Characteristics of Anomaly Limitation of Volume Entropy Based versus Volume Based Fraud Detection Epidemeology Anomaly Detection in Climate and Weather Anomalies in Climate Validation of Anomalies
Exploiting Graph Structure - Bipartite Graphs
Represent data as a bipartite graph Healthcare Data (Beneficiaries vs Providers) Insider trading (Traders vs Stocks)
Objective Identify anomalous links
Given a query node a isin V1 find the ldquorelevancerdquoof all other nodes in V1 to a
RelevanceScore(a b) prop Number of times aldquorandom walkrdquo from a reaches b
Use the relevance scores to compute thenormality scores for a node t isin V2
Find set St = a|〈a t〉 isin E Compute |St| times |St| similarity matrix using
relevance vectors for a isin St Normality Score = mean of non-diagonal entries
of similarity matrix
V1 E V2a1
a2
a3
an
t1
t2
t3
tn
Chawla and Chandola Anomaly Detection
Introduction Data Mining Methods Density-based anomaly Commute Time Approach Addressing Scalability Anomalies in Complex Data Evaluating Anomaly Detection Methods Applications Problem solutionsPCA and Subspace Method Subspace Method Algorithm Subspace Analysis Results Discussion Typical Characteristics of Anomaly Limitation of Volume Entropy Based versus Volume Based Fraud Detection Epidemeology Anomaly Detection in Climate and Weather Anomalies in Climate Validation of Anomalies
Detecting Disease Outbreaks
Domain Question Early detection of disease
outbreaks Anthrax attack
Data Emergency department visits Grocery data (Example [14]) Clinical visits Weatherclimate data
Challenges Weak signals in the data
ED cases involving cough rArrFlu or SARS
Integration of multiple signals(lag analysis)
Account for spatial and temporalcorrelations
Chawla and Chandola Anomaly Detection
Introduction Data Mining Methods Density-based anomaly Commute Time Approach Addressing Scalability Anomalies in Complex Data Evaluating Anomaly Detection Methods Applications Problem solutionsPCA and Subspace Method Subspace Method Algorithm Subspace Analysis Results Discussion Typical Characteristics of Anomaly Limitation of Volume Entropy Based versus Volume Based Fraud Detection Epidemeology Anomaly Detection in Climate and Weather Anomalies in Climate Validation of Anomalies
Whatrsquos Significant About Recent Events (WSARE) [33]
1 Learn Bayesian network from historical data Environmental and response variables
2 Sample from the BN (DBbaseline|Current Environment)3 Compute contingency table for rules for DBbaseline andDBcurrent
Rules are single assignment rules (Xi = Y ji ) or conjunctions4 Find p-value for rules using χ2-test
Null Hypothesis Rows and columns of tables for DBbaselineand DBcurrent are independent
5 Find rule with largest p-value Repeat Step 2
Chawla and Chandola Anomaly Detection
Introduction Data Mining Methods Density-based anomaly Commute Time Approach Addressing Scalability Anomalies in Complex Data Evaluating Anomaly Detection Methods Applications Problem solutionsPCA and Subspace Method Subspace Method Algorithm Subspace Analysis Results Discussion Typical Characteristics of Anomaly Limitation of Volume Entropy Based versus Volume Based Fraud Detection Epidemeology Anomaly Detection in Climate and Weather Anomalies in Climate Validation of Anomalies
Incorporating Spatial and Temporal Relationships
WSARE does not explicitly model the spatial and temporalrelationships
What happened yesterday What happened in the adjoining neighborhood (yesterday)
Bayesian Network Spatio-Temporal (BNST) modelingframework [17]
Add nodes for temporal and spatial dependencies Need more data to train
Chawla and Chandola Anomaly Detection
Introduction Data Mining Methods Density-based anomaly Commute Time Approach Addressing Scalability Anomalies in Complex Data Evaluating Anomaly Detection Methods Applications Problem solutionsPCA and Subspace Method Subspace Method Algorithm Subspace Analysis Results Discussion Typical Characteristics of Anomaly Limitation of Volume Entropy Based versus Volume Based Fraud Detection Epidemeology Anomaly Detection in Climate and Weather Anomalies in Climate Validation of Anomalies
Anomaly Detection in Climate and Weather
Science Questions Identify natural and anthropogenic disasters Identify long time scale events - droughts atmospheric rivers
cold fronts etc
Data Ground observations Remote sensing data (satellites
air-borne) Climate model simulation outputs Multiple variables spatio-temporal (often has height dimension
as well)
Challenges Model spatio-temporal relationships across multiple variables Explain the cause of anomalies Massive data sizes
Climate and weather extreme events are well defined
Key challenge is to find significant events and explain the cause
Chawla and Chandola Anomaly Detection
Introduction Data Mining Methods Density-based anomaly Commute Time Approach Addressing Scalability Anomalies in Complex Data Evaluating Anomaly Detection Methods Applications Problem solutionsPCA and Subspace Method Subspace Method Algorithm Subspace Analysis Results Discussion Typical Characteristics of Anomaly Limitation of Volume Entropy Based versus Volume Based Fraud Detection Epidemeology Anomaly Detection in Climate and Weather Anomalies in Climate Validation of Anomalies
Anomalies are Widely Used in Climate
Most analysis done on ldquoanomalyrdquo time series
Difference from a ldquobase periodrdquo (Toosimplistic)
Brings spatial smoothness (eg a mountaintop and nearby valley can have very differenttemperatures) Removes seasonality
Understand climate and weatherphenomenon
Southern Oscillation Index (SOI) Difference between Sea Level Pressure
(SLP) anomalies for Tahiti and DarwinAustralia
Figure Global AverageTemperature Anomaly(1975 - 2007) Srcwwwmetofficegovuk
Chawla and Chandola Anomaly Detection
Introduction Data Mining Methods Density-based anomaly Commute Time Approach Addressing Scalability Anomalies in Complex Data Evaluating Anomaly Detection Methods Applications Problem solutionsPCA and Subspace Method Subspace Method Algorithm Subspace Analysis Results Discussion Typical Characteristics of Anomaly Limitation of Volume Entropy Based versus Volume Based Fraud Detection Epidemeology Anomaly Detection in Climate and Weather Anomalies in Climate Validation of Anomalies
Constructing Anomalies from Raw Data
Anomaly time series for a given location i
vprimei = vi minus bi
where bi is the base (reference)
How to choose bi Mean of all data for location i Monthly mean values (account for seasonality) Monthly z-score values Median (more robust) Using a shorter ldquoreference periodrdquo
30 year moving window
Different methods show statistically significant differences[19] What is the right strategy Weighted mean of different strategies (Pick weights using
Monte Carlo sampling)
Chawla and Chandola Anomaly Detection
Introduction Data Mining Methods Density-based anomaly Commute Time Approach Addressing Scalability Anomalies in Complex Data Evaluating Anomaly Detection Methods Applications Problem solutionsPCA and Subspace Method Subspace Method Algorithm Subspace Analysis Results Discussion Typical Characteristics of Anomaly Limitation of Volume Entropy Based versus Volume Based Fraud Detection Epidemeology Anomaly Detection in Climate and Weather Anomalies in Climate Validation of Anomalies
Anomaly Detection for Identifying Droughts
Science question Identify significant drought patterns usinghistorical observation data or future simulation data or both
Find persistent spatiotemporal anomalies in precipitation data
A two step approach
1 Find precipitationanomalies usingthresholds
2 Find large connectedcomponents across spaceand time
Matlab - bwlabelbwlabeln
Followup Science questionExplain cause
(drought190120061avi)
Figure Video courtsey Dr ArindamBanerjee
Chawla and Chandola Anomaly Detection
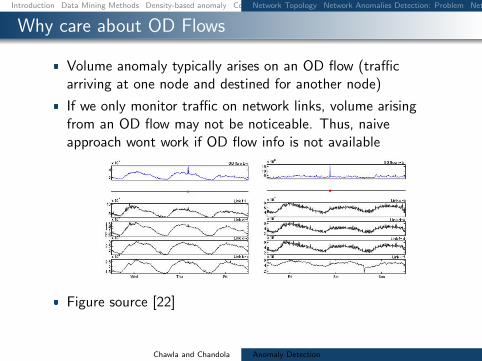
Introduction Data Mining Methods Density-based anomaly Commute Time Approach Addressing Scalability Anomalies in Complex Data Evaluating Anomaly Detection Methods Applications Problem solutionsNetwork Topology Network Anomalies Detection Problem Network Anomalies Detection Problem Why care about OD Flows
Why care about OD Flows
Volume anomaly typically arises on an OD flow (trafficarriving at one node and destined for another node)
If we only monitor traffic on network links volume arisingfrom an OD flow may not be noticeable Thus naiveapproach wont work if OD flow info is not available
Figure source [22]
Chawla and Chandola Anomaly Detection
Introduction Data Mining Methods Density-based anomaly Commute Time Approach Addressing Scalability Anomalies in Complex Data Evaluating Anomaly Detection Methods Applications Problem solutionsPCA and Subspace Method Subspace Method Algorithm Subspace Analysis Results Discussion Typical Characteristics of Anomaly Limitation of Volume Entropy Based versus Volume Based Fraud Detection Epidemeology Anomaly Detection in Climate and Weather Anomalies in Climate Validation of Anomalies
PCA and Subspace Method
Chawla and Chandola Anomaly Detection
Introduction Data Mining Methods Density-based anomaly Commute Time Approach Addressing Scalability Anomalies in Complex Data Evaluating Anomaly Detection Methods Applications Problem solutionsPCA and Subspace Method Subspace Method Algorithm Subspace Analysis Results Discussion Typical Characteristics of Anomaly Limitation of Volume Entropy Based versus Volume Based Fraud Detection Epidemeology Anomaly Detection in Climate and Weather Anomalies in Climate Validation of Anomalies
Subspace Method Algorithm
Step1- Determine the PCs based on eigenvaluedecomposition of the covariance matrix of the dataset
Step2- Choose first top k principle components with thehighest eigenvalues as matrix P
Step3-normal traffic subspace called Z
Z = PP TZ = CZ
Step4-abnormal traffic subspace called Z
Z = (I minus PP T )Z = CZ
Step5-If the norm of a vector is large then it is an rdquoanomalyrdquo
Chawla and Chandola Anomaly Detection
Introduction Data Mining Methods Density-based anomaly Commute Time Approach Addressing Scalability Anomalies in Complex Data Evaluating Anomaly Detection Methods Applications Problem solutionsPCA and Subspace Method Subspace Method Algorithm Subspace Analysis Results Discussion Typical Characteristics of Anomaly Limitation of Volume Entropy Based versus Volume Based Fraud Detection Epidemeology Anomaly Detection in Climate and Weather Anomalies in Climate Validation of Anomalies
Subspace Analysis Results
Note that during anomaly normal component does not changethat much while residual component changes quite a lot
Thus anomalies can be detected by setting some threshold
Figure source [22]
Chawla and Chandola Anomaly Detection
Introduction Data Mining Methods Density-based anomaly Commute Time Approach Addressing Scalability Anomalies in Complex Data Evaluating Anomaly Detection Methods Applications Problem solutionsPCA and Subspace Method Subspace Method Algorithm Subspace Analysis Results Discussion Typical Characteristics of Anomaly Limitation of Volume Entropy Based versus Volume Based Fraud Detection Epidemeology Anomaly Detection in Climate and Weather Anomalies in Climate Validation of Anomalies
Discussion Typical Characteristics of Anomaly
Most Anomalies induce a change in distributionalaspects of packet header fields (called features)
Most important features include 5-tuple Source ampdestination IP addresses Source and destination portnumbers and IP protocol
raquo DOS attack ndash multiple source IP address concentrated on asingle destination IP address
raquo Network scan ndash dispersed distribution of destination addresses
raquo Most wormsviruses also induce some change in distribution ofcertain features
raquo However these changes can be very subtle and mining them islike searching for needles in a haystack
Unlike many previous approach this paper aims todetect events which disturb the distribution of trafficfeatures rather than traffic volume
Chawla and Chandola Anomaly Detection
Introduction Data Mining Methods Density-based anomaly Commute Time Approach Addressing Scalability Anomalies in Complex Data Evaluating Anomaly Detection Methods Applications Problem solutionsPCA and Subspace Method Subspace Method Algorithm Subspace Analysis Results Discussion Typical Characteristics of Anomaly Limitation of Volume Entropy Based versus Volume Based Fraud Detection Epidemeology Anomaly Detection in Climate and Weather Anomalies in Climate Validation of Anomalies
Limitation of Volume
Figure source [22]
Port scan anomaly (traffic feature changes however traffic volume
remains more or less the same)
We can use entropy tocapture the variationsin the traffic feature
bullTakes value 0 when distribution is maximally concentratedbullTakes value log2N when distribution is maximally dispersed
But stands out in
feature entropy
which also reveals
its structure
Port scan
dwarfed
in volume
metricshellip
Chawla and Chandola Anomaly Detection
Introduction Data Mining Methods Density-based anomaly Commute Time Approach Addressing Scalability Anomalies in Complex Data Evaluating Anomaly Detection Methods Applications Problem solutionsPCA and Subspace Method Subspace Method Algorithm Subspace Analysis Results Discussion Typical Characteristics of Anomaly Limitation of Volume Entropy Based versus Volume Based Fraud Detection Epidemeology Anomaly Detection in Climate and Weather Anomalies in Climate Validation of Anomalies
Entropy Based versus Volume Based
DoSDDoS Attacks- a spike in traffic data toward adominant destination IP
Scan anomaly-a spike in traffic data from a dominant sourceIP
Flash Crowd anomaly- again a spike in traffic data to adominant destination IP
Worm anomaly-a Spike in traffic with a dominant port
Chawla and Chandola Anomaly Detection
Introduction Data Mining Methods Density-based anomaly Commute Time Approach Addressing Scalability Anomalies in Complex Data Evaluating Anomaly Detection Methods Applications Problem solutionsPCA and Subspace Method Subspace Method Algorithm Subspace Analysis Results Discussion Typical Characteristics of Anomaly Limitation of Volume Entropy Based versus Volume Based Fraud Detection Epidemeology Anomaly Detection in Climate and Weather Anomalies in Climate Validation of Anomalies
Fraud Detection
Domain Question Identifyfraudulent activities or players fromobserved transaction data
Data Transactions between different
players in the system Meta information about the
individuals An underlying graph structure
Challenges Track and model human behavior Anomalies caused by adaptive
human adversaries Massive data sizes
Insurance (autohealtha)
ClaimantProvider Payer
Telecommunications Customer
Provider
Credit Cards Customer
Supplier Bank
Web Advertising User Advertiser
Publisher
ahttpwwwcheatingculturecompast-cases-of-medicare-fraud
Chawla and Chandola Anomaly Detection
Introduction Data Mining Methods Density-based anomaly Commute Time Approach Addressing Scalability Anomalies in Complex Data Evaluating Anomaly Detection Methods Applications Problem solutionsPCA and Subspace Method Subspace Method Algorithm Subspace Analysis Results Discussion Typical Characteristics of Anomaly Limitation of Volume Entropy Based versus Volume Based Fraud Detection Epidemeology Anomaly Detection in Climate and Weather Anomalies in Climate Validation of Anomalies
A Generic Fraud Detection Method
Activity Monitoring [13]1 Build profiles for individuals (customers users etc) based on
historic data User X makes n calls on an average in January
2 Compare current behavior with historical profile for significantdeviations
Clustering based [4]1 Cluster historical profiles of customers2 Identify small clusters or outlying profiles as anomalies
Strengths Anomaly detection is fast (good for real time) Results are easy to explain
Weaknesses Need to create and maintain a large number of profiles Not dynamic Adequate historical data might not be available Too many false positives
Chawla and Chandola Anomaly Detection
Introduction Data Mining Methods Density-based anomaly Commute Time Approach Addressing Scalability Anomalies in Complex Data Evaluating Anomaly Detection Methods Applications Problem solutionsPCA and Subspace Method Subspace Method Algorithm Subspace Analysis Results Discussion Typical Characteristics of Anomaly Limitation of Volume Entropy Based versus Volume Based Fraud Detection Epidemeology Anomaly Detection in Climate and Weather Anomalies in Climate Validation of Anomalies
Exploiting Graph Structure - Weighted Graphs
Represent data as a weighted graph Communication networks (phone email SMS) Provider referral networks
Objective Identify anomalous nodes
For each node extract several features based on the propertiesof the induced sub-graph (egonet) of neighboring nodes [1]
Choose features that can highlight anomalous nodes
1 Ni degree of node2 Ei number of edges in egonet3 Wi total weight of egonet4 λi principal eigen vector of weighted adjacency matrix of
egonet
Data is transformed into a point in a multi-dimensional space
Chawla and Chandola Anomaly Detection
Introduction Data Mining Methods Density-based anomaly Commute Time Approach Addressing Scalability Anomalies in Complex Data Evaluating Anomaly Detection Methods Applications Problem solutionsPCA and Subspace Method Subspace Method Algorithm Subspace Analysis Results Discussion Typical Characteristics of Anomaly Limitation of Volume Entropy Based versus Volume Based Fraud Detection Epidemeology Anomaly Detection in Climate and Weather Anomalies in Climate Validation of Anomalies
Identifying Anomalies
Traditional anomaly detection (lof) Can be slow but can identify any type of anomalous structure
Faster method to identify specific types of anomalousstructures
Identify relevant feature pairs and power law relationship
Eg Egonet Density Power Law Ni vs Ei - detect nearcliques and stars
Ei prop Nαi 1 le α le 2
Anomaly score for node i wrt a pair of features (y = Cxθ)
Si =max(yi Cx
θi )
min(yi Cxθi )lowast log (|yi minus Cxθi |+ 1)
Chawla and Chandola Anomaly Detection
Introduction Data Mining Methods Density-based anomaly Commute Time Approach Addressing Scalability Anomalies in Complex Data Evaluating Anomaly Detection Methods Applications Problem solutionsPCA and Subspace Method Subspace Method Algorithm Subspace Analysis Results Discussion Typical Characteristics of Anomaly Limitation of Volume Entropy Based versus Volume Based Fraud Detection Epidemeology Anomaly Detection in Climate and Weather Anomalies in Climate Validation of Anomalies
Exploiting Graph Structure - Bipartite Graphs
Represent data as a bipartite graph Healthcare Data (Beneficiaries vs Providers) Insider trading (Traders vs Stocks)
Objective Identify anomalous links
Given a query node a isin V1 find the ldquorelevancerdquoof all other nodes in V1 to a
RelevanceScore(a b) prop Number of times aldquorandom walkrdquo from a reaches b
Use the relevance scores to compute thenormality scores for a node t isin V2
Find set St = a|〈a t〉 isin E Compute |St| times |St| similarity matrix using
relevance vectors for a isin St Normality Score = mean of non-diagonal entries
of similarity matrix
V1 E V2a1
a2
a3
an
t1
t2
t3
tn
Chawla and Chandola Anomaly Detection
Introduction Data Mining Methods Density-based anomaly Commute Time Approach Addressing Scalability Anomalies in Complex Data Evaluating Anomaly Detection Methods Applications Problem solutionsPCA and Subspace Method Subspace Method Algorithm Subspace Analysis Results Discussion Typical Characteristics of Anomaly Limitation of Volume Entropy Based versus Volume Based Fraud Detection Epidemeology Anomaly Detection in Climate and Weather Anomalies in Climate Validation of Anomalies
Detecting Disease Outbreaks
Domain Question Early detection of disease
outbreaks Anthrax attack
Data Emergency department visits Grocery data (Example [14]) Clinical visits Weatherclimate data
Challenges Weak signals in the data
ED cases involving cough rArrFlu or SARS
Integration of multiple signals(lag analysis)
Account for spatial and temporalcorrelations
Chawla and Chandola Anomaly Detection
Introduction Data Mining Methods Density-based anomaly Commute Time Approach Addressing Scalability Anomalies in Complex Data Evaluating Anomaly Detection Methods Applications Problem solutionsPCA and Subspace Method Subspace Method Algorithm Subspace Analysis Results Discussion Typical Characteristics of Anomaly Limitation of Volume Entropy Based versus Volume Based Fraud Detection Epidemeology Anomaly Detection in Climate and Weather Anomalies in Climate Validation of Anomalies
Whatrsquos Significant About Recent Events (WSARE) [33]
1 Learn Bayesian network from historical data Environmental and response variables
2 Sample from the BN (DBbaseline|Current Environment)3 Compute contingency table for rules for DBbaseline andDBcurrent
Rules are single assignment rules (Xi = Y ji ) or conjunctions4 Find p-value for rules using χ2-test
Null Hypothesis Rows and columns of tables for DBbaselineand DBcurrent are independent
5 Find rule with largest p-value Repeat Step 2
Chawla and Chandola Anomaly Detection
Introduction Data Mining Methods Density-based anomaly Commute Time Approach Addressing Scalability Anomalies in Complex Data Evaluating Anomaly Detection Methods Applications Problem solutionsPCA and Subspace Method Subspace Method Algorithm Subspace Analysis Results Discussion Typical Characteristics of Anomaly Limitation of Volume Entropy Based versus Volume Based Fraud Detection Epidemeology Anomaly Detection in Climate and Weather Anomalies in Climate Validation of Anomalies
Incorporating Spatial and Temporal Relationships
WSARE does not explicitly model the spatial and temporalrelationships
What happened yesterday What happened in the adjoining neighborhood (yesterday)
Bayesian Network Spatio-Temporal (BNST) modelingframework [17]
Add nodes for temporal and spatial dependencies Need more data to train
Chawla and Chandola Anomaly Detection
Introduction Data Mining Methods Density-based anomaly Commute Time Approach Addressing Scalability Anomalies in Complex Data Evaluating Anomaly Detection Methods Applications Problem solutionsPCA and Subspace Method Subspace Method Algorithm Subspace Analysis Results Discussion Typical Characteristics of Anomaly Limitation of Volume Entropy Based versus Volume Based Fraud Detection Epidemeology Anomaly Detection in Climate and Weather Anomalies in Climate Validation of Anomalies
Anomaly Detection in Climate and Weather
Science Questions Identify natural and anthropogenic disasters Identify long time scale events - droughts atmospheric rivers
cold fronts etc
Data Ground observations Remote sensing data (satellites
air-borne) Climate model simulation outputs Multiple variables spatio-temporal (often has height dimension
as well)
Challenges Model spatio-temporal relationships across multiple variables Explain the cause of anomalies Massive data sizes
Climate and weather extreme events are well defined
Key challenge is to find significant events and explain the cause
Chawla and Chandola Anomaly Detection
Introduction Data Mining Methods Density-based anomaly Commute Time Approach Addressing Scalability Anomalies in Complex Data Evaluating Anomaly Detection Methods Applications Problem solutionsPCA and Subspace Method Subspace Method Algorithm Subspace Analysis Results Discussion Typical Characteristics of Anomaly Limitation of Volume Entropy Based versus Volume Based Fraud Detection Epidemeology Anomaly Detection in Climate and Weather Anomalies in Climate Validation of Anomalies
Anomalies are Widely Used in Climate
Most analysis done on ldquoanomalyrdquo time series
Difference from a ldquobase periodrdquo (Toosimplistic)
Brings spatial smoothness (eg a mountaintop and nearby valley can have very differenttemperatures) Removes seasonality
Understand climate and weatherphenomenon
Southern Oscillation Index (SOI) Difference between Sea Level Pressure
(SLP) anomalies for Tahiti and DarwinAustralia
Figure Global AverageTemperature Anomaly(1975 - 2007) Srcwwwmetofficegovuk
Chawla and Chandola Anomaly Detection
Introduction Data Mining Methods Density-based anomaly Commute Time Approach Addressing Scalability Anomalies in Complex Data Evaluating Anomaly Detection Methods Applications Problem solutionsPCA and Subspace Method Subspace Method Algorithm Subspace Analysis Results Discussion Typical Characteristics of Anomaly Limitation of Volume Entropy Based versus Volume Based Fraud Detection Epidemeology Anomaly Detection in Climate and Weather Anomalies in Climate Validation of Anomalies
Constructing Anomalies from Raw Data
Anomaly time series for a given location i
vprimei = vi minus bi
where bi is the base (reference)
How to choose bi Mean of all data for location i Monthly mean values (account for seasonality) Monthly z-score values Median (more robust) Using a shorter ldquoreference periodrdquo
30 year moving window
Different methods show statistically significant differences[19] What is the right strategy Weighted mean of different strategies (Pick weights using
Monte Carlo sampling)
Chawla and Chandola Anomaly Detection
Introduction Data Mining Methods Density-based anomaly Commute Time Approach Addressing Scalability Anomalies in Complex Data Evaluating Anomaly Detection Methods Applications Problem solutionsPCA and Subspace Method Subspace Method Algorithm Subspace Analysis Results Discussion Typical Characteristics of Anomaly Limitation of Volume Entropy Based versus Volume Based Fraud Detection Epidemeology Anomaly Detection in Climate and Weather Anomalies in Climate Validation of Anomalies
Anomaly Detection for Identifying Droughts
Science question Identify significant drought patterns usinghistorical observation data or future simulation data or both
Find persistent spatiotemporal anomalies in precipitation data
A two step approach
1 Find precipitationanomalies usingthresholds
2 Find large connectedcomponents across spaceand time
Matlab - bwlabelbwlabeln
Followup Science questionExplain cause
(drought190120061avi)
Figure Video courtsey Dr ArindamBanerjee
Chawla and Chandola Anomaly Detection
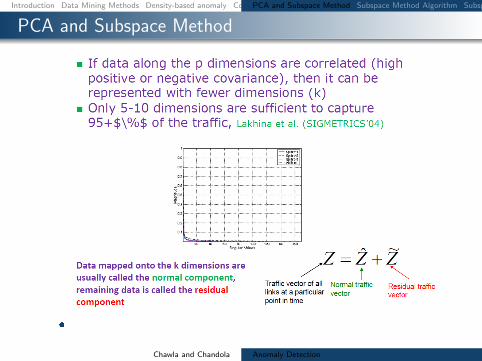
Introduction Data Mining Methods Density-based anomaly Commute Time Approach Addressing Scalability Anomalies in Complex Data Evaluating Anomaly Detection Methods Applications Problem solutionsPCA and Subspace Method Subspace Method Algorithm Subspace Analysis Results Discussion Typical Characteristics of Anomaly Limitation of Volume Entropy Based versus Volume Based Fraud Detection Epidemeology Anomaly Detection in Climate and Weather Anomalies in Climate Validation of Anomalies
PCA and Subspace Method
Chawla and Chandola Anomaly Detection
Introduction Data Mining Methods Density-based anomaly Commute Time Approach Addressing Scalability Anomalies in Complex Data Evaluating Anomaly Detection Methods Applications Problem solutionsPCA and Subspace Method Subspace Method Algorithm Subspace Analysis Results Discussion Typical Characteristics of Anomaly Limitation of Volume Entropy Based versus Volume Based Fraud Detection Epidemeology Anomaly Detection in Climate and Weather Anomalies in Climate Validation of Anomalies
Subspace Method Algorithm
Step1- Determine the PCs based on eigenvaluedecomposition of the covariance matrix of the dataset
Step2- Choose first top k principle components with thehighest eigenvalues as matrix P
Step3-normal traffic subspace called Z
Z = PP TZ = CZ
Step4-abnormal traffic subspace called Z
Z = (I minus PP T )Z = CZ
Step5-If the norm of a vector is large then it is an rdquoanomalyrdquo
Chawla and Chandola Anomaly Detection
Introduction Data Mining Methods Density-based anomaly Commute Time Approach Addressing Scalability Anomalies in Complex Data Evaluating Anomaly Detection Methods Applications Problem solutionsPCA and Subspace Method Subspace Method Algorithm Subspace Analysis Results Discussion Typical Characteristics of Anomaly Limitation of Volume Entropy Based versus Volume Based Fraud Detection Epidemeology Anomaly Detection in Climate and Weather Anomalies in Climate Validation of Anomalies
Subspace Analysis Results
Note that during anomaly normal component does not changethat much while residual component changes quite a lot
Thus anomalies can be detected by setting some threshold
Figure source [22]
Chawla and Chandola Anomaly Detection
Introduction Data Mining Methods Density-based anomaly Commute Time Approach Addressing Scalability Anomalies in Complex Data Evaluating Anomaly Detection Methods Applications Problem solutionsPCA and Subspace Method Subspace Method Algorithm Subspace Analysis Results Discussion Typical Characteristics of Anomaly Limitation of Volume Entropy Based versus Volume Based Fraud Detection Epidemeology Anomaly Detection in Climate and Weather Anomalies in Climate Validation of Anomalies
Discussion Typical Characteristics of Anomaly
Most Anomalies induce a change in distributionalaspects of packet header fields (called features)
Most important features include 5-tuple Source ampdestination IP addresses Source and destination portnumbers and IP protocol
raquo DOS attack ndash multiple source IP address concentrated on asingle destination IP address
raquo Network scan ndash dispersed distribution of destination addresses
raquo Most wormsviruses also induce some change in distribution ofcertain features
raquo However these changes can be very subtle and mining them islike searching for needles in a haystack
Unlike many previous approach this paper aims todetect events which disturb the distribution of trafficfeatures rather than traffic volume
Chawla and Chandola Anomaly Detection
Introduction Data Mining Methods Density-based anomaly Commute Time Approach Addressing Scalability Anomalies in Complex Data Evaluating Anomaly Detection Methods Applications Problem solutionsPCA and Subspace Method Subspace Method Algorithm Subspace Analysis Results Discussion Typical Characteristics of Anomaly Limitation of Volume Entropy Based versus Volume Based Fraud Detection Epidemeology Anomaly Detection in Climate and Weather Anomalies in Climate Validation of Anomalies
Limitation of Volume
Figure source [22]
Port scan anomaly (traffic feature changes however traffic volume
remains more or less the same)
We can use entropy tocapture the variationsin the traffic feature
bullTakes value 0 when distribution is maximally concentratedbullTakes value log2N when distribution is maximally dispersed
But stands out in
feature entropy
which also reveals
its structure
Port scan
dwarfed
in volume
metricshellip
Chawla and Chandola Anomaly Detection
Introduction Data Mining Methods Density-based anomaly Commute Time Approach Addressing Scalability Anomalies in Complex Data Evaluating Anomaly Detection Methods Applications Problem solutionsPCA and Subspace Method Subspace Method Algorithm Subspace Analysis Results Discussion Typical Characteristics of Anomaly Limitation of Volume Entropy Based versus Volume Based Fraud Detection Epidemeology Anomaly Detection in Climate and Weather Anomalies in Climate Validation of Anomalies
Entropy Based versus Volume Based
DoSDDoS Attacks- a spike in traffic data toward adominant destination IP
Scan anomaly-a spike in traffic data from a dominant sourceIP
Flash Crowd anomaly- again a spike in traffic data to adominant destination IP
Worm anomaly-a Spike in traffic with a dominant port
Chawla and Chandola Anomaly Detection
Introduction Data Mining Methods Density-based anomaly Commute Time Approach Addressing Scalability Anomalies in Complex Data Evaluating Anomaly Detection Methods Applications Problem solutionsPCA and Subspace Method Subspace Method Algorithm Subspace Analysis Results Discussion Typical Characteristics of Anomaly Limitation of Volume Entropy Based versus Volume Based Fraud Detection Epidemeology Anomaly Detection in Climate and Weather Anomalies in Climate Validation of Anomalies
Fraud Detection
Domain Question Identifyfraudulent activities or players fromobserved transaction data
Data Transactions between different
players in the system Meta information about the
individuals An underlying graph structure
Challenges Track and model human behavior Anomalies caused by adaptive
human adversaries Massive data sizes
Insurance (autohealtha)
ClaimantProvider Payer
Telecommunications Customer
Provider
Credit Cards Customer
Supplier Bank
Web Advertising User Advertiser
Publisher
ahttpwwwcheatingculturecompast-cases-of-medicare-fraud
Chawla and Chandola Anomaly Detection
Introduction Data Mining Methods Density-based anomaly Commute Time Approach Addressing Scalability Anomalies in Complex Data Evaluating Anomaly Detection Methods Applications Problem solutionsPCA and Subspace Method Subspace Method Algorithm Subspace Analysis Results Discussion Typical Characteristics of Anomaly Limitation of Volume Entropy Based versus Volume Based Fraud Detection Epidemeology Anomaly Detection in Climate and Weather Anomalies in Climate Validation of Anomalies
A Generic Fraud Detection Method
Activity Monitoring [13]1 Build profiles for individuals (customers users etc) based on
historic data User X makes n calls on an average in January
2 Compare current behavior with historical profile for significantdeviations
Clustering based [4]1 Cluster historical profiles of customers2 Identify small clusters or outlying profiles as anomalies
Strengths Anomaly detection is fast (good for real time) Results are easy to explain
Weaknesses Need to create and maintain a large number of profiles Not dynamic Adequate historical data might not be available Too many false positives
Chawla and Chandola Anomaly Detection
Introduction Data Mining Methods Density-based anomaly Commute Time Approach Addressing Scalability Anomalies in Complex Data Evaluating Anomaly Detection Methods Applications Problem solutionsPCA and Subspace Method Subspace Method Algorithm Subspace Analysis Results Discussion Typical Characteristics of Anomaly Limitation of Volume Entropy Based versus Volume Based Fraud Detection Epidemeology Anomaly Detection in Climate and Weather Anomalies in Climate Validation of Anomalies
Exploiting Graph Structure - Weighted Graphs
Represent data as a weighted graph Communication networks (phone email SMS) Provider referral networks
Objective Identify anomalous nodes
For each node extract several features based on the propertiesof the induced sub-graph (egonet) of neighboring nodes [1]
Choose features that can highlight anomalous nodes
1 Ni degree of node2 Ei number of edges in egonet3 Wi total weight of egonet4 λi principal eigen vector of weighted adjacency matrix of
egonet
Data is transformed into a point in a multi-dimensional space
Chawla and Chandola Anomaly Detection
Introduction Data Mining Methods Density-based anomaly Commute Time Approach Addressing Scalability Anomalies in Complex Data Evaluating Anomaly Detection Methods Applications Problem solutionsPCA and Subspace Method Subspace Method Algorithm Subspace Analysis Results Discussion Typical Characteristics of Anomaly Limitation of Volume Entropy Based versus Volume Based Fraud Detection Epidemeology Anomaly Detection in Climate and Weather Anomalies in Climate Validation of Anomalies
Identifying Anomalies
Traditional anomaly detection (lof) Can be slow but can identify any type of anomalous structure
Faster method to identify specific types of anomalousstructures
Identify relevant feature pairs and power law relationship
Eg Egonet Density Power Law Ni vs Ei - detect nearcliques and stars
Ei prop Nαi 1 le α le 2
Anomaly score for node i wrt a pair of features (y = Cxθ)
Si =max(yi Cx
θi )
min(yi Cxθi )lowast log (|yi minus Cxθi |+ 1)
Chawla and Chandola Anomaly Detection
Introduction Data Mining Methods Density-based anomaly Commute Time Approach Addressing Scalability Anomalies in Complex Data Evaluating Anomaly Detection Methods Applications Problem solutionsPCA and Subspace Method Subspace Method Algorithm Subspace Analysis Results Discussion Typical Characteristics of Anomaly Limitation of Volume Entropy Based versus Volume Based Fraud Detection Epidemeology Anomaly Detection in Climate and Weather Anomalies in Climate Validation of Anomalies
Exploiting Graph Structure - Bipartite Graphs
Represent data as a bipartite graph Healthcare Data (Beneficiaries vs Providers) Insider trading (Traders vs Stocks)
Objective Identify anomalous links
Given a query node a isin V1 find the ldquorelevancerdquoof all other nodes in V1 to a
RelevanceScore(a b) prop Number of times aldquorandom walkrdquo from a reaches b
Use the relevance scores to compute thenormality scores for a node t isin V2
Find set St = a|〈a t〉 isin E Compute |St| times |St| similarity matrix using
relevance vectors for a isin St Normality Score = mean of non-diagonal entries
of similarity matrix
V1 E V2a1
a2
a3
an
t1
t2
t3
tn
Chawla and Chandola Anomaly Detection
Introduction Data Mining Methods Density-based anomaly Commute Time Approach Addressing Scalability Anomalies in Complex Data Evaluating Anomaly Detection Methods Applications Problem solutionsPCA and Subspace Method Subspace Method Algorithm Subspace Analysis Results Discussion Typical Characteristics of Anomaly Limitation of Volume Entropy Based versus Volume Based Fraud Detection Epidemeology Anomaly Detection in Climate and Weather Anomalies in Climate Validation of Anomalies
Detecting Disease Outbreaks
Domain Question Early detection of disease
outbreaks Anthrax attack
Data Emergency department visits Grocery data (Example [14]) Clinical visits Weatherclimate data
Challenges Weak signals in the data
ED cases involving cough rArrFlu or SARS
Integration of multiple signals(lag analysis)
Account for spatial and temporalcorrelations
Chawla and Chandola Anomaly Detection
Introduction Data Mining Methods Density-based anomaly Commute Time Approach Addressing Scalability Anomalies in Complex Data Evaluating Anomaly Detection Methods Applications Problem solutionsPCA and Subspace Method Subspace Method Algorithm Subspace Analysis Results Discussion Typical Characteristics of Anomaly Limitation of Volume Entropy Based versus Volume Based Fraud Detection Epidemeology Anomaly Detection in Climate and Weather Anomalies in Climate Validation of Anomalies
Whatrsquos Significant About Recent Events (WSARE) [33]
1 Learn Bayesian network from historical data Environmental and response variables
2 Sample from the BN (DBbaseline|Current Environment)3 Compute contingency table for rules for DBbaseline andDBcurrent
Rules are single assignment rules (Xi = Y ji ) or conjunctions4 Find p-value for rules using χ2-test
Null Hypothesis Rows and columns of tables for DBbaselineand DBcurrent are independent
5 Find rule with largest p-value Repeat Step 2
Chawla and Chandola Anomaly Detection
Introduction Data Mining Methods Density-based anomaly Commute Time Approach Addressing Scalability Anomalies in Complex Data Evaluating Anomaly Detection Methods Applications Problem solutionsPCA and Subspace Method Subspace Method Algorithm Subspace Analysis Results Discussion Typical Characteristics of Anomaly Limitation of Volume Entropy Based versus Volume Based Fraud Detection Epidemeology Anomaly Detection in Climate and Weather Anomalies in Climate Validation of Anomalies
Incorporating Spatial and Temporal Relationships
WSARE does not explicitly model the spatial and temporalrelationships
What happened yesterday What happened in the adjoining neighborhood (yesterday)
Bayesian Network Spatio-Temporal (BNST) modelingframework [17]
Add nodes for temporal and spatial dependencies Need more data to train
Chawla and Chandola Anomaly Detection
Introduction Data Mining Methods Density-based anomaly Commute Time Approach Addressing Scalability Anomalies in Complex Data Evaluating Anomaly Detection Methods Applications Problem solutionsPCA and Subspace Method Subspace Method Algorithm Subspace Analysis Results Discussion Typical Characteristics of Anomaly Limitation of Volume Entropy Based versus Volume Based Fraud Detection Epidemeology Anomaly Detection in Climate and Weather Anomalies in Climate Validation of Anomalies
Anomaly Detection in Climate and Weather
Science Questions Identify natural and anthropogenic disasters Identify long time scale events - droughts atmospheric rivers
cold fronts etc
Data Ground observations Remote sensing data (satellites
air-borne) Climate model simulation outputs Multiple variables spatio-temporal (often has height dimension
as well)
Challenges Model spatio-temporal relationships across multiple variables Explain the cause of anomalies Massive data sizes
Climate and weather extreme events are well defined
Key challenge is to find significant events and explain the cause
Chawla and Chandola Anomaly Detection
Introduction Data Mining Methods Density-based anomaly Commute Time Approach Addressing Scalability Anomalies in Complex Data Evaluating Anomaly Detection Methods Applications Problem solutionsPCA and Subspace Method Subspace Method Algorithm Subspace Analysis Results Discussion Typical Characteristics of Anomaly Limitation of Volume Entropy Based versus Volume Based Fraud Detection Epidemeology Anomaly Detection in Climate and Weather Anomalies in Climate Validation of Anomalies
Anomalies are Widely Used in Climate
Most analysis done on ldquoanomalyrdquo time series
Difference from a ldquobase periodrdquo (Toosimplistic)
Brings spatial smoothness (eg a mountaintop and nearby valley can have very differenttemperatures) Removes seasonality
Understand climate and weatherphenomenon
Southern Oscillation Index (SOI) Difference between Sea Level Pressure
(SLP) anomalies for Tahiti and DarwinAustralia
Figure Global AverageTemperature Anomaly(1975 - 2007) Srcwwwmetofficegovuk
Chawla and Chandola Anomaly Detection
Introduction Data Mining Methods Density-based anomaly Commute Time Approach Addressing Scalability Anomalies in Complex Data Evaluating Anomaly Detection Methods Applications Problem solutionsPCA and Subspace Method Subspace Method Algorithm Subspace Analysis Results Discussion Typical Characteristics of Anomaly Limitation of Volume Entropy Based versus Volume Based Fraud Detection Epidemeology Anomaly Detection in Climate and Weather Anomalies in Climate Validation of Anomalies
Constructing Anomalies from Raw Data
Anomaly time series for a given location i
vprimei = vi minus bi
where bi is the base (reference)
How to choose bi Mean of all data for location i Monthly mean values (account for seasonality) Monthly z-score values Median (more robust) Using a shorter ldquoreference periodrdquo
30 year moving window
Different methods show statistically significant differences[19] What is the right strategy Weighted mean of different strategies (Pick weights using
Monte Carlo sampling)
Chawla and Chandola Anomaly Detection
Introduction Data Mining Methods Density-based anomaly Commute Time Approach Addressing Scalability Anomalies in Complex Data Evaluating Anomaly Detection Methods Applications Problem solutionsPCA and Subspace Method Subspace Method Algorithm Subspace Analysis Results Discussion Typical Characteristics of Anomaly Limitation of Volume Entropy Based versus Volume Based Fraud Detection Epidemeology Anomaly Detection in Climate and Weather Anomalies in Climate Validation of Anomalies
Anomaly Detection for Identifying Droughts
Science question Identify significant drought patterns usinghistorical observation data or future simulation data or both
Find persistent spatiotemporal anomalies in precipitation data
A two step approach
1 Find precipitationanomalies usingthresholds
2 Find large connectedcomponents across spaceand time
Matlab - bwlabelbwlabeln
Followup Science questionExplain cause
(drought190120061avi)
Figure Video courtsey Dr ArindamBanerjee
Chawla and Chandola Anomaly Detection
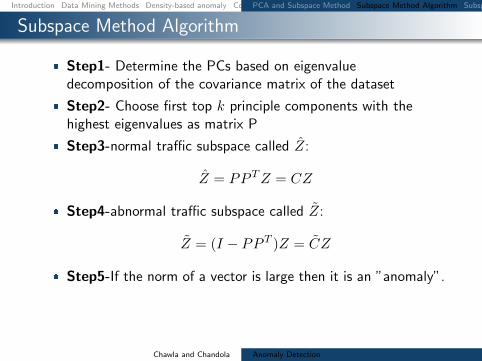
Introduction Data Mining Methods Density-based anomaly Commute Time Approach Addressing Scalability Anomalies in Complex Data Evaluating Anomaly Detection Methods Applications Problem solutionsPCA and Subspace Method Subspace Method Algorithm Subspace Analysis Results Discussion Typical Characteristics of Anomaly Limitation of Volume Entropy Based versus Volume Based Fraud Detection Epidemeology Anomaly Detection in Climate and Weather Anomalies in Climate Validation of Anomalies
Subspace Method Algorithm
Step1- Determine the PCs based on eigenvaluedecomposition of the covariance matrix of the dataset
Step2- Choose first top k principle components with thehighest eigenvalues as matrix P
Step3-normal traffic subspace called Z
Z = PP TZ = CZ
Step4-abnormal traffic subspace called Z
Z = (I minus PP T )Z = CZ
Step5-If the norm of a vector is large then it is an rdquoanomalyrdquo
Chawla and Chandola Anomaly Detection
Introduction Data Mining Methods Density-based anomaly Commute Time Approach Addressing Scalability Anomalies in Complex Data Evaluating Anomaly Detection Methods Applications Problem solutionsPCA and Subspace Method Subspace Method Algorithm Subspace Analysis Results Discussion Typical Characteristics of Anomaly Limitation of Volume Entropy Based versus Volume Based Fraud Detection Epidemeology Anomaly Detection in Climate and Weather Anomalies in Climate Validation of Anomalies
Subspace Analysis Results
Note that during anomaly normal component does not changethat much while residual component changes quite a lot
Thus anomalies can be detected by setting some threshold
Figure source [22]
Chawla and Chandola Anomaly Detection
Introduction Data Mining Methods Density-based anomaly Commute Time Approach Addressing Scalability Anomalies in Complex Data Evaluating Anomaly Detection Methods Applications Problem solutionsPCA and Subspace Method Subspace Method Algorithm Subspace Analysis Results Discussion Typical Characteristics of Anomaly Limitation of Volume Entropy Based versus Volume Based Fraud Detection Epidemeology Anomaly Detection in Climate and Weather Anomalies in Climate Validation of Anomalies
Discussion Typical Characteristics of Anomaly
Most Anomalies induce a change in distributionalaspects of packet header fields (called features)
Most important features include 5-tuple Source ampdestination IP addresses Source and destination portnumbers and IP protocol
raquo DOS attack ndash multiple source IP address concentrated on asingle destination IP address
raquo Network scan ndash dispersed distribution of destination addresses
raquo Most wormsviruses also induce some change in distribution ofcertain features
raquo However these changes can be very subtle and mining them islike searching for needles in a haystack
Unlike many previous approach this paper aims todetect events which disturb the distribution of trafficfeatures rather than traffic volume
Chawla and Chandola Anomaly Detection
Introduction Data Mining Methods Density-based anomaly Commute Time Approach Addressing Scalability Anomalies in Complex Data Evaluating Anomaly Detection Methods Applications Problem solutionsPCA and Subspace Method Subspace Method Algorithm Subspace Analysis Results Discussion Typical Characteristics of Anomaly Limitation of Volume Entropy Based versus Volume Based Fraud Detection Epidemeology Anomaly Detection in Climate and Weather Anomalies in Climate Validation of Anomalies
Limitation of Volume
Figure source [22]
Port scan anomaly (traffic feature changes however traffic volume
remains more or less the same)
We can use entropy tocapture the variationsin the traffic feature
bullTakes value 0 when distribution is maximally concentratedbullTakes value log2N when distribution is maximally dispersed
But stands out in
feature entropy
which also reveals
its structure
Port scan
dwarfed
in volume
metricshellip
Chawla and Chandola Anomaly Detection
Introduction Data Mining Methods Density-based anomaly Commute Time Approach Addressing Scalability Anomalies in Complex Data Evaluating Anomaly Detection Methods Applications Problem solutionsPCA and Subspace Method Subspace Method Algorithm Subspace Analysis Results Discussion Typical Characteristics of Anomaly Limitation of Volume Entropy Based versus Volume Based Fraud Detection Epidemeology Anomaly Detection in Climate and Weather Anomalies in Climate Validation of Anomalies
Entropy Based versus Volume Based
DoSDDoS Attacks- a spike in traffic data toward adominant destination IP
Scan anomaly-a spike in traffic data from a dominant sourceIP
Flash Crowd anomaly- again a spike in traffic data to adominant destination IP
Worm anomaly-a Spike in traffic with a dominant port
Chawla and Chandola Anomaly Detection
Introduction Data Mining Methods Density-based anomaly Commute Time Approach Addressing Scalability Anomalies in Complex Data Evaluating Anomaly Detection Methods Applications Problem solutionsPCA and Subspace Method Subspace Method Algorithm Subspace Analysis Results Discussion Typical Characteristics of Anomaly Limitation of Volume Entropy Based versus Volume Based Fraud Detection Epidemeology Anomaly Detection in Climate and Weather Anomalies in Climate Validation of Anomalies
Fraud Detection
Domain Question Identifyfraudulent activities or players fromobserved transaction data
Data Transactions between different
players in the system Meta information about the
individuals An underlying graph structure
Challenges Track and model human behavior Anomalies caused by adaptive
human adversaries Massive data sizes
Insurance (autohealtha)
ClaimantProvider Payer
Telecommunications Customer
Provider
Credit Cards Customer
Supplier Bank
Web Advertising User Advertiser
Publisher
ahttpwwwcheatingculturecompast-cases-of-medicare-fraud
Chawla and Chandola Anomaly Detection
Introduction Data Mining Methods Density-based anomaly Commute Time Approach Addressing Scalability Anomalies in Complex Data Evaluating Anomaly Detection Methods Applications Problem solutionsPCA and Subspace Method Subspace Method Algorithm Subspace Analysis Results Discussion Typical Characteristics of Anomaly Limitation of Volume Entropy Based versus Volume Based Fraud Detection Epidemeology Anomaly Detection in Climate and Weather Anomalies in Climate Validation of Anomalies
A Generic Fraud Detection Method
Activity Monitoring [13]1 Build profiles for individuals (customers users etc) based on
historic data User X makes n calls on an average in January
2 Compare current behavior with historical profile for significantdeviations
Clustering based [4]1 Cluster historical profiles of customers2 Identify small clusters or outlying profiles as anomalies
Strengths Anomaly detection is fast (good for real time) Results are easy to explain
Weaknesses Need to create and maintain a large number of profiles Not dynamic Adequate historical data might not be available Too many false positives
Chawla and Chandola Anomaly Detection
Introduction Data Mining Methods Density-based anomaly Commute Time Approach Addressing Scalability Anomalies in Complex Data Evaluating Anomaly Detection Methods Applications Problem solutionsPCA and Subspace Method Subspace Method Algorithm Subspace Analysis Results Discussion Typical Characteristics of Anomaly Limitation of Volume Entropy Based versus Volume Based Fraud Detection Epidemeology Anomaly Detection in Climate and Weather Anomalies in Climate Validation of Anomalies
Exploiting Graph Structure - Weighted Graphs
Represent data as a weighted graph Communication networks (phone email SMS) Provider referral networks
Objective Identify anomalous nodes
For each node extract several features based on the propertiesof the induced sub-graph (egonet) of neighboring nodes [1]
Choose features that can highlight anomalous nodes
1 Ni degree of node2 Ei number of edges in egonet3 Wi total weight of egonet4 λi principal eigen vector of weighted adjacency matrix of
egonet
Data is transformed into a point in a multi-dimensional space
Chawla and Chandola Anomaly Detection
Introduction Data Mining Methods Density-based anomaly Commute Time Approach Addressing Scalability Anomalies in Complex Data Evaluating Anomaly Detection Methods Applications Problem solutionsPCA and Subspace Method Subspace Method Algorithm Subspace Analysis Results Discussion Typical Characteristics of Anomaly Limitation of Volume Entropy Based versus Volume Based Fraud Detection Epidemeology Anomaly Detection in Climate and Weather Anomalies in Climate Validation of Anomalies
Identifying Anomalies
Traditional anomaly detection (lof) Can be slow but can identify any type of anomalous structure
Faster method to identify specific types of anomalousstructures
Identify relevant feature pairs and power law relationship
Eg Egonet Density Power Law Ni vs Ei - detect nearcliques and stars
Ei prop Nαi 1 le α le 2
Anomaly score for node i wrt a pair of features (y = Cxθ)
Si =max(yi Cx
θi )
min(yi Cxθi )lowast log (|yi minus Cxθi |+ 1)
Chawla and Chandola Anomaly Detection
Introduction Data Mining Methods Density-based anomaly Commute Time Approach Addressing Scalability Anomalies in Complex Data Evaluating Anomaly Detection Methods Applications Problem solutionsPCA and Subspace Method Subspace Method Algorithm Subspace Analysis Results Discussion Typical Characteristics of Anomaly Limitation of Volume Entropy Based versus Volume Based Fraud Detection Epidemeology Anomaly Detection in Climate and Weather Anomalies in Climate Validation of Anomalies
Exploiting Graph Structure - Bipartite Graphs
Represent data as a bipartite graph Healthcare Data (Beneficiaries vs Providers) Insider trading (Traders vs Stocks)
Objective Identify anomalous links
Given a query node a isin V1 find the ldquorelevancerdquoof all other nodes in V1 to a
RelevanceScore(a b) prop Number of times aldquorandom walkrdquo from a reaches b
Use the relevance scores to compute thenormality scores for a node t isin V2
Find set St = a|〈a t〉 isin E Compute |St| times |St| similarity matrix using
relevance vectors for a isin St Normality Score = mean of non-diagonal entries
of similarity matrix
V1 E V2a1
a2
a3
an
t1
t2
t3
tn
Chawla and Chandola Anomaly Detection
Introduction Data Mining Methods Density-based anomaly Commute Time Approach Addressing Scalability Anomalies in Complex Data Evaluating Anomaly Detection Methods Applications Problem solutionsPCA and Subspace Method Subspace Method Algorithm Subspace Analysis Results Discussion Typical Characteristics of Anomaly Limitation of Volume Entropy Based versus Volume Based Fraud Detection Epidemeology Anomaly Detection in Climate and Weather Anomalies in Climate Validation of Anomalies
Detecting Disease Outbreaks
Domain Question Early detection of disease
outbreaks Anthrax attack
Data Emergency department visits Grocery data (Example [14]) Clinical visits Weatherclimate data
Challenges Weak signals in the data
ED cases involving cough rArrFlu or SARS
Integration of multiple signals(lag analysis)
Account for spatial and temporalcorrelations
Chawla and Chandola Anomaly Detection
Introduction Data Mining Methods Density-based anomaly Commute Time Approach Addressing Scalability Anomalies in Complex Data Evaluating Anomaly Detection Methods Applications Problem solutionsPCA and Subspace Method Subspace Method Algorithm Subspace Analysis Results Discussion Typical Characteristics of Anomaly Limitation of Volume Entropy Based versus Volume Based Fraud Detection Epidemeology Anomaly Detection in Climate and Weather Anomalies in Climate Validation of Anomalies
Whatrsquos Significant About Recent Events (WSARE) [33]
1 Learn Bayesian network from historical data Environmental and response variables
2 Sample from the BN (DBbaseline|Current Environment)3 Compute contingency table for rules for DBbaseline andDBcurrent
Rules are single assignment rules (Xi = Y ji ) or conjunctions4 Find p-value for rules using χ2-test
Null Hypothesis Rows and columns of tables for DBbaselineand DBcurrent are independent
5 Find rule with largest p-value Repeat Step 2
Chawla and Chandola Anomaly Detection
Introduction Data Mining Methods Density-based anomaly Commute Time Approach Addressing Scalability Anomalies in Complex Data Evaluating Anomaly Detection Methods Applications Problem solutionsPCA and Subspace Method Subspace Method Algorithm Subspace Analysis Results Discussion Typical Characteristics of Anomaly Limitation of Volume Entropy Based versus Volume Based Fraud Detection Epidemeology Anomaly Detection in Climate and Weather Anomalies in Climate Validation of Anomalies
Incorporating Spatial and Temporal Relationships
WSARE does not explicitly model the spatial and temporalrelationships
What happened yesterday What happened in the adjoining neighborhood (yesterday)
Bayesian Network Spatio-Temporal (BNST) modelingframework [17]
Add nodes for temporal and spatial dependencies Need more data to train
Chawla and Chandola Anomaly Detection
Introduction Data Mining Methods Density-based anomaly Commute Time Approach Addressing Scalability Anomalies in Complex Data Evaluating Anomaly Detection Methods Applications Problem solutionsPCA and Subspace Method Subspace Method Algorithm Subspace Analysis Results Discussion Typical Characteristics of Anomaly Limitation of Volume Entropy Based versus Volume Based Fraud Detection Epidemeology Anomaly Detection in Climate and Weather Anomalies in Climate Validation of Anomalies
Anomaly Detection in Climate and Weather
Science Questions Identify natural and anthropogenic disasters Identify long time scale events - droughts atmospheric rivers
cold fronts etc
Data Ground observations Remote sensing data (satellites
air-borne) Climate model simulation outputs Multiple variables spatio-temporal (often has height dimension
as well)
Challenges Model spatio-temporal relationships across multiple variables Explain the cause of anomalies Massive data sizes
Climate and weather extreme events are well defined
Key challenge is to find significant events and explain the cause
Chawla and Chandola Anomaly Detection
Introduction Data Mining Methods Density-based anomaly Commute Time Approach Addressing Scalability Anomalies in Complex Data Evaluating Anomaly Detection Methods Applications Problem solutionsPCA and Subspace Method Subspace Method Algorithm Subspace Analysis Results Discussion Typical Characteristics of Anomaly Limitation of Volume Entropy Based versus Volume Based Fraud Detection Epidemeology Anomaly Detection in Climate and Weather Anomalies in Climate Validation of Anomalies
Anomalies are Widely Used in Climate
Most analysis done on ldquoanomalyrdquo time series
Difference from a ldquobase periodrdquo (Toosimplistic)
Brings spatial smoothness (eg a mountaintop and nearby valley can have very differenttemperatures) Removes seasonality
Understand climate and weatherphenomenon
Southern Oscillation Index (SOI) Difference between Sea Level Pressure
(SLP) anomalies for Tahiti and DarwinAustralia
Figure Global AverageTemperature Anomaly(1975 - 2007) Srcwwwmetofficegovuk
Chawla and Chandola Anomaly Detection
Introduction Data Mining Methods Density-based anomaly Commute Time Approach Addressing Scalability Anomalies in Complex Data Evaluating Anomaly Detection Methods Applications Problem solutionsPCA and Subspace Method Subspace Method Algorithm Subspace Analysis Results Discussion Typical Characteristics of Anomaly Limitation of Volume Entropy Based versus Volume Based Fraud Detection Epidemeology Anomaly Detection in Climate and Weather Anomalies in Climate Validation of Anomalies
Constructing Anomalies from Raw Data
Anomaly time series for a given location i
vprimei = vi minus bi
where bi is the base (reference)
How to choose bi Mean of all data for location i Monthly mean values (account for seasonality) Monthly z-score values Median (more robust) Using a shorter ldquoreference periodrdquo
30 year moving window
Different methods show statistically significant differences[19] What is the right strategy Weighted mean of different strategies (Pick weights using
Monte Carlo sampling)
Chawla and Chandola Anomaly Detection
Introduction Data Mining Methods Density-based anomaly Commute Time Approach Addressing Scalability Anomalies in Complex Data Evaluating Anomaly Detection Methods Applications Problem solutionsPCA and Subspace Method Subspace Method Algorithm Subspace Analysis Results Discussion Typical Characteristics of Anomaly Limitation of Volume Entropy Based versus Volume Based Fraud Detection Epidemeology Anomaly Detection in Climate and Weather Anomalies in Climate Validation of Anomalies
Anomaly Detection for Identifying Droughts
Science question Identify significant drought patterns usinghistorical observation data or future simulation data or both
Find persistent spatiotemporal anomalies in precipitation data
A two step approach
1 Find precipitationanomalies usingthresholds
2 Find large connectedcomponents across spaceand time
Matlab - bwlabelbwlabeln
Followup Science questionExplain cause
(drought190120061avi)
Figure Video courtsey Dr ArindamBanerjee
Chawla and Chandola Anomaly Detection
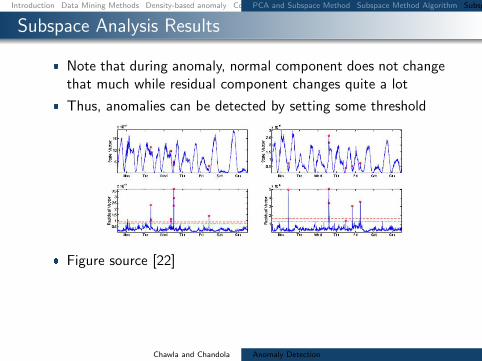
Introduction Data Mining Methods Density-based anomaly Commute Time Approach Addressing Scalability Anomalies in Complex Data Evaluating Anomaly Detection Methods Applications Problem solutionsPCA and Subspace Method Subspace Method Algorithm Subspace Analysis Results Discussion Typical Characteristics of Anomaly Limitation of Volume Entropy Based versus Volume Based Fraud Detection Epidemeology Anomaly Detection in Climate and Weather Anomalies in Climate Validation of Anomalies
Subspace Analysis Results
Note that during anomaly normal component does not changethat much while residual component changes quite a lot
Thus anomalies can be detected by setting some threshold
Figure source [22]
Chawla and Chandola Anomaly Detection
Introduction Data Mining Methods Density-based anomaly Commute Time Approach Addressing Scalability Anomalies in Complex Data Evaluating Anomaly Detection Methods Applications Problem solutionsPCA and Subspace Method Subspace Method Algorithm Subspace Analysis Results Discussion Typical Characteristics of Anomaly Limitation of Volume Entropy Based versus Volume Based Fraud Detection Epidemeology Anomaly Detection in Climate and Weather Anomalies in Climate Validation of Anomalies
Discussion Typical Characteristics of Anomaly
Most Anomalies induce a change in distributionalaspects of packet header fields (called features)
Most important features include 5-tuple Source ampdestination IP addresses Source and destination portnumbers and IP protocol
raquo DOS attack ndash multiple source IP address concentrated on asingle destination IP address
raquo Network scan ndash dispersed distribution of destination addresses
raquo Most wormsviruses also induce some change in distribution ofcertain features
raquo However these changes can be very subtle and mining them islike searching for needles in a haystack
Unlike many previous approach this paper aims todetect events which disturb the distribution of trafficfeatures rather than traffic volume
Chawla and Chandola Anomaly Detection
Introduction Data Mining Methods Density-based anomaly Commute Time Approach Addressing Scalability Anomalies in Complex Data Evaluating Anomaly Detection Methods Applications Problem solutionsPCA and Subspace Method Subspace Method Algorithm Subspace Analysis Results Discussion Typical Characteristics of Anomaly Limitation of Volume Entropy Based versus Volume Based Fraud Detection Epidemeology Anomaly Detection in Climate and Weather Anomalies in Climate Validation of Anomalies
Limitation of Volume
Figure source [22]
Port scan anomaly (traffic feature changes however traffic volume
remains more or less the same)
We can use entropy tocapture the variationsin the traffic feature
bullTakes value 0 when distribution is maximally concentratedbullTakes value log2N when distribution is maximally dispersed
But stands out in
feature entropy
which also reveals
its structure
Port scan
dwarfed
in volume
metricshellip
Chawla and Chandola Anomaly Detection
Introduction Data Mining Methods Density-based anomaly Commute Time Approach Addressing Scalability Anomalies in Complex Data Evaluating Anomaly Detection Methods Applications Problem solutionsPCA and Subspace Method Subspace Method Algorithm Subspace Analysis Results Discussion Typical Characteristics of Anomaly Limitation of Volume Entropy Based versus Volume Based Fraud Detection Epidemeology Anomaly Detection in Climate and Weather Anomalies in Climate Validation of Anomalies
Entropy Based versus Volume Based
DoSDDoS Attacks- a spike in traffic data toward adominant destination IP
Scan anomaly-a spike in traffic data from a dominant sourceIP
Flash Crowd anomaly- again a spike in traffic data to adominant destination IP
Worm anomaly-a Spike in traffic with a dominant port
Chawla and Chandola Anomaly Detection
Introduction Data Mining Methods Density-based anomaly Commute Time Approach Addressing Scalability Anomalies in Complex Data Evaluating Anomaly Detection Methods Applications Problem solutionsPCA and Subspace Method Subspace Method Algorithm Subspace Analysis Results Discussion Typical Characteristics of Anomaly Limitation of Volume Entropy Based versus Volume Based Fraud Detection Epidemeology Anomaly Detection in Climate and Weather Anomalies in Climate Validation of Anomalies
Fraud Detection
Domain Question Identifyfraudulent activities or players fromobserved transaction data
Data Transactions between different
players in the system Meta information about the
individuals An underlying graph structure
Challenges Track and model human behavior Anomalies caused by adaptive
human adversaries Massive data sizes
Insurance (autohealtha)
ClaimantProvider Payer
Telecommunications Customer
Provider
Credit Cards Customer
Supplier Bank
Web Advertising User Advertiser
Publisher
ahttpwwwcheatingculturecompast-cases-of-medicare-fraud
Chawla and Chandola Anomaly Detection
Introduction Data Mining Methods Density-based anomaly Commute Time Approach Addressing Scalability Anomalies in Complex Data Evaluating Anomaly Detection Methods Applications Problem solutionsPCA and Subspace Method Subspace Method Algorithm Subspace Analysis Results Discussion Typical Characteristics of Anomaly Limitation of Volume Entropy Based versus Volume Based Fraud Detection Epidemeology Anomaly Detection in Climate and Weather Anomalies in Climate Validation of Anomalies
A Generic Fraud Detection Method
Activity Monitoring [13]1 Build profiles for individuals (customers users etc) based on
historic data User X makes n calls on an average in January
2 Compare current behavior with historical profile for significantdeviations
Clustering based [4]1 Cluster historical profiles of customers2 Identify small clusters or outlying profiles as anomalies
Strengths Anomaly detection is fast (good for real time) Results are easy to explain
Weaknesses Need to create and maintain a large number of profiles Not dynamic Adequate historical data might not be available Too many false positives
Chawla and Chandola Anomaly Detection
Introduction Data Mining Methods Density-based anomaly Commute Time Approach Addressing Scalability Anomalies in Complex Data Evaluating Anomaly Detection Methods Applications Problem solutionsPCA and Subspace Method Subspace Method Algorithm Subspace Analysis Results Discussion Typical Characteristics of Anomaly Limitation of Volume Entropy Based versus Volume Based Fraud Detection Epidemeology Anomaly Detection in Climate and Weather Anomalies in Climate Validation of Anomalies
Exploiting Graph Structure - Weighted Graphs
Represent data as a weighted graph Communication networks (phone email SMS) Provider referral networks
Objective Identify anomalous nodes
For each node extract several features based on the propertiesof the induced sub-graph (egonet) of neighboring nodes [1]
Choose features that can highlight anomalous nodes
1 Ni degree of node2 Ei number of edges in egonet3 Wi total weight of egonet4 λi principal eigen vector of weighted adjacency matrix of
egonet
Data is transformed into a point in a multi-dimensional space
Chawla and Chandola Anomaly Detection
Introduction Data Mining Methods Density-based anomaly Commute Time Approach Addressing Scalability Anomalies in Complex Data Evaluating Anomaly Detection Methods Applications Problem solutionsPCA and Subspace Method Subspace Method Algorithm Subspace Analysis Results Discussion Typical Characteristics of Anomaly Limitation of Volume Entropy Based versus Volume Based Fraud Detection Epidemeology Anomaly Detection in Climate and Weather Anomalies in Climate Validation of Anomalies
Identifying Anomalies
Traditional anomaly detection (lof) Can be slow but can identify any type of anomalous structure
Faster method to identify specific types of anomalousstructures
Identify relevant feature pairs and power law relationship
Eg Egonet Density Power Law Ni vs Ei - detect nearcliques and stars
Ei prop Nαi 1 le α le 2
Anomaly score for node i wrt a pair of features (y = Cxθ)
Si =max(yi Cx
θi )
min(yi Cxθi )lowast log (|yi minus Cxθi |+ 1)
Chawla and Chandola Anomaly Detection
Introduction Data Mining Methods Density-based anomaly Commute Time Approach Addressing Scalability Anomalies in Complex Data Evaluating Anomaly Detection Methods Applications Problem solutionsPCA and Subspace Method Subspace Method Algorithm Subspace Analysis Results Discussion Typical Characteristics of Anomaly Limitation of Volume Entropy Based versus Volume Based Fraud Detection Epidemeology Anomaly Detection in Climate and Weather Anomalies in Climate Validation of Anomalies
Exploiting Graph Structure - Bipartite Graphs
Represent data as a bipartite graph Healthcare Data (Beneficiaries vs Providers) Insider trading (Traders vs Stocks)
Objective Identify anomalous links
Given a query node a isin V1 find the ldquorelevancerdquoof all other nodes in V1 to a
RelevanceScore(a b) prop Number of times aldquorandom walkrdquo from a reaches b
Use the relevance scores to compute thenormality scores for a node t isin V2
Find set St = a|〈a t〉 isin E Compute |St| times |St| similarity matrix using
relevance vectors for a isin St Normality Score = mean of non-diagonal entries
of similarity matrix
V1 E V2a1
a2
a3
an
t1
t2
t3
tn
Chawla and Chandola Anomaly Detection
Introduction Data Mining Methods Density-based anomaly Commute Time Approach Addressing Scalability Anomalies in Complex Data Evaluating Anomaly Detection Methods Applications Problem solutionsPCA and Subspace Method Subspace Method Algorithm Subspace Analysis Results Discussion Typical Characteristics of Anomaly Limitation of Volume Entropy Based versus Volume Based Fraud Detection Epidemeology Anomaly Detection in Climate and Weather Anomalies in Climate Validation of Anomalies
Detecting Disease Outbreaks
Domain Question Early detection of disease
outbreaks Anthrax attack
Data Emergency department visits Grocery data (Example [14]) Clinical visits Weatherclimate data
Challenges Weak signals in the data
ED cases involving cough rArrFlu or SARS
Integration of multiple signals(lag analysis)
Account for spatial and temporalcorrelations
Chawla and Chandola Anomaly Detection
Introduction Data Mining Methods Density-based anomaly Commute Time Approach Addressing Scalability Anomalies in Complex Data Evaluating Anomaly Detection Methods Applications Problem solutionsPCA and Subspace Method Subspace Method Algorithm Subspace Analysis Results Discussion Typical Characteristics of Anomaly Limitation of Volume Entropy Based versus Volume Based Fraud Detection Epidemeology Anomaly Detection in Climate and Weather Anomalies in Climate Validation of Anomalies
Whatrsquos Significant About Recent Events (WSARE) [33]
1 Learn Bayesian network from historical data Environmental and response variables
2 Sample from the BN (DBbaseline|Current Environment)3 Compute contingency table for rules for DBbaseline andDBcurrent
Rules are single assignment rules (Xi = Y ji ) or conjunctions4 Find p-value for rules using χ2-test
Null Hypothesis Rows and columns of tables for DBbaselineand DBcurrent are independent
5 Find rule with largest p-value Repeat Step 2
Chawla and Chandola Anomaly Detection
Introduction Data Mining Methods Density-based anomaly Commute Time Approach Addressing Scalability Anomalies in Complex Data Evaluating Anomaly Detection Methods Applications Problem solutionsPCA and Subspace Method Subspace Method Algorithm Subspace Analysis Results Discussion Typical Characteristics of Anomaly Limitation of Volume Entropy Based versus Volume Based Fraud Detection Epidemeology Anomaly Detection in Climate and Weather Anomalies in Climate Validation of Anomalies
Incorporating Spatial and Temporal Relationships
WSARE does not explicitly model the spatial and temporalrelationships
What happened yesterday What happened in the adjoining neighborhood (yesterday)
Bayesian Network Spatio-Temporal (BNST) modelingframework [17]
Add nodes for temporal and spatial dependencies Need more data to train
Chawla and Chandola Anomaly Detection
Introduction Data Mining Methods Density-based anomaly Commute Time Approach Addressing Scalability Anomalies in Complex Data Evaluating Anomaly Detection Methods Applications Problem solutionsPCA and Subspace Method Subspace Method Algorithm Subspace Analysis Results Discussion Typical Characteristics of Anomaly Limitation of Volume Entropy Based versus Volume Based Fraud Detection Epidemeology Anomaly Detection in Climate and Weather Anomalies in Climate Validation of Anomalies
Anomaly Detection in Climate and Weather
Science Questions Identify natural and anthropogenic disasters Identify long time scale events - droughts atmospheric rivers
cold fronts etc
Data Ground observations Remote sensing data (satellites
air-borne) Climate model simulation outputs Multiple variables spatio-temporal (often has height dimension
as well)
Challenges Model spatio-temporal relationships across multiple variables Explain the cause of anomalies Massive data sizes
Climate and weather extreme events are well defined
Key challenge is to find significant events and explain the cause
Chawla and Chandola Anomaly Detection
Introduction Data Mining Methods Density-based anomaly Commute Time Approach Addressing Scalability Anomalies in Complex Data Evaluating Anomaly Detection Methods Applications Problem solutionsPCA and Subspace Method Subspace Method Algorithm Subspace Analysis Results Discussion Typical Characteristics of Anomaly Limitation of Volume Entropy Based versus Volume Based Fraud Detection Epidemeology Anomaly Detection in Climate and Weather Anomalies in Climate Validation of Anomalies
Anomalies are Widely Used in Climate
Most analysis done on ldquoanomalyrdquo time series
Difference from a ldquobase periodrdquo (Toosimplistic)
Brings spatial smoothness (eg a mountaintop and nearby valley can have very differenttemperatures) Removes seasonality
Understand climate and weatherphenomenon
Southern Oscillation Index (SOI) Difference between Sea Level Pressure
(SLP) anomalies for Tahiti and DarwinAustralia
Figure Global AverageTemperature Anomaly(1975 - 2007) Srcwwwmetofficegovuk
Chawla and Chandola Anomaly Detection
Introduction Data Mining Methods Density-based anomaly Commute Time Approach Addressing Scalability Anomalies in Complex Data Evaluating Anomaly Detection Methods Applications Problem solutionsPCA and Subspace Method Subspace Method Algorithm Subspace Analysis Results Discussion Typical Characteristics of Anomaly Limitation of Volume Entropy Based versus Volume Based Fraud Detection Epidemeology Anomaly Detection in Climate and Weather Anomalies in Climate Validation of Anomalies
Constructing Anomalies from Raw Data
Anomaly time series for a given location i
vprimei = vi minus bi
where bi is the base (reference)
How to choose bi Mean of all data for location i Monthly mean values (account for seasonality) Monthly z-score values Median (more robust) Using a shorter ldquoreference periodrdquo
30 year moving window
Different methods show statistically significant differences[19] What is the right strategy Weighted mean of different strategies (Pick weights using
Monte Carlo sampling)
Chawla and Chandola Anomaly Detection
Introduction Data Mining Methods Density-based anomaly Commute Time Approach Addressing Scalability Anomalies in Complex Data Evaluating Anomaly Detection Methods Applications Problem solutionsPCA and Subspace Method Subspace Method Algorithm Subspace Analysis Results Discussion Typical Characteristics of Anomaly Limitation of Volume Entropy Based versus Volume Based Fraud Detection Epidemeology Anomaly Detection in Climate and Weather Anomalies in Climate Validation of Anomalies
Anomaly Detection for Identifying Droughts
Science question Identify significant drought patterns usinghistorical observation data or future simulation data or both
Find persistent spatiotemporal anomalies in precipitation data
A two step approach
1 Find precipitationanomalies usingthresholds
2 Find large connectedcomponents across spaceand time
Matlab - bwlabelbwlabeln
Followup Science questionExplain cause
(drought190120061avi)
Figure Video courtsey Dr ArindamBanerjee
Chawla and Chandola Anomaly Detection
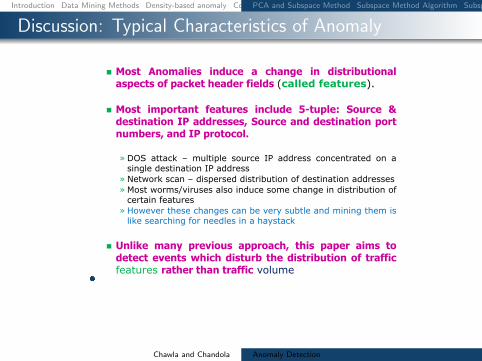
Introduction Data Mining Methods Density-based anomaly Commute Time Approach Addressing Scalability Anomalies in Complex Data Evaluating Anomaly Detection Methods Applications Problem solutionsPCA and Subspace Method Subspace Method Algorithm Subspace Analysis Results Discussion Typical Characteristics of Anomaly Limitation of Volume Entropy Based versus Volume Based Fraud Detection Epidemeology Anomaly Detection in Climate and Weather Anomalies in Climate Validation of Anomalies
Discussion Typical Characteristics of Anomaly
Most Anomalies induce a change in distributionalaspects of packet header fields (called features)
Most important features include 5-tuple Source ampdestination IP addresses Source and destination portnumbers and IP protocol
raquo DOS attack ndash multiple source IP address concentrated on asingle destination IP address
raquo Network scan ndash dispersed distribution of destination addresses
raquo Most wormsviruses also induce some change in distribution ofcertain features
raquo However these changes can be very subtle and mining them islike searching for needles in a haystack
Unlike many previous approach this paper aims todetect events which disturb the distribution of trafficfeatures rather than traffic volume
Chawla and Chandola Anomaly Detection
Introduction Data Mining Methods Density-based anomaly Commute Time Approach Addressing Scalability Anomalies in Complex Data Evaluating Anomaly Detection Methods Applications Problem solutionsPCA and Subspace Method Subspace Method Algorithm Subspace Analysis Results Discussion Typical Characteristics of Anomaly Limitation of Volume Entropy Based versus Volume Based Fraud Detection Epidemeology Anomaly Detection in Climate and Weather Anomalies in Climate Validation of Anomalies
Limitation of Volume
Figure source [22]
Port scan anomaly (traffic feature changes however traffic volume
remains more or less the same)
We can use entropy tocapture the variationsin the traffic feature
bullTakes value 0 when distribution is maximally concentratedbullTakes value log2N when distribution is maximally dispersed
But stands out in
feature entropy
which also reveals
its structure
Port scan
dwarfed
in volume
metricshellip
Chawla and Chandola Anomaly Detection
Introduction Data Mining Methods Density-based anomaly Commute Time Approach Addressing Scalability Anomalies in Complex Data Evaluating Anomaly Detection Methods Applications Problem solutionsPCA and Subspace Method Subspace Method Algorithm Subspace Analysis Results Discussion Typical Characteristics of Anomaly Limitation of Volume Entropy Based versus Volume Based Fraud Detection Epidemeology Anomaly Detection in Climate and Weather Anomalies in Climate Validation of Anomalies
Entropy Based versus Volume Based
DoSDDoS Attacks- a spike in traffic data toward adominant destination IP
Scan anomaly-a spike in traffic data from a dominant sourceIP
Flash Crowd anomaly- again a spike in traffic data to adominant destination IP
Worm anomaly-a Spike in traffic with a dominant port
Chawla and Chandola Anomaly Detection
Introduction Data Mining Methods Density-based anomaly Commute Time Approach Addressing Scalability Anomalies in Complex Data Evaluating Anomaly Detection Methods Applications Problem solutionsPCA and Subspace Method Subspace Method Algorithm Subspace Analysis Results Discussion Typical Characteristics of Anomaly Limitation of Volume Entropy Based versus Volume Based Fraud Detection Epidemeology Anomaly Detection in Climate and Weather Anomalies in Climate Validation of Anomalies
Fraud Detection
Domain Question Identifyfraudulent activities or players fromobserved transaction data
Data Transactions between different
players in the system Meta information about the
individuals An underlying graph structure
Challenges Track and model human behavior Anomalies caused by adaptive
human adversaries Massive data sizes
Insurance (autohealtha)
ClaimantProvider Payer
Telecommunications Customer
Provider
Credit Cards Customer
Supplier Bank
Web Advertising User Advertiser
Publisher
ahttpwwwcheatingculturecompast-cases-of-medicare-fraud
Chawla and Chandola Anomaly Detection
Introduction Data Mining Methods Density-based anomaly Commute Time Approach Addressing Scalability Anomalies in Complex Data Evaluating Anomaly Detection Methods Applications Problem solutionsPCA and Subspace Method Subspace Method Algorithm Subspace Analysis Results Discussion Typical Characteristics of Anomaly Limitation of Volume Entropy Based versus Volume Based Fraud Detection Epidemeology Anomaly Detection in Climate and Weather Anomalies in Climate Validation of Anomalies
A Generic Fraud Detection Method
Activity Monitoring [13]1 Build profiles for individuals (customers users etc) based on
historic data User X makes n calls on an average in January
2 Compare current behavior with historical profile for significantdeviations
Clustering based [4]1 Cluster historical profiles of customers2 Identify small clusters or outlying profiles as anomalies
Strengths Anomaly detection is fast (good for real time) Results are easy to explain
Weaknesses Need to create and maintain a large number of profiles Not dynamic Adequate historical data might not be available Too many false positives
Chawla and Chandola Anomaly Detection
Introduction Data Mining Methods Density-based anomaly Commute Time Approach Addressing Scalability Anomalies in Complex Data Evaluating Anomaly Detection Methods Applications Problem solutionsPCA and Subspace Method Subspace Method Algorithm Subspace Analysis Results Discussion Typical Characteristics of Anomaly Limitation of Volume Entropy Based versus Volume Based Fraud Detection Epidemeology Anomaly Detection in Climate and Weather Anomalies in Climate Validation of Anomalies
Exploiting Graph Structure - Weighted Graphs
Represent data as a weighted graph Communication networks (phone email SMS) Provider referral networks
Objective Identify anomalous nodes
For each node extract several features based on the propertiesof the induced sub-graph (egonet) of neighboring nodes [1]
Choose features that can highlight anomalous nodes
1 Ni degree of node2 Ei number of edges in egonet3 Wi total weight of egonet4 λi principal eigen vector of weighted adjacency matrix of
egonet
Data is transformed into a point in a multi-dimensional space
Chawla and Chandola Anomaly Detection
Introduction Data Mining Methods Density-based anomaly Commute Time Approach Addressing Scalability Anomalies in Complex Data Evaluating Anomaly Detection Methods Applications Problem solutionsPCA and Subspace Method Subspace Method Algorithm Subspace Analysis Results Discussion Typical Characteristics of Anomaly Limitation of Volume Entropy Based versus Volume Based Fraud Detection Epidemeology Anomaly Detection in Climate and Weather Anomalies in Climate Validation of Anomalies
Identifying Anomalies
Traditional anomaly detection (lof) Can be slow but can identify any type of anomalous structure
Faster method to identify specific types of anomalousstructures
Identify relevant feature pairs and power law relationship
Eg Egonet Density Power Law Ni vs Ei - detect nearcliques and stars
Ei prop Nαi 1 le α le 2
Anomaly score for node i wrt a pair of features (y = Cxθ)
Si =max(yi Cx
θi )
min(yi Cxθi )lowast log (|yi minus Cxθi |+ 1)
Chawla and Chandola Anomaly Detection
Introduction Data Mining Methods Density-based anomaly Commute Time Approach Addressing Scalability Anomalies in Complex Data Evaluating Anomaly Detection Methods Applications Problem solutionsPCA and Subspace Method Subspace Method Algorithm Subspace Analysis Results Discussion Typical Characteristics of Anomaly Limitation of Volume Entropy Based versus Volume Based Fraud Detection Epidemeology Anomaly Detection in Climate and Weather Anomalies in Climate Validation of Anomalies
Exploiting Graph Structure - Bipartite Graphs
Represent data as a bipartite graph Healthcare Data (Beneficiaries vs Providers) Insider trading (Traders vs Stocks)
Objective Identify anomalous links
Given a query node a isin V1 find the ldquorelevancerdquoof all other nodes in V1 to a
RelevanceScore(a b) prop Number of times aldquorandom walkrdquo from a reaches b
Use the relevance scores to compute thenormality scores for a node t isin V2
Find set St = a|〈a t〉 isin E Compute |St| times |St| similarity matrix using
relevance vectors for a isin St Normality Score = mean of non-diagonal entries
of similarity matrix
V1 E V2a1
a2
a3
an
t1
t2
t3
tn
Chawla and Chandola Anomaly Detection
Introduction Data Mining Methods Density-based anomaly Commute Time Approach Addressing Scalability Anomalies in Complex Data Evaluating Anomaly Detection Methods Applications Problem solutionsPCA and Subspace Method Subspace Method Algorithm Subspace Analysis Results Discussion Typical Characteristics of Anomaly Limitation of Volume Entropy Based versus Volume Based Fraud Detection Epidemeology Anomaly Detection in Climate and Weather Anomalies in Climate Validation of Anomalies
Detecting Disease Outbreaks
Domain Question Early detection of disease
outbreaks Anthrax attack
Data Emergency department visits Grocery data (Example [14]) Clinical visits Weatherclimate data
Challenges Weak signals in the data
ED cases involving cough rArrFlu or SARS
Integration of multiple signals(lag analysis)
Account for spatial and temporalcorrelations
Chawla and Chandola Anomaly Detection
Introduction Data Mining Methods Density-based anomaly Commute Time Approach Addressing Scalability Anomalies in Complex Data Evaluating Anomaly Detection Methods Applications Problem solutionsPCA and Subspace Method Subspace Method Algorithm Subspace Analysis Results Discussion Typical Characteristics of Anomaly Limitation of Volume Entropy Based versus Volume Based Fraud Detection Epidemeology Anomaly Detection in Climate and Weather Anomalies in Climate Validation of Anomalies
Whatrsquos Significant About Recent Events (WSARE) [33]
1 Learn Bayesian network from historical data Environmental and response variables
2 Sample from the BN (DBbaseline|Current Environment)3 Compute contingency table for rules for DBbaseline andDBcurrent
Rules are single assignment rules (Xi = Y ji ) or conjunctions4 Find p-value for rules using χ2-test
Null Hypothesis Rows and columns of tables for DBbaselineand DBcurrent are independent
5 Find rule with largest p-value Repeat Step 2
Chawla and Chandola Anomaly Detection
Introduction Data Mining Methods Density-based anomaly Commute Time Approach Addressing Scalability Anomalies in Complex Data Evaluating Anomaly Detection Methods Applications Problem solutionsPCA and Subspace Method Subspace Method Algorithm Subspace Analysis Results Discussion Typical Characteristics of Anomaly Limitation of Volume Entropy Based versus Volume Based Fraud Detection Epidemeology Anomaly Detection in Climate and Weather Anomalies in Climate Validation of Anomalies
Incorporating Spatial and Temporal Relationships
WSARE does not explicitly model the spatial and temporalrelationships
What happened yesterday What happened in the adjoining neighborhood (yesterday)
Bayesian Network Spatio-Temporal (BNST) modelingframework [17]
Add nodes for temporal and spatial dependencies Need more data to train
Chawla and Chandola Anomaly Detection
Introduction Data Mining Methods Density-based anomaly Commute Time Approach Addressing Scalability Anomalies in Complex Data Evaluating Anomaly Detection Methods Applications Problem solutionsPCA and Subspace Method Subspace Method Algorithm Subspace Analysis Results Discussion Typical Characteristics of Anomaly Limitation of Volume Entropy Based versus Volume Based Fraud Detection Epidemeology Anomaly Detection in Climate and Weather Anomalies in Climate Validation of Anomalies
Anomaly Detection in Climate and Weather
Science Questions Identify natural and anthropogenic disasters Identify long time scale events - droughts atmospheric rivers
cold fronts etc
Data Ground observations Remote sensing data (satellites
air-borne) Climate model simulation outputs Multiple variables spatio-temporal (often has height dimension
as well)
Challenges Model spatio-temporal relationships across multiple variables Explain the cause of anomalies Massive data sizes
Climate and weather extreme events are well defined
Key challenge is to find significant events and explain the cause
Chawla and Chandola Anomaly Detection
Introduction Data Mining Methods Density-based anomaly Commute Time Approach Addressing Scalability Anomalies in Complex Data Evaluating Anomaly Detection Methods Applications Problem solutionsPCA and Subspace Method Subspace Method Algorithm Subspace Analysis Results Discussion Typical Characteristics of Anomaly Limitation of Volume Entropy Based versus Volume Based Fraud Detection Epidemeology Anomaly Detection in Climate and Weather Anomalies in Climate Validation of Anomalies
Anomalies are Widely Used in Climate
Most analysis done on ldquoanomalyrdquo time series
Difference from a ldquobase periodrdquo (Toosimplistic)
Brings spatial smoothness (eg a mountaintop and nearby valley can have very differenttemperatures) Removes seasonality
Understand climate and weatherphenomenon
Southern Oscillation Index (SOI) Difference between Sea Level Pressure
(SLP) anomalies for Tahiti and DarwinAustralia
Figure Global AverageTemperature Anomaly(1975 - 2007) Srcwwwmetofficegovuk
Chawla and Chandola Anomaly Detection
Introduction Data Mining Methods Density-based anomaly Commute Time Approach Addressing Scalability Anomalies in Complex Data Evaluating Anomaly Detection Methods Applications Problem solutionsPCA and Subspace Method Subspace Method Algorithm Subspace Analysis Results Discussion Typical Characteristics of Anomaly Limitation of Volume Entropy Based versus Volume Based Fraud Detection Epidemeology Anomaly Detection in Climate and Weather Anomalies in Climate Validation of Anomalies
Constructing Anomalies from Raw Data
Anomaly time series for a given location i
vprimei = vi minus bi
where bi is the base (reference)
How to choose bi Mean of all data for location i Monthly mean values (account for seasonality) Monthly z-score values Median (more robust) Using a shorter ldquoreference periodrdquo
30 year moving window
Different methods show statistically significant differences[19] What is the right strategy Weighted mean of different strategies (Pick weights using
Monte Carlo sampling)
Chawla and Chandola Anomaly Detection
Introduction Data Mining Methods Density-based anomaly Commute Time Approach Addressing Scalability Anomalies in Complex Data Evaluating Anomaly Detection Methods Applications Problem solutionsPCA and Subspace Method Subspace Method Algorithm Subspace Analysis Results Discussion Typical Characteristics of Anomaly Limitation of Volume Entropy Based versus Volume Based Fraud Detection Epidemeology Anomaly Detection in Climate and Weather Anomalies in Climate Validation of Anomalies
Anomaly Detection for Identifying Droughts
Science question Identify significant drought patterns usinghistorical observation data or future simulation data or both
Find persistent spatiotemporal anomalies in precipitation data
A two step approach
1 Find precipitationanomalies usingthresholds
2 Find large connectedcomponents across spaceand time
Matlab - bwlabelbwlabeln
Followup Science questionExplain cause
(drought190120061avi)
Figure Video courtsey Dr ArindamBanerjee
Chawla and Chandola Anomaly Detection
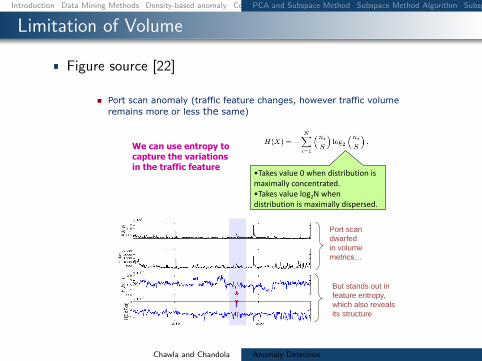
Introduction Data Mining Methods Density-based anomaly Commute Time Approach Addressing Scalability Anomalies in Complex Data Evaluating Anomaly Detection Methods Applications Problem solutionsPCA and Subspace Method Subspace Method Algorithm Subspace Analysis Results Discussion Typical Characteristics of Anomaly Limitation of Volume Entropy Based versus Volume Based Fraud Detection Epidemeology Anomaly Detection in Climate and Weather Anomalies in Climate Validation of Anomalies
Limitation of Volume
Figure source [22]
Port scan anomaly (traffic feature changes however traffic volume
remains more or less the same)
We can use entropy tocapture the variationsin the traffic feature
bullTakes value 0 when distribution is maximally concentratedbullTakes value log2N when distribution is maximally dispersed
But stands out in
feature entropy
which also reveals
its structure
Port scan
dwarfed
in volume
metricshellip
Chawla and Chandola Anomaly Detection
Introduction Data Mining Methods Density-based anomaly Commute Time Approach Addressing Scalability Anomalies in Complex Data Evaluating Anomaly Detection Methods Applications Problem solutionsPCA and Subspace Method Subspace Method Algorithm Subspace Analysis Results Discussion Typical Characteristics of Anomaly Limitation of Volume Entropy Based versus Volume Based Fraud Detection Epidemeology Anomaly Detection in Climate and Weather Anomalies in Climate Validation of Anomalies
Entropy Based versus Volume Based
DoSDDoS Attacks- a spike in traffic data toward adominant destination IP
Scan anomaly-a spike in traffic data from a dominant sourceIP
Flash Crowd anomaly- again a spike in traffic data to adominant destination IP
Worm anomaly-a Spike in traffic with a dominant port
Chawla and Chandola Anomaly Detection
Introduction Data Mining Methods Density-based anomaly Commute Time Approach Addressing Scalability Anomalies in Complex Data Evaluating Anomaly Detection Methods Applications Problem solutionsPCA and Subspace Method Subspace Method Algorithm Subspace Analysis Results Discussion Typical Characteristics of Anomaly Limitation of Volume Entropy Based versus Volume Based Fraud Detection Epidemeology Anomaly Detection in Climate and Weather Anomalies in Climate Validation of Anomalies
Fraud Detection
Domain Question Identifyfraudulent activities or players fromobserved transaction data
Data Transactions between different
players in the system Meta information about the
individuals An underlying graph structure
Challenges Track and model human behavior Anomalies caused by adaptive
human adversaries Massive data sizes
Insurance (autohealtha)
ClaimantProvider Payer
Telecommunications Customer
Provider
Credit Cards Customer
Supplier Bank
Web Advertising User Advertiser
Publisher
ahttpwwwcheatingculturecompast-cases-of-medicare-fraud
Chawla and Chandola Anomaly Detection
Introduction Data Mining Methods Density-based anomaly Commute Time Approach Addressing Scalability Anomalies in Complex Data Evaluating Anomaly Detection Methods Applications Problem solutionsPCA and Subspace Method Subspace Method Algorithm Subspace Analysis Results Discussion Typical Characteristics of Anomaly Limitation of Volume Entropy Based versus Volume Based Fraud Detection Epidemeology Anomaly Detection in Climate and Weather Anomalies in Climate Validation of Anomalies
A Generic Fraud Detection Method
Activity Monitoring [13]1 Build profiles for individuals (customers users etc) based on
historic data User X makes n calls on an average in January
2 Compare current behavior with historical profile for significantdeviations
Clustering based [4]1 Cluster historical profiles of customers2 Identify small clusters or outlying profiles as anomalies
Strengths Anomaly detection is fast (good for real time) Results are easy to explain
Weaknesses Need to create and maintain a large number of profiles Not dynamic Adequate historical data might not be available Too many false positives
Chawla and Chandola Anomaly Detection
Introduction Data Mining Methods Density-based anomaly Commute Time Approach Addressing Scalability Anomalies in Complex Data Evaluating Anomaly Detection Methods Applications Problem solutionsPCA and Subspace Method Subspace Method Algorithm Subspace Analysis Results Discussion Typical Characteristics of Anomaly Limitation of Volume Entropy Based versus Volume Based Fraud Detection Epidemeology Anomaly Detection in Climate and Weather Anomalies in Climate Validation of Anomalies
Exploiting Graph Structure - Weighted Graphs
Represent data as a weighted graph Communication networks (phone email SMS) Provider referral networks
Objective Identify anomalous nodes
For each node extract several features based on the propertiesof the induced sub-graph (egonet) of neighboring nodes [1]
Choose features that can highlight anomalous nodes
1 Ni degree of node2 Ei number of edges in egonet3 Wi total weight of egonet4 λi principal eigen vector of weighted adjacency matrix of
egonet
Data is transformed into a point in a multi-dimensional space
Chawla and Chandola Anomaly Detection
Introduction Data Mining Methods Density-based anomaly Commute Time Approach Addressing Scalability Anomalies in Complex Data Evaluating Anomaly Detection Methods Applications Problem solutionsPCA and Subspace Method Subspace Method Algorithm Subspace Analysis Results Discussion Typical Characteristics of Anomaly Limitation of Volume Entropy Based versus Volume Based Fraud Detection Epidemeology Anomaly Detection in Climate and Weather Anomalies in Climate Validation of Anomalies
Identifying Anomalies
Traditional anomaly detection (lof) Can be slow but can identify any type of anomalous structure
Faster method to identify specific types of anomalousstructures
Identify relevant feature pairs and power law relationship
Eg Egonet Density Power Law Ni vs Ei - detect nearcliques and stars
Ei prop Nαi 1 le α le 2
Anomaly score for node i wrt a pair of features (y = Cxθ)
Si =max(yi Cx
θi )
min(yi Cxθi )lowast log (|yi minus Cxθi |+ 1)
Chawla and Chandola Anomaly Detection
Introduction Data Mining Methods Density-based anomaly Commute Time Approach Addressing Scalability Anomalies in Complex Data Evaluating Anomaly Detection Methods Applications Problem solutionsPCA and Subspace Method Subspace Method Algorithm Subspace Analysis Results Discussion Typical Characteristics of Anomaly Limitation of Volume Entropy Based versus Volume Based Fraud Detection Epidemeology Anomaly Detection in Climate and Weather Anomalies in Climate Validation of Anomalies
Exploiting Graph Structure - Bipartite Graphs
Represent data as a bipartite graph Healthcare Data (Beneficiaries vs Providers) Insider trading (Traders vs Stocks)
Objective Identify anomalous links
Given a query node a isin V1 find the ldquorelevancerdquoof all other nodes in V1 to a
RelevanceScore(a b) prop Number of times aldquorandom walkrdquo from a reaches b
Use the relevance scores to compute thenormality scores for a node t isin V2
Find set St = a|〈a t〉 isin E Compute |St| times |St| similarity matrix using
relevance vectors for a isin St Normality Score = mean of non-diagonal entries
of similarity matrix
V1 E V2a1
a2
a3
an
t1
t2
t3
tn
Chawla and Chandola Anomaly Detection
Introduction Data Mining Methods Density-based anomaly Commute Time Approach Addressing Scalability Anomalies in Complex Data Evaluating Anomaly Detection Methods Applications Problem solutionsPCA and Subspace Method Subspace Method Algorithm Subspace Analysis Results Discussion Typical Characteristics of Anomaly Limitation of Volume Entropy Based versus Volume Based Fraud Detection Epidemeology Anomaly Detection in Climate and Weather Anomalies in Climate Validation of Anomalies
Detecting Disease Outbreaks
Domain Question Early detection of disease
outbreaks Anthrax attack
Data Emergency department visits Grocery data (Example [14]) Clinical visits Weatherclimate data
Challenges Weak signals in the data
ED cases involving cough rArrFlu or SARS
Integration of multiple signals(lag analysis)
Account for spatial and temporalcorrelations
Chawla and Chandola Anomaly Detection
Introduction Data Mining Methods Density-based anomaly Commute Time Approach Addressing Scalability Anomalies in Complex Data Evaluating Anomaly Detection Methods Applications Problem solutionsPCA and Subspace Method Subspace Method Algorithm Subspace Analysis Results Discussion Typical Characteristics of Anomaly Limitation of Volume Entropy Based versus Volume Based Fraud Detection Epidemeology Anomaly Detection in Climate and Weather Anomalies in Climate Validation of Anomalies
Whatrsquos Significant About Recent Events (WSARE) [33]
1 Learn Bayesian network from historical data Environmental and response variables
2 Sample from the BN (DBbaseline|Current Environment)3 Compute contingency table for rules for DBbaseline andDBcurrent
Rules are single assignment rules (Xi = Y ji ) or conjunctions4 Find p-value for rules using χ2-test
Null Hypothesis Rows and columns of tables for DBbaselineand DBcurrent are independent
5 Find rule with largest p-value Repeat Step 2
Chawla and Chandola Anomaly Detection
Introduction Data Mining Methods Density-based anomaly Commute Time Approach Addressing Scalability Anomalies in Complex Data Evaluating Anomaly Detection Methods Applications Problem solutionsPCA and Subspace Method Subspace Method Algorithm Subspace Analysis Results Discussion Typical Characteristics of Anomaly Limitation of Volume Entropy Based versus Volume Based Fraud Detection Epidemeology Anomaly Detection in Climate and Weather Anomalies in Climate Validation of Anomalies
Incorporating Spatial and Temporal Relationships
WSARE does not explicitly model the spatial and temporalrelationships
What happened yesterday What happened in the adjoining neighborhood (yesterday)
Bayesian Network Spatio-Temporal (BNST) modelingframework [17]
Add nodes for temporal and spatial dependencies Need more data to train
Chawla and Chandola Anomaly Detection
Introduction Data Mining Methods Density-based anomaly Commute Time Approach Addressing Scalability Anomalies in Complex Data Evaluating Anomaly Detection Methods Applications Problem solutionsPCA and Subspace Method Subspace Method Algorithm Subspace Analysis Results Discussion Typical Characteristics of Anomaly Limitation of Volume Entropy Based versus Volume Based Fraud Detection Epidemeology Anomaly Detection in Climate and Weather Anomalies in Climate Validation of Anomalies
Anomaly Detection in Climate and Weather
Science Questions Identify natural and anthropogenic disasters Identify long time scale events - droughts atmospheric rivers
cold fronts etc
Data Ground observations Remote sensing data (satellites
air-borne) Climate model simulation outputs Multiple variables spatio-temporal (often has height dimension
as well)
Challenges Model spatio-temporal relationships across multiple variables Explain the cause of anomalies Massive data sizes
Climate and weather extreme events are well defined
Key challenge is to find significant events and explain the cause
Chawla and Chandola Anomaly Detection
Introduction Data Mining Methods Density-based anomaly Commute Time Approach Addressing Scalability Anomalies in Complex Data Evaluating Anomaly Detection Methods Applications Problem solutionsPCA and Subspace Method Subspace Method Algorithm Subspace Analysis Results Discussion Typical Characteristics of Anomaly Limitation of Volume Entropy Based versus Volume Based Fraud Detection Epidemeology Anomaly Detection in Climate and Weather Anomalies in Climate Validation of Anomalies
Anomalies are Widely Used in Climate
Most analysis done on ldquoanomalyrdquo time series
Difference from a ldquobase periodrdquo (Toosimplistic)
Brings spatial smoothness (eg a mountaintop and nearby valley can have very differenttemperatures) Removes seasonality
Understand climate and weatherphenomenon
Southern Oscillation Index (SOI) Difference between Sea Level Pressure
(SLP) anomalies for Tahiti and DarwinAustralia
Figure Global AverageTemperature Anomaly(1975 - 2007) Srcwwwmetofficegovuk
Chawla and Chandola Anomaly Detection
Introduction Data Mining Methods Density-based anomaly Commute Time Approach Addressing Scalability Anomalies in Complex Data Evaluating Anomaly Detection Methods Applications Problem solutionsPCA and Subspace Method Subspace Method Algorithm Subspace Analysis Results Discussion Typical Characteristics of Anomaly Limitation of Volume Entropy Based versus Volume Based Fraud Detection Epidemeology Anomaly Detection in Climate and Weather Anomalies in Climate Validation of Anomalies
Constructing Anomalies from Raw Data
Anomaly time series for a given location i
vprimei = vi minus bi
where bi is the base (reference)
How to choose bi Mean of all data for location i Monthly mean values (account for seasonality) Monthly z-score values Median (more robust) Using a shorter ldquoreference periodrdquo
30 year moving window
Different methods show statistically significant differences[19] What is the right strategy Weighted mean of different strategies (Pick weights using
Monte Carlo sampling)
Chawla and Chandola Anomaly Detection
Introduction Data Mining Methods Density-based anomaly Commute Time Approach Addressing Scalability Anomalies in Complex Data Evaluating Anomaly Detection Methods Applications Problem solutionsPCA and Subspace Method Subspace Method Algorithm Subspace Analysis Results Discussion Typical Characteristics of Anomaly Limitation of Volume Entropy Based versus Volume Based Fraud Detection Epidemeology Anomaly Detection in Climate and Weather Anomalies in Climate Validation of Anomalies
Anomaly Detection for Identifying Droughts
Science question Identify significant drought patterns usinghistorical observation data or future simulation data or both
Find persistent spatiotemporal anomalies in precipitation data
A two step approach
1 Find precipitationanomalies usingthresholds
2 Find large connectedcomponents across spaceand time
Matlab - bwlabelbwlabeln
Followup Science questionExplain cause
(drought190120061avi)
Figure Video courtsey Dr ArindamBanerjee
Chawla and Chandola Anomaly Detection
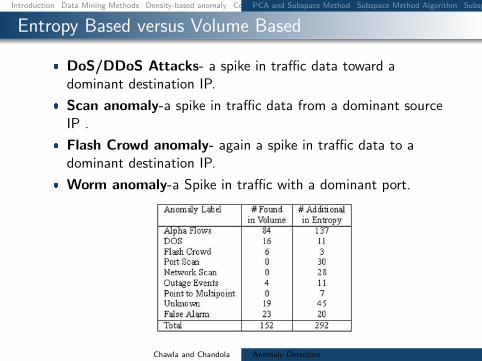
Introduction Data Mining Methods Density-based anomaly Commute Time Approach Addressing Scalability Anomalies in Complex Data Evaluating Anomaly Detection Methods Applications Problem solutionsPCA and Subspace Method Subspace Method Algorithm Subspace Analysis Results Discussion Typical Characteristics of Anomaly Limitation of Volume Entropy Based versus Volume Based Fraud Detection Epidemeology Anomaly Detection in Climate and Weather Anomalies in Climate Validation of Anomalies
Fraud Detection
Domain Question Identifyfraudulent activities or players fromobserved transaction data
Data Transactions between different
players in the system Meta information about the
individuals An underlying graph structure
Challenges Track and model human behavior Anomalies caused by adaptive
human adversaries Massive data sizes
Insurance (autohealtha)
ClaimantProvider Payer
Telecommunications Customer
Provider
Credit Cards Customer
Supplier Bank
Web Advertising User Advertiser
Publisher
ahttpwwwcheatingculturecompast-cases-of-medicare-fraud
Chawla and Chandola Anomaly Detection
Introduction Data Mining Methods Density-based anomaly Commute Time Approach Addressing Scalability Anomalies in Complex Data Evaluating Anomaly Detection Methods Applications Problem solutionsPCA and Subspace Method Subspace Method Algorithm Subspace Analysis Results Discussion Typical Characteristics of Anomaly Limitation of Volume Entropy Based versus Volume Based Fraud Detection Epidemeology Anomaly Detection in Climate and Weather Anomalies in Climate Validation of Anomalies
A Generic Fraud Detection Method
Activity Monitoring [13]1 Build profiles for individuals (customers users etc) based on
historic data User X makes n calls on an average in January
2 Compare current behavior with historical profile for significantdeviations
Clustering based [4]1 Cluster historical profiles of customers2 Identify small clusters or outlying profiles as anomalies
Strengths Anomaly detection is fast (good for real time) Results are easy to explain
Weaknesses Need to create and maintain a large number of profiles Not dynamic Adequate historical data might not be available Too many false positives
Chawla and Chandola Anomaly Detection
Introduction Data Mining Methods Density-based anomaly Commute Time Approach Addressing Scalability Anomalies in Complex Data Evaluating Anomaly Detection Methods Applications Problem solutionsPCA and Subspace Method Subspace Method Algorithm Subspace Analysis Results Discussion Typical Characteristics of Anomaly Limitation of Volume Entropy Based versus Volume Based Fraud Detection Epidemeology Anomaly Detection in Climate and Weather Anomalies in Climate Validation of Anomalies
Exploiting Graph Structure - Weighted Graphs
Represent data as a weighted graph Communication networks (phone email SMS) Provider referral networks
Objective Identify anomalous nodes
For each node extract several features based on the propertiesof the induced sub-graph (egonet) of neighboring nodes [1]
Choose features that can highlight anomalous nodes
1 Ni degree of node2 Ei number of edges in egonet3 Wi total weight of egonet4 λi principal eigen vector of weighted adjacency matrix of
egonet
Data is transformed into a point in a multi-dimensional space
Chawla and Chandola Anomaly Detection
Introduction Data Mining Methods Density-based anomaly Commute Time Approach Addressing Scalability Anomalies in Complex Data Evaluating Anomaly Detection Methods Applications Problem solutionsPCA and Subspace Method Subspace Method Algorithm Subspace Analysis Results Discussion Typical Characteristics of Anomaly Limitation of Volume Entropy Based versus Volume Based Fraud Detection Epidemeology Anomaly Detection in Climate and Weather Anomalies in Climate Validation of Anomalies
Identifying Anomalies
Traditional anomaly detection (lof) Can be slow but can identify any type of anomalous structure
Faster method to identify specific types of anomalousstructures
Identify relevant feature pairs and power law relationship
Eg Egonet Density Power Law Ni vs Ei - detect nearcliques and stars
Ei prop Nαi 1 le α le 2
Anomaly score for node i wrt a pair of features (y = Cxθ)
Si =max(yi Cx
θi )
min(yi Cxθi )lowast log (|yi minus Cxθi |+ 1)
Chawla and Chandola Anomaly Detection
Introduction Data Mining Methods Density-based anomaly Commute Time Approach Addressing Scalability Anomalies in Complex Data Evaluating Anomaly Detection Methods Applications Problem solutionsPCA and Subspace Method Subspace Method Algorithm Subspace Analysis Results Discussion Typical Characteristics of Anomaly Limitation of Volume Entropy Based versus Volume Based Fraud Detection Epidemeology Anomaly Detection in Climate and Weather Anomalies in Climate Validation of Anomalies
Exploiting Graph Structure - Bipartite Graphs
Represent data as a bipartite graph Healthcare Data (Beneficiaries vs Providers) Insider trading (Traders vs Stocks)
Objective Identify anomalous links
Given a query node a isin V1 find the ldquorelevancerdquoof all other nodes in V1 to a
RelevanceScore(a b) prop Number of times aldquorandom walkrdquo from a reaches b
Use the relevance scores to compute thenormality scores for a node t isin V2
Find set St = a|〈a t〉 isin E Compute |St| times |St| similarity matrix using
relevance vectors for a isin St Normality Score = mean of non-diagonal entries
of similarity matrix
V1 E V2a1
a2
a3
an
t1
t2
t3
tn
Chawla and Chandola Anomaly Detection
Introduction Data Mining Methods Density-based anomaly Commute Time Approach Addressing Scalability Anomalies in Complex Data Evaluating Anomaly Detection Methods Applications Problem solutionsPCA and Subspace Method Subspace Method Algorithm Subspace Analysis Results Discussion Typical Characteristics of Anomaly Limitation of Volume Entropy Based versus Volume Based Fraud Detection Epidemeology Anomaly Detection in Climate and Weather Anomalies in Climate Validation of Anomalies
Detecting Disease Outbreaks
Domain Question Early detection of disease
outbreaks Anthrax attack
Data Emergency department visits Grocery data (Example [14]) Clinical visits Weatherclimate data
Challenges Weak signals in the data
ED cases involving cough rArrFlu or SARS
Integration of multiple signals(lag analysis)
Account for spatial and temporalcorrelations
Chawla and Chandola Anomaly Detection
Introduction Data Mining Methods Density-based anomaly Commute Time Approach Addressing Scalability Anomalies in Complex Data Evaluating Anomaly Detection Methods Applications Problem solutionsPCA and Subspace Method Subspace Method Algorithm Subspace Analysis Results Discussion Typical Characteristics of Anomaly Limitation of Volume Entropy Based versus Volume Based Fraud Detection Epidemeology Anomaly Detection in Climate and Weather Anomalies in Climate Validation of Anomalies
Whatrsquos Significant About Recent Events (WSARE) [33]
1 Learn Bayesian network from historical data Environmental and response variables
2 Sample from the BN (DBbaseline|Current Environment)3 Compute contingency table for rules for DBbaseline andDBcurrent
Rules are single assignment rules (Xi = Y ji ) or conjunctions4 Find p-value for rules using χ2-test
Null Hypothesis Rows and columns of tables for DBbaselineand DBcurrent are independent
5 Find rule with largest p-value Repeat Step 2
Chawla and Chandola Anomaly Detection
Introduction Data Mining Methods Density-based anomaly Commute Time Approach Addressing Scalability Anomalies in Complex Data Evaluating Anomaly Detection Methods Applications Problem solutionsPCA and Subspace Method Subspace Method Algorithm Subspace Analysis Results Discussion Typical Characteristics of Anomaly Limitation of Volume Entropy Based versus Volume Based Fraud Detection Epidemeology Anomaly Detection in Climate and Weather Anomalies in Climate Validation of Anomalies
Incorporating Spatial and Temporal Relationships
WSARE does not explicitly model the spatial and temporalrelationships
What happened yesterday What happened in the adjoining neighborhood (yesterday)
Bayesian Network Spatio-Temporal (BNST) modelingframework [17]
Add nodes for temporal and spatial dependencies Need more data to train
Chawla and Chandola Anomaly Detection
Introduction Data Mining Methods Density-based anomaly Commute Time Approach Addressing Scalability Anomalies in Complex Data Evaluating Anomaly Detection Methods Applications Problem solutionsPCA and Subspace Method Subspace Method Algorithm Subspace Analysis Results Discussion Typical Characteristics of Anomaly Limitation of Volume Entropy Based versus Volume Based Fraud Detection Epidemeology Anomaly Detection in Climate and Weather Anomalies in Climate Validation of Anomalies
Anomaly Detection in Climate and Weather
Science Questions Identify natural and anthropogenic disasters Identify long time scale events - droughts atmospheric rivers
cold fronts etc
Data Ground observations Remote sensing data (satellites
air-borne) Climate model simulation outputs Multiple variables spatio-temporal (often has height dimension
as well)
Challenges Model spatio-temporal relationships across multiple variables Explain the cause of anomalies Massive data sizes
Climate and weather extreme events are well defined
Key challenge is to find significant events and explain the cause
Chawla and Chandola Anomaly Detection
Introduction Data Mining Methods Density-based anomaly Commute Time Approach Addressing Scalability Anomalies in Complex Data Evaluating Anomaly Detection Methods Applications Problem solutionsPCA and Subspace Method Subspace Method Algorithm Subspace Analysis Results Discussion Typical Characteristics of Anomaly Limitation of Volume Entropy Based versus Volume Based Fraud Detection Epidemeology Anomaly Detection in Climate and Weather Anomalies in Climate Validation of Anomalies
Anomalies are Widely Used in Climate
Most analysis done on ldquoanomalyrdquo time series
Difference from a ldquobase periodrdquo (Toosimplistic)
Brings spatial smoothness (eg a mountaintop and nearby valley can have very differenttemperatures) Removes seasonality
Understand climate and weatherphenomenon
Southern Oscillation Index (SOI) Difference between Sea Level Pressure
(SLP) anomalies for Tahiti and DarwinAustralia
Figure Global AverageTemperature Anomaly(1975 - 2007) Srcwwwmetofficegovuk
Chawla and Chandola Anomaly Detection
Introduction Data Mining Methods Density-based anomaly Commute Time Approach Addressing Scalability Anomalies in Complex Data Evaluating Anomaly Detection Methods Applications Problem solutionsPCA and Subspace Method Subspace Method Algorithm Subspace Analysis Results Discussion Typical Characteristics of Anomaly Limitation of Volume Entropy Based versus Volume Based Fraud Detection Epidemeology Anomaly Detection in Climate and Weather Anomalies in Climate Validation of Anomalies
Constructing Anomalies from Raw Data
Anomaly time series for a given location i
vprimei = vi minus bi
where bi is the base (reference)
How to choose bi Mean of all data for location i Monthly mean values (account for seasonality) Monthly z-score values Median (more robust) Using a shorter ldquoreference periodrdquo
30 year moving window
Different methods show statistically significant differences[19] What is the right strategy Weighted mean of different strategies (Pick weights using
Monte Carlo sampling)
Chawla and Chandola Anomaly Detection
Introduction Data Mining Methods Density-based anomaly Commute Time Approach Addressing Scalability Anomalies in Complex Data Evaluating Anomaly Detection Methods Applications Problem solutionsPCA and Subspace Method Subspace Method Algorithm Subspace Analysis Results Discussion Typical Characteristics of Anomaly Limitation of Volume Entropy Based versus Volume Based Fraud Detection Epidemeology Anomaly Detection in Climate and Weather Anomalies in Climate Validation of Anomalies
Anomaly Detection for Identifying Droughts
Science question Identify significant drought patterns usinghistorical observation data or future simulation data or both
Find persistent spatiotemporal anomalies in precipitation data
A two step approach
1 Find precipitationanomalies usingthresholds
2 Find large connectedcomponents across spaceand time
Matlab - bwlabelbwlabeln
Followup Science questionExplain cause
(drought190120061avi)
Figure Video courtsey Dr ArindamBanerjee
Chawla and Chandola Anomaly Detection
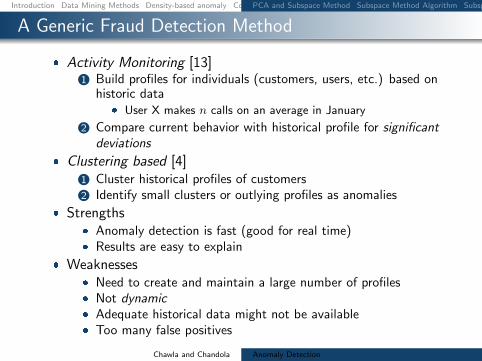
Introduction Data Mining Methods Density-based anomaly Commute Time Approach Addressing Scalability Anomalies in Complex Data Evaluating Anomaly Detection Methods Applications Problem solutionsPCA and Subspace Method Subspace Method Algorithm Subspace Analysis Results Discussion Typical Characteristics of Anomaly Limitation of Volume Entropy Based versus Volume Based Fraud Detection Epidemeology Anomaly Detection in Climate and Weather Anomalies in Climate Validation of Anomalies
A Generic Fraud Detection Method
Activity Monitoring [13]1 Build profiles for individuals (customers users etc) based on
historic data User X makes n calls on an average in January
2 Compare current behavior with historical profile for significantdeviations
Clustering based [4]1 Cluster historical profiles of customers2 Identify small clusters or outlying profiles as anomalies
Strengths Anomaly detection is fast (good for real time) Results are easy to explain
Weaknesses Need to create and maintain a large number of profiles Not dynamic Adequate historical data might not be available Too many false positives
Chawla and Chandola Anomaly Detection
Introduction Data Mining Methods Density-based anomaly Commute Time Approach Addressing Scalability Anomalies in Complex Data Evaluating Anomaly Detection Methods Applications Problem solutionsPCA and Subspace Method Subspace Method Algorithm Subspace Analysis Results Discussion Typical Characteristics of Anomaly Limitation of Volume Entropy Based versus Volume Based Fraud Detection Epidemeology Anomaly Detection in Climate and Weather Anomalies in Climate Validation of Anomalies
Exploiting Graph Structure - Weighted Graphs
Represent data as a weighted graph Communication networks (phone email SMS) Provider referral networks
Objective Identify anomalous nodes
For each node extract several features based on the propertiesof the induced sub-graph (egonet) of neighboring nodes [1]
Choose features that can highlight anomalous nodes
1 Ni degree of node2 Ei number of edges in egonet3 Wi total weight of egonet4 λi principal eigen vector of weighted adjacency matrix of
egonet
Data is transformed into a point in a multi-dimensional space
Chawla and Chandola Anomaly Detection
Introduction Data Mining Methods Density-based anomaly Commute Time Approach Addressing Scalability Anomalies in Complex Data Evaluating Anomaly Detection Methods Applications Problem solutionsPCA and Subspace Method Subspace Method Algorithm Subspace Analysis Results Discussion Typical Characteristics of Anomaly Limitation of Volume Entropy Based versus Volume Based Fraud Detection Epidemeology Anomaly Detection in Climate and Weather Anomalies in Climate Validation of Anomalies
Identifying Anomalies
Traditional anomaly detection (lof) Can be slow but can identify any type of anomalous structure
Faster method to identify specific types of anomalousstructures
Identify relevant feature pairs and power law relationship
Eg Egonet Density Power Law Ni vs Ei - detect nearcliques and stars
Ei prop Nαi 1 le α le 2
Anomaly score for node i wrt a pair of features (y = Cxθ)
Si =max(yi Cx
θi )
min(yi Cxθi )lowast log (|yi minus Cxθi |+ 1)
Chawla and Chandola Anomaly Detection
Introduction Data Mining Methods Density-based anomaly Commute Time Approach Addressing Scalability Anomalies in Complex Data Evaluating Anomaly Detection Methods Applications Problem solutionsPCA and Subspace Method Subspace Method Algorithm Subspace Analysis Results Discussion Typical Characteristics of Anomaly Limitation of Volume Entropy Based versus Volume Based Fraud Detection Epidemeology Anomaly Detection in Climate and Weather Anomalies in Climate Validation of Anomalies
Exploiting Graph Structure - Bipartite Graphs
Represent data as a bipartite graph Healthcare Data (Beneficiaries vs Providers) Insider trading (Traders vs Stocks)
Objective Identify anomalous links
Given a query node a isin V1 find the ldquorelevancerdquoof all other nodes in V1 to a
RelevanceScore(a b) prop Number of times aldquorandom walkrdquo from a reaches b
Use the relevance scores to compute thenormality scores for a node t isin V2
Find set St = a|〈a t〉 isin E Compute |St| times |St| similarity matrix using
relevance vectors for a isin St Normality Score = mean of non-diagonal entries
of similarity matrix
V1 E V2a1
a2
a3
an
t1
t2
t3
tn
Chawla and Chandola Anomaly Detection
Introduction Data Mining Methods Density-based anomaly Commute Time Approach Addressing Scalability Anomalies in Complex Data Evaluating Anomaly Detection Methods Applications Problem solutionsPCA and Subspace Method Subspace Method Algorithm Subspace Analysis Results Discussion Typical Characteristics of Anomaly Limitation of Volume Entropy Based versus Volume Based Fraud Detection Epidemeology Anomaly Detection in Climate and Weather Anomalies in Climate Validation of Anomalies
Detecting Disease Outbreaks
Domain Question Early detection of disease
outbreaks Anthrax attack
Data Emergency department visits Grocery data (Example [14]) Clinical visits Weatherclimate data
Challenges Weak signals in the data
ED cases involving cough rArrFlu or SARS
Integration of multiple signals(lag analysis)
Account for spatial and temporalcorrelations
Chawla and Chandola Anomaly Detection
Introduction Data Mining Methods Density-based anomaly Commute Time Approach Addressing Scalability Anomalies in Complex Data Evaluating Anomaly Detection Methods Applications Problem solutionsPCA and Subspace Method Subspace Method Algorithm Subspace Analysis Results Discussion Typical Characteristics of Anomaly Limitation of Volume Entropy Based versus Volume Based Fraud Detection Epidemeology Anomaly Detection in Climate and Weather Anomalies in Climate Validation of Anomalies
Whatrsquos Significant About Recent Events (WSARE) [33]
1 Learn Bayesian network from historical data Environmental and response variables
2 Sample from the BN (DBbaseline|Current Environment)3 Compute contingency table for rules for DBbaseline andDBcurrent
Rules are single assignment rules (Xi = Y ji ) or conjunctions4 Find p-value for rules using χ2-test
Null Hypothesis Rows and columns of tables for DBbaselineand DBcurrent are independent
5 Find rule with largest p-value Repeat Step 2
Chawla and Chandola Anomaly Detection
Introduction Data Mining Methods Density-based anomaly Commute Time Approach Addressing Scalability Anomalies in Complex Data Evaluating Anomaly Detection Methods Applications Problem solutionsPCA and Subspace Method Subspace Method Algorithm Subspace Analysis Results Discussion Typical Characteristics of Anomaly Limitation of Volume Entropy Based versus Volume Based Fraud Detection Epidemeology Anomaly Detection in Climate and Weather Anomalies in Climate Validation of Anomalies
Incorporating Spatial and Temporal Relationships
WSARE does not explicitly model the spatial and temporalrelationships
What happened yesterday What happened in the adjoining neighborhood (yesterday)
Bayesian Network Spatio-Temporal (BNST) modelingframework [17]
Add nodes for temporal and spatial dependencies Need more data to train
Chawla and Chandola Anomaly Detection
Introduction Data Mining Methods Density-based anomaly Commute Time Approach Addressing Scalability Anomalies in Complex Data Evaluating Anomaly Detection Methods Applications Problem solutionsPCA and Subspace Method Subspace Method Algorithm Subspace Analysis Results Discussion Typical Characteristics of Anomaly Limitation of Volume Entropy Based versus Volume Based Fraud Detection Epidemeology Anomaly Detection in Climate and Weather Anomalies in Climate Validation of Anomalies
Anomaly Detection in Climate and Weather
Science Questions Identify natural and anthropogenic disasters Identify long time scale events - droughts atmospheric rivers
cold fronts etc
Data Ground observations Remote sensing data (satellites
air-borne) Climate model simulation outputs Multiple variables spatio-temporal (often has height dimension
as well)
Challenges Model spatio-temporal relationships across multiple variables Explain the cause of anomalies Massive data sizes
Climate and weather extreme events are well defined
Key challenge is to find significant events and explain the cause
Chawla and Chandola Anomaly Detection
Introduction Data Mining Methods Density-based anomaly Commute Time Approach Addressing Scalability Anomalies in Complex Data Evaluating Anomaly Detection Methods Applications Problem solutionsPCA and Subspace Method Subspace Method Algorithm Subspace Analysis Results Discussion Typical Characteristics of Anomaly Limitation of Volume Entropy Based versus Volume Based Fraud Detection Epidemeology Anomaly Detection in Climate and Weather Anomalies in Climate Validation of Anomalies
Anomalies are Widely Used in Climate
Most analysis done on ldquoanomalyrdquo time series
Difference from a ldquobase periodrdquo (Toosimplistic)
Brings spatial smoothness (eg a mountaintop and nearby valley can have very differenttemperatures) Removes seasonality
Understand climate and weatherphenomenon
Southern Oscillation Index (SOI) Difference between Sea Level Pressure
(SLP) anomalies for Tahiti and DarwinAustralia
Figure Global AverageTemperature Anomaly(1975 - 2007) Srcwwwmetofficegovuk
Chawla and Chandola Anomaly Detection
Introduction Data Mining Methods Density-based anomaly Commute Time Approach Addressing Scalability Anomalies in Complex Data Evaluating Anomaly Detection Methods Applications Problem solutionsPCA and Subspace Method Subspace Method Algorithm Subspace Analysis Results Discussion Typical Characteristics of Anomaly Limitation of Volume Entropy Based versus Volume Based Fraud Detection Epidemeology Anomaly Detection in Climate and Weather Anomalies in Climate Validation of Anomalies
Constructing Anomalies from Raw Data
Anomaly time series for a given location i
vprimei = vi minus bi
where bi is the base (reference)
How to choose bi Mean of all data for location i Monthly mean values (account for seasonality) Monthly z-score values Median (more robust) Using a shorter ldquoreference periodrdquo
30 year moving window
Different methods show statistically significant differences[19] What is the right strategy Weighted mean of different strategies (Pick weights using
Monte Carlo sampling)
Chawla and Chandola Anomaly Detection
Introduction Data Mining Methods Density-based anomaly Commute Time Approach Addressing Scalability Anomalies in Complex Data Evaluating Anomaly Detection Methods Applications Problem solutionsPCA and Subspace Method Subspace Method Algorithm Subspace Analysis Results Discussion Typical Characteristics of Anomaly Limitation of Volume Entropy Based versus Volume Based Fraud Detection Epidemeology Anomaly Detection in Climate and Weather Anomalies in Climate Validation of Anomalies
Anomaly Detection for Identifying Droughts
Science question Identify significant drought patterns usinghistorical observation data or future simulation data or both
Find persistent spatiotemporal anomalies in precipitation data
A two step approach
1 Find precipitationanomalies usingthresholds
2 Find large connectedcomponents across spaceand time
Matlab - bwlabelbwlabeln
Followup Science questionExplain cause
(drought190120061avi)
Figure Video courtsey Dr ArindamBanerjee
Chawla and Chandola Anomaly Detection
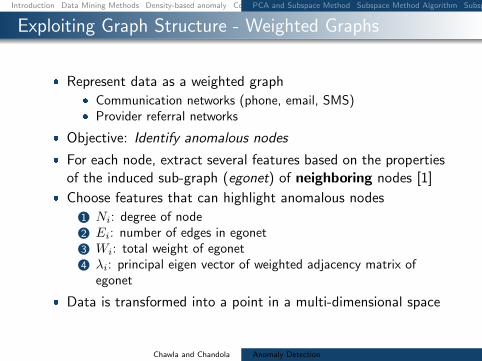
Introduction Data Mining Methods Density-based anomaly Commute Time Approach Addressing Scalability Anomalies in Complex Data Evaluating Anomaly Detection Methods Applications Problem solutionsPCA and Subspace Method Subspace Method Algorithm Subspace Analysis Results Discussion Typical Characteristics of Anomaly Limitation of Volume Entropy Based versus Volume Based Fraud Detection Epidemeology Anomaly Detection in Climate and Weather Anomalies in Climate Validation of Anomalies
Exploiting Graph Structure - Weighted Graphs
Represent data as a weighted graph Communication networks (phone email SMS) Provider referral networks
Objective Identify anomalous nodes
For each node extract several features based on the propertiesof the induced sub-graph (egonet) of neighboring nodes [1]
Choose features that can highlight anomalous nodes
1 Ni degree of node2 Ei number of edges in egonet3 Wi total weight of egonet4 λi principal eigen vector of weighted adjacency matrix of
egonet
Data is transformed into a point in a multi-dimensional space
Chawla and Chandola Anomaly Detection
Introduction Data Mining Methods Density-based anomaly Commute Time Approach Addressing Scalability Anomalies in Complex Data Evaluating Anomaly Detection Methods Applications Problem solutionsPCA and Subspace Method Subspace Method Algorithm Subspace Analysis Results Discussion Typical Characteristics of Anomaly Limitation of Volume Entropy Based versus Volume Based Fraud Detection Epidemeology Anomaly Detection in Climate and Weather Anomalies in Climate Validation of Anomalies
Identifying Anomalies
Traditional anomaly detection (lof) Can be slow but can identify any type of anomalous structure
Faster method to identify specific types of anomalousstructures
Identify relevant feature pairs and power law relationship
Eg Egonet Density Power Law Ni vs Ei - detect nearcliques and stars
Ei prop Nαi 1 le α le 2
Anomaly score for node i wrt a pair of features (y = Cxθ)
Si =max(yi Cx
θi )
min(yi Cxθi )lowast log (|yi minus Cxθi |+ 1)
Chawla and Chandola Anomaly Detection
Introduction Data Mining Methods Density-based anomaly Commute Time Approach Addressing Scalability Anomalies in Complex Data Evaluating Anomaly Detection Methods Applications Problem solutionsPCA and Subspace Method Subspace Method Algorithm Subspace Analysis Results Discussion Typical Characteristics of Anomaly Limitation of Volume Entropy Based versus Volume Based Fraud Detection Epidemeology Anomaly Detection in Climate and Weather Anomalies in Climate Validation of Anomalies
Exploiting Graph Structure - Bipartite Graphs
Represent data as a bipartite graph Healthcare Data (Beneficiaries vs Providers) Insider trading (Traders vs Stocks)
Objective Identify anomalous links
Given a query node a isin V1 find the ldquorelevancerdquoof all other nodes in V1 to a
RelevanceScore(a b) prop Number of times aldquorandom walkrdquo from a reaches b
Use the relevance scores to compute thenormality scores for a node t isin V2
Find set St = a|〈a t〉 isin E Compute |St| times |St| similarity matrix using
relevance vectors for a isin St Normality Score = mean of non-diagonal entries
of similarity matrix
V1 E V2a1
a2
a3
an
t1
t2
t3
tn
Chawla and Chandola Anomaly Detection
Introduction Data Mining Methods Density-based anomaly Commute Time Approach Addressing Scalability Anomalies in Complex Data Evaluating Anomaly Detection Methods Applications Problem solutionsPCA and Subspace Method Subspace Method Algorithm Subspace Analysis Results Discussion Typical Characteristics of Anomaly Limitation of Volume Entropy Based versus Volume Based Fraud Detection Epidemeology Anomaly Detection in Climate and Weather Anomalies in Climate Validation of Anomalies
Detecting Disease Outbreaks
Domain Question Early detection of disease
outbreaks Anthrax attack
Data Emergency department visits Grocery data (Example [14]) Clinical visits Weatherclimate data
Challenges Weak signals in the data
ED cases involving cough rArrFlu or SARS
Integration of multiple signals(lag analysis)
Account for spatial and temporalcorrelations
Chawla and Chandola Anomaly Detection
Introduction Data Mining Methods Density-based anomaly Commute Time Approach Addressing Scalability Anomalies in Complex Data Evaluating Anomaly Detection Methods Applications Problem solutionsPCA and Subspace Method Subspace Method Algorithm Subspace Analysis Results Discussion Typical Characteristics of Anomaly Limitation of Volume Entropy Based versus Volume Based Fraud Detection Epidemeology Anomaly Detection in Climate and Weather Anomalies in Climate Validation of Anomalies
Whatrsquos Significant About Recent Events (WSARE) [33]
1 Learn Bayesian network from historical data Environmental and response variables
2 Sample from the BN (DBbaseline|Current Environment)3 Compute contingency table for rules for DBbaseline andDBcurrent
Rules are single assignment rules (Xi = Y ji ) or conjunctions4 Find p-value for rules using χ2-test
Null Hypothesis Rows and columns of tables for DBbaselineand DBcurrent are independent
5 Find rule with largest p-value Repeat Step 2
Chawla and Chandola Anomaly Detection
Introduction Data Mining Methods Density-based anomaly Commute Time Approach Addressing Scalability Anomalies in Complex Data Evaluating Anomaly Detection Methods Applications Problem solutionsPCA and Subspace Method Subspace Method Algorithm Subspace Analysis Results Discussion Typical Characteristics of Anomaly Limitation of Volume Entropy Based versus Volume Based Fraud Detection Epidemeology Anomaly Detection in Climate and Weather Anomalies in Climate Validation of Anomalies
Incorporating Spatial and Temporal Relationships
WSARE does not explicitly model the spatial and temporalrelationships
What happened yesterday What happened in the adjoining neighborhood (yesterday)
Bayesian Network Spatio-Temporal (BNST) modelingframework [17]
Add nodes for temporal and spatial dependencies Need more data to train
Chawla and Chandola Anomaly Detection
Introduction Data Mining Methods Density-based anomaly Commute Time Approach Addressing Scalability Anomalies in Complex Data Evaluating Anomaly Detection Methods Applications Problem solutionsPCA and Subspace Method Subspace Method Algorithm Subspace Analysis Results Discussion Typical Characteristics of Anomaly Limitation of Volume Entropy Based versus Volume Based Fraud Detection Epidemeology Anomaly Detection in Climate and Weather Anomalies in Climate Validation of Anomalies
Anomaly Detection in Climate and Weather
Science Questions Identify natural and anthropogenic disasters Identify long time scale events - droughts atmospheric rivers
cold fronts etc
Data Ground observations Remote sensing data (satellites
air-borne) Climate model simulation outputs Multiple variables spatio-temporal (often has height dimension
as well)
Challenges Model spatio-temporal relationships across multiple variables Explain the cause of anomalies Massive data sizes
Climate and weather extreme events are well defined
Key challenge is to find significant events and explain the cause
Chawla and Chandola Anomaly Detection
Introduction Data Mining Methods Density-based anomaly Commute Time Approach Addressing Scalability Anomalies in Complex Data Evaluating Anomaly Detection Methods Applications Problem solutionsPCA and Subspace Method Subspace Method Algorithm Subspace Analysis Results Discussion Typical Characteristics of Anomaly Limitation of Volume Entropy Based versus Volume Based Fraud Detection Epidemeology Anomaly Detection in Climate and Weather Anomalies in Climate Validation of Anomalies
Anomalies are Widely Used in Climate
Most analysis done on ldquoanomalyrdquo time series
Difference from a ldquobase periodrdquo (Toosimplistic)
Brings spatial smoothness (eg a mountaintop and nearby valley can have very differenttemperatures) Removes seasonality
Understand climate and weatherphenomenon
Southern Oscillation Index (SOI) Difference between Sea Level Pressure
(SLP) anomalies for Tahiti and DarwinAustralia
Figure Global AverageTemperature Anomaly(1975 - 2007) Srcwwwmetofficegovuk
Chawla and Chandola Anomaly Detection
Introduction Data Mining Methods Density-based anomaly Commute Time Approach Addressing Scalability Anomalies in Complex Data Evaluating Anomaly Detection Methods Applications Problem solutionsPCA and Subspace Method Subspace Method Algorithm Subspace Analysis Results Discussion Typical Characteristics of Anomaly Limitation of Volume Entropy Based versus Volume Based Fraud Detection Epidemeology Anomaly Detection in Climate and Weather Anomalies in Climate Validation of Anomalies
Constructing Anomalies from Raw Data
Anomaly time series for a given location i
vprimei = vi minus bi
where bi is the base (reference)
How to choose bi Mean of all data for location i Monthly mean values (account for seasonality) Monthly z-score values Median (more robust) Using a shorter ldquoreference periodrdquo
30 year moving window
Different methods show statistically significant differences[19] What is the right strategy Weighted mean of different strategies (Pick weights using
Monte Carlo sampling)
Chawla and Chandola Anomaly Detection
Introduction Data Mining Methods Density-based anomaly Commute Time Approach Addressing Scalability Anomalies in Complex Data Evaluating Anomaly Detection Methods Applications Problem solutionsPCA and Subspace Method Subspace Method Algorithm Subspace Analysis Results Discussion Typical Characteristics of Anomaly Limitation of Volume Entropy Based versus Volume Based Fraud Detection Epidemeology Anomaly Detection in Climate and Weather Anomalies in Climate Validation of Anomalies
Anomaly Detection for Identifying Droughts
Science question Identify significant drought patterns usinghistorical observation data or future simulation data or both
Find persistent spatiotemporal anomalies in precipitation data
A two step approach
1 Find precipitationanomalies usingthresholds
2 Find large connectedcomponents across spaceand time
Matlab - bwlabelbwlabeln
Followup Science questionExplain cause
(drought190120061avi)
Figure Video courtsey Dr ArindamBanerjee
Chawla and Chandola Anomaly Detection
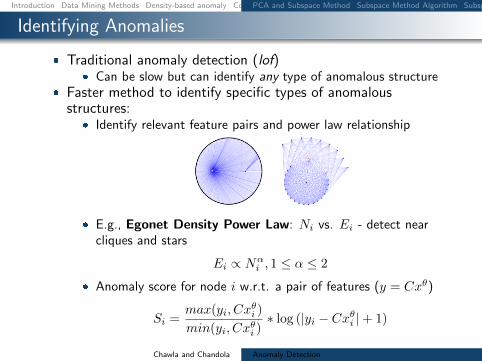
Introduction Data Mining Methods Density-based anomaly Commute Time Approach Addressing Scalability Anomalies in Complex Data Evaluating Anomaly Detection Methods Applications Problem solutionsPCA and Subspace Method Subspace Method Algorithm Subspace Analysis Results Discussion Typical Characteristics of Anomaly Limitation of Volume Entropy Based versus Volume Based Fraud Detection Epidemeology Anomaly Detection in Climate and Weather Anomalies in Climate Validation of Anomalies
Identifying Anomalies
Traditional anomaly detection (lof) Can be slow but can identify any type of anomalous structure
Faster method to identify specific types of anomalousstructures
Identify relevant feature pairs and power law relationship
Eg Egonet Density Power Law Ni vs Ei - detect nearcliques and stars
Ei prop Nαi 1 le α le 2
Anomaly score for node i wrt a pair of features (y = Cxθ)
Si =max(yi Cx
θi )
min(yi Cxθi )lowast log (|yi minus Cxθi |+ 1)
Chawla and Chandola Anomaly Detection
Introduction Data Mining Methods Density-based anomaly Commute Time Approach Addressing Scalability Anomalies in Complex Data Evaluating Anomaly Detection Methods Applications Problem solutionsPCA and Subspace Method Subspace Method Algorithm Subspace Analysis Results Discussion Typical Characteristics of Anomaly Limitation of Volume Entropy Based versus Volume Based Fraud Detection Epidemeology Anomaly Detection in Climate and Weather Anomalies in Climate Validation of Anomalies
Exploiting Graph Structure - Bipartite Graphs
Represent data as a bipartite graph Healthcare Data (Beneficiaries vs Providers) Insider trading (Traders vs Stocks)
Objective Identify anomalous links
Given a query node a isin V1 find the ldquorelevancerdquoof all other nodes in V1 to a
RelevanceScore(a b) prop Number of times aldquorandom walkrdquo from a reaches b
Use the relevance scores to compute thenormality scores for a node t isin V2
Find set St = a|〈a t〉 isin E Compute |St| times |St| similarity matrix using
relevance vectors for a isin St Normality Score = mean of non-diagonal entries
of similarity matrix
V1 E V2a1
a2
a3
an
t1
t2
t3
tn
Chawla and Chandola Anomaly Detection
Introduction Data Mining Methods Density-based anomaly Commute Time Approach Addressing Scalability Anomalies in Complex Data Evaluating Anomaly Detection Methods Applications Problem solutionsPCA and Subspace Method Subspace Method Algorithm Subspace Analysis Results Discussion Typical Characteristics of Anomaly Limitation of Volume Entropy Based versus Volume Based Fraud Detection Epidemeology Anomaly Detection in Climate and Weather Anomalies in Climate Validation of Anomalies
Detecting Disease Outbreaks
Domain Question Early detection of disease
outbreaks Anthrax attack
Data Emergency department visits Grocery data (Example [14]) Clinical visits Weatherclimate data
Challenges Weak signals in the data
ED cases involving cough rArrFlu or SARS
Integration of multiple signals(lag analysis)
Account for spatial and temporalcorrelations
Chawla and Chandola Anomaly Detection
Introduction Data Mining Methods Density-based anomaly Commute Time Approach Addressing Scalability Anomalies in Complex Data Evaluating Anomaly Detection Methods Applications Problem solutionsPCA and Subspace Method Subspace Method Algorithm Subspace Analysis Results Discussion Typical Characteristics of Anomaly Limitation of Volume Entropy Based versus Volume Based Fraud Detection Epidemeology Anomaly Detection in Climate and Weather Anomalies in Climate Validation of Anomalies
Whatrsquos Significant About Recent Events (WSARE) [33]
1 Learn Bayesian network from historical data Environmental and response variables
2 Sample from the BN (DBbaseline|Current Environment)3 Compute contingency table for rules for DBbaseline andDBcurrent
Rules are single assignment rules (Xi = Y ji ) or conjunctions4 Find p-value for rules using χ2-test
Null Hypothesis Rows and columns of tables for DBbaselineand DBcurrent are independent
5 Find rule with largest p-value Repeat Step 2
Chawla and Chandola Anomaly Detection
Introduction Data Mining Methods Density-based anomaly Commute Time Approach Addressing Scalability Anomalies in Complex Data Evaluating Anomaly Detection Methods Applications Problem solutionsPCA and Subspace Method Subspace Method Algorithm Subspace Analysis Results Discussion Typical Characteristics of Anomaly Limitation of Volume Entropy Based versus Volume Based Fraud Detection Epidemeology Anomaly Detection in Climate and Weather Anomalies in Climate Validation of Anomalies
Incorporating Spatial and Temporal Relationships
WSARE does not explicitly model the spatial and temporalrelationships
What happened yesterday What happened in the adjoining neighborhood (yesterday)
Bayesian Network Spatio-Temporal (BNST) modelingframework [17]
Add nodes for temporal and spatial dependencies Need more data to train
Chawla and Chandola Anomaly Detection
Introduction Data Mining Methods Density-based anomaly Commute Time Approach Addressing Scalability Anomalies in Complex Data Evaluating Anomaly Detection Methods Applications Problem solutionsPCA and Subspace Method Subspace Method Algorithm Subspace Analysis Results Discussion Typical Characteristics of Anomaly Limitation of Volume Entropy Based versus Volume Based Fraud Detection Epidemeology Anomaly Detection in Climate and Weather Anomalies in Climate Validation of Anomalies
Anomaly Detection in Climate and Weather
Science Questions Identify natural and anthropogenic disasters Identify long time scale events - droughts atmospheric rivers
cold fronts etc
Data Ground observations Remote sensing data (satellites
air-borne) Climate model simulation outputs Multiple variables spatio-temporal (often has height dimension
as well)
Challenges Model spatio-temporal relationships across multiple variables Explain the cause of anomalies Massive data sizes
Climate and weather extreme events are well defined
Key challenge is to find significant events and explain the cause
Chawla and Chandola Anomaly Detection
Introduction Data Mining Methods Density-based anomaly Commute Time Approach Addressing Scalability Anomalies in Complex Data Evaluating Anomaly Detection Methods Applications Problem solutionsPCA and Subspace Method Subspace Method Algorithm Subspace Analysis Results Discussion Typical Characteristics of Anomaly Limitation of Volume Entropy Based versus Volume Based Fraud Detection Epidemeology Anomaly Detection in Climate and Weather Anomalies in Climate Validation of Anomalies
Anomalies are Widely Used in Climate
Most analysis done on ldquoanomalyrdquo time series
Difference from a ldquobase periodrdquo (Toosimplistic)
Brings spatial smoothness (eg a mountaintop and nearby valley can have very differenttemperatures) Removes seasonality
Understand climate and weatherphenomenon
Southern Oscillation Index (SOI) Difference between Sea Level Pressure
(SLP) anomalies for Tahiti and DarwinAustralia
Figure Global AverageTemperature Anomaly(1975 - 2007) Srcwwwmetofficegovuk
Chawla and Chandola Anomaly Detection
Introduction Data Mining Methods Density-based anomaly Commute Time Approach Addressing Scalability Anomalies in Complex Data Evaluating Anomaly Detection Methods Applications Problem solutionsPCA and Subspace Method Subspace Method Algorithm Subspace Analysis Results Discussion Typical Characteristics of Anomaly Limitation of Volume Entropy Based versus Volume Based Fraud Detection Epidemeology Anomaly Detection in Climate and Weather Anomalies in Climate Validation of Anomalies
Constructing Anomalies from Raw Data
Anomaly time series for a given location i
vprimei = vi minus bi
where bi is the base (reference)
How to choose bi Mean of all data for location i Monthly mean values (account for seasonality) Monthly z-score values Median (more robust) Using a shorter ldquoreference periodrdquo
30 year moving window
Different methods show statistically significant differences[19] What is the right strategy Weighted mean of different strategies (Pick weights using
Monte Carlo sampling)
Chawla and Chandola Anomaly Detection
Introduction Data Mining Methods Density-based anomaly Commute Time Approach Addressing Scalability Anomalies in Complex Data Evaluating Anomaly Detection Methods Applications Problem solutionsPCA and Subspace Method Subspace Method Algorithm Subspace Analysis Results Discussion Typical Characteristics of Anomaly Limitation of Volume Entropy Based versus Volume Based Fraud Detection Epidemeology Anomaly Detection in Climate and Weather Anomalies in Climate Validation of Anomalies
Anomaly Detection for Identifying Droughts
Science question Identify significant drought patterns usinghistorical observation data or future simulation data or both
Find persistent spatiotemporal anomalies in precipitation data
A two step approach
1 Find precipitationanomalies usingthresholds
2 Find large connectedcomponents across spaceand time
Matlab - bwlabelbwlabeln
Followup Science questionExplain cause
(drought190120061avi)
Figure Video courtsey Dr ArindamBanerjee
Chawla and Chandola Anomaly Detection
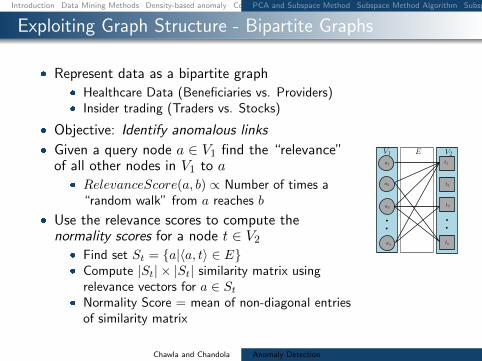
Introduction Data Mining Methods Density-based anomaly Commute Time Approach Addressing Scalability Anomalies in Complex Data Evaluating Anomaly Detection Methods Applications Problem solutionsPCA and Subspace Method Subspace Method Algorithm Subspace Analysis Results Discussion Typical Characteristics of Anomaly Limitation of Volume Entropy Based versus Volume Based Fraud Detection Epidemeology Anomaly Detection in Climate and Weather Anomalies in Climate Validation of Anomalies
Exploiting Graph Structure - Bipartite Graphs
Represent data as a bipartite graph Healthcare Data (Beneficiaries vs Providers) Insider trading (Traders vs Stocks)
Objective Identify anomalous links
Given a query node a isin V1 find the ldquorelevancerdquoof all other nodes in V1 to a
RelevanceScore(a b) prop Number of times aldquorandom walkrdquo from a reaches b
Use the relevance scores to compute thenormality scores for a node t isin V2
Find set St = a|〈a t〉 isin E Compute |St| times |St| similarity matrix using
relevance vectors for a isin St Normality Score = mean of non-diagonal entries
of similarity matrix
V1 E V2a1
a2
a3
an
t1
t2
t3
tn
Chawla and Chandola Anomaly Detection
Introduction Data Mining Methods Density-based anomaly Commute Time Approach Addressing Scalability Anomalies in Complex Data Evaluating Anomaly Detection Methods Applications Problem solutionsPCA and Subspace Method Subspace Method Algorithm Subspace Analysis Results Discussion Typical Characteristics of Anomaly Limitation of Volume Entropy Based versus Volume Based Fraud Detection Epidemeology Anomaly Detection in Climate and Weather Anomalies in Climate Validation of Anomalies
Detecting Disease Outbreaks
Domain Question Early detection of disease
outbreaks Anthrax attack
Data Emergency department visits Grocery data (Example [14]) Clinical visits Weatherclimate data
Challenges Weak signals in the data
ED cases involving cough rArrFlu or SARS
Integration of multiple signals(lag analysis)
Account for spatial and temporalcorrelations
Chawla and Chandola Anomaly Detection
Introduction Data Mining Methods Density-based anomaly Commute Time Approach Addressing Scalability Anomalies in Complex Data Evaluating Anomaly Detection Methods Applications Problem solutionsPCA and Subspace Method Subspace Method Algorithm Subspace Analysis Results Discussion Typical Characteristics of Anomaly Limitation of Volume Entropy Based versus Volume Based Fraud Detection Epidemeology Anomaly Detection in Climate and Weather Anomalies in Climate Validation of Anomalies
Whatrsquos Significant About Recent Events (WSARE) [33]
1 Learn Bayesian network from historical data Environmental and response variables
2 Sample from the BN (DBbaseline|Current Environment)3 Compute contingency table for rules for DBbaseline andDBcurrent
Rules are single assignment rules (Xi = Y ji ) or conjunctions4 Find p-value for rules using χ2-test
Null Hypothesis Rows and columns of tables for DBbaselineand DBcurrent are independent
5 Find rule with largest p-value Repeat Step 2
Chawla and Chandola Anomaly Detection
Introduction Data Mining Methods Density-based anomaly Commute Time Approach Addressing Scalability Anomalies in Complex Data Evaluating Anomaly Detection Methods Applications Problem solutionsPCA and Subspace Method Subspace Method Algorithm Subspace Analysis Results Discussion Typical Characteristics of Anomaly Limitation of Volume Entropy Based versus Volume Based Fraud Detection Epidemeology Anomaly Detection in Climate and Weather Anomalies in Climate Validation of Anomalies
Incorporating Spatial and Temporal Relationships
WSARE does not explicitly model the spatial and temporalrelationships
What happened yesterday What happened in the adjoining neighborhood (yesterday)
Bayesian Network Spatio-Temporal (BNST) modelingframework [17]
Add nodes for temporal and spatial dependencies Need more data to train
Chawla and Chandola Anomaly Detection
Introduction Data Mining Methods Density-based anomaly Commute Time Approach Addressing Scalability Anomalies in Complex Data Evaluating Anomaly Detection Methods Applications Problem solutionsPCA and Subspace Method Subspace Method Algorithm Subspace Analysis Results Discussion Typical Characteristics of Anomaly Limitation of Volume Entropy Based versus Volume Based Fraud Detection Epidemeology Anomaly Detection in Climate and Weather Anomalies in Climate Validation of Anomalies
Anomaly Detection in Climate and Weather
Science Questions Identify natural and anthropogenic disasters Identify long time scale events - droughts atmospheric rivers
cold fronts etc
Data Ground observations Remote sensing data (satellites
air-borne) Climate model simulation outputs Multiple variables spatio-temporal (often has height dimension
as well)
Challenges Model spatio-temporal relationships across multiple variables Explain the cause of anomalies Massive data sizes
Climate and weather extreme events are well defined
Key challenge is to find significant events and explain the cause
Chawla and Chandola Anomaly Detection
Introduction Data Mining Methods Density-based anomaly Commute Time Approach Addressing Scalability Anomalies in Complex Data Evaluating Anomaly Detection Methods Applications Problem solutionsPCA and Subspace Method Subspace Method Algorithm Subspace Analysis Results Discussion Typical Characteristics of Anomaly Limitation of Volume Entropy Based versus Volume Based Fraud Detection Epidemeology Anomaly Detection in Climate and Weather Anomalies in Climate Validation of Anomalies
Anomalies are Widely Used in Climate
Most analysis done on ldquoanomalyrdquo time series
Difference from a ldquobase periodrdquo (Toosimplistic)
Brings spatial smoothness (eg a mountaintop and nearby valley can have very differenttemperatures) Removes seasonality
Understand climate and weatherphenomenon
Southern Oscillation Index (SOI) Difference between Sea Level Pressure
(SLP) anomalies for Tahiti and DarwinAustralia
Figure Global AverageTemperature Anomaly(1975 - 2007) Srcwwwmetofficegovuk
Chawla and Chandola Anomaly Detection
Introduction Data Mining Methods Density-based anomaly Commute Time Approach Addressing Scalability Anomalies in Complex Data Evaluating Anomaly Detection Methods Applications Problem solutionsPCA and Subspace Method Subspace Method Algorithm Subspace Analysis Results Discussion Typical Characteristics of Anomaly Limitation of Volume Entropy Based versus Volume Based Fraud Detection Epidemeology Anomaly Detection in Climate and Weather Anomalies in Climate Validation of Anomalies
Constructing Anomalies from Raw Data
Anomaly time series for a given location i
vprimei = vi minus bi
where bi is the base (reference)
How to choose bi Mean of all data for location i Monthly mean values (account for seasonality) Monthly z-score values Median (more robust) Using a shorter ldquoreference periodrdquo
30 year moving window
Different methods show statistically significant differences[19] What is the right strategy Weighted mean of different strategies (Pick weights using
Monte Carlo sampling)
Chawla and Chandola Anomaly Detection
Introduction Data Mining Methods Density-based anomaly Commute Time Approach Addressing Scalability Anomalies in Complex Data Evaluating Anomaly Detection Methods Applications Problem solutionsPCA and Subspace Method Subspace Method Algorithm Subspace Analysis Results Discussion Typical Characteristics of Anomaly Limitation of Volume Entropy Based versus Volume Based Fraud Detection Epidemeology Anomaly Detection in Climate and Weather Anomalies in Climate Validation of Anomalies
Anomaly Detection for Identifying Droughts
Science question Identify significant drought patterns usinghistorical observation data or future simulation data or both
Find persistent spatiotemporal anomalies in precipitation data
A two step approach
1 Find precipitationanomalies usingthresholds
2 Find large connectedcomponents across spaceand time
Matlab - bwlabelbwlabeln
Followup Science questionExplain cause
(drought190120061avi)
Figure Video courtsey Dr ArindamBanerjee
Chawla and Chandola Anomaly Detection
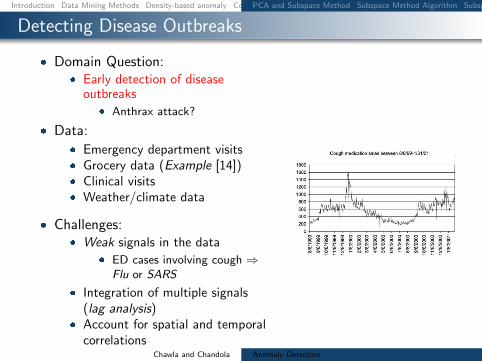
Introduction Data Mining Methods Density-based anomaly Commute Time Approach Addressing Scalability Anomalies in Complex Data Evaluating Anomaly Detection Methods Applications Problem solutionsPCA and Subspace Method Subspace Method Algorithm Subspace Analysis Results Discussion Typical Characteristics of Anomaly Limitation of Volume Entropy Based versus Volume Based Fraud Detection Epidemeology Anomaly Detection in Climate and Weather Anomalies in Climate Validation of Anomalies
Detecting Disease Outbreaks
Domain Question Early detection of disease
outbreaks Anthrax attack
Data Emergency department visits Grocery data (Example [14]) Clinical visits Weatherclimate data
Challenges Weak signals in the data
ED cases involving cough rArrFlu or SARS
Integration of multiple signals(lag analysis)
Account for spatial and temporalcorrelations
Chawla and Chandola Anomaly Detection
Introduction Data Mining Methods Density-based anomaly Commute Time Approach Addressing Scalability Anomalies in Complex Data Evaluating Anomaly Detection Methods Applications Problem solutionsPCA and Subspace Method Subspace Method Algorithm Subspace Analysis Results Discussion Typical Characteristics of Anomaly Limitation of Volume Entropy Based versus Volume Based Fraud Detection Epidemeology Anomaly Detection in Climate and Weather Anomalies in Climate Validation of Anomalies
Whatrsquos Significant About Recent Events (WSARE) [33]
1 Learn Bayesian network from historical data Environmental and response variables
2 Sample from the BN (DBbaseline|Current Environment)3 Compute contingency table for rules for DBbaseline andDBcurrent
Rules are single assignment rules (Xi = Y ji ) or conjunctions4 Find p-value for rules using χ2-test
Null Hypothesis Rows and columns of tables for DBbaselineand DBcurrent are independent
5 Find rule with largest p-value Repeat Step 2
Chawla and Chandola Anomaly Detection
Introduction Data Mining Methods Density-based anomaly Commute Time Approach Addressing Scalability Anomalies in Complex Data Evaluating Anomaly Detection Methods Applications Problem solutionsPCA and Subspace Method Subspace Method Algorithm Subspace Analysis Results Discussion Typical Characteristics of Anomaly Limitation of Volume Entropy Based versus Volume Based Fraud Detection Epidemeology Anomaly Detection in Climate and Weather Anomalies in Climate Validation of Anomalies
Incorporating Spatial and Temporal Relationships
WSARE does not explicitly model the spatial and temporalrelationships
What happened yesterday What happened in the adjoining neighborhood (yesterday)
Bayesian Network Spatio-Temporal (BNST) modelingframework [17]
Add nodes for temporal and spatial dependencies Need more data to train
Chawla and Chandola Anomaly Detection
Introduction Data Mining Methods Density-based anomaly Commute Time Approach Addressing Scalability Anomalies in Complex Data Evaluating Anomaly Detection Methods Applications Problem solutionsPCA and Subspace Method Subspace Method Algorithm Subspace Analysis Results Discussion Typical Characteristics of Anomaly Limitation of Volume Entropy Based versus Volume Based Fraud Detection Epidemeology Anomaly Detection in Climate and Weather Anomalies in Climate Validation of Anomalies
Anomaly Detection in Climate and Weather
Science Questions Identify natural and anthropogenic disasters Identify long time scale events - droughts atmospheric rivers
cold fronts etc
Data Ground observations Remote sensing data (satellites
air-borne) Climate model simulation outputs Multiple variables spatio-temporal (often has height dimension
as well)
Challenges Model spatio-temporal relationships across multiple variables Explain the cause of anomalies Massive data sizes
Climate and weather extreme events are well defined
Key challenge is to find significant events and explain the cause
Chawla and Chandola Anomaly Detection
Introduction Data Mining Methods Density-based anomaly Commute Time Approach Addressing Scalability Anomalies in Complex Data Evaluating Anomaly Detection Methods Applications Problem solutionsPCA and Subspace Method Subspace Method Algorithm Subspace Analysis Results Discussion Typical Characteristics of Anomaly Limitation of Volume Entropy Based versus Volume Based Fraud Detection Epidemeology Anomaly Detection in Climate and Weather Anomalies in Climate Validation of Anomalies
Anomalies are Widely Used in Climate
Most analysis done on ldquoanomalyrdquo time series
Difference from a ldquobase periodrdquo (Toosimplistic)
Brings spatial smoothness (eg a mountaintop and nearby valley can have very differenttemperatures) Removes seasonality
Understand climate and weatherphenomenon
Southern Oscillation Index (SOI) Difference between Sea Level Pressure
(SLP) anomalies for Tahiti and DarwinAustralia
Figure Global AverageTemperature Anomaly(1975 - 2007) Srcwwwmetofficegovuk
Chawla and Chandola Anomaly Detection
Introduction Data Mining Methods Density-based anomaly Commute Time Approach Addressing Scalability Anomalies in Complex Data Evaluating Anomaly Detection Methods Applications Problem solutionsPCA and Subspace Method Subspace Method Algorithm Subspace Analysis Results Discussion Typical Characteristics of Anomaly Limitation of Volume Entropy Based versus Volume Based Fraud Detection Epidemeology Anomaly Detection in Climate and Weather Anomalies in Climate Validation of Anomalies
Constructing Anomalies from Raw Data
Anomaly time series for a given location i
vprimei = vi minus bi
where bi is the base (reference)
How to choose bi Mean of all data for location i Monthly mean values (account for seasonality) Monthly z-score values Median (more robust) Using a shorter ldquoreference periodrdquo
30 year moving window
Different methods show statistically significant differences[19] What is the right strategy Weighted mean of different strategies (Pick weights using
Monte Carlo sampling)
Chawla and Chandola Anomaly Detection
Introduction Data Mining Methods Density-based anomaly Commute Time Approach Addressing Scalability Anomalies in Complex Data Evaluating Anomaly Detection Methods Applications Problem solutionsPCA and Subspace Method Subspace Method Algorithm Subspace Analysis Results Discussion Typical Characteristics of Anomaly Limitation of Volume Entropy Based versus Volume Based Fraud Detection Epidemeology Anomaly Detection in Climate and Weather Anomalies in Climate Validation of Anomalies
Anomaly Detection for Identifying Droughts
Science question Identify significant drought patterns usinghistorical observation data or future simulation data or both
Find persistent spatiotemporal anomalies in precipitation data
A two step approach
1 Find precipitationanomalies usingthresholds
2 Find large connectedcomponents across spaceand time
Matlab - bwlabelbwlabeln
Followup Science questionExplain cause
(drought190120061avi)
Figure Video courtsey Dr ArindamBanerjee
Chawla and Chandola Anomaly Detection
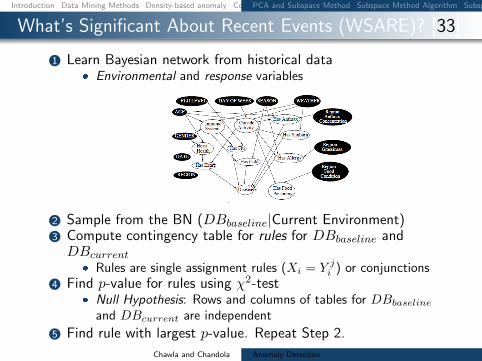
Introduction Data Mining Methods Density-based anomaly Commute Time Approach Addressing Scalability Anomalies in Complex Data Evaluating Anomaly Detection Methods Applications Problem solutionsPCA and Subspace Method Subspace Method Algorithm Subspace Analysis Results Discussion Typical Characteristics of Anomaly Limitation of Volume Entropy Based versus Volume Based Fraud Detection Epidemeology Anomaly Detection in Climate and Weather Anomalies in Climate Validation of Anomalies
Whatrsquos Significant About Recent Events (WSARE) [33]
1 Learn Bayesian network from historical data Environmental and response variables
2 Sample from the BN (DBbaseline|Current Environment)3 Compute contingency table for rules for DBbaseline andDBcurrent
Rules are single assignment rules (Xi = Y ji ) or conjunctions4 Find p-value for rules using χ2-test
Null Hypothesis Rows and columns of tables for DBbaselineand DBcurrent are independent
5 Find rule with largest p-value Repeat Step 2
Chawla and Chandola Anomaly Detection
Introduction Data Mining Methods Density-based anomaly Commute Time Approach Addressing Scalability Anomalies in Complex Data Evaluating Anomaly Detection Methods Applications Problem solutionsPCA and Subspace Method Subspace Method Algorithm Subspace Analysis Results Discussion Typical Characteristics of Anomaly Limitation of Volume Entropy Based versus Volume Based Fraud Detection Epidemeology Anomaly Detection in Climate and Weather Anomalies in Climate Validation of Anomalies
Incorporating Spatial and Temporal Relationships
WSARE does not explicitly model the spatial and temporalrelationships
What happened yesterday What happened in the adjoining neighborhood (yesterday)
Bayesian Network Spatio-Temporal (BNST) modelingframework [17]
Add nodes for temporal and spatial dependencies Need more data to train
Chawla and Chandola Anomaly Detection
Introduction Data Mining Methods Density-based anomaly Commute Time Approach Addressing Scalability Anomalies in Complex Data Evaluating Anomaly Detection Methods Applications Problem solutionsPCA and Subspace Method Subspace Method Algorithm Subspace Analysis Results Discussion Typical Characteristics of Anomaly Limitation of Volume Entropy Based versus Volume Based Fraud Detection Epidemeology Anomaly Detection in Climate and Weather Anomalies in Climate Validation of Anomalies
Anomaly Detection in Climate and Weather
Science Questions Identify natural and anthropogenic disasters Identify long time scale events - droughts atmospheric rivers
cold fronts etc
Data Ground observations Remote sensing data (satellites
air-borne) Climate model simulation outputs Multiple variables spatio-temporal (often has height dimension
as well)
Challenges Model spatio-temporal relationships across multiple variables Explain the cause of anomalies Massive data sizes
Climate and weather extreme events are well defined
Key challenge is to find significant events and explain the cause
Chawla and Chandola Anomaly Detection
Introduction Data Mining Methods Density-based anomaly Commute Time Approach Addressing Scalability Anomalies in Complex Data Evaluating Anomaly Detection Methods Applications Problem solutionsPCA and Subspace Method Subspace Method Algorithm Subspace Analysis Results Discussion Typical Characteristics of Anomaly Limitation of Volume Entropy Based versus Volume Based Fraud Detection Epidemeology Anomaly Detection in Climate and Weather Anomalies in Climate Validation of Anomalies
Anomalies are Widely Used in Climate
Most analysis done on ldquoanomalyrdquo time series
Difference from a ldquobase periodrdquo (Toosimplistic)
Brings spatial smoothness (eg a mountaintop and nearby valley can have very differenttemperatures) Removes seasonality
Understand climate and weatherphenomenon
Southern Oscillation Index (SOI) Difference between Sea Level Pressure
(SLP) anomalies for Tahiti and DarwinAustralia
Figure Global AverageTemperature Anomaly(1975 - 2007) Srcwwwmetofficegovuk
Chawla and Chandola Anomaly Detection
Introduction Data Mining Methods Density-based anomaly Commute Time Approach Addressing Scalability Anomalies in Complex Data Evaluating Anomaly Detection Methods Applications Problem solutionsPCA and Subspace Method Subspace Method Algorithm Subspace Analysis Results Discussion Typical Characteristics of Anomaly Limitation of Volume Entropy Based versus Volume Based Fraud Detection Epidemeology Anomaly Detection in Climate and Weather Anomalies in Climate Validation of Anomalies
Constructing Anomalies from Raw Data
Anomaly time series for a given location i
vprimei = vi minus bi
where bi is the base (reference)
How to choose bi Mean of all data for location i Monthly mean values (account for seasonality) Monthly z-score values Median (more robust) Using a shorter ldquoreference periodrdquo
30 year moving window
Different methods show statistically significant differences[19] What is the right strategy Weighted mean of different strategies (Pick weights using
Monte Carlo sampling)
Chawla and Chandola Anomaly Detection
Introduction Data Mining Methods Density-based anomaly Commute Time Approach Addressing Scalability Anomalies in Complex Data Evaluating Anomaly Detection Methods Applications Problem solutionsPCA and Subspace Method Subspace Method Algorithm Subspace Analysis Results Discussion Typical Characteristics of Anomaly Limitation of Volume Entropy Based versus Volume Based Fraud Detection Epidemeology Anomaly Detection in Climate and Weather Anomalies in Climate Validation of Anomalies
Anomaly Detection for Identifying Droughts
Science question Identify significant drought patterns usinghistorical observation data or future simulation data or both
Find persistent spatiotemporal anomalies in precipitation data
A two step approach
1 Find precipitationanomalies usingthresholds
2 Find large connectedcomponents across spaceand time
Matlab - bwlabelbwlabeln
Followup Science questionExplain cause
(drought190120061avi)
Figure Video courtsey Dr ArindamBanerjee
Chawla and Chandola Anomaly Detection
Introduction Data Mining Methods Density-based anomaly Commute Time Approach Addressing Scalability Anomalies in Complex Data Evaluating Anomaly Detection Methods Applications Problem solutionsPCA and Subspace Method Subspace Method Algorithm Subspace Analysis Results Discussion Typical Characteristics of Anomaly Limitation of Volume Entropy Based versus Volume Based Fraud Detection Epidemeology Anomaly Detection in Climate and Weather Anomalies in Climate Validation of Anomalies
Anomaly Detection in Climate and Weather
Science Questions Identify natural and anthropogenic disasters Identify long time scale events - droughts atmospheric rivers
cold fronts etc
Data Ground observations Remote sensing data (satellites
air-borne) Climate model simulation outputs Multiple variables spatio-temporal (often has height dimension
as well)
Challenges Model spatio-temporal relationships across multiple variables Explain the cause of anomalies Massive data sizes
Climate and weather extreme events are well defined
Key challenge is to find significant events and explain the cause
Chawla and Chandola Anomaly Detection
Introduction Data Mining Methods Density-based anomaly Commute Time Approach Addressing Scalability Anomalies in Complex Data Evaluating Anomaly Detection Methods Applications Problem solutionsPCA and Subspace Method Subspace Method Algorithm Subspace Analysis Results Discussion Typical Characteristics of Anomaly Limitation of Volume Entropy Based versus Volume Based Fraud Detection Epidemeology Anomaly Detection in Climate and Weather Anomalies in Climate Validation of Anomalies
Anomalies are Widely Used in Climate
Most analysis done on ldquoanomalyrdquo time series
Difference from a ldquobase periodrdquo (Toosimplistic)
Brings spatial smoothness (eg a mountaintop and nearby valley can have very differenttemperatures) Removes seasonality
Understand climate and weatherphenomenon
Southern Oscillation Index (SOI) Difference between Sea Level Pressure
(SLP) anomalies for Tahiti and DarwinAustralia
Figure Global AverageTemperature Anomaly(1975 - 2007) Srcwwwmetofficegovuk
Chawla and Chandola Anomaly Detection
Introduction Data Mining Methods Density-based anomaly Commute Time Approach Addressing Scalability Anomalies in Complex Data Evaluating Anomaly Detection Methods Applications Problem solutionsPCA and Subspace Method Subspace Method Algorithm Subspace Analysis Results Discussion Typical Characteristics of Anomaly Limitation of Volume Entropy Based versus Volume Based Fraud Detection Epidemeology Anomaly Detection in Climate and Weather Anomalies in Climate Validation of Anomalies
Constructing Anomalies from Raw Data
Anomaly time series for a given location i
vprimei = vi minus bi
where bi is the base (reference)
How to choose bi Mean of all data for location i Monthly mean values (account for seasonality) Monthly z-score values Median (more robust) Using a shorter ldquoreference periodrdquo
30 year moving window
Different methods show statistically significant differences[19] What is the right strategy Weighted mean of different strategies (Pick weights using
Monte Carlo sampling)
Chawla and Chandola Anomaly Detection
Introduction Data Mining Methods Density-based anomaly Commute Time Approach Addressing Scalability Anomalies in Complex Data Evaluating Anomaly Detection Methods Applications Problem solutionsPCA and Subspace Method Subspace Method Algorithm Subspace Analysis Results Discussion Typical Characteristics of Anomaly Limitation of Volume Entropy Based versus Volume Based Fraud Detection Epidemeology Anomaly Detection in Climate and Weather Anomalies in Climate Validation of Anomalies
Anomaly Detection for Identifying Droughts
Science question Identify significant drought patterns usinghistorical observation data or future simulation data or both
Find persistent spatiotemporal anomalies in precipitation data
A two step approach
1 Find precipitationanomalies usingthresholds
2 Find large connectedcomponents across spaceand time
Matlab - bwlabelbwlabeln
Followup Science questionExplain cause
(drought190120061avi)
Figure Video courtsey Dr ArindamBanerjee
Chawla and Chandola Anomaly Detection
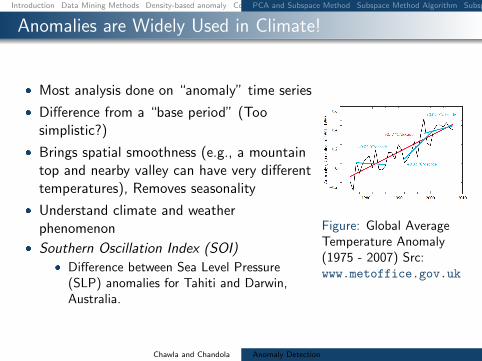
Introduction Data Mining Methods Density-based anomaly Commute Time Approach Addressing Scalability Anomalies in Complex Data Evaluating Anomaly Detection Methods Applications Problem solutionsPCA and Subspace Method Subspace Method Algorithm Subspace Analysis Results Discussion Typical Characteristics of Anomaly Limitation of Volume Entropy Based versus Volume Based Fraud Detection Epidemeology Anomaly Detection in Climate and Weather Anomalies in Climate Validation of Anomalies
Anomalies are Widely Used in Climate
Most analysis done on ldquoanomalyrdquo time series
Difference from a ldquobase periodrdquo (Toosimplistic)
Brings spatial smoothness (eg a mountaintop and nearby valley can have very differenttemperatures) Removes seasonality
Understand climate and weatherphenomenon
Southern Oscillation Index (SOI) Difference between Sea Level Pressure
(SLP) anomalies for Tahiti and DarwinAustralia
Figure Global AverageTemperature Anomaly(1975 - 2007) Srcwwwmetofficegovuk
Chawla and Chandola Anomaly Detection
Introduction Data Mining Methods Density-based anomaly Commute Time Approach Addressing Scalability Anomalies in Complex Data Evaluating Anomaly Detection Methods Applications Problem solutionsPCA and Subspace Method Subspace Method Algorithm Subspace Analysis Results Discussion Typical Characteristics of Anomaly Limitation of Volume Entropy Based versus Volume Based Fraud Detection Epidemeology Anomaly Detection in Climate and Weather Anomalies in Climate Validation of Anomalies
Constructing Anomalies from Raw Data
Anomaly time series for a given location i
vprimei = vi minus bi
where bi is the base (reference)
How to choose bi Mean of all data for location i Monthly mean values (account for seasonality) Monthly z-score values Median (more robust) Using a shorter ldquoreference periodrdquo
30 year moving window
Different methods show statistically significant differences[19] What is the right strategy Weighted mean of different strategies (Pick weights using
Monte Carlo sampling)
Chawla and Chandola Anomaly Detection
Introduction Data Mining Methods Density-based anomaly Commute Time Approach Addressing Scalability Anomalies in Complex Data Evaluating Anomaly Detection Methods Applications Problem solutionsPCA and Subspace Method Subspace Method Algorithm Subspace Analysis Results Discussion Typical Characteristics of Anomaly Limitation of Volume Entropy Based versus Volume Based Fraud Detection Epidemeology Anomaly Detection in Climate and Weather Anomalies in Climate Validation of Anomalies
Anomaly Detection for Identifying Droughts
Science question Identify significant drought patterns usinghistorical observation data or future simulation data or both
Find persistent spatiotemporal anomalies in precipitation data
A two step approach
1 Find precipitationanomalies usingthresholds
2 Find large connectedcomponents across spaceand time
Matlab - bwlabelbwlabeln
Followup Science questionExplain cause
(drought190120061avi)
Figure Video courtsey Dr ArindamBanerjee
Chawla and Chandola Anomaly Detection
Introduction Data Mining Methods Density-based anomaly Commute Time Approach Addressing Scalability Anomalies in Complex Data Evaluating Anomaly Detection Methods Applications Problem solutionsPCA and Subspace Method Subspace Method Algorithm Subspace Analysis Results Discussion Typical Characteristics of Anomaly Limitation of Volume Entropy Based versus Volume Based Fraud Detection Epidemeology Anomaly Detection in Climate and Weather Anomalies in Climate Validation of Anomalies
Constructing Anomalies from Raw Data
Anomaly time series for a given location i
vprimei = vi minus bi
where bi is the base (reference)
How to choose bi Mean of all data for location i Monthly mean values (account for seasonality) Monthly z-score values Median (more robust) Using a shorter ldquoreference periodrdquo
30 year moving window
Different methods show statistically significant differences[19] What is the right strategy Weighted mean of different strategies (Pick weights using
Monte Carlo sampling)
Chawla and Chandola Anomaly Detection
Introduction Data Mining Methods Density-based anomaly Commute Time Approach Addressing Scalability Anomalies in Complex Data Evaluating Anomaly Detection Methods Applications Problem solutionsPCA and Subspace Method Subspace Method Algorithm Subspace Analysis Results Discussion Typical Characteristics of Anomaly Limitation of Volume Entropy Based versus Volume Based Fraud Detection Epidemeology Anomaly Detection in Climate and Weather Anomalies in Climate Validation of Anomalies
Anomaly Detection for Identifying Droughts
Science question Identify significant drought patterns usinghistorical observation data or future simulation data or both
Find persistent spatiotemporal anomalies in precipitation data
A two step approach
1 Find precipitationanomalies usingthresholds
2 Find large connectedcomponents across spaceand time
Matlab - bwlabelbwlabeln
Followup Science questionExplain cause
(drought190120061avi)
Figure Video courtsey Dr ArindamBanerjee
Chawla and Chandola Anomaly Detection
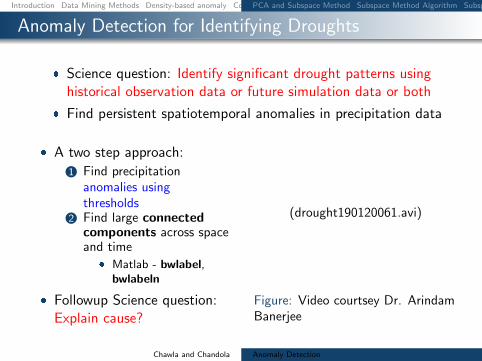
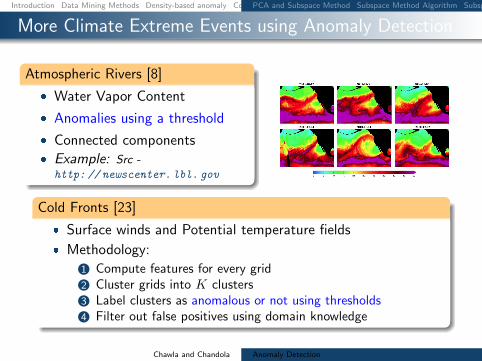
Introduction Data Mining Methods Density-based anomaly Commute Time Approach Addressing Scalability Anomalies in Complex Data Evaluating Anomaly Detection Methods Applications Problem solutionsPCA and Subspace Method Subspace Method Algorithm Subspace Analysis Results Discussion Typical Characteristics of Anomaly Limitation of Volume Entropy Based versus Volume Based Fraud Detection Epidemeology Anomaly Detection in Climate and Weather Anomalies in Climate Validation of Anomalies
More Climate Extreme Events using Anomaly Detection
Atmospheric Rivers [8]
Water Vapor Content
Anomalies using a threshold
Connected components Example Src -
http newscenter lbl gov
Cold Fronts [23]
Surface winds and Potential temperature fields
Methodology
1 Compute features for every grid2 Cluster grids into K clusters3 Label clusters as anomalous or not using thresholds4 Filter out false positives using domain knowledge
Chawla and Chandola Anomaly Detection
Introduction Data Mining Methods Density-based anomaly Commute Time Approach Addressing Scalability Anomalies in Complex Data Evaluating Anomaly Detection Methods Applications Problem solutionsPCA and Subspace Method Subspace Method Algorithm Subspace Analysis Results Discussion Typical Characteristics of Anomaly Limitation of Volume Entropy Based versus Volume Based Fraud Detection Epidemeology Anomaly Detection in Climate and Weather Anomalies in Climate Validation of Anomalies
Validation is Key
How useful are the anomalies from the domain perspective
Common pitfalls Anomalies are algorithmically correct but are not relevant (bad
data noise simplistic) Anomalies are not actionable
Not identified in timely fashion Resolution is not fine enough Cause not explained
Anomalies lost among false positives
Solution Good validation data during design Clear definition of a domain anomaly and distinction from
other potential competitors
Chawla and Chandola Anomaly Detection
Introduction Data Mining Methods Density-based anomaly Commute Time Approach Addressing Scalability Anomalies in Complex Data Evaluating Anomaly Detection Methods Applications Problem solutionsPCA and Subspace Method Subspace Method Algorithm Subspace Analysis Results Discussion Typical Characteristics of Anomaly Limitation of Volume Entropy Based versus Volume Based Fraud Detection Epidemeology Anomaly Detection in Climate and Weather Anomalies in Climate Validation of Anomalies
L Akoglu M McGlohon and C Faloutsos
OddBall Spotting Anomalies in Weighted GraphsIn In Pacific-Asia Conference on Knowledge Discovery and Data Mining (PAKDD) June 2010
A Asuncion and D J Newman
UCI machine learning repository[httparchiveicsucieduml] Irvine CA University of California 2007
S D Bay and M Schwabacher
Mining distance-based outliers in near linear time with randomization and a simple pruning ruleIn Proceedings of the ninth ACM SIGKDD international conference on Knowledge discovery and datamining pages 29ndash38 ACM Press 2003
R Bolton and D Hand
Unsupervised profiling methods for fraud detectionIn Credit Scoring and Credit Control VII 1999
S Boriah V Chandola and V Kumar
Similarity measures for categorical data A comparative evaluationIn SDM pages 243ndash254 2008
M M Breunig H-P Kriegel R T Ng and J Sander
Lof identifying density-based local outliersIn Proceedings of 2000 ACM SIGMOD International Conference on Management of Data pages 93ndash104ACM Press 2000
S Budalakoti A Srivastava and M Otey
Anomaly detection and diagnosis algorithms for discrete symbol sequences with applications to airlinesafetyProceedings of the IEEE International Conference on Systems Man and Cybernetics 37(6) 2007
S Byna Prabhat M Wehner and K Wu
Detecting atmospheric rivers in large climate datasets
Chawla and Chandola Anomaly Detection
Introduction Data Mining Methods Density-based anomaly Commute Time Approach Addressing Scalability Anomalies in Complex Data Evaluating Anomaly Detection Methods Applications Problem solutionsPCA and Subspace Method Subspace Method Algorithm Subspace Analysis Results Discussion Typical Characteristics of Anomaly Limitation of Volume Entropy Based versus Volume Based Fraud Detection Epidemeology Anomaly Detection in Climate and Weather Anomalies in Climate Validation of Anomalies
In 2nd International Workshop on Petascale Data Analytics Challenges and Opportunities (PDAC-11)2011
V Chandola A Banerjee and V Kumar
Anomaly detection for discrete sequences A surveyIEEE Transactions on Knowledge and Data Engineering 99(PrePrints) 2010
V Chandola S Boriah and V Kumar
A framework for exploring categorical dataIn Proceedings of the ninth SIAM International Conference on Data Mining 2009
V Chandola V Mithal and V Kumar
A comparative evaluation of anomaly detection techniques for sequence dataIn Proceedings of International Conference on Data Mining 2008
V Chandola V Mithal and V Kumar
Understanding anomaly detection techniques for sequence dataTechnical Report 09-001 University of Minnesota Computer Science Department January 2009
T Fawcett and F Provost
Activity monitoring noticing interesting changes in behaviorIn Proceedings of the 5th ACM SIGKDD International Conference on Knowledge Discovery and DataMining pages 53ndash62 ACM Press 1999
A Goldenberg G Shmueli R A Caruana and S E Fienberg
Early statistical detection of anthrax outbreaks by tracking over-the-counter medication salesProceedings of the National Academy of Sciences of the United States of America 99(8)pp 5237ndash52402002
D Hawkins
Identification of outliersMonographs on Applied Probability and Statistics May 1980
S A Hofmeyr S Forrest and A Somayaji
Chawla and Chandola Anomaly Detection
Introduction Data Mining Methods Density-based anomaly Commute Time Approach Addressing Scalability Anomalies in Complex Data Evaluating Anomaly Detection Methods Applications Problem solutionsPCA and Subspace Method Subspace Method Algorithm Subspace Analysis Results Discussion Typical Characteristics of Anomaly Limitation of Volume Entropy Based versus Volume Based Fraud Detection Epidemeology Anomaly Detection in Climate and Weather Anomalies in Climate Validation of Anomalies
Intrusion detection using sequences of system callsJournal of Computer Security 6(3)151ndash180 1998
X Jiang and G F Cooper
A bayesian spatio-temporal method for disease outbreak detectionJAMIA pages 462ndash471 2010
J S Kaustav Das
Detecting anomalous records in categorical datasetsIn Proc of the thirteenth ACM SIGKDD international conference on Knowledge discovery and data miningAug 2007
J Kawale S Chatterjee A Kumar S Liess M Steinbach and V Kumar
Anomaly construction in climate data Issues and challengesIn Proceedings of NASA Conference on Intelligent Data Understanding 2011
E M Knorr and R T Ng
Algorithms for mining distance-based outliers in large datasetsIn Proceedings of the 24rd International Conference on Very Large Data Bases pages 392ndash403 MorganKaufmann Publishers Inc 1998
H-P Kriegel P Kroger E Schubert and A Zimek
Interpreting and unifying outlier scoresIn SDM pages 13ndash24 2011
A Lakhina M Crovella and C Diot
Diagnosing network-wide traffic anomaliesIn Proceedings of ACM SIGCOMM pages 219ndash230 2004
X Li R Ramachandran S Graves S Movva B Akkiraju D Emmitt S Greco R Atlas J Terry and
J-C JusemAutomated detection of frontal systems from numerical model-generated dataIn Proceedings of the eleventh ACM SIGKDD international conference on Knowledge discovery in datamining KDD rsquo05 pages 782ndash787 New York NY USA 2005 ACM
Chawla and Chandola Anomaly Detection
Introduction Data Mining Methods Density-based anomaly Commute Time Approach Addressing Scalability Anomalies in Complex Data Evaluating Anomaly Detection Methods Applications Problem solutionsPCA and Subspace Method Subspace Method Algorithm Subspace Analysis Results Discussion Typical Characteristics of Anomaly Limitation of Volume Entropy Based versus Volume Based Fraud Detection Epidemeology Anomaly Detection in Climate and Weather Anomalies in Climate Validation of Anomalies
M V Mahoney and P K Chan
Learning rules for anomaly detection of hostile network trafficIn ICDM pages 601ndash604 2003
S V Mane
False negative estimation theory techniques and applicationsProQuest UMI Dissertation Publishing 2011
A Moore and M S Lee
Cached sufficient statistics for efficient machine learning with large datasetsJ Artif Int Res 867ndash91 March 1998
Y Pei and O Zaane
A synthetic data generator for clustering and outlier analysisTechnical report University of Alberta 2006
S Ramaswamy R Rastogi and K Shim
Efficient algorithms for mining outliers from large data setsIn Proceedings of the 2000 ACM SIGMOD international conference on Management of data pages427ndash438 ACM Press 2000
N Satish M Harris and M Garland
Designing efficient sorting algorithms for manycore gpusIn IPDPS pages 1ndash10 2009
X Song M Wu C Jermaine and S Ranka
Conditional anomaly detectionIEEE Trans on Knowl and Data Eng 19631ndash645 May 2007
D A Spielman and N Srivastava
Graph sparsification by effective resistancesIn Proceedings of the 40th annual ACM symposium on Theory of computing STOC rsquo08 pages 563ndash568New York NY USA 2008 ACM
Chawla and Chandola Anomaly Detection
Introduction Data Mining Methods Density-based anomaly Commute Time Approach Addressing Scalability Anomalies in Complex Data Evaluating Anomaly Detection Methods Applications Problem solutionsPCA and Subspace Method Subspace Method Algorithm Subspace Analysis Results Discussion Typical Characteristics of Anomaly Limitation of Volume Entropy Based versus Volume Based Fraud Detection Epidemeology Anomaly Detection in Climate and Weather Anomalies in Climate Validation of Anomalies
P Sun S Chawla and B Arunasalam
Mining for outliers in sequential databasesIn In SIAM International Conference on Data Mining 2006
W-K Wong A Moore G Cooper and M Wagner
Bayesian network anomaly pattern detection for disease outbreaksIn T Fawcett and N Mishra editors Proceedings of the Twentieth International Conference on MachineLearning pages 808ndash815 Menlo Park California August 2003 AAAI Press
L Xiong B Poczos and J Schneider
Group anomaly detection using flexible genre modelsIn NIPS 2011
Chawla and Chandola Anomaly Detection
Introduction Data Mining Methods Density-based anomaly Commute Time Approach Addressing Scalability Anomalies in Complex Data Evaluating Anomaly Detection Methods Applications Problem solutionsPCA and Subspace Method Subspace Method Algorithm Subspace Analysis Results Discussion Typical Characteristics of Anomaly Limitation of Volume Entropy Based versus Volume Based Fraud Detection Epidemeology Anomaly Detection in Climate and Weather Anomalies in Climate Validation of Anomalies
Acknowledgements
Linsey Pang Tara Babie and Khoa Nguyen (University ofSydney)
Arindam Banerjee (University of Minnesota)
Chawla and Chandola Anomaly Detection
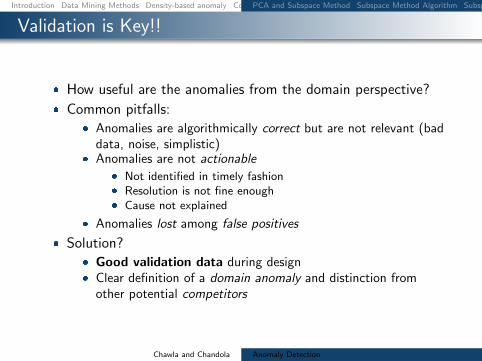
Introduction Data Mining Methods Density-based anomaly Commute Time Approach Addressing Scalability Anomalies in Complex Data Evaluating Anomaly Detection Methods Applications Problem solutionsPCA and Subspace Method Subspace Method Algorithm Subspace Analysis Results Discussion Typical Characteristics of Anomaly Limitation of Volume Entropy Based versus Volume Based Fraud Detection Epidemeology Anomaly Detection in Climate and Weather Anomalies in Climate Validation of Anomalies
Intrusion detection using sequences of system callsJournal of Computer Security 6(3)151ndash180 1998
X Jiang and G F Cooper
A bayesian spatio-temporal method for disease outbreak detectionJAMIA pages 462ndash471 2010
J S Kaustav Das
Detecting anomalous records in categorical datasetsIn Proc of the thirteenth ACM SIGKDD international conference on Knowledge discovery and data miningAug 2007
J Kawale S Chatterjee A Kumar S Liess M Steinbach and V Kumar
Anomaly construction in climate data Issues and challengesIn Proceedings of NASA Conference on Intelligent Data Understanding 2011
E M Knorr and R T Ng
Algorithms for mining distance-based outliers in large datasetsIn Proceedings of the 24rd International Conference on Very Large Data Bases pages 392ndash403 MorganKaufmann Publishers Inc 1998
H-P Kriegel P Kroger E Schubert and A Zimek
Interpreting and unifying outlier scoresIn SDM pages 13ndash24 2011
A Lakhina M Crovella and C Diot
Diagnosing network-wide traffic anomaliesIn Proceedings of ACM SIGCOMM pages 219ndash230 2004
X Li R Ramachandran S Graves S Movva B Akkiraju D Emmitt S Greco R Atlas J Terry and
J-C JusemAutomated detection of frontal systems from numerical model-generated dataIn Proceedings of the eleventh ACM SIGKDD international conference on Knowledge discovery in datamining KDD rsquo05 pages 782ndash787 New York NY USA 2005 ACM
Chawla and Chandola Anomaly Detection
Introduction Data Mining Methods Density-based anomaly Commute Time Approach Addressing Scalability Anomalies in Complex Data Evaluating Anomaly Detection Methods Applications Problem solutionsPCA and Subspace Method Subspace Method Algorithm Subspace Analysis Results Discussion Typical Characteristics of Anomaly Limitation of Volume Entropy Based versus Volume Based Fraud Detection Epidemeology Anomaly Detection in Climate and Weather Anomalies in Climate Validation of Anomalies
M V Mahoney and P K Chan
Learning rules for anomaly detection of hostile network trafficIn ICDM pages 601ndash604 2003
S V Mane
False negative estimation theory techniques and applicationsProQuest UMI Dissertation Publishing 2011
A Moore and M S Lee
Cached sufficient statistics for efficient machine learning with large datasetsJ Artif Int Res 867ndash91 March 1998
Y Pei and O Zaane
A synthetic data generator for clustering and outlier analysisTechnical report University of Alberta 2006
S Ramaswamy R Rastogi and K Shim
Efficient algorithms for mining outliers from large data setsIn Proceedings of the 2000 ACM SIGMOD international conference on Management of data pages427ndash438 ACM Press 2000
N Satish M Harris and M Garland
Designing efficient sorting algorithms for manycore gpusIn IPDPS pages 1ndash10 2009
X Song M Wu C Jermaine and S Ranka
Conditional anomaly detectionIEEE Trans on Knowl and Data Eng 19631ndash645 May 2007
D A Spielman and N Srivastava
Graph sparsification by effective resistancesIn Proceedings of the 40th annual ACM symposium on Theory of computing STOC rsquo08 pages 563ndash568New York NY USA 2008 ACM
Chawla and Chandola Anomaly Detection
Introduction Data Mining Methods Density-based anomaly Commute Time Approach Addressing Scalability Anomalies in Complex Data Evaluating Anomaly Detection Methods Applications Problem solutionsPCA and Subspace Method Subspace Method Algorithm Subspace Analysis Results Discussion Typical Characteristics of Anomaly Limitation of Volume Entropy Based versus Volume Based Fraud Detection Epidemeology Anomaly Detection in Climate and Weather Anomalies in Climate Validation of Anomalies
P Sun S Chawla and B Arunasalam
Mining for outliers in sequential databasesIn In SIAM International Conference on Data Mining 2006
W-K Wong A Moore G Cooper and M Wagner
Bayesian network anomaly pattern detection for disease outbreaksIn T Fawcett and N Mishra editors Proceedings of the Twentieth International Conference on MachineLearning pages 808ndash815 Menlo Park California August 2003 AAAI Press
L Xiong B Poczos and J Schneider
Group anomaly detection using flexible genre modelsIn NIPS 2011
Chawla and Chandola Anomaly Detection
Introduction Data Mining Methods Density-based anomaly Commute Time Approach Addressing Scalability Anomalies in Complex Data Evaluating Anomaly Detection Methods Applications Problem solutionsPCA and Subspace Method Subspace Method Algorithm Subspace Analysis Results Discussion Typical Characteristics of Anomaly Limitation of Volume Entropy Based versus Volume Based Fraud Detection Epidemeology Anomaly Detection in Climate and Weather Anomalies in Climate Validation of Anomalies
Acknowledgements
Linsey Pang Tara Babie and Khoa Nguyen (University ofSydney)
Arindam Banerjee (University of Minnesota)
Chawla and Chandola Anomaly Detection
Introduction Data Mining Methods Density-based anomaly Commute Time Approach Addressing Scalability Anomalies in Complex Data Evaluating Anomaly Detection Methods Applications Problem solutionsPCA and Subspace Method Subspace Method Algorithm Subspace Analysis Results Discussion Typical Characteristics of Anomaly Limitation of Volume Entropy Based versus Volume Based Fraud Detection Epidemeology Anomaly Detection in Climate and Weather Anomalies in Climate Validation of Anomalies
M V Mahoney and P K Chan
Learning rules for anomaly detection of hostile network trafficIn ICDM pages 601ndash604 2003
S V Mane
False negative estimation theory techniques and applicationsProQuest UMI Dissertation Publishing 2011
A Moore and M S Lee
Cached sufficient statistics for efficient machine learning with large datasetsJ Artif Int Res 867ndash91 March 1998
Y Pei and O Zaane
A synthetic data generator for clustering and outlier analysisTechnical report University of Alberta 2006
S Ramaswamy R Rastogi and K Shim
Efficient algorithms for mining outliers from large data setsIn Proceedings of the 2000 ACM SIGMOD international conference on Management of data pages427ndash438 ACM Press 2000
N Satish M Harris and M Garland
Designing efficient sorting algorithms for manycore gpusIn IPDPS pages 1ndash10 2009
X Song M Wu C Jermaine and S Ranka
Conditional anomaly detectionIEEE Trans on Knowl and Data Eng 19631ndash645 May 2007
D A Spielman and N Srivastava
Graph sparsification by effective resistancesIn Proceedings of the 40th annual ACM symposium on Theory of computing STOC rsquo08 pages 563ndash568New York NY USA 2008 ACM
Chawla and Chandola Anomaly Detection
Introduction Data Mining Methods Density-based anomaly Commute Time Approach Addressing Scalability Anomalies in Complex Data Evaluating Anomaly Detection Methods Applications Problem solutionsPCA and Subspace Method Subspace Method Algorithm Subspace Analysis Results Discussion Typical Characteristics of Anomaly Limitation of Volume Entropy Based versus Volume Based Fraud Detection Epidemeology Anomaly Detection in Climate and Weather Anomalies in Climate Validation of Anomalies
P Sun S Chawla and B Arunasalam
Mining for outliers in sequential databasesIn In SIAM International Conference on Data Mining 2006
W-K Wong A Moore G Cooper and M Wagner
Bayesian network anomaly pattern detection for disease outbreaksIn T Fawcett and N Mishra editors Proceedings of the Twentieth International Conference on MachineLearning pages 808ndash815 Menlo Park California August 2003 AAAI Press
L Xiong B Poczos and J Schneider
Group anomaly detection using flexible genre modelsIn NIPS 2011
Chawla and Chandola Anomaly Detection
Introduction Data Mining Methods Density-based anomaly Commute Time Approach Addressing Scalability Anomalies in Complex Data Evaluating Anomaly Detection Methods Applications Problem solutionsPCA and Subspace Method Subspace Method Algorithm Subspace Analysis Results Discussion Typical Characteristics of Anomaly Limitation of Volume Entropy Based versus Volume Based Fraud Detection Epidemeology Anomaly Detection in Climate and Weather Anomalies in Climate Validation of Anomalies
Acknowledgements
Linsey Pang Tara Babie and Khoa Nguyen (University ofSydney)
Arindam Banerjee (University of Minnesota)
Chawla and Chandola Anomaly Detection

Introduction Data Mining Methods Density-based anomaly Commute Time Approach Addressing Scalability Anomalies in Complex Data Evaluating Anomaly Detection Methods Applications Problem solutionsPCA and Subspace Method Subspace Method Algorithm Subspace Analysis Results Discussion Typical Characteristics of Anomaly Limitation of Volume Entropy Based versus Volume Based Fraud Detection Epidemeology Anomaly Detection in Climate and Weather Anomalies in Climate Validation of Anomalies
Acknowledgements
Linsey Pang Tara Babie and Khoa Nguyen (University ofSydney)
Arindam Banerjee (University of Minnesota)
Chawla and Chandola Anomaly Detection
Recommended